Embed Size (px)
Citation preview

80/2016 TEXTE
Harmonization of environmental exposure assessment for veterinary pharmaceuticals and biocides: Ring test for validation of a draft test protocol for studies on transformation in manure


TEXTE 80/2016
Environmental Research of the Federal Ministry for the Environment, Nature Conservation, Building and Nuclear Safety
Project No. (FKZ) 3712 65 420 Report No. (UBA-FB) 002336/3,ENG
Harmonization of environmental exposure assessment for veterinary pharmaceuticals and biocides: Ring test for validation of a draft test protocol for studies on transformation in manure
by
Thomas Junker, Dr. Jörg Römbke ECT Oekotoxikologie GmbH, Flörsheim, Germany
Dr. Dieter Hennecke, Dr. Monika Herrchen Fraunhofer Institute for Molecular Biology and Applied Ecology IME, Schmallenberg, Germany
Prof. Dr. Rolf Alexander Düring Justus Liebig University, Institute of Soil Science and Soil Conservation, Giessen, Germany
Prof. Dr. Sören Thiele-Bruhn University Trier, Soil Science Department, Faculty VI, Trier, Germany
Dr. Maria Meinerling Ibacon GmbH, Rossdorf, Germany
Silke Fiebig Noack-Laboratorien GmbH, Sarstedt, Germany
Dr. Ed Topp Agriculture and Agri-Food Canada, London, Canada
Dr. Wolfgang Völkel Innovative Environmental Sciences (IES), Witterswil, Switzerland
On behalf of the German Federal Environment Agency

Imprint
Publisher: Umweltbundesamt Wörlitzer Platz 1 06844 Dessau-Roßlau Tel: +49 340-2103-0 Fax: +49 340-2103-2285 [email protected] Internet: www.umweltbundesamt.de
/umweltbundesamt.de /umweltbundesamt
Study performed by: ECT Oekotoxikologie GmbH, Böttgerstraße 2-14, 65439 Flörsheim Fraunhofer-Institut für Molekularbiologie und Angewandte Ökologie (IME) Auf dem Aberg 1, 57392 Schmallenberg Justus Liebig Universität, Institut für Bodenkunde und Bodenerhaltung Heinrich-Buff-Ring 26-32, 35392 Giessen Universität Trier, Abteilung Bodenkunde, FB VI, 54286 Trier Ibacon GmbH, Arheiliger Weg 17, 64380 Rossdorf Noack-Laboratorien GmbH, Käthe-Paulus-Straße 1, 31157 Sarstedt Agriculture and Agri-Food Canada, 1391 Sandford Str., London, ON N5V 4T3, Canada Innovative Environmental Sciences (IES) Ltd, Benkenstraße 260, 4108 Witterswil, Switzerland Study completed in: March 2016 Edited by: Section IV 2.2 Pharmaceuticals, Washing and Cleaning Agents and Nanomaterials; Dr. Silvia Berkner, Dr. Sabine Konradi Publication as pdf: http://www.umweltbundesamt.de/publikationen ISSN 1862-4804 Dessau-Roßlau, November 2016 The Project underlying this report was supported with funding from the Federal Ministry for the Environment, Nature Conservation, Building and Nuclear safety under project number FKZ 3712 65 420. The responsibility for the content of this publication lies with the author(s).

Transformation of veterinary pharmaceuticals and biocides in (liquid) manure
4
Kurzbeschreibung
Die Ausbringung von Veterinärpharmaka und Bioziden mit Gülle auf landwirtschaftlich genutzte Flächen stellt einen sehr wichtigen Eintragspfad dieser Produktgruppen in die Umwelt dar. Aktuelle Bewertungsleitfäden (zum Beispiel: „Guideline on determining the fate of veterinary medicinal pro-ducts in manure“ (EMA/CVMP/ERA/430327/2009) (EMA, 2011) sehen aus diesem Grund auch expe-rimentelle Untersuchungen zur Transformation dieser Substanzen in Gülle vor. Allerdings beinhalten die Dokumente lediglich grundlegende regulatorische Vorgaben, eine experimentelle Prüfrichtlinie zur Durchführung von Studien zum Abbauverhalten von Veterinärpharmaka und Bioziden in Gülle liegt jedoch weder auf EU- noch auf OECD-Ebene vor. Um eine einheitliche Bewertung von Studien im Zulassungsverfahren zu gewährleisten wird jedoch ein harmonisiertes, international akzeptiertes und validiertes Testverfahren benötigt.
Vor diesem Hintergrund wurde im Rahmen des F+E-Vorhabens „Entwicklung einer Testvorschrift zum Abbauverhalten von Veterinärpharmaka und Bioziden in Gülle“ (Hennecke et al., 2015) ein Entwurf für eine experimentelle Richtlinie erarbeitet. Die experimentelle Methode wurde durch die Auswertung von Intralaborvergleichen sowie eines internationalen Interlaborvergleichs (pre-validation Ringversuch) mittels geeigneter statistischer Verfahren überprüft und überarbeitet.
Aufbauend auf diesen Vorarbeiten wurde im Vorhaben ein internationaler Ringversuch mit einem Tierarzneimittel (Florfenicol) in Schweinegülle sowie einem Biozid (Imidacloprid) in Rindergülle durchgeführt und ausgewertet. Darüber hinaus wurden zwei internationale Workshops organisiert; zu Beginn des Vorhabens in Zusammenhang mit dem Vorgängervorhaben, sowie am Ende des Pro-jektes zur Auswertung des internationalen Ringversuchs. Basierend auf den experimentellen Ergeb-nissen des Ringversuchs sowie den Diskussionen und Schlussfolgerungen der beiden Workshops wurde ein überarbeiteter Prüfrichtlinienentwurf erstellt.

Transformation of veterinary pharmaceuticals and biocides in (liquid) manure
5
Abstract
The spread of veterinary medicinal products (VMP) and biocides onto agriculturally used areas repre-sents a very important path of entry into the environment for these product groups. For this reason, current guidance (e.g. „Guideline on determining the fate of veterinary medicinal products in ma-nure“ (EMA/CVMP/ERA/430327/2009) (EMA, 2011) stipulates experimental studies on transfor-mation of VMPs and biocides in manure. Though, the documents only contain basic regulatory re-quirements, whereas an experimental test guideline is still missing, both on EU and OECD level. To allow for a consistent assessment of studies within the registration process, a harmonized interna-tionally accepted and validated test method is needed.
A draft test guideline was developed within a previous R&D-Project “Development of test guidance for transformation of veterinary pharmaceuticals and biocides in liquid manure” (Hennecke et al., 2015). The experimental method was examined and revised by an intra-laboratory comparisons as well as an international inter-laboratory comparison (pre-validation ring test).
In the present project, an international ring test has been performed and evaluated testing a veteri-nary medicinal product (florfenicol) in pig manure and a biocide (imidacloprid) in cattle manure. Moreover, two international workshops were organized; one at the beginning in connection with pre-ceding project (Hennecke et al., 2015) and one at the end of the project to discuss and evaluate the ring test. Based on the experimental results of the ring test as well as discussions and conclusions of both workshops, a revised draft test guideline was prepared.

Transformation of veterinary pharmaceuticals and biocides in (liquid) manure
6
Table of Contents
Table of Contents ...................................................................................................................... 6
List of tables ........................................................................................................................... 12
List of abbrevations ................................................................................................................. 16
Zusammenfassung .................................................................................................................. 18
Summary ................................................................................................................................ 24
1 Introduction .................................................................................................................... 30
2 Material and methods ..................................................................................................... 31
2.1 Test compounds ................................................................................................ 31
2.2 Test design ....................................................................................................... 32
2.2.1 Collection, handling and storage of manure ..................................................... 32
2.2.2 Manure characterization ................................................................................ 33
2.2.3 Acclimation ................................................................................................... 34
2.2.4 Test conditions .............................................................................................. 35
2.2.4.1 Test temperature and light conditions 35
2.2.4.2 Anaerobic incubation conditions 35
2.2.4.3 Abiotic controls 35
2.2.4.4 Treatment and application of test substance 36
2.2.4.5 Test duration and sampling 36
2.2.4.6 Measurements and analysis 37
2.3 Substance-specific procedures for the ringtest .................................................... 38
2.3.1 14C-florfenicol in pig manure ........................................................................... 38
2.3.1.1 Test substance concentration 38
2.3.1.2 Extraction method and analytical procedures 39
2.3.1.3 Analysis of florfenicol from incubation at 10°C 40
2.3.2 14C-imidacloprid in cattle manure .................................................................... 41
2.3.2.1 Test substance concentrations 41
2.3.2.2 Extraction method and analytical procedures 42
2.4 Evaluation of ring test results ............................................................................. 45
2.4.1 Manure matrix parameters ............................................................................. 45
2.4.2 Degradation kinetics ...................................................................................... 45
2.4.3 14C-mass balance ........................................................................................... 45
2.4.4 Statistical evaluation ..................................................................................... 45
3 Results and discussion .................................................................................................... 47
3.1 Overview ........................................................................................................... 47

Transformation of veterinary pharmaceuticals and biocides in (liquid) manure
7
3.2 Incubation systems ........................................................................................... 47
3.3 Manure sampling............................................................................................... 52
3.4 Manure matrix characterization parameters ........................................................ 55
3.4.1 Temperature .................................................................................................. 55
3.4.2 Dry matter content ......................................................................................... 56
3.4.3 Organic matter content .................................................................................. 56
3.4.4 Nitrogen content ............................................................................................ 57
3.4.4.1 Total nitrogen 57
3.4.4.2 Ammonia nitrogen 57
3.4.5 Redox potential and pH values ........................................................................ 57
3.5 Dissipation of the parent compound ................................................................... 60
3.6 Mineralization ................................................................................................... 66
3.7 Extractable residues .......................................................................................... 68
3.8 Non-extractable residues ................................................................................... 75
3.9 Mass balances .................................................................................................. 81
3.9.1 Florfenicol in pig manure ................................................................................ 81
3.9.2 Imidacloprid in cattle manure ......................................................................... 85
3.9.3 Derivation of quality criteria ........................................................................... 88
3.10 Overview on the variability of the results obtained in the ring test in different laboratories with different manures .................................................................... 91
3.11 Transformation of florfenicol in pig manure at 10°C - special method considerations for identification of transformation products ................................. 99
3.11.1 Extraction and clean-up method ..................................................................... 99
3.11.1.1 Test of additional accelerated solvent extraction (ASE) of centrifugation pellet 100
3.11.1.2 Recovery rate of the method 101
3.11.2 Assignment of transformation products ......................................................... 102
3.11.3 Conclusions on identification of transformation products ............................... 106
3.12 Modification, discussion and further development of the draft test guideline ....... 106
3.12.1 Technical workshops ................................................................................... 107
3.12.1.1 Presentations and discussions at the workshop 2013 108
3.12.1.2 Presentations and discussions at the workshop 2014 110
4 Conclusions .................................................................................................................. 113
5 References ................................................................................................................... 115
Annex 1 .................................................................................................................................... 1
Draft Guideline .......................................................................................................................... 1

Transformation of veterinary pharmaceuticals and biocides in (liquid) manure
8
Annex 2 .................................................................................................................................. 24
Invitation Ring Test; Outline Ring Test; Registration Form ........................................................... 24
Annex 3 .................................................................................................................................. 28
Evaluation Sheets .................................................................................................................... 28
Annex 4 .................................................................................................................................. 57
Degradation kinetics and statistical evaluation .......................................................................... 57
Annex 5 ................................................................................................................................ 109
List of Participants ................................................................................................................. 109
Technical Workshops and SETAC-Meetings .............................................................................. 109
Annex 6 ................................................................................................................................ 113
List of Publications ................................................................................................................ 113
Transformation of veterinary pharmaceuticals and biocides in (liquid) manure
9
List of figures
Figure 1: Container with fermentation air lock during storage of cattle manure ........................................................................................................... 33
Figure 2: Sterile control sample ..................................................................................... 36
Figure 3: Measurement of radioactivity in extracts and in non-extractable residues ......................................................................................................... 37
Figure 4: Extraction of cattle manure during the ringtest (left: transfer of manure into centrifugation vessel; right: manure samples in centrifuge) ...................................................................................................... 42
Figure 5: Schematic diagram of the flow-through test system used in the ring test by Institute 1 ..................................................................................... 48
Figure 6: Pictures of the flow-through test system used in the ring test by Institute 1 ....................................................................................................... 49
Figure 7: Schematic diagram of the semi-static test apparatus used in the ring test by Institute 2 ..................................................................................... 49
Figure 8: Pictures semi-static test apparatus used in the ring test by Institute 2 ....................................................................................................... 49
Figure 9: Schematic diagram of the semi-static test apparatus used in the ring test by Institute 3 ..................................................................................... 50
Figure 10: Pictures semi-static test apparatus used in the ring test by Institute 3 ....................................................................................................... 50
Figure 11: Pictures semi-static test apparatus used in the ring test by Institute 4 ....................................................................................................... 51
Figure 12: Pictures semi-static test apparatus used in the ring test by Institute 5 ....................................................................................................... 51
Figure 13: Picture semi-static test apparatus used in the ring test by Institute 6 ....................................................................................................... 51
Figure 14: Sampling of cattle manure for the ring test with imidacloprid ............................. 52
Figure 15: Plots for transformation of 14C-labeled and unlabeled florfenicol in pig manure at a temperature of 10°C. The measured values and the values calculated by means of applying the single first order kinetic model are shown for the parent compound florfenicol and the transformation products TP1, TP2 and TP3 (named as A1, B1 and C1 in the nomenclature of the KinGUI software tool). ................................... 62
Figure 16: Plots for transformation of florfenicol in pig manure for all institutes based on arithmetic mean of all replicates. The measured values and the values calculated by means of applying the single first order kinetic model are shown for the parent compound florfenicol and the transformation products TP1, TP2 and TP3 (named as A1, B1 and C1 in the nomenclature of the KinGUI software tool). A rapid decrease of the parent compound can be seen. ................................................................................................... 63
Transformation of veterinary pharmaceuticals and biocides in (liquid) manure
10
Figure 17: Plots for transformation of imidacloprid in cattle manure for all institutes based on arithmetic mean of all replicates. The measured values and the values calculated by means of applying the single first order kinetic model are shown for the parent compound imidacloprid and the transformation products TP1 and TP2 (named as A1 and B1 in the nomenclature of the KinGUI software tool). A decrease of the parent compound can be seen accompanied by an increase of transformation products. ................................... 64
Figure 18: Dissipation plot for florfenicol in pig manure at 20°C based on overall mean of mean values for institutes (3 institutes, predicted values, SFO kinetics) and standard deviation (shaded area). .............................. 65
Figure 19: Dissipation plot for florfenicol in pig manure at 10°C based on mean of two replicates (institute 6, predicted values, SFO kinetics) and standard deviation (shaded area). ................................................ 65
Figure 20: Dissipation plot for imidacloprid in cattle manure at 20°C based on overall mean of mean values for institutes (4 institutes, predicted values, SFO kinetics) and standard deviation (shaded area). ............................................................................................................. 66
Figure 21: Comparison of extractable residues [normalized, %aR] obtained from transformation of 14C-florfenicol in pig manure for all participants of the ring test. ............................................................................. 73
Figure 22: Comparison of extractable residues [normalized, %aR] obtained from transformation of 14C-imidacloprid in cattle manure for all participants of the ring test. ............................................................................. 75
Figure 23: Comparison of non-extractable residues obtained from transformation of 14C-florfenicol in pig manure for five participants of the ring test. The amount of radioactivity [% applied radioactivity, % aR] per sampling interval is given as mean. Values were normalized to 100% aR at day 0. .......................................... 78
Figure 24: Comparison of non-extractable residues obtained from transformation of 14C-imidacloprid in cattle manure for all participants of the ring test. The amount of radioactivity [% applied radioactivity, % aR] per sampling interval is given as mean. Values were normalized to 100 % aR at day 0. ......................................... 81
Figure 25: Mass balances for transformation of 14C-florfenicol in pig manure for all participants of the ring test. The amount of radioactivity [normalized, %aR] per sampling interval is given as mean. ................................. 85
Figure 26: Mass balances for transformation of 14C-imidacloprid in cattle manure for all participants of the ring test. The amount of radioactivity [normalized, %aR] per sampling interval is given as mean. ............................................................................................................. 88
Figure 27: Frequency distribution of mass balances [% aR] for 14C-florfenicol in pig manure for all participants of the ring test (without Institute 4); n=174 .......................................................................................... 90

Transformation of veterinary pharmaceuticals and biocides in (liquid) manure
11
Figure 28: Frequency distribution of mass balances [% aR] for 14C-imidacloprid in cattle manure for all participants of the ring test; n=199 ............................................................................................................ 90
Figure 29: Mean for mass balance, extractables, NER and mineralization data [normalized; % aR] and standard deviation (shaded area) within the ring test for 14C-florfenicol in pig manure; 4 Institutes ........................ 94
Figure 30: Mean for mass balance, extractables, NER and mineralization data [normalized; % aR] and standard deviation (shaded area) within the ring test for 14C-imidacloprid in cattle manure; 4 Institutes; ....................................................................................................... 94
Figure 31: Coefficients of variation [%]: mean across institutes (dots) for mass balance, extractables and non-extractable residues (NER) and total mean (open square) during the transformation studies of ring test. ..................................................................................................... 97
Figure 32: Boxplot diagram of mass balances (based on mean values) [% aR] within the ring test (14C-florfenicol in pig manure and 14C-imidacloprid in cattle manure) .......................................................................... 98
Figure 33: Chromatograms from Radio-HPLC; data smoothing by adjacent averaging 100. Dashed lines show retention times of radioactivity signals that significantly deviate from background noise. ........................................................................................................... 103
Figure 34: Participants of the technical workshops in Flörsheim 2013 (left) and in Giessen 2014 (right) ............................................................................ 108

Transformation of veterinary pharmaceuticals and biocides in (liquid) manure
12
List of tables
Table 1: Information on test substances ........................................................................ 32
Table 2: Measurement of matrix parameters for characterization of liquid manure ........................................................................................................... 34
Table 3: Florfenicol concentration in pig manure ............................................................ 38
Table 4: Putative transformation products (TP)/suggested reference compounds for florfenicol ................................................................................ 39
Table 5: Imidacloprid concentration in cattle manure ..................................................... 41
Table 6: Putative transformation products (TP)/suggested reference compounds for imidacloprid ............................................................................ 42
Table 7: Summary of test method parameters for the ring test ......................................... 44
Table 8: Parameters and endpoints determined by the participants during the ring test .................................................................................................... 47
Table 9: Cattle manure origin and sampling ................................................................... 53
Table 10: Pig manure origin and sampling ....................................................................... 54
Table 11: Temperature [°C] of pig manure at the given sampling points ............................. 55
Table 12: Temperature [°C] of cattle manure at the given sampling points .......................... 55
Table 13: Dry matter content of pig manure [%] ................................................................ 56
Table 14: Dry matter content of cattle manure [%] ............................................................ 56
Table 15: Organic matter content of pig and cattle manure [% relating to wet weight] ..................................................................................................... 56
Table 16: Total nitrogen content of pig and cattle manure [Ntotal; mg/kg] ............................ 57
Table 17: Ammonia nitrogen content of pig and cattle manure [NH4-N; mg/kg] ........................................................................................................... 57
Table 18: pH-values of pig manure at the given sampling points ....................................... 58
Table 19: pH-values of cattle manure at the given sampling points .................................... 58
Table 20: Redox-potential [mV] of pig manure at the given sampling points ....................... 59
Table 21: Redox-potential [mV] of cattle manure at the given sampling points ............................................................................................................ 59
Table 22: DT50- values [d] determined in the ring test for the test substance florfenicol (parent) at a temperature of 10°C and normalized to 20°C, fitting of SFO model ................................................................................ 60
Table 23: DT50- values [d] determined in the ring test for the test substances florfenicol (parent) and imidacloprid (parent) at 20°C, fitting of SFO model. ........................................................................................ 61
Table 24: mean-values and standard deviation (SD) of mineralization to 14CO2 [% aR] measured for the transformation of 14C-florfenicol in pig manure, 5 institutes. .................................................................................. 67

Transformation of veterinary pharmaceuticals and biocides in (liquid) manure
13
Table 25: mean-values and standard deviation (SD) of mineralization to 14CH4 [% aR] measured for the transformation of 14C-florfenicol in pig manure, 5 institutes. .................................................................................. 67
Table 26: mean-values and standard deviation (SD) of mineralization to 14CO2 [% aR] measured for the transformation of 14C-imidacloprid in cattle manure, 5 institutes. .......................................................................... 68
Table 27: mean-values and standard deviation (SD) of mineralization to 14CH4 [% aR] measured for the transformation of 14C-imidacloprid in cattle manure, 5 institutes. .......................................................................... 68
Table 28: mean-values, standard deviation (SD) and coefficient of variation (COV%) of extractable residues [% aR] measured for 14C-florfenicol in pig manure, 5 institutes. .............................................................. 69
Table 29: mean-values, standard deviation (SD) and coefficient of variation (COV%) of extractable residues [% aR] measured for 14C-imidacloprid in cattle manure, 5 institutes. ....................................................... 71
Table 30: mean-values, standard deviation (SD) ) and coefficient of variation (COV%) of extractable residues [normalized, %aR] measured for 14C-florfenicol in pig manure, 5 institutes. ..................................... 72
Table 31: mean-values and standard deviation (SD) of extractable residues [normalized, %aR] measured for 14C- imidacloprid in cattle manure, 5 institutes. ....................................................................................... 74
Table 32: minimum (Min), maximum (Max) and mean-values, standard deviation (SD) and coefficient of variation (COV%) of NER [% aR] for the transformation of 14C-florfenicol in pig manure, 5 institutes ........................................................................................................ 76
Table 33: minimum (Min), maximum (Max) and mean-values, standard deviation (SD) and coefficient of variation (COV%) of NER [normalized, % aR] for the transformation of 14C-florfenicol in pig manure, 5 institutes. ....................................................................................... 77
Table 34: minimum (Min), maximum (Max) and mean-values, standard deviation (SD) and coefficient of variation (COV%) of NER [% aR] for the transformation of 14C-imidacloprid in cattle manure, 5 institutes. ....................................................................................................... 79
Table 35: minimum (Min), maximum (Max) and mean-values, standard deviation (SD) and coefficient of variation (COV%) of NER [normalized, % aR] for the transformation of 14C-imidacloprid in cattle manure, all institutes. ............................................................................ 80
Table 36: Summarizing presentation of all minimum (Min), maximum (Max) and mean-values, standard deviation (SD) and coefficient of variation (COV%) of mass balances [% aR] for the transformation of 14C-florfenicol in pig manure, 5 institutes ...................................................... 82
Table 37: Summarizing presentation of all minimum (Min), maximum (Max) and mean-values, standard deviation (SD) and coefficient of variation (COV%) of normalized mass balances [% aR] for the transformation of 14C-florfenicol in pig manure, participant: all. .......................... 84

Transformation of veterinary pharmaceuticals and biocides in (liquid) manure
14
Table 38: Summarizing presentation of all minimum (Min), maximum (Max) and mean-values, standard deviation (SD) and coefficient of variation (COV%) of mass balances for the transformation of 14C-imidacloprid in cattle manure, participant: all. .................................................. 86
Table 39: Summarizing presentation of all minimum (Min), maximum (Max) and mean-values, standard deviation (SD) and coefficient of variation (COV%) of normalized mass balances for the transformation of 14C-imidacloprid in cattle manure, participant: all. ................................................................................................................. 87
Table 40: Comparison of obtained mass balances to the range of 90%-110% for all ring test experiments .................................................................... 89
Table 41: Comparison of obtained mass balances to the range of 85%-115% for all ring test experiments .................................................................... 91
Table 42: Summary of ring test results for 14C-florfenicol in pig manure [% aR]; mean, standard deviation and coefficient of variation for mineralization, extractables, NER and mass balance; 4 institutes1); mean across institutes for each sampling time point ........................ 92
Table 43: Summary of ring test results for 14C-florfenicol in pig manure [normalized, % aR]; mean, standard deviation and coefficient of variation for mineralization, extractables, NER and mass balance; 4 institutes1); mean across institutes for each sampling time point .............................................................................................................. 93
Table 44: Summary of ring test results for 14C-imidacloprid in cattle manure [% aR]; mean, standard deviation and coefficient of variation for mineralization, extractables, NER and mass balance; 5 institutes; mean across institutes for each sampling time point .......................................... 95
Table 45: Summary of ring test results for 14C-imidacloprid in cattle manure [normalized, % aR]; mean, standard deviation and coefficient of variation for mineralization, extractables, NER and mass balance; 5 institutes; mean across institutes for each sampling time point ....................... 96
Table 46: Mean, standard deviation and coefficient of variation [%] for dissipation of the parent compound (DT50-values) during the transformation studies of the ring test (mean across replicates for each institute at 20°C) ................................................................................ 97
Table 47: Maxima, minima and percentiles of mass balances (%aR) within the ring test .................................................................................................... 98
Table 48: Recovery of radioactivity from 14C-florfenicol from spiked manure over the different work steps of the extraction and clean-up procedure. .................................................................................................... 101
Table 49: Recovery of florfenicol in H2O/ACN 50:50 (v:v) without (control) and with filtration using four different syringe filters (Macherey-Nagel, Düren, Germany). ................................................................................ 102
Table 50: Putative and identified transformation products of florfenicol and parameters for LC-MS/MS analysis ................................................................. 105

Transformation of veterinary pharmaceuticals and biocides in (liquid) manure
15
Table 51: List of participants of the technical workshops in 2013 and 2014 ..................... 107

Transformation of veterinary pharmaceuticals and biocides in (liquid) manure
16
List of abbrevations
ACN Acetonitrile
aR applied radioactivity
ASE accelerated solvent extraction
Bq Bequerel (radioactive decay per second)
CAS Chemical Abstracts Service
COV coefficient of variation
CRO Contract Research Organisation
cpm counts per minute
d day
DGGE Denaturating Gradient Gel Electrophoresis
DMS dimethylsulfide
DMSO dimethylsulfoxide
DT50 time [d] needed for the disappearance of 50 % of the parent compound, disappear-ance time
DT90 time [d] needed for the disappearance of 90 % of the parent compound, disappear-ance time
EFSA European Food Safety Authority
EMA European Medicines Agency
ER extractable residues
ESI electrospray Ionization
FKZ Project No. (german: Forschungskennzahl)
FOCUS Forum of the Co-ordination of pesticide fate models and their Use
GC Gas chromatography
HLB Hydrophilic-Lipophilic-Balanced
HPLC high performance liquid chromatography
ISO International Organization for Standardization
Koc soil adsorption coefficient
Kow octanol-water partition coefficient
LC liquid chromatography
LSC liquid scintillation counting
Max Maximum
Min Minimum
MRM Multiple reaction monitoring
MS mass spectromety

Transformation of veterinary pharmaceuticals and biocides in (liquid) manure
17
NaOAc Sodium acetate
NaOH Sodium hydroxide
NER non-extractable residues
NH4-N ammonia nitrogen
NMR Nuclear Magnetic Resonance
Ntot total nitrogen
OECD Organisation for Economic Co-operation and Development
OM organic matter
PET polyethylenterephthalat (polyester)
PIS product ion scan
PTFE polytetrafluorethylene
QuEChERS Quick, Easy, Cheap, Effective, Rugged, and Safe
Rf retardation factor (also known as retention factor)
SAX strong anion exchange
SD standard deviation
SETAC Society of Environmental Toxicology and Chemistry
SFO single first order kinetics
SPE solid phase extraction
TFA trifluoroacetic acid
TLC thin layer chromatography
TP transformation product
VDI The Association of German Engineers (german: Verein Deutscher Ingenieure)
VICH International Cooperation on Harmonization of Technical Requirements for Registra-tion of Veterinary Medicinal Products
VMP veterinary medicinal products

Transformation of veterinary pharmaceuticals and biocides in (liquid) manure
18
Zusammenfassung
Zielsetzung
Ziel des Projekts waren die Weiterentwicklung einer Testvorschrift zur experimentellen Untersu-chung der Transformation von Veterinärpharmaka und Bioziden in Schweine- und Rindergülle, so-wie die Validierung der Methode im Rahmen eines Ringtests.
Hintergrund
Die Ausbringung von Gülle stellt einen bedeutenden Eintragspfad für Veterinärpharmaka (VMP) und Biozide in die Umwelt dar. Aus diesem Grund sehen aktuelle Leit- und Richtlinien die experimentelle Untersuchung dieser Substanzen in Gülle vor (z.B. „Guideline on determining the fate of veterinary medicinal products in manure (EMA, 2011)). Allerdings ist zurzeit noch keine standardisierte expe-rimentelle Methode zur Untersuchung der Transformation von Veterinärpharmaka und Bioziden in flüssiger Gülle verfügbar. Die EMA-Richtlinie zur Transformation in Gülle (EMA, 2011) beinhaltet zwar grundlegende regulatorische Anforderungen, um eine einheitliche Bewertung von Studien in-nerhalb regulatorischer Rahmenbedingungen zu ermöglichen, es wird jedoch eine harmonisierte, international akzeptierte und validierte Testmethode benötigt. In einem vorhergehenden For-schungsprojekt wurde daher in mehreren Schritten eine Testvorschrift entwickelt. Hierbei wurden Erfahrungen von Laboratorien bei der Durchführung von Simulationsstudien zur Transformation von Chemikalien in Boden und Wasser-Sediment Systemen genutzt und das Testdesign an die speziellen Anforderungen der Güllematrix angepasst.
Der Testvorschrift beschreibt Methoden zur Untersuchung der Transformation von Chemikalien in Schweine- und Rindergülle (90-95% Wassergehalt) unter anaeroben Bedingungen. Die Experimente werden durchgeführt, um die Transformationsrate der Testsubstanz, Identität, Bildungs- und Ab-nahmeraten von Transformationsprodukten, den Anteil der Substanz, welcher zu CO2 oder CH4 mine-ralisiert oder zu anderen volatilen Stoffen umgeformt wird, sowie die Menge an nicht-extrahierbaren Rückständen (NER) zu bestimmen.
Die Testsubstanz wird in die flüssige Gülleprobe appliziert und im Dunkeln unter kontrollierten La-borbedingungen inkubiert. Nach geeigneten Zeitintervallen werden Gülleproben entnommen, extra-hiert und auf die Muttersubstanz sowie Transformationsprodukte analysiert. Volatile Transformati-onsprodukte werden zur Analyse in geeigneten Apparaturen aufgefangen um die Bildung von CO2 und CH4 zu quantifizieren. Durch die Verwendung von 14C-radioaktiv markierter Testsubstanz kön-nen Mineralisierungsraten der Testsubstanz gemessen und eine Massenbilanz einschließlich der Bil-dung von NER erstellt werden. Die Ergebnisse ermöglichen die Berechnung von DT50-Werten, und gegebenenfalls DT90-Werten.
Die experimentelle Methode wurde entwickelt, indem drei unterschiedliche Wirkstoffe (Veterinär-pharmaka und Biodzide) getestet wurden. Die Methode wurde aufgrund der Ergebnisse aus Diskussi-onen mit Interessenvertretern bei vier internationalen Konferenzen (2012 Berlin, 2013 Glasgow, 2014 Basel, 2015 Barcelona) verfeinert. In 2012/2013 wurde ein internationaler pre-validation Ringversuch durchgeführt, um einen ersten Eindruck über die Anwendbarkeit der Testmethode in anderen Laboratorien zu gewinnen. Die Erfahrungen der Teilnehmer wurden gesammelt und 2013 im Rahmen eines zweitägigen Workshops in Flörsheim diskutiert. Basierend auf den Ergebnissen und Empfehlungen des Workshops wurde die Testvorschrift überarbeitet. Der resultierende Richtlinien-entwurf stellte die Grundlage für einen zweiten Ringversuch in 2013/2014 zur Validierung der expe-rimentellen Methode dar. Darüber hinaus sollten Kriterien zur Qualität und zur Reproduzierbarkeit der Testergebnisse abgeleitet werden. Im Anschluss an diesen Ringversuch diente ein zweitägiger

Transformation of veterinary pharmaceuticals and biocides in (liquid) manure
19
internationaler Workshop in Gießen 2014 dazu, die Erfahrungen der Teilnehmer zusammen zu tra-gen und den Richtlinienentwurf weiter zu verfeinern.
Ringversuch zur Validierung eines Richtlinienentwurfs für Studien zur Transformation in Gülle
Um die Anwendbarkeit des überarbeiteten Richtlinienentwurfs zu prüfen, wurde ein internationaler Ringversuch organisiert. Im März 2013 wurden zu diesem Zweck 35 Institute aus Europa, 4 Institute aus Nordamerika und 2 Institute aus Asien eingeladen, am Ringversuch teilzunehmen. Zudem wurde eine Informationsveranstaltung in Glasgow im Rahmen der 23. SETAC Europe Jahrestagung im Mai 2013 organisiert.
Die folgenden sechs Institute (in alphabetischer Reihenfolge) nahmen schließlich am Ringversuch teil:
▸ Agriculture and Agrifood Canada (AAFC), London, Kanada ▸ Noack Laboratorien GmbH, Sarstedt, Deutschland ▸ ECT Oekotoxikologie GmbH, Flörsheim, Deutschland ▸ Fraunhofer Institut für Molekularbiologie und Angewandte Ökologie (IME), Schmallenberg,
Deutschland ▸ IBACON GmbH, Rossdorf, Deutschland ▸ Universität Trier, Abteilung Bodenkunde, Trier, Deutschland
Der Ringversuch wurde basierend auf den Erfahrungen aus dem pre-validation Ringversuch sowie der aktuellen Version des Richtlinienentwurfs durchgeführt, welcher vor Beginn der Versuche an alle Teilnehmer verteilt wurde. Darüber hinaus wurden den Teilnehmern vorab substanz-spezifische Ver-fahren zur Durchführung des Ringversuchs zur Verfügung gestellt (z.B. Testdauer, Probenahmezeit-punkte, Testkonzentrationen, zu applizierende Radioaktivität je Testgefäß, Herstellung von Steril-kontrollen, empfohlene Extraktionsmethoden und analytische Verfahren, potentielle Transformati-onsprodukte).
Die anaerobe Transformation von zwei 14C-markierten Substanzen - ein Tierarzneimittelwirkstoff in Schweinegülle (14C-Florfenicol) und ein Biozid in Rindergülle (14C-Imidacloprid) - wurde bei einer Temperatur von 20 ± 2°C getestet. Die Substanzen wurden aufgrund mehrerer Kriterien ausgewählt: die Substanzen werden nicht zu schnell abgebaut und erlauben somit eine durchführbare und repro-duzierbare Probenahme; die Substanzen sind nicht persistent, woraus eine verlängerte Testdauer resultieren würde; der Abbau basiert hauptsächlich auf biologischen Prozessen; die Anforderungen für eine chemische Analytik sind nicht zu hoch; die Position der radioaktiven Markierung im Molekül erlaubt die Ermittlung der wesentlichen Transformationsprodukte; die Kosten für die Beschaffung der 14C-markierten Substanzen sind vertretbar.
Darüber hinaus wurde die Transformation von Florfenicol in Schweinegülle bei einer Testtemperatur von 10 ± 2°C unter der Verwendung von radioaktiv markierter sowie unmarkierter Testsubstanz un-tersucht, um eine Anleitung für die Untersuchung von auftretenden Transformationsprodukten zu entwickeln. Die chemische Analytik wurde mittels radio-HPLC (14C-markiert) und LC-ESI-MS/MS (unmarkiert) durchgeführt. Neue Extraktions- und Aufreinigungsmethoden wurden entwickelt.
Die Experimente des Ringversuchs wurden zwischen September 2013 und September 2014 durchge-führt.

Transformation of veterinary pharmaceuticals and biocides in (liquid) manure
20
Auswertung der Ergebnisse
Für jeden Probenahmezeitpunkt wurde eine 14C-Massenbilanz durch Aufsummieren der Mengen an Radioaktivität [% der applizierten Radioaktivität; % aR] in den Extrakten (extrahierbare Rückstände, ER), den nicht-extrahierbaren Rückständen (NER) und der Mineralisierung (14CO2 und 14CH4) erstellt. Da die Massenbilanzen zu Beginn der Experimente (Tag 0) Unterschiede zwischen den teilnehmen-den Instituten zeigten, werden alle Resultate bezogen auf die Massenbilanz [% aR] zusätzlich in nor-malisierter Form präsentiert (Massenbilanz bei Tag 0 wird für jedes Institut auf 100% gesetzt).
Die Ergebnisse eines Instituts für Florfenicol in Schweinegülle konnten nicht für die weitere Auswer-tung herangezogen werden, da die verwendete Extraktionsmethode wesentliche Abweichungen von der im Vorfeld an die Teilnehmer verteilten empfohlenen Methode aufwies. Für die Extraktion wur-den unpolare Lösemittel verwendet, welche zu einer geringeren Massenbilanz für diese Experimente geführt haben könnten.
DT50-Werte wurden für die Muttersubstanz und für Transformationsprodukte (TP; nur falls eine Ab-nahme beobachtet wurde) ermittelt, um die Kinetik des Verschwindens der Testsubstanz zu be-schreiben. DT50-Werte wurden unter Verwendung einer Kinetik erster Ordnung (single first order, SFO) mit der Software KinGUI ermittelt und für die Berechnung von Mittelwerten und Standardab-weichungen ln-transformiert. Als Maß für die Anpassung (goodness of fit) des gewählten Kinetikmo-dells wurde der chi2-Fehler berechnet und eine visuelle Kontrolle der Transformationskurve vorge-nommen.
Ergebnisse
Parameter zur Charakterisierung der Güllematrix
Die folgenden Parameter zur Charakterisierung der Güllematrix wurden von den Teilnehmern inner-halb der Testdauer bestimmt: Temperatur, Trockensubstanzgehalt, organischer Gehalt, Stickstoff-gehalt, Redoxpotential, pH-Wert. Die in Schweine-und Rindergülle gemessenen Temperaturen lagen innerhalb des geforderten Bereichs von 20 ± 2°C. Der pH-Wert lag zwischen 7.4 und 9.3 für Schwei-negülle und zwischen 6.1 und 8.8 für Rindergülle. Es konnte kein zeitabhängiger Verlauf während der Testperiode beobachtet werden. Alle Teilnehmer konnten im Test ein Redoxpotential von ≤ -100 mV in Schweine- und Rindergülle etablieren. Somit konnten zu jeder Zeit während der Experimente stabile anaerobe Bedingungen sichergestellt werden.
Verschwinden der Muttersubstanz
DT50-Werte bei 20 ± 2°C für die Testsubstanzen (Muttersubstanz) wurden mittels SFO-Kinetik unter Verwendung der Software KinGUI ermittelt. Für Florfenicol in Schweinegülle bei 20± 2°C lag der be-obachtete Mittelwert der DT50-Werte zwischen 0.17 Tagen und 0.41 Tagen. Für Imidacloprid in Rin-dergülle lagen die mittleren DT50-Werte im Bereich 17.4 Tage bis 40.0 Tage. Der Mittelwert der DT50-Werte für Florfenicol in Schweinegülle bei einer Temperatur von 10 ± 2°C lag bei 1.4 Tagen (unmar-kierte Testsubstanz) bzw. 2.3 Tagen (14C-markierte Testsubstanz).
Der durchschnittliche chi2-Fehler der Anpassungen lag bei 21.3 ± 6.3% für Florfenicol und bei 13.4 ± 4.4% für Imidacloprid. Obwohl für den chi2-Fehler für Florfenicol und Imidacloprid in mehreren Fäl-len Werte > 15% berechnet wurden, lassen die Residuendiagramme (residual plots) keinen systema-tischen Fehler des SFO-Modells erkennen.
Mineralisierung
Weder für Florfenicol (maximale gemessene Mineralisierung von 6% aR) noch für Imidacloprid (ma-ximale gemessene Mineralisierung von < 1% aR) konnte eine nennenswerte Mineralisierung gemes-sen werden.

Transformation of veterinary pharmaceuticals and biocides in (liquid) manure
21
Extrahierbare und nicht-extrahierbare Rückstände
Ein Rückgang der extrahierbaren Rückstände (ER) im Testverlauf konnte für Florfenicol und Imidacloprid beobachtet werden. Dementgegen zeigte sich ein Anstieg der nicht-extrahierbaren Rückstände (NER) für beide Testsubstanzen. Bei Testende lag der Anteil der NER nach Normalisie-rung (Massenbilanz bei Tag 0 wurde auf 100% aR gesetzt) zwischen 30.8% aR und 61.0% aR für Florfenicol in Schweinegülle und zwischen 11.3% aR und 65.3 % aR für Imidacloprid in Rindergülle. Die Variabilität der extrahierbaren und nicht-extrahierbaren Rückstände bei Testende könnte durch die Verwendung von leicht unterschiedlichen Extraktionsmethoden durch die teilnehmenden Institu-te verursacht worden sein.
Massenbilanz
Bei Testbeginn lag die mittlere Massenbilanz der einzelnen Institute im Bereich zwischen 92.8% aR und 100.3% aR für Florfenicol in Schweinegülle und zwischen 86.8% aR und 111.8% aR für Imidacloprid in Rindergülle. Nach Normalisierung auf 100% aR bei Testbeginn (Tag 0) lag die über alle Institute im Testverlauf gemittelte Massenbilanz zwischen 95.1% aR und 103.0% aR für Florfe-nicol und zwischen 92.3% aR und 103.7% aR für Imidacloprid.
Die Massenbilanzen aller Teilnehmer des Ringversuchs wurden ausgewertet. Als Empfehlung konnte ein Bereich von 100 ± 15% aR abgeleitet werden.
Betrachtung spezieller Methoden zur Identifikation von Transformationsprodukten
Die Transformation von Florfenicol in Schweinegülle bei 10 ± 2°C wurde unter Verwendung von 14C-radioaktiv markierter sowie unmarkierter Testsubstanz untersucht. Chemische Analytik wurde mit-tels radio-HPLC (14C-markiert) sowie LC-ESI-MS/MS (unmarkiert) durchgeführt. Für letztere wurde eine Methode zur Extraktion und Aufreinigung entwickelt.
Die Ergebnisse zeigen, dass Florfenicol und seine Haupt-Transformationsprodukte unter Verwen-dung einer dreifachen Extraktion mit 0.02 molarer KH2PO4/ACN 1:1 (v:v) ausreichend in Gülle nach-gewiesen werden können. Für die LC-MS/MS-Analytik wird eine sorgfältige Aufreinigung des Ex-trakts durch Zentrifugation bei hoher Beschleunigung und mehrere Aufreinigungsschritte mit Fest-phasenextraktion und Filtration benötigt. Jedoch führt die Aufreinigung der Proben zu Verlusten der Analyten; Wiederfindungsraten um 60% wurden erreicht. Eine zusätzliche beschleunigte Lösemitte-lextraktion der Probe erwies sich als nicht zweckdienlich.
Nach Einmischen von Florfenicol in Schweinegülle zeigt sich ein schneller Rückgang der Extrahier-barkeit. Gleichzeitig werden nicht-extrahierbare Rückstände gebildet, welche anhand von 14C-markiertem Florfenicol quantifiziert werden konnten.
Florfenicol wird in Transformationsprodukte umgewandelt. Nach Inkubation wurden vorübergehend Florfenicolamin, Florfenicoloxaminsäure sowie ein unbekanntes Transformationsprodukt in gerin-gen Mengen gebildet. Mit der Kombination von radio-HPLC und LC-ESI-MS/MS unter Verwendung von Produkt-Ionen-Scan (PIS) und Multiple Reaction Monitoring (MRM) war es nicht möglich, weitere Transformationsprodukte zu erfassen.
Basierend auf den Ergebnissen liegt der folgende Transformationspfad nahe: Transformation zu Florfenicolamin durch Hydrolyse der Amid-Bindung und anschließende Bildung von Florfenicolo-xaminsäure über Substitution von Fluor durch eine Hydroxylgruppe. Da keine Massenbestimmung und somit keine Molekülcharakterisierung des unbekannten Transformationsprodukts möglich war, kann für diese Substanz kein Transformationspfad vorgeschlagen werden.
Transformation of veterinary pharmaceuticals and biocides in (liquid) manure
22
Entwicklung der experimentellen Methode und des Prüfrichtlinienentwurfs
Die erste Version des Richtlinienentwurfs wurde im Rahmen des Vorgängerprojektes „Entwicklung einer Testvorschrift zum Abbauverhalten von Veterinärpharmaka und Bioziden in Gülle“ (Hennecke et al., 2015) erstellt. Die experimentelle Testmethode wurde zunächst durch Versuche innerhalb ei-nes Labors und einem Ringversuch (pre-validation ringtest) überprüft. Basierend auf den Ergebnis-sen und den Diskussionen während eines Workshops im April 2013 in Flörsheim, Deutschland, wur-de der Text des Richtlinienentwurfs überarbeitet und kritische Schritte bei der Testdurchführung wurden präzisiert ( z.B. Applikation der Testsubstanz; Verlängerung der Testdauer auf bis zu 90 Ta-ge; Details zur Anpassung des Trockensubstanzgehaltes).
Der überarbeitete Richtlinienentwurf wurde dann im internationalen Ringversuch 2013/2014 ange-wendet. Die Anwendbarkeit und Durchführbarkeit der Testmethode wurden während eines zweitägi-gen internationalen Workshops im September 2014 in Giessen, Deutschland, diskutiert. Vertreter aller Teilnehmer des Ringversuchs und internationale Experten nahmen an dem Workshop teil. Der Schwerpunkt des Workshops lag auf der Präsentation und Diskussion der Ergebnisse und den Erfah-rungen der Teilnehmer mit der Testmethode. Darauf basierend wurde die aktuelle Version des Richt-linienentwurfs im Detail diskutiert und überarbeitet. Dem Richtlinienentwurf wurden Anhänge hin-zugefügt, um genauere Anleitungen für wichtige Schritte der Methode zur Verfügung zu stellen.
Basierend auf den Ergebnissen des Ringversuchs und den Diskussionen bei den Workshops können die folgenden Schlussfolgerungen gezogen werden:
▸ Die im Richtlinienentwurf beschriebene Testmethode kann für die Routinemessung der Transformation von Veterinärpharmaka und Bioziden in flüssiger Schweine- und Rindergülle verwendet werden.
▸ Ein halbstatisches (semi-static) Testdesign sollte verwendet werden, wohingegen ein strikt statisches Testdesign nicht empfohlen wird. Ein Durchfluss-Testdesign kann darüber hinaus für Substanzen verwendet werden, welche keinerlei oder nur eine geringe Mineralisierung zeigen. Weitere Informationen können in Herrchen et al. (2016) nachgeschlagen werden.
▸ Redoxpotentiale im typischen Bereich für flüssige Gülle in Lagertanks oder Faulteichen (von -230 mV bis -400 mV (Weinfurtner, 2011)) können bei Verwendung der im Richtlinienentwurf beschriebenen Testmethode sichergestellt werden.
▸ Parallel zur Testsubstanz sollte eine Referenzsubstanz untersucht werden, um vergleichbare Bedingungen zwischen unterschiedlichen Experimenten mit unterschiedlichen Güllen sicher-stellen zu können. Salizylsäure (z.B. als Natriumsalicylat, CAS: 54-21-7 oder als Salizylsäure, CAS: 69-72-7) wird als Referenzsubstanz vorgeschlagen, da die Transformation von Salizyl-säure unter anaeroben Testbedingungen bereits in Schweine- und Rindergülle untersucht wurde und eine hohe Mineralisierung zu CO2 und CH4 nachgewiesen werden konnte (Hen-necke et al., 2015; Herrchen et al., 2016). Sofern eine Referenzsubstanz getestet wird, besteht keine Notwendigkeit zur weiteren Testung auf mikrobielle Aktivität der Gülle (z.B. Minerali-sierung von 14C-Glukose).
▸ Die Testung einer Gülle wird als ausreichend angesehen, sofern diese den vorgegebenen Mat-rixparametern entspricht, zeitgleich die Mineralisierung der Referenzsubstanz in der Gülle untersucht wird.
▸ Autoklavieren wird zur Herstellung von Sterilproben empfohlen. Das Autoklavieren sollte mindestens zweimal erfolgen und die Proben sollten zuvor erhitzt werden (100°C für mindes-tens 12 Stunden).
▸ Die Zeitspanne zum Austreiben von potentiell gelöstem 14CO2 nach Ansäuern der Gülleprobe sollte mindestens 24 Stunden betragen. Falls ein halbstatisches Testdesign verwendet wird, könnte eine zusätzliche Durchlüftung der Gülle notwendig sein. Hierzu Stickstoff sollte ver-wendet werden, um anaerobe Bedingungen sicherzustellen.

Transformation of veterinary pharmaceuticals and biocides in (liquid) manure
23
▸ Falls möglich sollte auch entstandenes 14CH4 bestimmt werden, um Verluste und unvollstän-dige Massenbilanzen zu vermeiden. Weiterhin kann die Messung von 14CH4 zum Nachweis von methanogenen Mikroorganismen in der Gülle verwendet werden.
▸ Unter Berücksichtigung von Häufigkeitsverteilungen und Boxplot-Diagrammen kann ein Qualitätskriterium von 100 ± 15% aR für die Massenbilanz bei Testbeginn, sowie für die mitt-lere Massenbilanz für alle Probenahmezeitpunkte im Testverlauf empfohlen werden.
▸ Basierend auf chi2-Fehlern und Residuendiagrammen wird das SFO-Modell wird als geeignet angesehen, um DT50-Werte zu bestimmen.
▸ Die Mengen an extrahierbaren Rückständen (ER) und nicht-extrahierbaren Rückständen (NER) sind abhängig von der verwendeten Extraktionsmethode. Aus diesem Grund müssen die analytischen Methoden (inklusive Extraktions- und Aufreinigungsmethoden) sorgfältig entwickelt, validiert und berichtet werden.
▸ Transformationsprodukte müssen mit einbezogen und bei der Methodenentwicklung berück-sichtigt werden. Für LC-MS/MS-Analytik ist eine gründliche Aufreinigung der Gülleextrakte erforderlich. Darüber hinaus wird die Verwendung eines internen Standards dringend emp-fohlen.
▸ Im Ringversuch konnte eine geringe Variabilität und Streuung der Ergebnisse für extrahierba-re Rückstände (Variationskoeffizient (COV) bei Testende: 31.0-40.7%), nicht-extrahierbare Rückstände (COV bei Testende: 32.1-54.1%) und DT50-Werte (Gesamt-COV: 37.2-52.6%), so-wie insbesondere für die Massenbilanz (COV bei Testende: 9.8-10.0%) erreicht werden.
Schlussfolgerungen
Der Entwurf der Testvorschrift erwies sich in verschiedenen Laboratorien mit unterschiedlich großer Erfahrung bei der Arbeit mit Gülle, sowie bei der Verwendung unterschiedlicher Versuchsaufbauten als anwendbar. Die Testvorschrift erscheint durchaus robust im Hinblick auf Änderungen bezüglich Testequipment und Versuchsaufbau.
Die beobachtete Variabilität zwischen den teilnehmenden Laboratorien erlaubt die Gewinnung ver-lässlicher und reproduzierbarer Ergebnisse, welche für die Charakterisierung des Verbleibs und der Transformation von Chemikalien in Gülle geeignet sind.
Zusammenfassend kann somit festgestellt werden, dass die in der aktuellen Version des Richtlinien-entwurfs beschriebene experimentelle Methode (siehe Annex 1) gut geeignet ist, um die Transforma-tion organischer Substanzen, inklusive Veterinärpharmaka und Biozide, unter anaeroben Bedingun-gen in flüssiger Gülle zu untersuchen.
Transformation of veterinary pharmaceuticals and biocides in (liquid) manure
24
Summary
Objective
The aim of the project was to further develop a draft test protocol for an experimental method to study the transformation of veterinary pharmaceuticals and biocides in cattle and pig liquid manure and to start the validation of the method by conducting a ring test.
Background
Spreading of manure constitutes an important pathway by which veterinary medicinal products (VMP) and biocides enter the environment. For this reason, current guidance (e.g. „Guideline on de-termining the fate of veterinary medicinal products in manure“ (EMA, 2011) take transformation of VMPs and biocides in manure into account. However, currently, there is no standardized experi-mental test protocol available to examine the transformation of veterinary medicinal products (VMP) and biocides in liquid manure. The EMA guideline on transformation in manure (EMA, 2011) con-tains basic regulatory requirements. To allow for a consistent assessment of studies within regulatory frameworks, a harmonized internationally accepted and validated test method is needed. In a previ-ous research project, a test protocol was developed in multiple steps taking into account experiences from labs performing simulation type studies like transformation of chemicals in soil and in water-sediment systems and adapting their test design to the specific requirements of the matrix manure.
The test protocol describes methods to examine the transformation of chemicals in pig and cattle manure (90-95% water content) under anaerobic conditions. The experiments are performed to de-termine the rate of transformation of the test substance, the identity and rates of formation and de-cline of transformation products, the amount of test substance that is mineralized to CO2 or CH4 or other volatiles, and the amount of non-extractable residues (NER).
Liquid manure samples are treated with the test substance and incubated in the dark under con-trolled laboratory conditions. After appropriate time intervals, manure samples are removed, extract-ed and analyzed for the parent substance and for transformation products. Volatile products are col-lected for analysis using appropriate trapping devices to quantify formation of CO2 and CH4. Using 14C-radiolabelled material, mineralization rates of the test substance can be measured and a mass balance, including the formation of NER, can be established. Results enable the calculation of DT50-values, and, if appropriate, DT90-values.
The experimental method was developed by testing three different VMP and biocide active ingredi-ents. The method was refined by results from discussions with stakeholders at four international meetings (2012 Berlin, 2013 Glasgow, 2014 Basel, 2015 Barcelona). In 2012/13 an international pre-validation ring test was conducted to get a first impression on how the protocol performs when transferred to other labs. The experiences of the participants were collected and discussed in detail in a technical two-day workshop held in Flörsheim in 2013. The developed test protocol was changed according to the recommendations from this workshop. This test protocol formed the basis for a ring test that was conducted 2013/14 with the purpose to validate the test protocol and derive criteria for quality and reproducibility of the test results. Following this validation ring test a two day interna-tional workshop held in Giessen in 2014 served to collect the experiences from the participants and to increase clarity and unambiguity of the draft test protocol.
Transformation of veterinary pharmaceuticals and biocides in (liquid) manure
25
Ring test for validation of a draft test protocol for studies on transformation in manure
To test the applicability of the revised draft test method, an international inter-laboratory comparison (ring test) was organized. For that purpose, 35 institutes from Europe, 4 institutes from Northern America and 2 institutes from Asia have been invited in March 2013 to participate in the ring test. In addition, an informative meeting has been organized in Glasgow in the framework of the 23rd SETAC Europe Annual Meeting in May 2013.
The following six institutes finally took part in the ring test (listed in alphabetical order):
▸ Agriculture and Agri-Food Canada (AAFC), London, Canada ▸ Noack Laboratorien GmbH, Sarstedt, Germany ▸ ECT Oekotoxikologie GmbH, Flörsheim, Germany ▸ Fraunhofer Institute for Molecular Biology and Applied Ecology (IME), Schmallenberg, Ger-
many ▸ IBACON GmbH, Rossdorf, Germany ▸ University Trier, Soil Science Department, Trier, Germany
The ring test was performed based on the experiences gained from a previous pre-validation ring test and the current version of the draft test guideline, which was handed out to all participants prior to the start of the experiments. Furthermore, substance-specific procedures for the performance of the ring test (e.g. test duration, sampling time points, test concentrations, radioactivity to be applied per test vessel, sterile controls, recommended extraction methods and analytical procedures, potential transformation products) were provided to all participants in advance.
The anaerobic transformation of two 14C-labeled compounds was tested at a temperature of 20 ± 2°C: one veterinary pharmaceutical in pig manure (14C-florfenicol) and one biocide in cattle manure (14C-imidacloprid). The compounds were chosen based on several selection criteria: the compounds do not degrade too fast and thus allow for a feasible and reproducible sampling; the substances are not persistent, which would result in a prolonged test period; degradation is mainly based on biological processes; requirements for chemical analyses are not extremely high; the position of the 14C-label enables the detection of main transformation products and the costs for synthesis of 14C-labeled compounds are acceptable.
In addition, the transformation of florfenicol in pig manure was investigated at 10 ± 2°C, using radio-labeled and unlabeled test compound to develop guidance on studying transformation products that arise during transformation in manure. Chemical analysis was performed by radio-HPLC (labeled) and LC-ESI-MS/MS (unlabeled). New extraction and clean-up procedures were developed.
The ring test experiments were performed between September 2013 and September 2014.
Evaluation of results
A 14C-mass balance was determined and calculated for each sampling time point by summing-up the amount of radioactivity [% of applied radioactivity; % aR] in the extracts (extractable residues, ER), non-extractable residues (NER) and mineralization (14CO2 and 14CH4). Since mass balances at the start of the experiments (day 0) showed differences between the participants, all results relating to the mass balance [% aR] are also presented in normalized from (mass balance at day 0 is set to 100% for each participant).
Results from one participant for florfenicol in pig manure had to be excluded from further evalua-tions as the applied extraction method deviated considerably from the recommended procedure in the ring test description handed out to all participants. Nonpolar extraction solvents were used which might have led to lower mass balances observed for these experiments.

Transformation of veterinary pharmaceuticals and biocides in (liquid) manure
26
DT50-values were determined for the parent compound and for transformation products (TP; only if a decrease is observed) to describe the kinetics of the disappearance of the test substance. DT50-values were calculated using “single first order” (SFO) kinetics by means of the KinGUI-software tool and were ln-transformed for calculation of mean and standard deviations. As a measure of the goodness of fit of the kinetic model selected, chi2-error values were determined and a visual check of the trans-formation plots was performed.
Results
Manure Matrix characterization parameters
The manure matrix parameters temperature, dry matter content, organic matter content, nitrogen content, as well as redox potential and pH value were determined by the participants throughout the test period. Temperatures measured in pig manure and cattle manure were within the required range of 20 ± 2°C. The pH-value was in the range between 7.4 and 9.3 for pig manure and between 6.1 and 8.8 for cattle manure. No time-dependent trend could be observed throughout the test period. All participants managed to establish redox potentials ≤ -100 mV in pig manure and cattle manure Thus, stable anaerobic conditions could be proved at any time during the experiments.
Disappearance of the parent compound
DT50-values for the test substances (parent compounds) were determined by means of the SFO-kinetic using the Software KinGUI. For imidacloprid in cattle manure mean DT50-values (20 ± 2°C) were in the range of 17.4 days to 40.0 days. For florfenicol in pig manure the range observed for mean DT50-values (20 ± 2°C) was between 0.17 days and 0.41 days. Mean DT50-vlaues determined for florfenicol in pig manure at a temperature of 10 ± 2°C were 1.4 days (unlabeled florfenicol) and 2.3 days (14C-labeled florfenicol).
Mean chi2-error of the fits was 21.3 ± 6.3% for florfenicol and 13.4 ± 4.4% for imidacloprid. Although chi2-error values are above 15% in most cases for florfenicol and imidacloprid, residual plots indicate no systematic error of the SFO model.
Mineralization
No noteworthy mineralization (neither 14CO2 nor 14CH4) could be measured in the experiments with florfenicol (maximum mineralization of 6% aR) and imidacloprid (maximum mineralization < 1% aR).
Extractable and non-extractable residues
A decrease in extractable residues (ER) for florfenicol and imidacloprid was observed over time. An increase of non-extractable residues (NER) was observed throughout the test period for both test compounds. At the end of the test the amount of NER after normalization (mass balance at day 0 was set to 100% aR) was between 30.8% aR and 61.0% aR for florfenicol in pig manure and between 11.3% aR and 65.3% aR for imidacloprid in cattle manure. The variation in extractable residues and non-extractable residues between the institutes at the end of the study might be caused by different extraction methods used by the participants.
Mass balance
At the beginning of the test, the mean mass balances for individual institutes were in the range be-tween 92.8% aR and 100.3% aR for florfenicol in pig manure and between 86.8% aR and 111.8% aR for imidacloprid in cattle manure. After normalization to 100% aR at day 0, mass balances averaged across all participating institutes throughout the test period were within 95.1% aR and 103.0% aR for florfenicol and within 92.3% aR and 103.7% aR for imidacloprid.

Transformation of veterinary pharmaceuticals and biocides in (liquid) manure
27
The mass balances of all ring test participants were evaluated. As a recommendation, a mass balance range of 100 ± 15% aR was derived.
Special method considerations for identification of transformation products
The transformation of florfenicol in pig manure at 10 ± 2°C was investigated using 14C-radiolabelled florfenicol and unlabeled test compound. Chemical analysis was performed by radio-HPLC (labeled) and LC-ESI-MS/MS (unlabeled). For the latter, an extraction and clean-up procedure was developed.
The results showed that florfenicol and its major transformation products are sufficiently extracted from manure using a threefold extraction with 0.02 M KH2PO4/ACN 1:1 (v:v). For LC-MS/MS-analysis, a thorough clean-up of the extract is required by using centrifugation at high acceleration and several clean-up steps with solid phase extraction materials as well as filtration. Yet, sample clean-up leads to losses of the analytes; recovery rates of about 60% were reached. Additional accelerated solvent extraction of the samples is not expedient.
Mixing florfenicol with manure is followed by a fast decline in florfenicol extractability. This is paral-leled by the formation of non-extractable residues that were quantified from 14C-labeled florfenicol.
Florfenicol is transformed into transformation products. Upon incubation, florfenicol amine and florfenicol oxamic acid as well as an unknown transformation product were formed in minor amounts followed by dissipation. With the combination of radio-HPLC and LC-ESI-MS/MS using product ion scan (PIS) and multiple reaction monitoring (MRM) experiments, it was not possible to discover further transformation products.
Based on the results the suggested transformation pathway for florfenicol is transformation to florfenicol amine by amide bond hydrolysis and to florfenicol oxamic acid through a substitution of fluorine with a hydroxyl group. Since no mass identification and thus molecular characterization of the unknown transformation product was possible, no transformation pathway can be suggested for this compound.
Development of the experimental method and the draft test guideline
The first version of the draft test guideline was compiled in the framework of the preceding project „Development of test guidance for transformation of veterinary pharmaceuticals and biocides in liq-uid manure“(Hennecke et al., 2015). The experimental test method was preliminary validated by intra-laboratory comparisons and an international inter-laboratory comparison (pre-validation ring test). Based on the results and the discussions during a workshop held in Flörsheim, Germany, in April 2013, the text of the draft test guideline has been revised and critical steps of the test perfor-mance have been specified more in detail (e.g. application of the test substance, a prolongation of the test duration up to 90 days, details on adjustment of the dry matter content).
The revised draft guideline was then used in an international ring test in 2013/2014. The applicabil-ity and feasibility of the test method were discussed at a two-day international technical workshop in Gießen, Germany in September 2014. Representatives of all ring test participants and international experts took part in the workshop. The main focus was the presentation and discussion of results and experiences of the participants with the test method. The current version of the draft test guideline was discussed in detail and revised based on the experiences of the participants. Annex documents were included to give more specific guidance on important steps of the procedure.
Based on the results of the ring test and the discussions at the workshop the following conclusions can be drawn:

Transformation of veterinary pharmaceuticals and biocides in (liquid) manure
28
▸ The test method described in the draft test guideline is applicable for routine measurements of the transformation of veterinary pharmaceuticals and biocides in pig and cattle manure.
▸ A semi-static test design should be used, whereas a strictly static test design is not recom-mended. A flow-through design might also be used for substances which show no or only low mineralization. More information can be found in Herrchen et al. (2016).
▸ Redox potentials in the typical range for liquid manure storage tanks or lagoons (from -230 mV to -400 mV (Weinfurtner, 2011)) can be ensured when using the test method described in the draft test guideline.
▸ A reference substance should be tested in parallel to the test compound to be able to ensure comparable conditions for different tests with different manures. Salicylic acid (e.g. as sodium salicylate CAS: 54-21-7 or as salicylic acid CAS: 69-72-7) is proposed as reference substance since it has been tested for transformation under anaerobic conditions in pig and cattle ma-nure and found to be mineralized to a high extend to CO2 and CH4 (Hennecke et al., 2015; Herrchen et al., 2016). If a reference substance is tested, there is no need to test for microbial activity (e.g. mineralization of 14C-glucose).
▸ One manure is considered to be sufficient if it conforms to the matrix parameters specified and the same manure is concurrently tested with the reference substance.
▸ Autoclaving is recommended to prepare sterile samples. Autoclaving should be performed at least twice and the samples should be preheated (100°C for at least 12 hours) in advance.
▸ The time period to strip out potentially dissolved 14CO2 after acidification of the manure should be at least 24 hours. If a semi-static test system is used, bubbling manure with nitro-gen might be necessary in addition. Nitrogen should be used to ensure anaerobic conditions.
▸ If feasible, 14CH4 should be determined to avoid losses and an incomplete mass balance. Fur-thermore, measurement of 14CH4 can be used to prove that methanogenic microorganisms are present in the manure.
▸ In consideration of frequency distributions and box-plot diagrams, a quality criterion of 100 ± 15% aR for mass balance at the beginning of the test, as well as for mean mass balances for all sampling time points throughout the test is recommended.
▸ The SFO model proved to be appropriate for determination of DT50-values based on Chi2error values and residual plots.
▸ The amounts of extractable residues (ER) and non-extractable residues (NER) depend on the extraction method used. Therefore, analytical methods (including extraction methods and clean-up methods) have to be carefully developed, validated and reported for each specific test substance.
▸ Transformation products have to be considered and to be included into the method develop-ment. For LC-MS/MS-analysis a thorough clean-up of manure extracts is required and the use of an internal standard is highly recommended.
▸ Low variability and spread in the results could be achieved in experiments in the ring test for extractable residues (COV at the end of the test: 31.0-40.7%), non-extractable residues (COV at the end of the test: 32.1-54.1%) and DT50 values (overall COV: 37.2-52.6%) and particular-ly for 14C-mass balances (COV at the end of the test: 9.8-10.0%).

Transformation of veterinary pharmaceuticals and biocides in (liquid) manure
29
Conclusions
The draft test protocol proved to be applicable in different laboratories with different levels of experi-ence in working with manure and using different experimental set-ups. The test protocol seems to be quite robust concerning variations in equipment and test setup. The observed variability in between different participating laboratories allows to obtain reliable and reproducible results suitable for the purpose of characterizing the fate and transformation of chemicals in manure.
In conclusion, the experimental method described in the current draft version of the test guideline (see Annex 1) is considered well-suited to examine the transformation of organic compounds, includ-ing veterinary pharmaceuticals and biocides, under anaerobic conditions in liquid manure.
Transformation of veterinary pharmaceuticals and biocides in (liquid) manure
30
1 Introduction Spreading of manure constitutes an important pathway by which veterinary medicinal products (VMP) and biocides enter the environment. For this reason, current guidance (e.g. „Guideline on de-termining the fate of veterinary medicinal products in manure“ (EMA, 2011) take transformation of VMPs and biocides in manure into account. However, currently, there is no standardized experi-mental test protocol available to examine the transformation of veterinary medicinal products (VMP) and biocides in liquid manure. The EMA guideline on transformation in manure (EMA, 2011) con-tains basic regulatory requirements. To allow for a consistent assessment of studies within regulatory frameworks, a harmonized internationally accepted and validated test method is needed. In a previ-ous research project a test protocol was developed in multiple steps taking into account experiences from labs performing simulation type studies like transformation of chemicals in soil and in water-sediment systems and adapting their test design to the specific requirements of the matrix manure.
The test protocol describes methods to examine the transformation of chemicals in pig and cattle manure under anaerobic conditions. The experiments are performed to determine the rate of trans-formation of the test substance, the identity and rates of formation and decline of transformation products, the amount of test substance that is mineralized to CO2 or CH4 or other volatiles, and the amount of non-extractable residues (NER).
Liquid manure samples are spiked with the test substance and incubated in the dark under controlled laboratory conditions. After appropriate time intervals, manure samples are removed, extracted and analyzed for the parent substance and for transformation products. Volatile products are collected for analysis using appropriate trapping devices to quantify formation of CO2 and CH4. Using 14C-radiolabelled material, mineralization rates of the test substance can be measured and a mass bal-ance, including the formation of NER, can be established. Results enable the calculation of DT50-values, and, if appropriate, DT90-values.
The experimental method was developed by testing three different VMP and biocide active ingredi-ents. Subsequently the method was refined by results from discussions with stakeholders at four in-ternational meetings (2012 Berlin, 2013 Glasgow, 2014 Basel, 2015 Barcelona). In 2012/2013 an international pre-validation ring test was conducted to get a first impression on how the protocol performs when transferred to another lab. The experiences of the participants were collected and discussed in detail in a technical two-day workshop held in Flörsheim in 2013. The developed test protocol was changed according to the recommendations from this workshop. This guideline formed the basis for a ring test that was conducted 2013/2014 with the purpose to validate the test protocol and derive criteria for validity and acceptability of the test results. Following this validation ring test a two-day international workshop held in Giessen in 2014 served to collect the experiences from the participants and to increase clarity and unambiguity of the draft test protocol.

Transformation of veterinary pharmaceuticals and biocides in (liquid) manure
31
2 Material and methods In order to test the applicability of the developed draft test method, an international inter-laboratory comparison (ring test) was organized.
For that purpose, thirty-five institutes from Europe, four institutes from Northern America and two institutes from Asia have been invited in March 2013 to take part in the ring test (see Annex 2 for the invitation, including outline of the ring test and registration form). In addition, an informative meet-ing has been organized in Glasgow in the framework of the 23rd SETAC Europe Annual Meeting in May 2013. Until September 2013 seven institutes (6 from Europe, 1 from Northern America) regis-tered for the ring-test. Unfortunately, two institutes had to cancel their participation short-term.
The following five institutes finally took part in the ring test (listed in alphabetical order):
▸ Agriculture and Agri-Food Canada (AAFC), London, Canada ▸ Noack Laboratorien GmbH, Sarstedt, Germany ▸ ECT Oekotoxikologie GmbH, Flörsheim, Germany ▸ Fraunhofer Institute for Molecular Biology and Applied Ecology (IME), Schmallenberg, Ger-
many ▸ IBACON GmbH, Rossdorf, Germany ▸ University Trier, Soil Science Department, Faculty VI, Trier, Germany
In addition, to include the identification of transformation products in more detail, the transfor-mation of one test compound (florfenicol in pig manure) was investigated by one institute (Institute 6), using radiolabeled and unlabeled test compound. Chemical analysis was performed by radio-HPLC (labeled) and LC-ESI-MS/MS (unlabeled). For the latter, a new extraction and clean-up proce-dure was developed.
2.1 Test compounds Two 14C-labeled compounds were tested: one veterinary pharmaceutical (14C-florfenicol, Batch-No. CFQ41813) in pig manure and one biocide (14C-imidacloprid, Batch-No. CFQ41814) in cattle manure.
The compounds were selected based on regulatory relevance, i.e. the compounds had already been examined in respective marketing authorization applications. The substances were chosen to reflect a different range of physical-chemical properties and different behavior in manure: florfenicol is a ra-ther polar antibiotic compound. It is expected to be rapidly transformed in manure while forming high amounts of non-extractable residues. Imidacloprid in contrast is an insecticide belonging to the neonicotinoids. It is less polar than florfenicol and expected to exhibit a longer half-life in manure than florfenicol. The participating labs could either test the two compounds in parallel or run con-secutive experiments (e.g. due to limited lab space).
Moreover, the compounds fulfil the following requirements:
▸ The compounds do not degrade extremely fast and thus allow for a feasible and reproducible sampling.
▸ The substances are not persistent, which would result in a prolonged test period. ▸ Degradation is mainly based on biological processes. ▸ Requirements for chemical analyses are not extremely high. ▸ The position of the 14C-label enables the detection of main transformation products. ▸ The costs for synthesis of 14C-labeled compounds are acceptable.
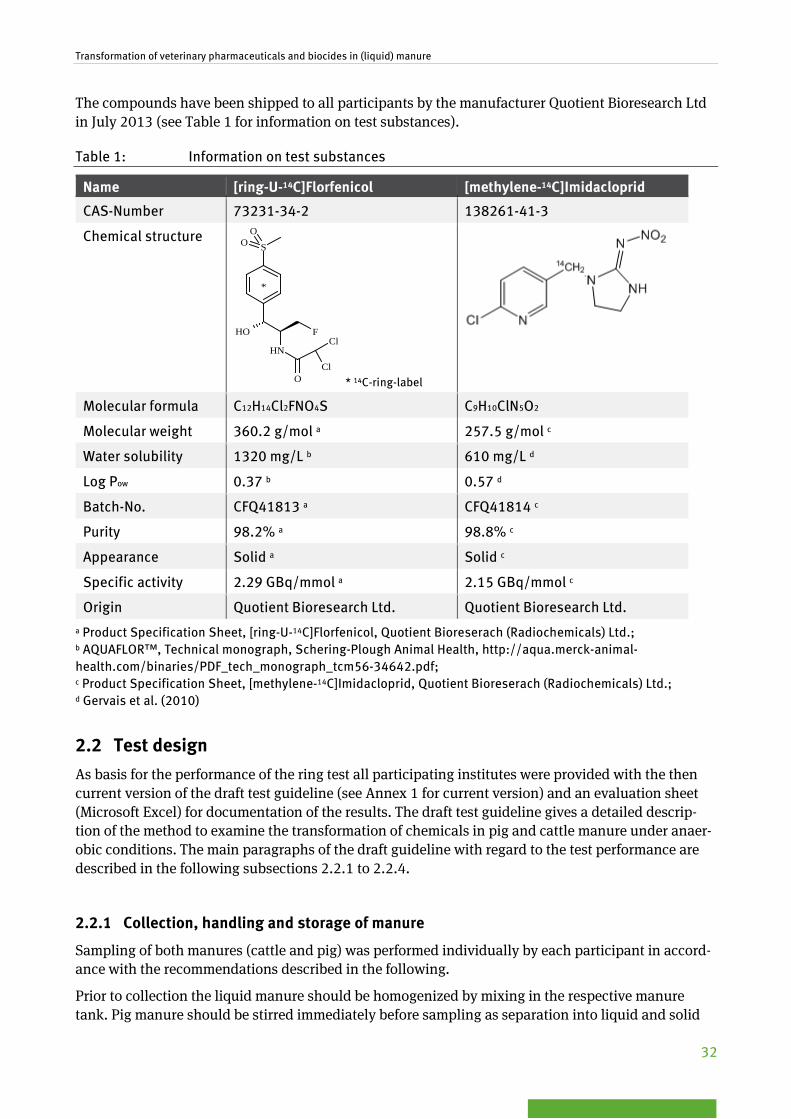
Transformation of veterinary pharmaceuticals and biocides in (liquid) manure
32
The compounds have been shipped to all participants by the manufacturer Quotient Bioresearch Ltd in July 2013 (see Table 1 for information on test substances).
Table 1: Information on test substances
Name [ring-U-14C]Florfenicol [methylene-14C]Imidacloprid
CAS-Number 73231-34-2 138261-41-3
Chemical structure
* 14C-ring-label
Molecular formula C12H14Cl2FNO4S C9H10ClN5O2
Molecular weight 360.2 g/mol a 257.5 g/mol c
Water solubility 1320 mg/L b 610 mg/L d
Log Pow 0.37 b 0.57 d
Batch-No. CFQ41813 a CFQ41814 c
Purity 98.2% a 98.8% c
Appearance Solid a Solid c
Specific activity 2.29 GBq/mmol a 2.15 GBq/mmol c
Origin Quotient Bioresearch Ltd. Quotient Bioresearch Ltd. a Product Specification Sheet, [ring-U-14C]Florfenicol, Quotient Bioreserach (Radiochemicals) Ltd.; b AQUAFLOR™, Technical monograph, Schering-Plough Animal Health, http://aqua.merck-animal-health.com/binaries/PDF_tech_monograph_tcm56-34642.pdf; c Product Specification Sheet, [methylene-14C]Imidacloprid, Quotient Bioreserach (Radiochemicals) Ltd.; d Gervais et al. (2010)
2.2 Test design As basis for the performance of the ring test all participating institutes were provided with the then current version of the draft test guideline (see Annex 1 for current version) and an evaluation sheet (Microsoft Excel) for documentation of the results. The draft test guideline gives a detailed descrip-tion of the method to examine the transformation of chemicals in pig and cattle manure under anaer-obic conditions. The main paragraphs of the draft guideline with regard to the test performance are described in the following subsections 2.2.1 to 2.2.4.
2.2.1 Collection, handling and storage of manure
Sampling of both manures (cattle and pig) was performed individually by each participant in accord-ance with the recommendations described in the following.
Prior to collection the liquid manure should be homogenized by mixing in the respective manure tank. Pig manure should be stirred immediately before sampling as separation into liquid and solid
SOO
FOH
NH
OCl
Cl
*
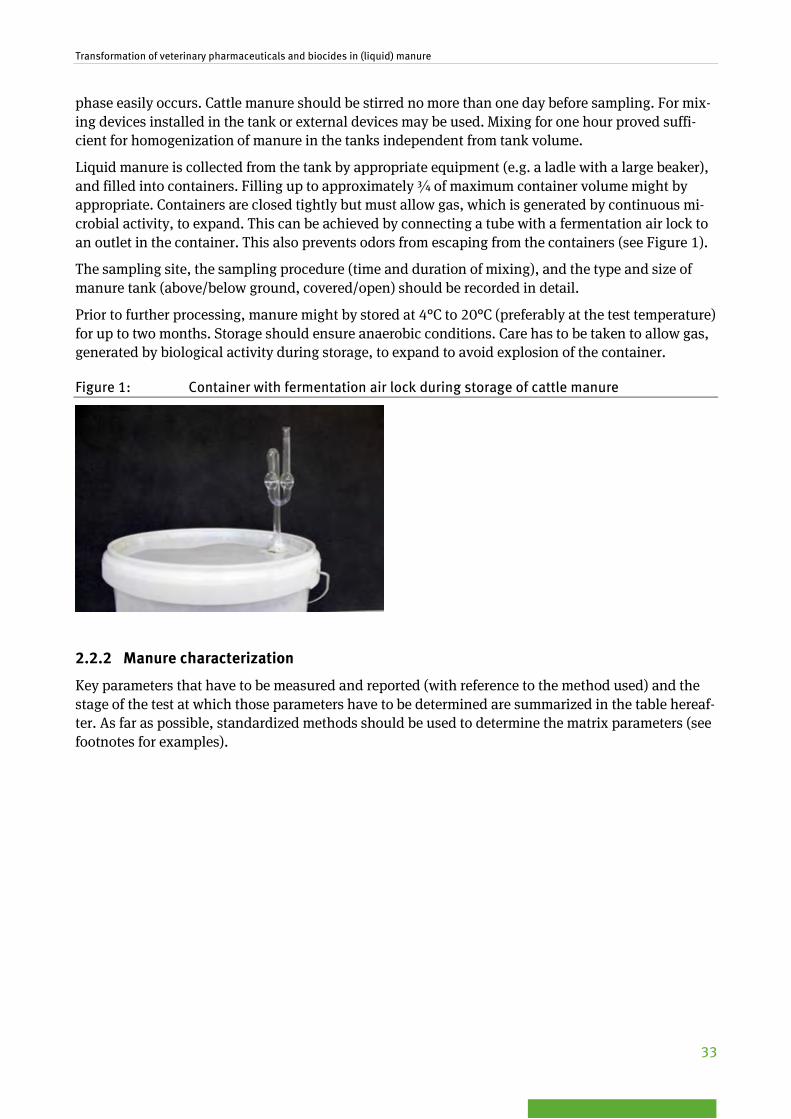
Transformation of veterinary pharmaceuticals and biocides in (liquid) manure
33
phase easily occurs. Cattle manure should be stirred no more than one day before sampling. For mix-ing devices installed in the tank or external devices may be used. Mixing for one hour proved suffi-cient for homogenization of manure in the tanks independent from tank volume.
Liquid manure is collected from the tank by appropriate equipment (e.g. a ladle with a large beaker), and filled into containers. Filling up to approximately ¾ of maximum container volume might by appropriate. Containers are closed tightly but must allow gas, which is generated by continuous mi-crobial activity, to expand. This can be achieved by connecting a tube with a fermentation air lock to an outlet in the container. This also prevents odors from escaping from the containers (see Figure 1).
The sampling site, the sampling procedure (time and duration of mixing), and the type and size of manure tank (above/below ground, covered/open) should be recorded in detail.
Prior to further processing, manure might by stored at 4°C to 20°C (preferably at the test temperature) for up to two months. Storage should ensure anaerobic conditions. Care has to be taken to allow gas, generated by biological activity during storage, to expand to avoid explosion of the container.
Figure 1: Container with fermentation air lock during storage of cattle manure
2.2.2 Manure characterization
Key parameters that have to be measured and reported (with reference to the method used) and the stage of the test at which those parameters have to be determined are summarized in the table hereaf-ter. As far as possible, standardized methods should be used to determine the matrix parameters (see footnotes for examples).

Transformation of veterinary pharmaceuticals and biocides in (liquid) manure
34
Table 2: Measurement of matrix parameters for characterization of liquid manure
Parameter1 Stage of test procedure Sampling
(on site) Start of
acclimation Start of
test During
test End of test
pH2 X X X X X
microbial activity3 (X)4 X X
organic matter content [%OM]5 X X
nitrogen content [Ntotal; mg/kg]6 X X
nitrogen content [NH4-N; mg/kg]7 X X
redox potential [mV]8 X X X X X
dry matter content [%]9 X X X X
temperature [°C] X X X X X
2.2.3 Acclimation
Prior to the start of the acclimation period, the dry matter content of the manure has to be deter-mined. To get comparable conditions it has to be adjusted to standardized values. The recommended dry matter content in cattle and pig manure is 10% ± 1% and 5% ± 1%, respectively (EMA (2011), Weinfurtner (2011). If the dry matter content is below the recommended value, it can be concentrat-ed by careful centrifugation (e.g. for 10 minutes at 740 × g). However, the initial dry matter content should not be below 8% (cattle) or 3% (pig). If dry matter content is too high, water (deionized water, bubbled with nitrogen for 30 min) should be added as needed.
Thereafter, cattle manure should be homogenized by mixing. No additional measures to prevent in-troduction of oxygen are used. Subsamples of 50 – 100 g (wet weight) each should be directly filled into the incubation vessels which are used for the acclimation and transformation study.
1 For all matrix parameters it has to be specified in the report whether they relate to dry or to wet mass of the sample. 2 e.g. ISO 10390 „Soil quality -- Determination of pH“ (ISO, 2005) 3 Optional. For testing the microbial activity several suggestions exist.
a) Reduction of DMSO to DMS (EMA (2011), Greibler and Slezak (2001)).
b) Mineralization of a readily degradable 14C-labeled substance (e.g., 14C-glucose) under anaerobic conditions (see An-nex 4 of the draft test guideline in Annex 1). This method was not recommended for the ring test due to low predictivity in pre-validation ringtest.
c) Determination of gas volume (e.g. VDI-Richtlinie 4630 „Fermentation of organic materials“, http://www.vdi.de/uploads/tx_vdirili/pdf/9703240.pdf).
It is recommended to use a reference substance concurrently with each test (see section 3.12.1.2). 4 In brackets are optional determinations 5 e.g. DIN 12879 „Charakterisierung von Schlämmen - Bestimmung des Glühverlustes der Trockenmasse” (DIN, 2001a) 6 e.g. ISO 11261 “Soil quality - Determination of total nitrogen - Modified Kjeldahl method” (ISO, 1995). For conversion
of mass based units in volume based units a density of 0.001 kg/m3 is used 7 e.g. ISO 5664 “Water quality - Determination of ammonium - Distillation and titration method” (ISO, 1984). 8 e.g. ISO 11271 “Soil quality - Determination of redox potential - Field method” (ISO, 2002) and/or DIN 38404-6 “De-
termination of the oxidation reduction (redox) potential” (DIN,1984) 9 e.g. DIN 12880 “Characterization of sludges - Determination of dry residue and water content” (DIN, 2001b)
Transformation of veterinary pharmaceuticals and biocides in (liquid) manure
35
Pig manure should be homogenized under anaerobic conditions in order to obtain a fairly stable phase. This can be achieved, e.g. by filling the manure into a beaker, putting a mixer/homogenizer (e.g. hand blender) into the manure, and gently passing a nitrogen stream over the manure while mixing. Thereafter, the dry matter content should be adjusted. After a repeated homogenization un-der anaerobic conditions by thoroughly mixing (set up as above) subsamples of 50 – 100 g (fresh weight) are filled into the incubation vessels.
If a flow through apparatus is used, the incubation apparatus has to be closed and a constant, water saturated stream of nitrogen is passed over the manure at a rate in the range of approximately 50 - 200 mL/min. If a semi-static apparatus is used, the incubation system is flushed with moistened ni-trogen for one hour to maintain anaerobic conditions. Subsequently, the incubation system is closed by valves. At regular intervals, the incubation system should be connected to the flow-through appa-ratus and purged with moistened nitrogen for pressure compensation.
The acclimation should be carried out for 21 ±1 days at test temperature.
2.2.4 Test conditions
2.2.4.1 Test temperature and light conditions
During the whole test period the manure samples should be incubated in the dark at the appropriate test temperature. Typical environmental temperatures observed in manure tanks are 10°C for Central European climate conditions (EFSA, 2007, Hennecke et al., 2015, Weinfurtner, 2011). In other re-gions, different temperatures might be considered typical. To facilitate laboratory studies, studies may be conducted at 20 °C (range of ± 2 °C) and resulting DTx values converted to environmentally relevant temperatures (FOCUS, 2006). To determine the pathway of transformation, environmentally relevant temperatures might have to be used.
2.2.4.2 Anaerobic incubation conditions
Transformation studies in cattle and pig manure should be performed under anaerobic conditions. Anaerobic conditions should be demonstrated by Eh ≤ -100 mV (OECD, 2002b). Redox potentials measured in pig and cattle manure have been found to range from -230 mV to -400 mV (Weinfurtner, 2011) and experimental conditions should be comparable. Redox potential should be measured and recorded at least as often that stable anaerobic conditions can be assured throughout the experiment.
2.2.4.3 Abiotic controls
For information on the abiotic transformation of the test substance it is recommended to include ster-ile controls. For substances undergoing rapid abiotic transformation otherwise no meaningful results might be deduced from the study. Manure may be sterilized, treated with sterile test substance and flasks kept closed carefully. Sampling of sterile controls should be according to the sampling sched-ule but sampling can be reduced to fewer time points. Sterile controls should be sampled at the end of the test. Sterilization can be achieved by autoclaving twice (e.g. 15 min, 121°C, 100 bar). It might be helpful to pre-heat the manure to be autoclaved at 100°C overnight if severe foaming is otherwise observed.

Transformation of veterinary pharmaceuticals and biocides in (liquid) manure
36
Figure 2: Sterile control sample
2.2.4.4 Treatment and application of test substance
The test substance should be dosed into the manure at a concentration that reflects the maximum expected manure concentration. If this concentration is not sufficient for detection and identification of transformation products, the test may be conducted at increased substance start concentrations. However, excessively high concentrations should be avoided.
The test substance should be dissolved in an appropriate solvent and should be added into the accli-mated manure in the respective incubation vessels followed by thoroughly mixing while maintaining anaerobic conditions. This can be achieved, e.g., as follows: during application passing the nitrogen stream over the samples has to be maintained. The required volume of stock solution should be pipet-ted into the manure under simultaneous stirring using the pipette tip. As soon as the solution is even-ly distributed in the manure the pipette tip remains in the manure. The total volume of a water misci-ble organic solvent used for application should not exceed 1% by volume.
2.2.4.5 Test duration and sampling
Test duration will depend on the rate of transformation of the parent compound and transformation products. The maximum study duration is 90 days. This time was derived from a survey on typical manure storage times (VICH, 2008). In certain cases it might be reasonable to prolong the study. Ide-ally, the test substance and transformation products should each be present in amounts below 10% of the applied amount at the end of the study. If the study is further prolonged, e.g. because increas-ing amounts of transformation products have been observed, a test for microbial activity may be con-ducted at the beginning and end of the prolongation period. It might therefore be useful to have a further spare incubation vessel for this purpose.
At least duplicate incubation flasks are sacrificed per sampling. Sampling intervals should be select-ed in a way that the pattern of decline of the test substance, and the pattern both of formation and decline of transformation products can be established (e.g. 0, 1, 3, 7 days; 2, 3 weeks; 1, 2, 3 months, etc.). Besides sampling directly after application at least 9 additional sampling points should be included. More sampling time points may be necessary for kinetic modeling according to FOCUS recommendations (FOCUS, 2006) and to include transformation products. An experiment prior to the test start might give valuable indications for the behavior of the test substance and transformation

Transformation of veterinary pharmaceuticals and biocides in (liquid) manure
37
products. In some cases rapid dissipation of the test substance may be observed and sampling time points have to be adjusted accordingly.
Traps to measure mineralization are removed at the same time intervals and analyzed for trapped 14CO2 and other evolved gases, respectively. Sampling procedures for the flow-through system and the static system are described in Annex 2 and Annex 4 of the draft guideline (see Annex 1 of this report).
2.2.4.6 Measurements and analysis
Manure samples are cleaned-up directly after sampling. The samples are extracted with appropriate solvents of different polarity. A sequential extraction approach should be followed for optimal recov-ery of parent substance and transformation products of different polarity. Aqueous solvent mixtures and acid and base systems should be used as solvents to ensure extraction of more polar transfor-mation products. In case non-extractable residues are observed, exhaustive extraction methods should be applied additionally. These methods comprise e.g. pressurized liquid extraction (e.g. ASE®), reflux, soxhlet etc. with appropriate solvents. Extracts are quantified by liquid scintillation counting (LSC). When using 14C-labeled test substance, the residues remaining after the last extrac-tion step (non-extractable residues, NER) will be quantified by combustion and a mass balance will be calculated for each sampling interval. Analytes should not be altered by the respective extraction method. This can be demonstrated by appropriate controls for the known substances.
Figure 3: Measurement of radioactivity in extracts and in non-extractable residues
left: liquid scintillation counter (LSC) to determine radioactivity in extracts (extractable residues, ER); right: sample oxidizer for combustion of dried manure residues after extraction (non-extractable residues, NER)
Concentration of the test substance and the transformation products at every sampling time should be determined and reported. In general, transformation products detected at ≥ 10% of the applied radioactivity at any sampling time should be identified. Transformation products for which concen-trations are continuously increasing during the study should also be identified, even if their concen-trations do not exceed the limit given above, as this may indicate persistence.
Typically, identification is accomplished either by co-chromatography of the transformation product with known standards using two dissimilar systems or by techniques capable of positive structural identification such as MS, NMR, etc. In the case of co-chromatography, chromatographic techniques utilizing the same stationary phase with two different solvent systems are not adequate for the verifi-cation of the transformation product identity, since the methods are not independent. Identification by co-chromatography should be obtained using two dissimilar, analytically independent systems, such as reverse and normal phase thin layer chromatography (TLC) or TLC and high performance liquid chromatography (HPLC). Provided that the chromatographic separation is of suitable quality, then additional confirmation by spectroscopy is not required. Unambiguous identification can also
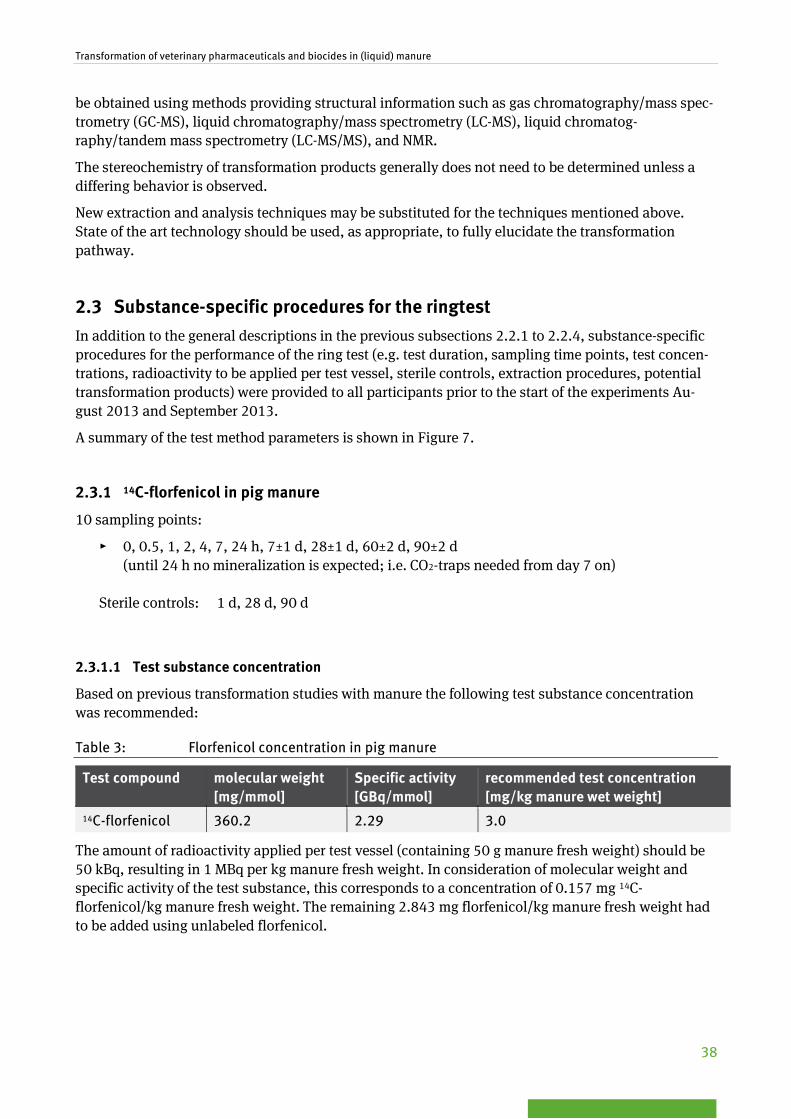
Transformation of veterinary pharmaceuticals and biocides in (liquid) manure
38
be obtained using methods providing structural information such as gas chromatography/mass spec-trometry (GC-MS), liquid chromatography/mass spectrometry (LC-MS), liquid chromatog-raphy/tandem mass spectrometry (LC-MS/MS), and NMR.
The stereochemistry of transformation products generally does not need to be determined unless a differing behavior is observed.
New extraction and analysis techniques may be substituted for the techniques mentioned above. State of the art technology should be used, as appropriate, to fully elucidate the transformation pathway.
2.3 Substance-specific procedures for the ringtest In addition to the general descriptions in the previous subsections 2.2.1 to 2.2.4, substance-specific procedures for the performance of the ring test (e.g. test duration, sampling time points, test concen-trations, radioactivity to be applied per test vessel, sterile controls, extraction procedures, potential transformation products) were provided to all participants prior to the start of the experiments Au-gust 2013 and September 2013.
A summary of the test method parameters is shown in Figure 7.
2.3.1 14C-florfenicol in pig manure
10 sampling points:
▸ 0, 0.5, 1, 2, 4, 7, 24 h, 7±1 d, 28±1 d, 60±2 d, 90±2 d (until 24 h no mineralization is expected; i.e. CO2-traps needed from day 7 on)
Sterile controls: 1 d, 28 d, 90 d
2.3.1.1 Test substance concentration
Based on previous transformation studies with manure the following test substance concentration was recommended:
Table 3: Florfenicol concentration in pig manure
Test compound molecular weight [mg/mmol]
Specific activity [GBq/mmol]
recommended test concentration [mg/kg manure wet weight]
14C-florfenicol 360.2 2.29 3.0
The amount of radioactivity applied per test vessel (containing 50 g manure fresh weight) should be 50 kBq, resulting in 1 MBq per kg manure fresh weight. In consideration of molecular weight and specific activity of the test substance, this corresponds to a concentration of 0.157 mg 14C-florfenicol/kg manure fresh weight. The remaining 2.843 mg florfenicol/kg manure fresh weight had to be added using unlabeled florfenicol.

Transformation of veterinary pharmaceuticals and biocides in (liquid) manure
39
Table 4: Putative transformation products (TP)/suggested reference compounds for florfenicol
Substance CAS-No: Remark Producer/supplier
florfenicol 73231-34-2 available Sigma-Aldrich
florfenicol alcohol presumably not available commercially
monochloroflorfenicol presumably not available commercially, probably first TP to be formed
florfenicol oxamic acid presumably not available commercially
florfenicol amine 76639-93-5 available Sigma-Aldrich
N-[2-Hydroxy-2-(4-methanesulfonyl-phenyl)-1-methyl-ethyl]-acetamide
presumably not available commercially
N-[1-Fluoromethyl-2-hydroxy-2-(4-methanesulfonyl-phenyl)-ethyl]-acetamide
presumably not available commercially
2.3.1.2 Extraction method and analytical procedures
The following two extraction procedures were recommended and provided to the participants (all amounts given refer to 50 g manure wet weight per test vessel):
Method proposal 1
The incubated manure sample is extracted with 50 mL of 0.02 M KH2PO4 solution: Acetonitrile (ACN) 1:1 (v:v) by shaking for 20 min followed by centrifugation at 2600 g for 10 min. This procedure is repeated 2 additional times and the (supernatant) extracts are combined and aliquots are submitted to LSC analysis. Before performing HPLC-RAM or LC-MS/MS analysis, the samples are filtered appro-priately (e.g. 0.2 µm PTFE filters).
HPLC on a RP18 column is performed using the following eluents: 20 mM ammonium acetate, pH 4 (Solvent A) and acetonitrile (ACN) (Solvent B). The program is described below
Time in min % Solvent A %Solvent B 0 95 5 2 95 5 38 5 95 42 5 95 43 95 5 47 95 5
For LC-MS/MS quantification and identification further dilution/clean-up of samples is recommended and different eluents/gradient programs might be appropriate (see chapters 2.3.1.3 and 3.11).
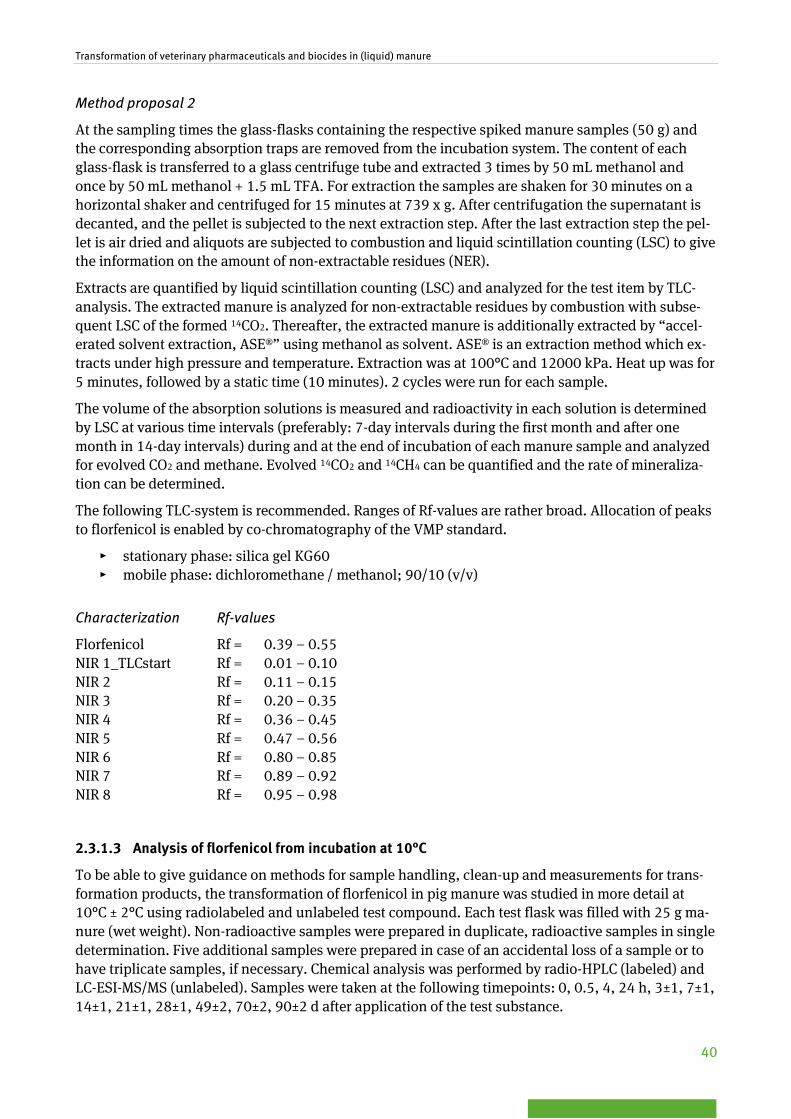
Transformation of veterinary pharmaceuticals and biocides in (liquid) manure
40
Method proposal 2
At the sampling times the glass-flasks containing the respective spiked manure samples (50 g) and the corresponding absorption traps are removed from the incubation system. The content of each glass-flask is transferred to a glass centrifuge tube and extracted 3 times by 50 mL methanol and once by 50 mL methanol + 1.5 mL TFA. For extraction the samples are shaken for 30 minutes on a horizontal shaker and centrifuged for 15 minutes at 739 x g. After centrifugation the supernatant is decanted, and the pellet is subjected to the next extraction step. After the last extraction step the pel-let is air dried and aliquots are subjected to combustion and liquid scintillation counting (LSC) to give the information on the amount of non-extractable residues (NER).
Extracts are quantified by liquid scintillation counting (LSC) and analyzed for the test item by TLC-analysis. The extracted manure is analyzed for non-extractable residues by combustion with subse-quent LSC of the formed 14CO2. Thereafter, the extracted manure is additionally extracted by “accel-erated solvent extraction, ASE®” using methanol as solvent. ASE® is an extraction method which ex-tracts under high pressure and temperature. Extraction was at 100°C and 12000 kPa. Heat up was for 5 minutes, followed by a static time (10 minutes). 2 cycles were run for each sample.
The volume of the absorption solutions is measured and radioactivity in each solution is determined by LSC at various time intervals (preferably: 7-day intervals during the first month and after one month in 14-day intervals) during and at the end of incubation of each manure sample and analyzed for evolved CO2 and methane. Evolved 14CO2 and 14CH4 can be quantified and the rate of mineraliza-tion can be determined.
The following TLC-system is recommended. Ranges of Rf-values are rather broad. Allocation of peaks to florfenicol is enabled by co-chromatography of the VMP standard.
▸ stationary phase: silica gel KG60 ▸ mobile phase: dichloromethane / methanol; 90/10 (v/v)
Characterization Rf-values
Florfenicol Rf = 0.39 – 0.55 NIR 1_TLCstart Rf = 0.01 – 0.10 NIR 2 Rf = 0.11 – 0.15 NIR 3 Rf = 0.20 – 0.35 NIR 4 Rf = 0.36 – 0.45 NIR 5 Rf = 0.47 – 0.56 NIR 6 Rf = 0.80 – 0.85 NIR 7 Rf = 0.89 – 0.92 NIR 8 Rf = 0.95 – 0.98
2.3.1.3 Analysis of florfenicol from incubation at 10°C
To be able to give guidance on methods for sample handling, clean-up and measurements for trans-formation products, the transformation of florfenicol in pig manure was studied in more detail at 10°C ± 2°C using radiolabeled and unlabeled test compound. Each test flask was filled with 25 g ma-nure (wet weight). Non-radioactive samples were prepared in duplicate, radioactive samples in single determination. Five additional samples were prepared in case of an accidental loss of a sample or to have triplicate samples, if necessary. Chemical analysis was performed by radio-HPLC (labeled) and LC-ESI-MS/MS (unlabeled). Samples were taken at the following timepoints: 0, 0.5, 4, 24 h, 3±1, 7±1, 14±1, 21±1, 28±1, 49±2, 70±2, 90±2 d after application of the test substance.

Transformation of veterinary pharmaceuticals and biocides in (liquid) manure
41
Analysis of non-radiolabeled florfenicol was done using a Shimadzu LC-20 HPLC (Shimadzu, Duis-burg, Germany) coupled to an API 3200 LC-ESI-MS/MS (Applied Biosystems/MDS Sciex Instruments, Toronto, Canada). The HPLC consisted of two LC-20 AD pumps, an autosampler SIL- 20 AC, a column oven CTO-10ASvp, and a system controller CBM-20A Lite. A Sunfire C18, 3.5 µm, 3.0×20 mm guard column and a Sunfire C18, 3.5 µm, 3.0×100 mm (Waters, Eschborn, Germany) were used for separa-tion of florfenicol and its transformation products from other matrix components. The eluent consist-ed of 20 mM HCOOH (formic acid) in water + 5% ACN (solvent A) and 20 mM HCOOH in ACN (solvent B) which were delivered in a gradient program.
Each sample was analyzed in product ion scan (PIS) and multiple reaction monitoring (MRM) exper-iments using positive and negative ionization mode. The sample injection volume was 10 µL. To re-duce the number of analytes and masses investigated at a single time, three methods were defined with three individual sets of masses detected. Consequently, every single sample was analyzed with six different LC-MS/MS methods for PIS. The software Analyst 1.4.2 (Applied Biosystems/MDS Sciex Instruments) was used for analysis of the data obtained. Quantification of the transformation prod-ucts listed in Table 50 was done relatively to florfenicol. For florfenicol amine, though, a standard substance was commercially available and externally calibrated. Chloramphenicol was used as inter-nal standard. All three chemicals were obtained from Sigma Aldrich.
Analysis of 14C-radiolabelled florfenicol was done using an Agilent 1200 S system equipped with a Berthold LB 507 b radioactivity detector with yttrium-glass scintillation cell. Exactly similar mobile and stationary phases as well as further conditions were used as for the analysis of non-radiolabeled florfenicol using LC-MS/MS. This ensured unbiased comparison of retention times. It was only neces-sary to respect the different dead time of the two chromatographic systems, which was done by sub-tracting a value of 2 minutes. To detect the total radioactivity in extracts a MicroBeta LSC-Plate Coun-ter and LSC Cocktail Optiphase Supermix (Perkin Elmer) were used.
2.3.2 14C-imidacloprid in cattle manure
10 sampling points: 0 h, 3±1 d, 7±1 d, 10±1 d, 14±1 d, 21±1 d, 28±1 d, 42±2 d, 56±2 d, 72±2 d, and 90±2 d.
Sterile controls: 7 d, 56 d, 90 d.
Note: The aqueous photolysis half-life of imidacloprid is very short (3.98 x 10⁻² days (24°C, pH 7)). Therefore, please ensure that during incubation exposure to light is avoided (e.g. by wrapping the test vessels with aluminum foil).
2.3.2.1 Test substance concentrations
Based on previous transformation studies with manure the following test substance concentration was recommended:
Table 5: Imidacloprid concentration in cattle manure
Test compound molecular weight [mg/mmol]
Specific activity [GBq/mmol]
recommended test concentration [mg/kg manure wet weight]
14C-imidacloprid 257.5 2.15 1.0
The amount of radioactivity applied per test vessel (containing 50 g manure fresh weight) should be 50 kBq, resulting in 1 MBq per kg manure fresh weight. In consideration of molecular weight and specific activity of the test substance, this corresponds to a concentration of 0.120 mg 14C-
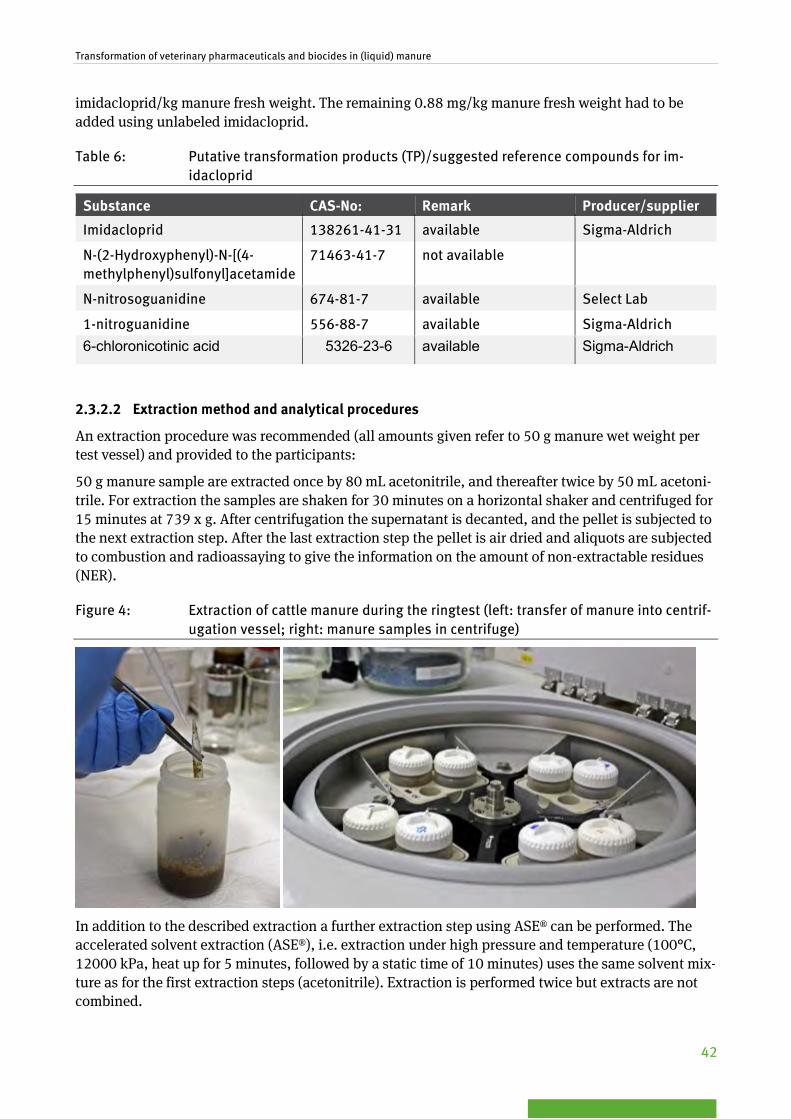
Transformation of veterinary pharmaceuticals and biocides in (liquid) manure
42
imidacloprid/kg manure fresh weight. The remaining 0.88 mg/kg manure fresh weight had to be added using unlabeled imidacloprid.
Table 6: Putative transformation products (TP)/suggested reference compounds for im-idacloprid
Substance CAS-No: Remark Producer/supplier
Imidacloprid 138261-41-31 available Sigma-Aldrich
N-(2-Hydroxyphenyl)-N-[(4-methylphenyl)sulfonyl]acetamide
71463-41-7 not available
N-nitrosoguanidine 674-81-7 available Select Lab
1-nitroguanidine 556-88-7 available Sigma-Aldrich 6-chloronicotinic acid 5326-23-6 available Sigma-Aldrich
2.3.2.2 Extraction method and analytical procedures
An extraction procedure was recommended (all amounts given refer to 50 g manure wet weight per test vessel) and provided to the participants:
50 g manure sample are extracted once by 80 mL acetonitrile, and thereafter twice by 50 mL acetoni-trile. For extraction the samples are shaken for 30 minutes on a horizontal shaker and centrifuged for 15 minutes at 739 x g. After centrifugation the supernatant is decanted, and the pellet is subjected to the next extraction step. After the last extraction step the pellet is air dried and aliquots are subjected to combustion and radioassaying to give the information on the amount of non-extractable residues (NER).
Figure 4: Extraction of cattle manure during the ringtest (left: transfer of manure into centrif-ugation vessel; right: manure samples in centrifuge)
In addition to the described extraction a further extraction step using ASE® can be performed. The accelerated solvent extraction (ASE®), i.e. extraction under high pressure and temperature (100°C, 12000 kPa, heat up for 5 minutes, followed by a static time of 10 minutes) uses the same solvent mix-ture as for the first extraction steps (acetonitrile). Extraction is performed twice but extracts are not combined.

Transformation of veterinary pharmaceuticals and biocides in (liquid) manure
43
As the matrix manure influences HPLC, radio-TLC is preferred over HPLC. The following TLC-system is recommended:
▸ stationary phase: silica gel KG60 ▸ mobile phase: ethylacetate / 2-propanol / water; 65/23/12 (v/v/v)
The radioactive peaks after the development of the TLC-plates are characterized by their Rf-values and allocation to the peaks of co-chromatographed imidacloprid and possible transformation prod-ucts.
Characterization Rf-values
Imidacloprid: Rf = 0.58 – 0.64 Nitroguanidine: Rf = 0.70 – 0.74 N-Nitrosoguanidine: Rf = 0.65 – 0.70 6-Chloronicotinic acid: Rf = 0.35 – 0.39
In addition, peaks might be observed, which cannot be allocated to any of the used reference sub-stances. They are described by their Rf-values and named as transformation product T1 and T2. Re-spective Rf-values are:
T1: Rf = 0.00 T2: Rf = 0.03 – 0.1

Transformation of veterinary pharmaceuticals and biocides in (liquid) manure
44
Table 7: Summary of test method parameters for the ring test
Parameter
Test compounds (radiolabeled) and test matrix
- Veterinary pharmaceutical: 14C-florfenicol (CAS No. 73231-34-2) anaerobic pig manure (liquid manure sampled from a tank or lagoon adjusted to 5% dry matter content, provided by coor-dinator)
- Biocide: 14C-imidacloprid (CAS No. 138261-41-3); anaerobic cattle manure (liquid manure sampled from a ma-nure tank or lagoon adjusted to 10% dry matter content, provided by coordinator)
Pre-treatment Homogenization (anaerobic)
Storage of manure maximum storage period: 2 months at 20°C (anaerobic)
Manure matrix characterization (minimum, ref. to EMA, 2011)
- pH - temperature - organic matter [%] - redox potential
- dry matter content - nitrogen content
(NH4-N and Ntot) - microbial activity 1)
Amount of manure 50 - 100 g wet weight per incubation vessel
Pre-incubation 21 days at 20°C, anaerobic
Test duration 90 d
Redox conditions Anaerobic: redox potential always below -100 mV (typical range -230-<-400 mV)
Temperature 20 ± 2°C
Lighting complete darkness
Number of sampling time points 10 2)
Number of test concentrations 1 (to be defined; e.g. maximum expected manure concentration)
Number of replicates 3 (per sampling)
Number of sterile controls 6 (without gas trapping; sampling at max. three time points incl. termination of incubation)
Endpoints / parameters - mineralization (CO2 + CH4), - formation of non-extractable residues (NER) - screening for and identification of transformation products - DT50 parent and transformation products - mass balance
Evaluation of ring test results by the Coordinator (excel file for data reporting will be provided to each participant)
1 optional; 2 For the test with florfenicol it is important to know that at 20°C sampling should be frequent during the first day. After one week, the sampling intervals can be increased. The dissipation half-life for the parent compound is expected to be in the rage of a few hours at 20°C.
Transformation of veterinary pharmaceuticals and biocides in (liquid) manure
45
2.4 Evaluation of ring test results
2.4.1 Manure matrix parameters
The results of the measurements of matrix parameters for characterization of liquid manure (e.g. pH, temperature, organic matter content, redox potential, dry matter content, nitrogen) are reported for each sampling point (see Table 2).
2.4.2 Degradation kinetics
By use of the KinGUI-software tool (Mikolasch et al., 2006), DT50-values were calculated for the par-ent compound and for transformation products (TP) using “single first order” (SFO) kinetics. SFO-kinetics proved to be most suitable for the evaluation of transformation studies in manure within the preceding project (Hennecke et al., 2015).
Consequently, SFO-kinetics were also used within this project for reasons of comparability. In addi-tion, chi2-values were determined and a visual check of the graphs was performed. Chi2-values are a measure of the goodness of fit of the kinetic model selected and indicate the robustness of the calcu-lation. FOCUS (FOCUS, 2006) states that chi2-values < 15% indicate that the resulting fit is of good quality.
2.4.3 14C-mass balance
A 14C-mass balance was determined and calculated for each sampling time point. This was done by summing-up the amount of radioactivity [% of applied radioactivity; % aR] in the extracts (extracta-ble residues, ER) + non-extractable residues (NER) + mineralization (14CO2 and 14CH4). Results for mass balances and radioactivity distribution are presented as figures and tables. Mean values, stand-ard deviations and coefficients of variation for mass balances were determined.
Since mass balances at the start of the experiments (day 0) show differences between the participants all results relating to the mass balance [% aR] are also presented in normalized from (mass balance at day 0 is set to 100% for each participant).
2.4.4 Statistical evaluation
DT50-values were determined to describe the kinetics of the disappearance of the test substance. DTX-values were ln-transformed for calculation of mean and standard deviations.
For DTX values the following parameters were calculated:
▸ Re-transformed arithmetic mean of the ln-transformed data ▸ Standard deviation of the ln-transformed data
▸ Coefficient of variation as 12
−σe with σ² = variance of the ln-transformed data
Furthermore, mean values, standard deviations and coefficients of variation for extractable residues (ER) and for non-extractable residues (NER) were determined.
DT50-values have to be normalized to reference conditions in order to compare results determined under different test conditions. For example, the transformation rate of chemicals is dependent on temperature. This dependency can be described by the Arrhenius equation which specifies the deg-radation rate constant and accordingly the DT50-value as a function of the temperature and the acti-vation energy Ea.

Transformation of veterinary pharmaceuticals and biocides in (liquid) manure
46
𝐷𝐷𝐷𝐷50,𝑟𝑟𝑟𝑟𝑟𝑟 = 𝐷𝐷𝐷𝐷50,𝑎𝑎𝑎𝑎𝑎𝑎 × 𝑒𝑒𝑒𝑒𝑒𝑒 �𝐸𝐸𝑎𝑎𝑅𝑅�
1𝐷𝐷𝑎𝑎𝑎𝑎𝑎𝑎
−1𝐷𝐷𝑟𝑟𝑟𝑟𝑟𝑟
��
Where: DT50,ref = DT50 at reference temperature DT50,act = DT50 at actual temperature Ea = activation energy (kJ mol-1) R = gas constant (0.008314 kJ K-1 mol-1) Tact = actual temperature (K) Tref = reference temperature (K)
The correction factor for the ratio between the degradation rates an actual temperature Tact that is 10°C lower than the reference Temperature Tref is defined as the Q10 value.
𝐷𝐷𝐷𝐷50,𝑟𝑟𝑟𝑟𝑟𝑟 = 𝐷𝐷𝐷𝐷50,𝑎𝑎𝑎𝑎𝑎𝑎 × 𝑄𝑄10(𝑇𝑇𝑎𝑎𝑎𝑎𝑎𝑎−𝑇𝑇𝑟𝑟𝑟𝑟𝑟𝑟)
∆𝑇𝑇
Here, a default Ea value of 65.4 kJ mol-1 is used, corresponding to a Q10 value of 2.58 (EFSA, 2008). The resulting equation can be written as
𝐷𝐷𝐷𝐷50,20°𝐶𝐶 = 𝐷𝐷𝐷𝐷50,10°𝐶𝐶 × 𝑄𝑄10(10−20)
10 =𝐷𝐷𝐷𝐷50,10°𝐶𝐶
2.58

Transformation of veterinary pharmaceuticals and biocides in (liquid) manure
47
3 Results and discussion 3.1 Overview In the following the results of all ring test participants are presented. All results have been anony-mized (Institute 1 to 6). The ring test experiments were performed between September 2013 and Sep-tember 2014.
The following chapters present the applied incubation systems and results obtained for manure ma-trix parameters, DT50-values, mineralization, extractable residues, non-extractable residues and 14C-mass balances. Table 8 gives an overview of the collected data (see Annex 3 for the filled evaluation sheets (Microsoft Excel) from all participants).
Table 8: Parameters and endpoints determined by the participants during the ring test
Institute Imidacloprid / cattle manure 14CO2 14CH4 extracts NER chemical
analyses microbial activity
1 Yes Yes Yes Yes Yes No
2 Yes Yes Yes Yes Yes Yes 1)
3 Yes Yes Yes Yes Yes Yes 2)
4 Yes Yes Yes Yes Yes No
5 Yes No Yes Yes No Yes 2)
Institute Florfenicol / pig manure 14CO2 14CH4 extracts NER chemical
analyses microbial activity
1 Yes Yes Yes Yes Yes No
2 Yes Yes Yes Yes Yes Yes 1)
3 Yes Yes Yes Yes Yes Yes 2)
4 Yes Yes Yes Yes Yes No
5 Yes No Yes Yes No Yes 2)
6 No No Yes Yes Yes No 1) Microbial activity was assessed by measuring the gas production of the respective manure; 2) Microbial activity was assessed by measuring the mineralization of 14C-glucose of the respective manure
3.2 Incubation systems A flow-through test system (see schematic example in Figure 5 and pictures in Figure 6) was used by Institute 1, whereas all other participants used (semi-)static test systems (see schematic examples and pictures in Figure 7 to Figure 13). For a detailed description of the semi-static test system and the flow-through test system refer to Annex 3 and Annex 4 of the final draft test guideline in Annex 1 of this report.

Transformation of veterinary pharmaceuticals and biocides in (liquid) manure
48
Figure 5: Schematic diagram of the flow-through test system used in the ring test by Insti-tute 1
1: nitrogen is gently passed over the manure samples 2: gas washing bottle containing water 3: manure transformation flasks filled with 50 g manure (fresh weight) 4: for anaerobic transformation two NaOH-filled traps in sequence are needed to trap evolving CO2 5: addition of oxygen for subsequent catalytic combustion of CH4 6: oven for combustion of CH4 to form CO2 7: NaOH-filled trap for CO2 formed from CH4

Transformation of veterinary pharmaceuticals and biocides in (liquid) manure
49
Figure 6: Pictures of the flow-through test system used in the ring test by Institute 1
Figure 7: Schematic diagram of the semi-static test apparatus used in the ring test by Insti-tute 2
1: variable area flowmeter 2: valve
Figure 8: Pictures semi-static test apparatus used in the ring test by Institute 2
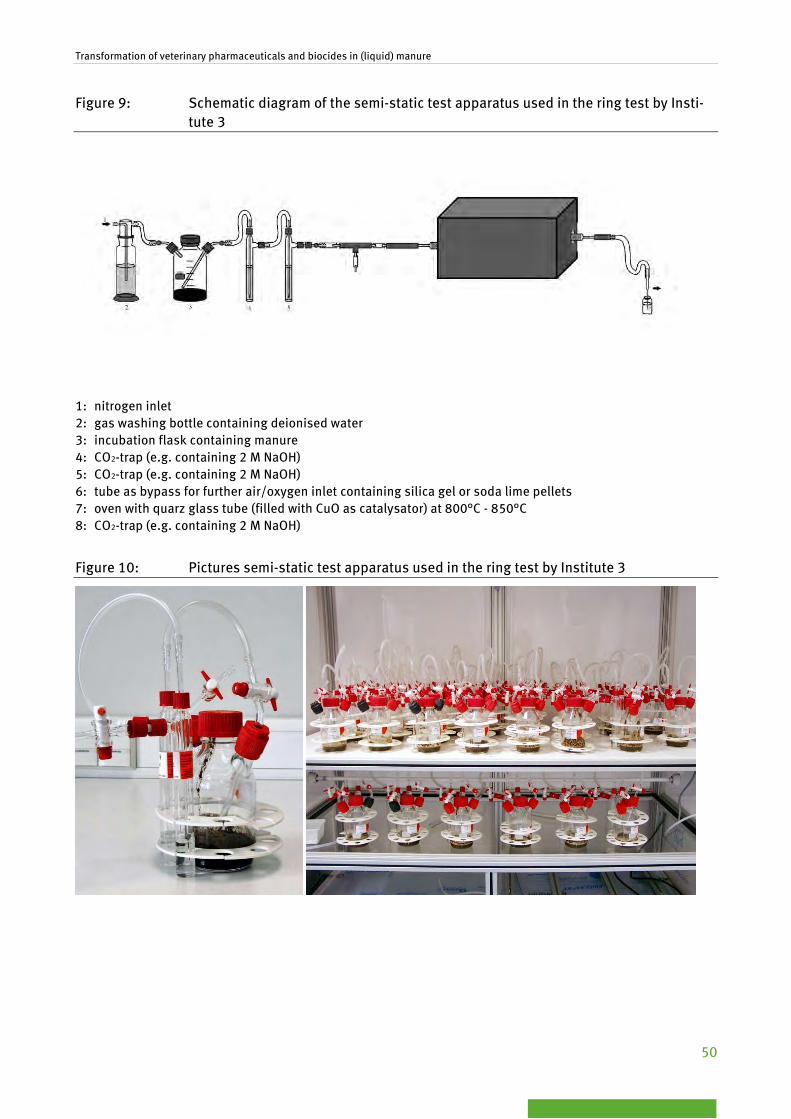
Transformation of veterinary pharmaceuticals and biocides in (liquid) manure
50
Figure 9: Schematic diagram of the semi-static test apparatus used in the ring test by Insti-tute 3
1: nitrogen inlet 2: gas washing bottle containing deionised water 3: incubation flask containing manure 4: CO2-trap (e.g. containing 2 M NaOH) 5: CO2-trap (e.g. containing 2 M NaOH) 6: tube as bypass for further air/oxygen inlet containing silica gel or soda lime pellets 7: oven with quarz glass tube (filled with CuO as catalysator) at 800°C - 850°C 8: CO2-trap (e.g. containing 2 M NaOH)
Figure 10: Pictures semi-static test apparatus used in the ring test by Institute 3

Transformation of veterinary pharmaceuticals and biocides in (liquid) manure
51
Figure 11: Pictures semi-static test apparatus used in the ring test by Institute 4
Figure 12: Pictures semi-static test apparatus used in the ring test by Institute 5
Figure 13: Picture semi-static test apparatus used in the ring test by Institute 6
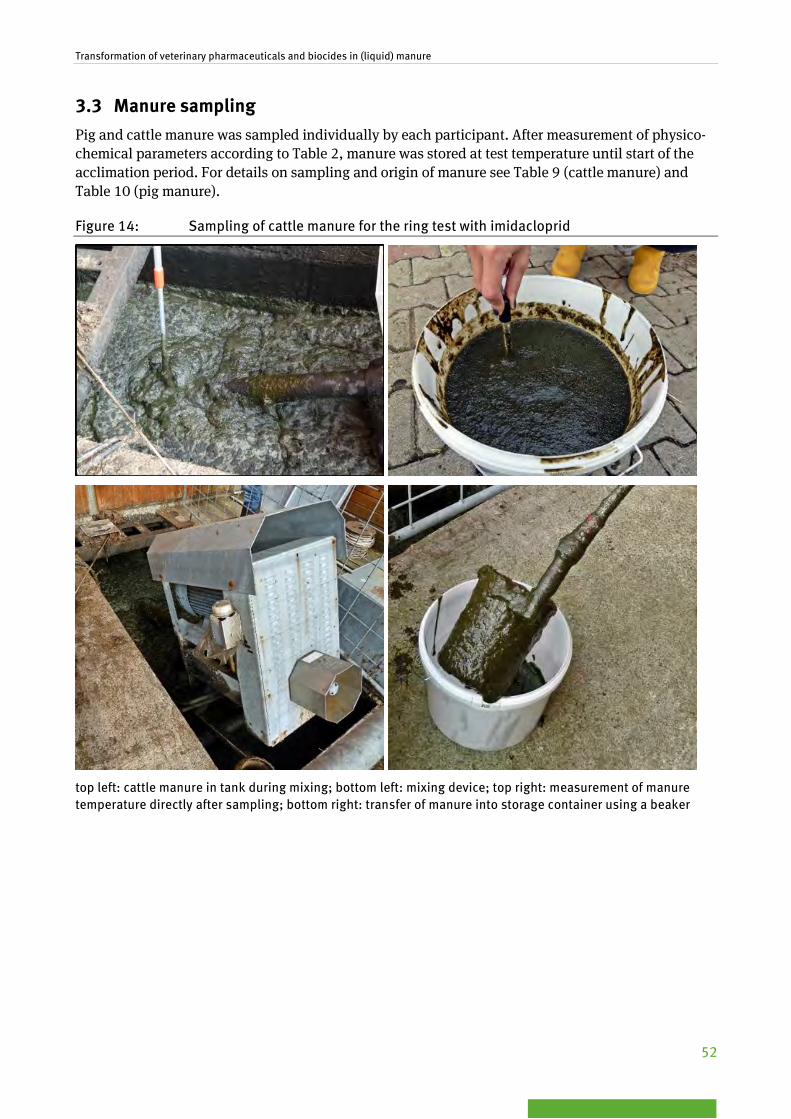
Transformation of veterinary pharmaceuticals and biocides in (liquid) manure
52
3.3 Manure sampling Pig and cattle manure was sampled individually by each participant. After measurement of physico-chemical parameters according to Table 2, manure was stored at test temperature until start of the acclimation period. For details on sampling and origin of manure see Table 9 (cattle manure) and Table 10 (pig manure).
Figure 14: Sampling of cattle manure for the ring test with imidacloprid
top left: cattle manure in tank during mixing; bottom left: mixing device; top right: measurement of manure temperature directly after sampling; bottom right: transfer of manure into storage container using a beaker

Transformation of veterinary pharmaceuticals and biocides in (liquid) manure
53
Table 9: Cattle manure origin and sampling
Cattle manure Institute 1 Institute 2 Institute 3 Institute 4 Institute 5
Sampling date: August 14, 2013 October 08, 2013 February 06, 2014
January 27, 2014 May 01, 2014
Sampling device/ sampling method:
beaker beaker with a telescope bar
dipper with stirring
ladle vacuum truck
Type of manure tank: below ground, 100 m3, stirring
device
open, below ground, stirring device
below ground, 120 m3
above ground pit, ~ 345 m3
Livestock/ type of animals:
80 cows 35 young cattle
290 dairy cows (age > 23 months),
20 female offspring (age < 23 months)
50 feeder cattle 25 180 milking cows and heifers
Feed: pasture, silage (pasture), mash
maize (silage), gras (silage), draff, winter wheat, winter bar-
ley, soybean, rape feed fat, straw
silage n.a. haylage, corn silage
Veterinary medicines/ biocides used:
n.a. 1-2 out of 385 cattles in the re-spective barn treated with ursol-cyclin, prostaglandin, albiotic,
procain penicillin
none none lincomycin, penicil-lin, CaCO3
Storage time in the laboratory [d]:
55 7 34 14 26
Storage temperature in the laboratory [°C]:
20 20 n.a. 20 20
Remarks: stirring device used one day before
sampling
horse manure is added at 2 tons per 30 tons cat-
tle manure per day.
- manure in tank was fro-zen; sampling of fresh manure from smaller
interim storage
-
n.a. = information not available
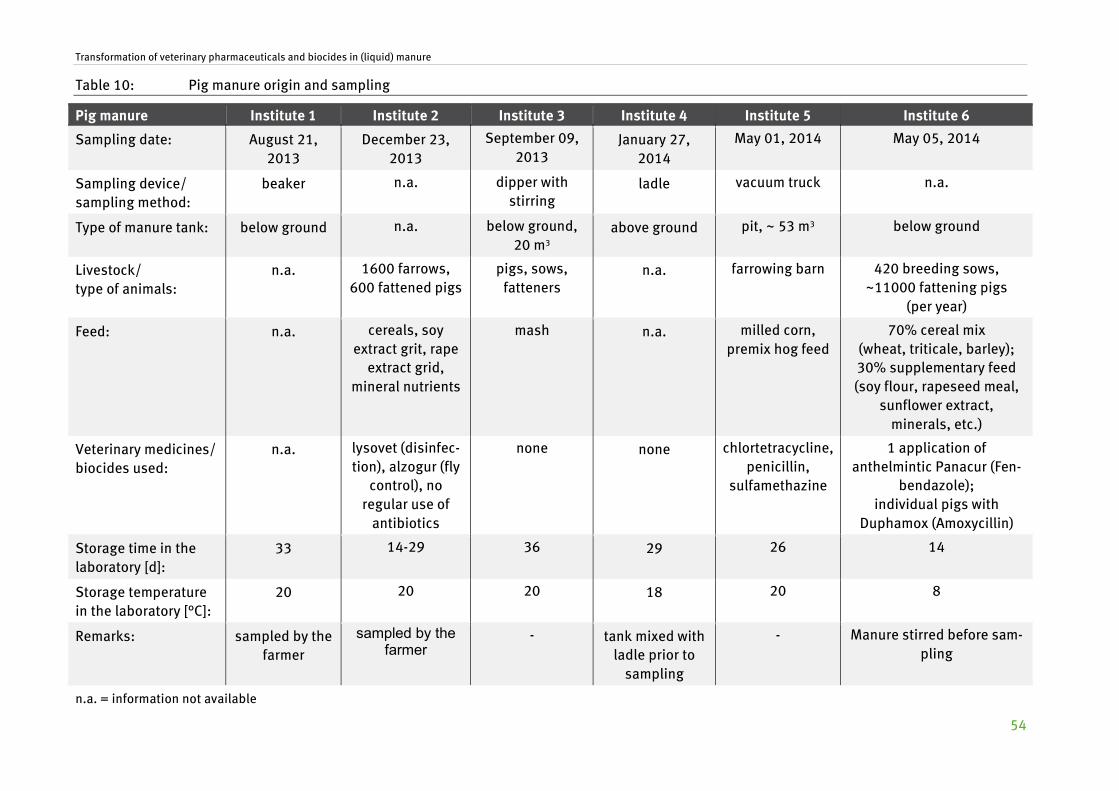
Transformation of veterinary pharmaceuticals and biocides in (liquid) manure
54
Table 10: Pig manure origin and sampling
Pig manure Institute 1 Institute 2 Institute 3 Institute 4 Institute 5 Institute 6
Sampling date: August 21, 2013
December 23, 2013
September 09, 2013
January 27, 2014
May 01, 2014 May 05, 2014
Sampling device/ sampling method:
beaker n.a. dipper with stirring
ladle vacuum truck n.a.
Type of manure tank: below ground n.a. below ground, 20 m3
above ground pit, ~ 53 m3 below ground
Livestock/ type of animals:
n.a. 1600 farrows, 600 fattened pigs
pigs, sows, fatteners
n.a. farrowing barn 420 breeding sows, ~11000 fattening pigs
(per year)
Feed: n.a. cereals, soy extract grit, rape
extract grid, mineral nutrients
mash n.a. milled corn, premix hog feed
70% cereal mix (wheat, triticale, barley); 30% supplementary feed (soy flour, rapeseed meal,
sunflower extract, minerals, etc.)
Veterinary medicines/ biocides used:
n.a. lysovet (disinfec-tion), alzogur (fly
control), no regular use of
antibiotics
none none chlortetracycline, penicillin,
sulfamethazine
1 application of anthelmintic Panacur (Fen-
bendazole); individual pigs with
Duphamox (Amoxycillin)
Storage time in the laboratory [d]:
33 14-29 36 29 26 14
Storage temperature in the laboratory [°C]:
20 20 20 18 20 8
Remarks: sampled by the farmer
sampled by the farmer
- tank mixed with ladle prior to
sampling
- Manure stirred before sam-pling
n.a. = information not available

Transformation of veterinary pharmaceuticals and biocides in (liquid) manure
55
3.4 Manure matrix characterization parameters The following subsections present the measured data obtained for manure matrix parameters tem-perature (3.4.1), dry matter content (3.4.2), organic matter content (3.4.3), nitrogen content (3.4.4), as well as redox potential and pH values (3.4.5).
3.4.1 Temperature
Temperatures measured in pig manure and cattle manure throughout the test period were within the required range of 20 ± 2°C (Institutes 1-5) and 10 ± 2°C (Institute 6). The temperature was in the range between 19.5°C and 21.8°C for pig manure (Table 11; except Institute 6) and between 18.4°C and 21.7°C for cattle manure (Table 12).
Table 11: Temperature [°C] of pig manure at the given sampling points
Time 0h 0.5h 1h 2h 4h 7h 24h 7d 28d 60d 90d
Institute 1 20.5 20.5 20.5 20.0 20.5 20.0 19.5 20.0 20.5 20.5 20.0
Institute 2 21.0 n.d. n.d. n.d. 21.5 n.d. n.d. 20.8 21.1 20.2 21.8
Institute 3 20.0 n.d. n.d. n.d. n.d. n.d. n.d. n.d. 20.0 n.d. 21.0
Institute 4 20.7 n.d. n.d. n.d. 20.7 n.d. 20.7 21.2 20.7 20.9 20.6
Institute 5 n.d. n.d. n.d. n.d. n.d. 20.0 20.0 20.0 20.0 n.d. 20.0
Institute 6 10.0 10.0 10.0 10.0 10.0 10.0 10.0 10.0 10.0 10.01) 10.0
n.d. = not determined; 1) measurements at day 49 and day 70
Table 12: Temperature [°C] of cattle manure at the given sampling points
Time [d] 0 3 7 10 14 21 28 42 56 72 90
Institute 1 20.5 20.0 19.5 20.0 20.5 20.0 19.5 19.5 20.0 20.5 20.0
Institute 2 18.4 21.6 20.4 n.d. 20.5 20.4 21.7 n.d. n.d. 20.3 21.3
Institute 3 20.0 n.d. n.d. n.d. n.d. n.d. n.d. 20.0 n.d. n.d. 20.0
Institute 4 20.8 20.4 20.7 21.3 19.7 21.1 20.9 20.7 20.8 20.4 20.9
Institute 5 20.0 20.0 20.0 n.d. n.d. n.d. 20.0 20.0 n.d. n.d. 20.0
n.d. = not determined
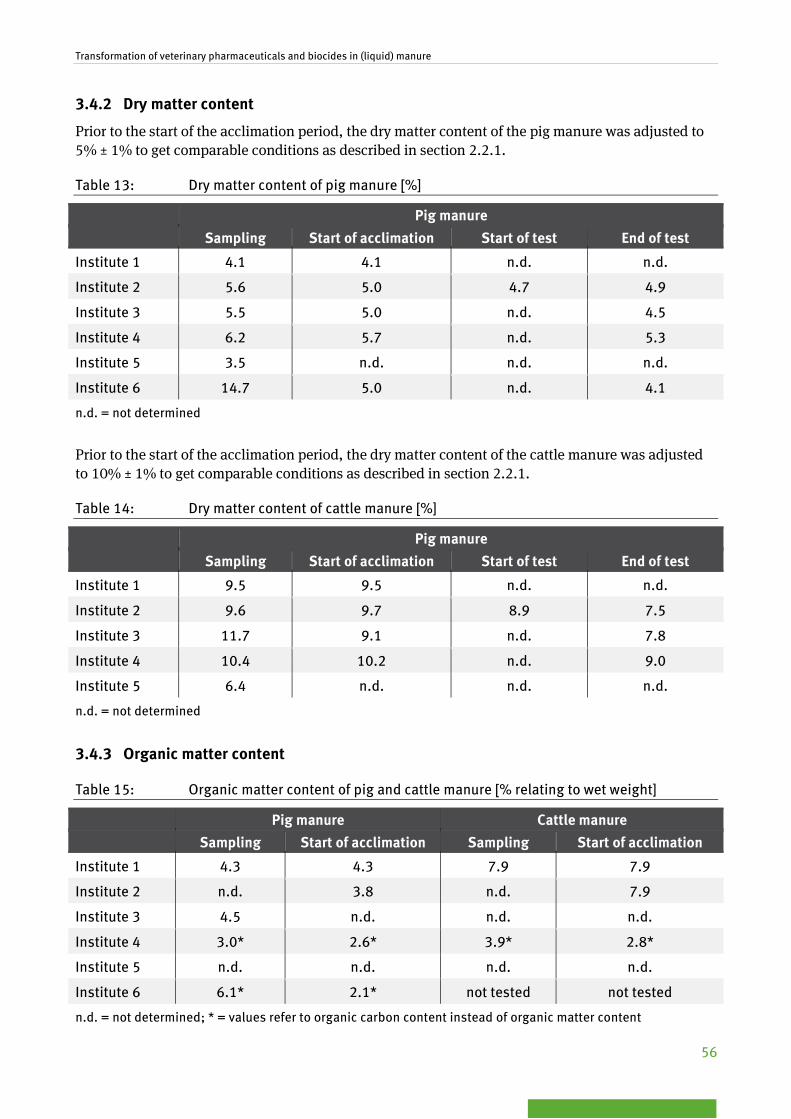
Transformation of veterinary pharmaceuticals and biocides in (liquid) manure
56
3.4.2 Dry matter content
Prior to the start of the acclimation period, the dry matter content of the pig manure was adjusted to 5% ± 1% to get comparable conditions as described in section 2.2.1.
Table 13: Dry matter content of pig manure [%]
Pig manure Sampling Start of acclimation Start of test End of test
Institute 1 4.1 4.1 n.d. n.d.
Institute 2 5.6 5.0 4.7 4.9
Institute 3 5.5 5.0 n.d. 4.5
Institute 4 6.2 5.7 n.d. 5.3
Institute 5 3.5 n.d. n.d. n.d.
Institute 6 14.7 5.0 n.d. 4.1
n.d. = not determined
Prior to the start of the acclimation period, the dry matter content of the cattle manure was adjusted to 10% ± 1% to get comparable conditions as described in section 2.2.1.
Table 14: Dry matter content of cattle manure [%]
Pig manure Sampling Start of acclimation Start of test End of test
Institute 1 9.5 9.5 n.d. n.d.
Institute 2 9.6 9.7 8.9 7.5
Institute 3 11.7 9.1 n.d. 7.8
Institute 4 10.4 10.2 n.d. 9.0
Institute 5 6.4 n.d. n.d. n.d.
n.d. = not determined
3.4.3 Organic matter content
Table 15: Organic matter content of pig and cattle manure [% relating to wet weight]
Pig manure Cattle manure Sampling Start of acclimation Sampling Start of acclimation
Institute 1 4.3 4.3 7.9 7.9
Institute 2 n.d. 3.8 n.d. 7.9
Institute 3 4.5 n.d. n.d. n.d.
Institute 4 3.0* 2.6* 3.9* 2.8*
Institute 5 n.d. n.d. n.d. n.d.
Institute 6 6.1* 2.1* not tested not tested
n.d. = not determined; * = values refer to organic carbon content instead of organic matter content

Transformation of veterinary pharmaceuticals and biocides in (liquid) manure
57
3.4.4 Nitrogen content
3.4.4.1 Total nitrogen
Table 16: Total nitrogen content of pig and cattle manure [Ntotal; mg/kg]
Pig manure Cattle manure Sampling Start of test Sampling Start of test
Institute 1 3418 n.d. 4194 n.d.
Institute 2 n.d. 3661 n.d. 4432
Institute 3 3000 n.d. 4000 n.d.
Institute 4 7120 n.d. 32900 3720
Institute 5 n.d. n.d. n.d. n.d.
Institute 6 11190 3800 1) not tested not tested
n.d. = not determined; 1) start of acclimation period
3.4.4.2 Ammonia nitrogen
Table 17: Ammonia nitrogen content of pig and cattle manure [NH4-N; mg/kg]
Pig manure Cattle manure Sampling Start of test Sampling Start of test
Institute 1 2296 n.d. 2034 n.d.
Institute 2 n.d. 1843 n.d. 3952
Institute 3 1600 n.d. n.d. n.d.
Institute 4 5200 n.d. 15100 1670
Institute 5 3220 n.d. 1504 n.d.
Institute 6 7330 24901) not tested not tested
n.d. = not determined; 1) start of acclimation period
3.4.5 Redox potential and pH values
The redox-potential and pH-value are two important parameters, which reflect the test conditions. Thus, they might also serve to interpret the results. All measurements of physical-chemical parame-ters are documented in the respective evaluation sheets in Annex 3.
The pH-value was in the range between 7.4 and 9.3 for pig manure (Table 18) and between 6.1 and 8.8 for cattle manure (Table 19). No time-dependent trend could be observed throughout the test period.
During the experiments, the measured redox potentials in pig manure (Table 20) and cattle manure (Table 21) were in the range typically observed for liquid manure storage tanks or lagoons of -230 mV to -400 mV (Weinfurtner, 2011) and always below ≤ -100 mV. Thus, stable anaerobic conditions prevailed throughout the test period.

Transformation of veterinary pharmaceuticals and biocides in (liquid) manure
58
Table 18: pH-values of pig manure at the given sampling points
Time 0h 0.5h 1h 2h 4h 7h 24h 7d 28d 60d 90d
Institute 1 8.9 8.7 8.2 8.6 9.1 9.3 8.4 7.9 8.7 9.3 8.4
Institute 2 7.8 n.a. n.a. n.a. 8.1 n.a. n.a. 8.1 8.1 8.1 8.0
Institute 3 7.8 n.a. n.a. n.a. n.a. n.a. n.a. n.a. 8.1 n.a. 7.7
Institute 4 8.2 n.a. n.a. n.a. 8.3 n.a. 8.3 8.4 8.4 8.5 8.7
Institute 5 n.a. n.a. n.a. n.a. n.a. 7.4 7.4 7.4 7.4 n.a. 7.4
Institute 6 n.a. n.a. n.a. n.a. n.a. n.a. n.a. n.a. n.a. n.a. 7.4
Minimum 7.4
Maximum 9.3
Mean 8.2
SD 0.5
COV% 6.6
n.a. = not analyzed
Table 19: pH-values of cattle manure at the given sampling points
Time [d] 0 3 7 10 14 21 28 42 56 72 90
Institute 1 8.1 8.1 8.2 7.9 8.4 8.6 8.1 8.8 8.3 8.3 8.5
Institute 2 7.4 7.2 7.7 n.a. 7.6 8.0 7.6 n.a. n.a. 7.6 7.8
Institute 3 7.5 n.a. n.a. n.a. n.a. n.a. n.a. 8.0 n.a. n.a. 8.1
Institute 4 6.3 6.2 6.2 6.3 6.1 6.4 6.6 6.5 7.6 7.4 7.5
Institute 5 6.9 6.9 6.9 n.a. n.a. n.a. 6.9 6.9 n.a. n.a. 6.9
Minimum 6.1
Maximum 8.8
Mean 7.4
SD 0.8
COV% 10.3
n.a. = not analyzed

Transformation of veterinary pharmaceuticals and biocides in (liquid) manure
59
Table 20: Redox-potential [mV] of pig manure at the given sampling points
Time 0h 0.5h 1h 2h 4h 7h 24h 7d 28d 60d 90d
Institute 1 -421 -413 -421 -404 -415 -424 -410 -423 -408 -419 -427
Institute 2 -373 n.a. n.a. n.a. -380 n.a. n.a. -325 -371 -375 -381
Institute 3 -373 n.a. n.a. n.a. n.a. n.a. n.a. n.a. -251 n.a. -328
Institute 4 -450 n.a. n.a. n.a. -448 n.a. -450 -328 -328 -266 -307
Institute 5 n.a. n.a. n.a. n.a. n.a. -366 -362 -360 -370 n.a. -370
Institute 6 -371 n.a. n.a. n.a. n.a. n.a. -336 -374 -409 -3781) -207
Minimum -450
Maximum -207
Mean -374.3
SD 54.2
COV% 14.5
n.a. = not analyzed; 1) measurements at day 70
Table 21: Redox-potential [mV] of cattle manure at the given sampling points
Time [d] 0 3 7 10 14 21 28 42 56 72 90
Institute 1 -398 -399 -405 -420 -413 -432 -422 -431 -410 -416 -464
Institute 2 -261 -436 -453 n.a. -420 -378 -410 n.a. n.a. -342 -325
Institute 3 -394 n.a. n.a. n.a. n.a. n.a. n.a. -348 n.a. n.a. -369
Institute 4 -230 -165 -192 -143 -161 -162 -162 -143 -130 -114 -353
Institute 5 -270 -268 -250 n.a. n.a. n.a. -270 -272 n.a. n.a. -300
Minimum -464
Maximum -114
Mean -316.2
SD 109.7
COV% 34.7
n.a. = not analyzed

Transformation of veterinary pharmaceuticals and biocides in (liquid) manure
60
3.5 Dissipation of the parent compound DT50-vlaues were determined for the experiments performed by Institutes 1, 2, 3 and 4 on both the transformation of florfenicol in pig manure and imidacloprid in cattle manure. For florfenicol at 20°C in pig manure the range observed for mean DT50-values was between 0.17 d and 0.41 d. For im-idacloprid in cattle manure, mean DT50-values were in the range of 17.4 d to 40.0 d.
DT50-vlaues were also determined in separate experiments on the transformation of florfenicol in pig manure at a reduced temperature of 10°C (14C-labeled and unlabeled). The aim of this experiment was to get more insight into the transformation pathway of florfenicol. At 20°C transformation pro-ceeds rapidly. However, the typical temperature in a manure tank is closer to 10°C (Weinfurtner, 2011). Therefore, special attention was put on the identification of transformation products at a low-er transformation rate condition at 10°C in this experiment. A detailed description of the experiments is presented in section 3.11.
DT50 values determined at 10°C were normalized to 20°C for comparison with the results from the other institutes by using the Q10 value of 2.58 as described in section 2.4. The results are presented in Table 22.
Table 22: DT50- values [d] determined in the ring test for the test substance florfenicol (par-ent) at a temperature of 10°C and normalized to 20°C, fitting of SFO model
Test substance Florfenicol (10°C) Florfenicol (normalized to 20°C)
unlabeled 14C-labeled unlabeled 14C-labeled
Replicate 1 1.27 2.335 0.492 0.905
Replicate 2 1.52 n.a. 0.589 n.a.
N 2 1 2 1
Mean 1.39 2.335 0.538 0.905
n.a. = not analyzed
The results for all Institutes are presented in Table 23 (DT50-values), Figure 15 (plots for florfenicol at 10°C), Figure 16 (plots for florfenicol at 20°C) and Figure 17 (plots for imidacloprid at 20°C). Results from Institute 4 were not considered for the evaluation due to deviations from the proposed extrac-tion method (use of very unpolar solvents only, see chapter 3.9.1). DT50-values could not be calculat-ed for institute 5 since no chemical analyses have been performed.
The acceptability of the fits was judged on the basis of the chi2-error and visual assessment. Mean chi2-error was 21.3 ± 6.3% for florfenicol and 13.4 ± 4.4% for imidacloprid. Although chi2-error val-ues are above 15% in most cases for florfenicol and imidacloprid, residual plots indicate no systemat-ic error of the SFO model.
The resulting plots for dissipation of parent compounds (overall mean and standard deviation) based on predicted values (SFO kinetics) are presented in Figure 18 (florfenicol at 20°C), Figure 19 (florfenicol at 10°C) and Figure 20 (imidacloprid at 20°C).

Transformation of veterinary pharmaceuticals and biocides in (liquid) manure
61
Table 23: DT50- values [d] determined in the ring test for the test substances florfenicol (par-ent) and imidacloprid (parent) at 20°C, fitting of SFO model.
Test substance
Florfenicol Imidacloprid
Institute 1 2 3 61) 4 1 2 3 4
Replicate 1 0.430 0.332 0.185 0.492 0.008 21.98 17.03 21.59 43.04
Replicate 2 0.394 0.490 0.155 0.589 0.008 21.58 17.02 21.00 37.16
Replicate 3 0.296 0.329 n.a. n.a. 0.008 21.16 17.51 n.a. 40.12
Replicate 4 0.373 0.357 n.a. n.a. n.a. 21.53 16.82 n.a. n.a.
Replicate 5 0.428 0.344 n.a. n.a. n.a. 22.18 18.24 n.a. n.a.
Replicate 6 0.558 0.353 n.a. n.a. n.a. 21.75 17.86 n.a. n.a.
N 6 6 2 2 3 6 6 2 3
Mean 0.406 0.364 0.169 0.538 0.008 21.69 17.41 21.29 40.03
SD 0.207 0.149 0.125 0.127 0.007 0.017 0.032 0.020 0.073
COV (%) 20.97 15.02 12.56 12.78 0.726 1.66 3.16 1.95 7.36
Minimum 0.169 2) 17.41
Maximum 0.538 2) 40.03
Overall mean 0.341 2) 23.82
Overall SD 0.494 2) 0.360
Overall COV (%) 52.61 2) 37.23
n.a. = not analyzed; 1) Values for unlabeled florfenicol; 2) Results from Institute 4 are not considered for evalua-tion
The calculation of DT50-values for detected transformation products is documented in Annex 4.
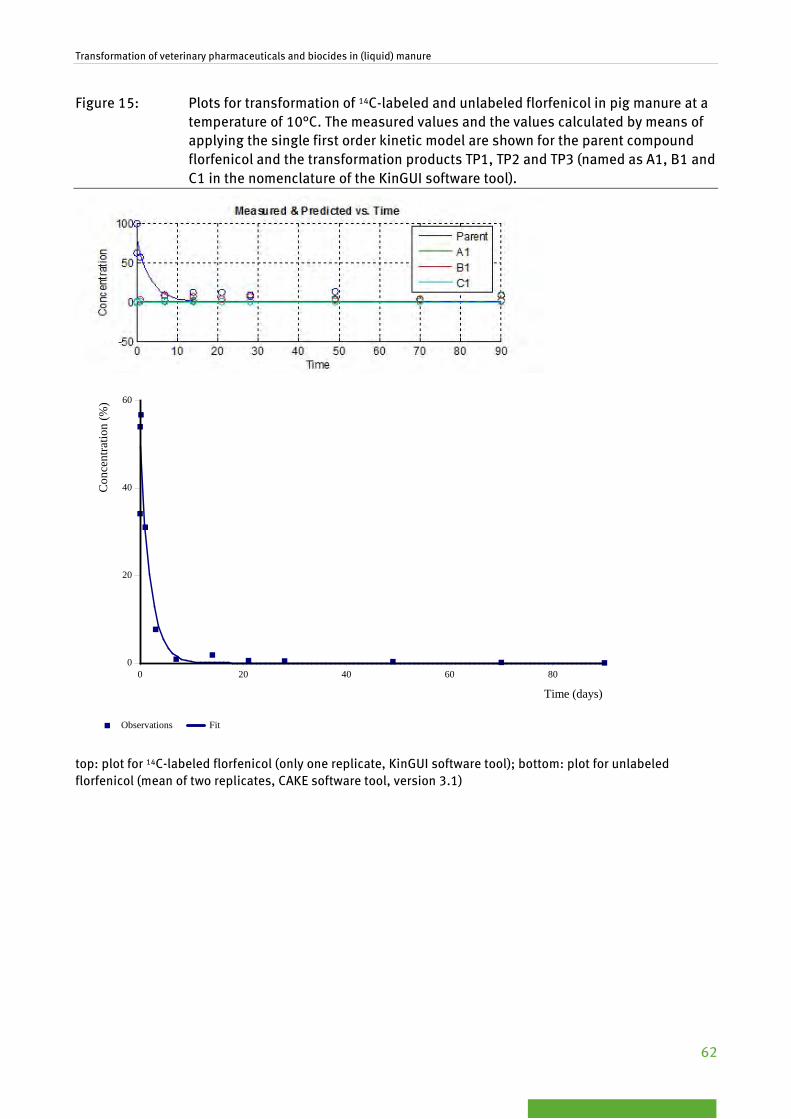
Transformation of veterinary pharmaceuticals and biocides in (liquid) manure
62
Figure 15: Plots for transformation of 14C-labeled and unlabeled florfenicol in pig manure at a temperature of 10°C. The measured values and the values calculated by means of applying the single first order kinetic model are shown for the parent compound florfenicol and the transformation products TP1, TP2 and TP3 (named as A1, B1 and C1 in the nomenclature of the KinGUI software tool).
top: plot for 14C-labeled florfenicol (only one replicate, KinGUI software tool); bottom: plot for unlabeled florfenicol (mean of two replicates, CAKE software tool, version 3.1)
0
20
40
60
Con
cent
ratio
n (%
)
0 20 40 60 80
Time (days)
Observations Fit

Transformation of veterinary pharmaceuticals and biocides in (liquid) manure
63
Figure 16: Plots for transformation of florfenicol in pig manure for all institutes based on arithmetic mean of all replicates. The measured val-ues and the values calculated by means of applying the single first order kinetic model are shown for the parent compound florfenicol and the transformation products TP1, TP2 and TP3 (named as A1, B1 and C1 in the nomenclature of the KinGUI software tool). A rapid decrease of the parent compound can be seen.
Institute 1 Institute 2
Institute 3 Institute 4
0 10 20 30 40 50 60 70 80 90-20
0
20
40
60
TimeC
once
ntra
tion
Measured & Predicted vs. Time
ParentA1
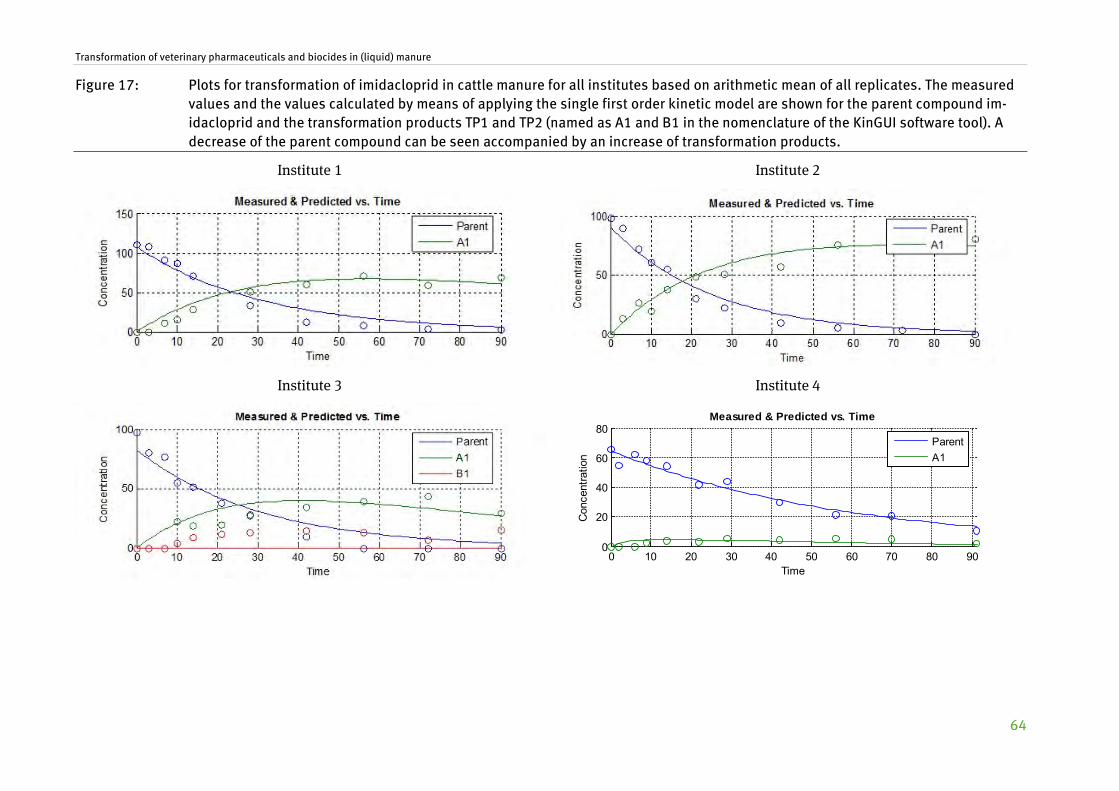
Transformation of veterinary pharmaceuticals and biocides in (liquid) manure
64
Figure 17: Plots for transformation of imidacloprid in cattle manure for all institutes based on arithmetic mean of all replicates. The measured values and the values calculated by means of applying the single first order kinetic model are shown for the parent compound im-idacloprid and the transformation products TP1 and TP2 (named as A1 and B1 in the nomenclature of the KinGUI software tool). A decrease of the parent compound can be seen accompanied by an increase of transformation products.
Institute 1 Institute 2
Institute 3 Institute 4
0 10 20 30 40 50 60 70 80 900
20
40
60
80
TimeC
once
ntra
tion
Measured & Predicted vs. Time
ParentA1

Transformation of veterinary pharmaceuticals and biocides in (liquid) manure
65
Figure 18: Dissipation plot for florfenicol in pig manure at 20°C based on overall mean of mean values for institutes (3 institutes, predicted values, SFO kinetics) and stand-ard deviation (shaded area).
Figure 19: Dissipation plot for florfenicol in pig manure at 10°C based on mean of two repli-cates (institute 6, predicted values, SFO kinetics) and standard deviation (shaded area).

Transformation of veterinary pharmaceuticals and biocides in (liquid) manure
66
Figure 20: Dissipation plot for imidacloprid in cattle manure at 20°C based on overall mean of mean values for institutes (4 institutes, predicted values, SFO kinetics) and stand-ard deviation (shaded area).
3.6 Mineralization No relevant mineralization (neither 14CO2 nor 14CH4) was observed in the experiments with florfenicol and imidacloprid. Therefore, results are only presented in tabular form (see Table 24 to Table 27).
The highest amount of 14CO2 in the experiments with florfenicol was measured by Institute 4 at the end of the incubation period (6.0% aR). In the experiment with imidacloprid, a high amount of 14CH4 (33.2% aR) was measured by Institute 3 at day 7 of the incubation period. However, this value can be regarded as measuring error since the mass balance for that replicate is clearly too high and the other replicate shows no mineralization. For that reason the values were excluded from further analysis.
Total mineralization at the end of the incubation period was in the range between 0% aR and 6% aR for florfenicol and below 1% aR for imidacloprid in all experiments.
Earlier experiments during method development with different test substances however underline the importance of determining mineralization as a parameter in studies on transformation in manure. Using e.g. salicylic acid, a VMP, as test substance up to 67.9% aR of CO2 and up to 4.8% aR of CH4 formation were observed (Hennecke et al., 2015), the determination is warranted for every experi-ment, as otherwise no complete mass balances can be obtained and it is thus impossible to assess the quality of the study.

Transformation of veterinary pharmaceuticals and biocides in (liquid) manure
67
Table 24: mean-values and standard deviation (SD) of mineralization to 14CO2 [% aR] meas-ured for the transformation of 14C-florfenicol in pig manure, 5 institutes.
Institute Time 0h 0.5h 1h 2h 4h 7h 24h 7d 28d 60d 90d
1 Mean 0.00 0.00 0.17 0.00 0.00 0.00 0.00 0.01 0.03 0.05 0.08
SD 0.00 0.01 0.23 0.01 0.00 0.00 0.00 0.01 0.01 0.02 0.02
2 Mean 0.06 0.03 0.02 0.02 0.03 0.04 0.07 0.11 0.22 0.69 1.44
SD 0.02 0.00 0.00 0.01 0.00 0.01 0.01 0.03 0.01 0.13 0.88
3 Mean 0.00 0.14 0.10 0.11 0.10 0.10 0.13 0.07 0.65 0.70 0.69
SD 0.00 0.06 0.02 0.02 0.01 0.01 0.04 0.01 0.37 0.46 0.14
4 Mean 0.00 0.00 0.00 0.00 0.00 0.00 0.00 0.56 0.88 1.64 5.95
SD 0.00 0.00 0.00 0.00 0.00 0.00 0.00 0.14 0.16 0.11 1.09
5 Mean 0.00 n.a. 0.00 0.00 n.a. 0.00 0.00 n.a. 0.00 n.a. 0.00
SD 0.00 n.a. 0.00 0.00 n.a. 0.00 0.00 n.a. 0.00 n.a. 0.00
n.a. = not analyzed
Table 25: mean-values and standard deviation (SD) of mineralization to 14CH4 [% aR] meas-ured for the transformation of 14C-florfenicol in pig manure, 5 institutes.
Institute Time 0h 0.5h 1h 2h 4h 7h 24h 7d 28d 60d 90d
1 Mean 0.00 0.00 0.00 0.00 0.00 0.00 0.00 0.00 0.00 0.00 0.00
SD 0.00 0.00 0.00 0.00 0.00 0.00 0.00 0.00 0.00 0.00 0.00
2 Mean 0.00 0.00 0.00 0.00 0.00 0.00 0.00 0.02 0.02 0.00 0.03
SD 0.00 0.00 0.00 0.00 0.00 0.00 0.00 0.01 0.01 0.00 0.01
3 Mean 0.00 0.00 0.00 0.00 0.00 0.00 0.00 0.00 0.00 0.00 0.00
SD 0.00 0.00 0.00 0.00 0.00 0.00 0.00 0.00 0.00 0.00 0.00
4 Mean 0.00 0.00 0.00 0.00 0.00 0.00 0.00 0.00 0.00 0.00 0.00
SD 0.00 0.00 0.00 0.00 0.00 0.00 0.00 0.00 0.00 0.00 0.00
5 Mean n.a. n.a. n.a. n.a. n.a. n.a. n.a. n.a. n.a. n.a. n.a.
SD n.a. n.a. n.a. n.a. n.a. n.a. n.a. n.a. n.a. n.a. n.a.
n.a. = not analyzed
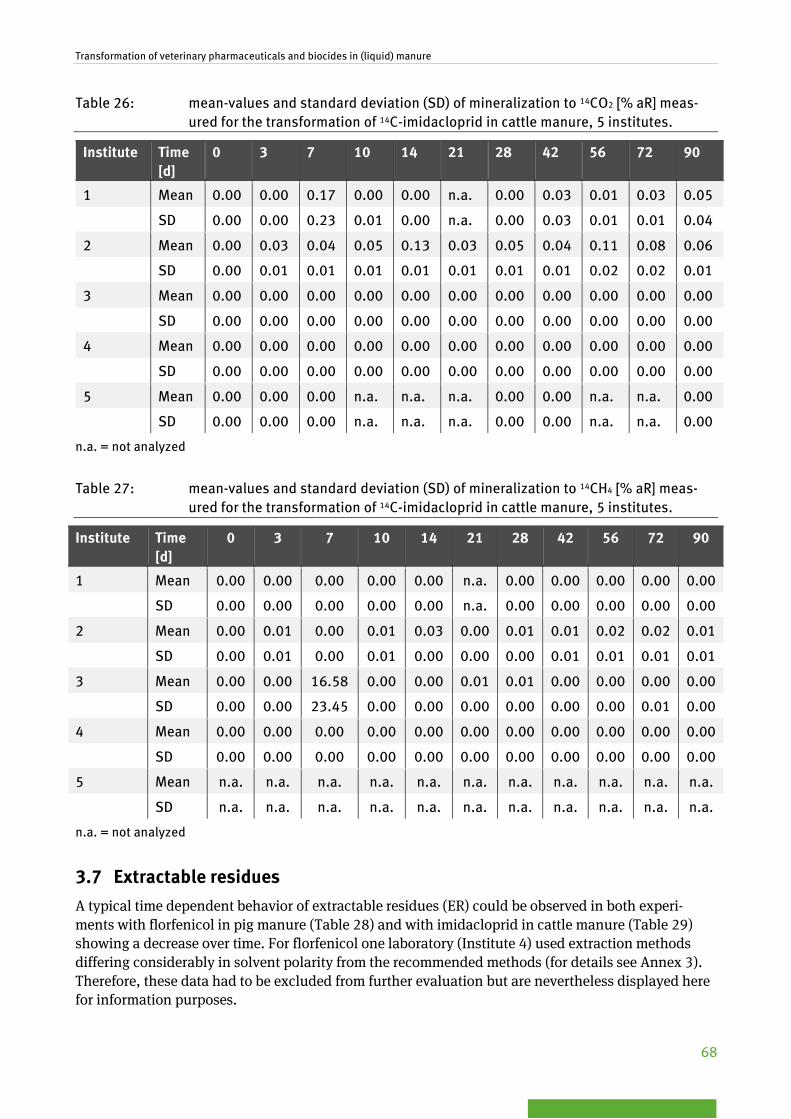
Transformation of veterinary pharmaceuticals and biocides in (liquid) manure
68
Table 26: mean-values and standard deviation (SD) of mineralization to 14CO2 [% aR] meas-ured for the transformation of 14C-imidacloprid in cattle manure, 5 institutes.
Institute Time [d]
0 3 7 10 14 21 28 42 56 72 90
1 Mean 0.00 0.00 0.17 0.00 0.00 n.a. 0.00 0.03 0.01 0.03 0.05
SD 0.00 0.00 0.23 0.01 0.00 n.a. 0.00 0.03 0.01 0.01 0.04
2 Mean 0.00 0.03 0.04 0.05 0.13 0.03 0.05 0.04 0.11 0.08 0.06
SD 0.00 0.01 0.01 0.01 0.01 0.01 0.01 0.01 0.02 0.02 0.01
3 Mean 0.00 0.00 0.00 0.00 0.00 0.00 0.00 0.00 0.00 0.00 0.00
SD 0.00 0.00 0.00 0.00 0.00 0.00 0.00 0.00 0.00 0.00 0.00
4 Mean 0.00 0.00 0.00 0.00 0.00 0.00 0.00 0.00 0.00 0.00 0.00
SD 0.00 0.00 0.00 0.00 0.00 0.00 0.00 0.00 0.00 0.00 0.00
5 Mean 0.00 0.00 0.00 n.a. n.a. n.a. 0.00 0.00 n.a. n.a. 0.00
SD 0.00 0.00 0.00 n.a. n.a. n.a. 0.00 0.00 n.a. n.a. 0.00
n.a. = not analyzed
Table 27: mean-values and standard deviation (SD) of mineralization to 14CH4 [% aR] meas-ured for the transformation of 14C-imidacloprid in cattle manure, 5 institutes.
Institute Time [d]
0 3 7 10 14 21 28 42 56 72 90
1 Mean 0.00 0.00 0.00 0.00 0.00 n.a. 0.00 0.00 0.00 0.00 0.00
SD 0.00 0.00 0.00 0.00 0.00 n.a. 0.00 0.00 0.00 0.00 0.00
2 Mean 0.00 0.01 0.00 0.01 0.03 0.00 0.01 0.01 0.02 0.02 0.01
SD 0.00 0.01 0.00 0.01 0.00 0.00 0.00 0.01 0.01 0.01 0.01
3 Mean 0.00 0.00 16.58 0.00 0.00 0.01 0.01 0.00 0.00 0.00 0.00
SD 0.00 0.00 23.45 0.00 0.00 0.00 0.00 0.00 0.00 0.01 0.00
4 Mean 0.00 0.00 0.00 0.00 0.00 0.00 0.00 0.00 0.00 0.00 0.00
SD 0.00 0.00 0.00 0.00 0.00 0.00 0.00 0.00 0.00 0.00 0.00
5 Mean n.a. n.a. n.a. n.a. n.a. n.a. n.a. n.a. n.a. n.a. n.a.
SD n.a. n.a. n.a. n.a. n.a. n.a. n.a. n.a. n.a. n.a. n.a.
n.a. = not analyzed
3.7 Extractable residues A typical time dependent behavior of extractable residues (ER) could be observed in both experi-ments with florfenicol in pig manure (Table 28) and with imidacloprid in cattle manure (Table 29) showing a decrease over time. For florfenicol one laboratory (Institute 4) used extraction methods differing considerably in solvent polarity from the recommended methods (for details see Annex 3). Therefore, these data had to be excluded from further evaluation but are nevertheless displayed here for information purposes.

Transformation of veterinary pharmaceuticals and biocides in (liquid) manure
69
At the end of the study with florfenicol in pig manure, after normalization, extractable residues ranged from 32.7% aR (Institute 3) to 70.9% aR (Institute 1). At the end of the study with imidaclo-prid in cattle manure, after normalization, extractable residues ranged from 26.4% aR (Institute 4) to 84.2% aR (Institute 5). The variability between the results of the different laboratories (COV of 31.0% for florfenicol and COV of 40.7% for imidacloprid) can be explained by differences in extraction pro-cedures used by the participating institutes.
Table 28: mean-values, standard deviation (SD) and coefficient of variation (COV%) of ex-tractable residues [% aR] measured for 14C-florfenicol in pig manure, 5 institutes.
Insti-tute
Time 0h 0.5h 1h 2h 4h 7h 24h 7d 28d 60d 90d
1 n 6 6 6 6 6 6 6 6 6 6 6
Mean 99.5 103.6 104.5 105.0 79.3 92.4 62.6 58.9 68.6 61.7 71.2
SD 2.7 3.2 2.8 2.4 5.0 2.3 3.1 4.5 7.8 1.2 0.9
COV 2.7 3.1 2.7 2.3 6.3 2.5 5.0 7.6 11.4 1.9 1.3
2 n 6 6 6 6 6 6 6 6 6 4 4
Mean 96.5 95.3 90.6 79.9 80.6 73.1 60.9 50.0 51.4 44.2 46.5
SD 3.7 0.6 1.4 3.1 2.0 1.1 1.3 0.7 1.2 1.0 3.4
COV 3.8 0.6 1.5 3.9 2.5 1.5 2.1 1.4 2.3 2.3 7.3
3 n 2 2 2 2 2 2 2 2 2 2 2
Mean 93.3 94.7 90.6 89.0 84.5 77.2 63.3 53.4 42.8 45.2 32.4
SD 2.0 0.5 1.2 0.7 2.1 0.3 5.3 1.9 1.2 5.6 6.8
COV 2.1 0.5 1.3 0.8 2.5 0.4 8.4 3.6 2.8 12.4 21.0
4 n 3 3 3 3 3 3 3 3 3 3 3
Mean 62.3 32.8 23.4 20.9 14.6 11.5 4.0 6.3 6.3 2.9 3.1
SD 11.0 9.1 6.0 0.7 4.7 2.9 0.1 1.5 1.6 0.5 0.5
COV 17.7 27.7 25.6 3.3 32.2 25.2 2.5 23.8 25.4 17.2 16.1
5 n 3 n.d. 3 3 n.d. 3 3 3 3 n.d. 3
Mean 91.7 n.d. 95.6 83.2 n.d. 81.5 81.5 76.6 71.1 n.d. 48.5
SD 2.5 n.d. 4.4 3.7 n.d. 4.9 5.0 20.6 11.0 n.d. 2.2
COV 2.7 n.d. 4.6 4.4 n.d. 6.0 6.1 26.9 15.5 n.d. 4.5
Total 1) n 4 3 4 4 3 4 4 4 4 3 4
Min 91.7 94.7 90.6 79.9 79.3 73.1 60.9 50.0 42.8 44.2 32.4
Max 99.5 103.6 104.5 105.0 84.5 92.4 81.5 76.6 71.1 61.7 71.2
Mean 95.2 97.9 95.3 89.3 81.5 81.1 67.1 59.7 58.5 50.4 49.6
SD 3.5 5.0 6.6 11.1 2.7 8.3 9.7 11.8 13.6 9.8 16.1
COV% 3.6 5.1 6.9 12.5 3.3 10.3 14.5 19.8 23.3 19.6 32.3
n.d. = not determined; 1) Results from Institute 4 are not considered for evaluation
Transformation of veterinary pharmaceuticals and biocides in (liquid) manure
70

Transformation of veterinary pharmaceuticals and biocides in (liquid) manure
71
Table 29: mean-values, standard deviation (SD) and coefficient of variation (COV%) of ex-tractable residues [% aR] measured for 14C-imidacloprid in cattle manure, 5 insti-tutes.
Insti-tute
Time [d]
0 3 7 10 14 21 28 42 56 72 90
1 n 6 6 6 6 6 n.d. 6 6 6 6 6
Mean 109.9
107.6
102.8
104.1
100.2
n.d. 87.2 74.9 80.0 63.5 71.9
SD 2.2 3.2 1.4 2.9 3.7 n.d. 3.6 1.8 6.4 1.0 1.7
COV 2.0 3.0 1.4 2.8 3.7 n.d. 4.1 2.4 8.0 1.6 2.4
2 n 6 6 6 6 6 6 6 6 6 6 6
Mean 100.4
102.8
98.4 86.3 92.8 78.6 82.5 79.1 80.6 79.8 81.0
SD 1.0 0.3 1.0 1.1 1.2 6.5 1.4 5.7 3.0 2.9 2.3
COV 1.0 0.3 1.0 1.3 1.3 8.3 1.7 7.2 3.7 3.6 2.8
3 n 2 2 2 2 2 2 2 2 2 2 2
Mean 97.2 80.4 76.8 81.3 79.5 69.0 68.2 58.6 55.0 50.2 44.2
SD 2.1 6.4 8.8 2.8 3.2 1.0 1.8 2.7 0.9 3.1 7.2
COV 2.2 8.0 11.5 3.4 4.0 1.4 2.6 4.6 1.6 6.2 16.3
4 n 3 3 3 3 3 3 3 3 3 3 3
Mean 70.9 78.3 71.1 74.1 65.5 53.2 64.6 48.6 38.9 40.1 22.9
SD 9.4 3.0 1.9 2.4 1.9 3.4 0.8 3.0 5.2 1.7 1.9
COV 13.3 3.8 2.7 3.2 2.9 6.4 1.2 6.2 13.4 4.2 8.3
5 n 3 3 3 n.d. n.d. n.d. 3 3 n.d. n.d. 3
Mean 86.2 79.1 82.2 n.d. n.d. n.d. 71.1 72.3 n.d. n.d. 73.6
SD 8.4 7.1 10.2 n.d. n.d. n.d. 7.7 4.8 n.d. n.d. 9.0
COV 9.7 9.0 12.4 n.d. n.d. n.d. 10.8 6.6 n.d. n.d. 12.2
Total n 5 5 5 4 4 3 5 5 4 4 5
Min 70.9 78.3 71.1 74.1 65.5 53.2 64.6 48.6 38.9 40.1 22.9
Max 109.9
107.6
102.8
104.1
100.2
78.6 87.2 79.1 80.6 79.8 81.0
Mean 92.9 89.6 86.3 86.5 84.5 66.9 74.7 66.7 63.6 58.4 58.7
SD 14.9 14.3 13.8 12.8 15.3 12.8 9.7 12.7 20.4 17.2 24.4
COV% 16.1 16.0 16.0 14.8 18.1 19.1 13.0 19.0 32.0 29.4 41.6
n.d. = not determined
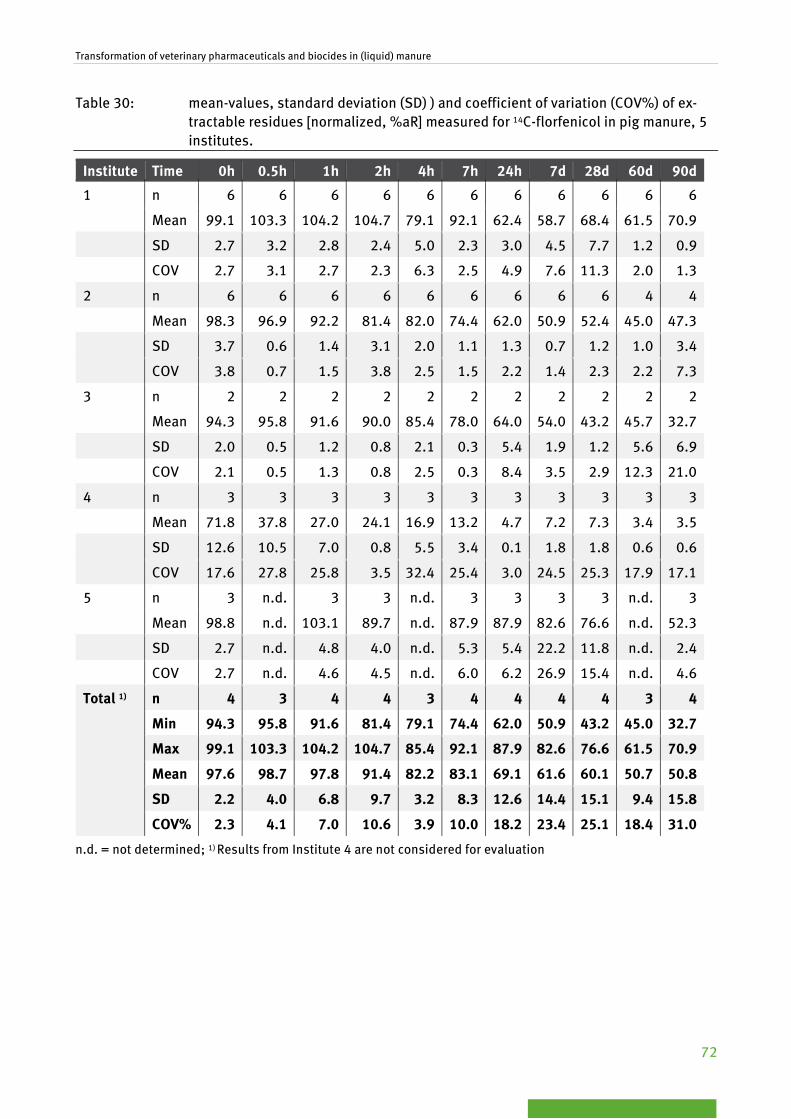
Transformation of veterinary pharmaceuticals and biocides in (liquid) manure
72
Table 30: mean-values, standard deviation (SD) ) and coefficient of variation (COV%) of ex-tractable residues [normalized, %aR] measured for 14C-florfenicol in pig manure, 5 institutes.
Institute Time 0h 0.5h 1h 2h 4h 7h 24h 7d 28d 60d 90d
1 n 6 6 6 6 6 6 6 6 6 6 6
Mean 99.1 103.3 104.2 104.7 79.1 92.1 62.4 58.7 68.4 61.5 70.9
SD 2.7 3.2 2.8 2.4 5.0 2.3 3.0 4.5 7.7 1.2 0.9
COV 2.7 3.1 2.7 2.3 6.3 2.5 4.9 7.6 11.3 2.0 1.3
2 n 6 6 6 6 6 6 6 6 6 4 4
Mean 98.3 96.9 92.2 81.4 82.0 74.4 62.0 50.9 52.4 45.0 47.3
SD 3.7 0.6 1.4 3.1 2.0 1.1 1.3 0.7 1.2 1.0 3.4
COV 3.8 0.7 1.5 3.8 2.5 1.5 2.2 1.4 2.3 2.2 7.3
3 n 2 2 2 2 2 2 2 2 2 2 2
Mean 94.3 95.8 91.6 90.0 85.4 78.0 64.0 54.0 43.2 45.7 32.7
SD 2.0 0.5 1.2 0.8 2.1 0.3 5.4 1.9 1.2 5.6 6.9
COV 2.1 0.5 1.3 0.8 2.5 0.3 8.4 3.5 2.9 12.3 21.0
4 n 3 3 3 3 3 3 3 3 3 3 3
Mean 71.8 37.8 27.0 24.1 16.9 13.2 4.7 7.2 7.3 3.4 3.5
SD 12.6 10.5 7.0 0.8 5.5 3.4 0.1 1.8 1.8 0.6 0.6
COV 17.6 27.8 25.8 3.5 32.4 25.4 3.0 24.5 25.3 17.9 17.1
5 n 3 n.d. 3 3 n.d. 3 3 3 3 n.d. 3
Mean 98.8 n.d. 103.1 89.7 n.d. 87.9 87.9 82.6 76.6 n.d. 52.3
SD 2.7 n.d. 4.8 4.0 n.d. 5.3 5.4 22.2 11.8 n.d. 2.4
COV 2.7 n.d. 4.6 4.5 n.d. 6.0 6.2 26.9 15.4 n.d. 4.6
Total 1) n 4 3 4 4 3 4 4 4 4 3 4
Min 94.3 95.8 91.6 81.4 79.1 74.4 62.0 50.9 43.2 45.0 32.7
Max 99.1 103.3 104.2 104.7 85.4 92.1 87.9 82.6 76.6 61.5 70.9
Mean 97.6 98.7 97.8 91.4 82.2 83.1 69.1 61.6 60.1 50.7 50.8
SD 2.2 4.0 6.8 9.7 3.2 8.3 12.6 14.4 15.1 9.4 15.8
COV% 2.3 4.1 7.0 10.6 3.9 10.0 18.2 23.4 25.1 18.4 31.0
n.d. = not determined; 1) Results from Institute 4 are not considered for evaluation
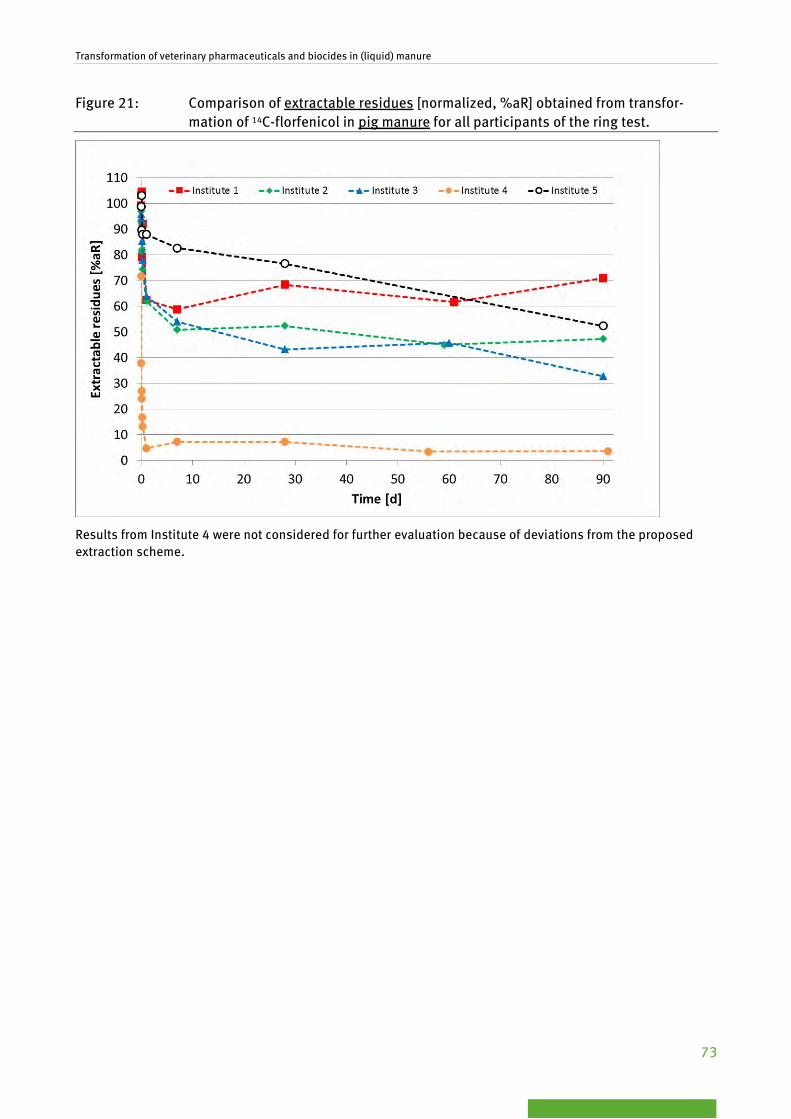
Transformation of veterinary pharmaceuticals and biocides in (liquid) manure
73
Figure 21: Comparison of extractable residues [normalized, %aR] obtained from transfor-mation of 14C-florfenicol in pig manure for all participants of the ring test.
Results from Institute 4 were not considered for further evaluation because of deviations from the proposed extraction scheme.

Transformation of veterinary pharmaceuticals and biocides in (liquid) manure
74
Table 31: mean-values and standard deviation (SD) of extractable residues [normalized, %aR] measured for 14C- imidacloprid in cattle manure, 5 institutes.
Institute Time [d] 0 3 7 10 14 21 28 42 56 72 90
1 n 6 6 6 6 6 n.d. 6 6 6 6 6
Mean 98.3 96.2 92.0 93.1 89.5 n.d. 77.9 66.9 71.6 56.8 64.3
SD 1.9 2.9 1.3 2.6 3.3 n.d. 3.2 1.6 5.7 0.9 1.5
COV 2.0 3.0 1.4 2.8 3.7 n.d. 4.1 2.4 7.9 1.5 2.4
2 n 6 6 6 6 6 6 6 6 6 6 6
Mean 97.3 99.7 95.4 83.7 90.0 76.2 80.0 76.7 78.2 77.3 78.5
SD 0.9 0.3 1.0 1.1 1.2 6.3 1.3 5.5 3.0 2.8 2.3
COV 1.0 0.3 1.1 1.3 1.3 8.2 1.6 7.2 3.8 3.7 2.9
3 n 2 2 2 2 2 2 2 2 2 2 2
Mean 96.4 79.7 76.2 80.7 78.9 68.4 67.6 58.1 54.5 49.8 43.8
SD 2.1 6.3 8.7 2.8 3.1 1.0 1.8 2.7 0.9 3.1 7.2
COV 2.2 7.9 11.4 3.5 4.0 1.5 2.6 4.6 1.6 6.2 16.4
4 n 3 3 3 3 3 3 3 3 3 3 3
Mean 81.8 90.2 81.9 85.4 75.5 61.3 74.4 56.0 44.8 46.2 26.4
SD 10.8 3.5 2.2 2.8 2.2 3.9 1.0 3.5 6.0 2.0 2.1
COV 13.2 3.9 2.6 3.3 2.9 6.4 1.3 6.2 13.4 4.2 8.1
5 n 3 3 3 n.d. n.d. n.d. 3 3 n.d. n.d. 3
Mean 98.5 90.4 94.0 n.d. n.d. n.d. 81.3 82.6 n.d. n.d. 84.2
SD 9.6 8.1 11.6 n.d. n.d. n.d. 8.8 5.5 n.d. n.d. 10.3
COV 9.7 9.0 12.4 n.d. n.d. n.d. 10.8 6.7 n.d. n.d. 12.2
Total n 5 5 5 4 4 3 5 5 4 4 5
Min 81.8 79.7 76.2 80.7 75.5 61.3 67.6 56.0 44.8 46.2 26.4
Max 98.5 99.7 95.4 93.1 90.0 76.2 81.3 82.6 78.2 77.3 84.2
Mean 94.5 91.3 87.9 85.7 83.5 68.6 76.2 68.1 62.3 57.5 59.4
SD 7.2 7.6 8.4 5.3 7.4 7.4 5.5 11.5 15.3 13.9 24.2
COV% 7.6 8.3 9.6 6.2 8.9 10.8 7.2 16.9 24.6 24.2 40.7
n.d. = not determined

Transformation of veterinary pharmaceuticals and biocides in (liquid) manure
75
Figure 22: Comparison of extractable residues [normalized, %aR] obtained from transfor-mation of 14C-imidacloprid in cattle manure for all participants of the ring test.
3.8 Non-extractable residues For pig manure an increase of NER until day 7 was observed by Institutes 1, 2 and 3. Afterwards, amounts of NER remain more or less constant until the end of the study. Different curve progressions were obtained by Institute 4 and Institute 5. Whereas NER slightly increase until day 60 at Institute 5, a rapid increase followed by a rapid decline was measured in the experiment by Institute 4. However, results from Institute 4 are not considered for evaluation since extraction methods differing consider-ably in solvent polarity from the recommended methods have been used (see chapter 3.9.1). At the end of the incubation period, after normalization, the amount of NER was between 30.8% aR (Insti-tute 5) and 61.0% aR (Institute 3) (see Table 32, Table 33 and Figure 23).
A time dependent behavior of non-extractable residues (NER) can be observed in cattle manure show-ing an increase throughout the test period (Table 34 and Table 35). The amount of NER at the end of the study, after normalization, was between 11.3% aR (Institute 2) and 65.3% aR (Institute 4) (Figure 24). The variability between the results of the different laboratories (COV of 32.1% for florfenicol and COV of 54.1% for imidacloprid) can be explained by differences in extraction procedures used by the participating institutes.

Transformation of veterinary pharmaceuticals and biocides in (liquid) manure
76
Table 32: minimum (Min), maximum (Max) and mean-values, standard deviation (SD) and coefficient of variation (COV%) of NER [% aR] for the transformation of 14C-florfenicol in pig manure, 5 institutes
Institute Time 0h 0.5h 1h 2h 4h 7h 24h 7d 28d 60d 90d
1 n 6 6 6 6 6 6 6 6 6 6 6
Mean 0.9 1.7 2.9 3.5 15.0 15.4 29.4 41.3 38.3 39.5 34.5
SD 0.1 0.2 0.1 1.0 1.7 1.7 3.5 4.5 6.2 1.6 1.7
COV 8.8 12.9 4.1 27.1 11.7 11.8 12.3 11.1 16.3 4.1 5.0
2 n 6 6 6 6 6 6 6 6 6 4 4
Mean 1.7 4.2 5.7 13.2 15.9 23.6 35.2 47.8 43.7 48.1 50.8
SD 0.2 0.3 1.1 3.7 1.4 1.4 3.7 2.1 4.0 4.3 3.5
COV 13.3 7.5 19.8 28.1 8.5 5.8 10.6 4.5 9.1 8.9 7.0
3 n 2 2 2 2 2 2 2 2 2 2 2
Mean 5.6 6.8 8.6 8.4 14.2 20.5 30.8 43.7 45.7 44.5 60.3
SD 2.6 6.0 0.1 3.3 1.1 0.5 0.5 3.5 2.3 12.2 6.5
COV 45.5 87.4 1.6 39.7 7.8 2.4 1.7 8.0 5.1 27.3 10.8
4 n 3 3 3 3 3 3 3 3 3 3 3
Mean 24.4 47.9 54.9 61.5 77.0 65.5 64.2 18.9 15.8 16.8 9.7
SD 1.0 2.1 1.6 3.0 10.0 3.3 2.6 1.3 2.0 2.4 1.5
COV 4.0 4.4 3.0 4.9 13.0 5.1 4.0 7.1 12.8 14.1 15.6
5 n 3 n.d. 3 3 n.d. 3 3 3 3 n.d. 3
Mean 1.1 n.a. 2.1 2.5 n.a. 3.8 7.2 18.3 12.8 n.a. 28.6
SD 0.4 n.a. 0.4 1.0 n.a. 3.2 0.4 0.7 1.0 n.a. 2.6
COV 33.7 n.a. 17.6 39.3 n.a. 84.5 5.8 4.1 8.0 n.a. 8.9
Total 1) n 4 3 4 4 3 4 4 4 4 3 4
Min 0.9 1.7 2.1 2.5 14.2 3.8 7.2 18.3 12.8 38.8 28.6
Max 5.6 6.8 8.6 13.2 15.9 23.6 35.2 47.8 45.7 48.1 60.3
Mean 2.3 4.2 4.8 6.9 15.1 15.8 25.6 37.8 35.1 44.0 43.6
SD 2.2 2.6 2.9 4.9 0.8 8.7 12.6 13.3 15.2 4.3 14.6
COV% 96.5 60.9 60.8 71.2 5.6 54.8 49.0 35.1 43.3 9.8 33.5
n.a. = not analyzed;1) Results from Institute 4 are not considered for evaluation

Transformation of veterinary pharmaceuticals and biocides in (liquid) manure
77
Table 33: minimum (Min), maximum (Max) and mean-values, standard deviation (SD) and coefficient of variation (COV%) of NER [normalized, % aR] for the transformation of 14C-florfenicol in pig manure, 5 institutes.
Institute Time 0h 0.5h 1h 2h 4h 7h 24h 7d 28d 60d 90d
1 n 6 6 6 6 6 6 6 6 6 6 6
Mean 0.9 1.7 2.9 3.5 15.0 15.4 29.3 41.1 38.2 39.4 34.4
SD 0.1 0.2 0.1 1.0 1.8 1.8 2.5 5.3 6.2 2.2 2.0
COV 8.8 12.9 4.1 27.1 11.7 11.8 8.4 13.0 16.1 5.6 5.8
2 n 6 6 6 6 6 6 6 6 6 4 4
Mean 1.7 4.3 5.8 13.5 16.2 24.0 35.9 48.6 44.4 48.9 51.7
SD 0.2 0.3 1.2 3.8 1.4 1.4 3.8 2.2 4.1 4.4 3.6
COV 13.3 7.5 19.8 28.1 8.5 5.8 10.6 4.5 9.1 8.9 7.0
3 n 2 2 2 2 2 2 2 2 2 2 2
Mean 5.7 6.9 8.7 8.5 14.4 20.7 31.1 44.2 46.2 45.0 61.0
SD 2.6 6.0 0.1 3.4 1.1 0.5 0.5 3.5 2.4 12.3 6.6
COV 45.5 87.4 1.6 39.7 7.8 2.4 1.7 8.0 5.1 27.3 10.8
4 n 3 3 3 3 3 3 3 3 3 3 3
Mean 28.2 55.2 63.3 70.9 88.9 75.5 74.1 21.8 18.3 19.4 11.2
SD 1.1 2.5 1.9 3.5 11.6 3.9 2.9 1.5 2.3 2.7 1.8
COV 4.0 4.4 3.0 4.9 13.0 5.1 4.0 7.1 12.8 14.1 15.6
5 n 3 n.d. 3 3 n.d. 3 3 3 3 n.d. 3
Mean 1.2 n.d. 2.3 2.7 n.d. 4.1 7.8 19.7 13.8 n.d. 30.8
SD 0.4 n.d. 0.4 1.1 n.d. 3.5 0.4 0.8 1.1 n.d. 2.8
COV 33.7 n.d. 17.6 39.3 n.d. 84.5 5.8 4.1 8.0 n.d. 8.9
Total 1) n 4 3 4 4 3 4 4 4 4 3 4
Min 0.9 1.7 2.3 2.7 14.4 4.1 7.8 19.7 13.8 39.4 30.8
Max 5.7 6.9 8.7 13.5 16.2 24.0 35.9 48.6 46.2 48.9 61.0
Mean 2.3 4.3 4.9 7.0 15.2 16.1 26.0 38.4 35.6 44.4 44.5
SD 2.2 2.6 2.9 5.0 0.9 8.7 12.5 12.8 15.0 4.8 14.3
COV% 95.3 61.2 59.7 70.7 6.1 54.2 48.0 33.4 42.0 10.8 32.1
n.a. = not analyzed;1) Results from Institute 4 are not considered for evaluation

Transformation of veterinary pharmaceuticals and biocides in (liquid) manure
78
Figure 23: Comparison of non-extractable residues obtained from transformation of 14C-florfenicol in pig manure for five participants of the ring test. The amount of radio-activity [% applied radioactivity, % aR] per sampling interval is given as mean. Val-ues were normalized to 100% aR at day 0.
Results from Institute 4 were not considered for further evaluation because of deviations from the proposed extraction scheme.
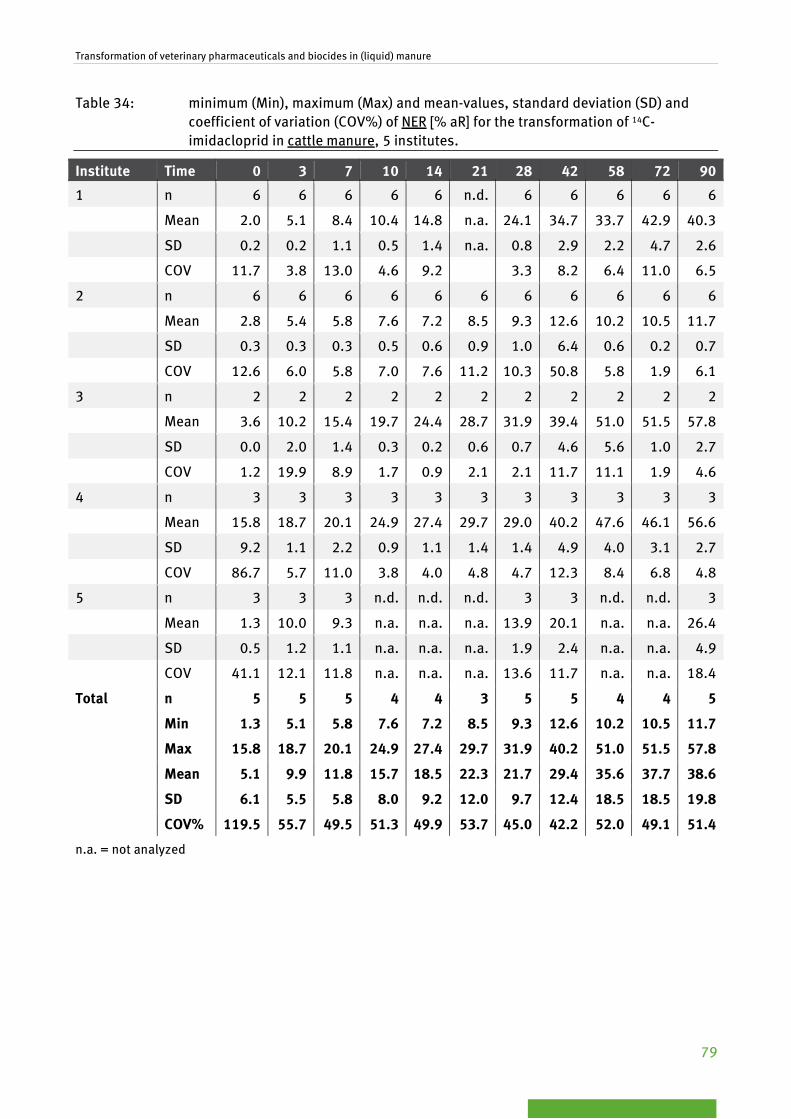
Transformation of veterinary pharmaceuticals and biocides in (liquid) manure
79
Table 34: minimum (Min), maximum (Max) and mean-values, standard deviation (SD) and coefficient of variation (COV%) of NER [% aR] for the transformation of 14C-imidacloprid in cattle manure, 5 institutes.
Institute Time 0 3 7 10 14 21 28 42 58 72 90
1 n 6 6 6 6 6 n.d. 6 6 6 6 6
Mean 2.0 5.1 8.4 10.4 14.8 n.a. 24.1 34.7 33.7 42.9 40.3
SD 0.2 0.2 1.1 0.5 1.4 n.a. 0.8 2.9 2.2 4.7 2.6
COV 11.7 3.8 13.0 4.6 9.2 3.3 8.2 6.4 11.0 6.5
2 n 6 6 6 6 6 6 6 6 6 6 6
Mean 2.8 5.4 5.8 7.6 7.2 8.5 9.3 12.6 10.2 10.5 11.7
SD 0.3 0.3 0.3 0.5 0.6 0.9 1.0 6.4 0.6 0.2 0.7
COV 12.6 6.0 5.8 7.0 7.6 11.2 10.3 50.8 5.8 1.9 6.1
3 n 2 2 2 2 2 2 2 2 2 2 2
Mean 3.6 10.2 15.4 19.7 24.4 28.7 31.9 39.4 51.0 51.5 57.8
SD 0.0 2.0 1.4 0.3 0.2 0.6 0.7 4.6 5.6 1.0 2.7
COV 1.2 19.9 8.9 1.7 0.9 2.1 2.1 11.7 11.1 1.9 4.6
4 n 3 3 3 3 3 3 3 3 3 3 3
Mean 15.8 18.7 20.1 24.9 27.4 29.7 29.0 40.2 47.6 46.1 56.6
SD 9.2 1.1 2.2 0.9 1.1 1.4 1.4 4.9 4.0 3.1 2.7
COV 86.7 5.7 11.0 3.8 4.0 4.8 4.7 12.3 8.4 6.8 4.8
5 n 3 3 3 n.d. n.d. n.d. 3 3 n.d. n.d. 3
Mean 1.3 10.0 9.3 n.a. n.a. n.a. 13.9 20.1 n.a. n.a. 26.4
SD 0.5 1.2 1.1 n.a. n.a. n.a. 1.9 2.4 n.a. n.a. 4.9
COV 41.1 12.1 11.8 n.a. n.a. n.a. 13.6 11.7 n.a. n.a. 18.4
Total n 5 5 5 4 4 3 5 5 4 4 5
Min 1.3 5.1 5.8 7.6 7.2 8.5 9.3 12.6 10.2 10.5 11.7
Max 15.8 18.7 20.1 24.9 27.4 29.7 31.9 40.2 51.0 51.5 57.8
Mean 5.1 9.9 11.8 15.7 18.5 22.3 21.7 29.4 35.6 37.7 38.6
SD 6.1 5.5 5.8 8.0 9.2 12.0 9.7 12.4 18.5 18.5 19.8
COV% 119.5 55.7 49.5 51.3 49.9 53.7 45.0 42.2 52.0 49.1 51.4
n.a. = not analyzed

Transformation of veterinary pharmaceuticals and biocides in (liquid) manure
80
Table 35: minimum (Min), maximum (Max) and mean-values, standard deviation (SD) and coefficient of variation (COV%) of NER [normalized, % aR] for the transformation of 14C-imidacloprid in cattle manure, all institutes.
Institute Time 0 3 7 10 14 21 28 42 58 72 90
1 n 6 6 6 6 6 n.d. 6 6 6 6 6
Mean 1.7 4.6 7.5 9.3 13.2 n.d. 21.5 31.0 30.1 38.4 36.0
SD 0.2 0.2 1.0 0.4 1.2 n.d. 0.7 2.5 1.9 4.2 2.3
COV 11.7 3.8 13.0 4.6 9.2 n.d. 3.3 8.2 6.4 11.0 6.5
2 n 6 6 6 6 6 6 6 6 6 6 6
Mean 2.7 5.2 5.6 7.4 7.0 8.2 9.0 12.2 9.9 10.2 11.3
SD 0.3 0.3 0.3 0.5 0.5 0.9 0.9 6.2 0.6 0.2 0.7
COV 12.6 6.0 5.8 7.0 7.6 11.2 10.3 50.8 5.8 1.9 6.1
3 n 2 2 2 2 2 2 2 2 2 2 2
Mean 3.6 10.1 15.3 19.6 24.2 28.5 31.7 39.1 50.6 51.0 57.3
SD 0.0 2.0 1.4 0.3 0.2 0.6 0.7 4.6 5.6 0.9 2.7
COV 1.2 19.9 8.9 1.7 0.9 2.1 2.1 11.7 11.1 1.9 4.6
4 n 3 3 3 3 3 3 3 3 3 3 3
Mean 18.2 21.6 23.2 28.7 31.6 34.2 33.5 46.3 54.8 53.2 65.3
SD 0.5 1.2 2.5 1.1 1.3 1.7 1.6 5.7 4.6 3.6 3.1
COV 2.8 5.7 11.0 3.8 4.0 4.8 4.7 12.3 8.4 6.8 4.8
5 n 3 3 3 n.d. n.d. n.d. 3 3 n.d. n.d. 3
Mean 1.4 11.5 10.6 n.d. n.d. n.d. 15.9 23.0 n.d. n.d. 30.2
SD 0.6 1.4 1.3 n.d. n.d. n.d. 2.2 2.7 n.d. n.d. 5.5
COV 41.1 12.1 11.8 n.d. n.d. n.d. 13.6 11.7 n.d. n.d. 18.4
Total n 5 5 5 4 4 3 5 5 4 4 5
Min 1.4 4.6 5.6 7.4 7.0 8.2 9.0 12.2 9.9 10.2 11.3
Max 18.2 21.6 23.2 28.7 31.6 34.2 33.5 46.3 54.8 53.2 65.3
Mean 5.5 10.6 12.4 16.2 19.0 23.6 22.3 30.3 36.3 38.2 40.0
SD 7.2 6.8 7.0 9.9 11.0 13.7 10.4 13.4 20.7 19.8 21.6
COV% 129.2 64.5 56.5 60.7 57.8 57.8 46.5 44.1 56.9 51.8 54.1
n.a. = not analyzed

Transformation of veterinary pharmaceuticals and biocides in (liquid) manure
81
Figure 24: Comparison of non-extractable residues obtained from transformation of 14C-imidacloprid in cattle manure for all participants of the ring test. The amount of ra-dioactivity [% applied radioactivity, % aR] per sampling interval is given as mean. Values were normalized to 100 % aR at day 0.
3.9 Mass balances A 14C-mass balance was determined for each sampling time point by summing-up the amount of ra-dioactivity [% aR] in extracts, in non-extractable residues and for mineralization (14CO2 and 14CH4).
According to established test guidelines on aerobic and anaerobic transformation (e.g. in soil (OECD, 2002a) and aquatic sediment systems (OECD, 2002b)) the mass balance throughout the study should be within a defined range (e.g. 100 ± 10% aR) to guarantee the quality of a study. However, since higher deviations are acceptable for initial measured mass balance values, it is crucial to normalize all results that are reported in % of the applied radioactivity to 100% mass balance at time point 0 days as losses due to sorption and dosing errors thereby are compensated. In the following, results of the mass balances (uncorrected and normalized data) are presented for 14C-florfenicol in pig manure and 14C-imidacloprid in cattle manure.
3.9.1 Florfenicol in pig manure
A summary of mass balances for the transformation of 14C-florfenicol in pig manure from all partici-pants is presented in Table 36 (uncorrected data), Table 37 (normalized data) and Figure 25 (normal-ized data).
Based on the results, data from Institute 4 were not considered for further evaluations (calculation of mean, standard deviation and coefficient of variation) since mass balances clearly decreased throughout the incubation period down to 21.6% aR at the end of the study. A potential reason might be the application of a different extraction method using a very unpolar solvent. With this method,

Transformation of veterinary pharmaceuticals and biocides in (liquid) manure
82
the polar test compound florfenicol and its even more polar transformation products were probably not extracted completely.
Mean mass balances are in the range between 92.0% aR and 102.1% aR (results from Institute 4 were not considered because of deviations from the proposed extraction scheme).
Table 36: Summarizing presentation of all minimum (Min), maximum (Max) and mean-values, standard deviation (SD) and coefficient of variation (COV%) of mass balances [% aR] for the transformation of 14C-florfenicol in pig manure, 5 institutes
Institute Time 0h 0.5h 1h 2h 4h 7h 24h 7d 28d 60d 90d
1 n 6 6 6 6 6 6 6 6 6 6 6
Mean 100.3
105.3
107.6
108.6
94.4 107.9
91.9 100.2
106.9
101.3
105.8
SD 2.7 3.0 2.7 2.4 5.3 1.9 2.0 1.4 2.1 2.5 2.3
COV 2.7 2.9 2.5 2.2 5.6 1.8 2.2 1.4 2.0 2.5 2.2
Min 94.8 101.3
104.5
106.0
88.0 105.8
88.6 98.7 103.5
96.7 102.2
Max 101.6
109.2
112.0
112.7
103.2
110.3
94.7 101.7
109.3
103.5
108.5
2 n 6 6 6 6 6 6 6 6 6 4 4
Mean 98.3 99.5 96.3 93.2 96.6 96.8 96.2 97.9 95.4 93.0 98.8
SD 3.8 0.4 1.9 4.7 1.7 1.4 4.2 2.5 3.6 4.5 5.5
COV 3.9 0.4 2.0 5.1 1.7 1.4 4.4 2.6 3.8 4.8 5.5
Min 91.7 98.9 93.4 88.5 94.9 95.2 90.8 96.9 92.0 89.7 94.0
Max 103.3
100.0
98.3 101.2
99.5 98.9 101.3
101.1
101.9
99.2 105.8
3 n 2 2 2 2 2 2 2 2 2 2 2
Mean 98.9 101.7
99.3 97.5 98.8 97.8 94.2 97.2 89.1 90.4 93.3
SD 0.6 5.6 1.0 2.6 1.0 0.2 5.9 5.3 3.9 6.1 0.1
COV 0.6 5.5 1.0 2.7 1.0 0.2 6.3 5.5 4.4 6.8 0.1
Min 98.5 97.8 98.5 95.7 98.1 97.6 90.0 93.5 86.3 86.0 93.2
Max 99.3 105.6
100.0
99.4 99.5 97.9 98.4 101.0
91.9 94.7 93.4
4 n 3 3 3 3 3 3 3 3 3 3 3
Mean 86.6 80.6 78.3 82.4 91.6 76.9 68.2 25.7 23.0 21.4 18.7
SD 11.2 10.9 6.4 2.4 10.6 0.5 2.5 2.7 3.4 2.0 1.3
COV 12.9 13.6 8.2 2.9 11.6 0.6 3.6 10.5 14.7 9.3 7.0
Min 73.7 68.6 73.9 80.6 82.2 76.6 66.7 23.9 19.1 20.1 17.8
Max 93.3 90.0 85.7 85.1 103.1
77.5 71.1 28.8 25.2 23.7 20.2
5 n 3 n.a. 3 3 n.a. 3 3 3 3 n.a. 3
Mean 92.8 n.a. 97.7 85.7 n.a. 85.4 86.3 94.9 87.9 n.a. 77.2
SD 2.8 n.a. 4.3 3.7 n.a. 5.7 7.0 21.3 10.8 n.a. 3.9
COV 3.1 n.a. 4.4 4.3 n.a. 6.7 8.1 22.4 12.3 n.a. 5.1
Min 90.2 n.a. 93.8 83.1 n.a. 81.6 81.1 71.6 80.3 n.a. 74.8

Transformation of veterinary pharmaceuticals and biocides in (liquid) manure
83
Max 95.8 n.a. 102.4
89.9 n.a. 92.0 94.3 113.4
95.6 n.a. 81.7
Total, based on lab means 1)
n 4 3 4 4 3 4 4 4 4 3 4
Min 92.8 99.5 96.3 85.7 94.4 85.4 86.3 94.9 87.9 90.4 77.2
Max 100.3
105.3
107.5
108.6
98.8 107.9
96.2 100.2
106.9
101.3
105.8
Mean 97.6 102.1
100.2
96.2 96.6 96.9 92.2 97.6 94.8 94.9 93.8
SD 3.3 2.9 5.1 9.6 2.2 9.2 4.3 2.2 8.7 5.7 12.2
COV% 3.4 2.9 5.1 9.9 2.3 9.5 4.6 2.2 9.2 6.0 13.0
n.a. = not analyzed;1) Results from Institute 4 are not considered for evaluation due to a deviation from the pro-posed extraction scheme

Transformation of veterinary pharmaceuticals and biocides in (liquid) manure
84
Table 37: Summarizing presentation of all minimum (Min), maximum (Max) and mean-values, standard deviation (SD) and coefficient of variation (COV%) of normalized mass balances [% aR] for the transformation of 14C-florfenicol in pig manure, participant: all.
Institute Time 0h 0.5h 1h 2h 4h 7h 24h 7d 28d 60d 90d
1 n 6 6 6 6 6 6 6 6 6 6 6
Mean 100.0 104.9 107.3 108.2 94.1 107.5 91.6 99.9 106.6 101.0 105.4
SD 2.7 3.0 2.7 2.4 5.3 1.9 2.0 1.4 2.1 2.5 2.3
COV 2.7 2.9 2.5 2.2 5.6 1.8 2.2 1.4 2.0 2.5 2.2
Min 94.5 100.9 104.1 105.7 87.7 105.4 88.3 98.4 103.1 96.4 101.8
Max 101.3 108.9 111.7 112.3 102.8 110.0 94.4 101.3 108.9 103.2 108.2
2 n 6 6 6 6 6 6 6 6 6 4 4
Mean 100.0 101.2 98.0 94.8 98.3 98.5 97.9 99.6 97.0 94.6 100.5
SD 3.9 0.4 2.0 4.8 1.7 1.4 4.3 2.5 3.7 4.6 5.6
COV 3.9 0.4 2.0 5.1 1.7 1.4 4.4 2.6 3.8 4.8 5.5
Min 93.3 100.6 95.0 90.1 96.6 96.9 92.4 96.8 93.6 91.3 95.7
Max 105.1 101.8 100.0 103.0 101.3 100.7 103.1 102.9 103.8 101.0 107.7
3 n 2 2 2 2 2 2 2 2 2 2 2
Mean 100.0 102.8 100.4 98.6 99.9 98.8 95.3 98.3 90.1 91.4 94.4
SD 0.6 5.6 1.0 2.6 1.0 0.2 6.0 5.4 4.0 6.2 0.1
COV 0.6 5.5 1.0 2.7 1.0 0.2 6.3 5.5 4.4 6.8 0.1
Min 99.6 98.9 99.6 96.7 99.2 98.7 91.0 94.5 87.3 95.8 94.3
Max 100.4 106.8 101.0 100.5 100.7 99.0 99.5 102.1 92.2 87.0 94.5
4 n 3 3 3 3 3 3 3 3 3 3 3
Mean 100.0 93.1 90.4 95.1 105.7 88.8 78.7 29.7 26.5 24.7 21.6
SD 12.9 12.6 7.4 2.8 12.3 0.5 2.9 3.1 3.9 2.3 1.5
COV 12.9 13.6 8.2 2.9 11.6 0.6 3.6 10.5 14.7 9.3 7.0
Min 85.1 79.2 85.3 93.1 94.9 88.4 77.0 27.6 22.0 23.2 20.5
Max 107.2 103.9 98.9 98.2 119.0 89.4 82.0 33.3 29.1 27.3 23.4
5 n 3 n.a. 3 3 n.a. 3 3 3 3 n.a. 3
Mean 100.0 n.a. 105.4 92.4 n.a. 92.0 95.7 102.3 90.4 n.a. 83.2
SD 3.1 n.a. 4.7 4.0 n.a. 6.2 5.7 22.9 11.2 n.a. 4.2
COV 3.1 n.a. 4.4 4.3 n.a. 6.7 6.0 22.4 12.4 n.a. 5.1
Min 97.2 n.a. 101.1 89.6 n.a. 88.0 90.2 77.2 81.6 n.a. 80.6
Max 103.3 n.a. 110.3 96.9 n.a. 99.2 101.6 122.2 103.0 n.a. 88.1
Total, based on lab means 1)
n 4 3 4 4 3 4 4 4 4 3 4
Min 100.0 101.2 98.0 92.4 94.1 92.0 91.6 98.3 90.1 91.4 83.2
Max 100.0 104.9 107.3 108.2 99.9 107.5 97.9 102.3 106.6 101.0 105.4
Mean 100.0 103.0 102.8 98.5 97.4 99.2 95.1 100.0 96.0 95.7 95.9
SD 0.0 1.9 4.3 7.0 3.0 6.3 2.6 1.7 7.7 4.9 9.6
COV% 0.0 1.8 4.2 7.1 3.1 6.4 2.7 1.7 8.1 5.1 10.0
n.a. = not analyzed;1) Results from Institute 4 are not considered for evaluation due to a deviation from the pro-posed extraction scheme

Transformation of veterinary pharmaceuticals and biocides in (liquid) manure
85
Figure 25: Mass balances for transformation of 14C-florfenicol in pig manure for all partici-pants of the ring test. The amount of radioactivity [normalized, %aR] per sampling interval is given as mean.
Results from Institute 4 were not considered for further evaluation because of deviations from the proposed extraction scheme.
3.9.2 Imidacloprid in cattle manure
A summary of mass balances for the transformation of 14C-imidacloprid in cattle manure from all par-ticipants is presented in Table 38 (uncorrected data), Table 39 (normalized data) and Figure 26 (normalized data). Mean mass balances of all Institutes were in the range between 89.2% aR and 103.1% aR.
0
10
20
30
40
50
60
70
80
90
100
110
120
0 15 30 45 60 75 90
Mas
s bal
ance
[%aR
]
Time [d]
Institute 1 Institute 2 Institute 3 Institute 4 Institute 5

Transformation of veterinary pharmaceuticals and biocides in (liquid) manure
86
Table 38: Summarizing presentation of all minimum (Min), maximum (Max) and mean-values, standard deviation (SD) and coefficient of variation (COV%) of mass balances for the transformation of 14C-imidacloprid in cattle manure, participant: all.
Institute Time [d]
0 3 7 10 14 21 28 42 56 72 90
1 n 6 6 6 6 6 n.a. 6 6 6 6 6
Mean 111.8 112.7 111.4 114.5 115.3 n.a. 111.5 109.8 113.9 106.7 112.5
SD 2.3 3.2 1.1 2.7 3.4 n.a. 3.7 2.1 5.6 4.4 2.3
COV 2.1 2.8 1.0 2.4 2.9 n.a. 3.3 1.9 5.0 4.1 2.1
Min 108.6 109.8 110.1 112.0 112.4 n.a. 107.8 107.3 109.9 102.7 109.4
Max 114.5 118.1 113.0 119.0 119.0 n.a. 118.2 113.0 125.2 114.9 114.4
2 n 6 6 6 6 6 6 6 6 6 6 6
Mean 103.1 108.2 104.2 94.0 100.2 87.1 91.9 91.7 91.0 90.3 92.7
SD 1.2 0.7 1.3 0.9 1.2 6.4 1.5 3.1 2.8 2.9 2.6
COV 1.1 0.6 1.2 0.9 1.1 7.4 1.6 3.4 3.0 3.3 2.9
Min 101.5 107.6 102.7 92.8 99.0 79.1 89.2 85.8 85.4 85.6 87.8
Max 104.3 109.5 106.3 95.1 102.1 94.3 93.1 94.6 92.8 92.8 95.3
3 n 2 2 2 2 2 2 2 2 2 2 2
Mean 100.8 90.6 108.8 101.1 104.0 97.7 100.1 98.0 106.0 101.6 102.0
SD 2.2 8.4 13.3 3.1 2.9 0.4 1.1 7.3 4.8 2.2 4.6
COV 2.2 9.3 12.2 3.1 2.8 0.4 1.1 7.4 4.5 2.1 4.5
Min 99.3 84.7 99.4 98.9 101.9 97.4 99.3 92.8 102.6 100.1 98.7
Max 102.4 96.5 118.3 103.3 106.1 98.0 100.9 103.1 109.3 103.2 105.2
4 n 3 3 3 3 3 3 3 3 3 3 3
Mean 86.8 97.0 91.2 99.0 92.9 82.9 93.6 88.8 86.5 86.3 79.5
SD 9.1 2.3 1.8 2.9 2.7 3.0 2.2 5.7 1.5 1.4 3.1
COV 10.5 2.4 2.0 2.9 2.9 3.6 2.3 6.4 1.7 1.7 3.8
Min 77.3 95.2 89.3 96.7 90.1 79.5 91.5 83.8 85.6 85.1 76.5
Max 95.6 99.6 92.9 102.2 95.4 85.3 95.9 95.0 88.2 87.9 82.6
5 n 3 3 3 n.a. n.a. n.a. 3 3 n.a. n.a. 3
Mean 87.4 89.1 91.5 n.a. n.a. n.a. 85.0 92.4 n.a. n.a. 100.0
SD 8.1 7.4 11.2 n.a. n.a. n.a. 8.0 2.8 n.a. n.a. 8.0
COV 9.3 8.3 12.2 n.a. n.a. n.a. 9.4 3.0 n.a. n.a. 8.0
Min 82.0 81.9 81.9 n.a. n.a. n.a. 78.7 90.3 n.a. n.a. 91.1
Max 96.8 96.7 103.9 n.a. n.a. n.a. 94.0 95.5 n.a. n.a. 106.7
Total, based on lab means
n 5 5 5 4 4 3 5 5 4 4 5
Min 86.8 89.1 91.2 94.0 92.9 82.9 85.0 88.8 86.5 86.3 79.5
Max 111.8 112.7 111.4 114.5 115.3 97.7 111.5 109.8 113.9 106.7 112.5
Mean 98.0 99.5 101.4 102.2 103.1 89.2 96.4 96.1 99.3 96.2 97.3
SD 10.8 10.6 9.6 8.8 9.4 7.6 10.0 8.3 12.8 9.5 12.2
COV% 11.0 10.6 9.4 8.6 9.1 8.5 10.3 8.7 12.9 9.9 12.6
n.a. = not analyzed
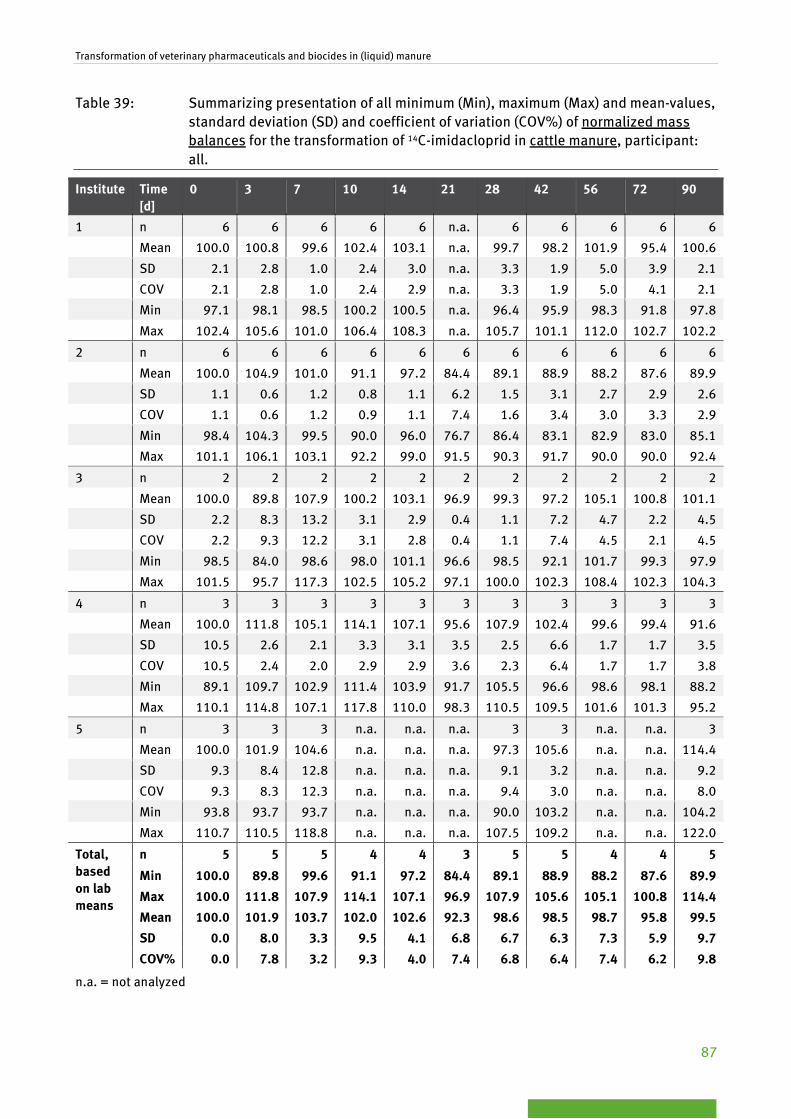
Transformation of veterinary pharmaceuticals and biocides in (liquid) manure
87
Table 39: Summarizing presentation of all minimum (Min), maximum (Max) and mean-values, standard deviation (SD) and coefficient of variation (COV%) of normalized mass balances for the transformation of 14C-imidacloprid in cattle manure, participant: all.
Institute Time [d]
0 3 7 10 14 21 28 42 56 72 90
1 n 6 6 6 6 6 n.a. 6 6 6 6 6
Mean 100.0 100.8 99.6 102.4 103.1 n.a. 99.7 98.2 101.9 95.4 100.6
SD 2.1 2.8 1.0 2.4 3.0 n.a. 3.3 1.9 5.0 3.9 2.1
COV 2.1 2.8 1.0 2.4 2.9 n.a. 3.3 1.9 5.0 4.1 2.1
Min 97.1 98.1 98.5 100.2 100.5 n.a. 96.4 95.9 98.3 91.8 97.8
Max 102.4 105.6 101.0 106.4 108.3 n.a. 105.7 101.1 112.0 102.7 102.2
2 n 6 6 6 6 6 6 6 6 6 6 6
Mean 100.0 104.9 101.0 91.1 97.2 84.4 89.1 88.9 88.2 87.6 89.9
SD 1.1 0.6 1.2 0.8 1.1 6.2 1.5 3.1 2.7 2.9 2.6
COV 1.1 0.6 1.2 0.9 1.1 7.4 1.6 3.4 3.0 3.3 2.9
Min 98.4 104.3 99.5 90.0 96.0 76.7 86.4 83.1 82.9 83.0 85.1
Max 101.1 106.1 103.1 92.2 99.0 91.5 90.3 91.7 90.0 90.0 92.4
3 n 2 2 2 2 2 2 2 2 2 2 2
Mean 100.0 89.8 107.9 100.2 103.1 96.9 99.3 97.2 105.1 100.8 101.1
SD 2.2 8.3 13.2 3.1 2.9 0.4 1.1 7.2 4.7 2.2 4.5
COV 2.2 9.3 12.2 3.1 2.8 0.4 1.1 7.4 4.5 2.1 4.5
Min 98.5 84.0 98.6 98.0 101.1 96.6 98.5 92.1 101.7 99.3 97.9
Max 101.5 95.7 117.3 102.5 105.2 97.1 100.0 102.3 108.4 102.3 104.3
4 n 3 3 3 3 3 3 3 3 3 3 3
Mean 100.0 111.8 105.1 114.1 107.1 95.6 107.9 102.4 99.6 99.4 91.6
SD 10.5 2.6 2.1 3.3 3.1 3.5 2.5 6.6 1.7 1.7 3.5
COV 10.5 2.4 2.0 2.9 2.9 3.6 2.3 6.4 1.7 1.7 3.8
Min 89.1 109.7 102.9 111.4 103.9 91.7 105.5 96.6 98.6 98.1 88.2
Max 110.1 114.8 107.1 117.8 110.0 98.3 110.5 109.5 101.6 101.3 95.2
5 n 3 3 3 n.a. n.a. n.a. 3 3 n.a. n.a. 3
Mean 100.0 101.9 104.6 n.a. n.a. n.a. 97.3 105.6 n.a. n.a. 114.4
SD 9.3 8.4 12.8 n.a. n.a. n.a. 9.1 3.2 n.a. n.a. 9.2
COV 9.3 8.3 12.3 n.a. n.a. n.a. 9.4 3.0 n.a. n.a. 8.0
Min 93.8 93.7 93.7 n.a. n.a. n.a. 90.0 103.2 n.a. n.a. 104.2
Max 110.7 110.5 118.8 n.a. n.a. n.a. 107.5 109.2 n.a. n.a. 122.0
Total, based on lab means
n 5 5 5 4 4 3 5 5 4 4 5
Min 100.0 89.8 99.6 91.1 97.2 84.4 89.1 88.9 88.2 87.6 89.9
Max 100.0 111.8 107.9 114.1 107.1 96.9 107.9 105.6 105.1 100.8 114.4
Mean 100.0 101.9 103.7 102.0 102.6 92.3 98.6 98.5 98.7 95.8 99.5
SD 0.0 8.0 3.3 9.5 4.1 6.8 6.7 6.3 7.3 5.9 9.7
COV% 0.0 7.8 3.2 9.3 4.0 7.4 6.8 6.4 7.4 6.2 9.8
n.a. = not analyzed
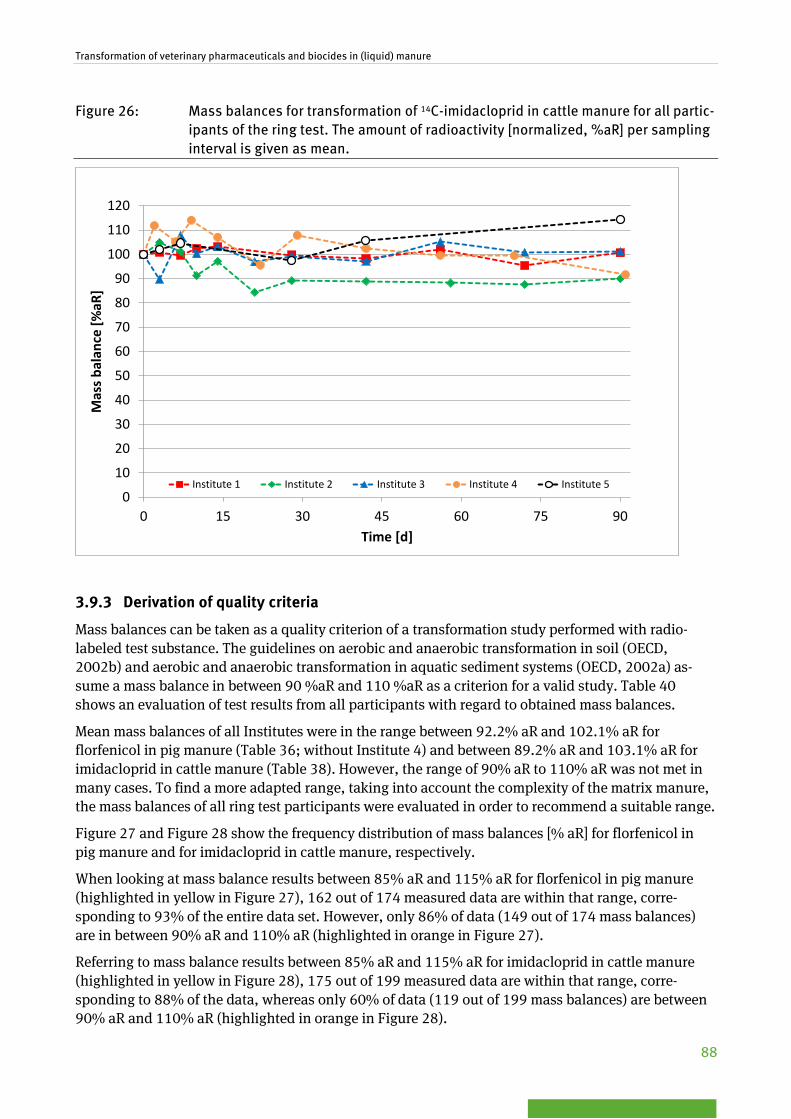
Transformation of veterinary pharmaceuticals and biocides in (liquid) manure
88
Figure 26: Mass balances for transformation of 14C-imidacloprid in cattle manure for all partic-ipants of the ring test. The amount of radioactivity [normalized, %aR] per sampling interval is given as mean.
3.9.3 Derivation of quality criteria
Mass balances can be taken as a quality criterion of a transformation study performed with radio-labeled test substance. The guidelines on aerobic and anaerobic transformation in soil (OECD, 2002b) and aerobic and anaerobic transformation in aquatic sediment systems (OECD, 2002a) as-sume a mass balance in between 90 %aR and 110 %aR as a criterion for a valid study. Table 40 shows an evaluation of test results from all participants with regard to obtained mass balances.
Mean mass balances of all Institutes were in the range between 92.2% aR and 102.1% aR for florfenicol in pig manure (Table 36; without Institute 4) and between 89.2% aR and 103.1% aR for imidacloprid in cattle manure (Table 38). However, the range of 90% aR to 110% aR was not met in many cases. To find a more adapted range, taking into account the complexity of the matrix manure, the mass balances of all ring test participants were evaluated in order to recommend a suitable range.
Figure 27 and Figure 28 show the frequency distribution of mass balances [% aR] for florfenicol in pig manure and for imidacloprid in cattle manure, respectively.
When looking at mass balance results between 85% aR and 115% aR for florfenicol in pig manure (highlighted in yellow in Figure 27), 162 out of 174 measured data are within that range, corre-sponding to 93% of the entire data set. However, only 86% of data (149 out of 174 mass balances) are in between 90% aR and 110% aR (highlighted in orange in Figure 27).
Referring to mass balance results between 85% aR and 115% aR for imidacloprid in cattle manure (highlighted in yellow in Figure 28), 175 out of 199 measured data are within that range, corre-sponding to 88% of the data, whereas only 60% of data (119 out of 199 mass balances) are between 90% aR and 110% aR (highlighted in orange in Figure 28).
0
10
20
30
40
50
60
70
80
90
100
110
120
0 15 30 45 60 75 90
Mas
s bal
ance
[%aR
]
Time [d]
Institute 1 Institute 2 Institute 3 Institute 4 Institute 5

Transformation of veterinary pharmaceuticals and biocides in (liquid) manure
89
Based on the frequency distributions of mass balances data (Figure 27 and Figure 28), we suggest to use the following quality criteria with regard to the mass balance:
“For radiolabeled compounds the mass balance at the beginning of the study should be within 85% to 115%. During the study average total mass balance for all samples within a treatment should fall within that range. For unlabeled test substances the analytical recovery of the test compound has to be at least 70%.”
Only three criteria are slightly out of the range of 85% aR – 115% aR: the range of mean mass bal-ances for 14C-florfenicol in pig manure during the study for Institute 5 (lowest mass balance 77.2% aR), the range of mean mass balances for 14C-imidacloprid in cattle manure during the study for insti-tute 1 (highest mass balance 115.3% aR) and the range of mean mass balances for 14C-imidacloprid in cattle manure during the study for institute 4 (lowest mass balance 79.5% aR) (Table 41).
Table 40: Comparison of obtained mass balances to the range of 90%-110% for all ring test experiments
Institute Mass balance Mean at test start Mean all sampling time
points Overall mean
Value Within 90%-110%?
Range Within 90%-110%?
Value Within 90%-110%?
Florfeniol in pig manure
1 100.3 YES 91.2 - 108.6 YES 102.6 YES
2 98.3 YES 93.0 - 99.5 YES 96.5 YES
3 98.9 YES 89.1 - 101.7 NO 96.2 YES
4 1) 86.6 NO 18.7 - 91.6 NO 59.4 NO
5 92.8 YES 77.2 - 97.7 NO 88.5 NO
Imidacloprid in cattle manure
1 111.8 NO 106.7 - 115.3 NO 112.0 NO
2 103.1 YES 87.1 - 108.2 NO 95.9 YES
3 100.8 YES 90.6 - 108.8 YES 101.0 YES
4 86.8 NO 79.5 - 99.0 NO 89.0 NO
5 87.4 NO 85.0 - 100.0 YES 90.9 YES 1) Results from Institute 4 are not considered for evaluation due to a deviation from the proposed extraction scheme

Transformation of veterinary pharmaceuticals and biocides in (liquid) manure
90
Figure 27: Frequency distribution of mass balances [% aR] for 14C-florfenicol in pig manure for all participants of the ring test (without Institute 4); n=174
Figure 28: Frequency distribution of mass balances [% aR] for 14C-imidacloprid in cattle ma-nure for all participants of the ring test; n=199

Transformation of veterinary pharmaceuticals and biocides in (liquid) manure
91
Table 41: Comparison of obtained mass balances to the range of 85%-115% for all ring test experiments
Institute Mass balance Mean at test start Mean all sampling time
points Overall mean
Value Within 85%-115%?
Range Within 85%-115%?
Value Within 85%-115%?
Florfeniol in pig manure
1 100.3 YES 91.2 - 108.6 YES 102.6 YES
2 98.3 YES 93.0 - 99.5 YES 96.5 YES
3 98.9 YES 89.1 - 101.7 YES 96.2 YES
4 1) 86.6 YES 18.7 - 91.6 NO 59.4 NO
5 92.8 YES 77.2 - 97.7 NO 88.5 YES
Imidacloprid in cattle manure
1 111.8 YES 106.7 - 115.3 NO 112.0 YES
2 103.1 YES 87.1 - 108.2 YES 95.9 YES
3 100.8 YES 90.6 - 108.8 YES 101.0 YES
4 86.8 YES 79.5 - 99.0 NO 89.0 YES
5 87.4 YES 85.0 - 100.0 YES 90.9 YES 1) Results from Institute 4 are not considered for evaluation due to a deviation from the proposed extraction scheme
3.10 Overview on the variability of the results obtained in the ring test in dif-ferent laboratories with different manures
The variability of the results obtained in the ring test was investigated by comparing mean values, standard deviations and coefficients of variation for mineralization, extractable residues, NER and mass balance as described in detail in sections 3.6 to 3.9. The results are summarized in Table 42 and Table 43 for florfenicol in pig manure and in Table 44 and Table 45 for imidacloprid in cattle manure. For the parameters mass balance, extractables and NER, single data refer to mean values across all institutes for each sampling time point.
Graphs of the results are presented in Figure 29 (mean values and standard deviations for florfenicol) and Figure 30 (mean values and standard deviations for imidacloprid). Variability of results related to coefficients of variation for mass balances, extractable residues and non-extractable residues is shown in Figure 31.
It becomes apparent that variability between the results of the different laboratories is low regarding mass balance (florfenicol (90 d): 95.9 ± 9.6% aR, COV = 10.0%; imidacloprid (90 d): 99.5 ± 9.7% aR, COV = 9.8%), but higher with respect to extractable residues (florfenicol (90 d): 50.8 ± 15.8% aR, COV = 31.0%; imidacloprid (90 d): 59.4 ± 24.2% aR, COV = 40.7%) and non-extractable residues (e.g. florfenicol (90 d): 44.5 ± 14.3% aR, COV = 32.1%; imidacloprid (90 d): 40.0 ± 21.6% aR, COV = 54.1%). This can be explained by differences in extraction procedures used by the participating insti-tutes.

Transformation of veterinary pharmaceuticals and biocides in (liquid) manure
92
No mineralization (neither to 14CO2 nor 14CH4) was observed in the experiments with florfenicol and imidacloprid. The peak in mineralization for imidacloprid after 7 days (3.33 ± 4.69 % aR) is caused by a high amount of 14CH4 (33.2 % aR) measured in one replicate by Institute 3. However, this value can be regarded as a measuring error since the mass balance for that replicate is clearly too high and the other replicate shows no mineralization.
The results are further displayed in the box-plot diagram (Figure 32) and in Table 47. For florfenicol in pig manure only 2 out of 41 values are outside the upper and lower whiskers (comprising 95% of the data), for imidacloprid in cattle manure 4 out of 49 values are not within this range.
Results regarding dissipation of the parent compound (DT50-values; see section 3.5) are summarized in Table 46. Single data refer to mean DT50 values across replicates for each institute. The mean coef-ficients of variation of 52.6% for florfenicol in pig manure and 37.2% for imidacloprid in cattle ma-nure are acceptable, e.g. considering an estimated coefficient of variation for DT50-values in different soils of about 100% (FOCUS, 2000). Clearly higher variation of DT50-values in different soils were also reported by Howard (1993).
Table 42: Summary of ring test results for 14C-florfenicol in pig manure [% aR]; mean, stand-ard deviation and coefficient of variation for mineralization, extractables, NER and mass balance; 4 institutes1); mean across institutes for each sampling time point
Time [d]
0h 0.5h 1h 2h 4h 7h 24h 7d 28d 60d 90d
Mineralization
Mean 0.02 0.06 0.07 0.04 0.04 0.04 0.05 0.07 0.23 0.48 0.56
SD 0.00 0.02 0.06 0.01 0.00 0.01 0.01 0.02 0.10 0.20 0.26
COV% 29.6 40.8 87.7 24.7 5.8 16.7 24.7 26.6 43.6 42.4 46.3
Extractables
Mean 95.2 97.9 95.3 89.3 81.5 81.1 67.1 59.7 58.5 50.4 49.6
SD 3.5 5.0 6.6 11.1 2.7 8.3 9.7 11.8 13.6 9.8 16.1
COV% 3.6 5.1 6.9 12.5 3.3 10.3 14.5 19.8 23.3 19.6 32.3
NER
Mean 2.3 4.2 4.8 6.9 15.1 15.8 25.6 37.8 35.1 44.0 43.6
SD 2.2 2.6 2.9 4.9 0.8 8.7 12.6 13.3 15.2 4.3 14.6
COV% 96.5 60.9 60.8 71.2 5.6 54.8 49.0 35.1 43.3 9.8 33.5
Mass balance
Mean 97.6 102.1 100.2 96.2 96.6 96.9 92.2 97.6 94.8 94.9 93.8
SD 3.3 2.9 5.1 9.6 2.2 9.2 4.3 2.2 8.7 5.7 12.2
COV% 3.4 2.9 5.0 9.9 2.4 9.4 4.7 2.2 9.2 6.1 13.1
For florfenicol in pig manure, data from institute 4 were not considered for evaluation.
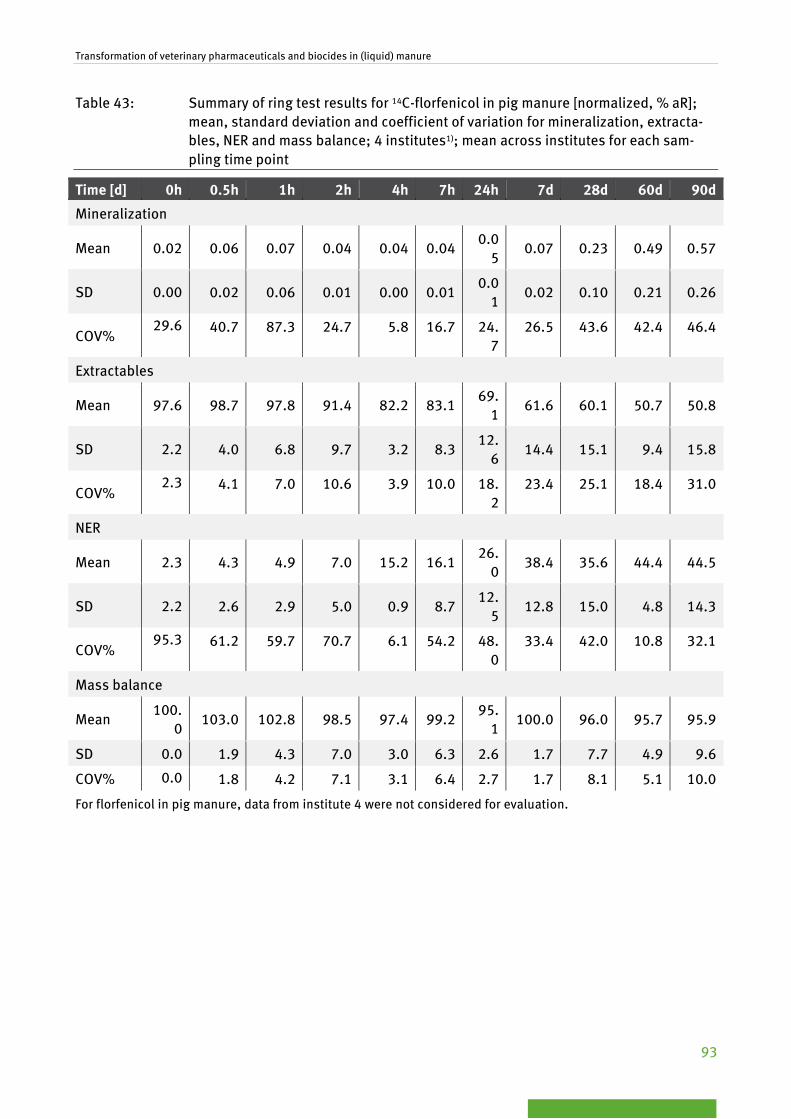
Transformation of veterinary pharmaceuticals and biocides in (liquid) manure
93
Table 43: Summary of ring test results for 14C-florfenicol in pig manure [normalized, % aR]; mean, standard deviation and coefficient of variation for mineralization, extracta-bles, NER and mass balance; 4 institutes1); mean across institutes for each sam-pling time point
Time [d] 0h 0.5h 1h 2h 4h 7h 24h 7d 28d 60d 90d
Mineralization
Mean 0.02 0.06 0.07 0.04 0.04 0.04 0.0
5 0.07 0.23 0.49 0.57
SD 0.00 0.02 0.06 0.01 0.00 0.01 0.0
1 0.02 0.10 0.21 0.26
COV% 29.6 40.7 87.3 24.7 5.8 16.7 24.
7 26.5 43.6 42.4 46.4
Extractables
Mean 97.6 98.7 97.8 91.4 82.2 83.1 69.
1 61.6 60.1 50.7 50.8
SD 2.2 4.0 6.8 9.7 3.2 8.3 12.
6 14.4 15.1 9.4 15.8
COV% 2.3 4.1 7.0 10.6 3.9 10.0 18.
2 23.4 25.1 18.4 31.0
NER
Mean 2.3 4.3 4.9 7.0 15.2 16.1 26.
0 38.4 35.6 44.4 44.5
SD 2.2 2.6 2.9 5.0 0.9 8.7 12.
5 12.8 15.0 4.8 14.3
COV% 95.3 61.2 59.7 70.7 6.1 54.2 48.
0 33.4 42.0 10.8 32.1
Mass balance
Mean 100.
0 103.0 102.8 98.5 97.4 99.2
95.1
100.0 96.0 95.7 95.9
SD 0.0 1.9 4.3 7.0 3.0 6.3 2.6 1.7 7.7 4.9 9.6
COV% 0.0 1.8 4.2 7.1 3.1 6.4 2.7 1.7 8.1 5.1 10.0
For florfenicol in pig manure, data from institute 4 were not considered for evaluation.

Transformation of veterinary pharmaceuticals and biocides in (liquid) manure
94
Figure 29: Mean for mass balance, extractables, NER and mineralization data [normalized; % aR] and standard deviation (shaded area) within the ring test for 14C-florfenicol in pig manure; 4 Institutes
Figure 30: Mean for mass balance, extractables, NER and mineralization data [normalized; % aR] and standard deviation (shaded area) within the ring test for 14C-imidacloprid in cattle manure; 4 Institutes;

Transformation of veterinary pharmaceuticals and biocides in (liquid) manure
95
Table 44: Summary of ring test results for 14C-imidacloprid in cattle manure [% aR]; mean, standard deviation and coefficient of variation for mineralization, extractables, NER and mass balance; 5 institutes; mean across institutes for each sampling time point
Time [d]
0 3 7 10 14 21 28 42 56 72 90
Mineralization
Mean 0.00 0.01 3.36 0.01 0.04 0.01 0.01 0.02 0.03 0.03 0.02
SD 0.00 0.00 4.74 0.00 0.00 0.00 0.00 0.01 0.01 0.01 0.01
COV% 0.00 35.0 141.1 31.5 4.4 26.7 15.2 46.1 26.7 35.4 46.9
Extractables
Mean 92.9 89.6 86.3 86.5 84.5 66.9 74.7 66.7 63.6 58.4 58.7
SD 14.9 14.3 13.8 12.8 15.3 12.8 9.7 12.7 20.4 17.2 24.4
COV% 16.1 16.0 16.0 14.8 18.1 19.1 13.0 19.0 32.0 29.4 41.6
NER
Mean 5.1 9.9 11.8 15.7 18.5 22.3 21.7 29.4 35.6 37.7 38.6
SD 6.1 5.5 5.8 8.0 9.2 12.0 9.7 12.4 18.5 18.5 19.8
COV% 119.5 55.7 49.5 51.3 49.9 53.7 45.0 42.2 52.0 49.1 51.4
Mass balance
Mean 98.0 99.5 101.4 102.2 103.1 89.2 96.4 96.1 99.3 96.2 97.3
SD 10.8 10.6 9.6 8.8 9.4 7.6 10.0 8.3 12.8 9.5 12.2
COV% 12.7 10.6 9.4 8.6 9.1 8.5 10.3 8.7 12.9 9.9 12.6

Transformation of veterinary pharmaceuticals and biocides in (liquid) manure
96
Table 45: Summary of ring test results for 14C-imidacloprid in cattle manure [normalized, % aR]; mean, standard deviation and coefficient of variation for mineralization, ex-tractables, NER and mass balance; 5 institutes; mean across institutes for each sampling time point
Time [d]
0 3 7 10 14 21 28 42 56 72 90
Mineralization
Mean 0.00 0.01 3.33 0.01 0.04 0.01 0.01 0.02 0.03 0.03 0.02
SD 0.00 0.00 4.69 0.00 0.00 0.00 0.00 0.01 0.01 0.01 0.01
COV% 0.00 33.9 141.1 30.5 4.4 26.9 15.2 45.1 26.1 35.5 45.6
Extractables
Mean 94.5 91.3 87.9 85.7 83.5 68.6 76.2 68.1 62.3 57.5 59.4
SD 7.2 7.6 8.4 5.3 7.4 7.4 5.5 11.5 15.3 13.9 24.2
COV% 7.6 8.3 9.6 6.2 8.9 10.8 7.2 16.9 24.6 24.2 40.7
NER
Mean 5.5 10.6 12.4 16.2 19.0 23.6 22.3 30.3 36.3 38.2 40.0
SD 7.2 6.8 7.0 9.9 11.0 13.7 10.4 13.4 20.7 19.8 21.6
COV% 129.2 64.5 56.5 60.7 57.8 57.8 46.5 44.1 56.9 51.8 54.1
Mass balance
Mean 100.0 101.9 103.7 102.0 102.6 92.3 98.6 98.5 98.7 95.8 99.5
SD 0.0 8.0 3.3 9.5 4.1 6.8 6.7 6.3 7.3 5.9 9.7
COV% 0.0 7.8 3.2 9.3 4.0 7.4 6.8 6.4 7.4 6.2 9.8

Transformation of veterinary pharmaceuticals and biocides in (liquid) manure
97
Figure 31: Coefficients of variation [%]: mean across institutes (dots) for mass balance, ex-tractables and non-extractable residues (NER) and total mean (open square) during the transformation studies of ring test.
Note: For florfenicol in pig manure, data from institute 4 were not considered for evaluation.
Table 46: Mean, standard deviation and coefficient of variation [%] for dissipation of the par-ent compound (DT50-values) during the transformation studies of the ring test (mean across replicates for each institute at 20°C)
Institute 1 2 3 4 5 6 Mean
Florfenicol
Mean 0.406 0.364 0.169 0.008 n.d. 0.538 0.341
SD 0.207 0.149 0.125 0.007 n.d. 0.127 0.494
COV% 20.97 15.02 12.56 0.73 n.d. 12.78 52.61
Imidacloprid
Mean 21.69 17.41 21.29 40.03 n.d. n.d. 23.819
SD 0.017 0.032 0.020 0.073 n.d. n.d. 0.360
COV% 1.66 3.16 1.95 7.36 n.d. n.d. 37.23
Note: For florfenicol in pig manure, data from institute 4 were not considered for evaluation. n.d. = not deter-mined

Transformation of veterinary pharmaceuticals and biocides in (liquid) manure
98
Figure 32: Boxplot diagram of mass balances (based on mean values) [% aR] within the ring test (14C-florfenicol in pig manure and 14C-imidacloprid in cattle manure)
Note: The ends of the error bars (whiskers) are set at the 97.5%-percentile (upper whisker) and at the 2.5%-percentile (lower whisker). Thus, the whiskers comprise 95% of the data. Values outside this range, are shown as dots. For florfenicol in pig manure, data from institute 4 were not considered for evaluation.
Table 47: Maxima, minima and percentiles of mass balances (%aR) within the ring test
14C-florfenicol in pig manure 14C-imidacloprid in cattle manure
Maximum 108.6 115.3
3rd quartile 99.5 106.0
median 97.2 98.0
1st quartile 93.2 91.0
Minimum 77.2 79.5
97.5 percentile 107.5 114.4
2.5 percentile 85.4 83.3

Transformation of veterinary pharmaceuticals and biocides in (liquid) manure
99
3.11 Transformation of florfenicol in pig manure at 10°C - special method con-siderations for identification of transformation products
3.11.1 Extraction and clean-up method
The identification of degradation products required the determination of transformation products using LC-MS/MS and non-radiolabeled florfenicol. Hence, it was mandatory to have a proper extrac-tion, clean-up and concentrating of florfenicol and transformation products because the ionization in the ESI interface of an LC-MS/MS system, and thus the result of the analysis vastly depends on the sample matrix.
To deliver extracts suitable for LC-MS/MS analysis, a modified and advanced method was developed. This encompassed especially centrifugation at much higher acceleration, additional clean-up and concentration steps.
Original method (see 2.3.1.2 method 1)
a) Batch extraction
▸ Manure sample in 50 mL Falcon tube ▸ Add same volume of 0.02 M KH2PO4/ACN 1:1 (v:v) ▸ Shake end-over-end for 20 minutes ▸ Centrifuge at 2600 g for 10 minutes ▸ Repeat this twice and combine extracts. ▸ Filtration of extract using e.g. 0.2 mm PTFE filters.
b) Additional ASE
c) HPLC using RPC18 column and gradient elution using 20 mM ammonium acetate and ACN.
New method
d) Batch extraction
▸ Manure sample in 50 mL Falcon tube ▸ Add same volume of 0.02 M KH2PO4/ACN 1:1 (v:v) ▸ Shake end-over-end for 20 minutes. ▸ Centrifuge at 15 000 g for 15 minutes ▸ Repeat this two more times with 1 minute vortexing; do not combine extracts.
e) Two-step clean-up using solid phase extraction (SPE) (according to Salvia et al. (2012), modified)
First clean-up using strong anion exchanger (SAX) cartridge (e.g. SB, Chromabond, Macherey-Nagel, Düren, Germany)
▸ Conditioning: 5 mL ACN followed by 5 mL conditioning buffer (0.04 M citric acid) ▸ Pass extract No. 1 through one and extracts No. 2 and 3 through a second SAX cartridge ▸ Elute into and combine in a 100-mL pear-shaped flask ▸ Wash SAX with extraction solution and collect ▸ Remove ACN on a rotary evaporator; water remains

Transformation of veterinary pharmaceuticals and biocides in (liquid) manure
100
Second clean-up using HLB cartridge (e.g. Strata-X, Phenomenex, Aschaffenburg, Germany)
▸ Conditioning: 5 mL ACN followed by 5 mL conditioning buffer (0.04 M citric acid). ▸ Pass extract and sequentially wash cartridge with 5 mL 0.04 M citric acid and 5 mL 0.1 M so-
dium acetate (NaOAc). ▸ Dry cartridge using vacuum (min. 10 minutes). ▸ Elute analytes with 10 mL ACN into 25 mL pear-shaped flask. ▸ Evaporate the eluate on a rotary evaporator until dryness (40°C, ~100 mbar). To avoid foam-
ing/boiling and to further diminish proteins etc. add ~0.5 g SAX (QuEChERS10 technique). ▸ Re-dissolve in 1 mL of H2O/ACN 50:50 (v:v). ▸ Add internal standard: 10 µL chloramphenicol 50 µg/mL; final concentration 500 ng/mL. ▸ Eventually filtrate using fiberglass filter (e.g. Chromafil GF-100/15MS). ▸ Store extracts at 8°C in the dark until measurement.
3.11.1.1 Test of additional accelerated solvent extraction (ASE) of centrifugation pellet
Because not all florfenicol and 14C-radioactivity from radiolabeled florfenicol could be recovered by the aforementioned method, the following ASE procedure was tested. To this end centrifugation pel-lets remaining after manure extraction with 0.02 M KH2PO4/ACN 1:1 (v:v) were store the at -18°C in the dark until ASE.
ASE method
▸ Freeze dry the centrifugation pellet. ▸ Weigh 1 g into extraction cartridge (Dionex 350).
ASE conditions: 100°C; 5 minutes heating, 10 minutes static extraction (12.000 kPa) using 100% ACN.
▸ Eventually further clean-up: Transfer extract into glass-centrifuge tube. QuEChERS: Conditioning of SAX powder in ACN. Add ~0.5 g to the extract (to remove addi-tional water add ~0.5 g anhydrous Na2SO4). Centrifuge and reduce extract in a rotary evaporator to ~1 mL.
▸ Add internal standard, eventually filtrate using fiberglass filter. Store extracts at 8°C in the dark until measurement.
The LC-MS/MS analysis of florfenicol and major transformation products in ASE extracts from the spiked soil samples using non-radioactive florfenicol revealed that additional ASE after preceding mild solvent extraction using 0.02 M KH2PO4/ACN 1:1 (v:v) did not yield sufficiently measurable compounds. Only small amounts (< 1.8% of residing compounds) were extracted. Such detectable concentrations were limited to the freshly spiked soil samples (incubation time ≤ 1 day) and the steri-lized samples from day 1 and 28. In all other samples, signals for all analytes (florfenicol and trans-formation products) were below the limit of detection. This result cannot be due to strong matrix in-terference with the ionization in the ESI source of the LC-MS/MS. This became evident from the good recovery of the spiked internal standard chloramphenicol. Instead it is concluded that the com-
10 QuEChERS stands for Quick, Easy, Cheap, Effective, Rugged, Safe, and is the acronym for a simplified solid phase ex-
traction (SPE) method adding bulk SPE material to the liquid sample or extract for removal of impurities and interfering substances instead of passing the sample through an SPE-cartridge. The method was first published by Anastassiades et al. (2003) and later adopted to a broader spectrum of analytes and matrices. The method has been collaboratively studied on a large number of commodity/pesticide combinations and is described in detail in the European Standard EN 15662:2008 (CEN, 2008).

Transformation of veterinary pharmaceuticals and biocides in (liquid) manure
101
pounds resisting threefold extraction with 0.02 M KH2PO4/ACN 1:1 (v:v) are strongly immobilized on manure organic matter. Thus, additional ASE is not recommended.
3.11.1.2 Recovery rate of the method
Analysis of florfenicol in freshly spiked manure samples (0.5 hours of incubation) showed that the recovery rate of the method was below 100%. For non-radioactive florfenicol spiked at 3 mg/kg to manure, the recovery rate was 59.8% (± 1.17%; standard deviation). For rapidly transforming sub-stances it is thus advisable to determine analytical recovery immediately after spiking. It was deter-mined that each of the three sequential extraction steps contributed to the recovery of florfenicol:
Step 1: 45.3% (± 1.60%)
Step 2: 10.0% (± 0.35%)
Step 3: 4.5% (± 0.08%)
This proved that the threefold extraction using 0.02 M KH2PO4/ACN 1:1 (v:v) is appropriate.
Recovery rates showed the same trend but were quantitatively somewhat different when measuring 14C-radioactivity from radiolabeled florfenicol (see Table 48).
To further identify the work steps most relevant for losses of the analyte, the extraction method was followed up step-by-step using 14C-radiolabelled florfenicol. Results for the recovery from spiked ma-nure that was incubated for 24 hours are shown in Table 48. It can be seen that the recovery of the applied radioactivity (100 kBq = 100%) was quite high with 114 % recovery after the three-stage extraction, 111 % after clean-up by SPE with SAX sorbent and 114 % after the second SPE using HRX sorbent. Recoveries > 100% are probably due to inhomogeneous distribution of suspended and/or dissolved organic matter from manure, containing adsorbed florfenicol. Considerable losses (recov-ery of the applied radioactivity =74.3%) occurred upon rotary evaporation, which was combined with a third sample clean-up step. For the latter SAX sorbent was used and applied with the QuEChERS technique, to avoid foaming and to further diminish proteins etc. A further reduction in recovery down to 44% was obtained after filtration of the concentrated sample using a fiberglass filter (Table 48).
Table 48: Recovery of radioactivity from 14C-florfenicol from spiked manure over the different work steps of the extraction and clean-up procedure.
Work step
Procedure Activity [kBq/mL]
Volume [mL]
Activity [kBq]
Total Activity [kBq]
1 1st extraction 2.7595 32 88.3 114.0
2 2nd extraction 0.7795 28 21.8
3 3rd extraction 0.1395 28 3.91
4 1st extract after SAX 2.7305 32 87.4 111.7
5 2nd & 3rd extract after SAX 0.4345 56 24.3
6.1 Loss from HRX 0.1035 47 4.86
6.2 Eluate from HRX 11.4765 10 114.8
7 1 mL concentrate from rotary evaporation 74.3115 1 74.3
8 1 mL concentrate fiberglass filtrated 44.0435 1 44.0
Initial radioactivity was 100 kBq so that activity [kBq] can be directly read as recovery rate [%]. Extraction was done 24 hours after spiking.

Transformation of veterinary pharmaceuticals and biocides in (liquid) manure
102
Further tests revealed that the losses in radioactivity were not due to volatilization, sorption of florfenicol to the fiberglass filter or incomplete extraction. Non-extractable residues in freshly spiked manure (0.5 hours of incubation) amounted to 2.3% of the spiked radioactivity from 14C-florfenicol (data not shown). Furthermore, the fiberglass filter was shown to produce minor losses of florfenicol when pure standard was filtrated (Table 49).
Together with the polyester (PET) filter, fiberglass is most recommended to be used for filtration of florfenicol extracts. Instead, it is strongly assumed that the losses of florfenicol/radioactivity during rotary evaporation combined with QuEChERS clean-up and upon filtration are due to the intended removal of suspended organic matter from the analysis solution. The observed losses show that sub-stantial parts of florfenicol are sorbed to this suspended organic matter, and thus get lost upon QuEChERS clean-up and filtration.
Table 49: Recovery of florfenicol in H2O/ACN 50:50 (v:v) without (control) and with filtration using four different syringe filters (Macherey-Nagel, Düren, Germany).
Filter types Recovery Recovery rate [ng/mL] SD [%]
Control without filter 860.67 3.74 100.00
1 Fiberglass - Chromafil GF 100/15MS 812.33 5.94 94.38
2 Regenerated cellulose - Chromafil RC 45/15 780.67 1.12 90.70
3 PET - Chromafil Xtra PET 45/25 818.00 2.12 95.04
4 PTFE - Chromafil 0-45/15MS 719.00 2.19 83.54
SD = standard deviation.
Calibration
Calibration of LC-MS/MS was done using external standards of florfenicol (50, 100, 200, 300, 400, 500, 750, 1000 ng/mL) and florfenicol amine (10, 20, 50, 100, 200, 500, 750, 1000 ng/mL). For radioactivity measurements the calibration curves were done using 14C-florfenicol standard solutions with 0.1, 0.5, 1, 5, 10, 20, 30, 40 and 50 kBq/mL. All calibrations were linear within the tested range.
3.11.2 Assignment of transformation products
From radio-HPLC analyses it became clear that florfenicol not only dissipated over time due to immo-bilization. At least part of the decline in the signal from 14C-florfenicol was due to transformation into transformation products. Three additional signals from radioactivity developed over time with reten-tion times of 4.0, 8.3 and 15.0 minutes for radio-HPLC. Transferred to the retention times in LC-MS/MS (with shorter dead time) these were 2.0, 6.3 and 13.0 minutes. Due to the broadness of the new signals at 4.0 and 15.0 minutes each could represent one or two transformation products (Figure 33). The signal at 30.0 min only occurred in a few samples (day 7, day 28) without meaningful kinet-ics. All reported and/or suggested transformation products of florfenicol are more polar (smaller Kow and/or higher electronegativity due to the type of functional groups; see Table 50). Hence, no trans-formation product is expected to occur in reversed phase chromatography at higher retention times compared to florfenicol. Thus, the signal at 30.0 minutes was not further considered.
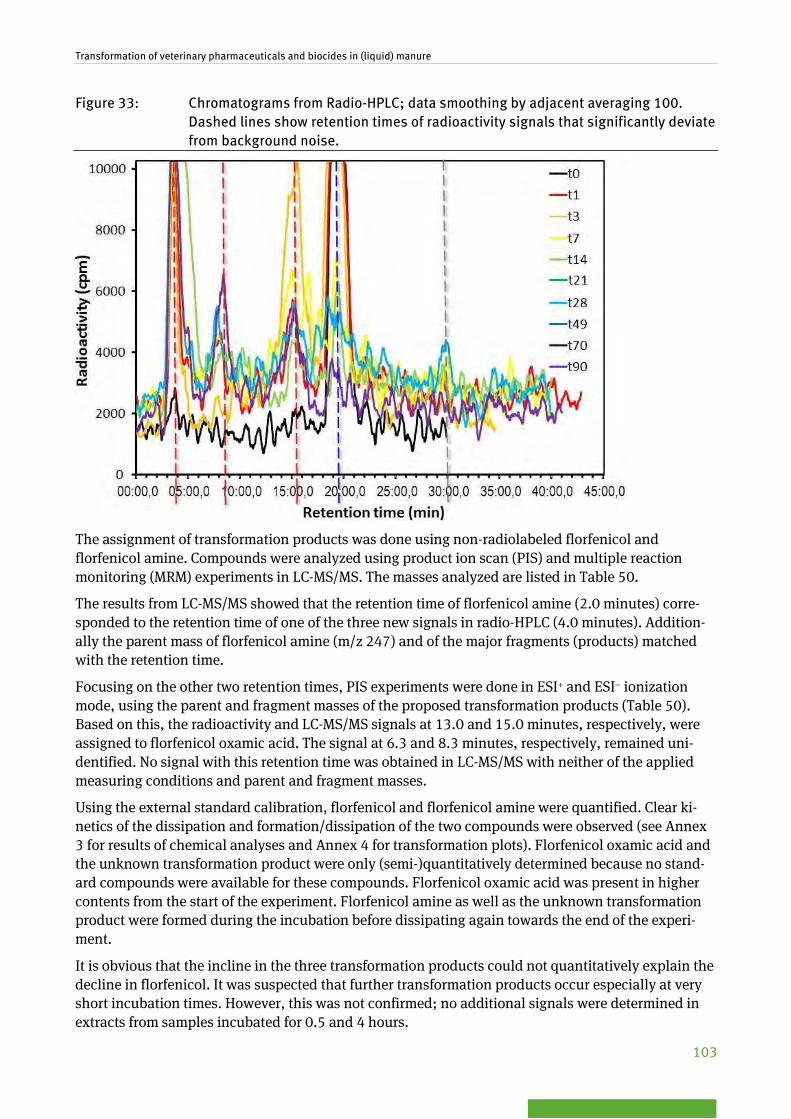
Transformation of veterinary pharmaceuticals and biocides in (liquid) manure
103
Figure 33: Chromatograms from Radio-HPLC; data smoothing by adjacent averaging 100. Dashed lines show retention times of radioactivity signals that significantly deviate from background noise.
The assignment of transformation products was done using non-radiolabeled florfenicol and florfenicol amine. Compounds were analyzed using product ion scan (PIS) and multiple reaction monitoring (MRM) experiments in LC-MS/MS. The masses analyzed are listed in Table 50.
The results from LC-MS/MS showed that the retention time of florfenicol amine (2.0 minutes) corre-sponded to the retention time of one of the three new signals in radio-HPLC (4.0 minutes). Addition-ally the parent mass of florfenicol amine (m/z 247) and of the major fragments (products) matched with the retention time.
Focusing on the other two retention times, PIS experiments were done in ESI+ and ESI– ionization mode, using the parent and fragment masses of the proposed transformation products (Table 50). Based on this, the radioactivity and LC-MS/MS signals at 13.0 and 15.0 minutes, respectively, were assigned to florfenicol oxamic acid. The signal at 6.3 and 8.3 minutes, respectively, remained uni-dentified. No signal with this retention time was obtained in LC-MS/MS with neither of the applied measuring conditions and parent and fragment masses.
Using the external standard calibration, florfenicol and florfenicol amine were quantified. Clear ki-netics of the dissipation and formation/dissipation of the two compounds were observed (see Annex 3 for results of chemical analyses and Annex 4 for transformation plots). Florfenicol oxamic acid and the unknown transformation product were only (semi-)quantitatively determined because no stand-ard compounds were available for these compounds. Florfenicol oxamic acid was present in higher contents from the start of the experiment. Florfenicol amine as well as the unknown transformation product were formed during the incubation before dissipating again towards the end of the experi-ment.
It is obvious that the incline in the three transformation products could not quantitatively explain the decline in florfenicol. It was suspected that further transformation products occur especially at very short incubation times. However, this was not confirmed; no additional signals were determined in extracts from samples incubated for 0.5 and 4 hours.
Transformation of veterinary pharmaceuticals and biocides in (liquid) manure
104
Furthermore, additional transformation products were screened for. This is an acetyl-conjugate as well as a methyl-conjugate of florfenicol and a fragment [4-(methylsulfonyl)phenyl]methanol (C8H10O3S) that has been reported to evolve in MS analysis (Alechaga et al., 2013). It was hypothe-sized that this typical fragmentation product of the molecule may also be a typical product of chemi-cal and/or biological degradation. It was found that the conjugates did not occur during the degrada-tion process. The same was found for [4-(methylsulfonyl)phenyl]methanol, although fragments with the typical m/z-ratio of [4-(methylsulfonyl)phenyl]methanol clearly occurred with high intensity al-ready in the first samples. Yet, the concentrations of [4-(methylsulfonyl)phenyl]methanol did not follow meaningful kinetics but arbitrarily changed from sampling time to sampling time. Further analyses revealed that a different compound with similar m/z-ratio must be contained in manure.
In summary, the following transformation products have been assigned:
1. Florfenicol amine 2. unknown transformation product 3. florfenicol oxamic acid
We propose that florfenicol is first transformed to florfenicol oxamic acid by substitution of chloride with a carboxyl group. Most likely, this intermediate product is further transformed to florfenicol amine by amide bond hydrolysis. It is assumed that florfenicol amine is not the major parent com-pound for the formation of florfenicol amine because the formation of florfenicol amine goes along with the dissipation of florfenicol oxamic acid. The formation and subsequent dissipation of the un-known transformation product parallels that of florfenicol amine. Since no mass identification and thus molecular characterization of the unknown transformation product was possible, no transfor-mation pathway can be suggested for this compound. From the retention time in reversed phase chromatography it is concluded that the polarity of the unknown transformation product is in be-tween of florfenicol amine and florfenicol oxamic acid. All transformation products disappeared again during the incubation time, showing that no dead-end transformation products could be identi-fied.
DT50-values for the parent compound, calculated by means of the KinGUI-software tool using “single first order” (SFO) kinetics, are presented in section 3.5. The corresponding transformation plots can be looked up in Annex 4, chemical analysis raw data are summarized in Annex 3.

Transformation of veterinary pharmaceuticals and biocides in (liquid) manure
105
Table 50: Putative and identified transformation products of florfenicol and parameters for LC-MS/MS analysis
Name Formula CAS Molar mass
Fragments for LC-MS
Esi Modea
for LC-MS logKOW KOC Sb
[mg/L] H-Donor/ Acceptor
Identified
1 Florfenicol C12H14Cl2FNO4S 73231-34-2 357 185/336 negative -0.04 205.2 5936 5/2 Yes
2 Florfenicol amine C10H14FNO3S 76639-93-5 247 130/230 positive -1.27 79.8 1.00E+6 4/3 Yes
3 Florfenicolalcohol N-[1-(fluoromethyl)-2-hydroxy-2-(4-methylsulfonylphenyl) ethyl]-2-hydroxy-acetamide
C12H16FNO5S - 305 185c negative < -0.04 - - - No
4 Florfenicol oxamic acid 2-[[1-(fluoro-methyl)-2-hydroxy-2-(4-methylsulfonyl phenyl)ethyl] amino]-2-oxo-acetic acid
C12H14FNO6S - 319 185 negative < -0.04 - - - Yes
5 Monochloroflorfenicol 2-chloro-N-[1-(fluoromethyl)-2-hydroxy-2-(4-methyl-sufonylphenyl)ethyl]acetamide
C12H15ClFNO4S - 323 185 negative - - - - No
6 N-2-hydroxy-2-4-methansulfonylphenyl-1-methyl-ethyl-acetamide
C12H17NO4S - 271 185 negative -1.05 34.8 1.41E+5 ? No
7 N-1-fluoromethyl-2-hydroxy-2-4-methane-sulfonylphenylethylacetamide
C12H16FNO4S - 289 185 negative -1.11 67.3 1.25E+5 ? No
8 Thiamphenicol C12H15Cl2NO5S 15318-45-3 355 185 negative -0.27 10.0 9660 6/3 No
9 Chloramphenicol C11H12Cl2N2O5 56-75-7 323 152 negative 1.14 10.0 2500 7/3 No
a) ESI = Electrospray inonization used in LC-MS/MS; b) S = water solubility at 25°C; c) italized fragment masses were estimated from molecular structure; chemical data on logKOW, KOC, S- and H-donor/acceptor properties were taken from ChemSpider (http://www.chemspider.com/Search.aspx) and calculated with EPI-Suite (© by US EPA, 2000), respectively

Transformation of veterinary pharmaceuticals and biocides in (liquid) manure
106
3.11.3 Conclusions on identification of transformation products ▸ For LC-MS/MS-analysis a thorough clean-up of manure extracts is required as many interfer-
ing substances are present in manure extracts without further clean-up. ▸ The following methods and techniques were found to be useful for extraction.
- A three times repeated extraction using a mixture of an aqueous salt solution with a polar solvent. For florfenicol this was 0.02 M KH2PO4 / ACN 1:1 (v:v).
- Centrifugation at high acceleration to enable maximum settling of manure particulate and colloidal matter. For florfenicol this was centrifugation at 15 000 g für 15 min.
- Multi-step solid phase extraction using 1. SAX cartridge, 2. HLB cartridge and 3. addi-tional SAX applied with the QuEChERS technique upon rotary evaporation of the solvent.
▸ The use of an internal standard is mandatory for chromatographic analysis. For florfenicol this was chloramphenicol.
▸ Further filtration of the sample might be required with best recovery obtained with PET filter and fiberglass filter.
▸ Additional extraction using pressurized liquid extraction did not yield sufficiently measurable contents of florfenicol.
▸ Analysis using LC-MS/MS is best suited for the detection of polar compounds such as phar-maceuticals.
▸ For the determination of florfenicol and its major transformation products analyses using the negative and the positive ionization mode are required. With the combination of radio-HPLC and LC-ESI-MS/MS using product ion scan (PIS) and multiple reaction monitoring (MRM) ex-periments, each performed with a suite of different modes and parameter settings proved use-ful to identify transformation products in manure
▸ The identification of transformation products and pathways is often hindered due to the una-vailability of standard substances. This was the case for the majority of the suggested trans-formation products of florfenicol. This problem might be circumvented by the use of high res-olution mass spectrometry.
3.12 Modification, discussion and further development of the draft test guide-line
The first version of the draft test guideline was compiled in the framework of the preceding project „Development of test guidance for transformation of veterinary pharmaceuticals and biocides in liq-uid manure“ (Hennecke et al., 2015). The guideline had been updated several times based on experi-ences from intra-laboratory comparisons and an international inter-laboratory comparison (pre-validation ring test). Based on the results and the discussions during a workshop held in Flörsheim, Germany, in April 2013, the text of the draft test guideline has been revised and critical steps of the test performance have been specified.
The revised draft guideline was then used as basis in the international ring test in 2013/2014, which is described in the present report. After conducting the ring test the applicants presented their expe-riences at an international technical workshop in Gießen, Germany, in September 2014 (see section 3.12.1), resulting in an updated draft test guideline. Besides the revision of the existing guideline text (e.g. paragraphs on reference substance, preparation of sterile samples, stripping out potentially dis-solved CO2), several annexes were added to the guideline, describing e.g. extractions and clean-up methods and incubation systems.
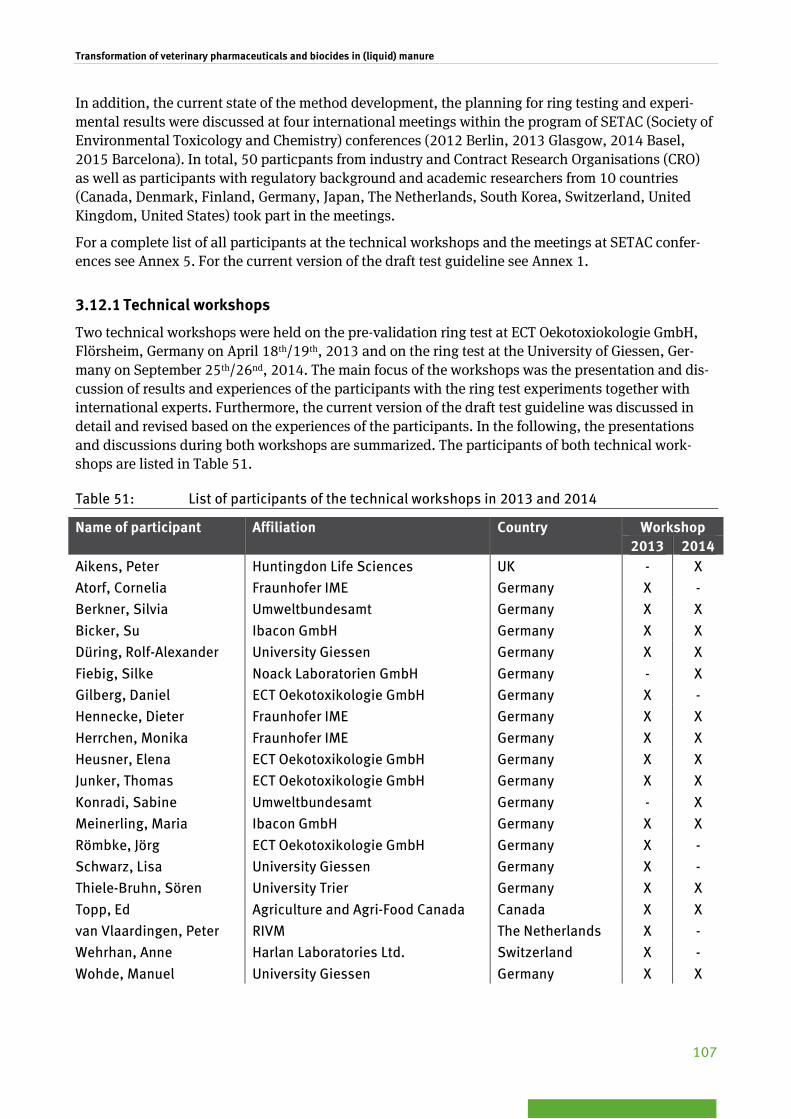
Transformation of veterinary pharmaceuticals and biocides in (liquid) manure
107
In addition, the current state of the method development, the planning for ring testing and experi-mental results were discussed at four international meetings within the program of SETAC (Society of Environmental Toxicology and Chemistry) conferences (2012 Berlin, 2013 Glasgow, 2014 Basel, 2015 Barcelona). In total, 50 particpants from industry and Contract Research Organisations (CRO) as well as participants with regulatory background and academic researchers from 10 countries (Canada, Denmark, Finland, Germany, Japan, The Netherlands, South Korea, Switzerland, United Kingdom, United States) took part in the meetings.
For a complete list of all participants at the technical workshops and the meetings at SETAC confer-ences see Annex 5. For the current version of the draft test guideline see Annex 1.
3.12.1 Technical workshops
Two technical workshops were held on the pre-validation ring test at ECT Oekotoxiokologie GmbH, Flörsheim, Germany on April 18th/19th, 2013 and on the ring test at the University of Giessen, Ger-many on September 25th/26nd, 2014. The main focus of the workshops was the presentation and dis-cussion of results and experiences of the participants with the ring test experiments together with international experts. Furthermore, the current version of the draft test guideline was discussed in detail and revised based on the experiences of the participants. In the following, the presentations and discussions during both workshops are summarized. The participants of both technical work-shops are listed in Table 51.
Table 51: List of participants of the technical workshops in 2013 and 2014
Name of participant Affiliation Country Workshop 2013 2014
Aikens, Peter Huntingdon Life Sciences UK - X Atorf, Cornelia Fraunhofer IME Germany X - Berkner, Silvia Umweltbundesamt Germany X X Bicker, Su Ibacon GmbH Germany X X Düring, Rolf-Alexander University Giessen Germany X X Fiebig, Silke Noack Laboratorien GmbH Germany - X Gilberg, Daniel ECT Oekotoxikologie GmbH Germany X - Hennecke, Dieter Fraunhofer IME Germany X X Herrchen, Monika Fraunhofer IME Germany X X Heusner, Elena ECT Oekotoxikologie GmbH Germany X X Junker, Thomas ECT Oekotoxikologie GmbH Germany X X Konradi, Sabine Umweltbundesamt Germany - X Meinerling, Maria Ibacon GmbH Germany X X Römbke, Jörg ECT Oekotoxikologie GmbH Germany X - Schwarz, Lisa University Giessen Germany X - Thiele-Bruhn, Sören University Trier Germany X X Topp, Ed Agriculture and Agri-Food Canada Canada X X van Vlaardingen, Peter RIVM The Netherlands X - Wehrhan, Anne Harlan Laboratories Ltd. Switzerland X - Wohde, Manuel University Giessen Germany X X

Transformation of veterinary pharmaceuticals and biocides in (liquid) manure
108
Figure 34: Participants of the technical workshops in Flörsheim 2013 (left) and in Giessen 2014 (right)
3.12.1.1 Presentations and discussions at the workshop 2013
After a presentation on the background and the aim of the preceding project (Hennecke et al., 2015), the development of the test method and the draft guideline was presented. In addition, the results of the inter-laboratory comparison were presented and discussed. Based on these experiences, the cur-rent version of the draft test guideline as well as necessary changes or problems were discussed at the workshop.
Incubation conditions
Flow-through as well as static test systems have to maintain anaerobic/methanogenic conditions. It was questioned whether the flow-through conditions are realistic, because tanks or lagoons are more or less static systems. Furthermore, problems may occur, if H2 is removed from the system with the gas flow since hydrogen is then missing for other processes, e.g. formation of CH4. No final conclu-sion could be drawn on the suitability of the test design (static/flow-through) but, the option for us-ing a static test system was added to the description of the test method. In addition, it was decided to compare static test systems and flow-through test system in further tests.
Dry matter content
Although the dry matter content might vary in the tank or lagoon due to different layers, the adjust-ment of the dry matter content to a uniform, representative value for testing purposes seems to be very important.
An extensive increase of the dry matter content by centrifugation was criticized because microorgan-isms and dissolved organic carbon are removed together with supernatant. Therefore, a minimum initial dry matter content was added to the description of the test method: If the dry matter content is below the recommended value, it can be concentrated by careful centrifugation (e.g. 10 minutes at 740 x g). However, the initial dry matter content should not be below 8% (cattle) or 3% (pig). If dry matter content is too high, water (deionized water, bubbled with nitrogen for 30 minutes) should be added as needed.” It was further decided to conduct additional experiments to investigate the influ-ence of the dry matter content of the manure on the parameters mineralization, DT50 and NER.

Transformation of veterinary pharmaceuticals and biocides in (liquid) manure
109
Microbial activity
The outcome of the 14C-glucose mineralization tests as a measure of microbial activity of the manure, seemed to be not predictive for the results of the test substance. Further testing is required to check the suitability of the glucose test for measuring microbial activity of the manure. However, no other methods are available so far that are better suited.
Test item concentration/application
The test item concentration should always be mentioned when presenting the results. Different test results might be obtained due to different application techniques (locally high test concentrations might be toxic to the microorganisms). Therefore, the application of the test item into the manure was simulated in a practical demonstration. It became apparent that comparable application techniques have been used by all participants of the pre-validation ring test. Thus, differences in the results can-not be explained by different application techniques.
Measurements and Analysis
Problems may occur with regard to chemical analysis if transformation products are detected at very low but continuously increasing concentrations during the study (e.g. 1% aR continuously increasing up to 1.5% aR at the end of the study).
Beyond that, the required test item purity of ≥95% means that up to 5% impurities might be present. Therefore, it would not make sense to identify transformation products below 5% aR. Thus, a modi-fied wording was suggested: “Transformation products once detected at ≥ 5% for which concentra-tions are continuously increasing during the study afterwards should also be identified, even if their concentrations do not exceed the limit given above, as this may indicate persistence.”
Quality Criteria
The redox conditions throughout the study have to guarantee methanogenic conditions as is ob-served in a manure tank. Care has to be taken to fulfil these conditions. It was recommended to pre-vent air entering the system during removal of single replicates by using valves or a special set-up design (e.g. replicates for one sampling time point in series instead of in parallel).
A high mass balance is important to be able to use the results from the study. In other simulation type studies (e.g. OECD 307 (OECD, 2002a) and OECD 308 (OECD, 2002b)) the criterion is 90-110% mass balance for radiolabeled compounds. This range was not met by all participants, thus less stringent criteria might be needed. This point was addressed in the following ring test.
Variability of results
Large differences were observed in this first comparison exercise between the results of the partici-pants for transformation of 14C-salicylic acid in cattle and pig manure. The variability seemed to be mainly caused by differences in the test design and in test procedures at the different laboratories. This can be explained by the fact that many of the participants were unexperienced in performing transformation studies with manure and many of the test parameters had not been fixed sufficiently in advance (e.g. minimum and maximum dry matter content). For that reason, a precise description of manure handling, particularly for critical steps, had been added to the draft test guideline in view of the upcoming ring test.

Transformation of veterinary pharmaceuticals and biocides in (liquid) manure
110
3.12.1.2 Presentations and discussions at the workshop 2014
After a presentation on the background and the aim of this project the results of the preceding project and the first inter-laboratory comparison were summarized (see above). In the following, all ring test participants presented details on the test setup, sampling and extraction procedures as well as results of the experiments and observed problems. The presentations were followed by discussions on differ-ent topics regarding performance and evaluation of the ring test, which are summarized in the sub-sequent section.
Quality criteria and microbial activity of manure
Several methods are suggested for testing the microbial activity of manure (e.g. EMA, 2011).
The mineralization of a readily biodegradable compound (e.g. 14C-glucose) was measured within the pre-validation ring test. However, results showed high variation and did not correlate with the results for the mineralization of the test compound 14C-salicylic acid. Although, the variation might have been caused by insufficient time to strip out 14CO2 after acidification of the manure, further testing would be required to check the suitability of the test method for measuring microbial activity of the manure. Additionally the suitability of glucose as a representative compound to conclude on the transformation ability of the manure for VMP and biocides was questioned. Reduction of DMSO to DMS can be used as measurement of anaerobic microbial activity without interference (Griebler and Slezak, 2001). The determination of gas production (e.g. according to VDI (2006)) of manure without addition of a test compound at several time points throughout acclimation and incubation was inves-tigated as a method to check microbial activity of the manures. The gas production was similar for both cattle and pig manure at the beginning of the acclimation period, but gas production decreased inconsistently afterwards. Thus, further testing (e.g. using several different manures in parallel) would be needed as well to check if this method is suitable for measuring microbial activity of the manure.
Another method to determine the microbial biomass (not the microbial activity) is the fumigation method according to ISO 14240–2 (ISO, 1999). The active and the inactive biomass were deter-mined, but false positive or false negative results were often obtained. The fumigation method can – in principle – be used to determine the microbial biomass under anaerobic conditions. However, pre-liminary tests showed that they are not applicable to the matrix manure due to very high background values (Hennecke et al., 2015).
Based on the experiences with 14C glucose method in the pre-validation ring test, this method was not recommended for the ring test. As no other suitable methods were available, testing the microbial activity within the ring test (e.g. according to one of the methods mentioned above) was optional.
As an alternative, the participants agreed that the mineralization of 14C-labeled salicylic acid as refer-ence compound should be used to get information on microbial activity. The transformation behavior of salicylic acid was already examined previously by Hennecke et al. (2015). Salicylic acid (e.g. as sodium salicylate (CAS-No. 54-21-7) or as salicylic acid (CAS-No. 69-72-7) has been tested for trans-formation under anaerobic conditions in pig and cattle manure and found to be mineralized to a high extent to CO2 and CH4 (> 50% aR to 80% aR within 85 to 91 days). DT50-values (SFO, dissipation of parent) observed in tests with 6 different pig and 3 different cattle manures ranged from 3 d to 30 d (Hennecke et al., 2015). DT50,MIN values (SFO, mineralization to CO2 and CH4) observed in tests with two pig and two cattle manures ranged from 15 d to 49 d (Herrchen et al., 2016). It is suggested to use the reference substance at a concentration of 24 mg/kg wet manure (corresponding to 0.02 mg 14C salicylic acid (75 kBq) plus 1.18 mg unlabeled salicylic acid applied to 50 g manure fresh weight. For the reference compound, the same results as for the test substance have to be reported.

Transformation of veterinary pharmaceuticals and biocides in (liquid) manure
111
A new section for testing the reference substance salicylic acid was added to the final draft guideline (see Annex 1) to be able to ensure comparable conditions for different tests with different manures. Consequently, no other measurement of microbial activity is needed.
Anaerobic test conditions and redox potential
The redox potential does not directly measure the presence of anaerobic or methanogenic conditions but it is the most feasible measurement and is commonly used as an indicator. The threshold value of -100 mV was adopted from OECD Guideline 308 (OECD, 2002b). The intention is to get conditions in the transformation experiments that mimic closely the conditions observed in reality in storage facili-ties for liquid manure, where redox potentials have been found to be typically in the range of -230 mV to -400 mV (Weinfurtner, 2011). If the guideline is followed, it should be no problem to meet the redox criteria.
Measurement of methane (CH4)
In the preceding project mineralisation to CH4 was measured for salicylic acid (up to 6% aR) and glu-cose (up to 23% aR). If feasible, CH4 should be determined to prevent losses of volatile transfor-mation products and an incomplete mass balance. Furthermore, measurement of CH4 can be used to prove the presence of methanogenic microorganisms, which is an indication for similar microbial communities as present in manure storage tanks (Barret et al., 2013).
Possible adaptation of microorganisms
Adaptation of microorganisms in manure pre-exposed to test substances cannot be excluded when sampling manure directly from a tank. However, it was agreed to use manure directly sampled from a tank or storage device and only to adjust the dry matter content instead of trying to set up a manure matrix from individual components, as this produces more problems in the long run. Mixtures ob-tained from mixing excrements (faces and urine) from animals were found to have a completely dif-ferent microbial community structure based on DGGE (Denaturating Gradient Gel Electrophoresis) experiments (unpublished results, personal communication Kornelia Smalla, Julius-Kühn-Institut, Braunschweig, Germany). All ring test participants had been able to obtain suitable manure. It was stressed that if manure is sampled from a tank and has to be used directly in the experiment, there is a low risk of adaptation occurring compared to preparing some kind of “standardized” manure by mixing urine and faeces collected separately or rearing specialized animals for the purpose of collect-ing their manure. It was agreed, that transformation should be studied under conditions as close as possible to the situation in a real world manure tank, in which VMPs, biocides as well as other sub-stances might be present. The inclusion of a positive control or reference substance into the method is a way of dealing with uncertainties stemming from this fact. To further take this into account, the medication that the animals received and used disinfection products in the stable should be recorded for the last 6 months prior to sampling and this information should be part of the study report. It is in the responsibility of the laboratory conducting the study to choose a manure suitable for testing pur-poses based on this information.
Number of manures
Transformation in manure is a complex study. For reasons of feasibility and practicability it was con-cluded that presently, one manure was considered to be sufficient if selected carefully and the same manure is concurrently tested with the reference compound.
Preparation of sterile manure samples

Transformation of veterinary pharmaceuticals and biocides in (liquid) manure
112
For laboratories that have no knowledge on working with the matrix manure, sterilization of samples might pose difficulties. Therefore detailed information on procedures that have been proven effective for the ring test laboratories have been included into the guideline, like e.g. autoclaving at least twice and preheating the samples (100°C for at least 12 hours) prior to autoclaving.
Test substance concentration in manure
Since the guideline should be applicable for several exposure scenarios with different calculations for maximum expected manure concentration it is not be possible to include detailed guidance how to calculate this value. It was added to the guideline that the calculation method and a rationale for its choice have to be reported. Substance specific regulatory frameworks (e.g. EMA, 2011) contain in-formation on exposure scenarios.
Determination of mineralization
Some participants of the ring test observed that three hours of incubation after acidification were insufficient to strip out the entire dissolved CO2. The time period should therefore be prolonged to at least 24 hours. If a (semi-)static test system is used, bubbling the manure might be necessary in addi-tion. Nitrogen should be used to ensure anaerobic conditions.
Which extraction methods to use?
The text in the draft guideline was adopted from the EMA guideline (EMA, 2011). Accordingly, it is recommended that a sequential extraction method is followed and the remaining residues are com-busted. The fraction of radiolabel therein is termed NER. The extraction method(s) have to be tailored to the specific test substance (and transformation products). Analytical methods (including extrac-tion methods and clean-up methods) have to be validated and reported in detail for each test com-pound by the laboratory conducting the study.
Suitability of different test setups
According to the outcome of the inter-laboratory comparison, a semi-static as well as a flow-through test setup are suitable. Further experiments revealed that the parameter mineralization might show differences in between both systems (Herrchen et al., 2016). Therefore, a semi-static test system is recommended. Periodic purging with nitrogen is needed to avoid losses due to overpressure in the test vessels.
Transformation of veterinary pharmaceuticals and biocides in (liquid) manure
113
4 Conclusions Based on the results and the experiences in the ring test, the discussions at the international work-shops in 2013 and 2014 as well as the discussions with stakeholders at four international mettings at SETAC conferences (2012 Berlin, 2013 Glasgow, 2014 Basel, 2015 Barcelona), the following conclu-sions can be drawn:
▸ The test method described in the draft test guideline proved to be applicable for routine measurements of the transformation of veterinary pharmaceuticals and biocides in pig and cattle manure.
▸ A semi-static test design should be used, whereas a strictly static test design is not recom-mended due to the potential loss of volatile transformation products and an incomplete mass balance that might result from overpressure in the closed system without periodic flushing.
▸ Anaerobic conditions can be ensured when using the test method described in the draft test guideline as demonstrated by measured redox potentials below -100 mV throughout the en-tire test period. The observed redox potentials are in the range typically found in liquid ma-nure storage tanks of -230 mV to -400 mV (Weinfurtner, 2011).
▸ A reference substance should be tested in parallel to the test compound to be able to ensure comparable conditions for different tests with different manures. Salicylic acid (e.g. as sodium salicylate CAS: 54-21-7 or as salicylic acid CAS: 69-72-7) is proposed as reference substance since it has been tested for transformation under anaerobic conditions in pig and cattle ma-nure and found to be mineralized to a high extend to CO2 and CH4. If a reference substance is tested, there is no need to test for microbial activity (e.g. mineralization of 14C-glucose).
▸ One manure is considered to be sufficient if selected carefully and the same manure is con-currently tested with the reference substance.
▸ Autoclaving is recommended to prepare sterile samples. Autoclaving should be performed at least twice and the samples should be heated (100°C for at least 12 hours) in advance.
▸ The time period to strip out potentially dissolved 14CO2 after acidification of the manure should be at least 24 hours. If a semi-static test system is used, bubbling the manure might be necessary in addition. Nitrogen should be used to ensure anaerobic conditions.
▸ If feasible, 14CH4 should be determined to avoid losses and an incomplete mass balance. Fur-thermore, measurement of 14CH4 can be used to prove that methanogenic microorganisms are present in the manure.
▸ Mean 14C mass balances averaged across all participants throughout the test period were in the range between 92.2% aR and 102.1% aR for florfenicol in pig manure and between 89.2% aR and 103.1% aR for imidacloprid in cattle manure. In consideration of frequency distributions of mass balances and other existing test guidelines on transformation of chemi-cals in different compartments, a quality criterion of 100 ± 15% aR for mass balance is rec-ommended.
▸ For the identification of transformation products analysis using LC-MS/MS is suited best. For LC-MS/MS-analysis a thorough clean-up of manure extracts is required and further filtration of the sample might be needed. The use of an internal standard is recommended for chroma-tographic analysis.
▸ The SFO model is considered to be appropriate for determination of DT50-values for transfor-mation in manure. Mean DT50-values were in the range between 17.4 d and 40.1 d for im-idacloprid in cattle manure and between 0.17 d and 0.41 d for florfenicol in pig manure.
▸ The amounts of extractable residues (ER) and non-extractable residues (NER) depend on the extraction method used. Therefore, analytical procedures (including extraction and clean-up methods) have to be validated and reported test substance specific.

Transformation of veterinary pharmaceuticals and biocides in (liquid) manure
114
▸ Low variability and spread in the results were observed in the ring test for extractable resi-dues (COV at the end of the test: 31.0-40.7%), non-extractable residues (COV at the end of the test: 32.1-54.1%) and DT50 values (overall COV: 37.2-52.6%) and particularly for 14C-mass balances (COV at the end of the test: 9.8-10.0%).
In summary, the draft test protocol prove to be applicable in different laboratories with different lev-els of experience with manure and different experimental set-ups using individually sampled manure from storage tanks. The observed variability in between different participating laboratories allows to obtain reproducible results suitable for the purpose of characterizing the fate and transformation of chemicals in manure.
In conclusion, the experimental method described in the final draft version of the test guideline (see Annex 1) is considered well-suited to examine the anaerobic transformation of organic compounds, including veterinary pharmaceuticals and biocides, in liquid manure.

Transformation of veterinary pharmaceuticals and biocides in (liquid) manure
115
5 References Alechaga, E., Moyano, E., Galceran, M.T. (2013): Atmospheric pressure ionization-tandem mass spectrometry of the pheni-
col drug family. J Mass Spectrom 48:1241-1251.
Anastassiades, M., Lehotay, S.J., Stajnbaher, D., Schenck, F.J. (2003): Fast and easy multiresidue method employing ace-
tonitrile extraction/partitioning and dispersive solid-phase extraction for the determination of pesticide residues in pro-
duce. JAOAC Int 86:412-31.
Barret, M., Gagnon, N., Kalmokoff, M.L., Topp, E., Verastegui, Y., Brooks, S.P.J., Matias, F., Neufeld, J.D., Talbot, G. (2013).
Identification of Methanoculleus spp. as Active Methanogens during Anoxic Incubations of Swine Manure Storage Tank
Samples. Appl Environ Microb 79:424-433.
CEN (European Committee for Standardization). 2008. European Standard EN 15662:2008. Foods of plant origin - Determi-
nation of pesticide residues using GC-MS and/or LC-MS/MS following acetonitrile extraction/partitioning and clean-up by
dispersive SPE - QuEChERS-method. CEN, Brussels, November 2008.
DIN (1984). DIN 38404-6:1984-05: German standard methods for the examination of water, waste water and sludge; physi-
cal and physico-chemical parameters (group C); determination of the oxidation reduction (redox) potential (C 6). Deutsches
Institut für Normung, Berlin, May 1984.
DIN (2001a). DIN EN 12879:2001-02: Characterization of sludges - Determination of the loss on ignition of dry mass.
Deutsches Institut für Normung, Berlin.
DIN (2001b). DIN EN 12880:2001-02: Characterization of sludges - Determination of dry residue and water content.
Deutsches Institut für Normung, Berlin.
EFSA (European Food Safety Authority). 2008. Scientific Opinion of the Panel on Plant Protection Products and their Resi-
dues on a request from EFSA related to the default Q10 value used to describe the temperature effect on transformation
rates of pesticides in soil. The EFSA Journal 622: 1-32.
EMA (2011). Guideline on determining the fate of veterinary medicinal products in manure (EMA/CVMP/ERA/ 430327/2009
(revised in 2011)).
FOCUS (2000). FOCUS groundwater scenarios in the EU review of active substances. Report of the FOCUS Groundwater
Scenarios Workgroup, EC Document Reference SANCO/321/2000 rev.2, 202 pp.
FOCUS (2006): Guidance Document on estimating persistence and degradation kinetics from environmental fate studies on
pesticides in EU Registration. Report of the FOCUS Work Group on degradation kinetics. EC Document Reference SAN-
CO/10058/2005 version 2.0. 434 pp.
Gervais, J. A.; Luukinen, B.; Buhl, K.; Stone, D. 2010. Imidacloprid Technical Fact Sheet; National Pesticide Information
Center, Oregon State University Extension Services. http://npic.orst.edu/factsheets/imidacloprid.pdf.
Griebler, C., Slezak, D. (2001): Microbial activity in aquatic environments measured by dimethyl sulfoxide reduction and
intercomparison with commonly used methods. Appl Environ Microb 67:100-109.
Hennecke, D., Atorf, C., Bickert, C., Herrchen, M., Hommen, U., Klein, M., Weinfurtner, K., Heusner, E., Knacker, T., Junker,
T., Römbke, J., Merrettig-Bruns, U. (2015): Development of a test protocol to study the transformation of veterinary pharma-
ceuticals and biocides in liquid manure. Texte | 78/2015. Umweltbundesamt, Dessau-Roßlau, Germany, 148 pages.
https://www.umweltbundesamt.de/sites/default/files/medien/378/publikationen/texte_78_2015_development_of_a_te
st_protocol_to_study_the_transformation.pdf
Herrchen, M., Hennecke, D. (2016). Harmonization of experimental exposure assessment for veterinary pharmaceuticals
and biocides: influence of different experimental setups on observed mineralization. Available at:
www.umweltbundesamt.de
Howard, P.H. (1993). Progress report: determining “real world” biodegradation rates. Environ Toxicol Chem 12:1135-1137.
ISO (1984). ISO 5664: Water quality - Determination of ammonium - Distillation and titration method. International Organi-
zation for Standardization, Geneva, 1984.

Transformation of veterinary pharmaceuticals and biocides in (liquid) manure
116
ISO (1995). ISO 11261: Soil quality - Determination of total nitrogen - Modified Kjeldahl method. International Organization
for Standardization, Geneva, 1995.
ISO (1999). ISO 14240 – 2: Soil Quality – Determination of soil microbial biomass – Part 2: fumigation-extraction method.
International Organization for Standardization, Geneva, 1999.
ISO (2002). ISO 11271: Soil quality - Determination of redox potential - Field method. International Organization for Stand-
ardization, Geneva, 2002.
ISO (2005). ISO 10390: Soil Quality - Determination of pH. International Organization for Standardization, Geneva, 2005.
Mikolasch, B., Schäfer, D. (2006): Kinetic Introduction to the Use of KinGUI. Version 1.1 01.09.2006. Bayer CropScience AG.
OECD (2002a): Guideline 307 for testing of chemicals. Aerobic and anaerobic transformation in soil. OECD, Paris, 24 April
2009.
OECD (2002b): Guideline 308 for testing of chemicals. Aerobic and anaerobic transformation in aquatic sediment systems.
OECD, Paris, 24 April 2009.
Salvia, M.V., Vulliet, E., Wiest, L., Baudot, R., Cren-Olivé, C. (2012): Development of a multi-residue method using acetoni-
trile-based extraction followed by liquid chromatography-tandem mass spectrometry for the analysis of steroids and veter-
inary and human drugs at trace levels in soil. J Chromatogr A 1245:122-133.
VDI (2006): Fermentation of organic materials - Characterisation of the substrate, sampling, collection of material data,
fermentation tests. Verein Deutscher Ingenieure, Düsseldorf, Germany, April 2006.
VICH (2008): Guideline on Environmental Impact Assessment for Veterinary Medicinal Products.
EMEA/CVMP/ERA/418282/2005-Rev.1. International Cooperation on Harmonisation of Technical Requirements for Regis-
tration of Veterinary Medicinal Products, European Medicines Agency, London, 23 June 2008.
Weinfurtner K. (2011): Matrix parameters and storage conditions of manure. UBA-Texte 02/2011, ISSN 1862-4804. Um-
weltbundesamt, Dessau-Roßlau, Germany, 54 pages, http://www.uba.de/uba-info-medien-e/4054.html

Transformation of veterinary pharmaceuticals and biocides in (liquid) manure
1
Annex 1
Draft Guideline

Transformation of veterinary pharmaceuticals and biocides in (liquid) manure
2
DRAFT FOR A GUIDELINE FOR THE TESTING OF CHEMICALS Anaerobic Transformation in Liquid Manure
INTRODUCTION 1. This guideline describes methods to examine the transformation of chemicals in pig and cattle manure under anaerobic conditions. The test guideline is based on existing guidelines [1,2]. The experiments are performed to determine the rate of transformation of the test substance, the identity and rates of formation and decline of transformation products, the amount of test sub-stance that is mineralized to CO2 or CH4 or other volatiles, and the amount of non extractable resi-dues (NER). Such studies are relevant for chemicals that are administered to animals housed in stables and later on excreted as e.g. veterinary medicinal products or for chemicals that are ap-plied in stables and may also enter the manure collected from these stables (e.g. biocides).
PRINCIPLE OF THE TEST
4. Liquid manure samples are treated with the test substance and incubated in the dark under controlled laboratory conditions (at constant temperature and dry matter content under anaerobic conditions). After appropriate time intervals, manure samples are removed, extracted and analyzed for the parent substance and for transformation products. Volatile products are collected for analy-sis using appropriate trapping devices to quantify formation of CO2 and CH4. Using 14C-labelled material, mineralization rates of the test substance can be measured and a mass balance, includ-ing the formation of NER, can be established. Results enable the calculation of DT50, and, if appro-priate, DT90.
5. Transformation studies should be performed in manure of a relevant species. Liquid ma-nure that is the predominant type of manure in Europe and North America [3] is a mixture of urine, faces and water used to clean the stables and may also contain bedding material. Typical dry mat-ter contents for pig and cattle manure have been found to be 5% and 10%, respectively [3].
APPLICABILITY OF THE TEST 6. The method is applicable to all chemical substances for which an analytical method with sufficient accuracy and sensitivity is available. It is applicable to slightly volatile, non-volatile, water-soluble or poorly water-soluble compounds. The test should not be applied to chemicals which are volatile from water (e.g. fumigants, organic solvents).
INFORMATION ON THE TEST SUBSTANCE
7. Non-labeled or labeled test substance can be used to measure the rate of dissipation of the parent compound. 14C-radio-labelled material is required for studying the pathway of transfor-mation, for quantifying CO2- and CH4-formation, formation of NER, screening for and quantification of transformation products and for establishing a mass balance. The label(s) should be positioned in the most stable part(s) of the molecule. For complex molecules (e.g. containing more than one aromatic ring system) or for extensively substituted molecules, labeling in different positions might be necessary. The active ingredient should be labeled so that the transformation pathway can be traced as far as possible and transformation products can be tracked. If multiple ring structures or significant side chains are present, separate studies reflecting labeling of each ring or side chain will normally be required if it is anticipated that cleavage between these moieties may occur. A sci-entifically based rationale may be submitted in lieu of conducting studies with multiple radiolabels if no cleavage is anticipated. However, if cleavage of the molecule is evident, it may be necessary to

Transformation of veterinary pharmaceuticals and biocides in (liquid) manure
3
conduct an additional study with a radiolabel that tracks the portion of the molecule that is cleaved. In choosing the position to be labeled, assurance is needed that a stable position is selected. The choice of the labeling position(s) should be justified and illustrated in a structural formula of the test substance.
The use of stable isotopes such as 13C, 15N, or 2D (nonexchangeable) together with the radio-labelled isotope is encouraged to aid in identification of metabolites by various spectroscopic methods (mass spectrometry (MS) or nuclear magnetic resonance (NMR)).
8. The purity of the test substance should be at least 95%. Deviations should be justified.
9. Before carrying out the test on transformation in manure, the following information on the test substance should be available and should be taken into account:
(a) solubility in water (TG 105; [4]),
(b) solubility in organic solvents,
(c) vapour pressure (TG 104; [5]) and Henry’s law constant,
(d) n-octanol/water partition coefficient (TG 107; [6]),
(e) chemical stability in water (hydrolysis) (TG 111; [7]),
(f) pKa if a molecule is liable to protonation or deprotonation (TG 112; [8]).
Other useful information may include data on toxicity of the test substance or transformation prod-ucts to microorganisms, e.g. according to TG 209 [9] or TG 216 [10].
10. Analytical methods (including extraction and clean-up methods) for quantification and iden-tification of the test substance and its transformation products should be available. If available, standard substances should be used for the characterization and/or identification of transformation products by spectroscopic and chromatographic methods.
If standard substances are unavailable identification based on spectrometric techniques (mass spectrometry, nuclear magnetic resonance spectrometry) may be attempted.
REFERENCE SUBSTANCE
11. A reference substance should be included to be able to ensure comparable conditions for different tests with different manures. Salicylic acid (e.g. as sodium salicylate CAS: 54-21-7 or as salicylic acid CAS: 69-72-7) has been tested for transformation under anaerobic conditions in pig and cattle manure and found to be mineralized to a high extent to CO2 and CH4 (> 50% to 80% within 85 to 91 d). DT50 values (SFO, dissipation of parent) observed in tests with 6 different pig and 3 different cattle manures ranged from 3 d to 30 d [11]. DT50 MIN values (SFO, mineralization to CO2 and CH4 ) observed in tests with two pig and two cattle manures ranged from 15 d to 49 d [12]. It is suggested to use the reference substance at a concentration of 24 mg/kg wet manure (corresponding to 0.02 mg 14C salicylic acid (75 kBq) plus 1.18 mg unlabeled salicylic acid applied to 50 g manure fresh weight. For the reference compound, the same results as for the test sub-stance have to be reported. A description of an extraction scheme for salicylic acid can be found in Annex 1.
Transformation of veterinary pharmaceuticals and biocides in (liquid) manure
4
DEFINITIONS 12. See Annex 2.
Mass balance, recovery, repeatability and sensitivity of analytical method
13. Extraction and analysis of, at least, duplicate manure samples immediately after the addi-tion of the test substance and at the end of incubation gives an indication of the recovery of the analytical method and of the uniformity of the application procedure for the test substance. Recov-eries concerning radiolabeled material are given by the respective mass balances. At the begin-ning of the test, mass balance should range from 85% to 115% for labeled chemicals and 70% to 110% for non-labeled chemicals. In addition, the mean mass balance for all time points for labeled chemicals should be within 85% and 115%. Results given as % of applied radioactivity have to be normalized to 100% at time point 0. Repeatability of the analytical method (excluding the initial extraction efficiency) to quantify test substance and transformation products can be checked by duplicate extraction and analysis of the same extract of the manure, incubated long enough for formation of transformation products.
14. The limit of detection (LOD) of the analytical method for the test substance and for the transformation products should be at least 1% of the applied dose or at least 0.01 mg/kg, whichev-er is lower. The limit of quantification (LOQ) should also be specified.
Kinetic evaluation of the test data
15. The quality of the fit of an appropriate kinetic model to the test data should be evaluated according to the recommendations of the FOCUS group [13]. More sampling time points might be required if transformation products are observed to be able to derive DT50 and DT90.
DESCRIPTION OF THE METHOD Equipment and chemical reagents 16. The incubation is conducted in a suitable system. An example of a semi-static and a flow-through incubation apparatus are shown in Annex 3 and Annex 4, respectively. Other incubation systems are described in references [1] and [2].
17. To ensure anaerobic conditions, humidified nitrogen is passed over the samples in the be-ginning and intermittently (for the semi-static system) or continuously (for the flow-through system). NaOH filled traps (or another appropriate trapping solution) are used to trap evolving CO2. Poten-tially formed methane (CH4) accumulates in the incubation flask (no excess pressure to be ex-pected, semi-static system) or passes through the CO2-traps (flow-through-system) and is subse-quently combusted in an oven (temperature details in the annexes) to form CO2, and finally trapped in a CO2-trap. To completely capture formed CO2, acidification of the sample is recom-mended. A detailed description is given in Annex 3 (semi-static system) and Annex 4 (flow-through system). To verify that the radioactivity trapped in the CO2-traps is 14CO2 and not from potentially also formed volatile fatty acids (VFA), Ba(OH)2 precipitation of the radioactivity can be conducted.

Transformation of veterinary pharmaceuticals and biocides in (liquid) manure
5
18. Standard laboratory equipment is required and especially the following: - Analytical instruments such as GC or HPLC, including the appropriate detection systems
for analyzing radiolabeled or non-labeled substances, - Instruments for identification purposes (e.g. RAM, MS, HRMS, NMR, etc.), - Liquid scintillation counter, - Oxidiser for combustion of radioactive material, - Centrifuge, - Extraction apparatus (for example, centrifuge tubes for cold extraction, Soxhlet apparatus
for continuous extraction under reflux, apparatus for accelerated solvent extraction, i.e. ex-traction under high pressure and temperature),
- Instrumentation for concentrating solutions and extracts (e.g. rotating evaporator), - Water bath, - Mechanical mixing device (e.g. kneading machine, rotating mixer, hand blender).
19. Chemical reagents used include, for example: - NaOH, analytical grade (2 M), or other appropriate base (e.g. KOH, ethanolamine) - Ba(OH)2, analytical grade (0.25 M) - H2SO4, analytical grade (0.05 M) - HCl (10%), analytical grade, - Organic solvents, analytical grade, such as acetone, methanol, etc., - Inorganic salts, analytical grade, such as KH2PO4 (for extraction solvents), - Scintillation liquid.
Manure
Manure selection
20. Manure for testing purposes should be sampled from manure storage or pre-storage tanks or manure lagoons. Storage facilities may be above ground or below ground. Manure should stem from animals that are reared under well controlled conditions. The manure should not have been exposed to the test substance or compounds from the same substance class within the last six months. This should be demonstrated by obtaining information on the medication of the animals producing the manure in the respective time period. The laboratory conducting the studies is re-sponsible for selecting an appropriate manure and providing a statement in the report, if farmers are not willing to consent that specific information is revealed in the study report. The number, type and age of animals should be known as well as their feed. Studies on transformation in manure should be conducted in manure of the relevant species (e.g. pigs, cattle). See also the paragraph 26 on manure characterization. At least one manure per species has to be used. If several ma-nures were sampled and turned out to be not suitable e.g. due to matrix parameters not conform-ing to the specifications, then the results should nevertheless be reported.

Transformation of veterinary pharmaceuticals and biocides in (liquid) manure
6
Collection, handling and storage of manure
Sampling of pigs and cattle liquid manure
21. Prior to collection the liquid manure should be homogenized by mixing in the respective manure tank. Pig manure should be stirred immediately before sampling as separation into liquid and solid phase easily occurs. Cattle manure should be stirred no more than one day before sam-pling. For mixing devices installed in the tank or external devices may be used. Mixing for one hour proved sufficient for homogenization of manure in the tanks independent from tank volume.
22. Liquid manure is collected from the tank by appropriate equipment (e.g. a ladle with a large beaker), and filled into containers. Filling up to approximately ¾ of maximum container volume might be appropriate. Containers are closed tightly but must allow gas, which is generated by con-tinuous microbial activity, to expand. This can be achieved by connecting a tube with a fermenta-tion air lock to an outlet in the container. This also prevents odors from escaping from the contain-ers.
23. The sampling site, the sampling procedure (time and duration of mixing), and the type and size of manure tank (above/below ground, covered/open) should be recorded in detail. A template can be found in Annex 5.
Storage of liquid manure
25. Prior to further processing manure might by stored at 4°C to 20°C (preferably at the test temperature) for up to two months. Storage should ensure anaerobic conditions. Care has to be taken to allow gas, generated by biological activity during storage, to expand to avoid explosion of the container. This can be achieved by connecting a tube with a fermentation air lock to an outlet of the container. This also prevents odors from escaping from the containers.
Manure characterization
26. Key parameters that have to be measured and reported (with reference to the method used) and the stage of the test at which those parameters have to be determined are summarized in the table hereafter.

Transformation of veterinary pharmaceuticals and biocides in (liquid) manure
7
Measurement of parameters for characterization of liquid manure
Parameter11 Stage of test procedure
Sampling Start of ac-climation
Start of test
During test End of test
pH12 X X X X X organic matter content [%]13 X nitrogen content [Ntotal; mg/kg]14 X nitrogen content [NH4-N; mg/kg]15 X redox potential [mV]16 X X X X17 X dry matter content [%]18 X X X X ash content [%]19 temperature [°C] X X X X X
Data after sampling (start of acclimation, start of test, during test and at the end of the test) have to be reported based on the adjusted dry matter content and wet mass of the manure.
If non-labeled test substance is used, a background control or blank sample has to be analyzed, to exclude the presence of the test substance or to quantify a possible background concentration of the test substance in the manure.
Establishing of test conditions
Acclimation
27. Prior to the start of the acclimation period, the dry matter content of the manure has to be determined. To get comparable conditions it has to be adjusted to standardized values. The rec-ommended dry matter content in cattle and pig manure is 10 ± 1% (m/m) and 5 ± 1% (m/m), re-spectively [1,3]. If the dry matter content is below the recommended value, it can be concentrated by careful centrifugation (e.g. for 10 minutes at 740 x g). However, the initial dry matter content has to be ≥ 8% (cattle) or ≥ 3% (pig). If these minimum values are not met, fresh manure has to be collected. If the dry matter content is too high, water (de-ionized water, bubbled with nitrogen for 30 minutes) should be added as needed.
28. Thereafter, cattle manure should be homogenized by mixing. No additional measures to prevent introduction of oxygen are used. Subsamples of 50 – 100 g (wet weight) each should be directly filled into the incubation vessels which are used for the acclimation and transformation study.
11 For all matrix parameters it has to be specified in the report whether they relate to dry or to wet mass of the sample. 12 e.g. ISO 10390 „Soil quality -- Determination of pH“ [14] 13 e.g. DIN 12879 „Charakterisierung von Schlämmen - Bestimmung des Glühverlustes der Trockenmasse” [15] 14 e.g. ISO 11261 “Soil quality - Determination of total nitrogen - Modified Kjeldahl method” [16]. For conversion of mass
based units in volume based units a density of 0.001 kg/m3 is used 15 e.g. ISO 5664 “Water quality - Determination of ammonium - Distillation and titration method” [17]. 16 e.g. ISO 11271 “Soil quality - Determination of redox potential - Field method” [18] and/or DIN 38404-6 “Determination
of the oxidation reduction (redox) potential” [19] 17 It has to be assured that the given specifications for the redox potential are met throughout the study. Therefore, at
least one measurement in the middle of the test period is recommended. 18 e.g. DIN 12880 “Characterization of sludges - Determination of dry residue and water content” [20] 19 According to European Standard EN 15935 [21]

Transformation of veterinary pharmaceuticals and biocides in (liquid) manure
8
29. Pig manure should be homogenized under anaerobic conditions in order to obtain a fairly stable phase. This can be achieved, e.g. by filling the manure into a beaker, putting a mix-er/homogenizer (e.g. hand blender) into the manure, and gently passing a nitrogen stream over the manure while mixing. Thereafter, the dry matter content should be adjusted. After a repeated ho-mogenization under anaerobic conditions by thoroughly mixing (set up as above) subsamples of 50 g (fresh weight) are filled into the incubation vessels.
30. If a semi-static apparatus (see Annex 3) is used, the incubation system is flushed with ni-trogen for 1 hour to maintain anaerobic conditions. Thereafter, the incubation system is closed by valves. If a flow-through apparatus (see Annex 4) is used, the incubation apparatus has to be closed and a constant, water saturated stream of nitrogen is passed over the manure at a rate in the range of approximately 50 - 200 mL/min.
31. The acclimation should be carried out for 21 (± 1 d) days at test temperature.
PERFORMANCE OF THE TEST
Test conditions
Test temperature and light conditions
32. During the whole test period the manure samples should be incubated in the dark at the appropriate test temperature. Typical environmental temperatures observed in manure tanks are 10°C for Central European climate conditions [3]. In other regions, different temperatures might be considered typical. To facilitate laboratory studies, studies may be conducted at 20°C (range of ± 2°C) and resulting DTx values converted to environmentally relevant temperatures [22]. To deter-mine the pathway of transformation, environmentally relevant temperatures might have to be used.
Anaerobic incubation conditions
33. Transformation studies in cattle and pig manure should be performed under anaerobic con-ditions similar to the conditions observed in a manure tank. Anaerobic conditions should be demonstrated by Eh ≤ -100 mV [2]. Redox potentials measured in pig and cattle manure have been found to range from -230 mV to -400 mV [3]. Redox potential should be measured and re-ported regularly to ensure stable anaerobic conditions throughout the experiment.
Abiotic controls
34. For information on the abiotic transformation of the test substance it is recommended to include sterile controls. For substances undergoing rapid abiotic transformation otherwise no meaningful results might be deduced from the study. Manure is sterilized, treated with sterile test substance and flasks kept closed carefully. Sampling of sterile controls should be according to the sampling schedule but sampling can be restricted to fewer time points. Sterile controls should be sampled at the end of the test. Sterilization can be achieved by autoclaving at least twice following this protocol: Preheat the manure in the test vessels overnight (at least 12 h) to 100°C. Let the vessels cool to room temperature during the day. Start first autoclaving cycle (15 min, 121°C, 100 bar) and let the test vessels again cool down to room temperature overnight to enable germination of bacterial spores. Then start the second autoclaving cycle (15 min, 121°C, 100 bar). This proce-dure helps to inactivate bacterial spores and prevents foaming. Other methods to stop the biologi-cal activity can be used, if appropriate (e.g. adding a toxicant or gamma irradiation).
Treatment and application of test substance

Transformation of veterinary pharmaceuticals and biocides in (liquid) manure
9
35. The test substance should be dosed into the manure at a concentration that reflects the maximum expected manure concentration, which depends on substance specific exposure scenar-ios. Concentrations in the mg/kg range are commonly observed for e.g. veterinary pharmaceuticals in manure [23]. The rationale for using a certain test substance concentration should be reported. If this concentration is not sufficient for detection and identification of transformation products, the test may be conducted at increased substance start concentrations. However, excessively high concentrations potentially toxic to microorganisms should be avoided.
36. The test substance should be dissolved in an appropriate solvent and should be added into the acclimated manure in the respective incubation vessels followed by thoroughly mixing while maintaining anaerobic conditions. This can be achieved, e.g., as follows: during application pass-ing the nitrogen stream over the samples has to be maintained. The required volume of stock solu-tion should be pipetted into the manure under simultaneous stirring using the pipette tip. As soon as the solution is evenly distributed in the manure the pipette tip remains in the manure. The total volume of a water miscible organic solvent used for application should not exceed 1% by volume.
Test duration and sampling
37. Test duration will depend on the rate of transformation of the parent compound and trans-formation products. The maximum study duration is 90 days. This time was derived from a survey on typical manure storage times [24] and during method development. Furthermore, validation studies were run up to 90 days. In certain cases it might be reasonable to prolong the study. Ideal-ly, the test substance and transformation products should each be present in amounts below 10% of the applied amount at the end of the study. If the study is further prolonged, e.g. because in-creasing amounts of transformation products have been observed a test for microbial activity may be conducted at the beginning and end of the prolongation period. It might therefore be useful to have a further spare incubation vessel for this purpose.
38. At least duplicate incubation flasks are sacrificed per sampling. Sampling intervals should be selected in a way that the pattern of decline of the test substance, and the pattern both of for-mation and decline of transformation products can be established (e.g. 0, 1, 3, 7 days; 2, 3 weeks; 1, 2, 3 months, etc.). Besides sampling directly after application at least 9 additional sampling points should be included. More sampling time points may be necessary for kinetic modeling ac-cording to FOCUS recommendations [13] and to include transformation products. An experiment prior to the test start might give valuable indications for the behavior of the test substance and transformation products. In some cases rapid dissipation of the test substance may be observed and sampling time points have to be adjusted accordingly.
Transformation of veterinary pharmaceuticals and biocides in (liquid) manure
10
39. CO2 and CH4 are major volatile final transformation products which are expected from transformation under anaerobic conditions. Beside these compounds, volatile fatty acids (VFA) also might be formed. The experimental set-up has to be such, that the following requirements are fulfilled:
• quantitative capturing to avoid any losses of volatiles and enable establishment of a mass bal-
ance, • differentiation between formed CO2, CH4 and VFAs.
For this purpose, traps to measure mineralization are removed at the same time intervals and ana-lyzed for trapped 14CO2 and other evolved gases, respectively. At first, adsorption traps are re-moved, replaced by freshly filled traps, and analyzed for radioactivity content. Thereafter, the ma-nure incubation flasks to be removed at that particular sampling point are treated by addition of 10 mL 10% HCl in order to strip potentially dissolved CO2 (or HCO3
- / CO32-). After addition of 10 mL
10% HCl, the incubation flasks are closed again and nitrogen is passed through for at least 24 hours. Thereafter, manure incubation flasks are removed and the samples are subjected to clean-up, extraction procedures and analyses. CO2-traps are removed and radio-counted for additionally trapped 14CO2.
For detailed descriptions of the sampling procedure see Annex 3 (semi-static system) and Annex 4 (flow-through system).
Measurements and analysis
40. Manure samples are cleaned-up directly after sampling. The samples are extracted with appropriate solvents of different polarity. A sequential extraction approach should be followed for optimal recovery of parent substance and transformation products of different polarity. Aqueous solvent mixtures and acid and base systems should be used as solvents to ensure extraction of more polar transformation products. In case non-extractable residues are observed, exhaustive extraction methods should be applied additionally. These methods comprise e.g. pressurized liquid extraction (e.g. ASE®), reflux, soxhlet etc. with appropriate solvents. When using 14C-labeled test substance, the residues remaining after the last extraction step (non-extractable residues, NER) will be quantified by combustion and a mass balance will be calculated for each sampling interval. Analytes should not be altered by the respective extraction method. This can be demonstrated by appropriate controls for the known substances.
41. Concentration of the test substance and the transformation products at every sampling time should be determined and reported (see also paragraph 42). In general, transformation products detected at ≥ 10% of the applied radioactivity at any sampling time should be identified. Transfor-mation products once detected at ≥ 5% of the applied radioactivity for which concentrations are continuously increasing during the study should also be identified, even if their concentrations do not exceed the limit given above, as this may indicate persistence.
42. Typically, identification is accomplished either by co-chromatography of the transformation product with known standards using two dissimilar systems or by techniques capable of positive structural identification such as MS, NMR, etc. In the case of co-chromatography, chromatographic techniques utilizing the same stationary phase with two different solvent systems are not adequate for the verification of the transformation product identity, since the methods are not independent.
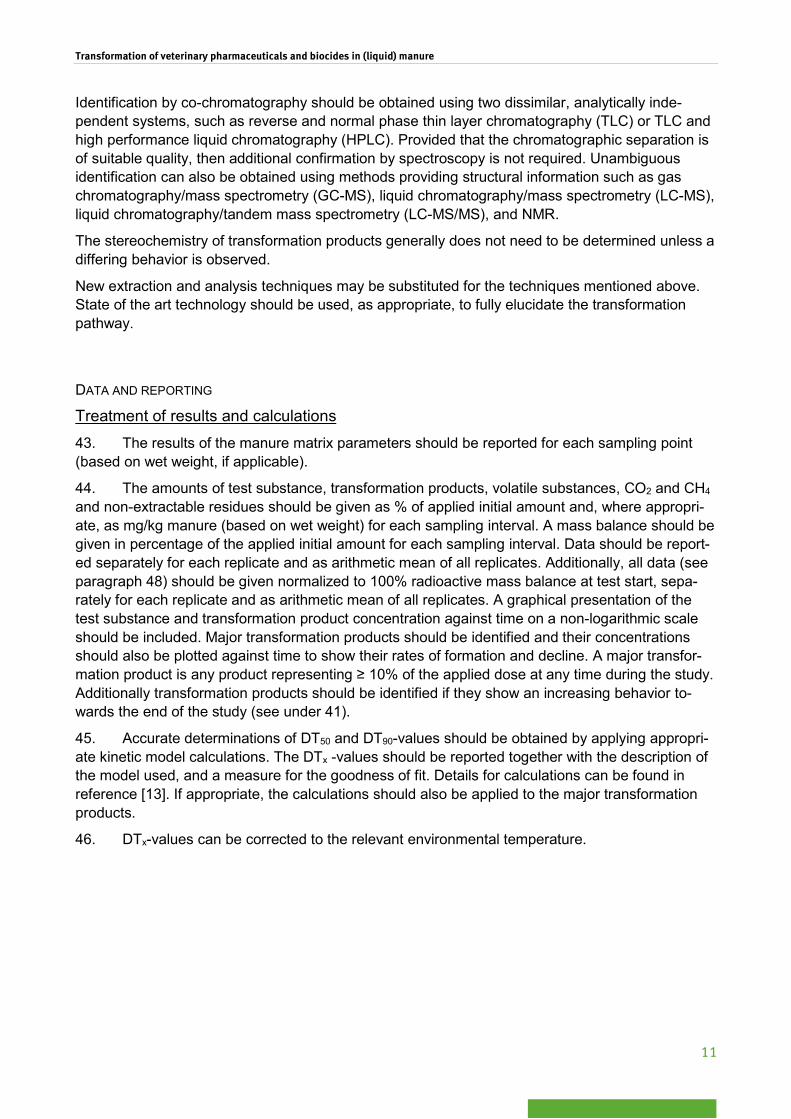
Transformation of veterinary pharmaceuticals and biocides in (liquid) manure
11
Identification by co-chromatography should be obtained using two dissimilar, analytically inde-pendent systems, such as reverse and normal phase thin layer chromatography (TLC) or TLC and high performance liquid chromatography (HPLC). Provided that the chromatographic separation is of suitable quality, then additional confirmation by spectroscopy is not required. Unambiguous identification can also be obtained using methods providing structural information such as gas chromatography/mass spectrometry (GC-MS), liquid chromatography/mass spectrometry (LC-MS), liquid chromatography/tandem mass spectrometry (LC-MS/MS), and NMR.
The stereochemistry of transformation products generally does not need to be determined unless a differing behavior is observed.
New extraction and analysis techniques may be substituted for the techniques mentioned above. State of the art technology should be used, as appropriate, to fully elucidate the transformation pathway.
DATA AND REPORTING
Treatment of results and calculations
43. The results of the manure matrix parameters should be reported for each sampling point (based on wet weight, if applicable).
44. The amounts of test substance, transformation products, volatile substances, CO2 and CH4
and non-extractable residues should be given as % of applied initial amount and, where appropri-ate, as mg/kg manure (based on wet weight) for each sampling interval. A mass balance should be given in percentage of the applied initial amount for each sampling interval. Data should be report-ed separately for each replicate and as arithmetic mean of all replicates. Additionally, all data (see paragraph 48) should be given normalized to 100% radioactive mass balance at test start, sepa-rately for each replicate and as arithmetic mean of all replicates. A graphical presentation of the test substance and transformation product concentration against time on a non-logarithmic scale should be included. Major transformation products should be identified and their concentrations should also be plotted against time to show their rates of formation and decline. A major transfor-mation product is any product representing ≥ 10% of the applied dose at any time during the study. Additionally transformation products should be identified if they show an increasing behavior to-wards the end of the study (see under 41).
45. Accurate determinations of DT50 and DT90-values should be obtained by applying appropri-ate kinetic model calculations. The DTx -values should be reported together with the description of the model used, and a measure for the goodness of fit. Details for calculations can be found in reference [13]. If appropriate, the calculations should also be applied to the major transformation products.
46. DTx-values can be corrected to the relevant environmental temperature.
Transformation of veterinary pharmaceuticals and biocides in (liquid) manure
12
Validity of the test 47. The test has to be conducted under anaerobic/ methanogenic conditions typically found in manure tanks. As an indicator parameter the redox potential (reported as Eh) should be in a typical range for manure (-230 to -400 mV (or lower)) and never above -100 mV.
For radio-labeled compounds the mass balance in the beginning of the study should be within 85% to 115%. During the study, the arithmetic mean of the mass balances for all sampling time points should fall within that range. For unlabeled test substances the analytical recovery of the test com-pound should be at least 70% to 110%.
Test report
48. The report must include:
Test substance (and reference substance salicylic acid): - common name, chemical name, CAS number, structural formula (indicating position of la-
bel(s) when radiolabeled material is used) and relevant physical-chemical properties, - purity (impurities) of test substance, - radiochemical purity of labeled chemical and specific activity (where appropriate);
Standard substance(s) for identification of transformation products: - chemical name and structure of reference substances used for the characterization and/or
identification of transformation products;
Analytical determinations
- methods for determination of manure matrix parameters
- methods for quantification and identification of the test substance, transformation products and reference substance
- recovery, repeatability, LOD and LOQ (expressed as % of applied amount and in mg/kg) of the analytical methods used,
- mass balance - detailed description of sequential extraction procedure
Test manure: - details of sampling site (date, location, type and number of animals, feed, type and size of
manure tank, information of use of chemicals, e.g. biocides or veterinary medicinal prod-ucts, in the last six months),
- date and procedure of manure sampling, - matrix parameters of manure (pH, organic matter content, nitrogen content, redox potential,
dry matter content, temperature), - duration of manure storage and storage conditions (if stored in the lab);
Test conditions: - dates of the performance of the studies, - amount of test substance applied, - calculation of maximum expected manure concentration (incl. rationale) - solvents used (if appropriate) and method of application for the test substance, - weight of manure treated (fresh weight), - description of the incubation system used, - nitrogen flow rates (for flow-through systems and semi-static systems only); - temperature,

Transformation of veterinary pharmaceuticals and biocides in (liquid) manure
13
- matrix parameters of manure (pH, , organic matter content, nitrogen content, redox poten-tial, dry matter content, temperature, as specified, method(s) of extraction, chemical analyt-ical method;
- number of replicates and number of controls including sterile controls;
Results: - result of manure matrix characterization for each time point, - tables of results expressed as % of applied initial dose and, where appropriate, as mg/kg
manure (on a wet weight basis) given for each replicate and as mean of all replicates for the following parameters and results expressed as % of applied initial dose, normalized to 100% radioactive mass balance at time point 0 for the following parameters,
- characterization of non-extractable radioactivity, - quantification of released CO2 and CH4, and other volatile compounds, - mass balance for each sampling point, - substance specific quantification of test substance and transformation products - plots (non-logarithmic) of concentrations versus time for the test substance and, where ap-
propriate, for major transformation products, - DT50, and DT90 for the test substance and, where appropriate, for major transformation
products including kinetic model used an procedure used for fitting, - abiotic transformation under sterile conditions, - substance storage stability, when samples are frozen prior to chemical analysis (for excep-
tional cases only); - an assessment of transformation kinetics for the test substance and, where appropriate, for
transformation products, - a proposed pathway for transformation including structural formula and consistent names
throughout the report for transformation products - discussion and interpretation of results, - raw data (e.g.. sample chromatograms, calculations of transformation rates and methods
used to identify transformation products).
- The same results have to be supplied for the reference compound salicylic acid, except for the information on transformation products and transformation pathway.

Transformation of veterinary pharmaceuticals and biocides in (liquid) manure
14
REFERENCES
[1] OECD (2002a). Guideline 307 for the testing of chemicals. Aerobic and anaerobic transfor-mation in soil.
[2] OECD (2002b). Guideline 308 for the testing of chemicals. Aerobic and anaerobic transfor-mation in aquatic sediment systems.
[3] Weinfurtner K. (2010). Matrix parameters and storage conditions of manure. UBA-Texte 02/2011, ISSN 1862-4804. Umweltbundesamt, Dessau-Roßlau, 1- 54, http://www.uba.de/uba-info-medien-e/4054.html
[4] OECD (1995a). Guideline 105 for the testing of chemicals. Water solubilty. OECD, Paris.
[5] OECD (2006). Guideline 104 for the testing of chemicals. Vapour Pressure. OECD, Paris.
[6] OECD (1995b) Guideline 107 for the testing of chemicals. Partition Coefficient (n-octanol/water): Shake Flask Method. OECD, Paris.
[7] OECD (2004). Guideline 111 for the testing of chemicals. Hydrolysis as a Function of pH. OECD, Paris.
[8] OECD (1981). Guideline 112 for the testing of chemicals. Dissociation Constants in Water. OECD, Paris.
[9] OECD (2010). Guideline 209 for the testing of chemicals. Activated Sludge, Respiration Inhibition Test (Carbon and Ammonium Oxidation). OECD, Paris.
[10] OECD (2000). Guideline 216 for the testing of chemicals. Soil Microorganisms: Nitrogen Transformation Test. OECD, Paris.
[11] Hennecke, D., Atorf, C., Bickert, C., Herrchen, M., Hommen, U., Klein, M., Weinfurtner, K., Heusner, E., Knacker, T., Junker, T., Römbke, J., Merrettig-Bruns, U. (2015): Development of a test protocol to study the transformation of veterinary pharmaceuticals and biocides in liquid manure. Available at: www.umweltbundesamt.de
[12] Herrchen et al. (2016): Harmonization of environmental exposure assessment for veterinary pharmaceuticals and biocides: influence of different experimental setups on observed min-eralization.
[13] FOCUS (2006). Guidance Document on Estimating Persistence and Degradation Kinetics from Environmental Fate Studies on Pesticides in EU Registration. Report of the FOCUS Work Group on Degradation Kinetics, EC Document Reference Sanco/10058/2005 version 2.0, 434 pp.
[14] ISO (2005). ISO 10390: Soil Quality - Determination of pH. International Organization for Standardization, Geneva, 2005.
[15] DIN (2001). DIN EN 12879:2001-02: Characterization of sludges - Determination of the loss on ignition of dry mass. Deutsches Institut für Normung, Berlin.
[16] ISO (1995). ISO 11261: Soil quality - Determination of total nitrogen - Modified Kjeldahl method. International Organization for Standardization, Geneva, 1995.
[17] ISO (1984). ISO 5664: Water quality - Determination of ammonium - Distillation and titration method. International Organization for Standardization, Geneva, 1984.
[18] ISO (2002). ISO 11271: Soil quality - Determination of redox potential - Field method. Inter-national Organization for Standardization, Geneva, 2002.

Transformation of veterinary pharmaceuticals and biocides in (liquid) manure
15
[19] DIN (1984). DIN 38404-6:1984-05: German standard methods for the examination of water, waste water and sludge; physical and physico-chemical parameters (group C); determina-tion of the oxidation reduction (redox) potential (C 6). Deutsches Institut für Normung, Ber-lin, May 1984.
[20] DIN (2001). DIN EN 12880:2001-02: Characterization of sludges - Determination of dry residue and water content. Deutsches Institut für Normung, Berlin.
[21] CEN (2012). Sludge, treated biowaste, soil and waste – Determination of loss on ignition. European Standard EN 15935:2012. European Committee for Standardization, Brussels, August 2012.
[22] EFSA (2007). Opinion on a request from EFSA related to the default Q10 value used to describe the temperature effect on transformation rates of pesticides in soil. The EFSA Journal 622: 1-32.
[23] Wohde et al. (2016): Harmonization of environmental exposure assessment for veterinary pharmaceuticals and biocides: literature review of studies on occurrence and transformation of veterinary pharmaceuticals and biocides in manure.
[24] VICH (2009). Guideline on Environmental Impact Assessment for Veterinary Medicinal Products. EMEA/CVMP/ERA/418282/2005-Rev.1.

Transformation of veterinary pharmaceuticals and biocides in (liquid) manure
16
ANNEX 1: Sampling and analytical determination for the reference compound salicylic acid
50 g wet manure sample are extracted once by 80 mL methanol + 1% trifluoroacetic acid (TFA), and thereafter twice by 50 mL methanol + 1 % TFA. For extraction, the samples are shaken for 30 minutes on a horizontal shaker and centrifuged for 10 minutes at 739 x g. After centrifugation the supernatant extract is collected and the pellet is subjected to the next extraction step. Further ex-traction solvent is added to the pellet. The whole process is repeated twice. Extracts are combined, and further analyzed by radio TLC. After the last extraction step the pellet is air dried and aliquots are subjected to combustion and radioassaying to give the information on the amount of non-extractable residues (NER).
In addition to the described extraction a further extraction step using ASE® can be performed. The accelerated solvent extraction (ASE®), i.e. extraction under high pressure and temperature (100°C, 12000 kPa, heat up for 5 minutes, followed by a static time of 10 minutes) uses the same solvent mixture as for the first extraction steps (methanol + 1 % TFA). Extraction is performed twice but extracts are not combined.
As the extracts without further cleanup might influence HPLC resulting in broad peaks, radio-TLC is preferred over HPLC. The following TLC-system is suggested:
• stationary phase: silica gel KG60
• mobile phase: methanol / toluene / ethylacetate / acetic acid; 10/44/43 /3 (v/v/v/v)
The radioactive peaks obtained after the development of the TLC-plates are characterized by their Rf-values and allocation to the peaks of co-chromatographed Salicylic acid and possible transfor-mation products.
Typical Rf-values are:
Salicylic acid: Rf = 0.50 – 0.55 Salicyluric acid: Rf = 0.31 – 0.36 Gentisinic acid: Rf = 0.42 – 0.47
If, in addition, peaks are observed which cannot be allocated to any of the used reference sub-stances, they should be described by their Rf-values and named as transformation product T1, T2, etc.
To determine mineralization to CO2 and CH4 please refer to Annex 3.
A mass balance can be established by adding the amounts of radioactivity given in [% of applied radioactivity; % aR] in the aqueous/organic extracts, carbon dioxide (14CO2), methane (14CH4) and non-extractable residues (NER):
Mass balance [% aR] = extractables [% aR] + 14CO2 [% aR] + 14CH4 [% aR] + NER [% aR].

Transformation of veterinary pharmaceuticals and biocides in (liquid) manure
17
ANNEX 2: Definitions
Manure: mixture of urine, feces and water collected in a storage tank, high liquid content, may con-tain residual bedding material
Test substance: substance used to conduct the study
Transformation products: all substances resulting from biotic or abiotic transformation reactions of the test substance including CO2, CH4 and non-extractable residues.
Non-extractable residues (NER): represent compounds in manure, which persist in the matrix after extraction.
Mineralization is the complete transformation of an organic compound to CO2 and H2O and CH4 (under anaerobic conditions).
DT50 (Disappearance or Dissipation Time 50) is the time after which 50% of the initial amount of the compound has dissipated.
DT90 (Disappearance or Dissipation Time 90) is the time within which the concentration of the test substance is reduced by 90%.

Transformation of veterinary pharmaceuticals and biocides in (liquid) manure
18
ANNEX 3: Incubation in a semi-static system
Example of a semi-static apparatus
Incubation
[1] nitrogen inlet
[2] gas washing bottle containing deionised water
[3] incubation flask containing manure
[4] CO2-trap (e.g. containing 2 M NaOH)
[5] CO2-trap (e.g. containing 2 M NaOH)
Manure samples are filled into the incubation flask [3]. The flask is connected to a semi-static ap-paratus. For a period of 1 hour a gentle stream of moistened nitrogen is passed over the manure to exclude air from the system and to ensure anaerobic conditions. After flushing with moistened ni-trogen the system is closed by closing the two valves directly at the incubation flasks and the valve at the outlet of the second NaOH trap [5].
Note: The valve at the outlet of the incubation flask might be left open to increase the headspace of the semi-static system and to enable absorption of evolved CO2 in the first CO2-trap [4] during in-cubation. In that case, a safety trap (empty washing bottle) should be inserted in between the incu-bation flask [3] and CO2-trap [4] to prevent a backflow of absorbing solution into the incubation flask in case of pressure drop in the test system.
At the end of the incubation period the respective incubation flasks are connected to the flow-through setup outlined below to detect formed CO2, CH4 and VFAs.
As a result of gas formation of the manure the pressure in the closed test vessel increases during the incubation period. To avoid losses of volatiles resulting in an incomplete mass balance, the test vessels should be connected to the flow-through apparatus and purged with moistened nitrogen at regular intervals (e.g. once a week).

Transformation of veterinary pharmaceuticals and biocides in (liquid) manure
19
Detection of CO2, CH4 and VFAs
[1] nitrogen inlet
[2] gas washing bottle containing deionised water
[3] incubation flask containing manure
[4] CO2-trap (e.g. containing 2 M NaOH)
[5] CO2-trap (e.g. containing 2 M NaOH)
[6] tube as bypass for further air/oxygen inlet containing silica gel or soda lime pellets
[7] oven with quarz glass tube (filled with CuO as catalysator) at 800°C - 850°C
[8] CO2-trap (e.g. containing 2 M NaOH)
Differentiation between CO2, CH4 and VFAs
Humidified nitrogen is bubbled through the manure samples at a rate in the range of approximately 50 – 200 mL/min for at least 1 hour. Evolved 14CO2 is purged from the manure samples, transport-ed and captured in traps ([4] and [5]) containing a CO2-absorber (e.g. 2 M NaOH). Potentially formed 14CH4 passes the CO2-traps ([4] and [5]). After the addition of oxygen or ambient air [6] it is catalytically (= CuO) oxidized in an oven [7] at 800°C - 850°C to form 14CO2. The formed 14CO2 is trapped in the CO2-trap situated at the outlet of the oven [8].
Such a set-up enables the differentiation between evolved 14CO2 (captured in traps [4] and [5]) and 14CH4 (captured in trap [10]).
To verify that the radioactivity captured in the CO2-traps [4] and [5] is 14CO2 and not from potential-ly also formed volatile fatty acids (VFA), BaCl2 precipitation of the radioactivity can be conducted. The radioactivity in the trapping solutions [4] and [5] is counted. Thereafter, 20 mL 0.25 M BaCl2 is added to 10 mL aliquots of trapping solution [4] and [5] each. Precipitation of Ba14CO2 occurs. The supernatant is to be radio-counted again. The radioactive content in the supernatant after precipita-tion can be attributed to VFAs whereas the difference of radioactive content before precipitation minus radioactive content after precipitation can be attributed to evolved 14CO2.

Transformation of veterinary pharmaceuticals and biocides in (liquid) manure
20
Quantification of volatiles
Quantification of trapped volatiles is by radio-counting (liquid scintillation counting, LSC) of aliquots of the trapping solutions.
When using a semi-static setup it is especially important to acidify the samples to release trapped CO2 by addition of 10 mL 10% HCl, further incubation and trapping of further released CO2.
This can be achieved as follows: after humidified nitrogen was bubbled through the manure sam-ples for at least 1 hour, CO2-traps ([4] and [5]) are removed and analyzed for trapped 14CO2 and other evolved gases, respectively, as described above. The removed traps are replaced by freshly filled ones.
Thereafter, the manure incubation flasks to be removed at that particular sampling point are treat-ed by addition of 10 mL 10% HCl in order to strip potentially dissolved CO2 (or HCO3
- / CO32-). After
adding of 10 mL 10% HCl the incubation flasks are closed again and moistened nitrogen is bub-bled through the manure for at least 24 hours20. Samples are not stirred in order to avoid foaming. If foaming is nevertheless observed, the acid should be added slowly (e.g. dropwise) over the in-cubation period. Thereafter, manure incubation flasks are removed and manure is cleaned-up and extracted. CO2-traps are also removed and radio-counted for additionally trapped CO2.
Note:
Prior to the addition of 10% HCl to the manure it has to be checked whether the test substance and transformation products are stable under acidic conditions21. If this is not the case further replicates have to be incubated for that purpose.
20 The time needed for purging the 14CO2 completely in the CO2-traps, depends strongly on the amount of 14CO2 formed
and how fast this 14CO2 formation is. For test substances with high mineralization purging for at least 24 h is recom-mended but time periods up to several days might be necessary to trap the 14CO2 completely. If high mineralization is expected the optimal purging might be determined in preliminary investigations.
21 In case of unknown transformation products, the stability check is not possible. A pre-test can be conducted to identify expected transformation products.

Transformation of veterinary pharmaceuticals and biocides in (liquid) manure
21
ANNEX 4: Incubation in a flow-through system
Example of a flow-through apparatus
Incubation
[1] nitrogen is gently passed over the manure samples
[2] gas washing bottle containing water
[3] manure transformation flasks filled with at least 50 – 100 g manure (fresh weight)
[4] for anaerobic transformation two NaOH-traps in sequence are needed to trap evolving CO2.
[5] addition of oxygen or ambient air for subsequent catalytic combustion of CH4
[6] oven for combustion of CH4 to form CO2
[7] NaOH-trap for CO2 formed from CH4
Transformation of veterinary pharmaceuticals and biocides in (liquid) manure
22
Differentiation between CO2, CH4 and VFAs
Humidified nitrogen is passed over the manure sub-samples at a rate in the range of approximately 50 – 200 mL/min. By such a constant N2-stream evolved 14CO2 is purged from the manure sam-ples, transported and captured in traps 1 and 2 (safety trap) containing a CO2-absorber (e.g. 2 M NaOH). Potentially formed 14CH4 passes the CO2-traps. After the addition of oxygen it is catalytical-ly (= CuO) oxidized in an oven at 800°C - 850°C to form 14CO2. The formed 14CO2 is trapped in the CO2-trap situated at the outlet of the oven.
Such a set-up enables the differentiation between evolved 14CO2 (captured in traps 1 and 2) and 14CH4 (captured in trap 3).
To verify that the radioactivity captured in the CO2-traps 1 and 2 is 14CO2 and not from potentially also formed volatile fatty acids (VFA) BaCl2 precipitation of the radioactivity can be conducted. The radioactivity in the trapping solutions 1 and 2 is counted. Thereafter, 20 mL 0.25 M BaCl2 is added to 10 mL aliquots of trapping solution from traps 1 and 2 each. Precipitation of Ba14CO2 occurs. The supernatant is to be radio-counted again. The radioactive content in the supernatant after pre-cipitation can be attributed to VFAs whereas the difference of radioactive content before precipita-tion minus radioactive content after precipitation can be attributed to evolved 14CO2.
Quantification of volatiles
Quantification of trapped volatiles is by radio-counting (liquid scintillation counting, LSC) of aliquots of the trapping solutions.
Furthermore, it should be proven whether evolved 14CO2 is purged quantitatively when passing the humidified nitrogen over the manure samples. This can be verified by addition of HCl to the ma-nure sub-samples in order to strip CO2 (or HCO3
- / CO32-) being potentially dissolved in the manure
matrix. Purging by addition of HCl should be applied in case the amount of 14CO2 exceeds the level of 10% of the total radioactivity (TRR).
This can be achieved as follows: CO2-traps 1 and 2 are removed at the particular sampling point and analyzed for trapped 14CO2 and other evolved gases, respectively, as described above. The removed traps are replaced by freshly filled ones.
Thereafter, the manure incubation flasks to be removed at that particular sampling point are treat-ed by addition of 10 mL 10% HCl in order to strip potentially dissolved CO2 (or HCO3
- / CO32-). After
adding of 10 mL 10% HCl the incubation flasks are closed again and nitrogen is passed over for 3 hours. Samples are not stirred in order to avoid foaming. If foaming is nevertheless observed, the acid should be added slowly (e.g. dropwise) over the incubation period. Thereafter, manure incu-bation flasks are removed and manure is cleaned-up and extracted. CO2-traps are also removed and radio-counted for additionally trapped CO2. In order to avoid interferences and cross-contaminations by evolving gases sampling should start with samples being next to the outlet (e.g. samples 3 and 4 in figure, Annex 4).
Note:
Prior to the addition of 10% HCl to the manure sub-samples it has to be checked whether the test substance and transformation products is stable under acidic conditions22. If this is not the case further replicates have to be incubated.
22 In case of unknown transformation products the stability check is not possible. A pre-test can be conducted to identify
expected transformation products.
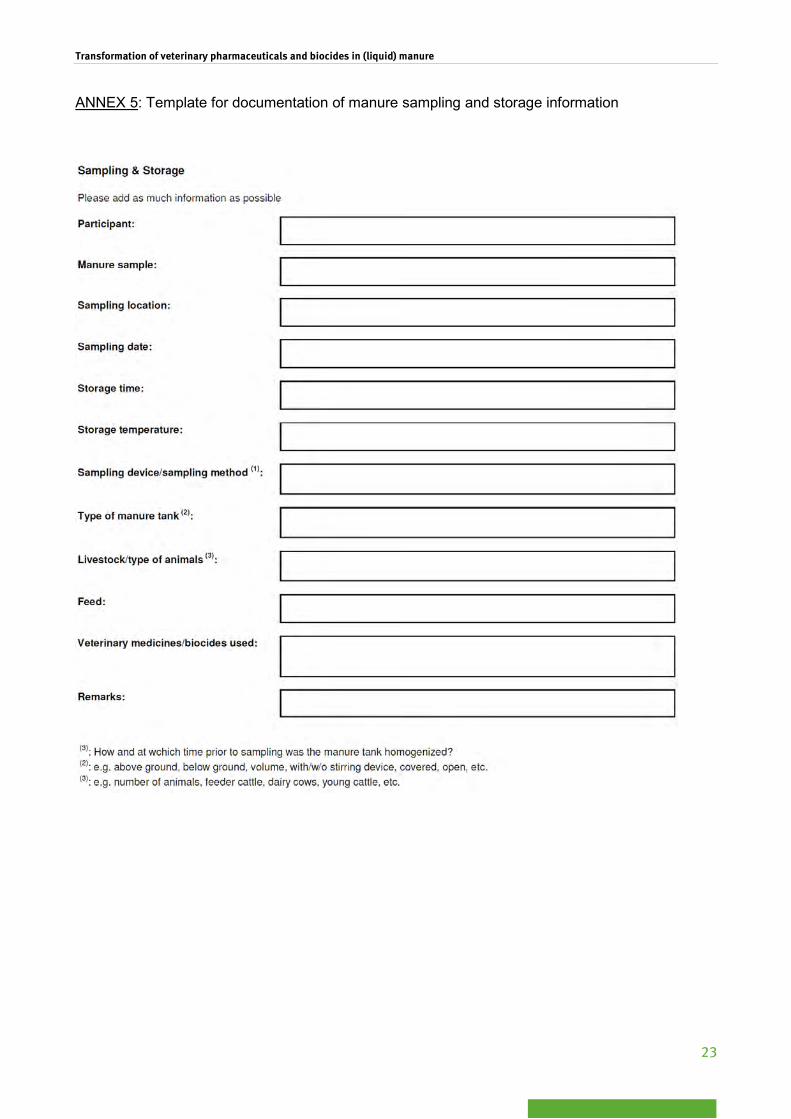
Transformation of veterinary pharmaceuticals and biocides in (liquid) manure
23
ANNEX 5: Template for documentation of manure sampling and storage information

Transformation of veterinary pharmaceuticals and biocides in (liquid) manure
24
Annex 2
Invitation Ring Test; Outline Ring Test; Registration Form

Transformation of veterinary pharmaceuticals and biocides in (liquid) manure
25

Transformation of veterinary pharmaceuticals and biocides in (liquid) manure
26

Transformation of veterinary pharmaceuticals and biocides in (liquid) manure
27

Transformation of veterinary pharmaceuticals and biocides in (liquid) manure
28
Annex 3
Evaluation Sheets
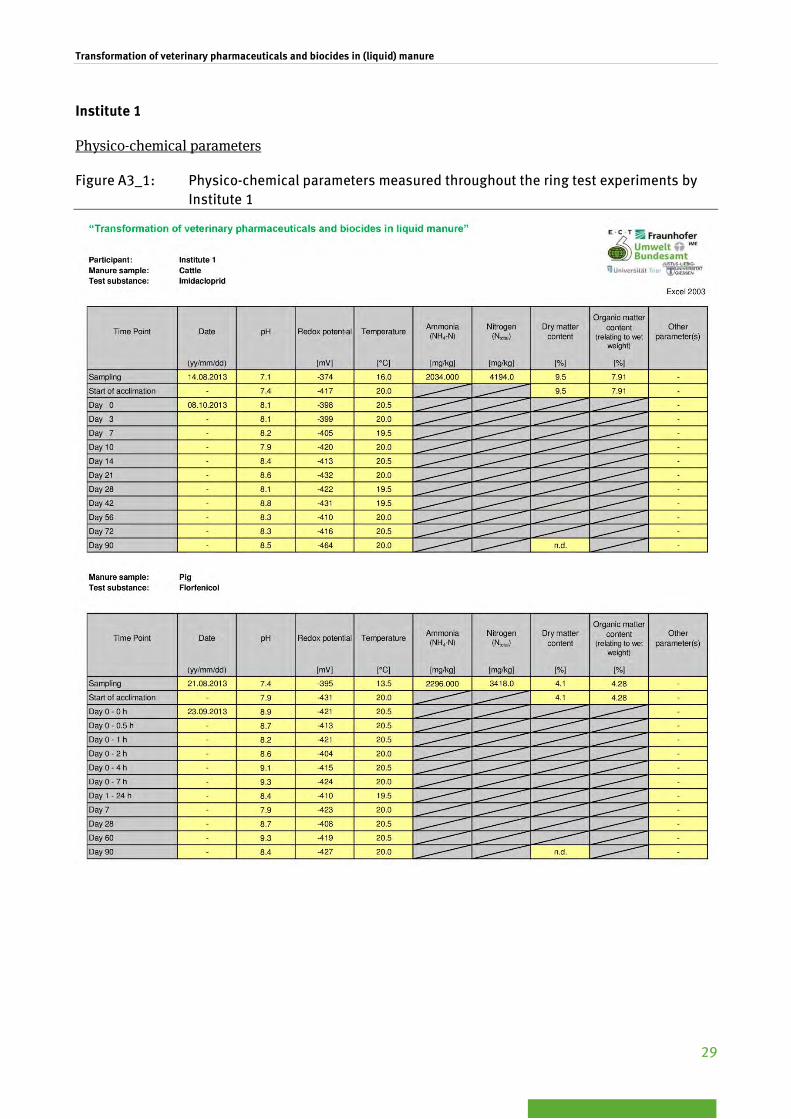
Transformation of veterinary pharmaceuticals and biocides in (liquid) manure
29
Institute 1
Physico-chemical parameters
Figure A3_1: Physico-chemical parameters measured throughout the ring test experiments by Institute 1
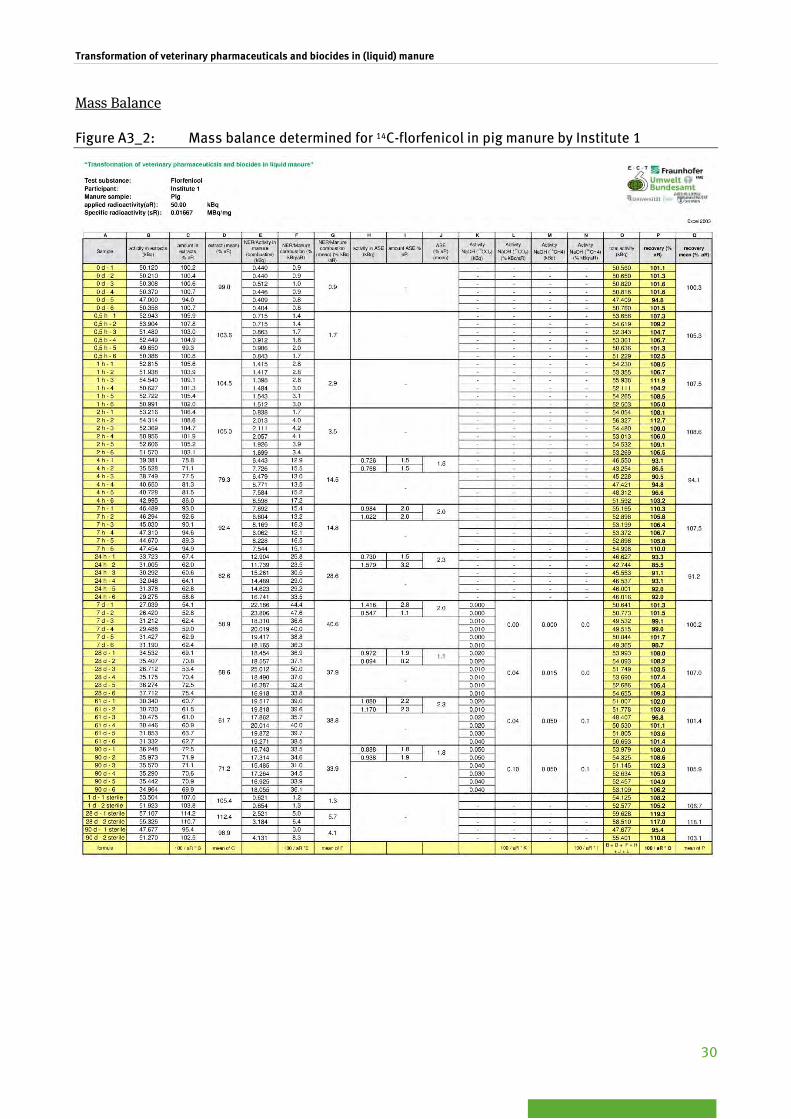
Transformation of veterinary pharmaceuticals and biocides in (liquid) manure
30
Mass Balance
Figure A3_2: Mass balance determined for 14C-florfenicol in pig manure by Institute 1

Transformation of veterinary pharmaceuticals and biocides in (liquid) manure
31
Figure A3_3: Mass balance determined for 14C-imidacloprid in cattle manure by Institute 1

Transformation of veterinary pharmaceuticals and biocides in (liquid) manure
32
Extraction methods
Figure A3_4: Extraction methods used within the ring test by Institute 1

Transformation of veterinary pharmaceuticals and biocides in (liquid) manure
33
Chemical Analysis
Figure A3_5: Results of chemical analysis for 14C-florfenicol in pig manure by Institute 1

Transformation of veterinary pharmaceuticals and biocides in (liquid) manure
34
Figure A3_6: Results of chemical analysis for 14C-imidacloprid in cattle manure by Institute 1

Transformation of veterinary pharmaceuticals and biocides in (liquid) manure
35
Institute 2
Physico-chemical parameters
Figure A3_7: Physico-chemical parameters measured throughout the ring test experiments by Institute 2
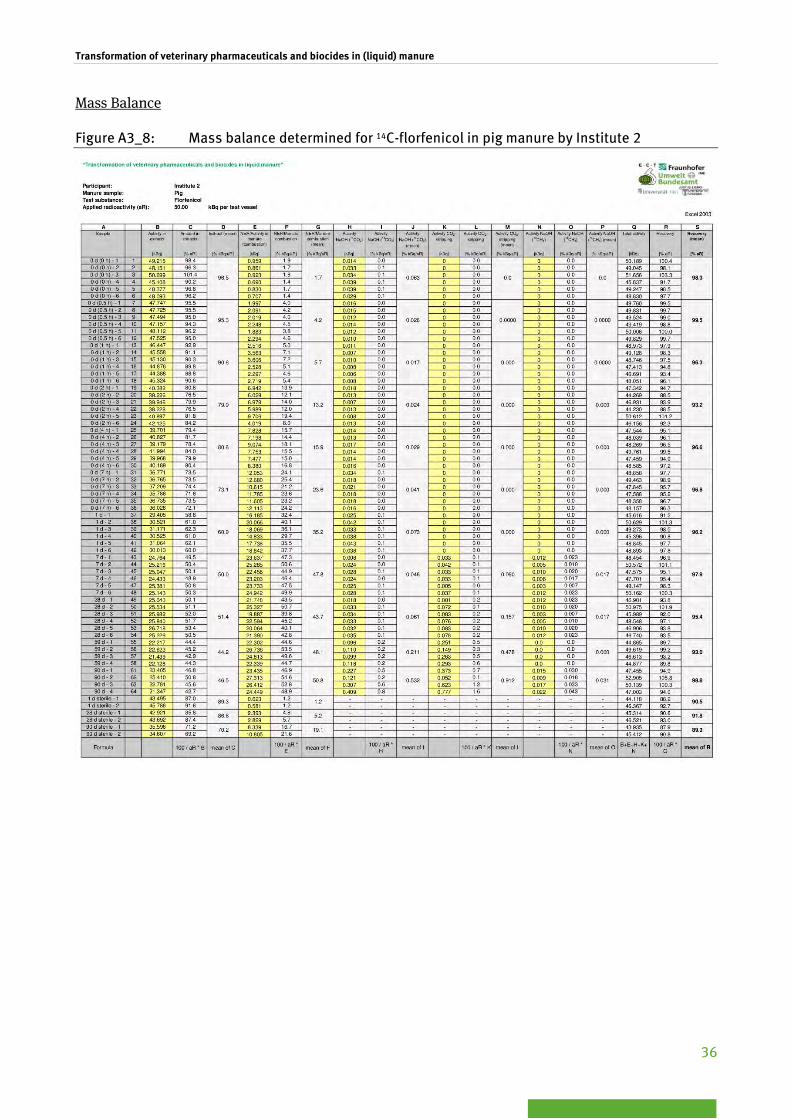
Transformation of veterinary pharmaceuticals and biocides in (liquid) manure
36
Mass Balance
Figure A3_8: Mass balance determined for 14C-florfenicol in pig manure by Institute 2

Transformation of veterinary pharmaceuticals and biocides in (liquid) manure
37
Figure A3_9: Mass balance determined for 14C-imidacloprid in cattle manure by Institute 2

Transformation of veterinary pharmaceuticals and biocides in (liquid) manure
38
Extraction methods
Figure A3_10: Extraction methods used within the ring test by Institute 2

Transformation of veterinary pharmaceuticals and biocides in (liquid) manure
39
Chemical Analysis
Figure A3_11: Results of chemical analysis for 14C-florfenicol in pig manure by Institute 2

Transformation of veterinary pharmaceuticals and biocides in (liquid) manure
40
Figure A3_12: Results of chemical analysis for 14C-imidacloprid in cattle manure by Institute 2

Transformation of veterinary pharmaceuticals and biocides in (liquid) manure
41
Institute 3
Physico-chemical parameters
Figure A3_13: Physico-chemical parameters measured throughout the ring test experiments by Institute 3

Transformation of veterinary pharmaceuticals and biocides in (liquid) manure
42
Mass Balance
Figure A3_14: Mass balance determined for 14C-florfenicol in pig manure by Institute 3

Transformation of veterinary pharmaceuticals and biocides in (liquid) manure
43
Figure A3_15: Mass balance determined for 14C-imidacloprid in cattle manure by Institute 3
Extraction methods
Figure A3_16: Extraction methods used within the ring test by Institute 3

Transformation of veterinary pharmaceuticals and biocides in (liquid) manure
44
Chemical Analysis
Figure A3_17: Results of chemical analysis for 14C-florfenicol in pig manure by Institute 3

Transformation of veterinary pharmaceuticals and biocides in (liquid) manure
45
Figure A3_18: Results of chemical analysis for 14C-imidacloprid in cattle manure by Institute 3

Transformation of veterinary pharmaceuticals and biocides in (liquid) manure
46
Institute 4
Physico-chemical parameters
Figure A3_19: Physico-chemical parameters measured throughout the ring test experiments by Institute 4

Transformation of veterinary pharmaceuticals and biocides in (liquid) manure
47
Mass Balance
Figure A3_20: Mass balance determined for 14C-florfenicol in pig manure by Institute 4
Figure A3_21: Mass balance determined for 14C-imidacloprid in cattle manure by Institute 4
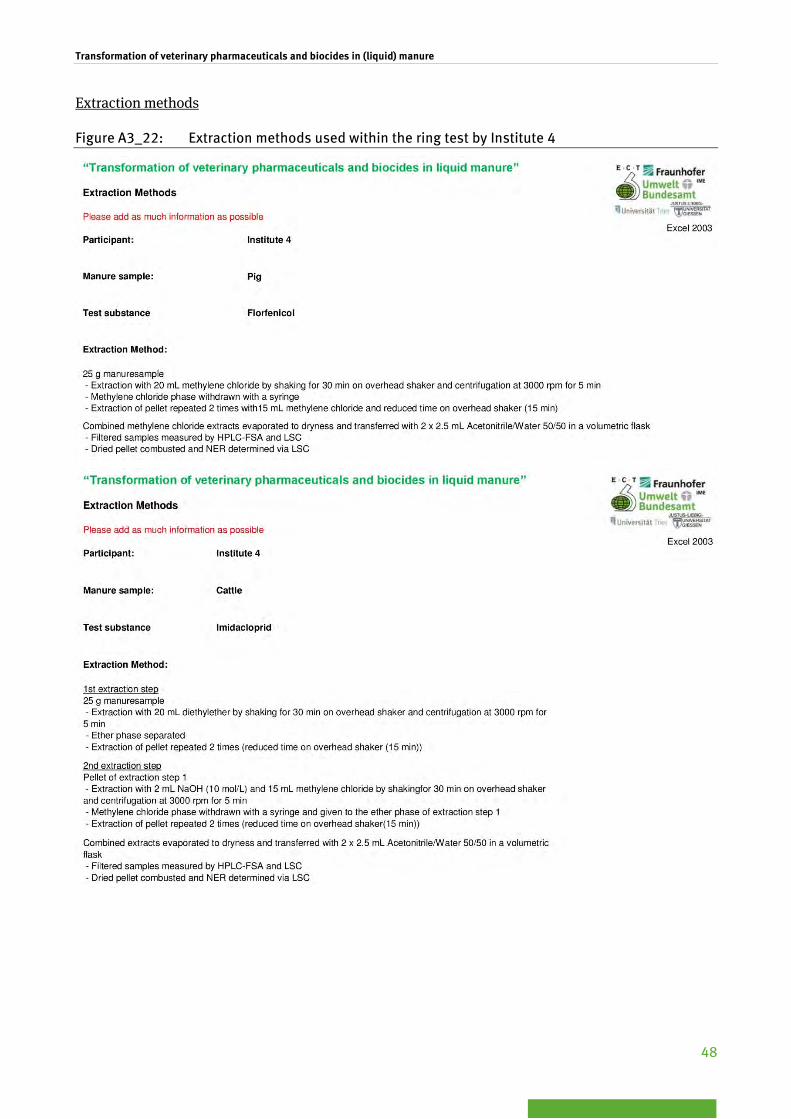
Transformation of veterinary pharmaceuticals and biocides in (liquid) manure
48
Extraction methods
Figure A3_22: Extraction methods used within the ring test by Institute 4
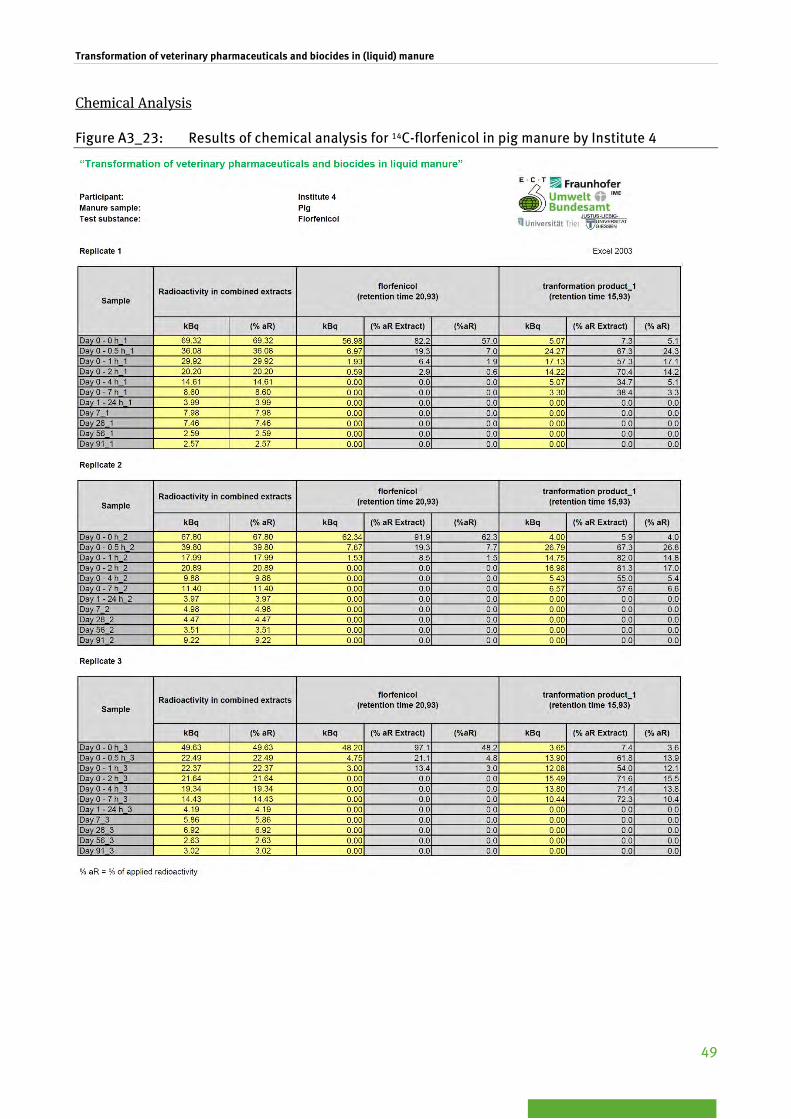
Transformation of veterinary pharmaceuticals and biocides in (liquid) manure
49
Chemical Analysis
Figure A3_23: Results of chemical analysis for 14C-florfenicol in pig manure by Institute 4
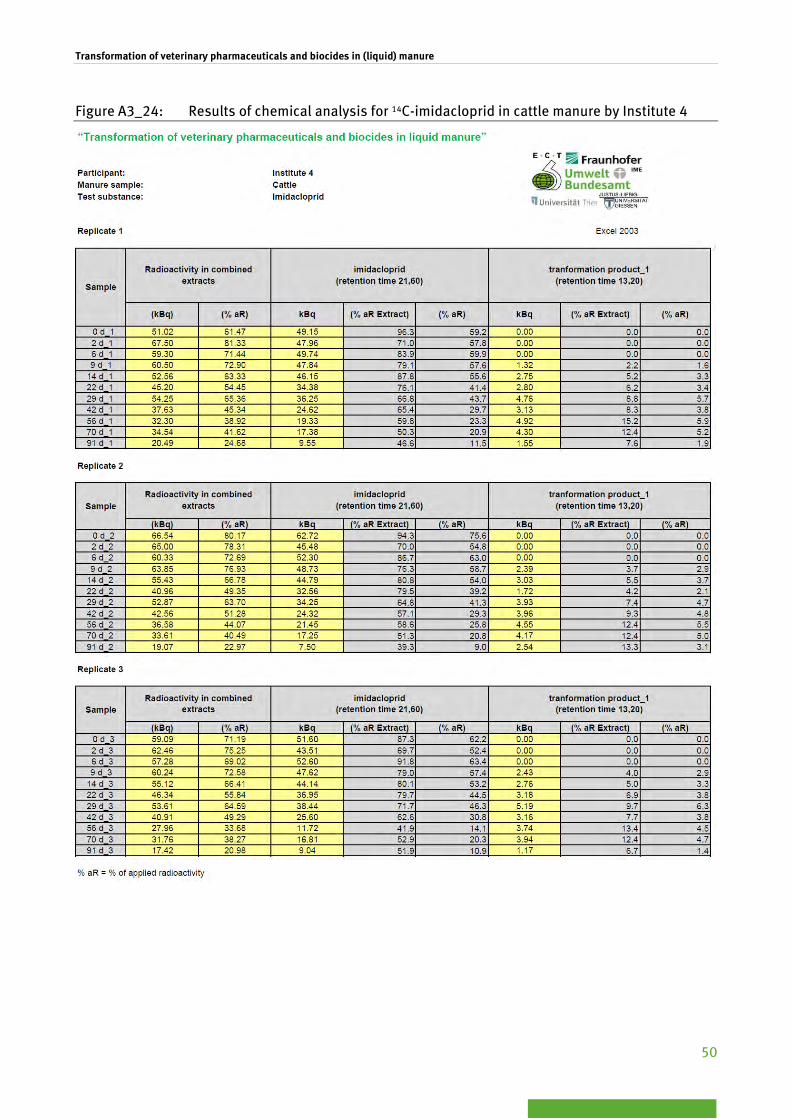
Transformation of veterinary pharmaceuticals and biocides in (liquid) manure
50
Figure A3_24: Results of chemical analysis for 14C-imidacloprid in cattle manure by Institute 4

Transformation of veterinary pharmaceuticals and biocides in (liquid) manure
51
Institute 5
Physico-chemical parameters
Figure A3_25: Physico-chemical parameters measured throughout the ring test experiments by Institute 5

Transformation of veterinary pharmaceuticals and biocides in (liquid) manure
52
Mass Balance
Figure A3_26: Mass balance determined for 14C-florfenicol in pig manure by Institute 5

Transformation of veterinary pharmaceuticals and biocides in (liquid) manure
53
Figure A3_27: Mass balance determined for 14C-imidacloprid in cattle manure by Institute 5
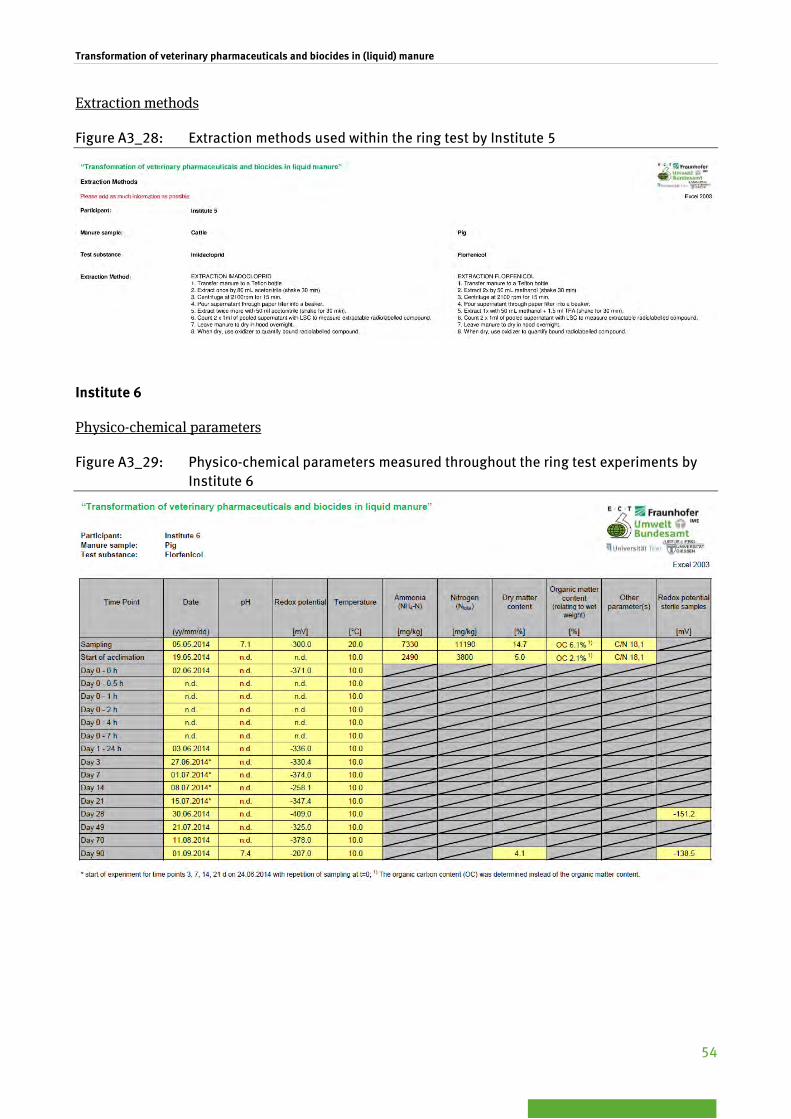
Transformation of veterinary pharmaceuticals and biocides in (liquid) manure
54
Extraction methods
Figure A3_28: Extraction methods used within the ring test by Institute 5
Institute 6
Physico-chemical parameters
Figure A3_29: Physico-chemical parameters measured throughout the ring test experiments by Institute 6

Transformation of veterinary pharmaceuticals and biocides in (liquid) manure
55
Mass Balance
Figure A3_30: Mass balance determined for 14C-florfenicol in pig manure by Institute 6
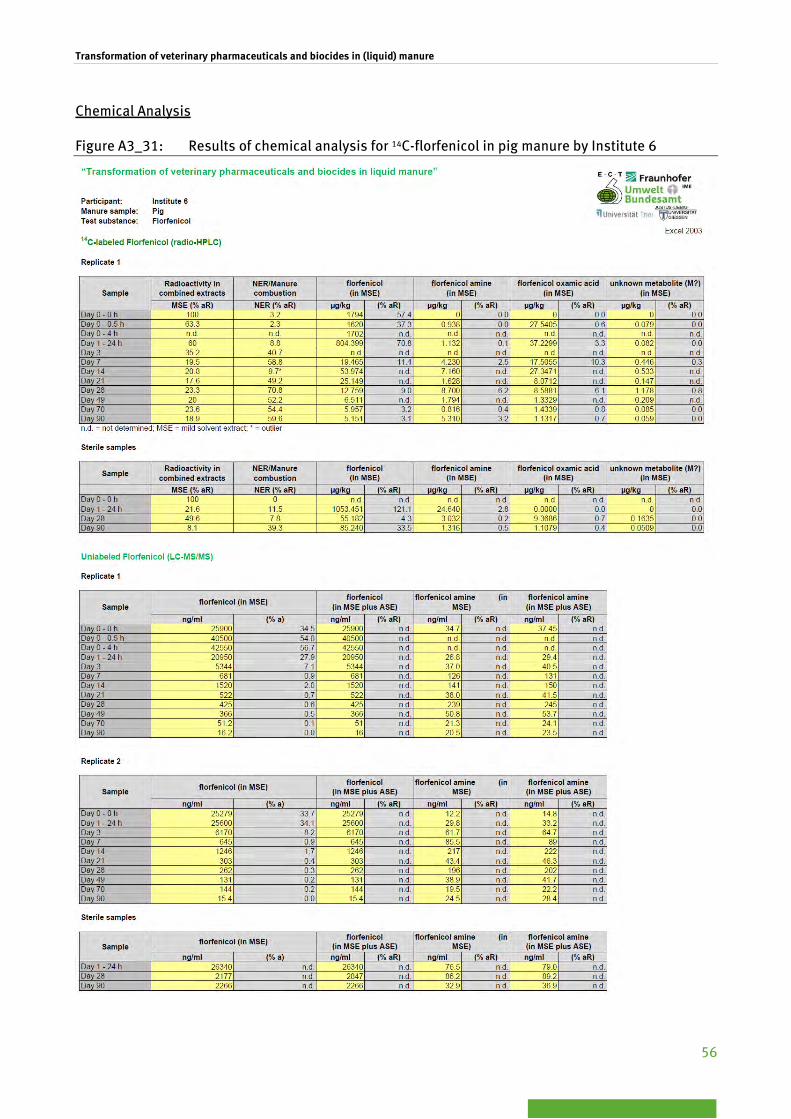
Transformation of veterinary pharmaceuticals and biocides in (liquid) manure
56
Chemical Analysis
Figure A3_31: Results of chemical analysis for 14C-florfenicol in pig manure by Institute 6

Transformation of veterinary pharmaceuticals and biocides in (liquid) manure
57
Annex 4
Degradation kinetics and statistical evaluation

Transformation of veterinary pharmaceuticals and biocides in (liquid) manure
58
Figure A5_1: Plots for transformation of florfenicol in pig manure, Institute 1, replicate 1. The measured values and the values calculated by means of applying the single first order kinetic model are shown for the parent compound florfenicol and the trans-formation products TP1, TP2 and TP3 (named as A1, B1 and C1 in the nomenclature of the KinGUI software tool). A rapid decrease of the parent compound can be seen accompanied by a modest increase of transformation products. Furthermore, in the graph below, the difference between measured value and calculated value is given. Chi2-value (parent) is 19.5.
0 10 20 30 40 50 60 70 80 90-50
0
50
100
150
Time
Con
cent
ratio
n
Measured & Predicted vs. Time
ParentA1B1C1
0 10 20 30 40 50 60 70 80 90-40
-20
0
20
40
Time
Res
idua
ls
Residual Plot
ParentA1B1C1

Transformation of veterinary pharmaceuticals and biocides in (liquid) manure
59
Figure A5_2: Plots for transformation of florfenicol in pig manure, Institute 1, replicate 2. The measured values and the values calculated by means of applying the single first order kinetic model are shown for the parent compound florfenicol and the trans-formation products TP1, TP2 and TP3 (named as A1, B1 and C1 in the nomenclature of the KinGUI software tool). A rapid decrease of the parent compound can be seen accompanied by a modest increase of transformation products. Furthermore, in the graph below, the difference between measured value and calculated value is given. Chi2-value (parent) is 21.3.
0 10 20 30 40 50 60 70 80 90-50
0
50
100
150
Time
Con
cent
ratio
n
Measured & Predicted vs. Time
ParentA1B1C1
0 10 20 30 40 50 60 70 80 90-50
0
50
Time
Res
idua
ls
Residual Plot
ParentA1B1C1

Transformation of veterinary pharmaceuticals and biocides in (liquid) manure
60
Figure A5_3: Plots for transformation of florfenicol in pig manure, Institute 1, replicate 3. The measured values and the values calculated by means of applying the single first order kinetic model are shown for the parent compound florfenicol and the trans-formation products TP1, TP2 and TP3 (named as A1, B1 and C1 in the nomenclature of the KinGUI software tool). A rapid decrease of the parent compound can be seen accompanied by a modest increase of transformation products. Furthermore, in the graph below, the difference between measured value and calculated value is given. Chi2-value (parent) is 14.5.
0 10 20 30 40 50 60 70 80 90-50
0
50
100
150
Time
Con
cent
ratio
n
Measured & Predicted vs. Time
ParentA1B1C1
0 10 20 30 40 50 60 70 80 90-50
0
50
Time
Res
idua
ls
Residual Plot
ParentA1B1C1

Transformation of veterinary pharmaceuticals and biocides in (liquid) manure
61
Figure A5_4: Plots for transformation of florfenicol in pig manure, Institute 1, replicate 4. The measured values and the values calculated by means of applying the single first order kinetic model are shown for the parent compound florfenicol and the trans-formation products TP1, TP2 and TP3 (named as A1, B1 and C1 in the nomenclature of the KinGUI software tool). A rapid decrease of the parent compound can be seen accompanied by a modest increase of transformation products. Furthermore, in the graph below, the difference between measured value and calculated value is given. Chi2-value (parent) is 15.3.
0 10 20 30 40 50 60 70 80 90-50
0
50
100
150
Time
Con
cent
ratio
n
Measured & Predicted vs. Time
ParentA1B1C1
0 10 20 30 40 50 60 70 80 90-40
-20
0
20
40
Time
Res
idua
ls
Residual Plot
ParentA1B1C1
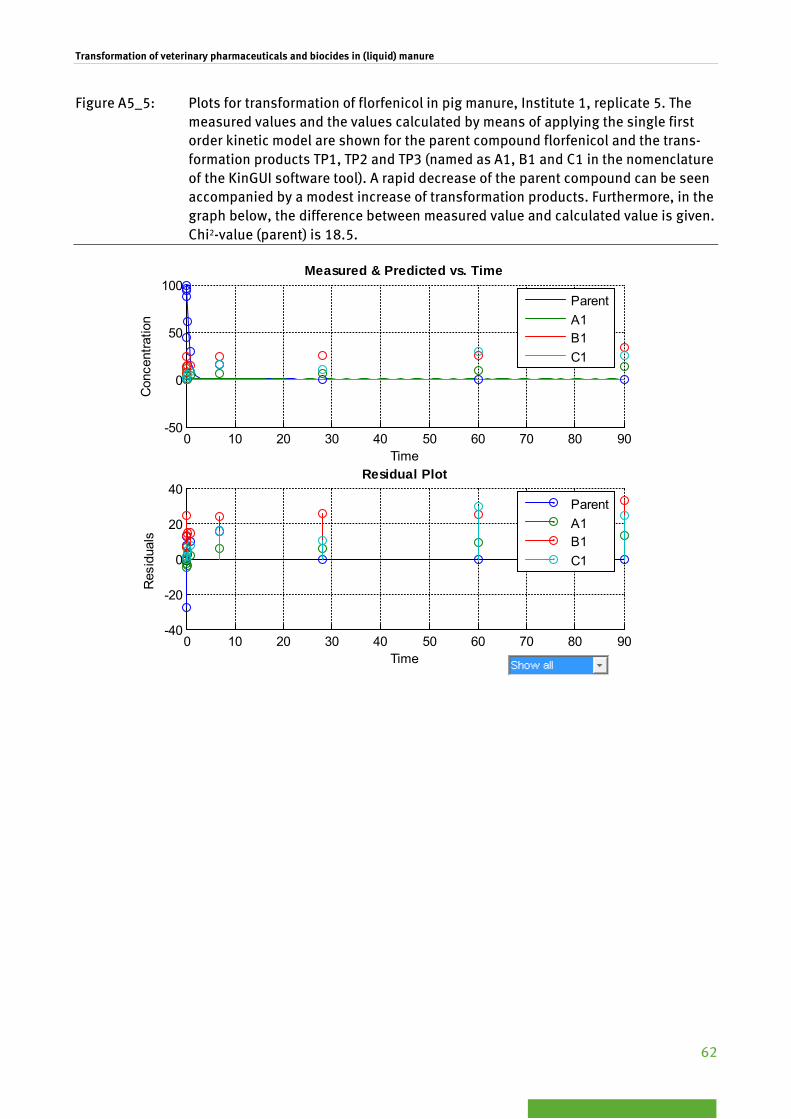
Transformation of veterinary pharmaceuticals and biocides in (liquid) manure
62
Figure A5_5: Plots for transformation of florfenicol in pig manure, Institute 1, replicate 5. The measured values and the values calculated by means of applying the single first order kinetic model are shown for the parent compound florfenicol and the trans-formation products TP1, TP2 and TP3 (named as A1, B1 and C1 in the nomenclature of the KinGUI software tool). A rapid decrease of the parent compound can be seen accompanied by a modest increase of transformation products. Furthermore, in the graph below, the difference between measured value and calculated value is given. Chi2-value (parent) is 18.5.
0 10 20 30 40 50 60 70 80 90-50
0
50
100
Time
Con
cent
ratio
n
Measured & Predicted vs. Time
ParentA1B1C1
0 10 20 30 40 50 60 70 80 90-40
-20
0
20
40
Time
Res
idua
ls
Residual Plot
ParentA1B1C1
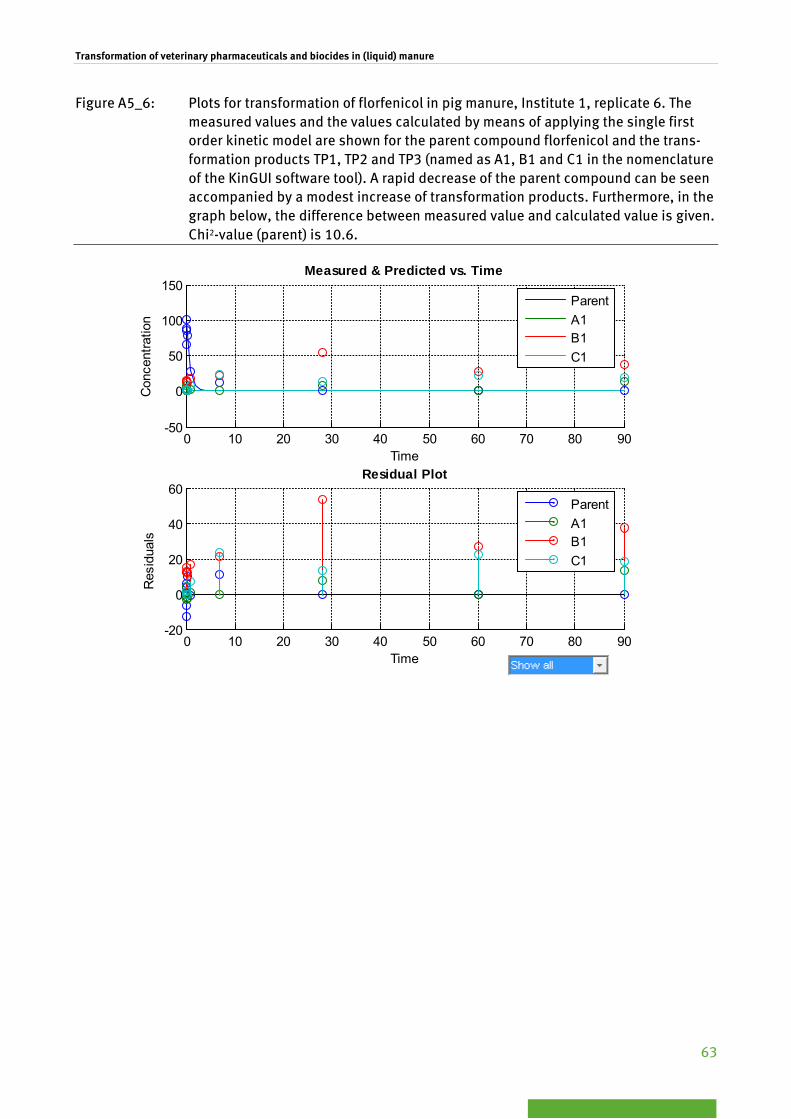
Transformation of veterinary pharmaceuticals and biocides in (liquid) manure
63
Figure A5_6: Plots for transformation of florfenicol in pig manure, Institute 1, replicate 6. The measured values and the values calculated by means of applying the single first order kinetic model are shown for the parent compound florfenicol and the trans-formation products TP1, TP2 and TP3 (named as A1, B1 and C1 in the nomenclature of the KinGUI software tool). A rapid decrease of the parent compound can be seen accompanied by a modest increase of transformation products. Furthermore, in the graph below, the difference between measured value and calculated value is given. Chi2-value (parent) is 10.6.
0 10 20 30 40 50 60 70 80 90-50
0
50
100
150
Time
Con
cent
ratio
n
Measured & Predicted vs. Time
ParentA1B1C1
0 10 20 30 40 50 60 70 80 90-20
0
20
40
60
Time
Res
idua
ls
Residual Plot
ParentA1B1C1

Transformation of veterinary pharmaceuticals and biocides in (liquid) manure
64
Figure A5_7: Plots for transformation of florfenicol in pig manure, Institute 1, mean of replicates. The measured values and the values calculated by means of applying the single first order kinetic model are shown for the parent compound florfenicol and the transformation products TP1, TP2 and TP3 (named as A1, B1 and C1 in the nomen-clature of the KinGUI software tool). A rapid decrease of the parent compound can be seen. Furthermore, in the graph below, the difference between measured value and calculated value is given. Chi2-value (parent) is 16.6.
Table A5_1: Measured, predicted and residual values for transformation of the parent com-pound florfenicol in pig manure (Institute 1, mean of replicates, single first order kinetics)
Time Florfenicol (parent) Measured [%] Predicted [%] residual
0.0 99.5000 97.0908 2.4092
0.021 103.6000 93.9682 9.6318
0.042 87.3000 90.9460 -3.6460
0.083 92.6000 85.1902 7.4098
0.167 48.0000 74.7482 -26.7482
0.292 67.0000 59.4595 7.5405
1.0 25.6000 18.9375 6.6625
7.0 11.0000 0.0010 10.9990
28.0 2.4000 0.0000 2.4000
0 10 20 30 40 50 60 70 80 90-50
0
50
100
150
Time
Con
cent
ratio
n
Measured & Predicted vs. Time
ParentA1B1C1
0 10 20 30 40 50 60 70 80 90-40
-20
0
20
40
Time
Res
idua
ls
Residual Plot
ParentA1B1C1

Transformation of veterinary pharmaceuticals and biocides in (liquid) manure
65
60.0 0.0000 0.0000 -0.0000
90.0 0.0000 0.0000 -0.0000
Figure A5_8: Plots for transformation of florfenicol in pig manure, Institute 2, replicate 1. The measured values and the values calculated by means of applying the single first order kinetic model are shown for the parent compound florfenicol and the trans-formation products TP1, TP2 and TP3 (named as A1, B1 and C1 in the nomenclature of the KinGUI software tool). A rapid decrease of the parent compound can be seen accompanied by an increase of TP1, followed by a modest decrease. Furthermore, in the graph below, the difference between measured value and calculated value is given. Chi2-value (parent) is 23.3; chi2-value (TP1) is 40.5.
0 10 20 30 40 50 60 70 80 90-50
0
50
100
Time
Con
cent
ratio
n
Measured & Predicted vs. Time
ParentA1B1C1
0 10 20 30 40 50 60 70 80 90-40
-20
0
20
40
Time
Res
idua
ls
Residual Plot
ParentA1B1C1

Transformation of veterinary pharmaceuticals and biocides in (liquid) manure
66
Figure A5_9: Plots for transformation of florfenicol in pig manure, Institute 2, replicate 2. The measured values and the values calculated by means of applying the single first order kinetic model are shown for the parent compound florfenicol and the trans-formation products TP1, TP2 and TP3 (named as A1, B1 and C1 in the nomenclature of the KinGUI software tool). A rapid decrease of the parent compound can be seen accompanied by an increase of TP1 followed by a modest decrease. Furthermore, in the graph below, the difference between measured value and calculated value is given. Chi2-value (parent) is 22.9; chi2-value (TP1) is 46.2.
0 10 20 30 40 50 60 70 80 90-50
0
50
100
Time
Con
cent
ratio
n
Measured & Predicted vs. Time
ParentA1B1C1
0 10 20 30 40 50 60 70 80 90-40
-20
0
20
40
Time
Res
idua
ls
Residual Plot
ParentA1B1C1

Transformation of veterinary pharmaceuticals and biocides in (liquid) manure
67
Figure A5_10: Plots for transformation of florfenicol in pig manure, Institute 2, replicate 3. The measured values and the values calculated by means of applying the single first order kinetic model are shown for the parent compound florfenicol and the trans-formation products TP1, TP2 and TP3 (named as A1, B1 and C1 in the nomenclature of the KinGUI software tool). A rapid decrease of the parent compound can be seen accompanied by an increase of TP1 followed by a modest decrease. Furthermore, in the graph below, the difference between measured value and calculated value is given. Chi2-value (parent) is 25.1; chi2-value (TP1) is 42.0.
0 10 20 30 40 50 60 70 80 90-50
0
50
100
150
Time
Con
cent
ratio
n
Measured & Predicted vs. Time
ParentA1B1C1
0 10 20 30 40 50 60 70 80 90-40
-20
0
20
40
Time
Res
idua
ls
Residual Plot
ParentA1B1C1
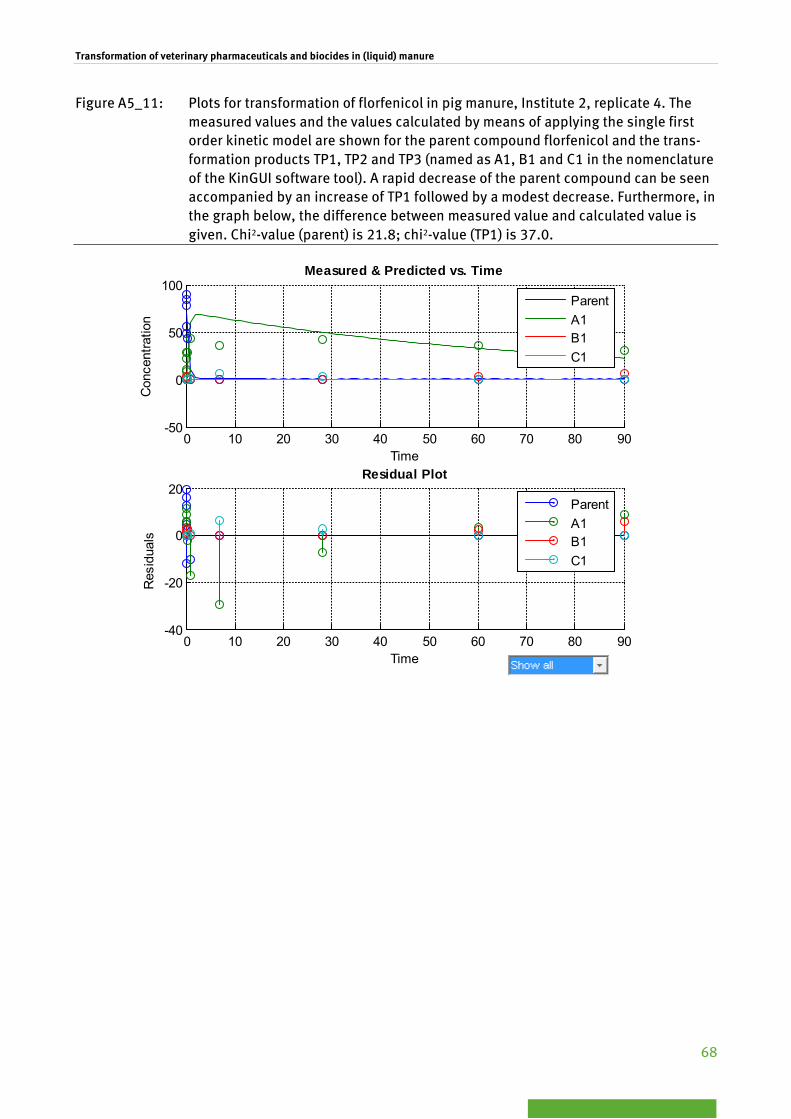
Transformation of veterinary pharmaceuticals and biocides in (liquid) manure
68
Figure A5_11: Plots for transformation of florfenicol in pig manure, Institute 2, replicate 4. The measured values and the values calculated by means of applying the single first order kinetic model are shown for the parent compound florfenicol and the trans-formation products TP1, TP2 and TP3 (named as A1, B1 and C1 in the nomenclature of the KinGUI software tool). A rapid decrease of the parent compound can be seen accompanied by an increase of TP1 followed by a modest decrease. Furthermore, in the graph below, the difference between measured value and calculated value is given. Chi2-value (parent) is 21.8; chi2-value (TP1) is 37.0.
0 10 20 30 40 50 60 70 80 90-50
0
50
100
Time
Con
cent
ratio
n
Measured & Predicted vs. Time
ParentA1B1C1
0 10 20 30 40 50 60 70 80 90-40
-20
0
20
Time
Res
idua
ls
Residual Plot
ParentA1B1C1

Transformation of veterinary pharmaceuticals and biocides in (liquid) manure
69
Figure A5_12: Plots for transformation of florfenicol in pig manure, Institute 2, replicate 5. The measured values and the values calculated by means of applying the single first order kinetic model are shown for the parent compound florfenicol and the trans-formation products TP1, TP2 and TP3 (named as A1, B1 and C1 in the nomenclature of the KinGUI software tool). A rapid decrease of the parent compound can be seen accompanied by an increase of TP1, followed by a modest decrease. Furthermore, in the graph below, the difference between measured value and calculated value is given. Chi2-value (parent) is 18.5; chi2-value (TP1) is 37.2.
0 5 10 15 20 250
50
100
Time
Con
cent
ratio
n
Measured & Predicted vs. Time
ParentA1B1C1
0 5 10 15 20 25 30-40
-20
0
20
40
Time
Res
idua
ls
Residual Plot
ParentA1B1C1

Transformation of veterinary pharmaceuticals and biocides in (liquid) manure
70
Figure A5_13: Plots for transformation of florfenicol in pig manure, Institute 2, replicate 6. The measured values and the values calculated by means of applying the single first order kinetic model are shown for the parent compound florfenicol and the trans-formation products TP1, TP2 and TP3 (named as A1, B1 and C1 in the nomenclature of the KinGUI software tool). A rapid decrease of the parent compound can be seen accompanied by an increase of A1, followed by a modest decrease. Furthermore, in the graph below, the difference between measured value and calculated value is given. Chi2-value (parent) is 18.5; chi2-value (TP1) is 37.2.
0 5 10 15 20 250
50
100
Time
Con
cent
ratio
n
Measured & Predicted vs. Time
ParentA1B1C1
0 5 10 15 20 25 30-40
-20
0
20
Time
Res
idua
ls
Residual Plot
ParentA1B1C1

Transformation of veterinary pharmaceuticals and biocides in (liquid) manure
71
Figure A5_14: Plots for transformation of florfenicol in pig manure, Institute 2, mean of replicates. The measured values and the values calculated by means of applying the single first order kinetic model are shown for the parent compound florfenicol and the transformation products TP1, TP2 and TP3 (named as A1, B1 and C1 in the nomen-clature of the KinGUI software tool). A rapid decrease of the parent compound can be seen. Furthermore, in the graph below, the difference between measured value and calculated value is given. Chi2-value (parent) is 13.1.
Table A5_2: Measured, predicted and residual values for transformation of the parent com-pound florfenicol in pig manure (Institute 2, mean of replicates, single first order kinetics)
Time Florfenicol (parent) Measured [%] Predicted [%] residual
0.0 96.5000 86.4695 10.0305
0.021 86.3000 81.5419 4.7581
0.042 77.1000 76.8952 0.2048
0.083 53.6000 68.5724 -14.9724
0.167 50.2000 54.2279 -4.0279
0.292 44.1000 38.2425 5.8575
1.0 2.8000 5.2899 -2.4899
7.0 0.0000 0.0000 -0.0000
28.0 0.0000 -0.0000 0.0000
0 10 20 30 40 50 60 70 80 90-50
0
50
100
Time
Con
cent
ratio
n
Measured & Predicted vs. Time
ParentA1B1C1
0 10 20 30 40 50 60 70 80 90-20
0
20
40
60
Time
Res
idua
ls
Residual Plot
ParentA1B1C1

Transformation of veterinary pharmaceuticals and biocides in (liquid) manure
72
60.0 0.0000 0.0000 -0.0000
90.0 0.0000 0.0000 -0.0000
Figure A5_15: Plots for transformation of florfenicol in pig manure, Institute 3, replicate 1. The measured values and the values calculated by means of applying the single first order kinetic model are shown for the parent compound florfenicol and the trans-formation products TP1 and TP2 (named as A1 and B1 in the nomenclature of the KinGUI software tool). A rapid decrease of the parent compound can be seen ac-companied by an increase of TP1 and TP2. Whereas TP1 decreased rapidly after-wards, TP2 remains constant until the end of the study. Furthermore, in the graph below, the difference between measured value and calculated value is given. Chi2-value (parent) is 15.7; chi2-value (TP1) is 48.2; chi2-value (TP2) is 103.4.
0 10 20 30 40 50 60 70 80 90-50
0
50
100
Time
Con
cent
ratio
n
Measured & Predicted vs. Time
ParentA1B1
0 10 20 30 40 50 60 70 80 90-20
0
20
40
60
Time
Res
idua
ls
Residual Plot
ParentA1B1
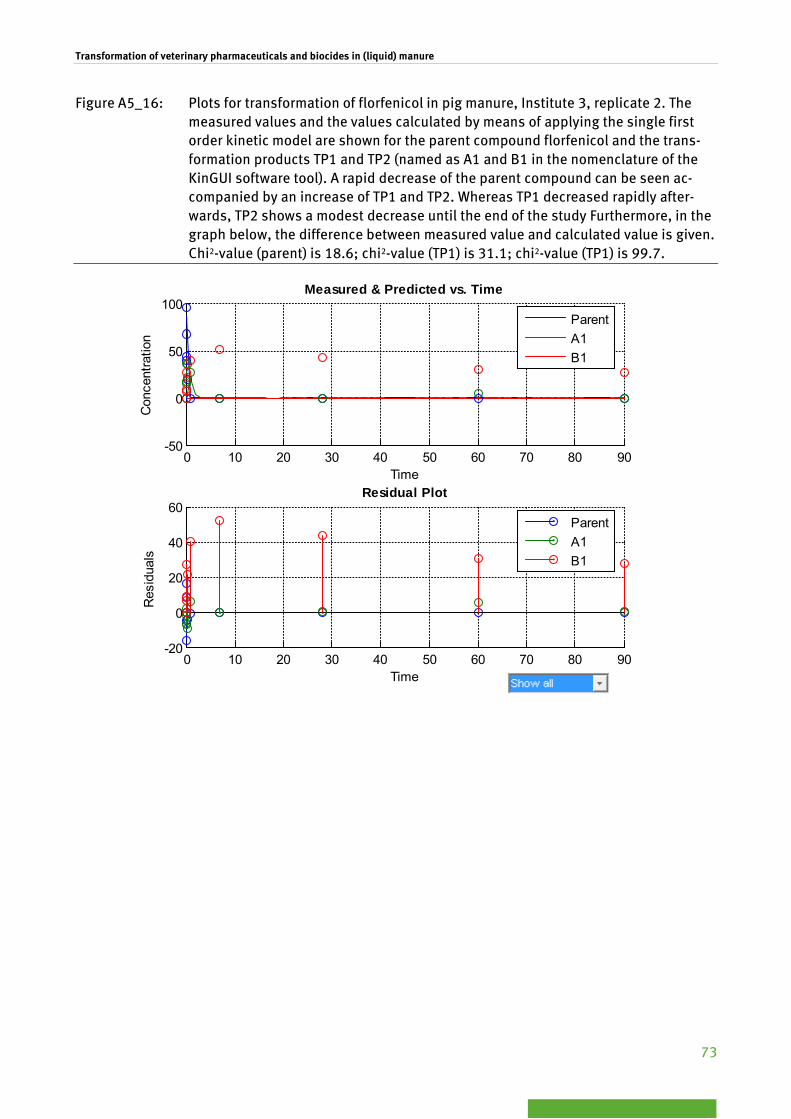
Transformation of veterinary pharmaceuticals and biocides in (liquid) manure
73
Figure A5_16: Plots for transformation of florfenicol in pig manure, Institute 3, replicate 2. The measured values and the values calculated by means of applying the single first order kinetic model are shown for the parent compound florfenicol and the trans-formation products TP1 and TP2 (named as A1 and B1 in the nomenclature of the KinGUI software tool). A rapid decrease of the parent compound can be seen ac-companied by an increase of TP1 and TP2. Whereas TP1 decreased rapidly after-wards, TP2 shows a modest decrease until the end of the study Furthermore, in the graph below, the difference between measured value and calculated value is given. Chi2-value (parent) is 18.6; chi2-value (TP1) is 31.1; chi2-value (TP1) is 99.7.
0 10 20 30 40 50 60 70 80 90-50
0
50
100
Time
Con
cent
ratio
n
Measured & Predicted vs. Time
ParentA1B1
0 10 20 30 40 50 60 70 80 90-20
0
20
40
60
Time
Res
idua
ls
Residual Plot
ParentA1B1

Transformation of veterinary pharmaceuticals and biocides in (liquid) manure
74
Figure A5_17: Plots for transformation of florfenicol in pig manure, Institute 3, mean of replicates. The measured values and the values calculated by means of applying the single first order kinetic model are shown for the parent compound florfenicol and the transformation products TP1 and TP2 (named as A1 and B1 in the nomenclature of the KinGUI software tool). A rapid decrease of the parent compound can be seen. Furthermore, in the graph below, the difference between measured value and cal-culated value is given. Chi2-value (parent) is 15.8.
Table A5_3: Measured, predicted and residual values for transformation of the parent com-pound florfenicol in pig manure (Institute 3, mean of replicates, single first order kinetics)
Time Florfenicol (parent) Measured [%] Predicted [%] residual
0.0 93.3000 86.1812 7.1188
0.021 94.7000 79.3602 15.3398
0.042 71.4000 73.0791 -1.6791
0.083 51.9000 61.9689 -10.0689
0.167 38.5000 44.5589 -6.0589
0.292 18.4000 25.0188 -6.6188
1.0 0.0000 1.3961 -1.3961
7.0 0.0000 0.0000 -0.0000
28.0 0.0000 0.0000 -0.0000
0 10 20 30 40 50 60 70 80 90-50
0
50
100
Time
Con
cent
ratio
n
Measured & Predicted vs. Time
ParentA1B1
0 10 20 30 40 50 60 70 80 90-20
0
20
40
60
Time
Res
idua
ls
Residual Plot
ParentA1B1
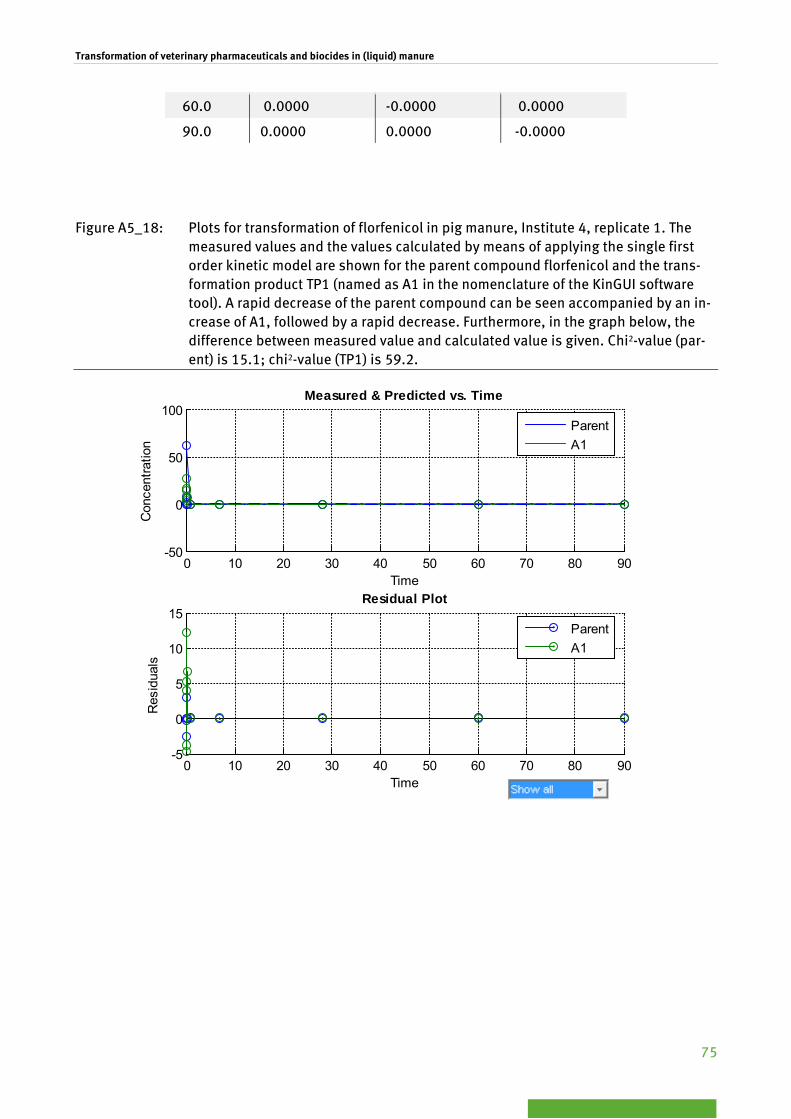
Transformation of veterinary pharmaceuticals and biocides in (liquid) manure
75
60.0 0.0000 -0.0000 0.0000
90.0 0.0000 0.0000 -0.0000
Figure A5_18: Plots for transformation of florfenicol in pig manure, Institute 4, replicate 1. The measured values and the values calculated by means of applying the single first order kinetic model are shown for the parent compound florfenicol and the trans-formation product TP1 (named as A1 in the nomenclature of the KinGUI software tool). A rapid decrease of the parent compound can be seen accompanied by an in-crease of A1, followed by a rapid decrease. Furthermore, in the graph below, the difference between measured value and calculated value is given. Chi2-value (par-ent) is 15.1; chi2-value (TP1) is 59.2.
0 10 20 30 40 50 60 70 80 90-50
0
50
100
Time
Con
cent
ratio
n
Measured & Predicted vs. Time
ParentA1
0 10 20 30 40 50 60 70 80 90-5
0
5
10
15
Time
Res
idua
ls
Residual Plot
ParentA1

Transformation of veterinary pharmaceuticals and biocides in (liquid) manure
76
Figure A5_19: Plots for transformation of florfenicol in pig manure, Institute 4, replicate 2. The measured values and the values calculated by means of applying the single first order kinetic model are shown for the parent compound florfenicol and the trans-formation product TP1 (named as A1 in the nomenclature of the KinGUI software tool). A rapid decrease of the parent compound can be seen accompanied by an in-crease of A1, followed by a rapid decrease. Furthermore, in the graph below, the difference between measured value and calculated value is given. Chi2-value (par-ent) is 15.0; chi2-value (TP1) is 59.2.
0 10 20 30 40 50 60 70 80 90-50
0
50
100
Time
Con
cent
ratio
n
Measured & Predicted vs. Time
ParentA1
0 10 20 30 40 50 60 70 80 90-5
0
5
10
15
Time
Res
idua
ls
Residual Plot
ParentA1

Transformation of veterinary pharmaceuticals and biocides in (liquid) manure
77
Figure A5_20: Plots for transformation of florfenicol in pig manure, Institute 4, replicate 3. The measured values and the values calculated by means of applying the single first order kinetic model are shown for the parent compound florfenicol and the trans-formation product TP1 (named as A1 in the nomenclature of the KinGUI software tool). A rapid decrease of the parent compound can be seen accompanied by an in-crease of A1, followed by a rapid decrease. Furthermore, in the graph below, the difference between measured value and calculated value is given. Chi2-value (par-ent) is 15.0; chi2-value (TP1) is 59.2.
0 10 20 30 40 50 60 70 80 90-50
0
50
100
Time
Con
cent
ratio
n
Measured & Predicted vs. Time
ParentA1
0 10 20 30 40 50 60 70 80 90-5
0
5
10
15
Time
Res
idua
ls
Residual Plot
ParentA1

Transformation of veterinary pharmaceuticals and biocides in (liquid) manure
78
Figure A5_21: Plots for transformation of florfenicol in pig manure, Institute 4, mean of replicates. The measured values and the values calculated by means of applying the single first order kinetic model are shown for the parent compound florfenicol and the transformation product TP1 (named as A1 in the nomenclature of the KinGUI soft-ware tool). A rapid decrease of the parent compound can be seen. Furthermore, in the graph below, the difference between measured value and calculated value is given. Chi2-value (parent) is 25.1.
Table A5_4: Measured, predicted and residual values for transformation of the parent com-pound florfenicol in pig manure (Institute 4, mean of replicates, single first order kinetics)
Time Florfenicol (parent) Measured [%] Predicted [%] residual
0.0 55.8000 51.5930 4.2070
0.021 6.5000 10.8872 -4.3872
0.042 2.2000 2.2974 -0.0974
0.083 0.2000 0.1023 0.0977
0.167 0.0000 0.0002 -0.0002
0.292 0.0000 0.0000 -0.0000
1.0 0.0000 0.0000 -0.0000
7.0 0.0000 -0.0000 0.0000
28.0 0.0000 -0.0000 0.0000
0 10 20 30 40 50 60 70 80 90-20
0
20
40
60
Time
Con
cent
ratio
n
Measured & Predicted vs. Time
ParentA1
0 10 20 30 40 50 60 70 80 90-10
-5
0
5
10
Time
Res
idua
ls
Residual Plot
ParentA1

Transformation of veterinary pharmaceuticals and biocides in (liquid) manure
79
60.0 0.0000 -0.0000 0.0000
90.0 0.0000 0.0000 -0.0000
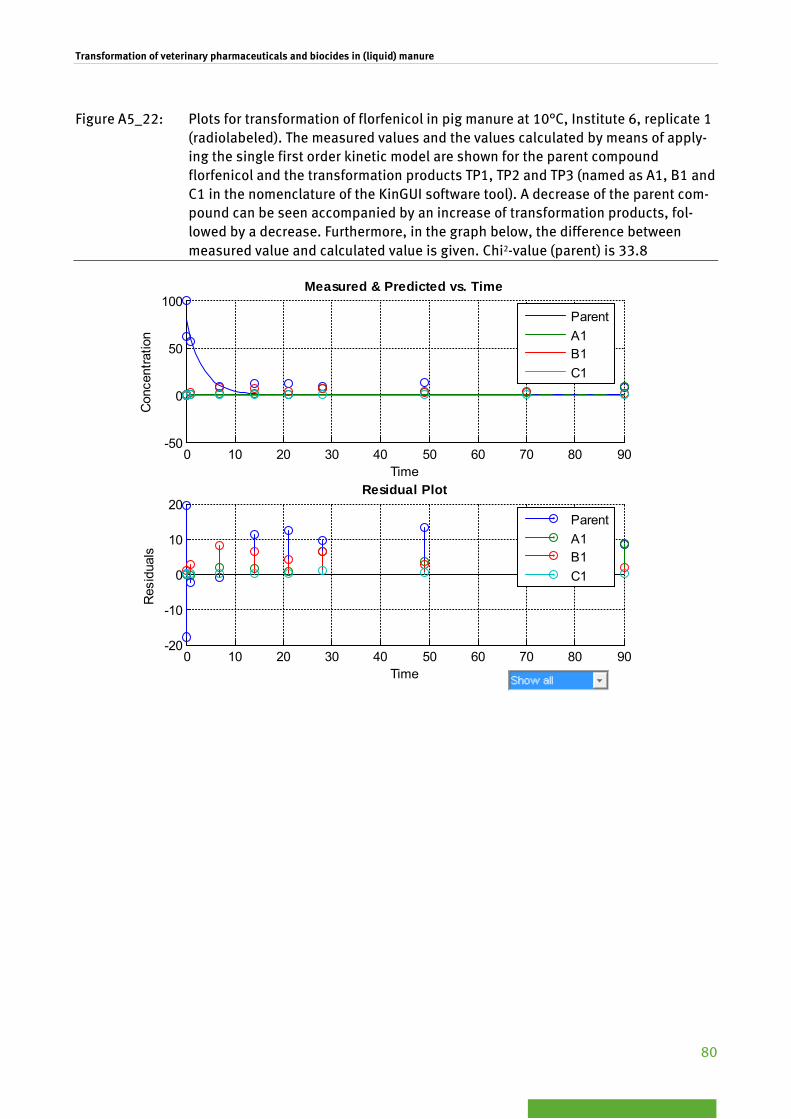
Transformation of veterinary pharmaceuticals and biocides in (liquid) manure
80
Figure A5_22: Plots for transformation of florfenicol in pig manure at 10°C, Institute 6, replicate 1 (radiolabeled). The measured values and the values calculated by means of apply-ing the single first order kinetic model are shown for the parent compound florfenicol and the transformation products TP1, TP2 and TP3 (named as A1, B1 and C1 in the nomenclature of the KinGUI software tool). A decrease of the parent com-pound can be seen accompanied by an increase of transformation products, fol-lowed by a decrease. Furthermore, in the graph below, the difference between measured value and calculated value is given. Chi2-value (parent) is 33.8
0 10 20 30 40 50 60 70 80 90-50
0
50
100
Time
Con
cent
ratio
n
Measured & Predicted vs. Time
ParentA1B1C1
0 10 20 30 40 50 60 70 80 90-20
-10
0
10
20
Time
Res
idua
ls
Residual Plot
ParentA1B1C1

Transformation of veterinary pharmaceuticals and biocides in (liquid) manure
81
Figure A5_23: Plots for transformation of florfenicol in pig manure at 10°C, Institute 6, replicate 1 (unlabeled). The measured values and the values calculated by means of applying the single first order kinetic model are shown for the parent compound florfenicol (using the CAKE software tool, version 3.1). A decrease of the parent compound can be seen. Furthermore, in the graph below, the difference between measured value and calculated value is given. Chi2-value (parent) is 30.2
0
20
40
60
Con
cent
ratio
n (%
)
0 20 40 60 80
Time (days)
Observations Fit
-15
-10
-5
0
5
10
15
Res
idua
l (%
)
0 20 40 60 80
Time (days)

Transformation of veterinary pharmaceuticals and biocides in (liquid) manure
82
Figure A5_24: Plots for transformation of florfenicol in pig manure at 10°C, Institute 6, replicate 2 (unlabeled). The measured values and the values calculated by means of applying the single first order kinetic model are shown for the parent compound florfenicol (using the CAKE software tool, version 3.1). A decrease of the parent compound can be seen. Furthermore, in the graph below, the difference between measured value and calculated value is given. Chi2-value (parent) is 30.3
0
20
40
60
Con
cent
ratio
n (%
)
0 20 40 60 80
Time (days)
Observations Fit
-20
-15
-10
-5
0
5
10
15
Res
idua
l (%
)
0 20 40 60 80
Time (days)
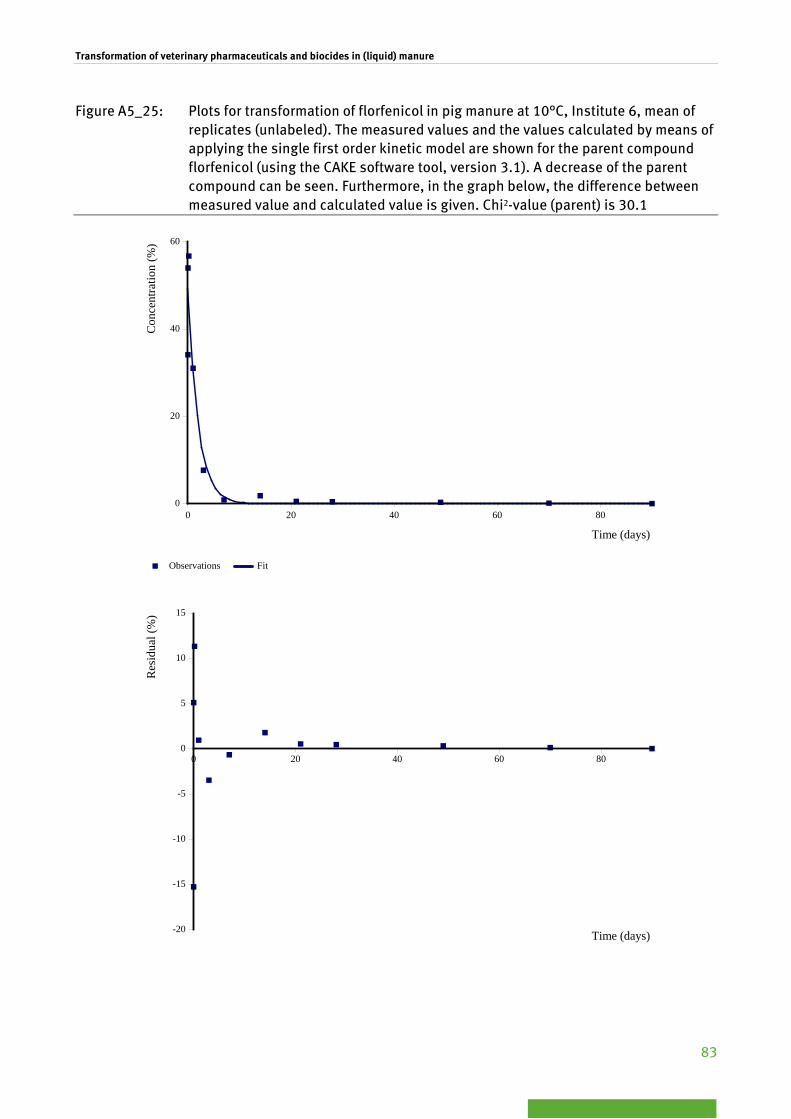
Transformation of veterinary pharmaceuticals and biocides in (liquid) manure
83
Figure A5_25: Plots for transformation of florfenicol in pig manure at 10°C, Institute 6, mean of replicates (unlabeled). The measured values and the values calculated by means of applying the single first order kinetic model are shown for the parent compound florfenicol (using the CAKE software tool, version 3.1). A decrease of the parent compound can be seen. Furthermore, in the graph below, the difference between measured value and calculated value is given. Chi2-value (parent) is 30.1
0
20
40
60
Con
cent
ratio
n (%
)
0 20 40 60 80
Time (days)
Observations Fit
-20
-15
-10
-5
0
5
10
15
Res
idua
l (%
)
0 20 40 60 80
Time (days)

Transformation of veterinary pharmaceuticals and biocides in (liquid) manure
84
Table A5_5: Measured, predicted and residual values for transformation of the parent com-pound florfenicol at 10°C in pig manure (Institute 6, mean of replicates, single first order kinetics)
Time Florfenicol (parent) Measured [%] Predicted [%] residual
0 34.12 49.38 -15.26
0.02 54.00 48.90 5.10
0.17 56.73 45.39 11.34
1 31.03 30.07 0.96
3 7.68 11.15 -3.47
7 0.88 1.53 -0.65
14 1.84 0.05 1.79
21 0.55 0.00 0.55
28 0.46 0.00 0.46
49 0.33 0.00 0.33
70 0.13 0 0.13
90 0.02 0 0.02
Table A5_6: Overview on chi2-values of all replicates and measurements for the parent com-pound florfenicol (SFO-kinetics)
Test substance Florfenicol (parent) Institute 1 2 3 4 6 2)
Replicate 1 19.503 23.250 15.710 15.066 30.200
Replicate 2 21.286 22.940 18.625 14.986 30.300
Replicate 3 14.476 25.090 n.a. 14.977 n.a.
Replicate 4 15.270 21.781 n.a. n.a. n.a.
Replicate 5 18.550 18.537 n.a. n.a. n.a.
Replicate 6 10.620 15.295 n.a. n.a. n.a.
N 6 6 2 3 2
Mean 16.618 21.149 17.168 15.010 30.250
SD 3.905 3.596 2.061 0.049 0.071
COV (%) 23.497 17.002 12.007 0.325 0.234
Minimum 16.618 1)
Maximum 30.300 1)
Overall mean 21.296 1)
Overall SD 6.302 1)
Overall COV (%) 29.590 1)
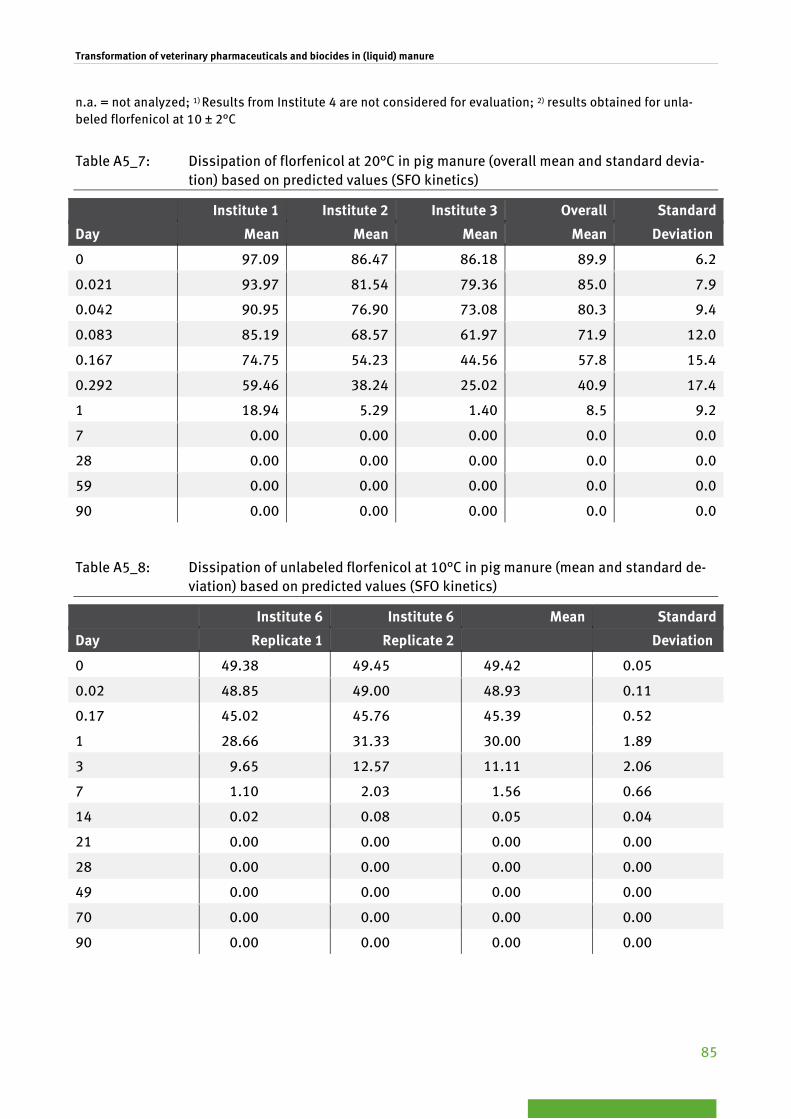
Transformation of veterinary pharmaceuticals and biocides in (liquid) manure
85
n.a. = not analyzed; 1) Results from Institute 4 are not considered for evaluation; 2) results obtained for unla-beled florfenicol at 10 ± 2°C
Table A5_7: Dissipation of florfenicol at 20°C in pig manure (overall mean and standard devia-tion) based on predicted values (SFO kinetics)
Institute 1 Institute 2 Institute 3 Overall Standard
Day Mean Mean Mean Mean Deviation
0 97.09 86.47 86.18 89.9 6.2
0.021 93.97 81.54 79.36 85.0 7.9
0.042 90.95 76.90 73.08 80.3 9.4
0.083 85.19 68.57 61.97 71.9 12.0
0.167 74.75 54.23 44.56 57.8 15.4
0.292 59.46 38.24 25.02 40.9 17.4
1 18.94 5.29 1.40 8.5 9.2
7 0.00 0.00 0.00 0.0 0.0
28 0.00 0.00 0.00 0.0 0.0
59 0.00 0.00 0.00 0.0 0.0
90 0.00 0.00 0.00 0.0 0.0
Table A5_8: Dissipation of unlabeled florfenicol at 10°C in pig manure (mean and standard de-viation) based on predicted values (SFO kinetics)
Institute 6 Institute 6 Mean Standard
Day Replicate 1 Replicate 2 Deviation
0 49.38 49.45 49.42 0.05
0.02 48.85 49.00 48.93 0.11
0.17 45.02 45.76 45.39 0.52
1 28.66 31.33 30.00 1.89
3 9.65 12.57 11.11 2.06
7 1.10 2.03 1.56 0.66
14 0.02 0.08 0.05 0.04
21 0.00 0.00 0.00 0.00
28 0.00 0.00 0.00 0.00
49 0.00 0.00 0.00 0.00
70 0.00 0.00 0.00 0.00
90 0.00 0.00 0.00 0.00

Transformation of veterinary pharmaceuticals and biocides in (liquid) manure
86
Figure A5_26: Plots for transformation of imidacloprid in cattle manure, Institute 1, replicate 1. The measured values and the values calculated by means of applying the single first order kinetic model are shown for the parent compound imidacloprid and the transformation product TP1 (named as A1 in the nomenclature of the KinGUI soft-ware tool). A decrease of the parent compound can be seen accompanied by an in-crease of TP1. Furthermore, in the graph below, the difference between measured value and calculated value is given. Chi2-value (parent) is 14.9; chi2-value (TP1) is 17.7.
0 10 20 30 40 50 60 70 80 900
50
100
150
Time
Con
cent
ratio
n
Measured & Predicted vs. Time
ParentA1
0 10 20 30 40 50 60 70 80 90-20
-10
0
10
20
Time
Res
idua
ls
Residual Plot
ParentA1

Transformation of veterinary pharmaceuticals and biocides in (liquid) manure
87
Figure A5_27: Plots for transformation of imidacloprid in cattle manure, Institute 1, replicate 2. The measured values and the values calculated by means of applying the single first order kinetic model are shown for the parent compound imidacloprid and the transformation product TP1 (named as A1 in the nomenclature of the KinGUI soft-ware tool). A decrease of the parent compound can be seen accompanied by an in-crease of TP1. Furthermore, in the graph below, the difference between measured value and calculated value is given. Chi2-value (parent) is 12.8; chi2-value (TP1) is 16.8.
0 10 20 30 40 50 60 70 80 900
50
100
150
Time
Con
cent
ratio
n
Measured & Predicted vs. Time
ParentA1
0 10 20 30 40 50 60 70 80 90-20
-10
0
10
Time
Res
idua
ls
Residual Plot
ParentA1

Transformation of veterinary pharmaceuticals and biocides in (liquid) manure
88
Figure A5_28: Plots for transformation of imidacloprid in cattle manure, Institute 1, replicate 3. The measured values and the values calculated by means of applying the single first order kinetic model are shown for the parent compound imidacloprid and the transformation product TP1 (named as A1 in the nomenclature of the KinGUI soft-ware tool). A decrease of the parent compound can be seen accompanied by an in-crease of TP1. Furthermore, in the graph below, the difference between measured value and calculated value is given. Chi2-value (parent) is 12.0; chi2-value (TP1) is 16.5.
0 10 20 30 40 50 60 70 80 900
50
100
150
Time
Con
cent
ratio
n
Measured & Predicted vs. Time
ParentA1
0 10 20 30 40 50 60 70 80 90-20
-10
0
10
Time
Res
idua
ls
Residual Plot
ParentA1

Transformation of veterinary pharmaceuticals and biocides in (liquid) manure
89
Figure A5_29: Plots for transformation of imidacloprid in cattle manure, Institute 1, replicate 4. The measured values and the values calculated by means of applying the single first order kinetic model are shown for the parent compound imidacloprid and the transformation product TP1 (named as A1 in the nomenclature of the KinGUI soft-ware tool). A decrease of the parent compound can be seen accompanied by an in-crease of TP1. Furthermore, in the graph below, the difference between measured value and calculated value is given. Chi2-value (parent) is 13.3; chi2-value (TP1) is 19.4.
0 10 20 30 40 50 60 70 80 900
50
100
150
Time
Con
cent
ratio
n
Measured & Predicted vs. Time
ParentA1
0 10 20 30 40 50 60 70 80 90-20
-10
0
10
20
Time
Res
idua
ls
Residual Plot
ParentA1

Transformation of veterinary pharmaceuticals and biocides in (liquid) manure
90
Figure A5_30: Plots for transformation of imidacloprid in cattle manure, Institute 1, replicate 5. The measured values and the values calculated by means of applying the single first order kinetic model are shown for the parent compound imidacloprid and the transformation product TP1 (named as A1 in the nomenclature of the KinGUI soft-ware tool). A decrease of the parent compound can be seen accompanied by an in-crease of TP1. Furthermore, in the graph below, the difference between measured value and calculated value is given. Chi2-value (parent) is 12.7; chi2-value (TP1) is 15.8.
0 10 20 30 40 50 60 70 80 900
50
100
150
Time
Con
cent
ratio
n
Measured & Predicted vs. Time
ParentA1
0 10 20 30 40 50 60 70 80 90-20
-10
0
10
20
Time
Res
idua
ls
Residual Plot
ParentA1

Transformation of veterinary pharmaceuticals and biocides in (liquid) manure
91
Figure A5_31: Plots for transformation of imidacloprid in cattle manure, Institute 1, replicate 6. The measured values and the values calculated by means of applying the single first order kinetic model are shown for the parent compound imidacloprid and the transformation product TP1 (named as A1 in the nomenclature of the KinGUI soft-ware tool). A decrease of the parent compound can be seen accompanied by an in-crease of TP1. Furthermore, in the graph below, the difference between measured value and calculated value is given. Chi2-value (parent) is 14.0; chi2-value (TP1) is 16.4.
0 10 20 30 40 50 60 70 80 900
50
100
150
Time
Con
cent
ratio
n
Measured & Predicted vs. Time
ParentA1
0 10 20 30 40 50 60 70 80 90-20
-10
0
10
20
Time
Res
idua
ls
Residual Plot
ParentA1

Transformation of veterinary pharmaceuticals and biocides in (liquid) manure
92
Figure A5_32: Plots for transformation of imidacloprid in cattle manure, Institute 1, mean of repli-cates. The measured values and the values calculated by means of applying the single first order kinetic model are shown for the parent compound imidacloprid and the transformation product TP1 (named as A1 in the nomenclature of the KinGUI software tool). A decrease of the parent compound can be seen accompa-nied by an increase of TP1. Furthermore, in the graph below, the difference be-tween measured value and calculated value is given. Chi2-value (parent) is 12.9.
Table A5_9: Measured, predicted and residual values for transformation of the parent com-pound imidacloprid in cattle manure (Institute 1, mean of replicates, single first or-der kinetics)
Time Florfenicol (parent) Measured [%] Predicted [%] residual
0.0 109.9000 107.7284 2.1716
3.0 107.6000 97.8586 9.7414
7.0 91.3000 86.0909 5.2091
10.0 86.5000 78.2035 8.2965
14.0 70.4000 68.7994 1.6006
28.0 33.7000 43.9379 -10.2379
42.0 12.5000 28.0604 -15.5604
56.0 8.0000 17.9204 -9.9204
72.0 3.5000 10.7345 -7.2345
0 10 20 30 40 50 60 70 80 900
50
100
150
Time
Con
cent
ratio
n
Measured & Predicted vs. Time
ParentA1
0 10 20 30 40 50 60 70 80 90-20
-10
0
10
Time
Res
idua
ls
Residual Plot
ParentA1

Transformation of veterinary pharmaceuticals and biocides in (liquid) manure
93
90.0 2.4000 6.0311 -3.6311
Figure A5_33: Plots for transformation of imidacloprid in cattle manure, Institute 2, replicate 1. The measured values and the values calculated by means of applying the single first order kinetic model are shown for the parent compound imidacloprid and the transformation product TP1 (named as A1 in the nomenclature of the KinGUI soft-ware tool). A decrease of the parent compound can be seen accompanied by an in-crease of TP1. Furthermore, in the graph below, the difference between measured value and calculated value is given. Chi2-value (parent) is 9.0; chi2-value (TP1) is 9.1.
0 10 20 30 40 50 60 70 80 900
50
100
Time
Con
cent
ratio
n
Measured & Predicted vs. Time
ParentA1
0 10 20 30 40 50 60 70 80 90-20
-10
0
10
Time
Res
idua
ls
Residual Plot
ParentA1

Transformation of veterinary pharmaceuticals and biocides in (liquid) manure
94
Figure A5_34: Plots for transformation of imidacloprid in cattle manure, Institute 2, replicate 2. The measured values and the values calculated by means of applying the single first order kinetic model are shown for the parent compound imidacloprid and the transformation product TP1 (named as A1 in the nomenclature of the KinGUI soft-ware tool). A decrease of the parent compound can be seen accompanied by an in-crease of TP1. Furthermore, in the graph below, the difference between measured value and calculated value is given. Chi2-value (parent) is 10.5; chi2-value (TP1) is 9.7.
0 10 20 30 40 50 60 70 80 900
50
100
Time
Con
cent
ratio
n
Measured & Predicted vs. Time
ParentA1
0 10 20 30 40 50 60 70 80 90-20
-10
0
10
Time
Res
idua
ls
Residual Plot
ParentA1

Transformation of veterinary pharmaceuticals and biocides in (liquid) manure
95
Figure A5_35: Plots for transformation of imidacloprid in cattle manure, Institute 2, replicate 3. The measured values and the values calculated by means of applying the single first order kinetic model are shown for the parent compound imidacloprid and the transformation product TP1 (named as A1 in the nomenclature of the KinGUI soft-ware tool). A decrease of the parent compound can be seen accompanied by an in-crease of TP1. Furthermore, in the graph below, the difference between measured value and calculated value is given. Chi2-value (parent) is 10.2; chi2-value (TP1) is 7.7.
0 10 20 30 40 50 60 70 80 900
50
100
Time
Con
cent
ratio
n
Measured & Predicted vs. Time
ParentA1
0 10 20 30 40 50 60 70 80 90-10
-5
0
5
10
Time
Res
idua
ls
Residual Plot
ParentA1

Transformation of veterinary pharmaceuticals and biocides in (liquid) manure
96
Figure A5_36: Plots for transformation of imidacloprid in cattle manure, Institute 2, replicate 4. The measured values and the values calculated by means of applying the single first order kinetic model are shown for the parent compound imidacloprid and the transformation product TP1 (named as A1 in the nomenclature of the KinGUI soft-ware tool). A decrease of the parent compound can be seen accompanied by an in-crease of TP1. Furthermore, in the graph below, the difference between measured value and calculated value is given. Chi2-value (parent) is 9.7; chi2-value (TP1) is 8.2.
0 10 20 30 40 50 60 70 80 900
50
100
Time
Con
cent
ratio
n
Measured & Predicted vs. Time
ParentA1
0 10 20 30 40 50 60 70 80 90-20
-10
0
10
Time
Res
idua
ls
Residual Plot
ParentA1

Transformation of veterinary pharmaceuticals and biocides in (liquid) manure
97
Figure A5_37: Plots for transformation of imidacloprid in cattle manure, Institute 2, replicate 5. The measured values and the values calculated by means of applying the single first order kinetic model are shown for the parent compound imidacloprid and the transformation product TP1 (named as A1 in the nomenclature of the KinGUI soft-ware tool). A decrease of the parent compound can be seen accompanied by an in-crease of TP1. Furthermore, in the graph below, the difference between measured value and calculated value is given. Chi2-value (parent) is 17.9, chi2-value (TP1) is 16.4.
0 10 20 30 40 50 60 70 80 900
50
100
Time
Con
cent
ratio
n
Measured & Predicted vs. Time
ParentA1
0 10 20 30 40 50 60 70 80 90-40
-20
0
20
Time
Res
idua
ls
Residual Plot
ParentA1

Transformation of veterinary pharmaceuticals and biocides in (liquid) manure
98
Figure A5_38: Plots for transformation of imidacloprid in cattle manure, Institute 2, replicate 6. The measured values and the values calculated by means of applying the single first order kinetic model are shown for the parent compound imidacloprid and the transformation product TP1 (named as A1 in the nomenclature of the KinGUI soft-ware tool). A decrease of the parent compound can be seen accompanied by an in-crease of TP1. Furthermore, in the graph below, the difference between measured value and calculated value is given. Chi2-value (parent) is 17.8, chi2-value (TP1) is 32.1.
0 10 20 30 40 50 60 70 80 900
50
100
Time
Con
cent
ratio
n
Measured & Predicted vs. Time
ParentA1
0 10 20 30 40 50 60 70 80 90-60
-40
-20
0
20
Time
Res
idua
ls
Residual Plot
ParentA1

Transformation of veterinary pharmaceuticals and biocides in (liquid) manure
99
Figure A5_39: Plots for transformation of imidacloprid in cattle manure, Institute 2, mean of repli-cates. The measured values and the values calculated by means of applying the single first order kinetic model are shown for the parent compound imidacloprid and the transformation product TP1 (named as A1 in the nomenclature of the KinGUI software tool). A decrease of the parent compound can be seen accompa-nied by an increase of TP1. Furthermore, in the graph below, the difference be-tween measured value and calculated value is given. Chi2-value (parent) is 11.9.
Table A5_10: Measured, predicted and residual values for transformation of the parent com-pound imidacloprid in cattle manure (Institute 2, mean of replicates, single first or-der kinetics)
Time Florfenicol (parent) Measured [%] Predicted [%] residual
0.0 98.1000 90.7744 7.3256
3.0 89.9000 80.5445 9.3555
7.0 72.0000 68.6751 3.3249
10.0 60.9000 60.9358 -0.0358
14.0 54.8000 51.9560 2.8440
21.0 29.8000 39.3072 -9.5072
28.0 22.4000 29.7378 -7.3378
42.0 9.6000 17.0209 -7.4209
56.0 5.3000 9.7421 -4.4421
0 10 20 30 40 50 60 70 80 900
50
100
Time
Con
cent
ratio
n
Measured & Predicted vs. Time
ParentA1
0 10 20 30 40 50 60 70 80 90-20
-10
0
10
Time
Res
idua
ls
Residual Plot
ParentA1
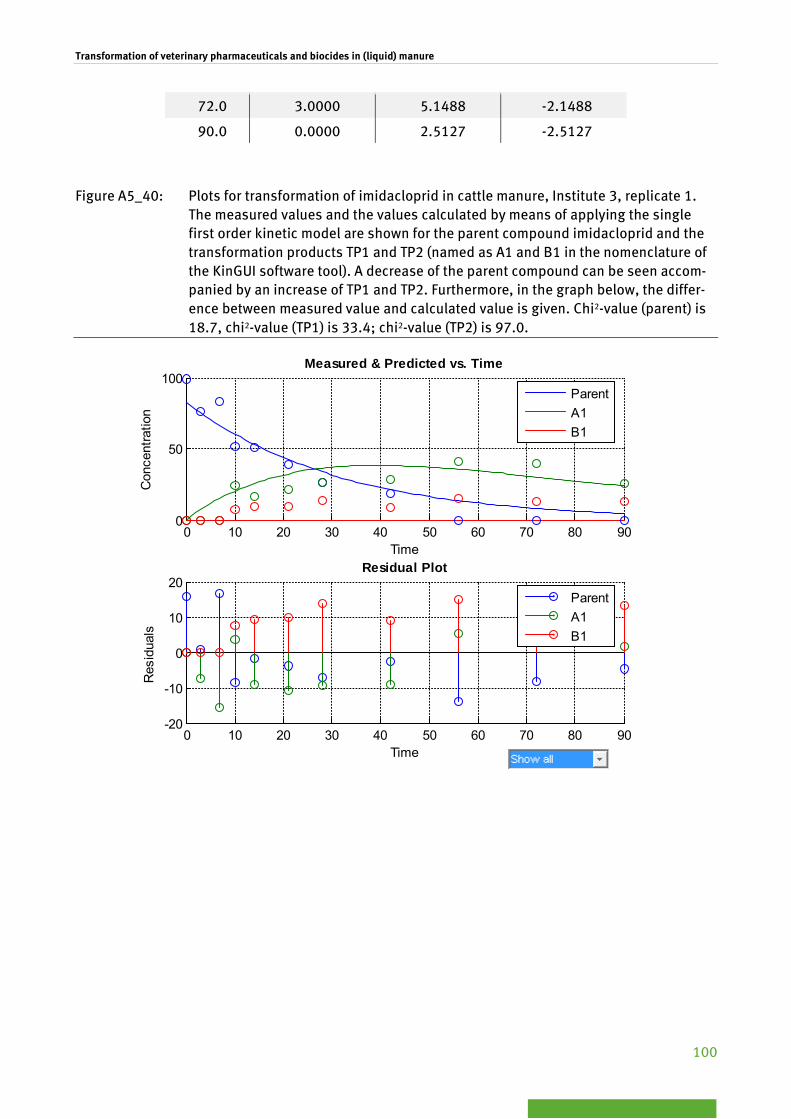
Transformation of veterinary pharmaceuticals and biocides in (liquid) manure
100
72.0 3.0000 5.1488 -2.1488
90.0 0.0000 2.5127 -2.5127
Figure A5_40: Plots for transformation of imidacloprid in cattle manure, Institute 3, replicate 1. The measured values and the values calculated by means of applying the single first order kinetic model are shown for the parent compound imidacloprid and the transformation products TP1 and TP2 (named as A1 and B1 in the nomenclature of the KinGUI software tool). A decrease of the parent compound can be seen accom-panied by an increase of TP1 and TP2. Furthermore, in the graph below, the differ-ence between measured value and calculated value is given. Chi2-value (parent) is 18.7, chi2-value (TP1) is 33.4; chi2-value (TP2) is 97.0.
0 10 20 30 40 50 60 70 80 900
50
100
Time
Con
cent
ratio
n
Measured & Predicted vs. Time
ParentA1B1
0 10 20 30 40 50 60 70 80 90-20
-10
0
10
20
Time
Res
idua
ls
Residual Plot
ParentA1B1

Transformation of veterinary pharmaceuticals and biocides in (liquid) manure
101
Figure A5_41: Plots for transformation of imidacloprid in cattle manure, Institute 3, replicate 2. The measured values and the values calculated by means of applying the single first order kinetic model are shown for the parent compound imidacloprid and the transformation products TP1 and TP2 (named as A1 and B1 in the nomenclature of the KinGUI software tool). A decrease of the parent compound can be seen accom-panied by an increase of TP1 and TP2. Furthermore, in the graph below, the differ-ence between measured value and calculated value is given. Chi2-value (parent) is 19.7, chi2-value (TP1) is 33.2; chi2-value (TP2) is 113.9.
0 10 20 30 40 50 60 70 80 900
50
100
Time
Con
cent
ratio
n
Measured & Predicted vs. Time
ParentA1B1
0 10 20 30 40 50 60 70 80 90-40
-20
0
20
40
Time
Res
idua
ls
Residual Plot
ParentA1B1

Transformation of veterinary pharmaceuticals and biocides in (liquid) manure
102
Figure A5_42: Plots for transformation of imidacloprid in cattle manure, Institute 3, mean of repli-cates. The measured values and the values calculated by means of applying the single first order kinetic model are shown for the parent compound imidacloprid and the transformation products TP1 and TP2 (named as A1 and B1 in the nomen-clature of the KinGUI software tool). A decrease of the parent compound can be seen accompanied by an increase of TP1 and TP2. Furthermore, in the graph be-low, the difference between measured value and calculated value is given. Chi2-value (parent) is 17.4.
Table A5_11: Measured, predicted and residual values for transformation of the parent com-pound imidacloprid in cattle manure (Institute 3, mean of replicates, single first or-der kinetics)
Time Florfenicol (parent) Measured [%] Predicted [%] residual
0.0 97.3000 82.9211 14.3789
3.0 80.4000 75.1935 5.2065
7.0 76.8000 65.9985 10.8015
10.0 55.2000 59.8479 -4.6479
14.0 51.7000 52.5295 -0.8295
21.0 38.0000 41.8092 -3.8092
28.0 28.3000 33.2768 -4.9768
42.0 9.4000 21.0804 -11.6804
56.0 0.0000 13.3542 -13.3542
0 10 20 30 40 50 60 70 80 900
50
100
Time
Con
cent
ratio
n
Measured & Predicted vs. Time
ParentA1B1
0 10 20 30 40 50 60 70 80 90-20
-10
0
10
20
Time
Res
idua
ls
Residual Plot
ParentA1B1

Transformation of veterinary pharmaceuticals and biocides in (liquid) manure
103
72.0 0.0000 7.9256 -7.9256
90.0 0.0000 4.4068 -4.4068
Figure A5_43: Plots for transformation of imidacloprid in cattle manure, Institute 4, replicate 1. The measured values and the values calculated by means of applying the single first order kinetic model are shown for the parent compound imidacloprid and the transformation product TP1 (named as A1 in the nomenclature of the KinGUI soft-ware tool). A decrease of the parent compound can be seen accompanied by a low increase of TP1. Furthermore, in the graph below, the difference between measured value and calculated value is given. Chi2-value (parent) is 6.2, chi2-value (TP1) is 60.7.
0 10 20 30 40 50 60 70 80 900
20
40
60
80
Time
Con
cent
ratio
n
Measured & Predicted vs. Time
ParentA1
0 10 20 30 40 50 60 70 80 90 100-5
0
5
10
Time
Res
idua
ls
Residual Plot
ParentA1

Transformation of veterinary pharmaceuticals and biocides in (liquid) manure
104
Figure A5_44: Plots for transformation of imidacloprid in cattle manure, Institute 4, replicate 2. The measured values and the values calculated by means of applying the single first order kinetic model are shown for the parent compound imidacloprid and the transformation product TP1 (named as A1 in the nomenclature of the KinGUI soft-ware tool). A decrease of the parent compound can be seen accompanied by a low increase of TP1. Furthermore, in the graph below, the difference between measured value and calculated value is given. Chi2-value (parent) is 8.8, chi2-value (TP1) is 63.8.
0 10 20 30 40 50 60 70 80 900
20
40
60
80
Time
Con
cent
ratio
n
Measured & Predicted vs. Time
ParentA1
0 10 20 30 40 50 60 70 80 90 100-20
-10
0
10
Time
Res
idua
ls
Residual Plot
ParentA1

Transformation of veterinary pharmaceuticals and biocides in (liquid) manure
105
Figure A5_45: Plots for transformation of imidacloprid in cattle manure, Institute 4, replicate 3. The measured values and the values calculated by means of applying the single first order kinetic model are shown for the parent compound imidacloprid and the transformation product TP1 (named as A1 in the nomenclature of the KinGUI soft-ware tool). A decrease of the parent compound can be seen accompanied by a low increase of TP1. Furthermore, in the graph below, the difference between measured value and calculated value is given. Chi2-value (parent) is 10.3, chi2-value (TP1) is 54.1.
0 10 20 30 40 50 60 70 80 900
20
40
60
80
Time
Con
cent
ratio
n
Measured & Predicted vs. Time
ParentA1
0 10 20 30 40 50 60 70 80 90 100-20
-10
0
10
Time
Res
idua
ls
Residual Plot
ParentA1

Transformation of veterinary pharmaceuticals and biocides in (liquid) manure
106
Figure A5_46: Plots for transformation of imidacloprid in cattle manure, Institute 4, mean of repli-cates. The measured values and the values calculated by means of applying the single first order kinetic model are shown for the parent compound imidacloprid and the transformation product TP1 (named as A1 in the nomenclature of the KinGUI software tool). A decrease of the parent compound can be seen accompa-nied by an increase of TP1. Furthermore, in the graph below, the difference be-tween measured value and calculated value is given. Chi2-value (parent) is 6.9.
Table A5_12: Measured, predicted and residual values for transformation of the parent com-pound imidacloprid in cattle manure (Institute 4, mean of replicates, single first or-der kinetics)
Time Florfenicol (parent) Measured [%] Predicted [%] residual
0.0 65.6500 64.7628 0.8872
2.0 55.0000 62.5619 7.5619
6.0 62.1000 58.3821 3.7179
9.0 57.9100 55.4315 2.4785
14.0 54.2500 50.8415 3.4085
22.0 41.7200 44.2749 -2.5549
29.0 43.7500 39.2288 4.5212
42.0 29.9300 31.3333 -1.4033
56.0 21.0800 24.5980 -3.5180
0 10 20 30 40 50 60 70 80 900
20
40
60
80
Time
Con
cent
ratio
n
Measured & Predicted vs. Time
ParentA1
0 10 20 30 40 50 60 70 80 90 100-10
-5
0
5
Time
Res
idua
ls
Residual Plot
ParentA1

Transformation of veterinary pharmaceuticals and biocides in (liquid) manure
107
70.0 20.6600 19.3105 1.3495
91.0 10.4800 13.4318 -2.9518

Transformation of veterinary pharmaceuticals and biocides in (liquid) manure
108
Table A5_13: Overview on chi2-values of all replicates and measurements for the parent com-pound imidacloprid (SFO-kinetics)
Test substance Imidacloprid (parent) Institute 1 2 3 4
Replicate 1 14.942 8.954 18.678 6.245
Replicate 2 12.750 10.505 19.685 8.825
Replicate 3 12.040 10.182 n.a. 10.302
Replicate 4 13.270 9.683 n.a. n.a.
Replicate 5 12.736 17.926 n.a. n.a.
Replicate 6 13.984 17.796 n.a. n.a.
N 6 6 2 3
Mean 13.287 12.508 19.182 8.457
SD 1.037 4.180 0.712 2.053
COV (%) 7.801 33.417 3.712 24.279
Minimum 8.457
Maximum 19.182
Overall mean 13.358
Overall SD 4.422
Overall COV (%) 33.102
n.a. = not analyzed
Table A5_14: Dissipation of imidacloprid at 20°C in cattle manure (overall mean and standard deviation) based on predicted values (SFO kinetics)
Institute 1 Institute 2 Institute 3 Institute 4 Overall Standard
Day Mean Mean Mean Mean Mean Deviation
0 107.73 90.77 82.92 64.76 86.5 17.8
3 97.86 80.54 75.19 62.56 79.0 14.6
7 86.09 68.68 66.00 58.38 69.8 11.7
10 78.20 60.94 59.85 55.43 63.6 10.0
14 68.80 51.96 52.53 50.84 56.0 8.5
21 n.d. 39.31 41.81 44.27 41.8 2.5
28 43.94 29.74 33.28 39.23 36.5 6.3
42 28.06 17.02 21.08 31.33 24.4 6.5
56 17.92 9.74 13.35 24.60 16.4 6.4
72 10.73 5.15 7.93 19.31 10.8 6.1
90 6.03 2.51 4.41 13.43 6.6 4.8
n.d. = not determined

Transformation of veterinary pharmaceuticals and biocides in (liquid) manure
109
Annex 5
List of Participants
Technical Workshops and SETAC-Meetings

Transformation of veterinary pharmaceuticals and biocides in (liquid) manure
110
Table A5: List of participants at the technical workshops and the SETAC-Meetings
Work-shops
SETAC-Meetings
Name Institution Country 2013
Fl
örsh
eim
20
14
Gie
ssen
20
12
Berl
in
2013
G
lasg
ow
2014
Ba
sel
2015
Ba
rcel
ona
Adler, Nicole Umweltbundesamt Germany
X
Aikens, Peter Huntingdon Life Sciences UK
X
Atorf, Cornelia Fraunhofer IME Germany X
X
Berkner, Silvia Umweltbundesamt Germany X X X X X
Bicker, Su-daporn
Ibacon GmbH Germany X X
X X
Blanckenhorn, Wolf
Univerity Zurich Switzerland
X
Düring, Rolf-Alexander
Universität Giessen Germany X X
X
Fiebig, Silke Dr.U.Noack-Laboratorien Germany
X
X X X
Floeter, Carolin Hamburg Applied University Germany
X
Förster, Bern-hard
ECT Oekotoxikologie GmbH Germany
X
Ganssmann, Matthias
Ibacon GmbH Germany
X X
Gassen, Mi-chael
Harlan Laboratories Ltd. Switzerland
X
Gilberg, Daniel ECT Oekotoxikologie GmbH Germany X
Hahn, Stefan Fraunhofer ITEM Germany
X
Hellstern, Jutta Eurofins Agroscience Ser-vices EcoChem GmbH
Germany
X
Hennecke, Di-eter
Fraunhofer IME Germany X X X
X
Herrchen, Monika
Fraunhofer IME Germany X X X
X
Heusner, Elena ECT Oekotoxikologie GmbH Germany X X
X
Hickmann, Silke
Umweltbundesamt Germany
X
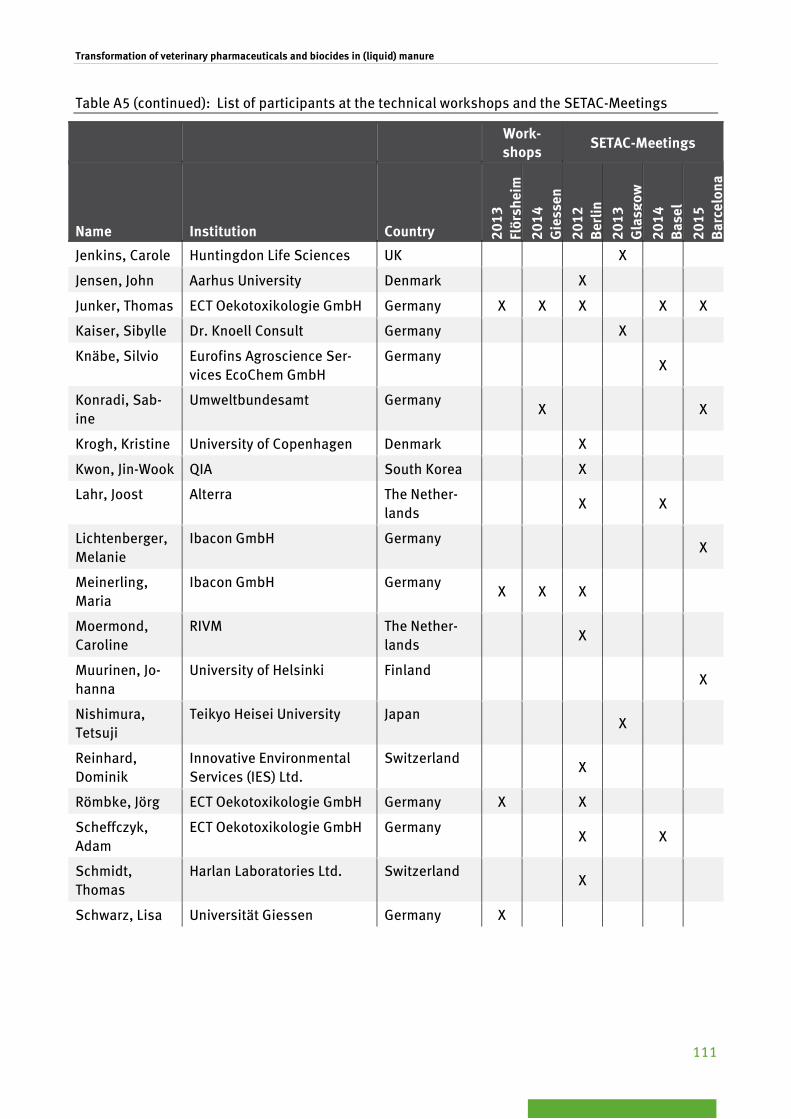
Transformation of veterinary pharmaceuticals and biocides in (liquid) manure
111
Table A5 (continued): List of participants at the technical workshops and the SETAC-Meetings
Work-shops
SETAC-Meetings
Name Institution Country 2013
Fl
örsh
eim
20
14
Gie
ssen
20
12
Berl
in
2013
G
lasg
ow
2014
Ba
sel
2015
Ba
rcel
ona
Jenkins, Carole Huntingdon Life Sciences UK
X
Jensen, John Aarhus University Denmark
X
Junker, Thomas ECT Oekotoxikologie GmbH Germany X X X
X X
Kaiser, Sibylle Dr. Knoell Consult Germany
X
Knäbe, Silvio Eurofins Agroscience Ser-vices EcoChem GmbH
Germany
X
Konradi, Sab-ine
Umweltbundesamt Germany
X
X
Krogh, Kristine University of Copenhagen Denmark
X
Kwon, Jin-Wook QIA South Korea
X
Lahr, Joost Alterra The Nether-lands
X
X
Lichtenberger, Melanie
Ibacon GmbH Germany
X
Meinerling, Maria
Ibacon GmbH Germany X X X
Moermond, Caroline
RIVM The Nether-lands
X
Muurinen, Jo-hanna
University of Helsinki Finland
X
Nishimura, Tetsuji
Teikyo Heisei University Japan
X
Reinhard, Dominik
Innovative Environmental Services (IES) Ltd.
Switzerland
X
Römbke, Jörg ECT Oekotoxikologie GmbH Germany X
X
Scheffczyk, Adam
ECT Oekotoxikologie GmbH Germany
X
X
Schmidt, Thomas
Harlan Laboratories Ltd. Switzerland
X
Schwarz, Lisa Universität Giessen Germany X
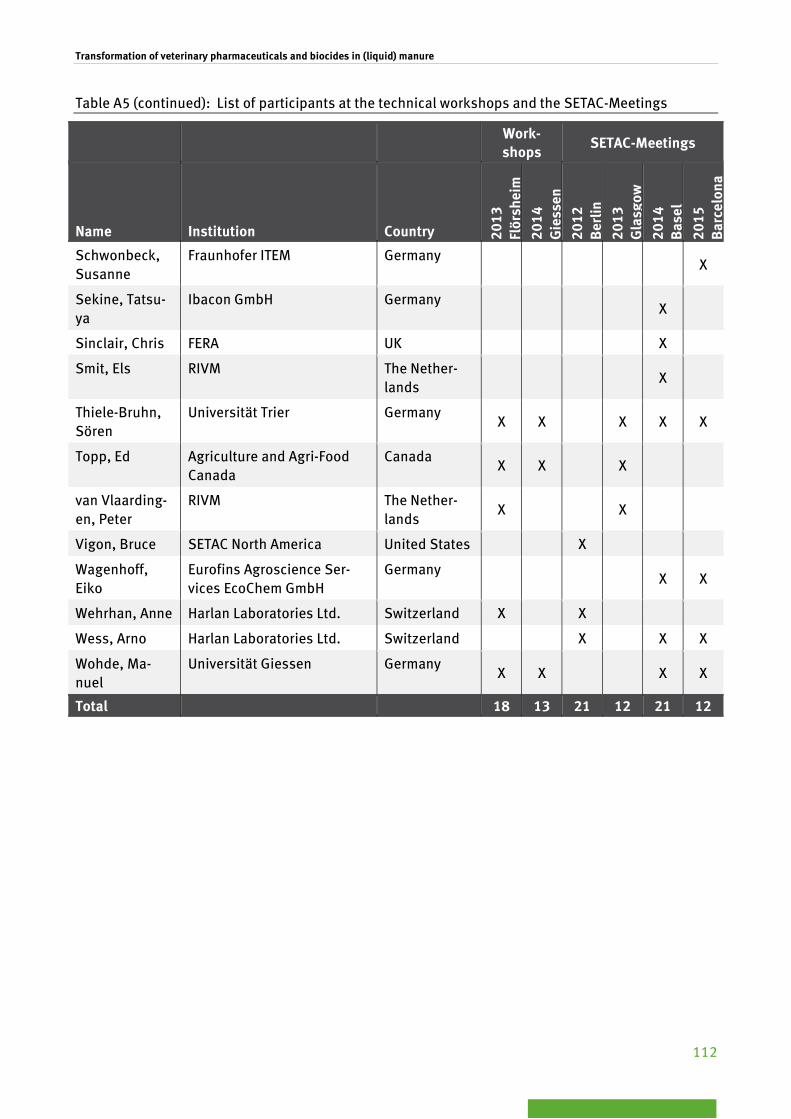
Transformation of veterinary pharmaceuticals and biocides in (liquid) manure
112
Table A5 (continued): List of participants at the technical workshops and the SETAC-Meetings
Work-shops
SETAC-Meetings
Name Institution Country 2013
Fl
örsh
eim
20
14
Gie
ssen
20
12
Berl
in
2013
G
lasg
ow
2014
Ba
sel
2015
Ba
rcel
ona
Schwonbeck, Susanne
Fraunhofer ITEM Germany
X
Sekine, Tatsu-ya
Ibacon GmbH Germany
X
Sinclair, Chris FERA UK
X
Smit, Els RIVM The Nether-lands
X
Thiele-Bruhn, Sören
Universität Trier Germany X X
X X X
Topp, Ed Agriculture and Agri-Food Canada
Canada X X
X
van Vlaarding-en, Peter
RIVM The Nether-lands
X
X
Vigon, Bruce SETAC North America United States
X
Wagenhoff, Eiko
Eurofins Agroscience Ser-vices EcoChem GmbH
Germany
X X
Wehrhan, Anne Harlan Laboratories Ltd. Switzerland X
X
Wess, Arno Harlan Laboratories Ltd. Switzerland
X
X X
Wohde, Ma-nuel
Universität Giessen Germany X X
X X
Total 18 13 21 12 21 12

Transformation of veterinary pharmaceuticals and biocides in (liquid) manure
113
Annex 6
List of Publications

Transformation of veterinary pharmaceuticals and biocides in (liquid) manure
114
PUBLICATIONS
Schwarz, L. (2014). Masterarbeit Lisa Schwartz „Transformation von Tierarzneimitteln und Bioziden in Gülle – Eine Litera-
turstudie. UBA-Texte 54/2014. Umweltbundesamt, Dessau-Roßlau, Germany. Available at:
https://www.umweltbundesamt.de/publikationen/transformation-von-tierarzneimitteln-bioziden-in.
Hennecke, D., Atorf, C., Bickert, C., Herrchen, M., Hommen, U., Klein, M., Weinfurtner, K., Heusner, E., Knacker, T., Junker,
T., Römbke, J., Merrettig-Bruns, U. (2015): Development of a test protocol to study the transformation of veterinary pharma-
ceuticals and biocides in liquid manure. Available at: www.umweltbundesamt.de
Düring, R.-A., Wohde, M., Junker, T., Hennecke, D., Herrchen, M., Thiele-Bruhn, S. (2016). Harmonization of experimental
exposure assessment for veterinary pharmaceuticals and biocides: Literature review of studies on occurrence and trans-
formation of veterinary pharmaceuticals and biocides in manure. Available at: www.umweltbundesamt.de
Herrchen, M., Hennecke, D., Junker, T., Düring, R.-A., Thiele-Bruhn, S. (2016). Harmonization of experimental exposure
assessment for veterinary pharmaceuticals and biocides: influence of different experimental setups on observed minerali-
zation. Available at: www.umweltbundesamt.de
POSTER PRESENTATIONS
Hennecke, D., Herrchen, M., Atorf, C., Junker, T., Berkner, S. (2012). Development of an experimental guideline for testing transformation of veterinary pharmaceuticals and biocides in liquid manure. 6th SETAC World Congress / SETAC Europe 22nd Annual Meeting, Berlin, 20- 24 May 2012
Heusner, E., Junker, T. (2013): Pre-validation of an experimental method for testing the transformation of 14C-labelled veter-
inary pharmaceuticals and biocides in liquid manure. Poster presentation. 3rd Young Environmental Scientists Meeting, 11-
13 February 2013, Krakow, Poland.
Herrchen, M., Hennecke, D., Atorf, C., Junker, T., Düring, R., Berkner, S., Konradi, S. (2014). Experimental test guidance for
transformation of veterinary pharmaceuticals and biocides in liquid manure – robustness test. Poster presentation. SETAC
Europe 24th Annual Meeting, 11-15 May 2014, Basel, Switzerland.
Junker, T., Heusner, E., Römbke, J., Gilberg, D., Gräf, W., Ferreira, P., Herrchen, M., Hennecke, D., Atorf, C., Berkner, S.,
Konradi, S. (2014). Transformation of veterinary pharmaceuticals and biocides in (liquid) manure – ring test. Poster presen-
tation. SETAC Europe 24th Annual Meeting, 11-15 May 2014, Basel, Switzerland.
ORAL PRESENTATIONS
Berkner, S., Rechenberg, B. (2010). The Fate of Veterinary Pharmaceuticals in Manure in the European Environmental Risk
Assessment (ERA). SETAC North America 31st Annual Meeting, 7-11 November, Portland, Oregon, USA.
Herrchen, M. (2014). Testing transformation of veterinary medicinal products (VMP) in soil and manure – Experimental
setup and evaluation of data. Informa Life Sciences’ 9th Annual Conference on Regulation of Veterinary Medicines in Europe,
Barcelona, Spain, 09 – 10 September 2014, Focus Day: 11 September 2014