Embed Size (px)
Citation preview
HARISCHANDRA MILLS PLC.
FOR THE NINE MONTHS ENDED 31 DECEMBER 2017
INTERIM FINANCIAL STATEMENTS

HARISCHANDRA MILLS PLC
INTERIM FINANCIAL STATEMENTS
For the nine months ended 31 December 2017
Legal form Subsidiary company
A Public Company with Limited Liability Harischandra Mills (Distributors) Limited
incorporated in Sri Lanka, whose shares (wholly owned) incorporated in Sri Lanka
are Listed in the Colombo Stock Exchange.
Registration No. Board of Directors
PQ 225 Bastiansz M.A. (Chairman)
Samarasinghe S.N. (Managing Director)
Date of incorporation De Silva G.S.V.
9th January 1953 De Silva M.P. (Mrs.)
Bandaranayake T.K.
Registered office Jayasundara S. A S.
No. 11, C.A.Harischandra Mawatha, Matara. Samarasinghe R.K (Mrs.)
Secretaries Remuneration Committee
Corporate Services (Pvt) Limited. Bastiansz M.A. (Chairman)
216, De Saram Place, Jayasundara S. A S.
Colombo 10
Auditors Audit Committee
KPMG Bandaranayake T.K.
(Chartered Accountants) Jayasundara S. A S.
32A, Sir Mohamed Macan Markar Mawatha,
Colombo 3.
Internal auditors Related Party Transactions Review
Ernst & Young Committee
(Chartered Accountants) Bastiansz M.A. (Chairman)
201, De Saram Place, Jayasundara S. A S.
Colombo 10 Samarasinghe S.N.
Legal advisors
F J & G De Saram
Attorneys - at - Law
216, De Saram Place,
Colombo 10
CORPORATE INFORMATION
1

HARISCHANDRA MILLS PLC
INTERIM FINANCIAL STATEMENTS
For the nine months ended 31 December 2017
INCOME STATEMENT
GROUP
Year Ended
31 March
(Audited)
2017 2016 VARIANCE 2017 2016 VARIANCE 2017
Rs. '000 Rs. '000 % Rs. '000 Rs. '000 % Rs. '000
Revenue 842,588 772,158 9 2,319,209 2,216,573 5 3,003,824
-
Cost of sales (653,918) (614,954) 6 (1,841,382) (1,788,165) 3 (2,408,376)
Gross profit 188,670 157,204 20 477,827 428,408 12 595,448
21% 0
Other income 7,839 2,642 197 13,498 30,030 (55) 38,912
196,509 159,846 23 491,325 458,438 7 634,360
Administrative expenses (63,335) (57,658) 10 (180,530) (165,449) 9 (216,627)
Selling & distribution expenses (78,225) (61,309) 28 (194,849) (183,266) 6 (252,064)
Result from operating activities 54,949 40,879 34 115,946 109,723 6 165,669
Finance income 4,369 4,764 (8) 15,537 14,134 10 19,894
Finance expenses (1,408) (2,287) (38) (5,552) (4,199) 32 (6,487)
Net finance income/(expenses) 2,961 2,477 20 9,985 9,935 1 13,407
Profit from ordinary activities before tax 57,910 43,356 34 125,931 119,658 5 179,076
Income tax expenses (18,185) (12,140) 50 (37,231) (25,804) 44 (53,930)
Profit after taxation attributable to shareholders of
Harischandra Mills PLC 39,725 31,216 88,700 93,854 125,146
Rs. Rs. Rs. Rs. Rs.
Basic/Diluted Earnings per Share 20.69 32.52 46.21 97.78 130.39
Notes :
The above figures are provisional and subject to audit.
Figures in brackets indicate deductions.
All values are in Rs.'000, unless otherwise stated.
Quarter Ended
31 December 31 December
Nine Months Ended
2

HARISCHANDRA MILLS PLC
INTERIM FINANCIAL STATEMENTS
For the nine months ended 31 December 2017
STATEMENT OF COMPREHENSIVE INCOME
GROUP
Year Ended
31 March
(Audited)
2017 2016 VARIANCE 2017 2016 VARIANCE 2017
Rs. '000 Rs. '000 % Rs. '000 Rs. '000 % Rs. '000
Profit for the period 39,725 31,216 27 88,700 93,854 (5) 125,146
Other comprehensive income
Gain/(Loss) on fair valuation of Financial Assets (638) (1,634) (61) 2,344 4,500 (48) 2,669
Actuarial loss from Re- measurement of employee
benefit obligation - - - - - - 8,111
Related Taxes - - - - - - (2,271)
Other comprehensive income for the period (638) (1,634) (61) 2,344 4,500 (48) 8,509
Total comprehensive income for the period 39,087 29,582 32 91,044 98,354 (7) 133,655
Notes :
The above figures are provisional and subject to audit.
Figures in brackets indicate deductions.
All values are in Rs.'000, unless otherwise stated.
`
31 December 31 December
Nine months endedQuarter Ended
3
HARISCHANDRA MILLS PLC
INTERIM FINANCIAL STATEMENTS
As at 31 December 2017
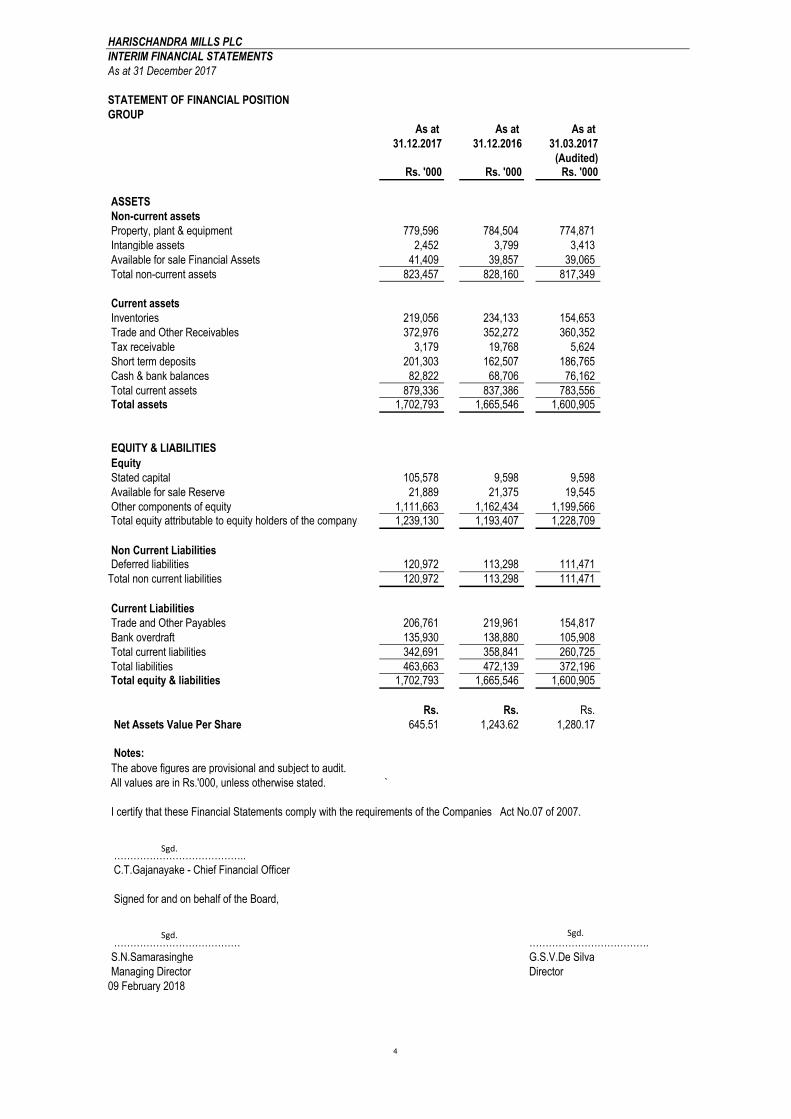
STATEMENT OF FINANCIAL POSITION
GROUP
As at As at As at
31.12.2017 31.12.2016 31.03.2017
(Audited)Rs. '000 Rs. '000 Rs. '000
ASSETS
Non-current assets
Property, plant & equipment 779,596 784,504 774,871
Intangible assets 2,452 3,799 3,413
Available for sale Financial Assets 41,409 39,857 39,065
Total non-current assets 823,457 828,160 817,349
Current assets
Inventories 219,056 234,133 154,653
Trade and Other Receivables 372,976 352,272 360,352
Tax receivable 3,179 19,768 5,624
Short term deposits 201,303 162,507 186,765
Cash & bank balances 82,822 68,706 76,162
Total current assets 879,336 837,386 783,556 Total assets 1,702,793 1,665,546 1,600,905
EQUITY & LIABILITIES
Equity
Stated capital 105,578 9,598 9,598
Available for sale Reserve 21,889 21,375 19,545
Other components of equity 1,111,663 1,162,434 1,199,566 Total equity attributable to equity holders of the company 1,239,130 1,193,407 1,228,709
Non Current LiabilitiesDeferred liabilities 120,972 113,298 111,471
Total non current liabilities 120,972 113,298 111,471
Current Liabilities
Trade and Other Payables 206,761 219,961 154,817
Bank overdraft 135,930 138,880 105,908
Total current liabilities 342,691 358,841 260,725
Total liabilities 463,663 472,139 372,196 Total equity & liabilities 1,702,793 1,665,546 1,600,905
Rs. Rs. Rs.
Net Assets Value Per Share 645.51 1,243.62 1,280.17
Notes:
The above figures are provisional and subject to audit.
All values are in Rs.'000, unless otherwise stated. `
I certify that these Financial Statements comply with the requirements of the Companies Act No.07 of 2007.
…………………………………..
C.T.Gajanayake - Chief Financial Officer
Signed for and on behalf of the Board,
………………………………… ……………………………….
S.N.Samarasinghe G.S.V.De Silva
Managing Director Director
09 February 2018
Sgd. Sgd.
Sgd.
4

HARISCHANDRA MILLS PLC
INTERIM FINANCIAL STATEMENTS
For the nine months ended 31 December 2017
INCOME STATEMENT
COMPANY
Year Ended
31 March
(Audited)
2017 2016 VARIANCE 2017 2016 VARIANCE 2017
Rs. '000 Rs. '000 % Rs. '000 Rs. '000 % Rs. '000
Revenue 842,588 772,158 9 2,319,209 2,216,573 5 3,003,824
Cost of sales (653,918) (614,954) 6 (1,841,382) (1,788,165) 3 (2,408,376)
Gross profit 188,670 157,204 20 477,827 428,408 12 595,448
Other operating income 7,839 2,642 197 82,797 99,330 (17) 108,211
196,509 159,846 23 560,624 527,738 6 703,659
Administrative expenses (63,296) (57,656) 10 (180,489) (165,374) 9 (216,204)
Selling & distribution expenses (78,225) (61,309) 28 (194,849) (183,266) 6 (252,064)
Profit from operating activities 54,988 40,881 35 185,286 179,098 3 235,391
Finance income 4,369 4,763 (8) 15,537 14,134 10 19,894
Finance expenses (4,034) (7,147) (44) (17,738) (20,922) (15) (27,976)
Net finance income 335 (2,384) (114) (2,201) (6,788) (68) (8,082)
Profit from ordinary activities before tax 55,323 38,497 44 183,085 172,310 6 227,309
Income tax expenses (15,490) (10,779) 44 (51,264) (48,247) 6 (40,690)
39,833 27,718 131,821 124,063 186,619
Rs. Rs. Rs. Rs. Rs.
Basic/Diluted Earnings per Share 20.75 28.88 68.67 129.26 194.44
Notes :
The above figures are provisional and subject to audit.
Figures in brackets indicate deductions.
All values are in Rs.'000, unless otherwise stated.
Profit after taxation attributable to
shareholders of Harischandra Mills PLC
Quarter Ended
31 December
Nine months ended
31 December
5

HARISCHANDRA MILLS PLC
INTERIM FINANCIAL STATEMENTS
For the nine months ended 31 December 2017
STATEMENT OF COMPREHENSIVE INCOME
COMPANY
Year Ended
31 March
(Audited)
2017 2016 VARIANCE 2017 2016 VARIANCE 2017
Rs. '000 Rs. '000 % Rs. '000 Rs. '000 % Rs. '000
Profit for the period 39,833 27,718 44 131,821 124,063 6 186,619
Other comprehensive income
Gain/(Loss) on fair valuation of Financial Assets (638) (1,634) (61) 2,344 4,500 (48) 2,669
Actuarial loss from Re- measurement of employee
benefit obligation - - - - - - 8,111
Related Taxes - - - - - - (2,271)
Other comprehensive income for the period (638) (1,634) (61) 2344 4,500 (48) 8,509
Total comprehensive income for the period 39,195 26,084 50 134,165 128,563 4 195,128
Notes :
The above figures are provisional and subject to audit.
Figures in brackets indicate deductions.
All values are in Rs.'000, unless otherwise stated.
Nine months endedQuarter Ended
31 December 31 December
6

HARISCHANDRA MILLS PLC
INTERIM FINANCIAL STATEMENTS
As at 31 December 2017
STATEMENT OF FINANCIAL POSITION
COMPANY
As at As at As at
31.12.2017 31.12.2016 31.03.2017(Audited)
Rs. '000 Rs. '000 Rs. '000
ASSETS
Non-current assets
Property, plant & equipment 779,596 784,504 774,871
Intangible assets 2,452 3,799 3,413
Available for sale Financial Assets 41,409 39,857 39,065
Total non-current assets 823,457 828,160 817,349
Current assets
Inventories 219,056 234,133 154,653
Trade and Other Receivables 372,976 352,272 360,352
Tax Recoverable - - 6,746
Short term deposits 201,303 162,507 186,765
Cash & bank balances 82,683 68,529 75,302
Total current assets 876,018 817,441 783,818
Total assets 1,699,475 1,645,601 1,601,167
EQUITY & LIABILITIES
Equity
Stated Capital 105,578 9,598 9,598
Available for sale Reserve 21,889 21,375 19,545
Other components of equity 1,002,790 979,176 1,047,572
Total equity attributable to equity holders of the 1,130,257 1,010,149 1,076,715
company
Non current liabilities
Deferred liabilities 120,972 113,298 111,471
Amounts due to subsidiary 4,033 72,094 75,396
Total non current liabilities 125,005 185,392 186,867
Current liabilities
Trade and Other Payables 206,812 220,015 154,677
Amounts due to subsidiary 77,000 77,000 77,000
Provision for taxation 24,471 14,165 -
Bank overdraft 135,930 138,880 105,908
Total current liabilities 444,213 450,060 337,585
Total liabilities 569,218 635,452 524,452
Total equity & liabilities 1,699,475 1,645,601 1,601,167
Rs. Rs. Rs.
Net assets value per share 588.80 1,052.46 1,121.81
Notes:
The above figures are provisional and subject to audit.
All values are in Rs.'000, unless otherwise stated. `
I certify that these Financial Statements comply with the requirements of the Companies Act No.07 of 2007.
…………………………………..
C.T.Gajanayake - Chief Financial Officer
Signed for and on behalf of the Board,
………………………………… ……………………………….
S.N.Samarasinghe G.S.V.De Silva
Managing Director Director
09 February 2018
Sgd. Sgd.
Sgd.
7

INTERIM FINANCIAL STATEMENTS
For the nine months ended 31 December 2017
Rs.'000 Rs.'000 Rs.'000 Rs.'000 Rs.'000 Rs.'000 Rs.'000 Rs.'000
Group
Balance as at 01 April 9,598 19,545 1,199,566 1,228,709 9,598 16,875 1,150,164 1,176,637
Retained profit for the Six months - - 48,975 48,975 - - 62,637 62,637
Capitalization of reserves 95,980 - (95,980)
Interim Dividend - - (38,392) (38,392) - - (38,392) (38,392)
Final Dividend (42,231) (42,231) (43,191) (43,191)
Other Comprehensive Income - 2,982 - 2,982 - 6,134 - 6,134
Balance as at 30 September 105,578 22,527 1,071,938 1,200,043 9,598 23,009 1,131,218 1,163,825
Retained profit for the Three months - - 39,725 39,725 - - 31,216 31,216
Other Comprehensive Income - (638) - (638) - (1,634) - (1,634)
Balance as at 31 December 105,578 21,889 1,111,663 1,239,130 9,598 21,375 1,162,434 1,193,407
Company
Balance as at 01 April 9,598 19,545 1,047,572 1,076,715 9,598 16,875 936,696 963,169
Retained profit for the Six months - - 91,989 91,989 - - 96,345 96,345
Capitalization of reserves 95,980 (95,980)
Interim Dividend - - (38,392) (38,392) - - (38,392) (38,392)
Final Dividend (42,231) (42,231) (43,191) (43,191)
Other Comprehensive Income - 2,982 - 2,982 - 6,134 - 6,134
Balance as at 30 September 105,578 22,527 962,958 1,091,063 9,598 23,009 951,458 984,065
Retained profit for the Three months - - 39,833 39,833 - - 27,718 27,718
Other Comprehensive Income - (638) - (638) - (1,634) - (1,634)
Balance as at 31 December 105,578 21,889 1,002,790 1,130,257 9,598 21,375 979,176 1,010,149
Notes :
The above figures are provisional and subject to audit.
Figures in brackets indicate deductions.
All values are in Rs.'000, unless otherwise stated.
Total Equity
Stated
Capital
Reserve on
available for
sale
Financial
Assets
Other
Reserves Total Equity
STATEMENTS OF CHANGES IN EQUITY
2017 2016
Stated
Capital
Reserve on
available for
sale
Financial
Assets
Other
Reserves
8

HARISCHANDRA MILLS PLC
INTERIM FINANCIAL STATEMENTS
For the nine months ended 31 December 2017
Company Group Company Group
Rs. '000 Rs. '000 Rs. '000 Rs. '000
Cash flows from operating activities
Net profit before taxation 183,085 125,931 172,310 119,658
Adjustment for
Provision for gratuity (Net of Payment) 9,501 9,501 7,782 7,782
Depreciation & amortization 62,702 62,702 60,314 60,314
Net interest income 2,201 (9,985) 6,788 (9,935)
(Profit)/Loss on sale of property, plant & equipment (4,872) (4,872) (22,886) (22,886)
Operating profit before working capital changes 252,617 183,277 224,308 154,933
Change in working capital
Change in inventories (64,403) (64,403) (72,573) (72,573)
Change in receivables (12,624) (12,624) (46,337) (46,337)
Change in payables (19,227) 51,946 5,504 70,680
Cash generated from operations 156,363 158,196 110,902 106,703
Income tax paid (20,047) (34,787) (44,103) (56,450)
Net cash flows from operating activities 136,316 123,409 66,799 50,253
Cash flows used in investing activities
Interest received (net) (2,201) 9,985 (6,788) 9,935
Proceeds from sale of property, plant & equipment 5,794 5,794 23,434 23,434
Acquisition of property, plant & equipment (67,389) (67,389) (98,296) (98,296)
Net cash used in investing activities (63,796) (51,610) (81,650) (64,927)
Cash flows used in financing activities
Dividend paid (80,623) (80,623) (81,583) (81,583)
Net cash used in financing activities (80,623) (80,623) (81,583) (81,583)
Net increase/(decrease) in cash & cash equivalents (8,103) (8,824) (96,434) (96,257)
Cash & Cash equivalents at the beginning 156,159 157,019 188,590 188,590
Cash & Cash equivalent at the end 148,056 148,195 92,156 92,333
Analysis of Cash & Cash Equivalents
Cash in Hand 82,683 82,822 68,529 68,706
Short Term Deposits 201,303 201,303 162,507 162,507
Bank Overdrafts (135,930) (135,930) (138,880) (138,880)
148,056 148,195 92,156 92,333
`
Notes :
The above figures are provisional and subject to audit.
Figures in brackets indicate deductions.
All values are in Rs.'000, unless otherwise stated.
2017 2016
CASH FLOW STATEMENTS
Nine months ended 31
December
Nine months ended 31
December
9

HARISCHANDRA MILLS PLC
INTERIM FINANCIAL STATEMENTS
For the nine months ended 31 December 2017
Notes to the interim financial statements
1. These Interim Financial Statements of the Company and the Group have been prepared based on the Sri Lanka Accounting Standards
prefixed both SLFRS and LKAS, promulgated by the Institute of Chartered Accountants of Sri Lanka and used the same accounting policies and method of computation
2.
3.
4. The Company did not have any contingent liabilities outstanding and contingent assets as at the Balance Sheet date.
5 Industry segments analysis of turnover 31.12.2017 31.12.2016 31.12.2017 31.12.2016
Food products 583,734 518,045 1,561,277 1,447,864
Soap products 59,983 65,019 181,936 192,784
Fuel & Lubricants 198,871 189,094 575,996 575,925
842,588 772,158 2,319,209 2,216,573
6 Segment information
For the Nine months ended 31 December 2017 2016 2017 2016 2017 2016 2017 2016
Rs. '000 Rs. '000 Rs. '000 Rs. '000 Rs. '000 Rs. '000 Rs. '000 Rs. '000
Consolidated turnover 1,561,277 1,447,864 181,936 192,784 575,996 575,925 2,319,209 2,216,573
Segmental operating profit/(loss) 123,947 75,038 (26,457) 114 4,958 4,541 102,448 79,693
Other operating income ` 13,498 30,030
Net finance income 9,985 9,935
Profit before taxation 125,931 119,658
Income tax expenses (37,231) (25,804)
Profit after taxation 88,700 93,854
Segments information
For the quarter ended 31 December 2017 2016 2017 2016 2017 2016 2017 2016
Rs. '000 Rs. '000 Rs. '000 Rs. '000 Rs. '000 Rs. '000 Rs. '000 Rs. '000
Consolidated turnover 583,734 518,045 59,983 65,019 198,871 189,094 842,588 772,158
Segmental operating profit/(loss) 55,549 39,387 (10,662) (2,793) 2,223 1,643 47,110 38,237
Other operating income 7,839 2,642
Net finance income 2,961 2,477
Profit before taxation 57,910 43,356
Income tax expenses (18,185) (12,140)
Profit after taxation 39,725 31,216
Soap Fuel & Lubricants Total
Food products Soap Fuel & Lubricants Total
Food products
EXPLANATORY NOTES:
GROUP
Quarter ended Nine months ended
The Interim financial statements have been prepared in compliance with Sri Lanka Accounting Standard - LKAS 34- Interim Financial Reporting.
These Interim Financial Statements should be read in conjunction with the annual financial statements for the year ended 31 March 2017.
The presentation and classification of figures for the corresponding period of the previous year have been rearranged, where relevant, to be
comparable with those for the current period.
There have been no events subsequent to the Balance Sheet date, which require disclosures in the Interim Financial Statements.
10

HARISCHANDRA MILLS PLC
INTERIM FINANCIAL STATEMENTS
For the nine months ended 31 December 2017
Notes to the interim financial statements
7 Stated capital and number of shares
as at as at as at
31.12.2017 31.12.2016 31.03.2017
Stated capital (Rs.) 105,578,000 9,598,000 9,598,000
No of shares (Nos.) 1,919,600 959,800 959,800
8 Market price recorded during the period
as at as at as at
31.12.2017 31.12.2016 31.03.2017
Rs. Rs. Rs.
Highest price (Rs.) 1,600.00 2,895.00 3,000.00
Lowest price (Rs.) 1,151.20 2,500.00 2,150.20
Closing price (Rs.) 1,350.00 2,500.00 2,799.90
Notes :
The above figures are provisional and subject to audit.
Figures in brackets indicate deductions.
All values are in Rs.'000, unless otherwise stated.
COMPANY
In order to comply with the requirements of Dirisavi board, at the Extra Ordinary General Meeting held on 05th June 2017, shareholders passed an ordinary resolution to
capitalize Rs. 95,980,000/= from and out of retained earnings by allocating 959,800 ordinary shares as fully paid shares to and among the shareholders.
11
HARISCHANDRA MILLS PLC
INTERIM FINANCIAL STATEMENTS
For the nine months ended 31 December 2017
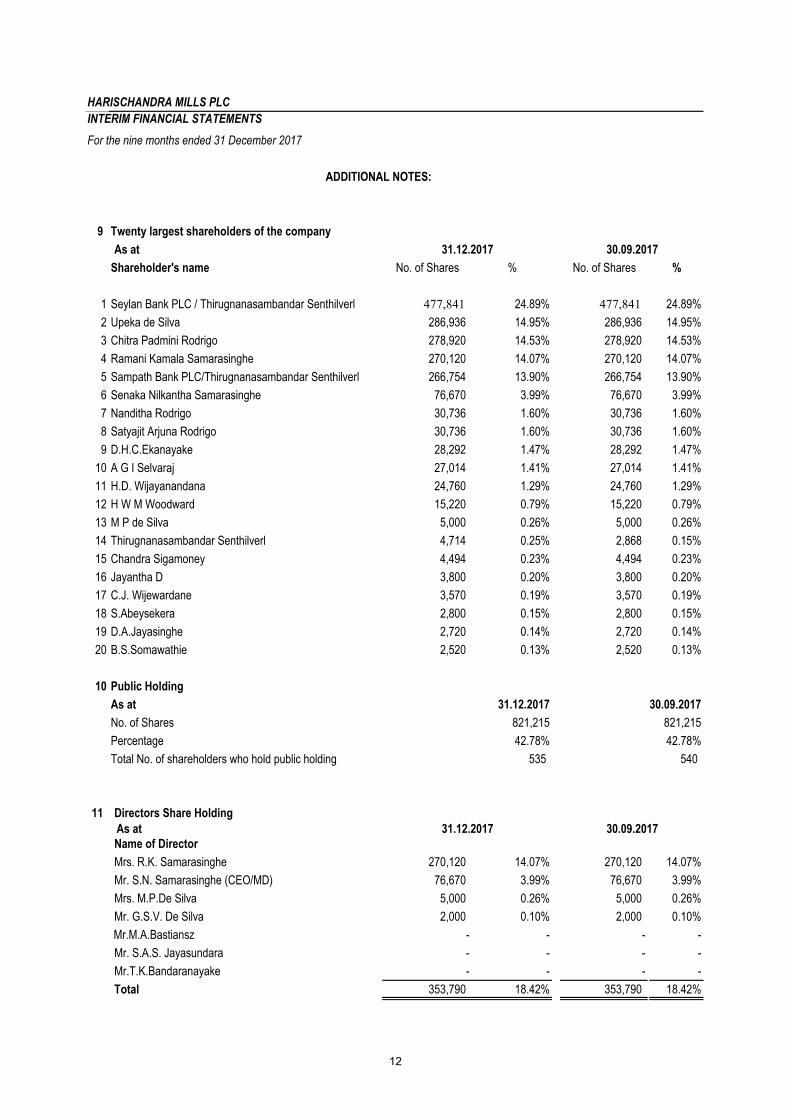
9 Twenty largest shareholders of the company
As at
Shareholder's name No. of Shares % No. of Shares %
1 Seylan Bank PLC / Thirugnanasambandar Senthilverl 477,841 24.89% 477,841 24.89%
2 Upeka de Silva 286,936 14.95% 286,936 14.95%
3 Chitra Padmini Rodrigo 278,920 14.53% 278,920 14.53%
4 Ramani Kamala Samarasinghe 270,120 14.07% 270,120 14.07%
5 Sampath Bank PLC/Thirugnanasambandar Senthilverl 266,754 13.90% 266,754 13.90%
6 Senaka Nilkantha Samarasinghe 76,670 3.99% 76,670 3.99%
7 Nanditha Rodrigo 30,736 1.60% 30,736 1.60%
8 Satyajit Arjuna Rodrigo 30,736 1.60% 30,736 1.60%
9 D.H.C.Ekanayake 28,292 1.47% 28,292 1.47%
10 A G I Selvaraj 27,014 1.41% 27,014 1.41%
11 H.D. Wijayanandana 24,760 1.29% 24,760 1.29%
12 H W M Woodward 15,220 0.79% 15,220 0.79%
13 M P de Silva 5,000 0.26% 5,000 0.26%
14 Thirugnanasambandar Senthilverl 4,714 0.25% 2,868 0.15%
15 Chandra Sigamoney 4,494 0.23% 4,494 0.23%
16 Jayantha D 3,800 0.20% 3,800 0.20%
17 C.J. Wijewardane 3,570 0.19% 3,570 0.19%
18 S.Abeysekera 2,800 0.15% 2,800 0.15%
19 D.A.Jayasinghe 2,720 0.14% 2,720 0.14%
20 B.S.Somawathie 2,520 0.13% 2,520 0.13%
10 Public Holding
As at 31.12.2017 30.09.2017
No. of Shares 821,215 821,215
Percentage 42.78% 42.78%
Total No. of shareholders who hold public holding 535 540
11 Directors Share Holding
As at
Name of Director
Mrs. R.K. Samarasinghe 270,120 14.07% 270,120 14.07%
Mr. S.N. Samarasinghe (CEO/MD) 76,670 3.99% 76,670 3.99%
Mrs. M.P.De Silva 5,000 0.26% 5,000 0.26%
Mr. G.S.V. De Silva 2,000 0.10% 2,000 0.10%
Mr.M.A.Bastiansz - - - -
Mr. S.A.S. Jayasundara - - - -
Mr.T.K.Bandaranayake - - - -
Total 353,790 18.42% 353,790 18.42%
ADDITIONAL NOTES:
31.12.2017 30.09.2017
31.12.2017 30.09.2017
12


![Manasata Damu Wilangu Galawima - මනසට දැමූ විලංගු ගැලවීම - Harischandra Wijethunga - [ මහාකළුසිංහලයෝ ]](https://img.dokumen.tips/doc/110x75/557213ad497959fc0b92c86f/manasata-damu-wilangu-galawima-.jpg)