Embed Size (px)
Citation preview
Hardware Implementation of an SK Spectrometer
Dale E. Gary∗†
New Jersey Institute of TechnologyE-mail: [email protected]
Zhiwei LiuNew Jersey Institute of TechnologyE-mail: [email protected]
Gelu M. NitaNew Jersey Institute of TechnologyE-mail: [email protected]
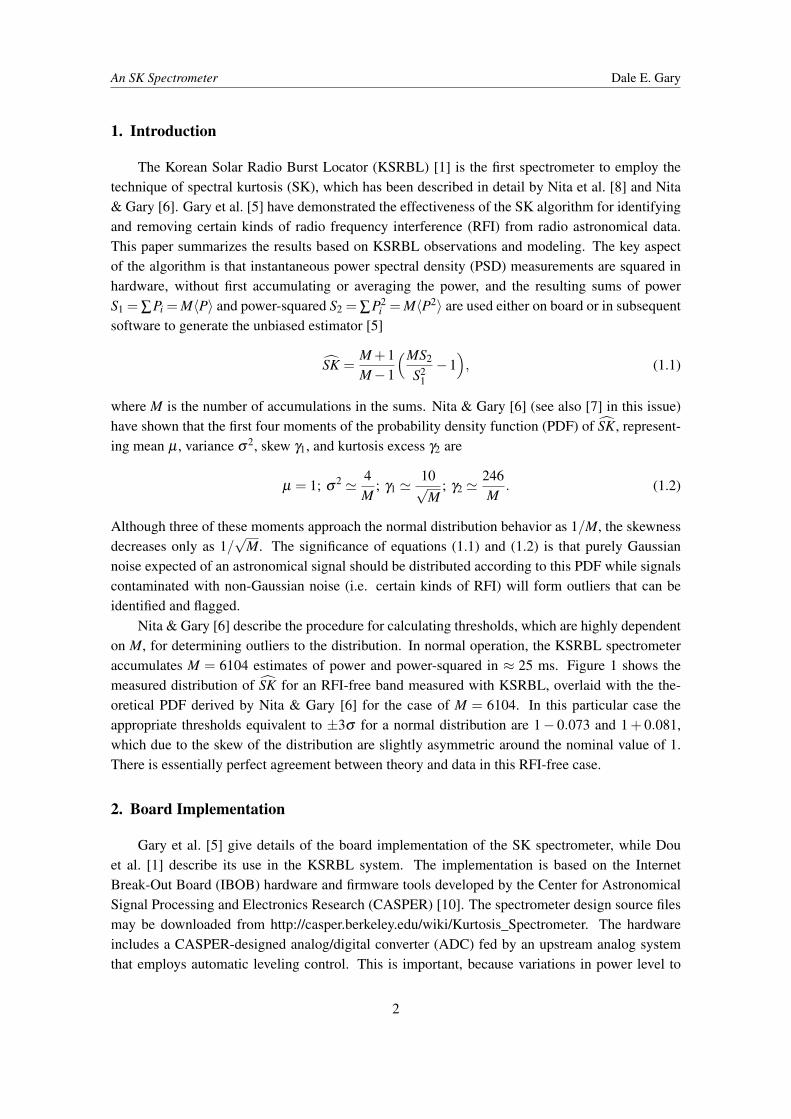
A wideband spectrometer of 500 MHz instantaneous bandwidth is described that includes an im-plementation of the Spectral Kurtosis (SK) algorithm for automatic radio frequency interference(RFI) detection. An SK spectrometer accumulates both power and power-squared, which are thenused to develop the SK estimator. The SK spectrometer of the Korean Solar Radio Burst Locator(KSRBL) has a 2 GHz instantaneous bandwidth that is time multiplexed over the 0.24-18 GHzradio frequency range, for the study of solar bursts. We use a novel presentation of the data fromthe spectrometers to classify types of RFI. It is found that the algorithm is especially useful forexcising highly intermittent RFI but is less successful for RFI due to digital signals. The methodof multiscale SK is presented that addresses the known blindness of Kurtosis-based estimators to50% duty-cycle RFI.
RFI mitigation workshop - RFI2010,March 29-31, 2010Groningen, the Netherlands
∗Speaker.†This work was supported by NSF grant AST-0908344 to NJIT
c⃝ Copyright owned by the author(s) under the terms of the Creative Commons Attribution-NonCommercial-ShareAlike Licence. http://pos.sissa.it/
An SK Spectrometer Dale E. Gary
1. Introduction
The Korean Solar Radio Burst Locator (KSRBL) [1] is the first spectrometer to employ thetechnique of spectral kurtosis (SK), which has been described in detail by Nita et al. [8] and Nita& Gary [6]. Gary et al. [5] have demonstrated the effectiveness of the SK algorithm for identifyingand removing certain kinds of radio frequency interference (RFI) from radio astronomical data.This paper summarizes the results based on KSRBL observations and modeling. The key aspectof the algorithm is that instantaneous power spectral density (PSD) measurements are squared inhardware, without first accumulating or averaging the power, and the resulting sums of powerS1 = ∑Pi = M⟨P⟩ and power-squared S2 = ∑P2
i = M⟨P2⟩ are used either on board or in subsequentsoftware to generate the unbiased estimator [5]
SK =M+1M−1
(MS2
S21
−1), (1.1)
where M is the number of accumulations in the sums. Nita & Gary [6] (see also [7] in this issue)have shown that the first four moments of the probability density function (PDF) of SK, represent-ing mean µ , variance σ 2, skew γ1, and kurtosis excess γ2 are
µ = 1; σ 2 ≃ 4M
; γ1 ≃10√M
; γ2 ≃246M
. (1.2)
Although three of these moments approach the normal distribution behavior as 1/M, the skewnessdecreases only as 1/
√M. The significance of equations (1.1) and (1.2) is that purely Gaussian
noise expected of an astronomical signal should be distributed according to this PDF while signalscontaminated with non-Gaussian noise (i.e. certain kinds of RFI) will form outliers that can beidentified and flagged.
Nita & Gary [6] describe the procedure for calculating thresholds, which are highly dependenton M, for determining outliers to the distribution. In normal operation, the KSRBL spectrometeraccumulates M = 6104 estimates of power and power-squared in ≈ 25 ms. Figure 1 shows themeasured distribution of SK for an RFI-free band measured with KSRBL, overlaid with the the-oretical PDF derived by Nita & Gary [6] for the case of M = 6104. In this particular case theappropriate thresholds equivalent to ±3σ for a normal distribution are 1− 0.073 and 1+ 0.081,which due to the skew of the distribution are slightly asymmetric around the nominal value of 1.There is essentially perfect agreement between theory and data in this RFI-free case.
2. Board Implementation
Gary et al. [5] give details of the board implementation of the SK spectrometer, while Douet al. [1] describe its use in the KSRBL system. The implementation is based on the InternetBreak-Out Board (IBOB) hardware and firmware tools developed by the Center for AstronomicalSignal Processing and Electronics Research (CASPER) [10]. The spectrometer design source filesmay be downloaded from http://casper.berkeley.edu/wiki/Kurtosis_Spectrometer. The hardwareincludes a CASPER-designed analog/digital converter (ADC) fed by an upstream analog systemthat employs automatic leveling control. This is important, because variations in power level to
2

An SK Spectrometer Dale E. Gary
Figure 1: Histogram of spec-tral kurtosis values for KSRBLdata when pointed at the Sun,in the frequency band 7500-8000 MHz (no RFI). The blackline shows the histogram of thedata, while the red line showsthe theoretical PDF for the caseof M = 6104. The vertical linesshow the thresholds given byNita & Gary [6], correspondingto the ±0.135% tail probabilityequivalent to ±3σ for a normaldistribution.
the digitizer during an accumulation can alter the statistics of RFI-free data (see [8] for furtherdiscussion). Each of the four SK spectrometer boards digitizes a 500 MHz bandwidth at 8-bitsusing a 1 GHz clock, and uses an FFT-based filterbank to divide the signal into 2048 frequencychannels. Power and power-squared are accumulated from the instantaneous PSD measurementson each channel, and dumped for off-board (although real-time) calculation of SK in the recordingcomputer system.
Due to resource and data-volume constraints, the power and power-squared accumulations aredone on limited bit-width data. The design includes several scaling and bit-select registers thatkeep these accumulations in an optimum range, without which the statistics of the SK estimatorare adversely affected. Once the spectrometer is properly scaled for a given system, however, thescaling parameters may be left fixed. Gary et al. [5] give further details of scaling and the adverseeffects of improperly set bit registers.
3. Classifying RFI Using the SK versus S1 Diagram
To understand the behavior of the SK estimator for non-Gaussian signals (i.e. RFI), Nita etal. [8] compared the theoretical response of SK to a continuous-wave (CW) signal of constantamplitude, which can be used to simulate transient RFI by considering its presence or absence withsome duty cycle d. Consider M contiguous PSD estimates of which R are contaminated by RFI atsignal to noise ratio (S/N), ηk, where k is the spectral channel index. The duty cycle is thereforedefined as d = R/M. For this case, the SK estimator expectation value is
SK =M+1M−1
[1+
(1/d −2)η2k
(1/d +ηk)2
], (3.1)
which has the following properties: for d = 12 (50% duty cycle), the estimator is always 1; for d < 1
2(highly intermittent RFI), the estimator is above 1; for d > 1
2 (more continuous RFI), the estimatoris below 1.
These characteristics are clearly visible in the example shown in Figures 2 and 3, covering the500-1000 MHz range with considerable RFI. The RFI in this band consists of both continuous and
3

An SK Spectrometer Dale E. Gary
Figure 2: (a) The 150 full-resolution snapshotspectra (2048 frequency subchannels), shown asa dynamic spectrum. (b) The clean dynamicspectrum, again with 2048 frequency subchan-nels, after applying the SK flags. Bins where theSK estimator exceeds the threshold are black. (c)The same as in (b), but now rebinned to 512 sub-channels by averaging 4 adjacent frequency bins.(d) Average spectrum formed by summing overthe 150 snapshot spectra.
Figure 3: Plot of SK estimator vs. S1, for the 150accumulated spectra in Fig. 2. The horizontal dashedlines indicate the thresholds used in Fig. 1. Each dotrepresents a single frequency-time bin in Fig. 2, andthe dots for selected frequency ranges are color-codedwith the same colors as in Fig. 2d. The colors cor-respond to the marked frequency ranges in Fig. 2d,whether or not RFI is present.
intermittent RFI, and the different types can be traced in the SK versus S1 plot of Fig. 3 by means ofthe color coding in Fig. 2d. The intermittent RFI (cyan color) forms a fountain of points in Fig. 3,lying mostly above SK = 1 due to its less than 50% duty cycle. The frequencies of continuous RFI,in contrast, produce points that lie primarily below SK = 1 due to their 100% duty cycle. Note,however, the green points in the range 0.2 < S1 < 0.3 that correspond to frequencies near 877 MHzin Fig. 2. It is clear that the characteristics of this RFI somehow mimic Gaussian noise statistics sothat the SK estimator is closely equal to 1. For that reason, the algorithm does not detect the RFIand it appears unflagged in Fig. 2c. These results generally show that the SK algorithm is effectivein removing RFI, especially the highly-intermittent type, but that some types of RFI do somehowescape detection.
We have investigated other bands (see [5] for examples) and have found other instances wherethe RFI escapes detection. In these cases, the source of RFI could be positively identified as dueto digital transmissions (XM and Sirius digital radio and digital data links). We therefore havesimulated [5] a typical method of encoding information by digital transmitters, viz. QuadraturePhase-Shift Keying [11], which encodes symbols by manipulating their phase and amplitude in afinite set of discrete values. Using such a simulation, we find that indeed the SK estimator PDFmimics that for Gaussian noise almost precisely. We therefore conclude that the SK algorithm is notwell suited to identify digital transmissions. Nevertheless, such digital transmissions are likely tobe at fixed frequencies that can be identified by other means. The SK algorithm remains extremelyuseful for identifying the particularly problematic, intermittent RFI that appears randomly andbriefly at a given frequency, as well as most sources of continuous, analog RFI.
4

An SK Spectrometer Dale E. Gary
4. Multiscale SK
One of the advantages of retrieving both S1 and S2 information from the hardware (as opposedto calculating SK in hardware and retrieving only the flags) is that these sums can be combinedin alternative ways to address the algorithm’s blindness to RFI with a duty-cycle near 50%—c.f.equation (3.1). Consider a frequency-time bin bik in a dynamic spectrum at full resolution thatcontains RFI at duty cycle dik = 0.5, and an adjacent time bin that contains RFI at some otherduty cycle di+1,k. Because of the linearity of S1 and S2, new values S1 = S1,ik + S1,i+1,k and S2 =
S2,ik +S2,i+1,k can be formed, and a new SK can be calculated for the combined bins, whose dutycycle is now d = (dik + di+1,k)/2. If di+1,k = 0 (no RFI) or di+1,k = 1 (continuous RFI), thenthe combined duty cycle is 0.25 or 0.75, respectively. In either case, the combined SK is likely toexceed the thresholds and could be used to flag bin bik. This is likely to be a good strategy in the caseof highly intermittent RFI such as that shown in Figs. 2 and 3. Alternatively, for more continuousnarrow-band RFI one might use instead an adjacent frequency channel, i.e. S1 = S1,ik + S1,i,k+1
and S2 = S2,ik + S2,i,k+1. In general, we define multiscale SK for bin i,k as the determination ofalternative values of SK over multiple “macro-bins" of size m×n, i.e.
Smn1,ik =
m
∑j=0
n
∑l=0
S1,i+ j,k+l, Smn2,ik =
m
∑j=0
n
∑l=0
S2,i+ j,k+l, (4.1)
each of which will have duty cycle
dmnik =
1(m+1)(n+1)
m
∑j=0
n
∑l=0
di+ j,k+l. (4.2)
These multiple values of SK, which we refer to as multiscale SK, can be combined in variousways to flag problem RFI. The KSRBL analysis software routinely applies multiscale SK withm = n = 1. See Gary et al. [5] for examples of the performance of the SK algorithm for differentchoices of m and n.
5. Conclusion
As new radio astronomy instruments explore ever wider radio frequency bandwidths, RFI hascome to the fore as one of the key problems to be addressed [e.g. 2, 3, 4, 9]. No single approach willwork in all cases, and it is necessary to employ layered RFI avoidance [12] and excision algorithms.The work of Nita et al. [8] and Nita & Gary [6, 7] has placed the SK algorithm on a firm theoreticalfooting, while Gary et al. [5], briefly summarized here, shows the practical application of thealgorithm in hardware. Although the algorithm does not work optimally for all cases, notably fordigitally encoded transmissions, it is especially powerful for one problematic type of RFI, highlyintermittent RFI in frequency and time. This includes both fixed and mobile transmitters, especiallyaircraft DME (distance measuring equipment), as shown but not discussed by Nita et al. [8] (theirfigures 9 and 10). Its ability to identify and flag such RFI in real time makes it an important firstline of defense after avoidance and front-end filters.
In this paper we have shown that the hardware implementation we have designed maintainsthe requisite precision to recover the SK PDF to high accuracy when compared to the theoretical
5

An SK Spectrometer Dale E. Gary
PDF determined by Nita & Gary [6]. This permits use of the precise theoretical thresholds foridentifying outliers due to RFI, and offers excellent detection while minimizing the false alarmrate. By introducing the SK versus S1 plot, we have provided a useful method of characterizingRFI based on its duty cycle. Further examples are given in Gary et al. [5].
The relative simplicity and ease of implementation of the SK algorithm in high-speed digitalsystems makes it highly suitable for inclusion in new radio spectrometer designs based on eithertime-domain or spectral-domain filtering. It can easily be used in concert with other RFI excisiontechniques, and we recommend its use.
References
[1] Dou, Y., Gary, D. E., Liu, Z., Nita, G. M., Bong, S.-C., Cho, K.-S., Park, Y.-D., & Moon,Y. J., The Korean Solar Radio Burst Locator (KSRBL), PASP, 121, 512
[2] Fridman, P. A., RFI excision using a higher order statistics analysis of the power spectrum,Astronomy & Astrophysics, 368, 369
[3] Fridman, P. A., & Baan, W. A., RFI mitigation methods in radio astronomy, Astronomy &Astrophysics, 378, 327
[4] Fridman, P. A., Statistically Stable Estimates of Variance in Radio-Astronomy Observationsas Tools for Radio-Frequency Interference Mitigation, AJ, 135, 1810
[5] Gary, D. E., Liu, Z., & Nita, G. M., A Wideband Spectrometer with RFI Detection, PASP, 122,560
[6] Nita, G. M., Gary, D. E., Statistics of the Spectral Kurtosis Estimator, PASP, 122, 595
[7] Nita, G. M., Gary, D. E., Statististics of the SK estimator, in this proceedings,PoS(RFI2010)019
[8] Nita, G. M., Gary, D. E., Liu, Z., Hurford, G. J., & White, S. M., Radio Frequency InterferenceExcision Using Spectral Domain Statistics, PASP, 119, 805
[9] Offringa, A. R., de Bruyn, A. G., Biehl, M., Zaroubi, S., Bernardi, G., & Pandey, V. N.,Post-correlation radio frequency interference classification methods, MNRAS, 405, 155
[10] Parsons, A., et al., A Scalable Correlator Architecture Based on Modular FPGA Hardware,Reuseable Gateware, and Data Packetization, PASP, 120, 1207
[11] Proakis, J. G. 2001, Digital Communications, 4th Ed., McGraw-Hill (NY)
[12] Tzioumis, A., Radio Quiet Zones (RQZ) - Working with national communication administra-tions, 37th COSPAR Scientific Assembly, 37, 3247
6