Embed Size (px)
Citation preview

UUndergr
H
round W
Harcourt
Water Im
Petroleu
mpact RATP
um N.L.Draft
ReportP 564P

UUndergr
Ha
round W
arcourt P
Water Im
Petroleum
mpact ReATP
m N.L.Drafteport564P
18 April 20
CDM Smith AABN 88 152 021 McLachlanFortitude VallQLD 4006 Tel: +61 7 382Fax: +61 7 382
013
Australia Pty Ltd 082 936 n St ley
28 6900 28 6999

Draft Underground Water Impact Report ‐ ATP 564P iii
Table of Contents
Section1 Introduction...............................................................................................................................................1‐11.1 Projectarea......................................................................................................................................................1‐11.2 Legislativerequirements............................................................................................................................1‐31.3 PetroleumAct1923(QLD)........................................................................................................................1‐31.4 WaterAct2000(QLD).................................................................................................................................1‐31.5 Summaryofmethods...................................................................................................................................1‐4
Section2 WaterProductionSchedule(PartA).................................................................................................2‐12.1 Summaryofhistoricallyproducedwater...........................................................................................2‐12.2 Summaryofgasproductionwells..........................................................................................................2‐22.3 Summaryofwatertobeproducedinthenextthreeyears........................................................2‐2
Section3 ExistingGeologicalandHydrogeologicalRegime(PartB).........................................................3‐13.1 Regionalgeology............................................................................................................................................3‐13.2 Hydrogeology..................................................................................................................................................3‐5
3.2.1 QuaternaryalluvialaquifersandTertiarybasalt......................................................................3‐53.2.2 Triassicsedimentaryaquifers...........................................................................................................3‐53.2.3 Permiancoalmeasures.........................................................................................................................3‐63.2.4 Hydrogeologicalproperties................................................................................................................3‐6
3.3 Conceptualhydrogeologicalmodel.......................................................................................................3‐73.3.1 Groundwaterlevelsandflow.............................................................................................................3‐73.3.2 Aquiferrechargeanddischarge.....................................................................................................3‐133.3.3 Historicalgroundwaterleveltrendanalysis............................................................................3‐133.3.4 Groundwaterquality...........................................................................................................................3‐163.3.5 Aquiferconnectivity............................................................................................................................3‐193.3.6 Groundwateruse..................................................................................................................................3‐193.3.7 Summary..................................................................................................................................................3‐19
Section4 ImpactstoGroundwaterSystem(PartC)........................................................................................4‐14.1 Modellingmethodology..............................................................................................................................4‐1
4.1.1 MODFLOW‐SURFACTmodelimplementation............................................................................4‐14.1.2 Modeldomainandgrid.........................................................................................................................4‐14.1.3 Modellayers...............................................................................................................................................4‐34.1.4 Boundaryconditions..............................................................................................................................4‐54.1.5 Currentconditions..................................................................................................................................4‐74.1.6 Predictionmethodology....................................................................................................................4‐10
4.2 Groundwaterimpactaffectedareas...................................................................................................4‐104.2.1 Predictedwaterleveldeclinemaps.............................................................................................4‐10
4.3 Keyfindingsandreviewprocedures.................................................................................................4‐13
Section5 WaterMonitoringStrategy(PartD)..................................................................................................5‐15.1 Rationale............................................................................................................................................................5‐1
5.1.1 Monitoringthresholdcriteria............................................................................................................5‐15.1.2 Criticaldatagaps.....................................................................................................................................5‐1
5.2 Monitoringstrategyandtimetable........................................................................................................5‐25.2.1 Extractedundergroundwater...........................................................................................................5‐25.2.2 Fieldlocations...........................................................................................................................................5‐25.2.3 Waterlevelmonitoring.........................................................................................................................5‐35.2.4 Waterqualitymonitoring....................................................................................................................5‐3
5.3 Reportingprogram.......................................................................................................................................5‐4

Draft Underground Water Impact Report ‐ ATP 564P iv
Section6 SpringImpactManagement(PartE).................................................................................................6‐16.1 Springinventory............................................................................................................................................6‐1
Section7 Conclusion..................................................................................................................................................7‐1
Section8 References..................................................................................................................................................8‐1
List of Figures
Figure 1‐1 Location map .................................................................................................................................. 1‐2Figure 2‐1 Gas well historical test pumping ..................................................................................................... 2‐1Figure 2‐2 Estimated locations of proposed production wells ........................................................................ 2‐3Figure 3‐1 Regional geology map ..................................................................................................................... 3‐2Figure 3‐2 Schematic West to East cross section through ATP 564P ............................................................... 3‐4Figure 3‐3 Interpreted water level contours in the alluvium and basalt ......................................................... 3‐8Figure 3‐4 Interpreted groundwater contours in the Clematis sandstone and the Moolayember Formation . 3‐
10Figure 3‐5 Interpreted contour maps for Baralaba Coal Measures ............................................................... 3‐12Figure 3‐6 Hydrographs for selected bores installed in the Dawson River alluvium ..................................... 3‐14Figure 3‐7 Hydrographs for bores installed in Castle Creek alluvium ............................................................ 3‐14Figure 3‐8 Hydrographs for bores installed in the Moolayember Formation ................................................ 3‐15Figure 3‐9 Hydrographs for bores installed in the Rewan Formation ............................................................ 3‐15Figure 3‐10 Sampled Groundwater Bores ‐ January 2013 ............................................................................. 3‐18Figure 4‐1 Model Domain ................................................................................................................................ 4‐2Figure 4‐2 3D model of the ground surface and 6 model layers (base of all layers are presented, the alluvium
is directly under the ground surface) ............................................................................................................... 4‐3Figure 4‐3 Down dip cross section through modelling area (cross section A‐B) .............................................. 4‐4Figure 4‐4 East ‐ west model cross section showing the stratigraphy of row 45 (Northing ~7287800m) ....... 4‐4Figure 4‐5 Model boundary conditions on Layer 1 .......................................................................................... 4‐6Figure 4‐6 Calibration scatterplot of simulated hydraulic head versus observed hydraulic head [m] for
steady‐state model. ......................................................................................................................................... 4‐8Figure 4‐7 Simulated water table at end of 2012 ............................................................................................ 4‐9Figure 4‐8 Simulated drawdown in the Baralaba Coal Measures at the end of 3 years CSG pumping. ........ 4‐12Figure 6‐1 Location of closest registered springs to ATP 564P ........................................................................ 6‐2
List of Tables
Table 1‐1 Summary of UWIR requirements and sections where this is addressed in the report .................... 1‐5Table 2‐1 Summary of historical production testing ........................................................................................ 2‐1Table 2‐2 Summary of water to be produced over the next five years ........................................................... 2‐2Table 3‐1 Regional stratigraphy of the Bowen Basin ....................................................................................... 3‐3Table 3‐2: Summary of hydrogeological properties for major HSUs in the Bowen Basin. ............................... 3‐7Table 3‐3 Summary of registered bores in the Clematis sandstone and the Moolayember Formation ......... 3‐9Table 3‐4 Summary of registered bores installed in the Baralaba Coal Measures ........................................ 3‐11Table 3‐5 Summary of water levels as recorded during field sampling ......................................................... 3‐16Table 3‐6 Summary of field parameters recorded during field investigations .............................................. 3‐17Table 3‐7 Summary of water quality from production wells in Baralaba Coal Measures.............................. 3‐17Table 4‐1 Model Layers and Stratigraphy ........................................................................................................ 4‐4Table 4‐2 Calibrated model hydraulic properties. ........................................................................................... 4‐7

Draft Underground Water Impact Report ‐ ATP 564P v
Table 4‐3 ATP 564P predicted water production schedule ........................................................................... 4‐10Table 4‐4 ATP 602P predicted water production schedule ........................................................................... 4‐10Table 5‐1 Reconnoitred monitoring locations ................................................................................................. 5‐3Table 5‐2 Groundwater analytical suite ........................................................................................................... 5‐4
Appendices
Appendix A ‐ Summary of registered bores installed in alluviumAppendix B ‐ Summary of laboratory results for registered bores sampled in Jan 2013Appendix C ‐ UWIR Groundwater Monitoring ChecklistAppendix D ‐ Submissions Report for UWIR for ATP 564PAppendix E ‐ Disclaimer and Limitations

Draft Underground Water Impact Report ‐ ATP 564P vi
Document History and Status
Revision Date Issued Reviewed By Approved By Date Approved Revision Type
Draft 16/04/2013 Rikito Gresswell Lloyd Townley 16/4/2013 A
Final 18/04/2013 John Leyland Lloyd Townley 18/4/2013 B
Distribution of Copies
Version Date Issued Quantity Electronic Issued To
Draft 16/4/2013 1 Yes Harcourt
Final 18/4/2013 1 Yes Harcourt
Final 14/06/2013 1 Yes EHP
Printed: 23 December 2013
Last Saved: 23 December 2013 03:40 PM
File Name: CDMSmith_B12787 01_Harcourt_UWIR_ATP564P_RPT_130418.docx
Author: Katarina David/Andrew Brooker/Mauricio Taulis
Project Manager: John Leyland
Client: Harcourt Petroleum N.L.
Document Title: Draft Underground Water Impact Report ‐ ATP 564P
Document Version: Final
Project Number: B12787.01

Draft Underground Water Impact Report ‐ ATP 564P vii
Executive Summary
Harcourt Petroleum N.L. (Harcourt) has been granted an authority to prospect permit forATP546PwhereHarcourtisthemajorityowner.ATP546PislocatedintheDawsonRivervalleynearMoura, 150 km southwest from Gladstone, Queensland, with target coal seams located atdepthsof approximately450mbelowground level. Theproject is currently at anearly testingstage.Withinthecomingfiveyearsitisanticipatedthatupto23productionwellswillbeputintooperationinthenorthernHarcourtAreaoftheATP564PCentralTenements.
CDM Smith Australia Pty Ltd (CDM Smith) has been commissioned by Harcourt (previously byMolopoEnergyLimited)toprepareanUndergroundWaterImpactReport(UWIR)forpetroleumcoalseamgas(CSG)operationswithinATP564PtoenableHarcourttomanagetheimpactsfromtheir testing or production activities. This UWIR provides information about the relevantundergroundwaterextractionsandpotentialimpactsonaquiferswithinATP564Pasaresultoftheexerciseofundergroundwaterrightsduringtheperiod2013to2016.
A conceptual hydrogeologicalmodelwas developed following review of published reports, coalseamtestingandwaterleveldata.Twoaquifers,theshallowalluviumandbasalt,andthedeeperBaralaba Coal Measures were identified as potentially affected by the exercise of undergroundwater rights. A numerical model was developed utilising available information and projectedwaterextractionratesfromcoalseamgas(CSG)operations.Predictedwaterleveldeclineswerecompared to the regulatory trigger levels of 2m in unconsolidated aquifers and 5m inconsolidatedaquifers.
NoImmediatelyAffectedAreas(IAAs)wereidentifiedandnoLongTermAffectedAreas(LTAAs)werepredictedaftercessationofwaterextractionin2016.
Awatermonitoringstrategywasdevelopedtoquantifychangesinwaterlevelsandwaterquality,andtoimproveunderstandingofthelocalhydrogeologicparameters.Themonitoringstrategywillbe implemented not only in aquifers identified as Immediately Affected, but also as aprecautionarymeasureintheshallowaquifer,wherethemajorityofregisteredlandholderboresaresited.
Monitoring will allow annual review of the accuracy of the maps when information changessubstantially.Thecollecteddatawillbereported,andanupdateofthisUWIRwillbegeneratedinthreeyears.

Draft Underground Water Impact Report ‐ ATP 564P 1‐1
Section 1 Introduction
CDM Smith Australia Pty Ltd (CDM Smith) has been engaged by Harcourt Petroleum N.L.(Harcourt) toprepare thisUndergroundWater ImpactReport (UWIR) tomeetrequirements fortheoperationofAuthoritytoProspect(ATP)564.TheserequirementsaresetoutwithintheLevel2 Environmental Authority (EA PEN200008607) issued by the Queensland GovernmentDepartment of Environment and Resource Management (DERM) now administered by theDepartmentofEnvironmentandHeritageProtection(EHP).Harcourt is themajorityownerandoperatorofATP564P.
This report has been prepared in accordance with UndergroundWater Impact Report (UWIR)guidelinesanditspurposeistoaddressChapter3andinparticularsection376oftheWaterAct(Qld)2000whichstipulatesthataUWIRmustinclude:
Thequantityofwaterproducedortakenfromtheareaasaresultofpreviousgasexplorationorproductionactivities;
an estimate of quantity of water to be produced or taken as a result of gas exploration orproductionfora3‐yearperiodstartingontheconsultationdayforthereport;
informationaboutaquifersaffected,orlikelytobeaffected;
maps showing the area of the affected aquifer(s) where underground water levels areexpectedtodecline;
awatermonitoringstrategy;and
aspringimpactmanagementstrategy.
This UWIR provides information about the relevant underground water extractions and thepotentialimpactsonaquiferswithinATP564Pasaresultofdewateringduringproductiontesting.
1.1 Project area
TheProjectAreaislocatedapproximately150kmsouthwestofGladstone,incentralQueensland. ATP564Pcomprisesthreetenements:theNorthernTenements,TheCentralTenementincludingHarcourtNorthandHarcourt(15kmnortheastofMoura)andSouthernTenementwherenopilotorproductiontestingisproposed(Figure1‐1).NopilotorproductiontestingwillbeundertakenwithintheNorthernTenements,thereforethisareahasbeenexcludedfromfurtheranalysisandreporting.
TestwellsintheHarcourtareaweredrilledin2002.Theinstallationinvolveddrillingofverticalwellsandlaterals,coring,geophysicalloggingandtestingforpermeability.

Draft Underground Water Impact Report ‐ ATP 56P Harcourt Petroleum N.L.
Draft Underground Water Impact Report ‐ ATP 564P 1‐2
Figure 1‐1 Location map

Draft Underground Water Impact Report ‐ ATP 56P Harcourt Petroleum N.L.
Draft Underground Water Impact Report ‐ ATP 564P 1‐3
1.2 Legislative requirements
The primary legislative requirements for themanagement of groundwaterwith respect to coalseamgasactivitiesforATP564Paresummarisedbelow.
1.3 Petroleum Act 1923 (QLD)
ATP564PwasgrantedunderthePetroleumAct1923(Qld).UnderthePetroleumAct1923(Qld),the petroleum tenure holder may take or interfere with groundwater to the extent that it isnecessary and unavoidable during the course of an activity authorised under the petroleumtenure.TheActrequirestenureholderstocomplywithundergroundwaterobligationsspecifiedintheWaterAct2000(Qld).
1.4 Water Act 2000 (QLD)
TheWaterAct2000(Qld):
Provides a comprehensive regime for theplanning andmanagement of allwater resources(includingvesting to theState the rightsover theuse, flowandcontrolof all surfacewater,groundwater,riversandsprings)inQueensland;
Regulateswateruseandtheobligationsofcoalseamgasproducersinrelationtogroundwatermonitoring,reporting,impactassessmentandmanagementofimpactsonotherwaterusers;
ProvidesaframeworkandconditionsforpreparingaBaselineAssessmentPlanandoutlinestherequirementsofboreownerstoprovideinformationthatthepetroleumholderreasonablyrequirestoundertakeabaselineassessmentofanybore;
Sets out the process for applying for aWater Licence (wherewater is utilised outside of apetroleumleaseornotonadjacentlandownedbythesameperson);and
Sets out the process for assessing, reporting,monitoring, and negotiatingwith otherwaterusersregardingtheimpactofcoalseamgasproductiononaquifers.
The management of impacts on groundwater caused by the exercise of groundwater right bypetroleumtenementholdersisachievedprimarilyby:
Providingaregulatoryframeworkthat:
- Requirespetroleumtenureholderstomonitorandassesstheimpactoftheexerciseof underground water rights on water bores and to enter into “make good”agreementswiththeownersofthebores;
- Requires the preparation of UWIRs that establish undergroundwater obligations,includingobligationstomonitorandmanageimpactsonaquifersandsprings;
Giving theQueenslandWaterCommission functionsandpowers formanagingundergroundwaterindeclaredcumulativeimpactareas.
IfawaterborehasanimpairedcapacityasaresultofCSGactivities,anagreementisrequiredtobenegotiatedwiththeowneroftheboreaboutthefollowing:
Thereasonforthebore’simpairedcapacity;

Draft Underground Water Impact Report ‐ ATP 56P Harcourt Petroleum N.L.
Draft Underground Water Impact Report ‐ ATP 564P 1‐4
Themeasuresthepetroleumtenementholderwilltaketoensuretheboreownerhasaccesstoa reasonablequantityandqualityofwater for theauthorisedusesandpurposeof thebore;and
Anymonetaryornon‐monetary compensationpayable to theboreowner for impacton thebore.
If an agreement relating to awater bore ismade the agreement is taken to be a “make good”agreementforthebore.AnUWIRwill identifywhetheranImmediatelyAffectedAreawillresultfrom CSG activities. An Immediately Affected Area is defined as an area where the predicteddeclineinwaterlevelswithin3yearsisabovethetriggerthreshold:
›5mforaconsolidatedaquifer;
2mforanunconsolidatedaquifer;and
0.2mforaspring.
UWIRs are published to enable the community, including bore owners and other stakeholders,withintheareaoftesting,tomakecomments.SubmissionsmadebystakeholderswillbereviewedandsummarisedbyCDMSmithonbehalfofHarcourt,addressedasappropriateandprovidedtotheDepartmentofEnvironmentandHeritageProtection (EHP) togetherwith theUWIR.UWIRsaresubmittedforapprovalbyEHP.
1.5 Summary of methods
AnassessmentofimpactsonundergroundwaterfromthepilottestingactivitieswithinATP564Phas been undertaken by referencing available relevant data and reports, including availablegeologicalandhydrogeologicalreports,recordsobtainedfromDNRMandtheAustralianBureauofMeteorology.
Adesktopreviewofthesedatawasundertakentoprovidedevelopaconceptualhydrogeologicalmodel for this part of the Bowen Basin. The potential impacts of the current coal seam gasactivitiesoutsidebutinthevicinityoftheATP564Pwerenotincorporatedinthisassessmentduetothelimitedknowledgeoftheseactivities.Fromthisconceptualhydrogeologicalunderstandingacomputer based numerical groundwater model was developed. This model was then used topredictthepotentialforimpactstogroundwaterlevels.Themodelunderpinsthedevelopmentofmanagementstrategiesforthisandanyfutureflowtestingprograms.
AsummaryoftheUWIRrequirementsundertheWaterActandtherelevantsectionsofthisreportinwhichtheyhavebeenaddressedisincludedinTable1‐1.
ItshouldbenotedthatarequirementoftheUWIRistopredictthemagnitudeofwaterleveldeclines foraffectedaquifers.Tothisend, theUWIRmust includemapsshowingtheareaofthe aquifer where groundwater level is predicted to decline by more than the applicabletrigger value as a result of the activities assessed. Thesemapsmust present the results ofpredictionsofgroundwater levelswithin3years following the reportconsultationday (thisareaisdefinedastheImmediatelyAffectedArea);and
atanytime(thisareaisdefinedastheLongTermAffectedArea).
Trigger threshold values, as defined by the Water Act, are 5 m declines in water level withinconsolidated rock (e.g. sandstone) aquifers, 2m declines in unconsolidated aquifers, and 0.2mdeclinesinwaterlevelforaquifersrelatedtosprings.

Draft Underground Water Impact Report ‐ ATP 56P Harcourt Petroleum N.L.
Draft Underground Water Impact Report ‐ ATP 564P 1‐5
Water level declines have been predicted through application of a numerical hydrogeologicalmodel(refertoSection4).
Table 1‐1 Summary of UWIR requirements and sections where this is addressed in the report
Part Section UWIR
Underground water extractions 2.0
Information about affected aquifers 3.0
Maps showing the areas of affected aquifer 4.0
Water monitoring strategy 5.0
Spring impact management strategy 6.0

Draft Underground Water Impact Report ‐ ATP 564P 2‐1
Section 2 Water Production Schedule (Part A)
2.1 Summary of historically produced water
Between1995and2007production testingofcoalseamgaswells installedwithin theBaralabaCoal Measures was conducted in various well fields within ATP 564P petroleum tenure. Thistesting was conducted prior to the commencement of the Water Act 2000 amendments on1December 2010. No testing was occurring at the time of or since the enactment of theseamendments. No further testing of thesewells is anticipated. Thewells installed as part of theearlierprogramweresubsequentlyabandoned.Asummaryofproduction testingundertaken todateisincludedinTable2‐1below.
Table 2‐1 Summary of historical production testing
Well Permit Area Pump On Pump Off Volume KL
BD02 564 Harcourt 23/05/2005 11/02/2006 693
BD01 564 Harcourt 23/05/2005 23/07/2006 521
Gibihi‐1 564 Mungi West 18/10/1995 31/10/1996 430
Gibihi‐2 564 Mungi West 16/02/1995 30/04/1996 513
Gibihi‐3 564 Mungi West 21/01/1996 30/10/1996 364
HR01 564 Harcourt 16/05/2001 16/11/2004 3114
HR02 564 Harcourt 5/07/2003 6/07/2005 1558
MR27 564 Mungi West 30/11/1996 7/05/1997 149
KM03 564 Mungi West 30/12/1996 20/12/1997 163
Isla‐1 602 Timmy 21/12/1995 3/10/1996 213
Tim Shay Creek‐1 602 Timmy 5/02/1997 8/05/1997 87
TM01 602 Timmy 27/03/2003 23/10/2007 3083
DetailedwaterproductioninformationonadailybasiswasavailableforHarcourt1andHarcourt2 andBD01andBD02 testwells. Thesedata are presented inTable2‐1 below.The extractionvolumesweremeasuredusingtheflowmeteronthepump.
Figure 2‐1 Gas well historical test pumping

Draft Underground Water Impact Report ‐ ATP 56P Harcourt Petroleum N.L.
Draft Underground Water Impact Report ‐ ATP 564P 2‐2
2.2 Summary of gas production wells
Harcourt is proposing to undertake thepilotprogramwithin thenorthern tenementwhichwillconsistofaverticalfracturestimulationwellandasinglelateralwelltargetingasingleseam.Pilotwellswillbedrilledineachofthefollowinglocations: Harcourt(CentralTenement)andHarcourtNorth(CentralTenement).Ineachofthesepilotwells,asinglelateralwellwillbedrilledthroughoneseamintoaverticalproductionwell.Anotherverticalwellwillbedrillednearbyandallseamsotherthantheseamcontainingthelateralwillbefracturestimulated.
The development in the Harcourt field may involve triple collar, triple seam wells.The anglebetweenlaterals(andhencethelateralspacing)mayvary.Closerspacing(approximately300m)wouldbe applied to deeper, lower permeability areas.Wider spacing (up to 1.2 km)would beusedinhighpermeabilityareas.
ThethickerseamswillbetargetedincludingtheAandBseamsoftheBaralabaCoalMeasures.
2.3 Summary of water to be produced in the next three years
A total of 23 productionwells are proposed to be installed and operational over the next fiveyears. The approximate location of the wells is given in Figure 2‐2 Estimated total waterproduction(basedonhistoricalrecords)hasthereforebeendividedinto23wellspumpingovertheperiodof fiveyears.Table2‐2 summarisesthepredictedaveragewaterabstractionrate foreachofthetimeperiods.
Table 2‐2 Summary of water to be produced over the next five years
Number of Wells Year Average abstraction rate
per well (KL/day) Total abstraction rate
(KL/day)
4 1 15.9 63
10 2 12.7 127
14 3 9 127
19 4 6.6 125
23 5 5.3 124

Draft Underground Water Impact Report ‐ ATP 56P Harcourt Petroleum N.L.
Draft Underground Water Impact Report ‐ ATP 564P 2‐3
Figure 2‐2 Estimated locations of proposed production wells

Draft Underground Water Impact Report ‐ ATP 564P 3‐1
Section 3 Existing Geological and
Hydrogeological Regime (Part B)
3.1 Regional geology
TheBowenBasinisoneofthemajorcoalbasinsintheworldandcoversanareaover60,000km2from Collinsville to Theodore within Central Queensland. The Project area covers part of thePermo‐Triassic, back‐arc extensional to foreland basin that is made up of north‐northwest tosouth‐southeasttrendingshelves,separatedbysedimentarytroughs(Baker1993;Fielding1993).ThetwomajortroughsinthebasinaretheTaroomTroughandtheDenisonTrough.TheProjectarealiestotheeastoftheTaroomTroughanorth‐southtrendingslightlyasymmetricsyncline,inthe central part of the Bowen Basin (Figure3‐1). TheMimosa Syncline is a structural featuredevelopedoverthesouthernTaroomTroughandwestoftheProjectarea.

Draft Underground Water Impact Report ‐ ATP 56P Harcourt Petroleum N.L.
Draft Underground Water Impact Report ‐ ATP 564P 3‐2
Figure 3‐1 Regional geology map

Draft Underground Water Impact Report ‐ ATP 56P Harcourt Petroleum N.L.
Draft Underground Water Impact Report ‐ ATP 564P 3‐3
ThesedimentarydepositionwithintheBasincomprisesPermian,Triassic,andyoungTertiaryandQuaternarysediments.MostofthesedimentationintheProjectareaoccurredinthenon‐marineshallowwaters(Olgers,1966).Theoldestoutcroppingrocks(intheeastoftheProjectarea)arepartof theupperPermianGyrandaFormationwhich isconformablyoverlainby theRangalandBaralaba CoalMeasures. Rewan Formation sandstones and siltstones are the lowermost of theTriassic sequenceandareoverlainby theClematis sandstoneand theMoolayemberFormation.TheRewanFormation,ClematisGroupandtheMoolayemberFormationoutcroptothewestoftheprojectareaandthecentralareaiscoveredbyyoungerTertiaryandQuaternarysediments.
The fold and fault axis in this area generally trend north‐northwest, which is parallel to theregionalBowenBasintrendandaxisofMimosaSynclinetothewest.TheeastoftheProjectareaisboundbytheBananaFault,theeastdippingthrustzoneatabout8degrees.
Aschematicgeologicalcrosssection(Figure3‐2)preparedbyCDMSmithindicatesthedippingofthe layers (and thewhole sedimentary sequence) to thewest at around6 to8degrees and thepresenceoffaultsinthearea.
AsummaryoftheregionalstratigraphyoftheBowenBasinisgiveninTable3‐1.
Table 3‐1 Regional stratigraphy of the Bowen Basin
Period Group West East
Jurassic Precipice Sandstone
Evergreen Formation (Boxvale sandstone member)
Triassic Mimosa Group Moolayember Formation Moolayember Formation
Clematis Sandstone Clematis Sandstone
Rewan Formation Rewan Formation
Upper Permian Blackwater Group Bandanna Formation Baralaba Coal‐ Rangal Coal Measures
Back Creek Group Gyranda Formation
Flat Top Formation Bartfield Formation Oxtrack Formation
Lower Permian Back Creek Group Catherine Sandstone Ingelara Formation
Rennes Beds
Source: Dear et al, 1971 and Olgers, F.1966

Draft Underground Water Impact Report ‐ ATP 56P Harcourt Petroleum N.L.
Draft Underground Water Impact Report ‐ ATP 564P 3‐4
Figure 3‐2 Schematic West to East cross section through ATP 564P

Draft Underground Water Impact Report ‐ ATP 56P Harcourt Petroleum N.L.
Draft Underground Water Impact Report ‐ ATP 564P 3‐5
3.2 Hydrogeology
OnaregionalscaletheTriassicandPermiansedimentsaregenerallynotregardedassignificantgroundwater resource, however fractured sandstone interbeds and coal seams have generallyhigher permeability than the interburden material. The most productive aquifers locally areQuaternaryalluviumandTertiarybasalt.
Conceptuallytheareaconsistsoffivedistincthydrostratagraphicunits(HSUs)(Figure3‐2)(fromyoungesttooldest):
TertiarybasaltandQuaternaryalluvium;
ClematisGroup;
RewanFormation;
RangalandBaralabaCoalMeasures;and
GyrandaFormation.
3.2.1 Quaternary alluvial aquifers and Tertiary basalt
Thealluviumisgenerallyahighlytransmissiveunitcomprisedoflayersofgravel,sand,andclays.Itisclassedasaporousmediumsincegroundwateroccurswithinvoidsbetweengrainparticles.In the Project area alluvial aquifers are associated with Dawson River and Castle Creek, andsurface water and groundwater interaction is likely. Monitoring data suggest that the alluvialaquifer isunconfinedand inconnectionwithsurfacewater featuressuchasstreamsandrivers.Theprimary sourceof recharge to the aquifer is rainfall and toaminorextent interactionwithsurface water. The alluvial system loses water via baseflow (contribution to surface water),evapotranspirationandflowtootherconnectedaquifers.Thethicknessofthisunitisaround20mandtheyieldisupto35L/s(DNRMgroundwaterdatabase).
Basaltoutcropsoveraverysmallareaofthetenement,howeveranumberofgroundwaterboreswithin the ATP 564P have been installed in this unit. Flow through basalt occurs mostly viafractureswiththeyieldsofupto5.6L/s(DNRMgroundwaterdatabase)withinthisregion.
Local aquifers in alluviumandbasalt provide themost reliablewater supplywithin theProjectarea.
3.2.2 Triassic sedimentary aquifers
Triassic sedimentary units within the Project area include Moolayember Formation, ClematisSandstoneandRewanFormation.TheMoolayemberFormationoutcropstothewestoftheProjectarea,howeverboththeClematisSandstoneandRewanFormationoutcropwithinthecentralareaoftheproject.
TheLowertoMiddleTriassicClematissedimentsareprimarilyrepresentedbyquartzsandstonewithminor siltstoneandmudstone.They formamajoraquiferwithin theGreatArtesianBasin,howeverlocallythisformationisalessreliablesourceofwaterduetoincreasingdepthofcoverand small outcrop area. Flow via primary porosity is limited, with the vast majority of flowthroughthesystemviasecondaryporosity(fractures).Forthepurposesofthisprojectanaveragehorizontalandverticalconductivityisconsideredsuitable.Theaverageporosityofthesandstoneisreported(Gray,1968)tobe21%,andhydraulicconductivityisreportedintherangefrom0.4to

Draft Underground Water Impact Report ‐ ATP 56P Harcourt Petroleum N.L.
Draft Underground Water Impact Report ‐ ATP 564P 3‐6
37m/d, with an average of 8.5m/d. The thickness of this unit is approximately 150m in theeasternedgeofBowenbasinandislargelyuniform.
Rechargetothisunitoccursviadirectrainfallwherethestrataoutcrops,butalsovialeakagefromoverlaying alluvium (where present). Discharge occurs either via lateral down‐gradient flow orevapotranspiration.
TheLowerTriassicRewanFormationisrepresentedbyargillaceousmudstone,siltstoneandlabilesandstoneand isgenerally regardedas the lowpermeabilitystrata.Within theProjectarea thisformationisaround410mthick.Gray(1968)statesthattheaverageporosityofthesandstoneintheRewanFormationis16to17%,andhydraulicconductivityvariesfromnegligibleinthelowerRewanto1.25x10‐3m/dintheupperRewanFormation.
3.2.3 Permian coal measures
The Permian sequence in this area comprises the Back Creek Group and Blackwater Group.Blackwater Group comprises the Baralaba Coal Measures which is made up of the uppereconomicallyvaluable coalmeasuresapproximately220m thick (inMouraarea) and the lowerKaloolaMemberabout120mthick(inthesamearea)comprisingmudstonesandthincoalbeds.Thenumberofcoalseamsvariesbetweenthenorthandthesouth,howeverfourmainseamsareidentifiedintheBaralaba‐Bananaareacomparedto12furthertothesouth.
The coal seams are considered to be themost permeable unitwithin theBaralaba/Rangal CoalMeasures.The lowerKaloolamembercomprisessandstones, tuffsandmudstoneswiththincoalpliesandisconsideredtobelowpermeabilityunit.
Groundwaterrechargewithinthecoalseamsoccursviadirectrainfallrechargeattheoutcrop,andleakage from the overlying aquifers. The discharge is likely to be via lateral flow and bygroundwaterextractionasaresultofcoalseamgasandminingactivities.
3.2.4 Hydrogeological properties
Permeabilitytestinghasbeenundertakenovertheprojectareatargetingmainlycoalseams.ForotherhydrogeologicalunitsthedatawasobtainedfromliteratureintheBowenBasin.AsummaryofvaluesisprovidedinTable3‐2belowincludingreferences.

Draft Underground Water Impact Report ‐ ATP 56P Harcourt Petroleum N.L.
Draft Underground Water Impact Report ‐ ATP 564P 3‐7
Table 3‐2: Summary of hydrogeological properties for major HSUs in the Bowen Basin.
Formation Type Kh [m/d] Kv [m/d] T [m2/d] Sy [‐] Ss [1/m] Source
Quaternary Alluvium Aquifer
1 to 40 0.2‐2 0.05‐0.18 0.0005 2
100 10 0.25 0.001 1
0.7‐1.5 6 to 15 3
10 1 0.2 0.0001 7
0.088‐0.38 5
Tertiary Basalt Aquifer 0.005‐0.19 5
0.05 0.005 0.05 0.00005 2
Clematis Sandstone Aquifer 0.0025 ‐2.5 0.2 8
Rewan Formation Aquiclude
0.00001‐0.0001
0.000001‐0.00001 0.005 0.000001 1
0.00075 0.0000001 0.05 0.00005 2
0.1 0.05 0.000005 6
Rangal and Baralaba Coal Measures
Coal Seams, Aquifers
0.0028‐0.47 0.008‐1.9 4
0.3‐178.6 3
0.000001‐1 0.000001‐1 0.01 0.000001 1
0.000041‐0.16
0.0000083‐0.082 0.01 0.0000002 2
0.111‐0.9 0.08 0.0004 7
5 0.05 0.000005 6
0.001‐20 0.01‐0.05 10
Interburden, Aquicludes
0.0001 0.00000007 0.05 0.00001 2
0.1 0.05 0.000005 6
Back Creek Group Aquitard/ Basement 0.01‐0.001
0.001‐0.00001 0.03‐‐0.18 5E‐4 ‐ 5E‐6 9
Source of data is 1: AGE (2006), 2: Ausenco‐Norwest (2012), 3: JBT (2012), 4: Parsons Brinckerhoff (2011), 5: URS (2009), 6: BHP Billiton Mitsubishi Alliance (2009), 8: Gray (1968), 9: URS (2012), 10; Simeone, S.F. and Corbett, B.J. (2003)
3.3 Conceptual hydrogeological model
3.3.1 Groundwater levels and flow
The primary source of groundwater datawas the Department of Natural Resources andMines(DNRM)groundwaterdatabase,fieldsurveyofregisteredboresandhistoricaltestingofwellsforcoal seam gas purposes. Within the Project area water level data is available for alluviumassociatedwithcreeksandrivers,Tertiarybasalts,theClematisSandstoneandtheMoolayemberFormation and the Rewan Formation, the Baralaba CoalMeasures and the Gyranda Formation.However,notallboreshaverecordedwaterlevels.
Thisdatasetincludes256boreswithina10kmperimeteroftheATP564Pboundary.Groundwaterlevels in the shallow alluvium vary from 0.5 to 20 m below ground. Figure 3‐3 shows theinterpreted groundwater level contours within the alluvium and Tertiary basalt using the fulldataset of 855 bores within a 17,600 km2 area around ATP 564P that was obtained from thegroundwater database. Groundwater flow within these shallow aquifers tends to follow thetopography and is generally toward local rivers and creeks. The list of bores used is given inAppendixA.Theyieldinthoseboresaverages9L/swiththemaximumrecorded65L/sforaboreintheKrombitCreekalluvium(DNRMgroundwaterdatabase).Overtwothirdsoftheboreshavestatedyieldslessthan2L/s(DNRMgroundwaterdatabase).

Draft Underground Water Impact Report ‐ ATP 56P Harcourt Petroleum N.L.
Draft Underground Water Impact Report ‐ ATP 564P 3‐8
Figure 3‐3 Interpreted water level contours in the alluvium and basalt

Draft Underground Water Impact Report ‐ ATP 56P Harcourt Petroleum N.L.
Draft Underground Water Impact Report ‐ ATP 564P 3‐9
Thedatabaseholdsrecordsfor18DNRMregisteredboresinstalledintheClematisSandstoneandtheMoolayemberFormationwithrecordedwaterlevels;thesearelistedinTable3‐3below.Thewater strike (during drilling) in these two hydrostratagraphic units varied from 5.6 mbgl to33.8mbgl,howeverthisinformationwasrecordedwhentheboreswereinstalledandmaynotberepresentativeofcurrentconditions.Itisalsonotedthattheseboresarelocatedintheareawheretheseunitsoutcropandthereforerepresenttheshallowandunconfinedpartoftheaquifer.Wateryield is low,generallybelow1L/s.Figure3‐4 showsthe interpretedgroundwatercontours forthe Clematis sandstone and the Moolayember Formation based on the available groundwaterlevelswithintheregisteredbores.Theinterpretedgroundwaterflow(basedondataavailablefortheareatothewestoftheProject) istothewestandfollowstheoveralldipofthesedimentarysequence.
Table 3‐3 Summary of registered bores in the Clematis sandstone and the Moolayember Formation
Bore ID (RN) Latitude Longitude Aquifer Water quality
(µS/cm) Yield (L/s)
Standing water level (mbgl)
30691 ‐24.9414 150.0748 Moolayember Formation
NA 0.22 33.8
62042 ‐24.3239 150.4521 Moolayember Formation
Brackish 0.63 21.3
89556 ‐24.554 150.3769 Moolayember Formation
Salty 0.5 20
89623 ‐24.3505 150.4383 Moolayember Formation
NA 0.4 18.3
89692 ‐24.418 150.4254 Moolayember Formation
Brackish 0.78 17.7
128305 ‐24.8742 150.1597 Moolayember Formation
Potable/Brack
ish 0.78 16.5
44057 ‐24.4001 150.4814 Moolayember Formation
6900 0.5 15.9
62557 ‐25.2709 149.6703 Moolayember Formation
6600 0.25 15.2
62558 ‐24.374 150.5113 Moolayember Formation
2700 0.76 15
89948 ‐24.3331 150.4252 Moolayember Formation
4800 1.4 14.17
44055 ‐24.3057 150.4547 Moolayember Formation
6150 0.76 12
62632 ‐24.427 150.5041 Moolayember Formation
2720 0.63 9.3
44056 ‐24.3409 150.4523 Moolayember Formation
1555 0.95 8.6
67007 ‐24.3651 150.4523 Clematis Sandstone
990 1.89 18.29
89557 ‐24.5701 150.3711 Clematis Sandstone
Potable 1.9 8
43557 ‐24.3815 150.4996 Clematis Sandstone
NA NA NA
47008 ‐24.3046 150.4258 Clematis Sandstone
900 0.08 5.6
43557 ‐24.3815 150.4996 Clematis Sandstone
570 0.39 27.58
Note: Information from the DNRM groundwater databaseNA –information not available

Draft Underground Water Impact Report ‐ ATP 56P Harcourt Petroleum N.L.
Draft Underground Water Impact Report ‐ ATP 564P 3‐10
Figure 3‐4 Interpreted groundwater contours in the Clematis sandstone and the Moolayember Formation

Draft Underground Water Impact Report ‐ ATP 56P Harcourt Petroleum N.L.
Draft Underground Water Impact Report ‐ ATP 564P 3‐11
WaterlevelinformationisavailableforfiveboresinstalledinBaralabaCoalMeasures,summaryisprovidedinTable3‐4.
Table 3‐4 Summary of registered bores installed in the Baralaba Coal Measures
Bore name (RN)
Latitude Longitude Aquifer Electrical
Conductivity (µS/cm)
Yield (L/s) Standing water level (mbgl)
84909 ‐24.3865 150.4352 Baralaba Coal Measures
Brackish 0.5 33.1
84912 ‐24.3163 150.4192 Baralaba Coal Measures
8600 1.33 20.5
84913 ‐24.3572 150.5054 Baralaba Coal Measures
4600 0.52 20
128169 ‐24.3175 150.4638 Baralaba Coal Measures
NA 1.4 13
128045 ‐24.424 150.5189 Baralaba Coal Measures
870 1.5 11
Note: NA –not available
Groundwater levels intheBaralabaCoalMeasuresrangefrom11mbglto33.1mbgl,andreflectthestatusintheshallowunconfinedpartoftheaquifer.Therecordedyieldisrelativelylowwithamaximum recorded 1.5 L/s. The available water levels were used in preparation of thegroundwatercontourmap.Figure3‐5showstheinterpretedgroundwatercontoursinthecentralarea only, due to the location of registered bores and therefore available data. The interpretedgroundwaterbasedonthislimiteddatasetistothenorth.However,itisconsideredlikelythatthegroundwater gradient in this unit is to the northwest and is influenced by the dip of the coalmeasurestosomedegree.

Draft Underground Water Impact Report ‐ ATP 56P Harcourt Petroleum N.L.
Draft Underground Water Impact Report ‐ ATP 564P 3‐12
Figure 3‐5 Interpreted contour maps for Baralaba Coal Measures

Draft Underground Water Impact Report ‐ ATP 56P Harcourt Petroleum N.L.
Draft Underground Water Impact Report ‐ ATP 564P 3‐13
3.3.2 Aquifer recharge and discharge
Rechargetoshallowalluviumandbasaltoccursdirectlyviarainfallrecharge,withsmallvolumesof leakage from the losing/ephemeral streamsystems.Someconnectivitybetweengroundwaterandthesurfacewatersystemisevidentanditislikelythatsomecontributiontodeeperaquifersismadebyflowfromtheoverlyingvolcanicsystem.
Groundwater recharge toTriassicandPermianunitsalsooccursviadirect recharge to the rockoutcrop.Wherethesearecoveredbyyoungerbasalt flowsandTertiaryunits,vertical leakage ispossible.
Thecumulativedeviationfrommean(CDFM)methodisoftenusedtoidentifywhetherobservedwaterlevelfluctuationsareduetorainfallrechargeorotherprocesses.CDFMistheaccumulateddifferencebetweentheactualrainfallrecorded(e.g.inamonthorayear)andthelongtermmean.If there is poor correlation between groundwater level hydrographs and the CDFM, it may beconcluded that rainfall recharge is not significant, or that some other recharge processes aredominant(e.g.regionalinflow,upwardleakagefromthedeeperaquifersystemsetc.).
TheclosestBureauofMeteorology (BoM)rainfall station (Stationnumber039071) is locatedatMoura. The data from this station was used in the CDFM analysis, along with long termgroundwater level data from bores installed in the alluvium and the Rewan Formation. Thehydrographsanddataarefurtherdiscussedinthenextsection.
3.3.3 Historical groundwater level trend analysis
DNRMhaveanumberof long termmonitoringboreswithin theProjectarea,mostofwhichareinstalledinalluvium,namelyCastleCreekAlluviumandDawsonRiverAlluvium.Thedatarangesfor a period from 1968 to present. A small number of bores installed in the MoolayemberFormationandRewanFormationhavealsobeenmonitoredonacontinualbasissince2001.
Figure3‐6 showshydrographs forbores installed inshallowDawsonRiveralluvium,whicharesuperposedonthelongtermrainfalldatapresentedasCDFM.
Selected hydrographs for the Dawson River alluvium are plotted inFigure3‐6 these generallyindicate that groundwater level reacts to rainfall recharge events; however the response issubdued during recession periods and pronounced during recovery periods. Thismay indicatethatthereisagoodconnectionbetweenthisaquiferandsurfacewaterwhichmostlikelyprovidesrechargetotheaquiferduringlowrainfallperiods.Theobservedgroundwaterlevelsfluctuatebyupto5mduringthemonitoredperiod.

Draft Underground Water Impact Report ‐ ATP 56P Harcourt Petroleum N.L.
Draft Underground Water Impact Report ‐ ATP 564P 3‐14
Figure 3‐6 Hydrographs for selected bores installed in the Dawson River alluvium
A small number of bores installed (4) andmonitored in Castle Creek alluvium, indicate similarpattern(seeFigure3‐7),withtheresponsetorainfallevidentduringrechargeperiodsbutabsentorminorduringrecessionperiods.Groundwaterlevelsfluctuateovertimebyupto5mwithintheregisteredboresinthisaquifer.
Figure 3‐7 Hydrographs for bores installed in Castle Creek alluvium
ThehydrographsforboresinstalledintheMoolayemberFormation(seeFigure3‐8),showminorfluctuations over time with a maximum variation of 0.5 m between 2004 and mid 2010.Groundwaterdoesnotrespondtoshortdurationrainfallevents,with thewater levelremainingstableorrisingslightlyinextendedwetperiods.

Draft Underground Water Impact Report ‐ ATP 56P Harcourt Petroleum N.L.
Draft Underground Water Impact Report ‐ ATP 564P 3‐15
Figure 3‐8 Hydrographs for bores installed in the Moolayember Formation
Hydrographs for twobores installed intheRewanFormation(seeFigure3‐9) indicatethat thisHSU is not actively recharged by rainfall. Themaximumwater level fluctuation is up to 0.8mbetween2004and2010.Thewaterlevelremainsstableovertime,withaslightriseunlikelytobeassociatedwithspecificrechargeevents.
Figure 3‐9 Hydrographs for bores installed in the Rewan Formation

Draft Underground Water Impact Report ‐ ATP 56P Harcourt Petroleum N.L.
Draft Underground Water Impact Report ‐ ATP 564P 3‐16
3.3.4 Groundwater quality
Groundwater quality datawas obtained from theDNRMdatabase and from field investigationsundertakenaspartofthisUWIR.
The information available from the database indicates that groundwater within alluvium andTertiary basalt is fresh to saline,with salinity up to 5000 µS/cm in the Callide Creek alluvium,1050 µS/cm in the Castle Creek alluvium, up to 10000 µS/cm in the Dawson River alluvium,7800µSintheKroombitRiveralluviumand6750µS/cmintheProspectCreekalluvium.
Thegroundwaterqualityof theMoolayemberFormation is typicallybrackish tosaline,with therecorded salinity ranging from 1555 µS/cm to 6900 µS/cm (Table 3‐3). Within the Clematissandstonethewaterqualityislesssalineanddescribedas“potable”withthemaximumreportedsalinitybeing990µS/cm.
WaterqualityrecordedintheDNRMdatabasefortheBaralabaCoalMeasures,indicatesthatthegroundwaterisbrackishwithmaximumrecordedsalinitybeing8600µS/cm(Table3‐4).
InadditiontoareviewofthegroundwaterdatabasefieldworkwasundertakeninJanuary2013.Fieldworkinvolvedgaugingofgroundwaterlevels,purgingandsamplingofselectedgroundwaterboreswherepossible.SampledboresareincludedinFigure3‐10.ThewaterlevelsareprovidedinTable3‐5andwaterqualityinTable3‐6.Someoftheboreswherewaterlevelwasmeasuredwerenotavailableforwaterqualitysampling.
Table 3‐5 Summary of water levels as recorded during field sampling
Closest registered bore (RN)
Field ID Formation Latitude Longitude Surface Elevation (mAHD)
Depth to Ground‐water (mbgl)
Ground‐water
elevation (mAHD)
Undi 01 Alluvium ‐24.5392 149.9927 116.42 7.281 109.14
Undi 02 Alluvium ‐24.5428 149.9800 114.20 12.235 101.97
13030385 13030385 Dawson River
Alluvium ‐24.9256 149.9773 136.78 9.2 127.58
13030393 13030393 Dawson River
Alluvium ‐24.9218 150.0994 142.04 4.609 137.43
13030394 13030394A Dawson River
Alluvium ‐24.9152 150.0910 142.29 5.188 137.10
84914 84914 Gyranda ‐24.3572 149.9750 103.99 17.624 86.37
84915 84915A Gyranda ‐24.3755 149.9936 108.29 26.395 81.90
84915 84915B Gyranda ‐24.3755 149.9936 108.29 26.68 81.61
128584 Stockyard Unknown ‐24.5928 149.9533 109.45 13.678 95.77
13030830 13030830 Rewan Group ‐24.6137 149.8413 137.53 28.473 109.06
573 13030573 ‐24.9005 150.1120 150.41 8.868 141.54
738 13030738 ‐24.9409 150.0743 140.82 7.855 132.96
9239 9239 Gyranda ‐24.9726 150.0779 142.53 5.214 137.31

Draft Underground Water Impact Report ‐ ATP 56P Harcourt Petroleum N.L.
Draft Underground Water Impact Report ‐ ATP 564P 3‐17
Table 3‐6 Summary of field parameters recorded during field investigations
Field ID Date visited Electrical
Conductivity (µ/cm)
DO (mg/L)
ORP (mV)
pH Temp (oC)
Formation
13030385 19/01/2013 1482 0.54 ‐203.3 7.19 24.6 Dawson River Alluvium
13030394A 16/01/2013 1240 1.34 ‐53.4 6.89 23.2 Dawson River Alluvium
84914 14/01/2013 1382 1.03 ‐213.7 7.35 24.6 Gyranda
84915A 14/01/2013 2319 2.32 ‐232.5 7.19 25.4 Gyranda
9239 19/01/2013 4600 2.47 ‐78.3 7.97 28.3 Gyranda
13030830 18/01/2013 25978 7.65 ‐87.4 7.67 27.2 Rewan
128587 18/01/2013 992 4.15 ‐32.3 7.45 26.1 Unknown
Thegroundwaterfielddataindicatethatgroundwaterintheshallowalluviumisofrelativelygoodquality(freshtobrackish),whilethewaterqualityinthestratigraphicallylowerRewanFormationispoor(saline).ThewaterqualityofthesamplestakenfromtheGyrandaFormationisrelativelybrackishwithECupto4600(µS/cm).
Thewater quality data collected in the field alignswellwith overallwater quality given in theDNRMgroundwaterdatabase.
Full laboratory analysis of samples taken during January 2013 fieldwork is provided inAppendixC.
WaterqualityfromtheBaralabaCoalMeasureswasobtainedfromlimitedsamplingundertakenin2009and2010.TheresultsaresummarisedinTable3‐7.
Table 3‐7 Summary of water quality from production wells in Baralaba Coal Measures
Parameter Average value
pH 8.4
Electrical Conductivity (µS/cm) 10582

Draft Underground Water Impact Report ‐ ATP 56P Harcourt Petroleum N.L.
Draft Underground Water Impact Report ‐ ATP 564P 3‐18
Figure 3‐10 Sampled Groundwater Bores ‐ January 2013

Draft Underground Water Impact Report ‐ ATP 56P Harcourt Petroleum N.L.
Draft Underground Water Impact Report ‐ ATP 564P 3‐19
3.3.5 Aquifer connectivity
RegionallywithintheBowenBasin,northwesttosoutheasttrendingfaultsrunthroughtheprojectarea.ThisfaultingisasaresultoftectonicactivityfollowingtheEarlyPermian(Silwaetal.2008).These faults exhibit significant throw and are believed to act as groundwater barriers toundergroundwater flow east‐west across the faults. Numerousminor fault zones are presentwithin the project area, and within the central area a reverse fault withmapped with verticalthrowofover60m.Geologicalinterpretationofaerialphotographsandcoressuggestthatalocalsetoffaultstrendseast‐west,thestratabeingdownthrownonthesouth(Chong,1971).Areviewof groundwater levels in monitoring water bores relative to the faults in the project area wasinconclusiveindeterminingwhetherthefaultstrulyaresealing,asinsufficientdataexists.
Connectivitybetweenunderlyingandoverlyingaquifershasnotbeenassessedthroughpumpingtests,howeverlongtermmonitoringandwaterqualityanalysisprovidessomeinformationontheaquiferconnectivity.Generally,thesuperficialalluvialaquiferisseparatedfromtheBaralabaCoalMeasures by low conductivity interburden and the low conductivity Triassic Rewan Formation.Reviewoflongtermalluvialtrendanalysisindicatesthatthefluctuationinshallowaquiferaretheresult of rainfall recharge condition and are not impacted by numerous gas testing that werehistorically undertaken in the vicinity of the project area. In addition, the water quality datasuggests that there is limited vertical connectivity between the alluvium and the underlyingaquifersbasedonthegenerallybetterwaterqualitywithinthealluviumcomparedtotheClematisSandstoneandtheBaralabaCoalMeasures.
3.3.6 Groundwater use
AreviewofDNRMdatabasewasundertakentoidentifytheregisteredwaterboresusewithintheATP564Parea.Noinformationwasfoundwhichindicatestheboreuse,howeverduringthefieldassessment itwas foundthat theboreuse in thisarea ispredominantly forstockwateringwithsomeboresinisolatedareasusedfordomesticsupply.
3.3.7 Summary
The hydrogeological characterisation for ATP 564P can be summarised by the following keypoints,withreferencetoFigure3‐1toFigure3‐9:
The sedimentary sequence comprises four hydraulic units (superficial Quaternary/Tertiary,Triassic,Permiancoalseamgroups,andlowerPermian)withvarioushydraulicconductivities.TheolderPermianunitsoutcropover the central and easternpart of theproject,while theTriassicunitsoccurtothewest.ThepresenceoftheMimosaSynclinetothewestofATP564Presultsinthewholesedimentarysequencedippingrelativelysteeplytowardsthesynclineaxisatabout10to40degrees;
The project area is bound to the east by the Banana Fault which extends in a north southdirection (similar to other structures in the Bowen Basin), and to the south by graniteintrusions.Tothewest,theaxisofMimosaSynclinerepresentsthebarriertoflow;
Groundwaterflowinthe lowpermeabilityTriassicandPermianstrata isrelativelyslowandhas long residence times; therefore the groundwater quality is generally poor as thewaterslowly flows through the rock dissolving soluble salts. Available groundwater data indicatethatthegroundwaterinthePermianandTriassicstrataissaline;
Groundwaterflowintheshallowbasaltandalluviumfollowsthetopography.TheflowintheClematisSandstoneisinaneasterlydirectionandfollowsthedipofthestrata.Theassessment

Draft Underground Water Impact Report ‐ ATP 56P Harcourt Petroleum N.L.
Draft Underground Water Impact Report ‐ ATP 564P 3‐20
offlowintheBaralabaCoalmeasures(tothenorthwest)islimitedtoboreslocatedalongthestructural lineament extending north‐south. This interpretation is based on data collectedover different time periods and within the outcrop zone only, and may not be entirelyaccurate;
Waterlevelcontouringoftheheadsinalluviumandbasaltdemonstratesthatheadscorrelatewithtopography,indicatingrechargeathigheroutcropareasanddischargeatlow‐lyingareas.The rainfall represents important source of recharge to alluvial aquifers and water levelfluctuationof5mreflectsthisfinding;
In areas where the Permian strata outcrops and is not overlain by alluvium or basalt, theaquifer is unconfined to semi‐confined. With depth, underlying units such as the RewanFormationandtheBaralabaCoalMeasuresbecomeconfined;
The shallow aquifer system is recharged mainly through rainfall infiltration. Groundwaterrechargeoccursinareasofhighreliefwherestrataoutcrops,aswellasthroughbetterdrainedsoils in themid and lower slopes and in the valley where Permian rocks subcrop. Deeperhydrostratagraphicunitsarerechargedattheoutcrop;
Where the water table is shallow, evapotranspiration can become an aquifer dischargeprocess;and
Historical water level trend and water quality data analysis indicates that there is limitedconnectivity between the shallow alluvial aquifers and the deeper Baralaba CoalMeasures.ConnectivityisfurtherlimitedbythepresenceofthelowpermeabilityRewanFormation.

Draft Underground Water Impact Report ‐ ATP 564P 4‐1
Section 4 Impacts to Groundwater System
(Part C)
Possible changes in groundwater levels in aquifers affected by the extraction of undergroundwater rights in ATP 564P are predicted through the use of a numerical groundwater model.Throughoutthisanalysis,thefocusisonaquiferslikelytobepossiblyaffectedbyCSGpumping.
4.1 Modelling methodology
4.1.1 MODFLOW‐SURFACT model implementation
The numerical groundwater flow model uses MODFLOW‐SURFACT (SURFACT) developed andmaintained byHydroGeoLogic Inc (HydroGeoLogic 1998). SURFACT is based on theMODFLOWcode developed by the United States Geological Survey (McDonald and Harbaugh,1988) andincludesseveralmodificationstoaddressrecognisedlimitationsofMODFLOW.Themodificationsinclude better handling of dry cells, more accurate tracking of the water table and additionalrobustsolverspackages(HydroGeoLogic,1998,PandayandHuyakorn,2008).TherequirementofMODFLOWtoretainlaterallycontinuousmodellayerscanresultinnumerousthinandmostlydrycells that can be problematic in areas where the water table extends across multiple layers,particularlyinareasofsteeptopographicgradient.SURFACTischoseninthisstudybecauseitisbetterabletosimulatetheseconditionsandprovidesbetternumericalstability.Allmodellayersaredefinedasconfinedorunconfineddependinguponwhether thewater table lieswithineachparticularmodelgridcell.
4.1.2 Model domain and grid
Themodel domain covers a total area of 15,000 km2 and has an active area of 6,403 km2. Themodel grid comprises 150 rows, 100 columns and 6 layers, giving a total of 90,000 cells(37,994activecells).ThegridisshownregionallyinFigure4‐1.Thesouth‐westernextentofthemodeldomainisboundedbytheextentofsub‐croppingJurassic formationsandsteeplydippingMimosaSyncline.ThewestandnorthernmodelextentsareplacedsufficientlywestandnorthoftheproposedCSGpumpingarea. TheeasternmodelextentisboundedbytheBananaFaultandvolcanics.
A rectangular model grid, rotated by 6 degrees (anti clockwise) to align with the Basinmorphology, is adopted. The model origin is at 769209.6E, 7177873.346N (MGA Zone 55,GDA1994)

Draft Underground Water Impact Report ‐ ATP 56P Harcourt Petroleum N.L.
Draft Underground Water Impact Report ‐ ATP 564P 4‐2
Figure 4‐1 Model Domain

Draft Underground Water Impact Report ‐ ATP 56P Harcourt Petroleum N.L.
Draft Underground Water Impact Report ‐ ATP 564P 4‐3
Auniformcolumnandrowspacingof1kmisassigned.Themodelgriddiscretisationiscoarseandisconsideredcommensuratewiththecurrentunderstandingofthesitehydrogeology.Refinementofthemodelgridisnotconsideredwarrantedatthisstageasitwouldnotbeexpectedtoincreasetheconfidencelevelofmodelpredictionswithoutadditionalsitespecificdata.
4.1.3 Model layers
A 3D hydrogeological model was generated using the Baralaba Coal Measures (BCM) depth,outcrop zones, bore stratigraphy, and nominal dips and thicknesses from the literature. Themodelisrepresentedby6layersintotal(Figure4‐2andFigure4‐3). Table4‐1correlatesthemodel layers and stratigraphy. The extent, top and base of each layer used in the numericalgroundwatermodelhasbeensourcedfromthe3DHydrogeologicalmodel.DuetorequirementsofSURFACT (specifically thatmodel layers are not allowed to be discontinuous)where geologicalmodellayersoutcropthendisappear,theyarecontinuedintheSURFACTmodelatathicknessof1metre and are assigned the parameters of the layer directly below them. Where the BCMoutcrops for example, in the SURFACTmodel it is overlain bymodel layers that in other areasrepresent the full thickness of the Kaloola and Gyranda Formation. As previously noted, theClematis Sandstone does not represent a standalone unit within the Bowen Basin, rather acollection of lithologies in a certain area. The Clematis Sandstone is therefore not allocated amodel layer of its own, but where the Clematis Sandstone, the Rewan Formation and theMoolayember Formation cross into the area designated as "Clematis", they are all allocated theClematisSandstonehydraulicparameters.
Figure 4‐2 3D model of the ground surface and 6 model layers (base of all layers are presented, the alluvium is directly under the ground surface)

Draft Underground Water Impact Report ‐ ATP 56P Harcourt Petroleum N.L.
Draft Underground Water Impact Report ‐ ATP 564P 4‐4
Figure 4‐3 Down dip cross section through modelling area (cross section A‐B)
Table 4‐1 Model Layers and Stratigraphy
Model Layer Nominal Thickness (m) Equivalent Stratigraphy
1 30 Dawson Creek and Boam Creek Alluvium. Sediments in some places.
2 ‐ Mainly Clematis sandstone but Rewan Formation and Moolayember Formation in places
3 1350 Rewan Formation
4 230 Baralaba Coal Measures
5 120 Kaloola member
6 500 Gyranda Formation
Thetoplayerofthemodelisintendedtorepresentthewatertableaquifer,comprisingalluviumandweathered Permian sequences. A uniform thickness of 30m is assumed for this layer. Atypicaleast–westcross‐sectionthroughthemodeldomainisshowninFigure4‐4.
Figure 4‐4 East ‐ west model cross section showing the stratigraphy of row 45 (Northing ~7287800m)

Draft Underground Water Impact Report ‐ ATP 56P Harcourt Petroleum N.L.
Draft Underground Water Impact Report ‐ ATP 564P 4‐5
4.1.4 Boundary conditions
Anoflowboundaryconditionisassignedaroundtheperimeterofthemodel.Theuseofanoflowboundary is conservative and is considered appropriate given the uncertainty in the sitehydrogeologyandbroaderhydrogeologybeyondthemodeldomain.
Auniformrechargerateof18.25mm/yr isassignedto theareaofalluvialsdefinedviaregionalgeologytorepresentthebackgroundrainfallderivedrecharge.Evapotranspiration(ET)fromthewatertableissimulatedwithanETrateof2m/yrassignedtothetoplayerofthemodelandanextinctiondepthof5m.
ModelcellsinhighelevationareasofLayer1(e.g.noaquiferspresent)areinactivated(noflow).DraincellshavebeenassignedtomodelLayer1forallthemajorsurfacedrainages(Figure4‐5).Drain elevation equates to topographic level minus 1 to 7 m (to represent a nominal base ofdrainage channel). A conductance value of 1000 m2/d has been assigned to drain cells. Thesedrainsrepresenttheeffectthatdischargetoshallowsurfacewaterbodies(e.g.intermittentcreeksandstreams)wouldhaveonthealluvium.
The implication of the selected boundary conditions is that under a baseline condition all ofrecharge into themodel is balanced by ET and drain flow. Anywater removed from simulatedproductionactivitieswillbederived initially fromaquifer (andboundingaquitard) storage.Thevolume of water removed by ET and change will change if the simulated production activitiesresultindrawdownatthewatertablewherethewatertablelieswithinthespecifiedETextinctiondepthorabovethedrainbaseelevation.

Draft Underground Water Impact Report ‐ ATP 56P Harcourt Petroleum N.L.
Draft Underground Water Impact Report ‐ ATP 564P 4‐6
Figure 4‐5 Model boundary conditions on Layer 1

Draft Underground Water Impact Report ‐ ATP 56P Harcourt Petroleum N.L.
Draft Underground Water Impact Report ‐ ATP 564P 4‐7
4.1.5 Current conditions
The available groundwater level data indicate that the water table is a subdued reflection oftopography, with recharge occurring in areas of topographic high and discharge in areas oftopographic low.The interpreted groundwater flowdirection is to thenorth. FewgroundwaterleveldatafromdeeperHSUswereavailableforcalibration.
The groundwater elevation as simulated at the end of 2012 is shown in Figure 4‐7. ThetopographiccontrolonthebaselinewatertableissimulatedbyETanddrains.Duetothechoiceofboundaryconditions,thesimulatedwatertableisnotstronglysensitivetotheassumedhydraulicpropertiesanddoesnotassist inconstraining thehydraulicproperties. Rather, theobjectiveofthesteadystatecalibrationpresentedhereinistoestablishasetofinitialconditionsforpredictivesimulations that are consistent with the available hydraulic head information and assumedhydraulicproperties.
Figure4‐6presentstheplotofobservedhydraulicheadagainstsimulatedhydraulicheadforthesteadystatemodel. The56observationwater levelshadarangeof51.4m. Themodelledrootmeansquared (RMS)errorwas3.28m,givinga scaledRMSerrorof6.4%.This is consideredagoodfitandcomplieswithAustralianGroundwaterModellingGuidelines(SRMPbetween5%and10%).
ThecalibratedestimatesofhydraulicpropertiesarepresentedinTable4‐2below.AllvaluesfallwithintheliteraturerangepresentedinSection3.2.4.
Table 4‐2 Calibrated model hydraulic properties.
Unit KH (m/d) KV (m/d) Ss (1/m) Sy (‐)
Alluvium/Weathered zone 20 2 1 x 10‐6 0.05
Clematis sandstone 0.2 0.02 1 x 10‐6 0.01
Rewan Formation 1 0.001 1 x 10‐6 0.01
Baralaba Coal Measures 0.05 1 x 10‐5 1 x 10‐6 0.01
Kaloola member 0.01 0.001 1 x 10‐6 0.01
Gyranda Formation 0.01 0.001 1 x 10‐6 0.01

Draft Un
Figuresteady
nderground Wate
e 4‐6 Calibraty‐state mode
er Impact Report
ion scatterplel.
Draft U
‐ ATP 564P
ot of simulat
Underground
ted hydraulic
Water Impact
c head versus
t Report ‐ ATP
s observed hy
P 56P Harcou
ydraulic head
urt Petroleum N
4‐8
d [m] for
N.L.

Draft Underground Water Impact Report ‐ ATP 56P Harcourt Petroleum N.L.
Draft Underground Water Impact Report ‐ ATP 564P 4‐9
Figure 4‐7 Simulated water table at end of 2012

Draft Underground Water Impact Report ‐ ATP 56P Harcourt Petroleum N.L.
Draft Underground Water Impact Report ‐ ATP 564P 4‐10
4.1.6 Prediction methodology
The predictive simulations consider the potential impacts to groundwater due to the proposedproductionprogram.Theproductionprogramwilldrawdownthewaterlevelswithinthetargetedcoal seams and bounding HSUs. Possible pathways of drawdown impacts to the water tableincludelateralflowviacoalseamsandverticalflowviaoverburden.
ThewaterproductionfromgaswellsissimulatedusingSURFACT’sWELLpackagebyprescribingtheproductionrate.ThesimulatedCSGpumpingproduceswaterscreenedfromtheBaralabaCoalMeasures(modellayer4)foraperiodof3yearsafterwhichthepumpingisswitchedoffandthemodelrunforafurther40years.TheproductionschedulemodelledisdetailedinTable4‐3andTable4‐4with the location of CSGwells shown inFigure4‐8. Due to proximity of ATP602Ptenement, and the knowledge of proposed pumping rates over the next three years, thisinformationwasalsoincludedinthegroundwatermodel.
Table 4‐3 ATP 564P predicted water production schedule
Bore Phase Number of Pumping
wells Year 1 Pumping rates (kL/d)
Year 2 Pumping rates (kL/d)
Year 3 Pumping rates (kL/d)
ATP 564P Year 1 4 15.9 12.7 9.1
ATP 564P Year 2 6 0 12.7 9.1
ATP 564P Year 3 4 0 0 9.1
All Phases 14 63.6 127.2 127.2
Table 4‐4 ATP 602P predicted water production schedule
Bore Phase Number of Pumping
wells Year 1 Pumping rates (kL/d)
Year 2 Pumping rates (kL/d)
Year 3 Pumping rates (kL/d)
ATP602P Year 1 4 0 7.1 7.4
ATP602P Year 2 5 0 7.1 7.4
ATP602P Year 3 6 0 0 7.4
All Phases 14 0 63.6 111.3
Itisacknowledgedthatthecurrentgenerationofregionalgroundwaterflowmodels,includingthismodel,arenotcapableofsimulating localiseddrawdownatproductionwellsandtheassociatedtwo‐phaseflowofwaterandgasinthenear‐areaofthewells.Theimplicationofneglectingtwo‐phase flow is that drawdown at the wells is likely to be underestimated. The assessment oflocalisedtwo‐phasefloweffectisbeyondthescopeofthisProjectandisnotconsideredwarrantedfor the purpose of assessing the regional scale impact to groundwater due to the proposedproduction program. Additionally it is acknowledged that the Baralaba Coal Measures is asequenceofcoalseamsandinterburdenunitsandthatbycombiningcoalseamsandinterburdeninto a single hydrostratagraphic unit the predicted drawdown will be an average drawdownacrosstheentireunit.Inreality,thedrawdownmayvaryverticallythroughouttheBCM.However,giventheproposedproductionschedulethe inclusionof individualcoalseamsisnotconsideredwarranted.
4.2 Groundwater impact affected areas
4.2.1 Predicted water level decline maps
The Water Act defines the trigger threshold in the water level decline as 5 metres for aconsolidatedaquiferand2metres foranunconsolidatedaquifer. In thegroundwatermodel, theQuaternaryAlluviuminlayer1isdefinedasunconsolidated.Allotheraquiferlayersareclassifiedasconsolidated.Theresultsaredividedintwocategories:theImmediatelyAffectedAreaandtheLongTermAffectedArea.TheImmediateAffectedAreashowstheimpactedzonesduringthefirst
Draft Underground Water Impact Report ‐ ATP 56P Harcourt Petroleum N.L.
Draft Underground Water Impact Report ‐ ATP 564P 4‐11
threeyearsfollowingthereportconsultation(2014to2016).TheLongTermAffectedAreashowstheimpactedzonesatanytimefollowingthethreeyearperiod.
4.2.1.1 Immediately Affected Area maps and bores
The maximum drawdown occurs within the Baralaba Coal Measures at the end of 3 yearsproduction.ThisdrawdownisshowninFigure4‐8.Notethatthedrawdownshowntothesouthof ATP 564P occurs as a result of pumping from the ATP 602P area that was simultaneouslysimulatedinthismodelprediction.ThesimulatedmaximumdrawdownwithintheBCMis1.6m.Hence, therearenoareas thatexceed the5m threshold for consolidatedaquifers. Similarly,noareasexceedthe2mthresholdfordrawdownintheunconsolidatedaquiferinlayer1.
Themodelpredictionisthatnoboreswillbeaffectedwithin3years.
4.2.1.2 Long term Affected Area
AfterthecessationofCSGpumpingthesimulatedmaximumdrawdownwithintheBCMreducestoless than1mwithin a fewmonths and zerodrawdown ispredictedwithin the alluvial aquifer.Hence, there are predicted to beno long termaffected areas that exceed the5m threshold forconsolidatedaquifersorthe2mthresholdforunconsolidatedaquifers.
4.2.1.3 Uncertainty analysis
Giventherelativelysmallvolumesofwatertobeproducedandtheminimaldrawdownimpactspredictedbythecalibratedmodeladetailedpredictiveuncertaintyanalysis(Doherty,2003)isnotwarranted.

Draft Underground Water Impact Report ‐ ATP 56P Harcourt Petroleum N.L.
Draft Underground Water Impact Report ‐ ATP 564P 4‐12
Figure 4‐8 Simulated drawdown in the Baralaba Coal Measures at the end of 3 years CSG pumping.

Draft Underground Water Impact Report ‐ ATP 56P Harcourt Petroleum N.L.
Draft Underground Water Impact Report ‐ ATP 564P 4‐13
4.3 Key findings and review procedures
ThisreportidentifiesareaswhichareImmediatelyAffectedandLongTermAffectedbypredictingdrawdownsabovethetriggerlevels,causedbyundergroundwaterextraction.
Groundwater modelling using the best available information predicts that there will be noImmediate or LongTermAffectedAreas atATP564P in the coal seamswhere extraction takesplaceorintheoverlyingAlluviumaquifer.
These findings depend upon several documents and data sources and will be reviewed on anannualbasistomaintainaccuracyofthemaps.Reviewsareparticularlyimportantwheneverthemodellingassumptionsordatachangesignificantly. Amodelreviewwillbeperformedannuallywhenever new information that is likely to appreciably impact model results is available.Informationwhichmayfallunderthiscategoryincludes:
geological structural information, e.g. from drill holes or geophysical surveys, which maymodifyaquiferextents;
hydrogeological parameters, e.g. from pressure testing or core geophysical analysis, whichmaymodifymodelparametersandaffectaquiferconnectivity;
plannedgroundwateroperations,includingprojectedCSGwaterextractionrates;
calibrationdata,e.g.pressureheadsfromnewmonitoringwells;and
unexpected results from monitoring locations, where impacts do not correspond topredictions.
Afteramodelupdate,newmapswillbedevelopedforassessingtheImmediatelyAffectedandLongTermAffectedAreas.ReportingisfurtherdescribedinSection6.

Draft Underground Water Impact Report ‐ ATP 564P 5‐1
Section 5 Water Monitoring Strategy (Part D)
5.1 Rationale
Theundergroundwatermonitoring strategyhasbeendeveloped to address the findingsof thisUWIR, and to keep track of water level and water quality changes caused by the exercise ofundergroundwaterrightsatATP564P.
Although no Immediately Affected Areas (IAAs) or Long Term Affected Areas (LAAs) wereidentified, the water monitoring strategy proposed has been developed as a precautionarymeasuretoimproveknowledgeofthegroundwaterresourcesinthearea.
LocalregisteredboresareprimarilydrawingawatersupplyfromtheshallowQuaternaryalluvialand Tertiary basalt aquifers. These superficial aquifers are separated from the perforated andexposedintervalsofthecoalseamproductionwellsbylowerpermeabilityinterburdenandRewanformations.Inaddition,theproductionwellboresarecementedandcasedtobestpracticetoavoidaquifer cross‐contamination. Modelling results show no anticipated significant impact in theshallow aquifers. Therefore, the underground watermonitoring strategy will not address thisaquifer.
TherearenospringsidentifiedwithinATP564Porthesurrounding40km,asdiscussedinSection6Therefore,thismonitoringstrategyalsodoesnotincludeprovisionsformonitoringsprings.
5.1.1 Monitoring threshold criteria
Inordertoidentifyadverseimpacts,themonitoringstrategyrequiresthedevelopmentofcriteriathatdetectsignificantchangesagainstbaselineorongoingmeasurements.Thefollowingcriteriawillbeusedtoidentifysignificantchangesinwaterqualityandquantity:
Adverse chemical impacts: Compare concentrations of following analytes to previousmonitoringrounds–ifeither(a)valueexceedshighestpreviousmeasurementby>25%or(b)threesubsequentmonitoringeventsrecordanincreaseinoneormoreanalytesconcentrationthenapotentialadverseimpacthasbeenidentified;and
AdversewaterlevelImpacts:Comparemeasuredwaterleveltopreviousmonitoringrounds– if either (a)water level is lower than previous lowestmeasurement by >5mor (b) threesubsequentmonitoringeventsrecordafallinwaterlevel>1mthenapotentialadverseimpacthasbeenidentified.
ThesecriteriaareincludedintheGroundwaterMonitoringChecklistincludedinAppendixC.
5.1.2 Critical data gaps
As discussed in Section 4, the predicted impacts depend upon some model inputs andassumptionswhicharenotcertain.Thisuncertaintycanaffecttheimpactconclusionsandfuturedatagatheringshouldbedesignedtoimprovemodelcertainty.AprogrammewillbeimplementedatATP564Ptoimproveconfidenceinthemodel.Thiswillinclude:
Harcourt will measure horizontal and vertical permeability in both coal seam aquifer andinterburdenformationsinsituandwithlaboratorytesting.Thesemeasurementswillprovideadditionalcertaintyinthehydraulicconductivityparametersutilisedinthemodel;

Draft Underground Water Impact Report ‐ ATP 56P Harcourt Petroleum N.L.
Draft Underground Water Impact Report ‐ ATP 564P 5‐2
Monitoringofpressureatnearbywellsinthecoalseamsandoverlyingaquifermayassistindetermining aquifer connectivity and hydrogeologic parameters such as permeability andstorativity;and
Regular groundwater level monitoring will be implemented at private bores identified assuitable,therebyprovidingcalibrationdataandextendingknowledgeabouttheimpactofCSGoperationsonaquifers.SeeSection5.2formoredetailonthisstrategy.
5.2 Monitoring strategy and timetable
The monitoring strategy is designed to quantify changes occur as a result of water extractionduringpetroleumoperations.Thestrategycoversthewaterextractedfromthecoalseamsandasa precaution, regional impacts in the area. As there is no Long Term Affected area, baselinesamplingwithinorwithoutATP564Pisnotwarranted.
5.2.1 Extracted underground water
As in thepast,Harcourtwillmaintain recordsof undergroundwater extractedwhile exercisingwaterrights. Thesequantitieswillbetabulatedonadailyandmonthlybasisandgraphedeachyear,andpresentedinastylesimilartoFigure2‐1.Resultswillbeincludedinannualreports(seeSection4).
5.2.2 Field locations
NoregisteredboreswereidentifiedintheaffectedareaoftheBaralabaCoalMeasures.TheDNRMgroundwaterdatabasedoes indicatesomeregisteredbores furtheraway fromtheaffectedarea,althoughitisimpossibletodeterminefromtherecordsinwhichaquifertheboresarescreened.
Although nomonitoring is required as part of theWater Act,monitoring is suggested at a fewlocations within the Baralaba Coal Measures, Clematis Sandstone and the Alluvial aquifer as aprecautionarymeasure.Previouswatercensusidentified42boresofwhich24areconsideredtohave potential to provide meaningful monitoring data, these bores shown in Table 5‐1. Therationale for sampling at these bores is provided in the table. Further efforts will be made toidentify each bores targeted aquifer through liaison with landowners during groundwatersamplingevents.
InadditiontotheboresidentifiedinTable5‐1,boreslocatedneartoCSGtestingintheBaralabaCoalMeasuresshouldbeidentified. Duringinitialmonitoring,investigationintotheexistenceofunregistered bores within the area will also be conducted to ascertain if more appropriatemonitoring locations exist. Should this not be the case, a total of six monitoring bores (acombination of standpipe piezometers and vibrating wire piezometers) will be installed in theBaralaba Coal Measures and alluvium aquifer (number of each to be confirmed following fieldinvestigation)toprovideearlydetectionofpotentialimpactofgasoperationwells.Boreswillbesituatedtomaximizeearlydetectionofanyimpactandthedipofstratigraphicformationsmustbeconsideredwhenselecting locations. Themonitoringnetworkdesignand inspectionof suitablemonitoringboresforthisprojectwillbeundertakenbyaqualifiedhydrogeologist.

Draft Underground Water Impact Report ‐ ATP 56P Harcourt Petroleum N.L.
Draft Underground Water Impact Report ‐ ATP 564P 5‐3
Table 5‐1 Reconnoitred monitoring locations
Bore ID Installed Date
Latitude Longitude Aquifer Purpose
Kia Ora 01 9/05/2005 ‐25.0588 150.0809 Baralaba Coal Measures
Monitoring in Baralaba Coal Measures
Willtony 01 9/05/2005 ‐25.0618 150.0747 Alluvium Regional water levels and Fluctuation analysis
13030823 26/03/2003 ‐25.1247 150.0632 Rewan Regional water levels and Fluctuation analysis
13030824 26/03/2000 ‐25.1247 150.0632 Quaternary Regional water levels and Fluctuation analysis
47605 Unknown ‐25.1503 150.2605 Camboon Volcanics Regional water levels and Fluctuation analysis
Felledman Bottom bore
Unknown ‐25.2672 150.1340 Alluvium Regional water levels and Fluctuation analysis
Undi 01 Unknown ‐24.5392 149.9927 Alluvium Regional water levels and Fluctuation analysis
128584 12/01/2010 ‐24.6034 149.9474 Sand Regional water levels and Fluctuation analysis
13030830 6/04/2003 ‐24.6137 149.8413 Rewan Group Regional water levels and Fluctuation analysis
13030573 Unknown ‐24.9005 150.1120 Alluvium Regional water levels and Fluctuation analysis
13030385 6/08/1969 ‐24.9256 149.9773 Dawson River Alluvium
Regional water levels and Fluctuation analysis
13030393 28/01/1971 ‐24.9218 150.0994 Dawson River Alluvium
Regional water levels and Fluctuation analysis
13030394A 27/01/1971 ‐24.9152 150.0910 Dawson River Alluvium
Regional water levels and Fluctuation analysis
Afterthemonitoringboresarelocatedorinstalled,fulldetailsoftheboresincludingtheregisterednumberorotheruniqueidentifierandthetenureandlocationoftheborewillbeprovidedintheannualreportingforATP564P.
5.2.3 Water level monitoring
Water level monitoring is designed to verify the model predictions and to provide earlynotification of any unexpected water level decline. Standing groundwater elevation will berecorded in Australian Height Datum (AHD). Groundwater levels will be determined using anelectronicdipmeter.Thereferencepointbelowwhichthedepthtowaterwasmeasuredwillberecordedandphotographedsuchthatconsistencywithhistoricalandfuturemeasurementscanbemaintained. Where applicable casing collar height above ground level will be measured andrecorded. The threshold criteria discussed in Section 4 will be utilised to determine ifgroundwaterlevelchangesaresignificant.
Monitoring shall comprisemeasurement of groundwater levels on amonthly basis for the first12months.Oncompletionofoneyearofmonthlymonitoringtoestablishanyseasonalorannualnatural variations itmay be possible to reduce groundwater level sampling to quarterly or bi‐annualasappropriateandbasedontheresultsofmonitoring.
5.2.4 Water quality monitoring
Water quality monitoring is designed to assess whether CSG operations are contributing todecreased water quality within the affected aquifer. Accordingly, the suite of analyticalparameters described inTable5‐2 focuses on parameters whichmay help distinguish aquiferwatersources,andonhydrocarbonoccurrence.AllwaterqualityanalysiswillbeperformedbyaNATAaccreditedlaboratory.

Draft Underground Water Impact Report ‐ ATP 56P Harcourt Petroleum N.L.
Draft Underground Water Impact Report ‐ ATP 564P 5‐4
Monitoringshallcomprisecollectionofgroundwatersamplesfromtheboresonaquarterlybasisforthefirst12months.SampleswillbescheduledforlaboratoryanalysisforthesuiteincludedinTable5‐2.Oncompletionofoneyearofquarterlymonitoringtoestablishanyseasonalorannualnatural variations it may be possible to reduce groundwater quality sampling to bi‐annual orannualasappropriateandbasedontheresultsofmonitoring.
Table 5‐2 Groundwater analytical suite
General Parameters
pH Electrical conductivity Total Dissolved Solids (TDS) Total Suspended Solids
(TSS)
Major ions
Cations Anions
calcium chloride
magnesium carbonate
sodium bicarbonate
potassium sulphate
NutrientsNitrate Nitrite Ammonia
Hydrocarbons
Phenol compounds Polycyclic aromatic
hydrocarbons (PAH)
Total petroleum
hydrocarbons Methane (dissolved)
Samplingwillconformtodetailedqualitymanagementguidelines.Theguidelinesshouldincludeprocedures for sample preservation/packaging/shipping, chain of custody protocol, sampledocumentation, decontamination procedures. All measured data will be subjected to qualityassuranceandqualitycontrolobjectivesondatacompleteness,comparability,representativeness,precisionandaccuracy,andlaboratoryprocedures.
5.3 Reporting program
HarcourtwillprepareanannualreportonthefindingsoftheWaterMonitoringStrategydiscussedin Section 5 and the review of the maps shown in Figure 4‐8 as discussed in Section 4.Information relating to the completion of the monitoring requirements associated with thisUnderground Water Impact Report should be collated annually. The checklist provided inAppendixDshouldbecompletedandattachedtoanyrelevantdocumentationwhichshouldthenbeattachedtothisreport.Anyindicatedactionspromptedbyamaterialchangeintheinformationorpredictionsshouldbeimplemented.
This UWIR will be updated in three years, incorporating the annual reviews and an updatedgroundwater model consistent with the monitoring data collected and other relevant newinformationonthehydrogeologicalregimeorthequantityofwaterproduced.

Draft Underground Water Impact Report ‐ ATP 564P 6‐1
Section 6 Spring Impact Management (Part E)
The Water Act requires UWIRs to identify springs which could be potentially affected byundergroundwaterextractionactivities. For these springswherepredictedwater levelswithinthesourceaquiferwoulddeclinemorethan0.2metres,aspring impactmanagementstrategyisrequired.
6.1 Spring inventory
Adesktopreviewofspringinventorieshasbeencompleted,searchingforspringswithin10kmofATP564Pboundaries. Springsandwatercourseswere identifiedusing the followingsourcesofinformation,andcross‐checkingagainstprojectmaps.
QueenslandGovernmentInformationService(QueenslandWetlandData–Springs)
WetlandInfoWebsite
GreatArtesianBasinResourceOperationPlanSpringRegister
BasedonthesedatanospringshavebeenidentifiedwithintheboundaryofATP564P.Theclosestsprings are located 40 km to the south of the southern area, where no production wells areproposed(Figure6‐1).Basedonthis finding, impacttospringsasaresultof thisUWIRhasnotbeenfurtherconsideredinthisreport.

Draft Underground Water Impact Report ‐ ATP 564P 6‐2
Figure 6‐1 Location of closest registered springs to ATP 564P

Draft Underground Water Impact Report ‐ ATP 564P 7‐1
Section 7 Conclusion
ThisUndergroundWaterImpactReportwaspreparedforHarcourtATP564PinQueensland.ThereportconformstoreportingrequirementslaidoutintheWaterActof2000.
Reviewofpublishedreports, registeredboreextractionandwater leveldata,andprojectedCSGoperationsatATP564Pledtotheidentificationofoneaquiferwhichislikelytobeaffectedbytheexercise of underground water rights. Modelling has predicted that the shallow alluvium andbasalt aquifers are not likely to be affected by underground water extraction. No ImmediatelyAffectedorLongTermAffectedAreaswereidentifiedfortheBaralabaCoalMeasures.
A program was designed to quantify changes in water quality or levels as a result of waterextractionduringtheprojectedpetroleumoperations.Althoughnotrequiredbylaw,thestrategycoversregionalmonitoringinboththeBaralabaCoalMeasuresandprecautionarymonitoringinthealluvialaquifer.
Datagatheringwill allowannual reviewof theaccuracyof themapswhen information changessubstantially.Thecollecteddatawillbereported,andanupdateofthisUWIRwillbegeneratedinthreeyears.

Draft Underground Water Impact Report ‐ ATP 564P 8‐1
Section 8 References
AGE,2006.EnshamCentralProjectEIA‐GroundwaterImpactAssessment.PreparedforHansenConsulting.http://www.ensham.com.au/updated/eis/pdf/Volume‐2_Appendices/APPENDIX%20C%20‐%20GROUNDWATER.pdf
Ausenco‐Norwest,2012,GroundwaterModel,NorthernBowenBasinRegionalModelImpactPredictions,Queensland,Australia.PreparedforArrowEnergyPtyLtd.http://www.arrowenergy.com.au/__data/assets/pdf_file/0018/3870/Appendix‐M_Groundwater‐Model‐Technical‐Report.pdf
BureauofMeteorology(BoM),2013,ClimatestatisticsforMoura,QLD.http://www.bom.gov.au/climate/averages/tables/cw_033013.shtml,viewed11April2013.
BHPBillitonMitsubishiAlliance,2009.DauniaCoalMineProject‐EnvironmentalImpactStatement.AppendixHTechnicalReport:GroundwaterModellingAssessmentofImpactofDauniaCoalMineonRegionalGroundwaterAquifers.http://www.bhpbilliton.com/home/aboutus/regulatory/Documents/dauniaMineEisAppendixH.pdf
Cadman,SJ,LPain,andVVuckovic,1998,BowenandSuratBasins,Clarence‐Moretonbasin,SydneyBasin,GunnedahBasinandotherminoronshorebasins,Qld,NSWandNT,AustralianPetroleumAccumulationsReport11,DepartmentofPrimaryIndustriesandEnergy,BureauofResourceSciences.
Chong,1971CoalresourcesBaralaba–Moura,Kianga‐TheodoreCoalfield,BananaCreekArea,GSQ1971/18,
Doherty,J2003,Groundwatermodelcalibrationusingpilotpointsandregularization,GroundWater,Volume41,pp170‐177.
Dear,J.F,McKellar,R.G.&Tucker,R.M.,1971GeologyoftheMonto1:250000sheet.Rep.neol.Surv.Qd,46.
Gray,ARG,1968,StratigraphicdrillingintheSuratandBowenBasins,1965‐1966,QueenslandDepartmentofMines,ReportNo.22.
JBT,2012.FoxleighPlainsProject‐EnvironmentalImpactStatementGroundwaterReport.PreparedforHansenBailey.http://www.hansenbailey.com.au/assets/pdfs/foxleigh_eis/Appendix%20F%20‐%20Groundwater.pdf
Olgers,F, Webb,A.W, Smith,J.A.J.and Coxhead,B.A 1966. 1:250,000 Geological Series ExplanatoryNotes Baralaba, Sheet SG/55‐4, Bureau of Mineral Resources, Geology and Geophysics,Austrep.102,1‐59
ParsonsBrinckerhoff,2011.MiddlemountCoalProjectStage2EnvironmentalImpactStatement‐Chapter10Groundwater.PreparedforMiddlemountCoal.http://www.pb.com.au/middlemountcoal/09%20EIS%20for%20Public%20Consultation/Volume%202%20Main%20Text/10_Groundwater_110107.pdf

Draft Underground Water Impact Report ‐ ATP 564P 8‐2
QueenslandSpringsDatabaseVersion5(FenshamandFairfax,2008).downloadedfromtheQueenslandQGISwebsitehttp://dds.information.qld.gov.au/DDS/SearchResult.aspx
Simeone,S.F.andCorbett,B.J.(2003)Harcourt1wellcompletionreport,OilCompanyofAustralia,PL94_Queensland,unpublishedreport
Silwa,R,SHamilton,JHodgkinson,andJDraper(2008).BowenBasinStructuralGeology,posterproducedbyCSIROandtheQueenslandGovernmentDepartmentofMinesandEnergy.
URS,2009.CavalRidgeGroundwaterImpactAssessment.PreparedforBMAllianceCoalOperationsPtyLtd.http://www.bhpbilliton.com/home/aboutus/regulatory/Documents/creisAppJGroundwater.pdf
URS, 2012. Report Groundwater Impact Assessment, Bowen Gas Project. Prepared for ArrowEnergyPty. Ltd.http://www.arrowenergy.com.au/__data/assets/pdf_file/0008/3869/Appendix‐L_Groundwater‐and‐Geology‐Technical‐Report.pdf

Draft Underground Water Impact Report ‐ ATP 564P 8‐1
Appendix A ‐ Summary of registered bores
installed in alluvium
Bore ID (RN)
Latitude Longitude Hydraulic unit Water quality
(µS/cm) Yield (L/s)
Water level (mbgl)
68124 ‐24.4287 150.4846 BACK CREEK ALLUVIUM 1.9 7.45
62897 ‐24.37 150.4969 BACK CREEK ALLUVIUM 2740 25.2 6.7
67341 ‐24.3267 150.4638 BASALT 1.14 30.5
128449 ‐25.088 149.7387 BASALT 5000 0.63 29.6
128300 ‐24.9522 149.8513 BASALT POTABLE 1.23 28.5
128582 ‐24.6476 150.4719 BASALT POTABLE 5.6 25
128448 ‐24.9568 149.8831 BASALT 2400 0.2 23.8
128456 ‐24.4278 150.4797 BASALT POTABLE 0.2 22.5
128639 ‐24.8149 150.4894 BASALT POTABLE 22.5
128620 ‐24.4232 150.4316 BASALT 2.8 PPM 1.2 20
128626 ‐24.6439 149.7797 BASALT POTABLE 1.81 19.5
128619 ‐24.3722 150.5016 BASALT 0.1 18
128614 ‐24.2801 150.4241 BASALT POTABLE 1.2 16.4
128638 ‐24.3857 150.3177 BASALT POTABLE 0.4 15.3
128453 ‐24.3783 150.5135 BASALT SALTY 0.21 11.9
128625 ‐25.2355 149.6579 BASALT POTABLE 1.8 11.8
128301 ‐25.0142 150.1633 BASALT POTABLE 2.15 11.5
128615 ‐24.4145 150.5008 BASALT POTABLE 0.8 10.5
128586 ‐24.2961 150.4391 BASALT POTABLE 5.61 10
128648 ‐24.6242 150.2351 BASALT POTABLE 1.23 10
128616 ‐24.4056 150.5176 BASALT POTABLE 0.2 9.2
128634 ‐24.6236 150.2825 BASALT POTABLE 0.18 8.5
128635 ‐24.367 150.1777 BASALT POTABLE 1.5 8.5
128627 ‐24.4317 150.4231 BASALT POTABLE 0.6 8
128618 ‐24.7729 150.471 BASALT 0.5 7.77
128628 ‐24.4265 150.51 BASALT POTABLE 2.15 5.5
128457 ‐24.3946 150.4931 BASALT POTABLE 0.5 5.4
89807 ‐24.3789 150.4905 BASALT CONDT. 2200 1.34 4.5
13030685 ‐24.8531 150.2664 BOAM CREEK ALLUVIUM 7.79
89516 ‐24.349 150.459 BOAM CREEK ALLUVIUM COND 2030 40 5.61
89527 ‐24.3767 150.4924 BOAM CREEK ALLUVIUM COND 2650 38.5 4.52
89528 ‐24.3651 150.4782 BOAM CREEK ALLUVIUM COND 2750 39 4.34
89529 ‐24.3655 150.5131 BOAM CREEK ALLUVIUM COND 3050 39 2.42
68688 ‐24.38 150.4594 CALLIDE CREEK ALLUVIUM 15 18.5
68881 ‐24.3841 150.4975 CALLIDE CREEK ALLUVIUM 0.63 17.5
68318 ‐24.4245 150.43 CALLIDE CREEK ALLUVIUM 0.5 17.3
31064 ‐24.9414 150.091 CALLIDE CREEK ALLUVIUM 1.5 17
68564 ‐24.4074 150.438 CALLIDE CREEK ALLUVIUM 0.5 17
89746 ‐24.4034 150.4615 CALLIDE CREEK ALLUVIUM 8.06 16.9
89795 ‐24.4898 150.1578 CALLIDE CREEK ALLUVIUM 1 16.9
68763 ‐24.3712 150.5009 CALLIDE CREEK ALLUVIUM 1 16.8
13030671 ‐25.2739 150.2875 CALLIDE CREEK ALLUVIUM BRACKISH 16.72
128032 ‐24.3647 150.4718 CALLIDE CREEK ALLUVIUM POTABLE 25 16.7
13030604 ‐24.4247 150.5168 CALLIDE CREEK ALLUVIUM COND 1000 16.64
68874 ‐24.4078 150.4396 CALLIDE CREEK ALLUVIUM 0.5 16.6
68768 ‐24.5631 150.475 CALLIDE CREEK ALLUVIUM 0.38 16.36

Draft Underground Water Impact Report ‐ ATP 564P 8‐2
Bore ID (RN)
Latitude Longitude Hydraulic unit Water quality
(µS/cm) Yield (L/s)
Water level (mbgl)
68459 ‐24.4106 150.4664 CALLIDE CREEK ALLUVIUM 16.4 16.3
128395 ‐24.5462 149.6655 CALLIDE CREEK ALLUVIUM POTABLE 1.6 16.3
68608 ‐24.296 150.4936 CALLIDE CREEK ALLUVIUM 0.63 16.1
68793 ‐24.4137 150.4672 CALLIDE CREEK ALLUVIUM 1 16
68711 ‐24.4267 150.473 CALLIDE CREEK ALLUVIUM 15 15.95
13030558 ‐24.3766 150.5003 CALLIDE CREEK ALLUVIUM COND 3640 15.9
68740 ‐24.3786 150.5019 CALLIDE CREEK ALLUVIUM COND 834 15.9
13030561 ‐25.1825 150.4197 CALLIDE CREEK ALLUVIUM 15.8
89841 ‐25.149 149.8025 CALLIDE CREEK ALLUVIUM 1 15.65
13030553 ‐24.4062 150.5164 CALLIDE CREEK ALLUVIUM `COND 1478 15.6
13030606 ‐24.3863 150.488 CALLIDE CREEK ALLUVIUM COND 1100 15.53
68460 ‐24.4217 150.5027 CALLIDE CREEK ALLUVIUM 26 15.5
68685 ‐24.4349 150.5189 CALLIDE CREEK ALLUVIUM 13.86 15.5
13030552 ‐24.4958 150.0912 CALLIDE CREEK ALLUVIUM COND 610 15.3
836 ‐24.5861 149.9604 CALLIDE CREEK ALLUVIUM TDS 472 MG/L 0 15.24
68109 ‐24.392 150.4411 CALLIDE CREEK ALLUVIUM 17.7 15
89881 ‐24.3419 150.473 CALLIDE CREEK ALLUVIUM 0.8 14.9
62910 ‐24.3729 150.4976 CALLIDE CREEK ALLUVIUM 16.3 14.8
89874 ‐24.3804 150.5008 CALLIDE CREEK ALLUVIUM 1.1 14.7
34488 ‐24.4376 150.4932 CALLIDE CREEK ALLUVIUM TDS 330 MG/L 0.8 14.6
68613 ‐24.6214 150.4613 CALLIDE CREEK ALLUVIUM 0.5 14.5
89902 ‐24.38 150.4949 CALLIDE CREEK ALLUVIUM 1 14.5
128653 ‐24.4123 150.2427 CALLIDE CREEK ALLUVIUM POTABLE 1 14.5
13030715 ‐24.9297 150.1783 CALLIDE CREEK ALLUVIUM 14.38
13030559 ‐24.3779 150.5005 CALLIDE CREEK ALLUVIUM COND 1220 14.3
453 ‐24.4733 149.8008 CALLIDE CREEK ALLUVIUM COND 585 0.8 14.3
13030557 ‐24.3763 150.5003 CALLIDE CREEK ALLUVIUM COND 1120 14.2
62884 ‐24.4251 150.5091 CALLIDE CREEK ALLUVIUM COND 450 10.1 14.2
13030555 ‐24.3742 150.4993 CALLIDE CREEK ALLUVIUM COND 3230 14.1
57616 ‐24.405 150.4908 CALLIDE CREEK ALLUVIUM 11 14
13030605 ‐24.2997 150.4206 CALLIDE CREEK ALLUVIUM COND 3650 13.94
68785 ‐24.5615 150.4947 CALLIDE CREEK ALLUVIUM 1 13.87
13030551 ‐24.4778 150.286 CALLIDE CREEK ALLUVIUM COND 750 13.8
68317 ‐24.5 150.4264 CALLIDE CREEK ALLUVIUM COND 767 25.2 13.8
89698 ‐24.4226 150.5136 CALLIDE CREEK ALLUVIUM 15.12 13.8
128038 ‐24.3772 150.4871 CALLIDE CREEK ALLUVIUM POTABLE 8 13.8
128391 ‐25.0759 150.1438 CALLIDE CREEK ALLUVIUM POTABLE 1.6 13.75
128394 ‐24.5456 149.6597 CALLIDE CREEK ALLUVIUM POTABLE 1.6 13.75
13030556 ‐24.3756 150.4988 CALLIDE CREEK ALLUVIUM COND 3870 13.7
128392 ‐25.0676 150.1252 CALLIDE CREEK ALLUVIUM POTABLE 1.6 13.6
128393 ‐24.9272 149.8361 CALLIDE CREEK ALLUVIUM POTABLE 1.6 13.6
34285 ‐24.3763 150.4242 CALLIDE CREEK ALLUVIUM COND 700 8.5 13.5
128390 ‐25.0823 150.1264 CALLIDE CREEK ALLUVIUM POTABLE 1.6 13.5
128396 ‐24.5462 149.6608 CALLIDE CREEK ALLUVIUM POTABLE 1 13.5
68439 ‐24.4063 150.4867 CALLIDE CREEK ALLUVIUM 36.6 13.25
13030594 ‐24.4082 150.499 CALLIDE CREEK ALLUVIUM COND 1680 13.1
13030579 ‐24.7558 150.5039 CALLIDE CREEK ALLUVIUM COND 1117 13.08
62934 ‐24.5024 150.4247 CALLIDE CREEK ALLUVIUM 0.6 13
13030554 ‐24.3742 150.4987 CALLIDE CREEK ALLUVIUM COND 2600 12.7
62415 ‐24.4525 150.5167 CALLIDE CREEK ALLUVIUM 31.5 12.7
89754 ‐24.8775 150.2094 CALLIDE CREEK ALLUVIUM 28.7 12.7
7841 ‐24.929 150.0666 CALLIDE CREEK ALLUVIUM TDS 469 MG/L 0 12.65

Draft Underground Water Impact Report ‐ ATP 564P 8‐3
Bore ID (RN)
Latitude Longitude Hydraulic unit Water quality
(µS/cm) Yield (L/s)
Water level (mbgl)
68441 ‐24.3622 150.4668 CALLIDE CREEK ALLUVIUM 0.5 12.6
68167 ‐24.5569 150.4289 CALLIDE CREEK ALLUVIUM 0.5 12.5
68026 ‐24.4154 150.4864 CALLIDE CREEK ALLUVIUM 0.5 12.4
62940 ‐24.2934 150.4188 CALLIDE CREEK ALLUVIUM COND 680 18.9 12.4
34518 ‐24.9797 150.1417 CALLIDE CREEK ALLUVIUM COND 1710 7.6 12.4
89809 ‐24.3803 150.4984 CALLIDE CREEK ALLUVIUM 22.7 12.32
31374 ‐24.4731 150.1225 CALLIDE CREEK ALLUVIUM COND 1000 29 12.3
68276 ‐24.446 150.5072 CALLIDE CREEK ALLUVIUM COND 738 12.5 12.27
68693 ‐24.3118 150.4095 CALLIDE CREEK ALLUVIUM 1.4 12.27
32755 ‐24.3627 150.4662 CALLIDE CREEK ALLUVIUM 26 12.2
47105 ‐24.9779 150.1036 CALLIDE CREEK ALLUVIUM 0.8 12.2
57830 ‐24.3822 150.4727 CALLIDE CREEK ALLUVIUM 13.9 12.2
825 ‐24.7978 149.9562 CALLIDE CREEK ALLUVIUM TDS 390 MG/L 1.14 12.19
68544 ‐24.3828 150.5152 CALLIDE CREEK ALLUVIUM 18.9 12.15
31534 ‐24.3114 150.4466 CALLIDE CREEK ALLUVIUM 31.57 12.04
13030141 ‐24.5536 150.3758 CALLIDE CREEK ALLUVIUM COND 5000 12
34444 ‐24.442 150.4955 CALLIDE CREEK ALLUVIUM 0.01 11.9
57617 ‐24.5559 150.4277 CALLIDE CREEK ALLUVIUM COND 5100 1 11.9
68297 ‐24.5403 150.4278 CALLIDE CREEK ALLUVIUM 15 11.9
13030541 ‐24.5245 150.1091 CALLIDE CREEK ALLUVIUM COND 740 11.8
13030723 ‐24.8739 150.2936 CALLIDE CREEK ALLUVIUM 11.65
68935 ‐24.3036 150.423 CALLIDE CREEK ALLUVIUM 19.4 11.65
47130 ‐24.9873 150.1161 CALLIDE CREEK ALLUVIUM 7.6 11.6
68510 ‐24.6001 150.431 CALLIDE CREEK ALLUVIUM 0.5 11.6
13030534 ‐24.8446 150.1223 CALLIDE CREEK ALLUVIUM COND 2650 11.5
13030560 ‐24.3787 150.4952 CALLIDE CREEK ALLUVIUM COND 1710 11.4
62474 ‐24.339 150.4489 CALLIDE CREEK ALLUVIUM 1.4 11.3
415 ‐24.4813 149.834 CALLIDE CREEK ALLUVIUM 0.03 11.3
47356 ‐25.2566 149.9782 CALLIDE CREEK ALLUVIUM 0.58 11.3
57789 ‐24.3078 150.4414 CALLIDE CREEK ALLUVIUM 0.3 11.3
68230 ‐24.4211 150.5084 CALLIDE CREEK ALLUVIUM 26.5 11.3
13030581 ‐24.8836 150.4878 CALLIDE CREEK ALLUVIUM COND 1143 11.28
31533 ‐24.3235 150.4358 CALLIDE CREEK ALLUVIUM 25.26 11.28
34064 ‐24.3801 150.5118 CALLIDE CREEK ALLUVIUM COND 2430 1 11.2
89914 ‐24.3188 150.2751 CALLIDE CREEK ALLUVIUM COND 1082 0.88 11.16
31332 ‐24.2944 150.4327 CALLIDE CREEK ALLUVIUM GOOD 16.4 11
57919 ‐24.3211 150.4536 CALLIDE CREEK ALLUVIUM 21.4 10.8
31512 ‐24.3158 150.4201 CALLIDE CREEK ALLUVIUM COND 1762 27.1 10.7
38301 ‐24.4044 150.5114 CALLIDE CREEK ALLUVIUM COND 1250 12.5 10.7
68487 ‐24.3881 150.4353 CALLIDE CREEK ALLUVIUM 0.5 10.7
62911 ‐24.3802 150.4985 CALLIDE CREEK ALLUVIUM 21.9 10.6
13030717 ‐24.8681 150.305 CALLIDE CREEK ALLUVIUM 10.5
47469 ‐24.6267 150.4541 CALLIDE CREEK ALLUVIUM 1.3 10.5
68491 ‐24.3489 150.4371 CALLIDE CREEK ALLUVIUM 25 10.5
13030591 ‐24.2882 150.4435 CALLIDE CREEK ALLUVIUM COND 1476 10.4
31942 ‐24.3188 150.4519 CALLIDE CREEK ALLUVIUM COND 1050 26.9 10.4
31517 ‐24.3163 150.4194 CALLIDE CREEK ALLUVIUM 0.36 10.3
34286 ‐24.4294 150.4845 CALLIDE CREEK ALLUVIUM 8.84 10.2
68024 ‐24.4218 150.4917 CALLIDE CREEK ALLUVIUM COND 1350 10.2
31945 ‐24.3144 150.4493 CALLIDE CREEK ALLUVIUM 0.8 10.1
8230 ‐24.9159 150.0672 CALLIDE CREEK ALLUVIUM 0.63 10.06
33069 ‐24.3485 150.4726 CALLIDE CREEK ALLUVIUM COND 1025 15.2 10

Draft Underground Water Impact Report ‐ ATP 564P 8‐4
Bore ID (RN)
Latitude Longitude Hydraulic unit Water quality
(µS/cm) Yield (L/s)
Water level (mbgl)
33375 ‐24.3917 150.491 CALLIDE CREEK ALLUVIUM COND 1200 24 9.98
33752 ‐24.3635 150.4847 CALLIDE CREEK ALLUVIUM 20.8 9.9
35817 ‐25.2498 149.7042 CALLIDE CREEK ALLUVIUM 9.9
37063 ‐24.3802 150.4836 CALLIDE CREEK ALLUVIUM POTABLE 28.5 9.9
33067 ‐24.3807 150.4614 CALLIDE CREEK ALLUVIUM COND 1060 12.5 9.8
13030580 ‐24.7558 150.5039 CALLIDE CREEK ALLUVIUM COND 2350 9.7
34009 ‐24.3652 150.5069 CALLIDE CREEK ALLUVIUM 4.42 9.7
62022 ‐24.3214 150.4495 CALLIDE CREEK ALLUVIUM 27.7 9.6
13030153 ‐25.1469 150.4103 CALLIDE CREEK ALLUVIUM COND 1950 9.6
13030154 ‐24.3765 150.4733 CALLIDE CREEK ALLUVIUM COND 1000 9.73 9.54
7684 ‐24.9433 150.0492 CALLIDE CREEK ALLUVIUM 9.5 9.5
47150 ‐25.004 150.1528 CALLIDE CREEK ALLUVIUM COND 843 1 9.5
57326 ‐24.6082 150.4771 CALLIDE CREEK ALLUVIUM 15 9.5
8420 ‐24.9101 150.0719 CALLIDE CREEK ALLUVIUM 1.5 9.45
47151 ‐25.0162 150.1525 CALLIDE CREEK ALLUVIUM 1 9.4
47695 ‐24.6083 150.4515 CALLIDE CREEK ALLUVIUM COND 980 1 9.3
13030151 ‐24.7879 150.2172 CALLIDE CREEK ALLUVIUM COND 1110 9.3
13030152 ‐24.5204 150.1755 CALLIDE CREEK ALLUVIUM 9.3
13030593 ‐24.5147 150.5028 CALLIDE CREEK ALLUVIUM COND 1620 9.2
31944 ‐24.3325 150.4492 CALLIDE CREEK ALLUVIUM COND 1480 17.7 9.2
31511 ‐24.3165 150.4192 CALLIDE CREEK ALLUVIUM POTABLE 22.3 9.2
13030592 ‐24.386 150.4348 CALLIDE CREEK ALLUVIUM COND 1090 9.1
34284 ‐24.417 150.4351 CALLIDE CREEK ALLUVIUM 5.05 9.1
33574 ‐24.3774 150.4829 CALLIDE CREEK ALLUVIUM 6.3 9
47149 ‐25.0048 150.1197 CALLIDE CREEK ALLUVIUM COND 1170 1 9
32324 ‐24.3129 150.4558 CALLIDE CREEK ALLUVIUM 47.99 8.94
47081 ‐24.9823 150.0889 CALLIDE CREEK ALLUVIUM COND 1420 1.3 8.9
8231 ‐24.9006 150.0727 CALLIDE CREEK ALLUVIUM 0.76 8.84
37313 ‐24.3049 150.4393 CALLIDE CREEK ALLUVIUM 8.5
33573 ‐24.3774 150.4826 CALLIDE CREEK ALLUVIUM 23.99 8.47
31531 ‐24.3037 150.4408 CALLIDE CREEK ALLUVIUM COND 1790 25.3 8.46
47648 ‐24.6089 150.4488 CALLIDE CREEK ALLUVIUM 0.8 8.4
32746 ‐24.3276 150.4689 CALLIDE CREEK ALLUVIUM COND 1640 2.1 8.3
31530 ‐24.3252 150.4324 CALLIDE CREEK ALLUVIUM COND 950 32.8 8.3
32770 ‐24.3292 150.4589 CALLIDE CREEK ALLUVIUM 42.3 8.2
33186 ‐24.3835 150.4538 CALLIDE CREEK ALLUVIUM COND 1580 19.7 8.2
33187 ‐24.3246 150.4748 CALLIDE CREEK ALLUVIUM 36 8.2
47616 ‐24.4167 150.4377 CALLIDE CREEK ALLUVIUM 25 8.2
33188 ‐24.345 150.4754 CALLIDE CREEK ALLUVIUM 0.5 8.1
44650 ‐24.3694 150.458 CALLIDE CREEK ALLUVIUM 32 8
47530 ‐24.523 150.434 CALLIDE CREEK ALLUVIUM COND 890 45.4 7.9
32325 ‐24.354 150.4396 CALLIDE CREEK ALLUVIUM 19.4 7.9
32745 ‐24.3552 150.4653 CALLIDE CREEK ALLUVIUM COND 1100 19.4 7.9
47458 ‐25.0031 150.5033 CALLIDE CREEK ALLUVIUM 7.9
31073 ‐24.938 150.0773 CALLIDE CREEK ALLUVIUM TDS 375 MG/L 45.46 7.86
32518 ‐24.321 150.4626 CALLIDE CREEK ALLUVIUM COND 3150 37.8 7.7
34067 ‐24.4107 150.4321 CALLIDE CREEK ALLUVIUM COND 1126 19.5 7.7
57579 ‐24.6437 150.4644 CALLIDE CREEK ALLUVIUM 7.7
31943 ‐24.3234 150.1047 CALLIDE CREEK ALLUVIUM COND 1500 37.8 7.6
57821 ‐24.3797 150.4785 CALLIDE CREEK ALLUVIUM 23.9 7.5
8368 ‐24.9076 150.0739 CALLIDE CREEK ALLUVIUM TDS 415 MG/L 2.3 7.5
31532 ‐24.3311 150.4242 CALLIDE CREEK ALLUVIUM COND 1820 24 7.5

Draft Underground Water Impact Report ‐ ATP 564P 8‐5
Bore ID (RN)
Latitude Longitude Hydraulic unit Water quality
(µS/cm) Yield (L/s)
Water level (mbgl)
32767 ‐24.3244 150.4675 CALLIDE CREEK ALLUVIUM GOOD 1.21 7.32
13030132 ‐24.7253 150.4061 CALLIDE CREEK ALLUVIUM COND 1070 7.1
13030140 ‐24.5705 150.3951 CALLIDE CREEK ALLUVIUM COND 1820 6.8
57607 ‐24.644 150.4636 CALLIDE CREEK ALLUVIUM 0.8 6.8
57820 ‐24.3122 150.4471 CALLIDE CREEK ALLUVIUM 12.6 6.3
32754 ‐24.3387 150.4747 CALLIDE CREEK ALLUVIUM 15.1 5.7
13030138 ‐24.5254 150.4478 CALLIDE CREEK ALLUVIUM COND 2250 5.2
13030234 ‐24.809 150.2702 CALLIDE CREEK ALLUVIUM COND 2400 5.2
34489 ‐24.7567 150.1503 CALLIDE CREEK ALLUVIUM 20.6 5.2
13030233 ‐25.1194 150.2988 CALLIDE CREEK ALLUVIUM 4.7
111914 ‐24.4317 150.5132 CAMBOON VOLCANICS 680 US/CM 1.1 37
89968 ‐24.39 150.4516 CAMBOON VOLCANICS 980 CON 5.8 36
68678 ‐24.4109 150.5127 CAMBOON VOLCANICS 1.1 30
128263 ‐24.3681 149.9883 CAMBOON VOLCANICS 900PPM 2.27 27
31384 ‐24.3046 150.439 CAMBOON VOLCANICS 0.06 21.3
128178 ‐24.3992 150.4885 CAMBOON VOLCANICS 2300 M/S 0.25 21
128171 ‐24.4378 150.5157 CAMBOON VOLCANICS 5500 M/S 0.3 20.7
128175 ‐24.3929 150.4606 CAMBOON VOLCANICS 3400 M/S 0.26 20.7
128198 ‐24.5374 150.3609 CAMBOON VOLCANICS 1180 M/S 2.38 20.7
128200 ‐24.3333 150.4398 CAMBOON VOLCANICS 2.15 19.5
31442 ‐24.3093 150.4421 CAMBOON VOLCANICS 0.63 19.2
111910 ‐24.3093 150.4375 CAMBOON VOLCANICS 670 US/CM 1 18.6
31448 ‐24.3089 150.431 CAMBOON VOLCANICS 0.38 16.7
128182 ‐24.4727 150.4294 CAMBOON VOLCANICS 3430 M/S 0.63 16
128201 ‐24.41 150.4997 CAMBOON VOLCANICS 2.53 15.5
89805 ‐24.3793 150.4913 CAMBOON VOLCANICS 7.5 15.3
89799 ‐24.3128 150.4532 CAMBOON VOLCANICS 2900 US/CM 0.68 15.15
34522 ‐24.436 150.5193 CAMBOON VOLCANICS 0.04 14.6
68580 ‐24.3118 150.4543 CAMBOON VOLCANICS COND 5400 1.9 14
128144 ‐24.3187 150.4192 CAMBOON VOLCANICS 0.6 14
128173 ‐24.3676 150.4711 CAMBOON VOLCANICS 4900 M/S 2.66 13.7
33925 ‐24.4062 150.4296 CAMBOON VOLCANICS 0.19 12.8
89802 ‐24.3208 150.4377 CAMBOON VOLCANICS 2000 US/CM 1.37 12.72
47604 ‐24.2843 150.4386 CAMBOON VOLCANICS 3.5 12.2
31441 ‐24.3128 150.4243 CAMBOON VOLCANICS 0.25 12.2
128174 ‐24.4242 150.5109 CAMBOON VOLCANICS 3400 M/S 3.55 12
128183 ‐24.3029 150.4465 CAMBOON VOLCANICS 970 M/S 1.9 12
89901 ‐24.4398 150.4952 CAMBOON VOLCANICS COND 1000 0.56 11.8
31446 ‐24.3001 150.451 CAMBOON VOLCANICS 0.63 10.6
57732 ‐24.5559 150.4219 CAMBOON VOLCANICS 0.88 10.6
128216 ‐25.2801 149.7392 CAMBOON VOLCANICS 0.45 10.5
9265 ‐24.935 150.0772 CAMBOON VOLCANICS 0.63 10.27
31241 ‐24.28 150.417 CAMBOON VOLCANICS POTABLE 0.63 10.06
128179 ‐24.4157 150.5176 CAMBOON VOLCANICS 830 M/S 0.19 10
128181 ‐24.4154 150.5185 CAMBOON VOLCANICS 2400 M/S 4.68 10
84680 ‐24.4161 150.5019 CAMBOON VOLCANICS COND 2500 1 9.8
68951 ‐24.4281 150.5055 CAMBOON VOLCANICS 700 1.42 9.6
128199 ‐24.3753 150.4804 CAMBOON VOLCANICS 1.5 9.5
128215 ‐25.2476 149.7492 CAMBOON VOLCANICS 0.78 9.5
34211 ‐24.372 150.5134 CAMBOON VOLCANICS 0.19 9.3
38951 ‐24.3803 150.4579 CAMBOON VOLCANICS 0.6 9.2
47606 ‐24.4401 150.5125 CAMBOON VOLCANICS 1.29 9.1

Draft Underground Water Impact Report ‐ ATP 564P 8‐6
Bore ID (RN)
Latitude Longitude Hydraulic unit Water quality
(µS/cm) Yield (L/s)
Water level (mbgl)
68527 ‐24.5782 150.443 CAMBOON VOLCANICS 0.22 8.9
31242 ‐24.9034 150.1016 CAMBOON VOLCANICS POTABLE 0.25 8.84
68659 ‐24.6725 150.4912 CAMBOON VOLCANICS 0.58 8.23
34212 ‐24.411 150.4322 CAMBOON VOLCANICS 0.19 8.2
57512 ‐24.2841 150.488 CAMBOON VOLCANICS 1.07 8.2
111915 ‐24.2915 150.4508 CAMBOON VOLCANICS COND 5900 3.3 8.2
128180 ‐24.3659 150.4522 CAMBOON VOLCANICS 840 M/S 0.76 8.2
57516 ‐24.2787 150.4369 CAMBOON VOLCANICS 1.04 8
128262 ‐24.3617 149.9755 CAMBOON VOLCANICS 1600PPM 0.57 8
128383 ‐24.4981 150.1733 CAMBOON VOLCANICS 0.14 8
89521 ‐24.3772 150.5071 CAMBOON VOLCANICS 0.5 7.96
57734 ‐24.5431 150.4422 CAMBOON VOLCANICS 0.2 7.6
57400 ‐24.3571 150.4329 CAMBOON VOLCANICS BRACKISH 0.4 6.4
128644 ‐24.2777 149.9907 CAMBOON VOLCANICS POTABLE 1.25 6.2
31443 ‐24.3056 150.4241 CAMBOON VOLCANICS 0.19 6.1
84872 ‐24.4179 150.5044 CAMBOON VOLCANICS 2500 US/CM 0.8 6.1
128044 ‐24.5579 150.4872 CAMBOON VOLCANICS 1100 US/CM 1.51 5
47605 ‐24.5711 150.4391 CAMBOON VOLCANICS 1.29 4.6
33924 ‐24.3616 150.499 CAMBOON VOLCANICS 0.19 3.6
128209 ‐24.3339 150.4432 CAMBOON VOLCANICS 0.22 3
128261 ‐24.3767 150.0158 CAMBOON VOLCANICS 1600PPM 0.63 0.2
128142 ‐24.3548 150.4342 CASTLE CREEK ALLUVIUM 0.5 16
128143 ‐24.3182 150.4651 CASTLE CREEK ALLUVIUM 16
13030688 ‐24.8678 150.2467 CASTLE CREEK ALLUVIUM 14.05
89590 ‐24.2908 150.4508 CASTLE CREEK ALLUVIUM COND 1280 11.84
89563 ‐24.542 150.3969 CASTLE CREEK ALLUVIUM 20 8.65
84678 ‐24.4089 150.493 CASTLE CREEK ALLUVIUM COND 1100 26 8.57
128151 ‐24.4999 150.4234 CASTLE CREEK ALLUVIUM 1.81 8.4
13030689 ‐24.821 150.2457 CASTLE CREEK ALLUVIUM 8.13
62918 ‐24.4727 150.5195 CASTLE CREEK ALLUVIUM 0.68 7.33
68091 ‐24.3419 150.4677 CASTLE CREEK ALLUVIUM 15 7.06
13030573 ‐24.8866 150.457 CASTLE CREEK ALLUVIUM COND 790 6.87
84615 ‐24.3768 150.48 CASTLE CREEK ALLUVIUM 26 6.83
89508 ‐24.3683 150.5075 CASTLE CREEK ALLUVIUM 1.25 6
128210 ‐25.1259 149.7783 CASTLE CREEK ALLUVIUM 1.81 6
62321 ‐24.3209 150.463 CASTLE CREEK ALLUVIUM COND 1050 31 5.9
62322 ‐24.3212 150.4613 CASTLE CREEK ALLUVIUM COND 960 33 5.3
68021 ‐24.4189 150.4892 CASTLE CREEK ALLUVIUM 27.7 4.57
128211 ‐25.1073 149.7914 CASTLE CREEK ALLUVIUM 1.23 4
68022 ‐24.4116 150.4872 CASTLE CREEK ALLUVIUM 15.4 2.79
128193 ‐24.38 150.4649 CATTLE CREEK ALLUVIUM 800 PPM 22 11
128164 ‐24.3853 150.4343 CATTLE CREEK ALLUVIUM 0.99 6.5
128574 ‐24.4806 150.3822 CLAY 52.7 M.S 0.01 36
128585 ‐24.413 150.4358 CLAY 650 2.8 13.8
128386 ‐24.8939 150.0772 CONTACT CREEK ALLUVIUM POTABLE 1 16.2
89785 ‐24.8559 149.7347 CONTACT CREEK ALLUVIUM 1 16.05
68853 ‐24.3031 150.4377 CONTACT CREEK ALLUVIUM 1 15.7
128221 ‐24.8787 150.1633 CONTACT CREEK ALLUVIUM 0.76 15.5
13030693 ‐24.8351 150.2953 CONTACT CREEK ALLUVIUM 14.2
68845 ‐24.4501 150.5049 CONTACT CREEK ALLUVIUM 11.7
43667 ‐24.3708 150.5173 CONTACT CREEK ALLUVIUM 1.8 9.8
31466 ‐24.3165 150.4192 CONTACT CREEK ALLUVIUM 26 7.6

Draft Underground Water Impact Report ‐ ATP 564P 8‐7
Bore ID (RN)
Latitude Longitude Hydraulic unit Water quality
(µS/cm) Yield (L/s)
Water level (mbgl)
31395 ‐24.3197 150.4161 CONTACT CREEK ALLUVIUM 11.37 4
13030385 ‐24.5173 150.3533 DAWSON RIVER ALLUVIUM COND 1090 3.9 17.1
13030435 ‐24.4246 150.4197 DAWSON RIVER ALLUVIUM TDS 291.7 MG/L 1.52 14.33
13030392 ‐24.4493 150.5194 DAWSON RIVER ALLUVIUM 13.9
89578 ‐24.3727 150.4976 DAWSON RIVER ALLUVIUM 12.6 13.5
13030436 ‐24.3086 150.4164 DAWSON RIVER ALLUVIUM TDS 229 MG/L 1.5 13.3
13030434 ‐24.4704 150.3894 DAWSON RIVER ALLUVIUM COND 680 13.1
13030432 ‐24.4197 150.4242 DAWSON RIVER ALLUVIUM COND 245 12.9
89686 ‐24.3364 150.4491 DAWSON RIVER ALLUVIUM POTABLE 18.9 12.8
13030437 ‐24.4353 150.4088 DAWSON RIVER ALLUVIUM TDS 343.2 MG/L 1.5 12.8
13030391 ‐24.6575 150.4494 DAWSON RIVER ALLUVIUM COND 1100 12.7
13030428 ‐24.8603 150.1841 DAWSON RIVER ALLUVIUM COND 1700 4.4 12.5
89690 ‐24.355 150.4964 DAWSON RIVER ALLUVIUM POTABLE 2.4 12.5
128188 ‐24.6474 150.4669 DAWSON RIVER ALLUVIUM 350 PPM 2 12.5
89755 ‐24.4088 150.4988 DAWSON RIVER ALLUVIUM POTABLE 0.45 12.3
89593 ‐25.1259 149.8375 DAWSON RIVER ALLUVIUM 11.3 11.97
13030420 ‐24.445 150.5075 DAWSON RIVER ALLUVIUM COND 950 11.8
89575 ‐24.4629 150.3794 DAWSON RIVER ALLUVIUM 25 11.6
13030641 ‐24.6594 150.3122 DAWSON RIVER ALLUVIUM COND 528 11.54
13030429 ‐24.7866 150.2677 DAWSON RIVER ALLUVIUM COND 380 11.5
13030637 ‐24.4731 150.1208 DAWSON RIVER ALLUVIUM COND 595 11.46
13030683 ‐25.126 150.1114 DAWSON RIVER ALLUVIUM 11.34
13030387 ‐24.5398 150.3508 DAWSON RIVER ALLUVIUM 1.9 11.3
13030422 ‐24.7272 150.2278 DAWSON RIVER ALLUVIUM COND 22,300 11.2
13030427 ‐24.9243 150.0778 DAWSON RIVER ALLUVIUM COND 4200 11.1
13030423 ‐24.6919 150.1936 DAWSON RIVER ALLUVIUM COND 23,750 11.1
89598 ‐24.4447 150.5155 DAWSON RIVER ALLUVIUM GOOD 10.5 11.07
13030684 ‐24.9453 150.2939 DAWSON RIVER ALLUVIUM 11.04
13030418 ‐24.54 150.0247 DAWSON RIVER ALLUVIUM COND 920 4.9 10.9
13030403 ‐24.6852 150.235 DAWSON RIVER ALLUVIUM COND 5850 10.9
13030430 ‐24.7799 149.759 DAWSON RIVER ALLUVIUM COND 460 1.9 10.9
13030426 ‐25.2671 150.1334 DAWSON RIVER ALLUVIUM COND 5350 10.8
13030390 ‐24.5717 150.3953 DAWSON RIVER ALLUVIUM COND 2340 10.8
89581 ‐24.4547 150.5192 DAWSON RIVER ALLUVIUM 13.5 10.75
89597 ‐25.117 149.8461 DAWSON RIVER ALLUVIUM 16.4 10.74
13030415 ‐24.4265 150.5094 DAWSON RIVER ALLUVIUM COND 298 10.7
13030402 ‐24.7066 150.4426 DAWSON RIVER ALLUVIUM COND 4900 10.7
13030421 ‐24.7536 150.2581 DAWSON RIVER ALLUVIUM 35.3 10.7
13030586 ‐25.0831 150.4553 DAWSON RIVER ALLUVIUM COND 660 10.53
13030400 ‐24.6861 150.3628 DAWSON RIVER ALLUVIUM COND 6700 10.5
38975 ‐24.3125 150.4994 DAWSON RIVER ALLUVIUM COND 1760 30.7 10.47
13030425 ‐24.4736 150.1225 DAWSON RIVER ALLUVIUM COND 9600 10.4
13030639 ‐24.4737 150.0188 DAWSON RIVER ALLUVIUM COND 777 10.36
13030410 ‐24.8204 150.3576 DAWSON RIVER ALLUVIUM COND 595 10.3
13030424 ‐24.4715 150.1225 DAWSON RIVER ALLUVIUM COND 30,000 10.3
13030401 ‐24.726 150.4102 DAWSON RIVER ALLUVIUM COND 2500 10.3
13030411 ‐24.7939 150.2628 DAWSON RIVER ALLUVIUM 10.3
13030394 ‐24.2761 149.8342 DAWSON RIVER ALLUVIUM COND 2400 10.2
13030419 ‐25.0472 149.6689 DAWSON RIVER ALLUVIUM COND 1300 9.5 10.2
13030638 ‐24.4839 149.9703 DAWSON RIVER ALLUVIUM COND 2500 10.19
13030640 ‐24.4958 150.0912 DAWSON RIVER ALLUVIUM COND 1580 10.13
89577 ‐24.386 150.4351 DAWSON RIVER ALLUVIUM 10 10.1

Draft Underground Water Impact Report ‐ ATP 564P 8‐8
Bore ID (RN)
Latitude Longitude Hydraulic unit Water quality
(µS/cm) Yield (L/s)
Water level (mbgl)
13030417 ‐24.4734 150.125 DAWSON RIVER ALLUVIUM COND 755 5.68 10.03
13030404 ‐24.6776 150.2296 DAWSON RIVER ALLUVIUM COND 5100 10
13030396 ‐24.4713 150.1213 DAWSON RIVER ALLUVIUM COND 1880 10
13030406 ‐24.3031 150.4228 DAWSON RIVER ALLUVIUM COND 1210 2.8 9.9
13030405 ‐24.7677 150.2966 DAWSON RIVER ALLUVIUM COND 1975 27.8 9.9
13030395 ‐24.6216 150.4628 DAWSON RIVER ALLUVIUM COND 1400 9.9
13030433 ‐24.4701 150.3891 DAWSON RIVER ALLUVIUM COND 28400 9.9
13030397 ‐24.9048 150.0892 DAWSON RIVER ALLUVIUM COND 10,000 9.8
89546 ‐24.6994 150.4862 DAWSON RIVER ALLUVIUM COND 3200 20 9.72
13030412 ‐24.7451 150.2941 DAWSON RIVER ALLUVIUM 9.7
13030393 ‐24.43 150.5112 DAWSON RIVER ALLUVIUM COND 2130 9.7
89547 ‐24.4276 150.5102 DAWSON RIVER ALLUVIUM COND 1300 38 9.55
13030399 ‐24.7096 150.4653 DAWSON RIVER ALLUVIUM COND 11500 3.79 9.5
13030407 ‐24.3863 150.4412 DAWSON RIVER ALLUVIUM COND 1070 9.5
13030738 ‐24.95 149.849 DAWSON RIVER ALLUVIUM 9.5
13030409 ‐24.8274 150.3459 DAWSON RIVER ALLUVIUM 1.52 9.5
13030398 ‐24.9095 150.0826 DAWSON RIVER ALLUVIUM COND 10,000 9.4
13030416 ‐24.4096 150.495 DAWSON RIVER ALLUVIUM COND 341 2.5 9.2
13030408 ‐24.7418 150.2983 DAWSON RIVER ALLUVIUM COND 815 5.8 9.2
13030576 ‐24.9983 150.3619 DAWSON RIVER ALLUVIUM COND 540 9.13
13030590 ‐24.2894 150.4456 DAWSON RIVER ALLUVIUM 9.07
13030735 ‐24.8286 150.3206 DAWSON RIVER ALLUVIUM 9.07
13030414 ‐24.7545 150.4921 DAWSON RIVER ALLUVIUM 8.8
13030413 ‐24.7824 150.5092 DAWSON RIVER ALLUVIUM COND 5090 8.7
13030389 ‐24.5503 150.377 DAWSON RIVER ALLUVIUM COND 4150 8.7
13030584 ‐25.0819 150.4572 DAWSON RIVER ALLUVIUM COND 7200 8.26
128298 ‐24.9242 149.8896 DAWSON RIVER ALLUVIUM POTABLE 8
13030582 ‐25.0856 150.1794 DAWSON RIVER ALLUVIUM BRACKISH 7.8
13030575 ‐25.0043 150.4561 DAWSON RIVER ALLUVIUM COND 4000 7.1
13030583 ‐25.1007 150.187 DAWSON RIVER ALLUVIUM COND 3600 7.08
89509 ‐24.3832 150.4862 DAWSON RIVER ALLUVIUM 1.26 6
13030574 ‐25.0327 150.44 DAWSON RIVER ALLUVIUM COND 2520 5.92
47549 ‐24.6233 150.4406 DAWSON RIVER ALLUVIUM 0.6 3
128163 ‐24.3993 150.4947 GLANDORE GRANODIORITE 0.78 20
89987 ‐24.3737 150.5114 GLANDORE GRANODIORITE 0.01 18.3
89987 ‐24.3737 150.5114 GLANDORE GRANODIORITE COND 12600 0.01 18.3
128196 ‐24.3988 150.4943 GLANDORE GRANODIORITE 2600 M/S 0.69 18.3
89961 ‐24.3615 150.4964 GLANDORE GRANODIORITE 3000 US/CM 0.43 17.12
128153 ‐24.3843 150.501 GLANDORE GRANODIORITE 1900 M/S 1.64 15
111911 ‐24.4459 150.5057 GLANDORE GRANODIORITE COND 1200 1.13 12
128197 ‐24.4092 150.4925 GLANDORE GRANODIORITE 2580 M/S 11.6
128148 ‐24.3089 150.4488 GLANDORE GRANODIORITE 1600 US/CM 1.26 10
128153 ‐24.3843 150.501 GLANDORE GRANODIORITE 1780 M/S 0.76 9
128153 ‐24.3843 150.501 GLANDORE GRANODIORITE 1720 M/S 2.78 8
128153 ‐24.3843 150.501 GLANDORE GRANODIORITE 1920 M/S 0.52 4.9
57511 ‐24.2912 150.4513 GLENHALVERN GRANITE 1.26 7.6
128446 ‐24.5525 149.9044 GRANITE POTABLE 0.63 75
128467 ‐24.4061 150.4865 GRANITE POTABLE 0.5 63.3
128444 ‐25.1686 150.106 GRANITE POTABLE 2.52 28
128623 ‐24.3536 150.4823 GRANITE POTABLE 0.13 18.8
128631 ‐24.4237 150.5149 GRANITE POTABLE 0.2 17
128640 ‐24.8248 150.5194 GRANITE POTABLE 0.3 15.3

Draft Underground Water Impact Report ‐ ATP 564P 8‐9
Bore ID (RN)
Latitude Longitude Hydraulic unit Water quality
(µS/cm) Yield (L/s)
Water level (mbgl)
128432 ‐25.2255 149.9426 GRANITE GOOD 0.2 14
128629 ‐24.3608 150.4901 GRANITE POTABLE 0.2 12.8
128466 ‐24.3995 150.4958 GRANITE POTABLE 0.13 11.5
128630 ‐24.7739 150.465 GRANITE POTABLE 0.07 8.5
111909 ‐24.3724 150.5132 GRANITE 1300 US/CM 10 8.2
128632 ‐24.3907 150.4835 GRANITE POTABLE 0.3 8.2
128413 ‐25.1015 149.8415 GRANITE BRACKISH 0.44 7
128633 ‐24.426 150.2273 GRANITE POTABLE 1.24 5.4
68557 ‐24.3669 150.4774 GREVILLEA CREEK ALLUVIUM COND 1920 3.8 16.4
68553 ‐24.2813 150.4466 GREVILLEA CREEK ALLUVIUM 0.5 15.9
68362 ‐24.5509 150.4222 GREVILLEA CREEK ALLUVIUM 1.7 15.3
89705 ‐24.5464 149.6633 GREVILLEA CREEK ALLUVIUM 0.9 15.3
62403 ‐24.3192 150.4658 GREVILLEA CREEK ALLUVIUM 1.9 14.4
68130 ‐24.2944 150.4005 GREVILLEA CREEK ALLUVIUM 1.5 14.3
13030544 ‐24.4672 150.1259 GREVILLEA CREEK ALLUVIUM COND 1050 14.2
128206 ‐24.4093 150.5 GREVILLEA CREEK ALLUVIUM 1 13.8
33681 ‐24.3813 150.4972 GREVILLEA CREEK ALLUVIUM 1.5 13.6
37244 ‐24.3124 150.4415 GREVILLEA CREEK ALLUVIUM COND 2470 1.6 13.4
36463 ‐24.3603 150.4836 GREVILLEA CREEK ALLUVIUM 1.1 12.7
57595 ‐24.6542 150.4864 GREVILLEA CREEK ALLUVIUM COND 3400 16 12.7
32926 ‐24.3811 150.4607 GREVILLEA CREEK ALLUVIUM 44.2 12.1
33263 ‐24.393 150.473 GREVILLEA CREEK ALLUVIUM 0.6 11.8
128149 ‐24.5157 150.4871 GREVILLEA CREEK ALLUVIUM 11.55
37331 ‐24.3207 150.4354 GREVILLEA CREEK ALLUVIUM 0 10.7
32633 ‐24.3417 150.4563 GREVILLEA CREEK ALLUVIUM COND 2950 3.4 9.7
57795 ‐24.3034 150.4466 GREVILLEA CREEK ALLUVIUM 0.5 9.3
47092 ‐24.9715 150.0944 GREVILLEA CREEK ALLUVIUM COND 6200 1.9 8.4
8362 ‐24.8923 150.0849 GREVILLEA CREEK ALLUVIUM 2 6.7
32632 ‐24.8849 150.1462 GREVILLEA CREEK ALLUVIUM 1.89 6
128185 ‐24.415 150.518 KARIBOE CREEK ALLUVIUM 12.6 18.05
89736 ‐24.3375 150.4332 KARIBOE CREEK ALLUVIUM 1 16.1
68452 ‐24.3847 150.4778 KARIBOE CREEK ALLUVIUM 1.5 15.7
13030545 ‐24.4943 150.2504 KARIBOE CREEK ALLUVIUM COND 1650 13.9
31980 ‐24.327 150.4563 KARIBOE CREEK ALLUVIUM COND 2800 45.5 9
31132 ‐24.9377 150.0773 KARIBOE CREEK ALLUVIUM COND 2475 30.2 8.8
34106 ‐24.4114 150.4323 KARIBOE CREEK ALLUVIUM 4.7 7.5
13030084 ‐25.2097 150.1411 KARIBOE CREEK ALLUVIUM COND 2230 4.8
31527 ‐24.6862 149.8354 KARIBOE CREEK ALLUVIUM 37.8 4.6
31528 ‐25.155 150.1756 KARIBOE CREEK ALLUVIUM 38.4 3.3
68835 ‐24.3204 150.4372 KROOMBIT CREEK ALLUVIUM 1.38 59.5
128220 ‐24.8998 150.1083 KROOMBIT CREEK ALLUVIUM 0.63 18
128187 ‐24.5719 150.4381 KROOMBIT CREEK ALLUVIUM 25.26 17.7
89963 ‐24.3845 150.4527 KROOMBIT CREEK ALLUVIUM 0.63 17.55
89957 ‐24.3787 150.5135 KROOMBIT CREEK ALLUVIUM POTABLE 9.99 17.5
68489 ‐24.4145 150.5019 KROOMBIT CREEK ALLUVIUM 0.4 17.4
68829 ‐24.3056 150.433 KROOMBIT CREEK ALLUVIUM 1 17.2
416 ‐24.4843 149.8417 KROOMBIT CREEK ALLUVIUM 0.01 16.8
68592 ‐24.6354 150.4702 KROOMBIT CREEK ALLUVIUM 1.3 16.7
68552 ‐24.3859 150.435 KROOMBIT CREEK ALLUVIUM COND 920 1.3 16.6
128596 ‐24.339 150.4488 KROOMBIT CREEK ALLUVIUM POTABLE 0.8 16.4
13030694 ‐24.8443 150.2866 KROOMBIT CREEK ALLUVIUM 16.35
68843 ‐24.347 150.4716 KROOMBIT CREEK ALLUVIUM POTABLE 11.25 16.35

Draft Underground Water Impact Report ‐ ATP 564P 8‐10
Bore ID (RN)
Latitude Longitude Hydraulic unit Water quality
(µS/cm) Yield (L/s)
Water level (mbgl)
89890 ‐24.3325 150.4572 KROOMBIT CREEK ALLUVIUM 1 16.28
89794 ‐24.8295 149.8 KROOMBIT CREEK ALLUVIUM 0.38 16.2
13030615 ‐24.3814 150.4989 KROOMBIT CREEK ALLUVIUM 16.13
89737 ‐24.4106 150.499 KROOMBIT CREEK ALLUVIUM 20.2 16
13030669 ‐25.1503 150.2606 KROOMBIT CREEK ALLUVIUM 15.8
68456 ‐24.4092 150.4941 KROOMBIT CREEK ALLUVIUM 20.2 15.8
89733 ‐24.3374 150.4523 KROOMBIT CREEK ALLUVIUM 1 15.8
89730 ‐24.41 150.4958 KROOMBIT CREEK ALLUVIUM 1 15.4
68866 ‐24.7024 150.4858 KROOMBIT CREEK ALLUVIUM 1 15.3
68903 ‐24.4091 150.4919 KROOMBIT CREEK ALLUVIUM COND 830 1.89 15.15
89908 ‐24.2944 150.4138 KROOMBIT CREEK ALLUVIUM POTABLE 17.5 14.95
68802 ‐24.4195 150.4347 KROOMBIT CREEK ALLUVIUM 23.94 14.86
13030477 ‐24.3222 150.4258 KROOMBIT CREEK ALLUVIUM 14.8
31134 ‐24.9478 150.0768 KROOMBIT CREEK ALLUVIUM COND 990 0.88 14.6
35002 ‐24.9828 150.14 KROOMBIT CREEK ALLUVIUM COND 840 0.76 14.52
43863 ‐24.305 150.4543 KROOMBIT CREEK ALLUVIUM 35.9 14.4
89956 ‐24.482 150.421 KROOMBIT CREEK ALLUVIUM POTABLE 1.2 14.38
32683 ‐24.3186 150.465 KROOMBIT CREEK ALLUVIUM 0.5 14.2
89873 ‐24.545 150.4251 KROOMBIT CREEK ALLUVIUM 0.8 14.15
68543 ‐24.3701 150.5153 KROOMBIT CREEK ALLUVIUM 1.89 14.1
128341 ‐24.2986 149.6997 KROOMBIT CREEK ALLUVIUM POTABLE 10.25 14.05
34972 ‐24.437 150.4186 KROOMBIT CREEK ALLUVIUM 13.9 14
47084 ‐24.9792 150.0891 KROOMBIT CREEK ALLUVIUM 25.2 13.8
128017 ‐24.3281 150.4422 KROOMBIT CREEK ALLUVIUM 8 13.8
13030259 ‐25.0603 150.0714 KROOMBIT CREEK ALLUVIUM 13.73
68057 ‐24.5376 150.4292 KROOMBIT CREEK ALLUVIUM POTABLE 1.1 13.7
62034 ‐24.3261 150.4455 KROOMBIT CREEK ALLUVIUM 0.8 13.7
68605 ‐24.3045 150.3994 KROOMBIT CREEK ALLUVIUM COND 2650 1.2 13.7
89857 ‐25.2773 149.7392 KROOMBIT CREEK ALLUVIUM POTABLE 0.8 13.7
128028 ‐24.4268 150.5141 KROOMBIT CREEK ALLUVIUM 1.26 13.7
68911 ‐24.8226 149.8055 KROOMBIT CREEK ALLUVIUM 13.5
89789 ‐24.4262 150.4286 KROOMBIT CREEK ALLUVIUM 0.76 13.5
128002 ‐24.3387 150.4566 KROOMBIT CREEK ALLUVIUM 0.8 13.4
128654 ‐24.3582 150.4383 KROOMBIT CREEK ALLUVIUM POTABLE 13.35
68981 ‐24.3657 150.4964 KROOMBIT CREEK ALLUVIUM POTABLE 0.56 13.34
68611 ‐24.6073 150.4462 KROOMBIT CREEK ALLUVIUM 12.6 13.3
128010 ‐24.3572 150.5143 KROOMBIT CREEK ALLUVIUM 8.75 13.3
68761 ‐24.3738 150.5011 KROOMBIT CREEK ALLUVIUM 1.4 13.2
68912 ‐24.8306 149.8011 KROOMBIT CREEK ALLUVIUM 1 13.15
68950 ‐24.2953 150.4233 KROOMBIT CREEK ALLUVIUM 0.75 13.13
68621 ‐24.4189 150.4263 KROOMBIT CREEK ALLUVIUM 19 13.1
68801 ‐25.2423 149.6972 KROOMBIT CREEK ALLUVIUM COND 500 15.12 13
68800 ‐24.4026 150.4835 KROOMBIT CREEK ALLUVIUM 0.88 13
68618 ‐24.3978 150.4875 KROOMBIT CREEK ALLUVIUM 7.56 12.95
47252 ‐25.2817 150.26 KROOMBIT CREEK ALLUVIUM 0.6 12.9
128369 ‐24.8984 150.0878 KROOMBIT CREEK ALLUVIUM POTABLE 12 12.9
13030679 ‐25.2729 150.2783 KROOMBIT CREEK ALLUVIUM COND 1250 1.26 12.8
43088 ‐24.3413 150.4862 KROOMBIT CREEK ALLUVIUM COND 2110 11.3 12.8
47251 ‐25.0679 150.2483 KROOMBIT CREEK ALLUVIUM 0.6 12.8
68735 ‐24.3852 150.4771 KROOMBIT CREEK ALLUVIUM 12.6 12.7
47249 ‐24.9584 150.1083 KROOMBIT CREEK ALLUVIUM 0.6 12.6
57496 ‐24.329 150.4209 KROOMBIT CREEK ALLUVIUM 1 12.6

Draft Underground Water Impact Report ‐ ATP 564P 8‐11
Bore ID (RN)
Latitude Longitude Hydraulic unit Water quality
(µS/cm) Yield (L/s)
Water level (mbgl)
68960 ‐24.4065 150.4599 KROOMBIT CREEK ALLUVIUM 38 12.6
8659 ‐24.9387 150.0709 KROOMBIT CREEK ALLUVIUM TDS 686 MG/L 1.1 12.5
67278 ‐24.3638 150.449 KROOMBIT CREEK ALLUVIUM POTIABLE 1.76 12.5
68999 ‐24.3764 150.5059 KROOMBIT CREEK ALLUVIUM 12.6 12.5
68697 ‐24.4187 150.4661 KROOMBIT CREEK ALLUVIUM 1 12.4
47250 ‐24.9804 150.1036 KROOMBIT CREEK ALLUVIUM 0.63 12.37
68732 ‐24.4284 150.4797 KROOMBIT CREEK ALLUVIUM 0.63 12.35
13030696 ‐25.0564 150.475 KROOMBIT CREEK ALLUVIUM 12.2
47248 ‐24.9581 150.1136 KROOMBIT CREEK ALLUVIUM 0.6 12.2
57694 ‐24.5592 150.4299 KROOMBIT CREEK ALLUVIUM 31.5 12.2
62116 ‐24.3641 150.4704 KROOMBIT CREEK ALLUVIUM 0.5 12.2
13030680 ‐25.2731 150.2989 KROOMBIT CREEK ALLUVIUM COND 1500 1.26 12.15
47297 ‐25.199 149.825 KROOMBIT CREEK ALLUVIUM COND 1657 15.14 12.08
13030631 ‐24.3772 150.5069 KROOMBIT CREEK ALLUVIUM 11.9
68018 ‐24.409 150.5146 KROOMBIT CREEK ALLUVIUM POTABLE 1 11.9
62315 ‐25.1853 149.6424 KROOMBIT CREEK ALLUVIUM 11.9
68482 ‐24.3653 150.4976 KROOMBIT CREEK ALLUVIUM 0.5 11.9
34023 ‐24.3657 150.5173 KROOMBIT CREEK ALLUVIUM 0.3 11.8
68198 ‐24.3284 150.4429 KROOMBIT CREEK ALLUVIUM 18.9 11.8
13030670 ‐25.1542 150.2458 KROOMBIT CREEK ALLUVIUM 11.4
89964 ‐24.3655 150.5121 KROOMBIT CREEK ALLUVIUM 25.25 11.4
47617 ‐24.4125 150.4347 KROOMBIT CREEK ALLUVIUM 0.6 11.3
33294 ‐24.3673 150.4878 KROOMBIT CREEK ALLUVIUM COND 5400 7.6 11.3
47161 ‐25.0162 150.1525 KROOMBIT CREEK ALLUVIUM 0.6 11.3
68834 ‐24.4524 150.5083 KROOMBIT CREEK ALLUVIUM 22.73 11.27
62237 ‐24.4084 150.4686 KROOMBIT CREEK ALLUVIUM 0.6 11.2
68029 ‐24.4358 150.4958 KROOMBIT CREEK ALLUVIUM 0.5 11.1
68478 ‐24.3286 150.4714 KROOMBIT CREEK ALLUVIUM 33 11.05
13030548 ‐24.5091 150.258 KROOMBIT CREEK ALLUVIUM COND 2900 10.9
33651 ‐24.3592 150.4827 KROOMBIT CREEK ALLUVIUM COND 1270 8.9 10.9
47971 ‐24.6133 150.4534 KROOMBIT CREEK ALLUVIUM 12.6 10.9
62118 ‐24.4228 150.4816 KROOMBIT CREEK ALLUVIUM 0.6 10.9
68862 ‐24.319 150.4088 KROOMBIT CREEK ALLUVIUM 34.02 10.9
68975 ‐24.325 150.47 KROOMBIT CREEK ALLUVIUM 20.16 10.75
13030724 ‐24.8333 150.3058 KROOMBIT CREEK ALLUVIUM 10.7
89860 ‐25.1768 149.7858 KROOMBIT CREEK ALLUVIUM 10.65
68238 ‐24.5315 150.4333 KROOMBIT CREEK ALLUVIUM COND 3500 1.9 10.6
68805 ‐24.4451 150.4989 KROOMBIT CREEK ALLUVIUM 1 10.6
68932 ‐24.8154 149.7478 KROOMBIT CREEK ALLUVIUM POTABLE 10.6
37312 ‐24.3604 150.4958 KROOMBIT CREEK ALLUVIUM 1 10.5
62914 ‐24.3608 150.4746 KROOMBIT CREEK ALLUVIUM 0.6 10.5
68982 ‐24.3736 150.5066 KROOMBIT CREEK ALLUVIUM POTABLE 0.9 10.5
89714 ‐24.3792 150.5055 KROOMBIT CREEK ALLUVIUM 0.5 10.5
43662 ‐24.3756 150.5113 KROOMBIT CREEK ALLUVIUM 0.3 10.4
13030635 ‐24.3594 150.4817 KROOMBIT CREEK ALLUVIUM 10.1
32335 ‐24.3538 150.4397 KROOMBIT CREEK ALLUVIUM 31.6 10
38577 ‐24.3767 150.4818 KROOMBIT CREEK ALLUVIUM COND 7800 7.6 10
47185 ‐24.9629 150.1489 KROOMBIT CREEK ALLUVIUM 1.7 10
47542 ‐24.6141 150.4223 KROOMBIT CREEK ALLUVIUM 16.4 10
62426 ‐24.4065 150.4823 KROOMBIT CREEK ALLUVIUM 1.1 10
89722 ‐24.4173 150.503 KROOMBIT CREEK ALLUVIUM POTABLE 1.25 10
13030716 ‐25.0628 150.1372 KROOMBIT CREEK ALLUVIUM 9.95

Draft Underground Water Impact Report ‐ ATP 564P 8‐12
Bore ID (RN)
Latitude Longitude Hydraulic unit Water quality
(µS/cm) Yield (L/s)
Water level (mbgl)
68806 ‐24.4034 150.4591 KROOMBIT CREEK ALLUVIUM 26.46 9.91
57792 ‐24.3162 150.4444 KROOMBIT CREEK ALLUVIUM COND 5550 12.6 9.9
47600 ‐24.6219 150.4567 KROOMBIT CREEK ALLUVIUM 16.1 9.9
32681 ‐24.3415 150.4564 KROOMBIT CREEK ALLUVIUM 23.2 9.9
33987 ‐24.3183 150.4899 KROOMBIT CREEK ALLUVIUM 0.63 9.9
32006 ‐24.3319 150.4534 KROOMBIT CREEK ALLUVIUM POTABLE 9.8
31133 ‐24.999 150.0758 KROOMBIT CREEK ALLUVIUM 21.7 9.7
31739 ‐24.3216 150.4391 KROOMBIT CREEK ALLUVIUM 25.2 9.6
43149 ‐24.3661 150.5071 KROOMBIT CREEK ALLUVIUM 17.7 9.6
47299 ‐25.2004 149.765 KROOMBIT CREEK ALLUVIUM 10.61 9.53
13030269 ‐24.4775 150.391 KROOMBIT CREEK ALLUVIUM COND 2200 13.9 9.5
62425 ‐24.3115 150.4174 KROOMBIT CREEK ALLUVIUM 1 9.5
34174 ‐24.4092 150.4912 KROOMBIT CREEK ALLUVIUM 11.4 9.4
36051 ‐24.3815 150.26 KROOMBIT CREEK ALLUVIUM COND 2600 1 9.3
36145 ‐24.6623 150.477 KROOMBIT CREEK ALLUVIUM 22 9.3
13030266 ‐24.7603 150.507 KROOMBIT CREEK ALLUVIUM COND 2340 9.29
47298 ‐25.1606 149.8125 KROOMBIT CREEK ALLUVIUM COND 1950 9.2
13030144 ‐24.4733 150.4055 KROOMBIT CREEK ALLUVIUM COND 1950 41.7 9.2
35050 ‐24.3517 150.2908 KROOMBIT CREEK ALLUVIUM 0.6 9.2
447 ‐24.4764 149.8125 KROOMBIT CREEK ALLUVIUM TDS 350 MG/L 0 9.14
34011 ‐24.977 150.1372 KROOMBIT CREEK ALLUVIUM 2.5 9.1
32717 ‐24.3174 150.4544 KROOMBIT CREEK ALLUVIUM COND 2500 39 8.9
34553 ‐24.4276 150.5134 KROOMBIT CREEK ALLUVIUM 0.6 8.9
32893 ‐24.4127 150.4917 KROOMBIT CREEK ALLUVIUM COND 3000 18.1 8.8
34131 ‐24.4113 150.5072 KROOMBIT CREEK ALLUVIUM COND 1750 17.8 8.7
47599 ‐24.6204 150.4559 KROOMBIT CREEK ALLUVIUM 15.1 8.5
32892 ‐24.3711 150.4991 KROOMBIT CREEK ALLUVIUM POTABLE 64.6 8.5
34066 ‐24.4104 150.4324 KROOMBIT CREEK ALLUVIUM 2 8.5
13030149 ‐24.8834 150.1685 KROOMBIT CREEK ALLUVIUM COND 1750 33.1 8.47
31740 ‐24.3118 150.4436 KROOMBIT CREEK ALLUVIUM 21.7 8.4
44510 ‐24.3712 150.4747 KROOMBIT CREEK ALLUVIUM 27.2 8.3
13030157 ‐24.9303 150.0778 KROOMBIT CREEK ALLUVIUM 8.2
8359 ‐24.9159 150.0925 KROOMBIT CREEK ALLUVIUM 2.3 8.2
32801 ‐24.3651 150.471 KROOMBIT CREEK ALLUVIUM 12.6 8.2
68530 ‐24.5901 150.419 KROOMBIT CREEK ALLUVIUM 0.8 8.1
13030150 ‐24.883 150.1672 KROOMBIT CREEK ALLUVIUM COND 1560 8.05
13030095 ‐25.0806 150.3056 KROOMBIT CREEK ALLUVIUM COND 2410 7.8
13030267 ‐24.5821 150.1577 KROOMBIT CREEK ALLUVIUM COND 1310 7.6
32334 ‐24.307 150.4548 KROOMBIT CREEK ALLUVIUM COND 1840 22.4 7.6
62269 ‐24.4468 150.4256 KROOMBIT CREEK ALLUVIUM 1.1 7.6
13030143 ‐24.5177 150.3544 KROOMBIT CREEK ALLUVIUM COND 2060 7.5
13030112 ‐24.6869 150.3603 KROOMBIT CREEK ALLUVIUM COND 1150 7.5
13030147 ‐24.8139 150.0999 KROOMBIT CREEK ALLUVIUM COND 2600 46.6 7.5
32722 ‐24.3298 150.4643 KROOMBIT CREEK ALLUVIUM 7.44
13030146 ‐24.3125 150.0044 KROOMBIT CREEK ALLUVIUM COND 1960 7.4
57822 ‐24.3805 150.476 KROOMBIT CREEK ALLUVIUM 25.2 7.3
32905 ‐24.3661 150.4736 KROOMBIT CREEK ALLUVIUM COND 2150 30 7.3
33199 ‐24.3914 150.4741 KROOMBIT CREEK ALLUVIUM 3.8 7.3
34015 ‐24.3495 150.4975 KROOMBIT CREEK ALLUVIUM 0.25 7.3
62189 ‐24.3003 150.4224 KROOMBIT CREEK ALLUVIUM COND 3500 26.5 7.3
13030145 ‐24.3803 150.4336 KROOMBIT CREEK ALLUVIUM COND 2100 7.3
13030268 ‐24.4761 150.4046 KROOMBIT CREEK ALLUVIUM COND 920 7.2

Draft Underground Water Impact Report ‐ ATP 564P 8‐13
Bore ID (RN)
Latitude Longitude Hydraulic unit Water quality
(µS/cm) Yield (L/s)
Water level (mbgl)
13030602 ‐24.4168 150.5025 KROOMBIT CREEK ALLUVIUM COND 1880 7.11
8369 ‐24.9054 150.0758 KROOMBIT CREEK ALLUVIUM TDS 1616 MG/L 2.3 7
31273 ‐24.2962 150.4225 KROOMBIT CREEK ALLUVIUM COND 6620 0.63 7
32333 ‐24.3386 150.4493 KROOMBIT CREEK ALLUVIUM 27.9 6.9
13030603 ‐24.4186 150.5042 KROOMBIT CREEK ALLUVIUM COND 1750 6.83
32336 ‐24.3235 150.4556 KROOMBIT CREEK ALLUVIUM 1 6.8
35037 ‐24.4967 150.4206 KROOMBIT CREEK ALLUVIUM 55.9 6.78
62523 ‐24.3408 150.4437 KROOMBIT CREEK ALLUVIUM COND 2800 18.9 6.75
13030135 ‐24.7013 150.4439 KROOMBIT CREEK ALLUVIUM COND 2620 6.7
31625 ‐24.3228 150.4383 KROOMBIT CREEK ALLUVIUM COND 4250 18.9 6.7
31270 ‐25.0325 150.1516 KROOMBIT CREEK ALLUVIUM COND 3150 14.2 6.7
36614 ‐24.3061 150.4235 KROOMBIT CREEK ALLUVIUM COND 8420 0.9 6.7
13030601 ‐24.3833 150.4811 KROOMBIT CREEK ALLUVIUM COND 1950 6.65
57745 ‐24.4301 150.5113 KROOMBIT CREEK ALLUVIUM 29 6.6
13030240 ‐24.7603 150.4808 KROOMBIT CREEK ALLUVIUM COND 1580 6.55
31657 ‐24.3032 150.4418 KROOMBIT CREEK ALLUVIUM 1.2 6.5
43862 ‐24.3133 150.4586 KROOMBIT CREEK ALLUVIUM 37.9 6.5
13030600 ‐24.6242 150.4214 KROOMBIT CREEK ALLUVIUM COND 1580 6.5
32906 ‐24.3664 150.4738 KROOMBIT CREEK ALLUVIUM COND 1500 38 6.3
62119 ‐24.3072 150.4144 KROOMBIT CREEK ALLUVIUM 0.5 6.3
32162 ‐24.3219 150.3938 KROOMBIT CREEK ALLUVIUM COND 3300 32.83 6.25
31886 ‐24.3207 150.4488 KROOMBIT CREEK ALLUVIUM 0.5 6.2
47607 ‐24.4376 150.5158 KROOMBIT CREEK ALLUVIUM 6.1
8366 ‐24.8612 150.2397 KROOMBIT CREEK ALLUVIUM 2.3 6.1
32720 ‐24.2789 150.3341 KROOMBIT CREEK ALLUVIUM COND 3250 45 5.99
32719 ‐24.3675 150.4485 KROOMBIT CREEK ALLUVIUM COND 1840 24.7 5.97
31626 ‐24.2804 150.4406 KROOMBIT CREEK ALLUVIUM 20.7 5.9
31526 ‐24.3087 150.431 KROOMBIT CREEK ALLUVIUM COND 3700 39.4 5.8
13030262 ‐24.7935 150.5052 KROOMBIT CREEK ALLUVIUM 5.64
8276 ‐24.937 150.0676 KROOMBIT CREEK ALLUVIUM TDS 644 MG/L 0.9 5.6
13030108 ‐24.7669 150.5173 KROOMBIT CREEK ALLUVIUM COND 1960 5.5
34003 ‐24.3187 150.4893 KROOMBIT CREEK ALLUVIUM 0.74 5.4
32721 ‐24.279 150.3342 KROOMBIT CREEK ALLUVIUM COND 2000 35.5 5.3
32783 ‐25.1592 150.2172 KROOMBIT CREEK ALLUVIUM COND 2800 30 5.18
33418 ‐24.3862 150.4882 KROOMBIT CREEK ALLUVIUM 19.8 5.18
13030261 ‐24.6208 150.4187 KROOMBIT CREEK ALLUVIUM 5.13
13030263 ‐24.7628 150.4652 KROOMBIT CREEK ALLUVIUM 5.13
13030110 ‐24.8834 150.4576 KROOMBIT CREEK ALLUVIUM COND 1910 5.1
13030111 ‐24.7127 150.4612 KROOMBIT CREEK ALLUVIUM COND 1950 32.8 5.1
13030096 ‐24.7164 150.2851 KROOMBIT CREEK ALLUVIUM COND 1900 5.1
13030109 ‐24.8524 150.4598 KROOMBIT CREEK ALLUVIUM COND 1930 5.1
32022 ‐24.3351 150.4478 KROOMBIT CREEK ALLUVIUM 2305 US/CM 27.8 4.8
32902 ‐24.9059 150.1258 KROOMBIT CREEK ALLUVIUM 18.9 4.8
32718 ‐24.3523 150.4487 KROOMBIT CREEK ALLUVIUM COND 3750 52.3 4.7
31749 ‐24.3305 150.4418 KROOMBIT CREEK ALLUVIUM COND 2850 34.1 4.6
13030265 ‐24.7603 150.4645 KROOMBIT CREEK ALLUVIUM 4.49
32161 ‐24.316 150.4591 KROOMBIT CREEK ALLUVIUM COND 3130 20.2 4.4
32904 ‐24.3329 150.463 KROOMBIT CREEK ALLUVIUM COND 2390 36.5 4.4
32781 ‐24.4723 150.1508 KROOMBIT CREEK ALLUVIUM COND 3300 63 4.34
32903 ‐24.3414 150.4771 KROOMBIT CREEK ALLUVIUM COND 2420 25 4.3
13030264 ‐24.7632 150.476 KROOMBIT CREEK ALLUVIUM 4.12
13030093 ‐25.0698 150.311 KROOMBIT CREEK ALLUVIUM COND 4100 4.1

Draft Underground Water Impact Report ‐ ATP 564P 8‐14
Bore ID (RN)
Latitude Longitude Hydraulic unit Water quality
(µS/cm) Yield (L/s)
Water level (mbgl)
13030098 ‐24.7694 150.4541 KROOMBIT CREEK ALLUVIUM COND 3500 4
13030137 ‐24.5217 150.4486 KROOMBIT CREEK ALLUVIUM COND 3400 3.8
31529 ‐24.3268 150.4293 KROOMBIT CREEK ALLUVIUM 52.7 3.6
13030238 ‐24.7615 150.4763 KROOMBIT CREEK ALLUVIUM COND 3000 3.3
13030100 ‐24.8585 150.4642 KROOMBIT CREEK ALLUVIUM COND 1440 2.9
13030102 ‐24.8583 150.4633 KROOMBIT CREEK ALLUVIUM 2.8
13030106 ‐24.7572 150.4583 KROOMBIT CREEK ALLUVIUM 2.8
13030103 ‐24.8583 150.4632 KROOMBIT CREEK ALLUVIUM 2.7
13030107 ‐24.7584 150.4615 KROOMBIT CREEK ALLUVIUM COND 2840 2.6
13030105 ‐24.8056 150.5129 KROOMBIT CREEK ALLUVIUM COND 3010 31.6 2.6
13030099 ‐24.7798 150.4637 KROOMBIT CREEK ALLUVIUM COND 2450 2.5
13030104 ‐24.8249 150.4862 KROOMBIT CREEK ALLUVIUM COND 3000 2.3
13030237 ‐24.8318 150.3143 KROOMBIT CREEK ALLUVIUM 2.06
128378 ‐25.1541 150.1713 LONESOME CREEK ALLUVIUM POTABLE 0.99 9.5
128311 ‐25.022 150.158 LONESOME CREEK ALLUVIUM POTABLE 0.99 8.7
89582 ‐24.3615 150.4669 LONESOME CREEK ALLUVIUM 10 8.5
68337 ‐24.6275 150.4239 LONESOME CREEK ALLUVIUM COND 3850 23 6.15
68104 ‐24.3436 150.4744 LONESOME CREEK ALLUVIUM COND 3850 22.7 5.95
68105 ‐24.4078 150.4966 LONESOME CREEK ALLUVIUM COND 670 23.9 5.8
68103 ‐24.3427 150.4757 LONESOME CREEK ALLUVIUM COND 1350 43.6 5.65
68338 ‐24.6415 150.4591 LONESOME CREEK ALLUVIUM COND 4600 23 5.54
89591 ‐24.3858 150.4987 LONESOME CREEK ALLUVIUM COND 3300 25.3 5.3
128154 ‐24.3233 150.442 MOOCOOROOBA GRANITE 1220 M/S 0.25 17
128154 ‐24.3233 150.442 MOOCOOROOBA GRANITE 1110 M/S 1.14 9
128154 ‐24.3233 150.442 MOOCOOROOBA GRANITE 1430 M/S 0.25 6.4
47186 ‐24.9851 150.15 OAKY CREEK ALLUVIUM 1 12.1
13030714 ‐24.9317 150.1756 OAKY CREEK ALLUVIUM 9.25
13030713 ‐24.9161 150.3817 OAKY CREEK ALLUVIUM BRACKISH 9.1
128195 ‐24.3674 150.4775 OXTRACK FORMATION 1200 M/S 0.6 26.5
10926 ‐24.9415 150.0749 OXTRACK FORMATION FAIR 1.8 3
44642 ‐24.3723 150.4921 PROSPECT CREEK ALLUVIUM 10.1 14
89903 ‐24.3714 150.4836 PROSPECT CREEK ALLUVIUM 0.76 13.95
89832 ‐24.4124 150.4735 PROSPECT CREEK ALLUVIUM 22.7 13.65
36418 ‐24.3917 150.4689 PROSPECT CREEK ALLUVIUM COND 1520 0.3 13
128021 ‐24.3499 150.4722 PROSPECT CREEK ALLUVIUM 0.44 12.45
34774 ‐25.1247 150.0633 PROSPECT CREEK ALLUVIUM 0.9 12.3
33848 ‐24.3995 150.4295 PROSPECT CREEK ALLUVIUM 1.69 12.2
128037 ‐24.3306 150.4652 PROSPECT CREEK ALLUVIUM POTABLE 0.9 12.2
31234 ‐24.9553 150.0744 PROSPECT CREEK ALLUVIUM 0.57 11.7
128207 ‐24.3848 150.4526 PROSPECT CREEK ALLUVIUM 3 11.5
68985 ‐24.3754 150.5071 PROSPECT CREEK ALLUVIUM 1.26 11.4
34210 ‐24.4126 150.4325 PROSPECT CREEK ALLUVIUM 0.19 11.1
43137 ‐24.2971 150.4501 PROSPECT CREEK ALLUVIUM COND 2100 1.3 10.84
62577 ‐24.4267 150.5097 PROSPECT CREEK ALLUVIUM COND 2720 13.9 10.7
68777 ‐24.5595 150.4839 PROSPECT CREEK ALLUVIUM 0.75 10.15
68313 ‐24.495 150.4214 PROSPECT CREEK ALLUVIUM 0.5 10
31235 ‐24.2762 150.399 PROSPECT CREEK ALLUVIUM COND 2060 31.6 9.8
31385 ‐24.3201 150.4158 PROSPECT CREEK ALLUVIUM 10.1 9.1
34492 ‐24.4318 150.501 PROSPECT CREEK ALLUVIUM 0.12 9.1
68674 ‐24.7282 150.5037 PROSPECT CREEK ALLUVIUM COND?? 2800 8.4 8.66
68676 ‐24.4177 150.4283 PROSPECT CREEK ALLUVIUM 1.76 8.1
31239 ‐24.2859 150.4113 PROSPECT CREEK ALLUVIUM POTABLE 9.25 7.92
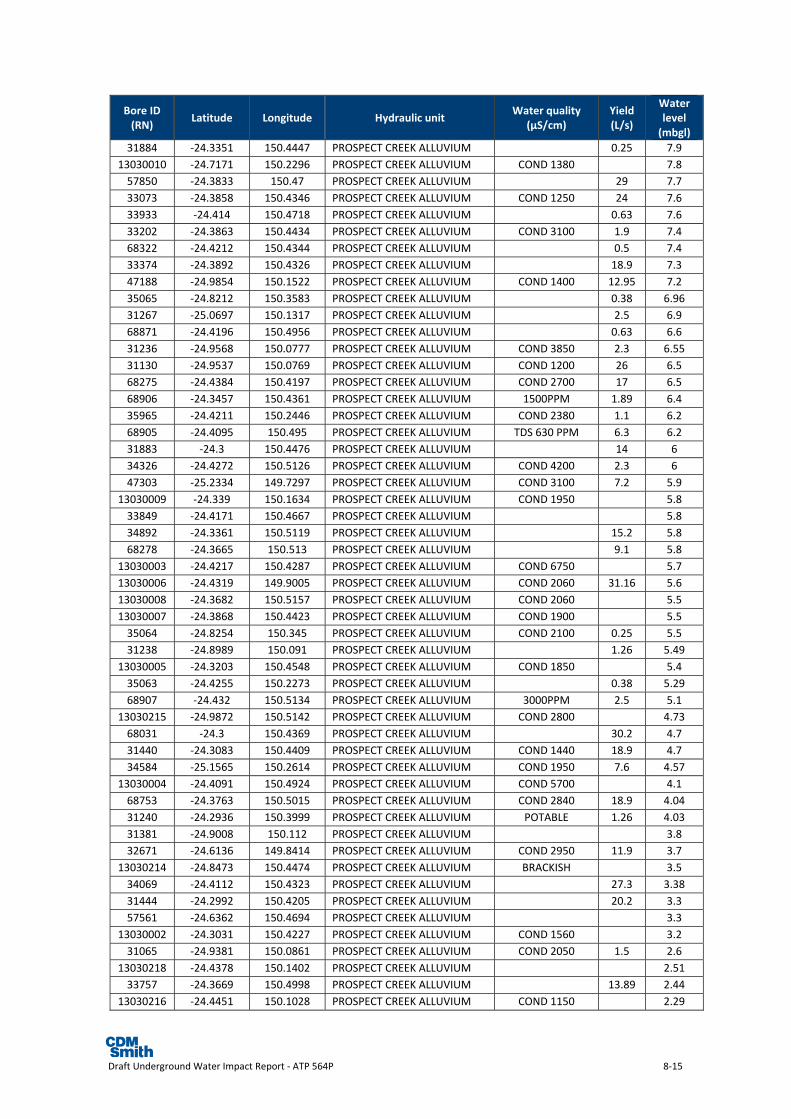
Draft Underground Water Impact Report ‐ ATP 564P 8‐15
Bore ID (RN)
Latitude Longitude Hydraulic unit Water quality
(µS/cm) Yield (L/s)
Water level (mbgl)
31884 ‐24.3351 150.4447 PROSPECT CREEK ALLUVIUM 0.25 7.9
13030010 ‐24.7171 150.2296 PROSPECT CREEK ALLUVIUM COND 1380 7.8
57850 ‐24.3833 150.47 PROSPECT CREEK ALLUVIUM 29 7.7
33073 ‐24.3858 150.4346 PROSPECT CREEK ALLUVIUM COND 1250 24 7.6
33933 ‐24.414 150.4718 PROSPECT CREEK ALLUVIUM 0.63 7.6
33202 ‐24.3863 150.4434 PROSPECT CREEK ALLUVIUM COND 3100 1.9 7.4
68322 ‐24.4212 150.4344 PROSPECT CREEK ALLUVIUM 0.5 7.4
33374 ‐24.3892 150.4326 PROSPECT CREEK ALLUVIUM 18.9 7.3
47188 ‐24.9854 150.1522 PROSPECT CREEK ALLUVIUM COND 1400 12.95 7.2
35065 ‐24.8212 150.3583 PROSPECT CREEK ALLUVIUM 0.38 6.96
31267 ‐25.0697 150.1317 PROSPECT CREEK ALLUVIUM 2.5 6.9
68871 ‐24.4196 150.4956 PROSPECT CREEK ALLUVIUM 0.63 6.6
31236 ‐24.9568 150.0777 PROSPECT CREEK ALLUVIUM COND 3850 2.3 6.55
31130 ‐24.9537 150.0769 PROSPECT CREEK ALLUVIUM COND 1200 26 6.5
68275 ‐24.4384 150.4197 PROSPECT CREEK ALLUVIUM COND 2700 17 6.5
68906 ‐24.3457 150.4361 PROSPECT CREEK ALLUVIUM 1500PPM 1.89 6.4
35965 ‐24.4211 150.2446 PROSPECT CREEK ALLUVIUM COND 2380 1.1 6.2
68905 ‐24.4095 150.495 PROSPECT CREEK ALLUVIUM TDS 630 PPM 6.3 6.2
31883 ‐24.3 150.4476 PROSPECT CREEK ALLUVIUM 14 6
34326 ‐24.4272 150.5126 PROSPECT CREEK ALLUVIUM COND 4200 2.3 6
47303 ‐25.2334 149.7297 PROSPECT CREEK ALLUVIUM COND 3100 7.2 5.9
13030009 ‐24.339 150.1634 PROSPECT CREEK ALLUVIUM COND 1950 5.8
33849 ‐24.4171 150.4667 PROSPECT CREEK ALLUVIUM 5.8
34892 ‐24.3361 150.5119 PROSPECT CREEK ALLUVIUM 15.2 5.8
68278 ‐24.3665 150.513 PROSPECT CREEK ALLUVIUM 9.1 5.8
13030003 ‐24.4217 150.4287 PROSPECT CREEK ALLUVIUM COND 6750 5.7
13030006 ‐24.4319 149.9005 PROSPECT CREEK ALLUVIUM COND 2060 31.16 5.6
13030008 ‐24.3682 150.5157 PROSPECT CREEK ALLUVIUM COND 2060 5.5
13030007 ‐24.3868 150.4423 PROSPECT CREEK ALLUVIUM COND 1900 5.5
35064 ‐24.8254 150.345 PROSPECT CREEK ALLUVIUM COND 2100 0.25 5.5
31238 ‐24.8989 150.091 PROSPECT CREEK ALLUVIUM 1.26 5.49
13030005 ‐24.3203 150.4548 PROSPECT CREEK ALLUVIUM COND 1850 5.4
35063 ‐24.4255 150.2273 PROSPECT CREEK ALLUVIUM 0.38 5.29
68907 ‐24.432 150.5134 PROSPECT CREEK ALLUVIUM 3000PPM 2.5 5.1
13030215 ‐24.9872 150.5142 PROSPECT CREEK ALLUVIUM COND 2800 4.73
68031 ‐24.3 150.4369 PROSPECT CREEK ALLUVIUM 30.2 4.7
31440 ‐24.3083 150.4409 PROSPECT CREEK ALLUVIUM COND 1440 18.9 4.7
34584 ‐25.1565 150.2614 PROSPECT CREEK ALLUVIUM COND 1950 7.6 4.57
13030004 ‐24.4091 150.4924 PROSPECT CREEK ALLUVIUM COND 5700 4.1
68753 ‐24.3763 150.5015 PROSPECT CREEK ALLUVIUM COND 2840 18.9 4.04
31240 ‐24.2936 150.3999 PROSPECT CREEK ALLUVIUM POTABLE 1.26 4.03
31381 ‐24.9008 150.112 PROSPECT CREEK ALLUVIUM 3.8
32671 ‐24.6136 149.8414 PROSPECT CREEK ALLUVIUM COND 2950 11.9 3.7
13030214 ‐24.8473 150.4474 PROSPECT CREEK ALLUVIUM BRACKISH 3.5
34069 ‐24.4112 150.4323 PROSPECT CREEK ALLUVIUM 27.3 3.38
31444 ‐24.2992 150.4205 PROSPECT CREEK ALLUVIUM 20.2 3.3
57561 ‐24.6362 150.4694 PROSPECT CREEK ALLUVIUM 3.3
13030002 ‐24.3031 150.4227 PROSPECT CREEK ALLUVIUM COND 1560 3.2
31065 ‐24.9381 150.0861 PROSPECT CREEK ALLUVIUM COND 2050 1.5 2.6
13030218 ‐24.4378 150.1402 PROSPECT CREEK ALLUVIUM 2.51
33757 ‐24.3669 150.4998 PROSPECT CREEK ALLUVIUM 13.89 2.44
13030216 ‐24.4451 150.1028 PROSPECT CREEK ALLUVIUM COND 1150 2.29

Draft Underground Water Impact Report ‐ ATP 564P 8‐16
Bore ID (RN)
Latitude Longitude Hydraulic unit Water quality
(µS/cm) Yield (L/s)
Water level (mbgl)
68003 ‐24.3833 150.498 PROSPECT CREEK ALLUVIUM POTABLE 17.6 2.2
33774 ‐24.3439 150.5 PROSPECT CREEK ALLUVIUM 13.9 1.8
13030001 ‐24.3789 150.4992 PROSPECT CREEK ALLUVIUM COND 2120 1.5
31050 ‐24.9421 150.0726 PROSPECT CREEK ALLUVIUM POTABLE 1 1.5
31051 ‐24.9487 150.0843 PROSPECT CREEK ALLUVIUM 8.8 1.5
31071 ‐24.9409 150.0744 PROSPECT CREEK ALLUVIUM 11.4 1.5
62281 ‐24.4466 150.4255 PROSPECT CREEK ALLUVIUM 10 1.4
33915 ‐24.3525 150.4969 PROSPECT CREEK ALLUVIUM 0.63 0.72
31072 ‐24.9464 150.0738 PROSPECT CREEK ALLUVIUM 5.7 0.5
33916 ‐24.414 150.4717 PROSPECT CREEK ALLUVIUM 0.63 0.37
68211 ‐24.3681 150.5078 QUATERNARY ‐ UNDEFINED COND 2810 0.4 4.2
68210 ‐24.3709 150.5108 QUATERNARY ‐ UNDEFINED COND 2750 0.8 2.8
128502 ‐24.3856 150.4829 SAND 26
128556 ‐24.3067 150.457 SAND POTABLE 1.1 16.3
128539 ‐25.1583 149.8965 SAND POTABLE 0.78 15.5
128583 ‐24.3095 150.4428 SAND 1200 2.8 13.69
128636 ‐24.3566 150.2983 SAND 2400 13.5
128584 ‐24.2842 150.4146 SAND 1200 2.5 13.47
128587 ‐24.4644 150.4305 SAND 820 5 11.8
128651 ‐24.2808 150.1796 SAND POTABLE 11.5
128571 ‐24.6697 150.4768 SAND POTABLE 0.45 9
128624 ‐25.177 149.6527 SAND POTABLE 3 8.8
84698 ‐24.4172 150.503 SAND 2.6 8.1
128534 ‐24.5988 149.9106 SAND GOOD 7.5
128328 ‐25.0304 150.155 TORSDALE VOLCANICS 1560 MS 0.12 37
89986 ‐24.3803 150.4984 TORSDALE VOLCANICS COND 3700 1.7 20.9
128170 ‐24.3093 150.424 TORSDALE VOLCANICS 2400 M/S 0.13 20.1
68508 ‐24.5924 150.4424 TORSDALE VOLCANICS COND 2400 2.3 18.3
128329 ‐24.9398 150.0498 TORSDALE VOLCANICS 720MS 0.22 17
128177 ‐24.4304 150.5028 TORSDALE VOLCANICS 1300 M/S 0.58 13.4
89970 ‐24.9042 150.0766 TORSDALE VOLCANICS 2100 CON 0.57 13
89803 ‐24.388 150.4844 TORSDALE VOLCANICS COND 1900 1.1 12.42
89804 ‐24.276 150.443 TORSDALE VOLCANICS COND 1650 1.38 12.42
111917 ‐24.2885 150.4482 TORSDALE VOLCANICS 1000 US/CM 0.5 11.3
31069 ‐24.8984 150.086 TORSDALE VOLCANICS 0.4 10.4
89971 ‐24.4417 150.496 TORSDALE VOLCANICS 2000 CON 0.76 10.3
128162 ‐24.365 150.5118 TORSDALE VOLCANICS 4.99 9
128046 ‐24.4092 150.5001 TORSDALE VOLCANICS 1500 US/CM 0.9 7
33075 ‐24.3863 150.4436 TORSDALE VOLCANICS 0.38 6.7
33850 ‐24.4021 150.43 TORSDALE VOLCANICS 0.03 4.6
128047 ‐24.4099 150.4968 TORSDALE VOLCANICS 2100 US/CM 0.3 4
89693 ‐24.3494 150.4772 TUALKA CREEK ALLUVIUM POTABLE 0.32 7.5
89753 ‐24.422 150.4919 TUALKA CREEK ALLUVIUM POTABLE 0.45 7.5
68010 ‐24.4129 150.5097 UNDIFF BASALT 0.6 6
89759 ‐24.4097 150.5001 WASHPOOL GULLY ALLUVIUM 1 14.14
68757 ‐24.3721 150.5012 WASHPOOL GULLY ALLUVIUM 0.88 13.8
68380 ‐24.6428 150.4624 WASHPOOL GULLY ALLUVIUM 20.7 13.4
68945 ‐24.4278 150.4216 WASHPOOL GULLY ALLUVIUM 0.6 13.3
68377 ‐24.5565 150.4197 WASHPOOL GULLY ALLUVIUM 1.9 13.1
35688 ‐25.1851 150.2644 WASHPOOL GULLY ALLUVIUM COND 674 17 12.9
62964 ‐24.3609 150.4512 WASHPOOL GULLY ALLUVIUM 2.3 12.8
62944 ‐24.312 150.4316 WASHPOOL GULLY ALLUVIUM POTABLE 1.5 12.7

Draft Underground Water Impact Report ‐ ATP 564P 8‐17
Bore ID (RN)
Latitude Longitude Hydraulic unit Water quality
(µS/cm) Yield (L/s)
Water level (mbgl)
68522 ‐24.6007 150.4128 WASHPOOL GULLY ALLUVIUM 0.5 12.7
68502 ‐24.5815 150.4424 WASHPOOL GULLY ALLUVIUM 0.5 12.6
62958 ‐24.3749 150.4805 WASHPOOL GULLY ALLUVIUM 0.63 12.15
62957 ‐24.3753 150.4767 WASHPOOL GULLY ALLUVIUM 17.6 11.8
35687 ‐24.5443 150.4288 WASHPOOL GULLY ALLUVIUM COND 1150 28.4 11.6
35689 ‐25.2329 149.7169 WASHPOOL GULLY ALLUVIUM 10.6 11.6
68595 ‐24.6542 150.4872 WASHPOOL GULLY ALLUVIUM 0.5 11.5
68020 ‐24.4136 150.4979 WASHPOOL GULLY ALLUVIUM POTABLE 1.2 11.27
89747 ‐24.5335 150.4336 WASHPOOL GULLY ALLUVIUM 1 11.07
35691 ‐24.3837 150.2859 WASHPOOL GULLY ALLUVIUM 13 10.8
62056 ‐24.3203 150.4549 WASHPOOL GULLY ALLUVIUM 0.5 10.8
68776 ‐24.5576 150.4858 WASHPOOL GULLY ALLUVIUM COND 3400 0.88 10.32
35690 ‐24.5125 150.5114 WASHPOOL GULLY ALLUVIUM COND 1260 11.5 9.9
47162 ‐24.9723 150.1616 WASHPOOL GULLY ALLUVIUM 1 9.3
68182 ‐24.3679 150.5008 WASHPOOL GULLY ALLUVIUM 32.8 9
57638 ‐24.5679 150.4127 WASHPOOL GULLY ALLUVIUM 28.4 8.7
47192 ‐24.9756 150.1378 WASHPOOL GULLY ALLUVIUM COND 865 15.2 8.57
32353 ‐24.3412 150.4551 WASHPOOL GULLY ALLUVIUM 30.3 8.5
68070 ‐24.5162 150.4127 WASHPOOL GULLY ALLUVIUM 0.5 8.2
32355 ‐24.3461 150.4476 WASHPOOL GULLY ALLUVIUM 1.6 7.8
47615 ‐24.4349 150.5191 WASHPOOL GULLY ALLUVIUM 7.7
32354 ‐24.3188 150.4578 WASHPOOL GULLY ALLUVIUM 35.3 7.4
57310 ‐24.6163 150.4536 WASHPOOL GULLY ALLUVIUM 24 7.1
47247 ‐24.9667 150.1261 WASHPOOL GULLY ALLUVIUM COND 2570 1 6.9
62923 ‐24.4732 150.5177 WASHPOOL GULLY ALLUVIUM 0.6 6.8
57737 ‐24.5487 150.4297 WASHPOOL GULLY ALLUVIUM 1.3 6.4
35626 ‐24.538 150.428 WASHPOOL GULLY ALLUVIUM 0.6 6.1
47520 ‐24.282 150.4435 WASHPOOL GULLY ALLUVIUM 20 6.1
34010 ‐24.4062 150.4297 WASHPOOL GULLY ALLUVIUM 0.6 2.4

Draft Underground Water Impact Report ‐ ATP 564P 8‐18

Draft Underground Water Impact Report ‐ ATP 564P 8‐19
Appendix B ‐ Summary of laboratory results for
registered bores sampled in Jan 2013

Draft Underground Water Impact Report ‐ ATP 564P 8‐20

Draft Underground Water Impact Report ‐ ATP 564P 8‐21
Appendix C ‐ UWIR Groundwater Monitoring
Checklist
Thefollowingchecklistwillbecompletedateachmonitoringepisode.
Task
Verifymonitoringcompletedasrequired
1 Allmonitoredboresintact? Y/N
Ifboreholesdamagedamendregistereddetails
2 Allmonitoringcompletedaccordingtoschedule Y/N
Ifmonitoringincompletecommissionadditionalmonitoringasrequired
Reviewmonitoringdata
3 Potentiallyadverseimpactsidentified?
Comparemeasuredwaterleveltopreviousmonitoringrounds–ifeither
(a)waterlevelislowerthanpreviouslowestmeasurementby>5mor
(b)threesubsequentmonitoringeventsrecordafallinwaterlevel>1mthenapotentialadverseimpacthasbeenidentified.
Y/N
Ifpotentiallyadverseimpactsidentifiedthen:
AdviseEnvironmentManager;
Reviewoperationalactivities;
Ifappropriatecommissionreviewofdata;
Identify any requirement for and implement changes in operation tomitigateadverseimpacts.
Checklist Reviewed by Name ‐
Date ‐

Draft Underground Water Impact Report ‐ ATP 564P 8‐22

Draft Underground Water Impact Report ‐ ATP 564P 8‐1
Appendix D ‐ Submissions Report for UWIR for
ATP 564P

Draft Underground Water Impact Report ‐ ATP 564P 8‐1
Appendix E ‐ Disclaimer and Limitations
ThisreporthasbeenpreparedbyCDMSmithAustraliaPtyLtd(CDMSmith)forthesolebenefitofHarcourtPetroleum]forthesolepurposeofprovidingadraftUndergroundWaterImpactReportforATP564PnearMourainCentralQueensland.
ThisreportshouldnotbeusedorrelieduponforanyotherpurposewithoutCDMSmith’spriorwrittenconsent.CDMSmith,noranyofficeroremployeeofCDMSmith,acceptsnoresponsibilityorliabilityinanywaywhatsoeverfortheuseorrelianceofthisreportforanypurposeotherthanthatforwhichithasbeenprepared.
ExceptwithCDMSmith’spriorwrittenconsent,thisreportmaynotbe:
(a) releasedtoanyotherparty,whetherinwholeorinpart(otherthantoHarcourtPetroleumN.L.’sofficers,employeesandadvisers);
(b) usedorrelieduponbyanyotherparty;or
(c) filedwithanyGovernmentalagencyorotherpersonorquotedorreferredtoinanypublicdocument.
CDM Smith, nor any officer or employee of CDM Smith, accepts no liability or responsibilitywhatsoeverfororinrespectofanyuseorrelianceuponthisreportbyanythirdparty.
TheinformationonwhichthisreportisbasedhasbeenprovidedbyHarcourtPetroleumN.L.andthirdparties.CDMSmith(includingitsofficerandemployee):
(a) hasrelieduponandpresumedtheaccuracyofthisinformation;
(b) has not verified the accuracy or reliability of this information (other than as expresslystatedinthisreport);
(c) hasnotmadeany independent investigationsorenquiries inrespectof thosemattersofwhichithasnoactualknowledgeatthetimeofgivingthisreporttoHarcourtPetroleumN.L.;and
(d) makesnowarrantyorguarantee,expressedorimplied,astotheaccuracyorreliabilityofthisinformation.
Inrecognitionofthe limitedusetobemadebyHarcourtPetroleumN.L.of thisreport,HarcourtPetroleumN.L. agrees that, to themaximumextent permittedby law, CDMSmith (including itsofficerandemployee)shallnotbeliableforanylosses,claims,costs,expenses,damages(whetherin statute, in contract or tort for negligence or otherwise) suffered or incurred by HarcourtPetroleumN.L. or any thirdpartyas a resultofor in connectionwith the information, findings,opinions,estimates,recommendationsandconclusionsprovidedinthecourseofthisreport.
Iffurtherinformationbecomesavailable,oradditionalassumptionsneedtobemade,CDMSmithreservesitsrighttoamendthisreport.