Embed Size (px)
Citation preview

UNITED NATIONS INDUSTRIAL DEVELOPMENT ORGANIZATION Vienna International Centre, P.O. Box 300, 1400 Vienna, Austria
Tel: (+43-1) 26026-0 · www.unido.org · [email protected]
OCCASION
This publication has been made available to the public on the occasion of the 50th
anniversary of the
United Nations Industrial Development Organisation.
DISCLAIMER
This document has been produced without formal United Nations editing. The designations
employed and the presentation of the material in this document do not imply the expression of any
opinion whatsoever on the part of the Secretariat of the United Nations Industrial Development
Organization (UNIDO) concerning the legal status of any country, territory, city or area or of its
authorities, or concerning the delimitation of its frontiers or boundaries, or its economic system or
degree of development. Designations such as “developed”, “industrialized” and “developing” are
intended for statistical convenience and do not necessarily express a judgment about the stage
reached by a particular country or area in the development process. Mention of firm names or
commercial products does not constitute an endorsement by UNIDO.
FAIR USE POLICY
Any part of this publication may be quoted and referenced for educational and research purposes
without additional permission from UNIDO. However, those who make use of quoting and
referencing this publication are requested to follow the Fair Use Policy of giving due credit to
UNIDO.
CONTACT
Please contact [email protected] for further information concerning UNIDO publications.
For more information about UNIDO, please visit us at www.unido.org

20363 --- --
HANDY MANUAL
TEXTILE INDUSTRY
Output of a Seminar on Energy Conservation in Textile Industry
Sponsored hy
l'nited Sations Industrial Development Organization (UNIDO)
and
'.\1inistry of International Trade and Industry ( MITI), .Japan
llosted /Jy
Ministry of Energy. Telecommunications and Post, \1alaysia
On~cmi:ed hy
Ministry of Mines and Energy. Indonesia
The Energy Conservation Center <ECC). Japan
1992 Malaysia Indonesia
Preface
The conservation of energy is an essential step we can all take towards overcoming
the mounting problems of the worldwide energy crisis and environmental degradation.
In panicular. developing countries are interested to increase their awareness on the
inefficient power generation and energy usage in their countries. Hl"'wever, usually only
limited infonnation sources on the rational use of energy are available.
The know-hov. on modem energy sa,.·ing and conservation technologies should,
ther:.!forc. be disseminated to governments and industrial managers. as well as to
engineers and opc:-ators at the plant level in developing countries. It is particularly
imponam that they ac4uire practical knowledge of the currently available energy
conservation technologies and techni4ues.
In December 1983. L1NIDO organized a Regional Meeting on Energy Consumprion
a.; well as an Expcn Group Meeting on Energy Conservation in small- and medium
'.'!Calc industries for Asian countries. During these meetings, it was brought out that, for
some energy intensive industries, o;avings up to 10'/C could be achieved through basic
housekeeping improvements. such as auditing and energy management.
The rational use of energy calls for a broad application of energy conservation
technologies in the various industrial sectors where energy is wasted. One of these
energy intensive industrial sectors to he considered w improve efficiency through the
introduction of modem energy conservation technologies is the te~tile industry.
In the textile indus:ry. appreciahlc amounts of energy could be saved or conserved hy
regulating the temperature in the steam pipes, adjusting the air/fuel ratio in the boilers.
and installing heat ex.changers using wann waste water.
Currently. VNIDO. with the financial suppon of the Japanese GMemment, is
carrying out a regional programme on the promotion and application of energy saving
technologies in selected Asian developing countries. This programme aims at adopting
these innovati\e energy conservation technologies. developed in Japan. to the conditions
of developing countries.
In this programme. v.e arc considering that the transfer of these technologies could
tx: achieved through:
lil Conducting .. urveys of energy usage and efficiency at the plant level;
Iii> Preparin)! manuals on energy managemcn: and energy conscrvarion/saving
technologies. hascd on the finding~ of the 11llovc survey;
(iii) Presenting and discussing che manuab ac seminars held for govemrnc:m officials.
represemacives of induscries. plam managers anll engineers:
Ii\') Disseminating the manuals to other developing coumries for their proper utilizacion
and application hy c~ industrial sector.
The experience ohtained chrough chis programme will he applied to ocher
programmcs/projcch \\ hich inHlln: n;her industrial -.eclOP> a-. wdl a-. ocher de\doping
countries and region-..
l''.\llX) has -.caned thi-. programme with che project l"S/R.-\S/911/075 -- Racional
L·se ot Energy Resoun:es in Steel and Textile lndu ... tr:· m \1alay ... 1a ;md Indone ... ia.
The pre ... ent Handy \1anual on Te\tik lmlu ... t~ wa' prl'.pared by l":\IDO. \\1th the
coopcrauon of e\perls from the Energy c,m,en at inn Center t ECC 1 of Japan. on enng;.
sa\ing technologie' in the framework of the ahme memioned l' ~!DO project. ll is
based on the re ... ults of the sun·ey ... c;trried out. the plant oh ... er\ation' anJ till'
recommendation... and sugge ... tion' emanating from the Seminars on Energ;.
Con-.ervation in the Steel and Tex tile lndu ... tries. held under the ... ame project i11 January
1992 in Jakana. lndone ... ia. and Kuala Lumpur. \1alay,ia. The manuai \\ill not only he imere..,ting for go\entmcm and repre,entative' from ir.du·ary. hut it i,. in panicular.
de ... igned for plant-leH:: engineers and opnator' in dcvdnping countrie.., a\ a help tn
impro\.l'. cnergy efficiency in the production pr1lCe"'·
Appreciation i-. expre"'ed for the \ aluahle co111rihutior1 made hy the follow in~
institutions to the -.ucces,ful preparation and puhlication of 1hc mant1al n .-.:ntioncd ahoH::
\tiru..,t~ of \tine-; and Encrg~ . lndonc-.1a
Ministl} of Ener~). T cicl.:ommunication-. and Po'\l'I. \1alay,ia
Mini'tr'Y of lmcmational Trade and lndu,1ry t \11TI 1. Japan
The Energy Conservation Center tECCl. Japan
June l1.KJ2
CONTENTS
I. Charncteristics of thr: Manual···---···--···-··-------·----·--·---··---···-----· -----·--·---·-·--------------- I
.., Char.i.cteristics of Energy Consumption ---·--···--·--------·---··-------·------·-·-----------------·-· I
2.1 Types of energy used in the textile indu'itry -·-·-----------··--·--------··· ·······---···-······ I
.., .., Production process and energy use for each spcciali7.ed tt."chnical field ............. 2
.., .., . -·-·' Fiber production··--··-··········-·---······-·---····-······-·--·-···-········-----··-···············- 3 .., , , Spinning ___ ............ --·---·· .... --···-----··--··- .... -·-· .... ·····-·---·--·····-·-····-·-----··-·.-··-- 4
2.2.3 Twisting ·······---······-··-·-···-······-··-···----···-·········-·····-·······-··············-····----·-·· 4
2.2A Textured-yam production ....... ·-···--·-----···--···--··-·--·---···········-·-·················· 5
2.2.5 \\"caving ···················-································-··················· ........................ 5
2.2.6 Knitting .................................................................................................. 6
2.2.1 Dyeing and finishing ............................................................................... 6
2.2.~ CIClthing manufacturing ......................................................................... 11
3. Promotion of Energy Conscrvation Technologies ............................................... 12
3.1 Energy cono;crvation management technologies. ............................................. 12
·'·I.I Organi1ational rati•lnali1ation .......................................... 12
_,_I .2 Improving efficiency of electricity use .................................................. 12
3.1.3 Improvements in efficient fuel use ........................................................ 13
.1.1.4 Improvement in efficient use of steam ................................................... 1-t
3.1.5 Utilization of heat exchanger ................................................................. 15
.l 1.6 Mea'.'luring in'.'ltn11nents and automatic control ...................................... 15
3.2 Energy use and rational use of energy in process-specific technologies .......... 15
3.2. I Fi her pnxluction .................................................................................... 16
3.2.2 Spinning ............................................................................................... 17
'·2 "\ Tcxturcd-yamproduction ............................................................... IX
_,_2.-t Weaving ............................................................................................... 19
3.2.5 Knitting ................................................................................................. 20
3.2.6 Dyeing and finishing ............................................................................ 20
:l2.7 Clothing manufacturing ........................................................................ 35
-i-

4. Actual Conditions of the Textile Industry in Japan ............................................. 35
5. Structures of Textile Markets ............................................................................... 42
5.1 Basic clothing .................................................................................................. 42
5.2 Fashion clothing .............................................................................................. 44
5.3 World's total textile demand and production ba-;e distribution ........................ 45
5.4 Characteristics of texlile market... .................................................................... 4 7
6. Conclusions ......................................................................................................... 51
-· Ii ··

1. Characteristics of the l,anual
In order to promote energy conservation in the textile industry. this manual analyzes
in detail the actual conditions of energy consumption in each field. Thus. it has been
compiled to serve as reference material for the practical application of these techniques
which are always kept available for the engineers. A step-by-step description is included
as to how to implement the energy conservation measures. specifically in the area of the
dyeing and finishing process. wh!.!re many small- to medium-sized companies are
operating. We strong!~ hope that 1his manual will he used as a guide to promote energy
nm~rvation in 1he tcxule industry and to rationalize the management.
2. Characteristics of Energy Consumption
2.1 Types of energy used in the textile industry In general. energy in the textile i11dus1ry is mostly used in the forms of: electricity. as
a common power source for machinery. cooling and temperature control systems.
lighting. office equipment. etc.: oil as a fuel for hoilcrs which generate steam: liquified
pctrokum ga~: c11al: and city gas. Tabk I compare~ the enc;gy consumption shares of
various specialized technical fields and it can he seen that energy consumption is
relatively high in the fields of dyeing and finishing. fiher production. spinning. weaving
and clothing manufacturing. Table 2 summarizes recent trends in the use of various
energy sources in rhe fiber production and dyeing and finishing divisions of the textile
industry. when.• the energy consumption ratio i~ relatively high.

Table 1 Energy Consumption Share of Each Specialized Technical Field in the Japan~se Textile Industry
Lnit: million Yen ~----- ---------·---- ------- ------ --- ------- ~--
Total Share l Specialized Technical Field Fuel Electricity I ; Fiber production 32551 21.498 54.049 21.0<;~
! Spinnino 3.224 ..J4.2n2 .nA80 i8.4 . ~
Twi'lting 219 1.660 1.879 n.:
Textured-yam production L:'.O 1.5-B 1.663 0.6
Weaving 4Atl7 24.848 2Q.315 11.4
Kniuing 4.1)59 11.709 15.85X 6.1
Dyeing -'7 .titi I 2XA12 tin.073 2:".11
Clo1hing manufac1unng X.240 15.420 23.tinO ll.2
Others 5.Q59 i..CJ)()() 17.95Q 7.0
Tora! %500 16 l...J4:! 257.942 :oo.o
"01e: Cakula1cJ from the Tabula1ed lndus1rial S1ali\liC'i llndu,1r~ Volunwt
Table 2 Types of Energy Sources Used in the Textile Industry
---r:::h .,,._,; t;'°i'1
~--
('.[~
,ii,c,. ft11.1i
.;o'm~ 11d'l\. .... 1i1
l.1~~,l~-h;t.'.'l Ot! hu:! c>i: Yue! 01: Pct~,,: .. -um~ < ,l.a,i a1 .\ ·K;· H ti\.: l. l\.J1 Ci.a.,q1
~ Go<
F-t .... ..i I fkidr~1.1t" Kcrn'4:n(' O:!
'~.&:" : 101
K\\h1 t;:· 1\:1
-~,h \.)4 ~".""NI l.lltl- '.0 '; -,; -~
.. ,~, :;~~-")ii: 'i.""' ... :'i~:i. lJ~~.!.1r'".1 --~-': :1
·.'~" ~)4S .... \~ ~_-1,,,
.,,.,.} lJIH •. lifl~ ' ...... : -~-~ ---~~___:.. .... _ .. ~~~ - __ '_._.__'._"'_:_\~~~~~~ -~ 9"'" ~~ ~ ·"'"~ ~ i.2~11 :tll -.._ i ':".'1·12 '~.tt""1' ·' - u.:-:-.i :11l '""~ . -
;lo\M .. : '1'1 2-l: " "'' M,, ; '. .•M'ltl '1111>. 17' "! ... _,) ... ~ ~11.f~I I' ~ '' ,, '.:,:. lhX
''I"\~ i.'ll.',11(,q .:1.:-;-•j "'" : 1. \~'\ 7'<. 111 •1< .t.N 1"'.l'Wh 1; .'~o: : ~.h:P.~ 1 J1'\ 1).,. ,,,,
9)W i ! . hf'.,:NJ -· 1711 r'! 11150- .. OX.'h2 104,i.:" , . . <xn t"i.!l! ;2::1Wl.t:\O
;')1141 ! i.N".l~- ~o. ~n~ hil .tu~ l17M.942 '.1,1.!MI l.:.x1·; .i; l.2''' 1.:. '~·1,'11 f •
-.;ote: falrulatc:d from the: .-\nnu.11 Rc:porr on Textile Sta11,tu.:s. Dyeing reprc:,c:nl' the dyeinj! pr<11:e" mi:ludmg fin1'hing. for Oc>th .... oven Jnd knitted materials.
2.2 Production process and energy use for each specialized technical field
The major operations and i.;ourcc' 1lf energy use involved in the production process
or each speciali1.cd technical field. a~ a necessaf)' i:omponenl of the over.ill production of
apparel goods. a'i illustrated in Fi~urc .~I. arc 'ichema11ca!ly 'ummari1cd a-; follows:
2
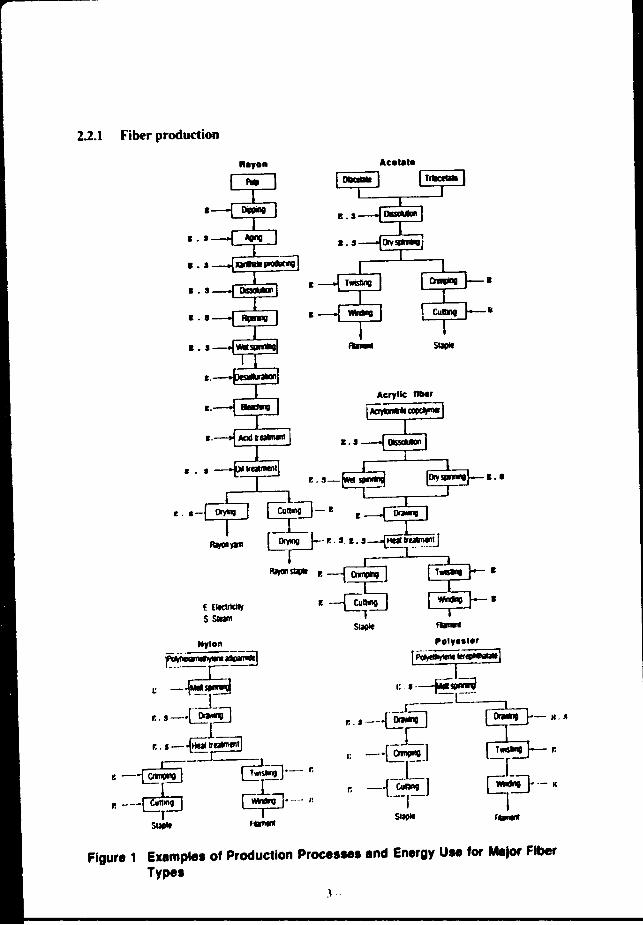
2.2.1 Fiber produdion
R•yon
I. S
I• S
I• S
••• I• S
I.
1.
I . I
I. 1- Orytng
Acot•t• TrllCetlll
I.SI
'·'
I I
I Ill
~ 5-
P..S- Illy Sllft1llO I . I
PolyHt•r
r Potyelllylllll •__. J
-'~ 1; .•• _bii ...... -r-:_l_
rn;;S-r..' --"'\._llla!!_J
1: --~] M.~
r:
r]=] r: -1.7-
r ~-·-K
Figure 1 Examples of Production Processes and Energy Use for Malor Fiber Types

2.2.2 Spinning
£
l --i-
E El<ectroory
B
TWO folded yam
Figure 2 Example of Typical Spinning Processes and Energy Use
2.2.3 Twistin~
E Electncttv
Figure 3 Twisting Proceu and Energy UM
4
-E

2.2.4 Textured-yam produdion
2.2.5
E
E.S
E
F.
E.(s)---~ '---~---'
E
Figure 4 Textured-yam Production Process and Energy Use
Weaving Warp s
Aewidng SizinO
-F.
a------------4"1
E
E.S
E
Weft
Rewildir1J
Pimwindi1g
E: Eleclric11y S. Steam
Figure 5 Weaving Processes and Energy Use
- 5
E
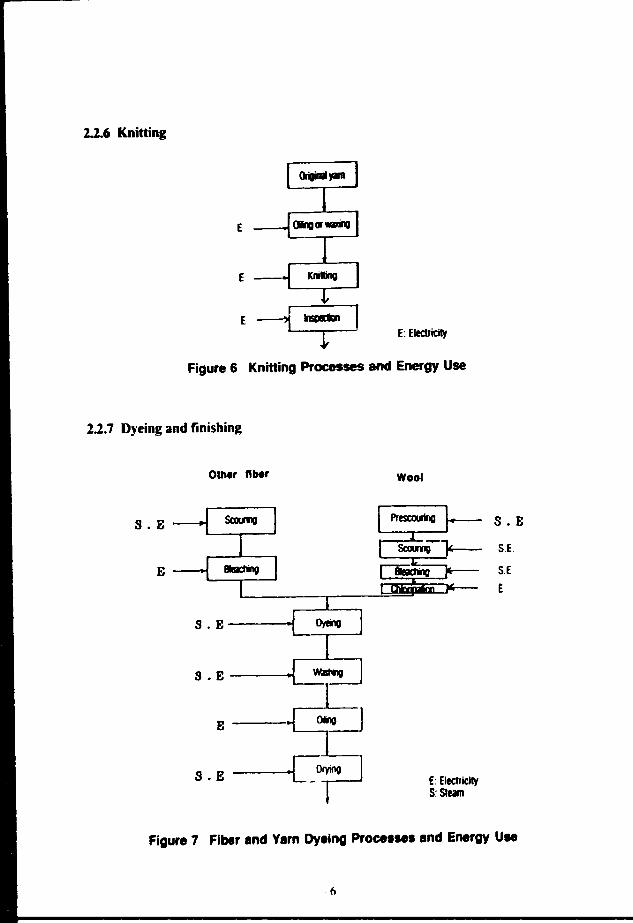
2.2.6 Knitting
E:Eledricity
Figure 6 Knitting Processes and Energy Use
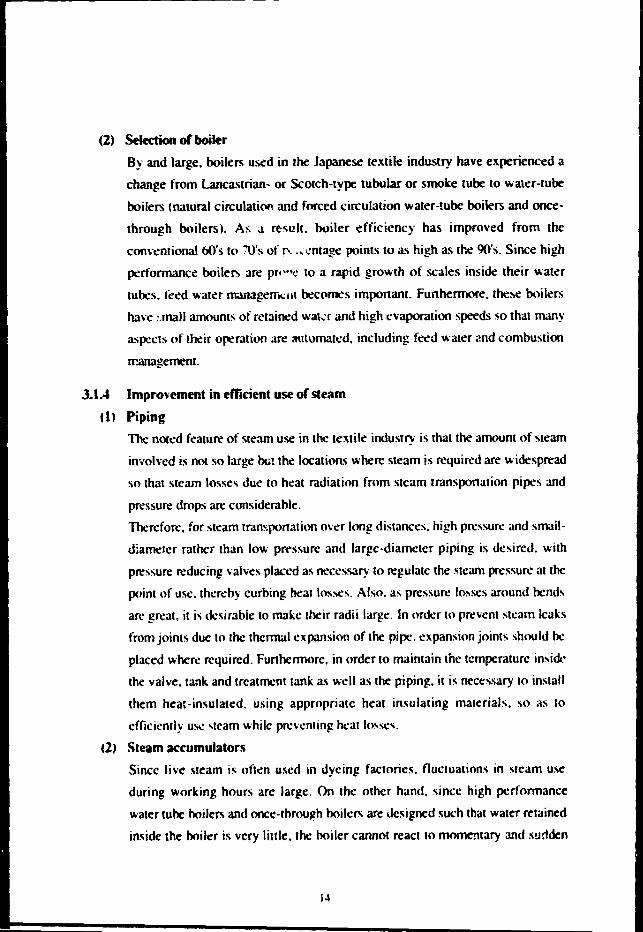
2.2.7 Dyeing and finishing
Olher ftHr
S.E
E
S.E
S.E
E
S.E
w.istq
~
Wool
S.E c-~~,, """"'""' ,_-- S.E.
E: Electrlclty S:Steam
S.E
E
Figure 7 Fiber end Yarn Dyeing Procetses and Energy Use
·6

Worsted febrlc
•: ~
1-:
E • (i
•> S
E·S
•:- s
E•S
E
E
£
E·S
•:· s
E·S
•:-s
E
l::•S
Wooten lebrlc
lnSpdln
E: Electricity S Steam G Gas
Figure 8 Typical Dyeing Processes and Energy Use tor Woolen Fabric
7

r; . 0
p;.a
p:. u
E·C
r; . r.
E-S
£.s
r;.o
light I mldlum sllade
(Continuous dyeing)
E
0
E·S
p;.s
E
E
Dari! sllade
(Batch dyeing l
Jn case of dark Shade
r;.s
Pitntlng
(Dyes) (Pigments)
E Electricity S Steam G Gas
Figure 9 Typical Dyeing Processes and Energy Use for Cotton Fabric
- K -

(Bleached finishing)
LIOhl & medium shade
(Continuous dyeing)
E
E
0
F. .:J
r;. s ~orrzmo
E~ E 7C$=]
Dalll sbade
(Balcb dyelnol
--. ....... E·9
(Dyes) (Pifments)
E. Eleclricily S Sleam G.Gas
Figure 1 o Typical Dyeing Processes and Energy Use tor Polyester & Cotton Blend Fabric
9

E
E.S.G -tlGreyfDtcsellinO~-------- Se1sQ ~ E I I
L------------
I
.---_,_---.CV~ finishing) Es --+ Presenmo •-~~
(Ball dyeinQ) (t'.onhous d'tei!Dl (PnnfinO)
ES.
E.S._, WBq
E: Electricity S:Slum G:Ga
E
E.S.
E.S. (G) "---.---'
- E.S
E.S.
E.S.
E.S.
E.S.
E.S.
E.S. I I
E.S. I I I
I I I I I I
E
ES.
E.S.
ES
ES
ES.
Figure 11 TypiC81 Dyeing Processes and Energy Use for Polyester TexturedYam Fabric

E
f
!Mdl
ES
Figure 12 Dyeing Processes and Energy Use for Nylon Tricot
2.2.8 Clothing manufacturing
Figure 13 Sewing Proce .... and Energy Use
··II-·

3. Promotion of Energy Conservation Technologies
While the significance of elk!rgy conservation awareness is rdatively easily·
understood at home. when a program is introduced into a factory to promOle it. its
thorough implememation tend" to he delayed at an early stage. Therefore. for its actual
cour.;e of implelllc!ntatton. it is desired to de\·ise company-\\ ide coordinated mca.o;ure'
similar to QC activities at factories. Also. in order to promote energy saving mea'>ures
efficiently. it is found to be effective to separately consider general management
tcxhniques for .. r.uional use of energy .. and process-specific techniques to be de\·eloped
in each 'pccialized technical fidd.
3.1 Energy conservation management technologies
3.1.1 Organizational rationalization
Since energy management is relevant 10 a wide r • .mge of Jepartmenh wi1hin a
company. it is necessary 10 enhance 1he awarenes... impron: 1he knowledge and
obtain 1hc partitipalion and cooperation nf neryhody inrnh·ed in the production
process. Therefore. while it is nece-;,ary for engineer; and 1echniciam. wi1h specialized
technical kr.ow ledge to :1lay a central rok in energy conservation effort-;. 1he
implememation of an energy cnn,ervatien program ihelf 'hnuhl not he left to a
handful of specialish or spcciali:t.ed o;cctions. Rather. it i' dc,:rahk to addres' the ta1'l
company-wide. for e:w.amplc hy .. ening up ;m 'Energy '.\1anagemcn1 Committee·.
3.1.2 lmpro,·ing efraciency of electricity u.w
(I) Ughting
Due to its nature of operations. the share of lighting in elcctricily u~e i' relatively
high. After the \Witch from tung .. tcn hulth tn fluore,cent lamps achieved
con,iderahle electricity 'iaving'i. clectru.:ity- .. aving fluorescent lamp' have hccn
developed and markc1ed for funher imprme~nt,_ includinµ tho'l' l·apahk of
reducing electricity use hy scvl~ral pcn:ent for the 'arn: lc\'cl of illumination.
In ~cnc:r.il. the cffectivenc'' of illumination i' influenced hy vari1m' factor,, 'uch
as the intcn.;i1y of light 'oun:e. the reflection coefficient and 'hapc of 1he
rcfkccivc filling I lamp shade 1. the layout of thl room to he illuminated. interior
finish. color and the distance from the light .. ourcc. "Jllcrcforc. it ., imponant to
12

re-e,amine ~hether the light source is utilized in the most efficient wa~ and take
del.'1ricit~ sa\•ing llll'asures. if necessary. such as reducing the number of lamps
in uSc: by switching from global lighting to local lighting as much as possible_
C2> Electric motor
The textile industry uses a vast number of relatively small electric motors.
~otably. while a conventional machine was driven by a single motor with the
generated mechanical power transmitted to various parts of lhe machine in a
collc:criw manner. many modem machines utilize multiple ;ll()(ors with a comrol
board l.·omrolling the movemem of each motor. which is directly coupled to a
nwchine pan 10 driw u independently from others. This is also a rationalized
kature in tenns of energy saving. However. regarding the selection of each
motor. emphasis has ~n placed on mechanical performance. resulting in a
motor with an excessive capacity. This leaves considerable room for re
C\amination from a energy conservation point of view.
f31 Electric heating
In the textile industl}. electric heating ha'i largely been replaced by other melhods
l'iteam. gas heating. or direct or indirect fired heating) for some time in order to
a'"·hieve cost reductions. Howe\·er. since electric heating only requires a small
initiai investmcnr as a result of convenience and simplicity in equipment
corhlruction. it is still us-:d for small capacity local heating purposes. "Therefore,
it " desirable 10 conduc1 a compararive investigation into alternative heating
mctho<h. such as far-infrared radiation heating, high frequency dielectric heating
and microwave heating.
3.1.3 Improvement~ in dTacient fuel u.w
' • , Selection or fuel As i, described hcforc. fuels utilized in the teittilc industry ha·1e already gone
1hrou~h a '"'itch-mer from coal to oi!. More recently. efficient cocr~y U\C i'
under inve,tiga1ion. including the revival of coal on the way 10 a funher move
from oil to liquefied and city gases. while reflcctin~ various fuel prices. Ir.
,c1ec1ing fuels, thn\C wi1h good fltoc gas charactcris1ics in addition to high
calorific .. ·alu.: and case of comhustion arc desired. so thaf air pollution can he
prevented as much as po!.~ihlc.
J.\
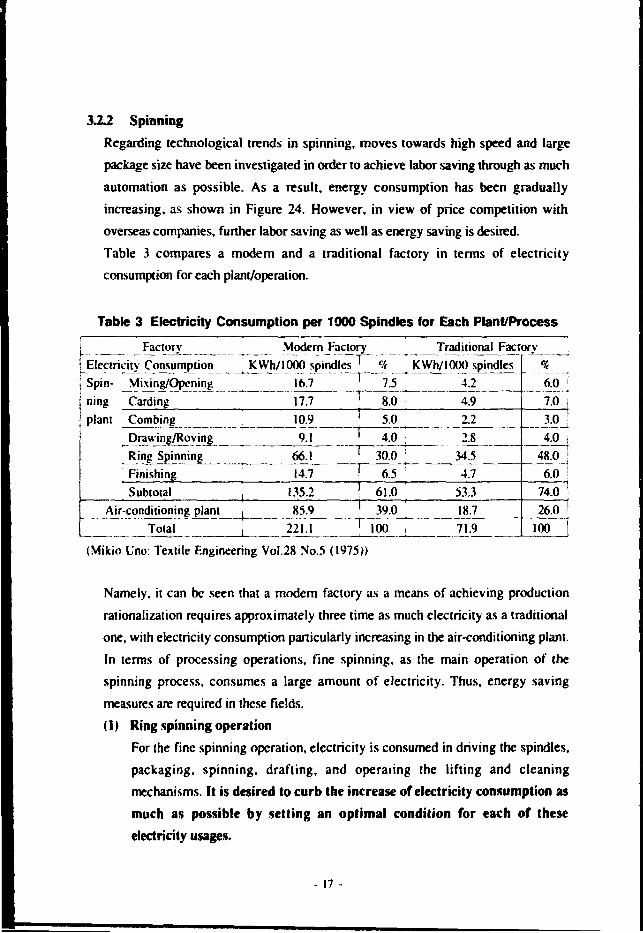
(2) Selection or boiler
By and large. boilers used in the Japanese textile industry have experienced a
change from Lancastrian- or Scotch-type tubular or smoke tube to waler-rube
boilers (natural circulatioo and forced circulation water-tube boilers and once
through boilers). As a result. boiler efficiency has improved from the
conventional 60's to W's of rx • ..:-:ntage points to a'> high as the 90's. Since high
performance boile~ are pr.-0 c to a rapid growth of scales inside their water
tubes. leed water managem\.:111 beco~s imponam. Funhennore. these boilers
ha\·e ::mall amounts of retained wat-:r and high evaporation speeds so that many
aspects of their operation are 3\ttumared, including feed water and combustion
IT'.anagement.
J.1.4 Improvement in efficient use of steam
ti) Piping
Thc noted feature of steam use in the textile industry is that the amount of steam
imoh·ed is not so large bt;t the locations where steam is required are widespread
so that steam lossel\ due 10 heat radiation from steam transportation pipes and
pressure drops are considerable.
Therefore. for steam lrdn~.ponation owr long distances. high pressure and small
diamc1er rather than low prt"ssure and large-diameter piping is desired. wirh
pressure reducing valves placed as necessary to regulate the steam pressure at the
puint of use. thereh)· curbing heal losses. Also. as pressure lo,scs around bends
arc great, it is desirable to make rheir radii large. In order to prevent :-team leaks
from joints due to the thcnnal expansion of the pipe. expansion joints should he
placed where required. Funhennore, in order to maintain the temperature insidt.·
the valve. tank and treatment tank as well as the piping. it is necessary to install
them heat-insulated. using appropriate heat insulating materials. so as to
efficiently use 'ileam while pn:vcnting heat losse'i.
tl> Sleam accumulators
Since live steam is often used in dyeing factories. fluctuations in steam ui;e
during working hours are large. On the other hand. since high pcrfonnance
water rube boilers and oncc-rhrou~h boiler. arc Jcsigncd such that water retained
inside the boiler is very liule. the boiler cannot react to momentary and S!.Hldcn
14

load changes. while responding to automatically controlled slow load changes is
not a problem. In such a c.i.se. a steam accumulator can be installed midway
through the heat transponing piP'!. between the boiler and the heat consuming
load. in order to store e'lcess steam when the load is light by transforming it to
heated water. This then transfonns the heated water back to steam when the load
j, heavy in order to reinforce supply to the load. This allows the boiler to
cominuously opemte with the a\·er.ige load ;:.r:d is quite advantageous in view of
energy saving.
131 Rec~ding of drain So far. afti.:r its heat energy is consumed. steam has hccn dr.iined off. However.
in \ icw of energy saving. it is necessary to collect and recycle the heat energy
crnicd hy the drJin water.
3.1.S Uili1.ation of heat exchanger
In each prodm:tion process of !he te'ltilc industry. the heating an<l cooling of gases and
li4uids a' media of heat arc frequently required. This is done through heat c'lchange
h.:twecn diffcn.:m tluid,. and in order to avoid contamination or chemical reaction due
to their dm:cl contact. heal nchangcr' ;ire: mi:d to c;1rry out indirecl heating and
cool in)!. It j, imponant to usc !he right heat c'lchangcr for the intended purpose.
3.1.6 \leasuring instruments and automatic' control
Encrg~ ,a, ing i' an opcrati'ln to gra'p the actual 'ituation of energy u'e in a factory
prcci,c:ly and 4uantitativcly and to <.·arry nu! improwmcnt mca,urcs in order to
rationali1c ;md cconomi1c on ii. While mea,uring ins1rurncnts arc needed to ohtain
quantitativl.' data. i[ \\tll hccomc more and more imponant to investigate the use of
,ophi\ticatcd mca,uring in,trum~nts hascd on recent developments in mechanical and
electronic cn)!tnci:rin)!. comhined \\ith automatic control o;ystcms.
3.2 Energy use and rational use of energy in process-specific technologies
Pro~re,, in production ra1i11nali1a11on ''achieved through rhe irnplefll(.'ntarion of a
comprdwn,1\e ,er of measure,. including energy conservarion technolngic' as the
I~

centerpiece measure. along with time management. labor saving. natural resources
saving and space saving. !t has been frequently pointed out that. along with management
techniques described earlier. the improvement and development of process-specific
techniques on energy conservation greatly contribute to the rationalization of production.
Here. process-specific techniques relating to energy saving a1e summarized for each
specialized technical field.
3.2.1 Fiber production
Exhibiting relative!~ large-scale structural fonns in chc textik industry. this division
has already reached a high levd of production rJtionalization. as seen from Figure 24:
as is well known. it is tc1.:hnologically aiming at diversification into such high valuc
added goods as super extra-finc fiber and inorganic furctio11al fiber. commonly
refcrrei.l to as .~hi11gose11. In particular. the following techniques rdatc 10 energy
saving:
(I> Raw material production prncess
Implementation of energy saving through improvements in the process and
reaction conditions
12> Polymerization proces.'i
Reduction in polymerization time hy mcars of high efficiency cata!yst:-..
polymerization method:-.. etc.
13) Spinning process
Promotion of energy :-.avin~ 1hrough 1:ombining the POY I Pre-oriented Yam:
Yarn wi1h some ~tahility Y.ith its molcrulc:-. partially having gone through
ori.:ntation1 and DTY I Draw Texrur;:d Yam: false twisted yarn produced
while drawing PO\' yarn) method~ and an expanded use in multi-folded
spinning yarn.
(4) Sewly huilr factories
The fa1.:toric' huilt during thl" high )!rm~ 1h period ha\l" large margin' and
allowances for production increase 'o that high ""'cs would rc,ult if productic1n
decreased. Therefore. suitahly -;izcd factoric' should he cono;tructcd.
16
-- -- - ---------------------------.
3.2.2 Spinning
Regarding technological trends in spinning, moves towards high speed and large
package size have been investigated in order to achieve labor saving through as much
automation as possible. As a result, energy consumption has been gradually
increasing. as shown in Figure 24. However. in view of price competition with
overseas companies, further labor saving as well as energy saving is desired.
Table 3 compares a modem and a 1raditional fac1ory in terms of electricity
consumption for each planl/operation.
Table 3 Electricity Consumption per 1000 Spindles for Each Plant/Process
L _____ Fac~ory ____________ -~~f!lY~c!?ry ________ !!~i!ional F~~ory ___ _.
[__El~~rri~il)~ ~~ns':l!l!P~i_o_I! __ ~KW_JJJl_~ _ _s_ein_~l~~~-~--K\Vh/lf)OO spindles1-~ -~. i Spin- ~foing/Opening 16.7 7.5 4.2 6.0 : ' --- - ------ - ---------- ------··-· 1------·----- -----
1
, ning Carding 17.7 8.0 4.9 7.0 i planr Combing I0.9 1 5.0 2.2 3.0 !
I --- ----------- ------- -· ---,------ - - ------~-------' Drawing/Roving 9.1 4.0 , 2.8 4.0 i -Ri~g-Spinni~g--~----66.-1---·--r-30.0 1 - 345-- 48.0 i -- -------------- -- -,---~----------~----1
Finishing 14.7 . 6.5 4.7 6.0 :
Subrocal 1 135.2 I 61.0 53.3 74.0 ! ~ _ -~--~011~itioning..£!_~~1-~--- . _ 8~.~-- __ +_19_.Q _______ J_8_:l_ _ --~~~ ~. ______ Jota~ ____ ___L_ ___ ~~--~~--.J___ ____ 71.~ IOO_J
(Mikio t:no: Textile Engineering Vol.28 No.5 ( 1975))
Namely, it can be seen that a modem factory as a means of achieving production
rationalization requires approximately three time as much eleclricity as a traditional
one, with electricity consumption panicularly increa-.ing in lhe air-conditioning plant.
In tenns of processing operations, fine spinning, as the main operation of the
spinning process, consumes a large amount of electricity. Thus, energy saving
measures are required in these fields.
(I) Ring spinning operation
For the fine spinning operation, eleclricity is consumed in driving the spindles,
packaging. spinning, drafting, and operaiing rhe lifting and cleaning
mechanisms. It is desired to curb the increase of electricity consumption as
much as possible by setting an optimal condition for each of these
electricity usages.
- 17 -
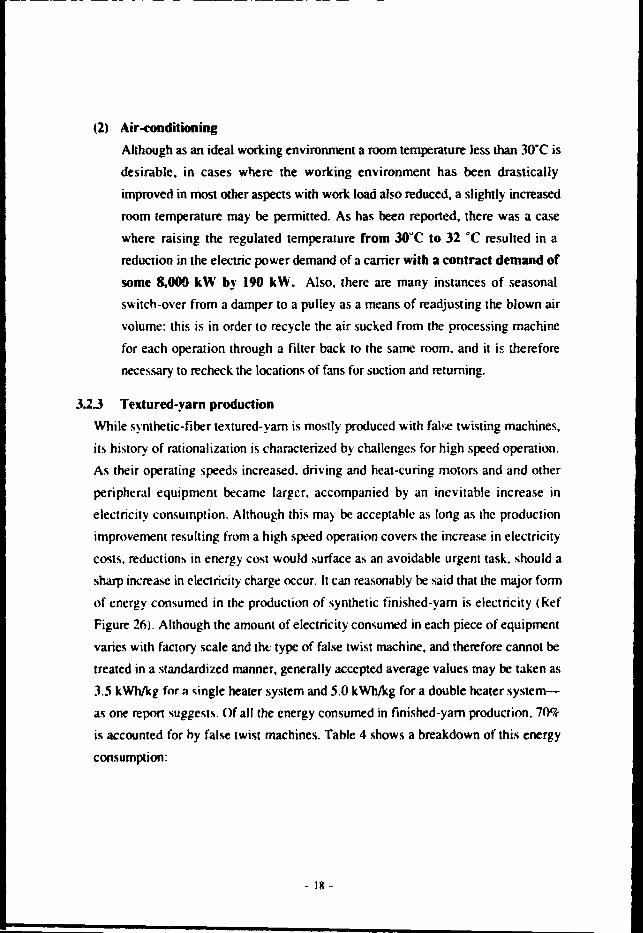
(2) Air-conditioning
Allhough as an ideal working environment a room temperature less than 30"C is
desirable. in cases where the working environment has been drastically
improved in most other aspects with work load also reduced, a slightly increased
room temperature may be permitted. As has been reported, there was a case
where raising the regulated temperature from J0°C to 32 °C resulted in a
reduction in the electric power demand of a carrier with a contract demand of
some 8.000 kW by 190 kW. Also. there are many instances of seasonal
switch-over from a damper to a pulley as a means of readjusting the blown air
volume: this is in order to recycle the air sucked from the processing machine
for each operation through a filter back to the same room. and it is therefore
necessary to recheck the locations of fans for suction and returning.
3.2.3 Textured.yarn production
While synthetic-fiber textured-yam is mostly produced with false twisting machines,
its history of ralionalization is characterized by challenges for high speed operation.
As their operating speeds increased. driving and heat-curing motors and and other
peripheral equipment became larger. accompanied by an inevitable increase in
electricity consumption. Although this may be acceptable as long as the production
improvement resulting from a high speed operation covers the increase in electricity
costs. reductions in energy cost would surface as an avoidable urgent task. should a
sharp incrcao;e in electricicy charge occur. It can reasonably be said that the major form
of energy consumed in che production of synthetic finished-yam is electricity (Ref
Figure 26). Although the amount of electricity cono;umed in each piece of equipment
varies with factory scale and tht: type of false twist machine, and therefore cannot be
treated in a standardized manner, generally accepted average values may be taken as
3.5 kWh/kg for :1 o;ingle heater system and 5.0 kWh/kg for a double heater system
as one repon suggests. Of all rhe energy consumed in finished-yam production. 70~
is accounted for by false twist machines. Table 4 shows a breakdown of this energy
consumption:
- Ill -
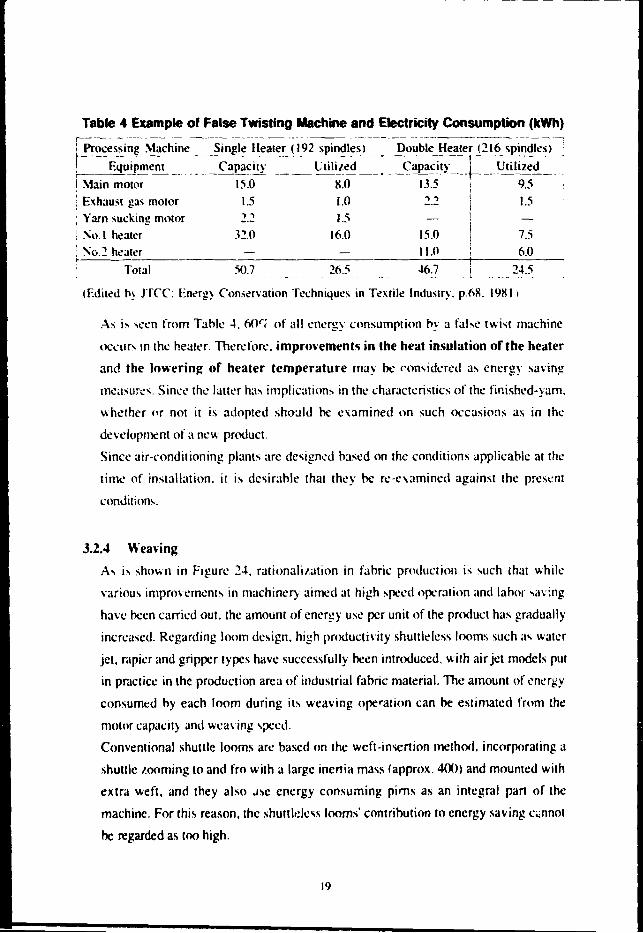
Table 4 Example of False Twisting Machine and Electricity Consumption (kWh) ,----~------------ ---------------- - - -- ---------~------l_!!~ce~~'!!_ \1ac_~i!'c: __ ~init~_Hea1c:r (192 spind~~l ___ ~ou~le H~rer ~216 sp~'!<!!e~-! Equipmeni _ Capacity t.:lilized Capaciry I U1ilized r-----------~- -- .. - ----------------- ----------+---------· I \fain motor 15.0 8.0 13.5 1 9.5 , . ! \ E1'haus1 gas motor 1.5 1.0 , , I 1.5 · Yam sucking mo1or "') "') 15 I -
! :\l). l hearer 3:!.0 16.0 15.0 7.5
'. '.'\o.2 healer 11.0 6.0
To1al 50.7 26.5 .J6.7 2-t.5
<Edited fl~ JTCC: Ent.'rg.y Conservation Techniques in Tex1ile lmtus1ry. p.68. 19811
. ..\ ... is 'een from Tahk ~- 6<l"( of all energy consumption hy a fahe twisr machine
O<.'l:ur' m the hearer Therefore. improvements in the heat insulation of the heater
and the lowerin~ of heater temperature ma_y he ronsidcrcd a<> energy savin~
measure,_ Since the lath:r has implication, in the characteristics of the finisht•d-yam.
whether or not it is adopted sho:.ild he examined on such occasions as in 1he
development of a new product.
Since air-rnnditioning plants arc designed h:.ised on the conditions applicable at the
time of installation. ir is dcsirahle thai they he rc-e,amined against the present
conJi1iom ..
3.2.4 Weaving
A' j, shown in Figure :!..J, rationali1.ation in fahric produclion is such 1ha1 Y.hile
\'arious improvements in machinery aimed at high 'peed operation and lahor -.aving
have hecn carried out the amoum of energy use per unit of the product has gradually
incrca:\c<l. Regarding loom design, high productivi1y shuttlelcss looms such "' water
jet. rapier and gripper types have successfully hecn introduced. with air jct models put
in practice in the production area of industrial fahric material. The amount of enagy
consumed hy each loom during its weaving operation can be estimated from the
motor capacity and wca\ ing \peed.
Conventional shuttle looms arc based on the weft-insertion mcthcxl, incorporating a
shuttle 1.0oming to and fro with a large inertia mass <approx. 40()) and mounted with
extra weft, and they also Jse energy consuming pirns as an integral part of the
machine. For this reason. the shuttlt!lc.;s looms' contrihution 10 energy saving c<;nnot
he regarded as too high.
19

On the other hand. as a large amount of energy is consumeJ in sizing. as one of the
preparatory operations for wea\·ing. the introdudion of foam and solvent sizing
operations are being imestigated. Furthermore. long fiber fabrics using
nonsizing filaments have been developed. eliminating the sizing process altogether.
In a reported e.\ample. the introdudion of a ne"· heat exchanger into a sizing
machine with a very poor sealing capability achiend more than 40'l- of energy
saving.
3.2.5 Knitting
As is shown in Tahk 13. the share of energy cost in the total cost of production is not
necessarily high for the knitting process. Howe\·er. of the main production facilities
for this process. knitting machines have also been undergoing a shift 1owards high
speed and large ,~apacity and fine gauge features; the current industry trend is for high
added-value £oods and multi-line. small-volume production hased on advanced
systems su.:h as compuler-controlled pattern making mechanisms. Therdnre. a
potential 1endency for inc .:a~d energy consumption should he 1akcn into account. As
a resul1. it is desirable to conduct a comprehensin re-examination of the
production schedule along with the implementation of actual energy
consenation measures in order to reduce or restrain the share of energy cost in
the total production cost.
3.2.6 Dyeing and finishing
It is very important to ad,·ance energy CC)nservation in the dyeing and finishing
field, which has a high energy consumption share in tenns of both the amounts of
money and energy used. a-; shown in Table I and Figure 24.
As is illus1rated in Figures 7 to 12, the dyeing and finishing proce'' consists of many
interwoven unit operations, and it is well known that the process gcnenlly goes
throu~h repeated wet and dry operations. The heat halancc nf a unit operation can
mainly be considered as the difference between the total supplied heat on the one hand
and the sum of the heat required by the system and various forms of heat losses on
the other. Figure 14 graphically summarizes the major factors in a thorough
implementation of energy savings. Figure 15 shows an example of heat balance in a
continuous water cleansing machine.
. 20

tjC. Ymin
Suppled heat f\i ..,-,_(E_1ec1r_-"_· F_ue1_°"_.Gas_· ·_T_.· - ~ Xm ~=
{ :::. } ElinillilbOll
+ ~ ~1 carnet! by fibef
{
Heaf radiation from machilery ~ Of waste
l+ ~ 11 enl!IU'i s m111 balll mo 1 P conversion elliaenty
..... { Heat rellllned by system } before processing ~ c:ontnuabOn Heat radiation from o;ystem alter processmo Resi<kJal neat 11 svsen ~ll:lue.d use
of!>altl • Heat recover/ from waste
Figure 14 Heat Balance in Unit Operation (Kazuo Sh1ozawa: Textile Wet Processing Technology. p.118 Ch1jin Shokan. 1991)
Heat energy 3.50 ---------
0.05 Eleclnc energy
Fnction 3.0 Diseharge
Figure 15 Example of Energy Balance in Typical Continued Washing Machine (E P Dempsey & C.E Velhngs. Heat Transfer Printing p 46. lnrerpr1nt 1975)
21

This clearly illustrates the importance of the development and utilization of process
specif:c techniques, apart from the already-described management technologies.
Table 5 shows that the implementation of production rationalization eventua!ly relates
to energy .:..., ,servation. 'The following are brid explanations of typical examples.
Tatle 5 Relationship between Production Rationalization Techniques and Energy Savings
f:r~~~!~~·-- ---~~~:an~=---- _ -- _ -~""' ~- J Time saving (I ) High "peed processing of unit operation,; Reductions in energy use I
( 2) Reduction in waiting time between unit per unit operation through i operations an improvement in i
__________ J}_)_Elimina~<:>~ _o_r_~~~~~ of~l)i_t__~~-tions_ ~odu~t~~it~- ____ _ _ _ _ ~ Labor saving ( I) Implementation of automation Reductions in the I
(2) Strengthening colorimetric management frequency of reprocessing I through a reduction in the : failure rate I
--- -------------- ------· ------------- 1 Energy saving I I ) Reduction in bath ratio Reductions in energy cost )1
(2) Reduction in treatment time I 3) Reduction in margin of tempt!raturc rise ( 4) Re-examination of drying method
_________ (5!_S~itc_i!_to_non-~ater_-ba~ed_o_pe_!<t_l!o11s ________________ _ Conservation (I) L.:tilization of continuous bath l.Itilization of system's of natural residual heat resources Space saving (I) Construction of modem factories Improvements in factory-
- _. ~i_de ene_rgx savin11 ~!fee~
(I) High speed processing of unit operations
As the proces~ing machines become faster they also become larger. This means
the energy consumption per unit length of time will increase, but generally it will
accompany a reduction in energy consumption for the treatment of a unit amount
of fabric. Table 6 shows an example of this situation. Therefore, it follows that,
as long as the product turnout is maintained, continuoaJs pr0<:es.4ling with a
large machine will be more efl'ective in achieving ener~y conservation •
. 22

Table 6 length of Mercerizing Machine and Productivity and Energy Consumption
~~~~I~~~~~----- -%----~ ;,: :~ ---
[_i::rrati11_~ti~~-~:ec~ll1~! ______ -----1--~--5--~--~--~-~>!__5 ___ : [ Pmducl I hour 10pera1ion rate um I I 2AOO .l.600 .J.!100 ! i ' rurnout X hou."li tOperation rare 115':<) i 19.200 I 16.301)) 2!Ulfl0 12.J.5001 j -~8.-lOO t 32.6001
! tml 16 hours t()peration ra1e QITT) i 311.400 t3-l.5001 57.600 t51.XI)()) I 76.1100 169.0001
1 .!4 hour; tOperarion rare 95'1) I 57.600 15.J.7001 86 • .JOO (11:!.000l 1115.21>0 t I Hl.000)
! Con· Wa1enm'1 llU l.J.O i 19.0
sumption 1.075 1X2.69{) 1.500 ( 115.38/) I l.X50 (!.J2.Jl/) i
. rate 2 I.II i 511.0
2XX -t32 I
576 r- -- -- ---- ·-t Energy and raw Warer 0.00.t.J 0.00.l9
i --+--
0.00.t()
i material re4uired Sream ! 0.-t479 ((l.03.t/1
0.00XI!
o..i 167 10.0320 1 o.J85-t 10.030;1
i for creating ma of I
Ekcrrici1y O.IH06 O.OIO.J
; fahric Amouri oi energy (kca11
B7.2 .~22.0
i I
i 0.12 0. 12 0. 12
:\mes I. The hrackered enrries under Production Turnout show appro~1mate figures which would
resulr from the n.·specuve opera1io11 rate\.
, The hrackercd entrie~ under Steam ,how equiv·Jlenl fuel consumprion figures which w·ould
he needed 1f a hoiler with a evapor;:tmn rario I= evaporation/fuel consumption J of I J was
used.
J. The energy v·alues wert· nhraincd from Figure: 2-t.
tl\azuo Shio7.awa: Te:i1tilc Wet Processing Technology. p.-tK. Chijin Shokan. 1991 l
(2) Elimination or merger of unit operations
The currently employed dyeing techniques arc hased on unit operations which
have been developed and established for use with ;1atural fiber. For this reason,
the traditional standard treatment steps an; often applied to blended yam fabrics
as a maner of principk. However. through omitting or merging some of the
unit operations according to the usage of the product and considering the
characteristics of the coexisting synthetic fibers, ii becomes possible to
achieve energy conservation. Tabie 7 shows an example.

Table 7 Unit Operations in Preparatory Process of PE/C Blended Fabric and its Processing Characteristics
Combination and Ordering !'umber I Prucc:ssmg Characteristics of ~rations of C nits
Singeing --+ Dcsizing --+ Drying I I I l Cumulative: Method 10 I 121 Strict Control
I -+Heat setting --+ Scouri!lg -+ Drying c ~I Ex.cc:ssivc Drying operations I --+ Bleaching --+ 0ry; ·~ -+ Mercerizing 1 --+ Driino I . e-
I Singeing --+ Dcsizing --+ Scouring
! --+ Bleaching --+ Dn;ing --+ Mercerizing
j -· Drying --+ Heat :.Cui:ig
; Heat ~uing --+ Singeing -+ De;1zmg
i --+ Scouring --+ Bleaching --+ Drying
--+ ~1c:n:c:rizing -+ Drying
I
I 'II c2) Fewer drying operations Difficul!f in controlling scouring and blea,·hing
I .11 Grc:al number of wrinkles from processing
; ( I l Difficulty in d~sizing I ('.?) lnsuffa:ient efkcti~·eness in processing
c ~I Wrinkle~ from proce\sing prevented
---- -~ - -- ~------------------------- --r------- ----- --- --
Singeing -+ Dcsizmg --+ Scouring ! c I l Satisfactory desizing I! I c 2 l Fe"c:r drying ,lp.:rauons
-+ Bleaching --+ Drying --+ Heat sc:n111g
--+ '.'.1en:erizing --+ Drying
I Singeing --+ Mcr'-'erizing --+ Des1zing 7
li --+ Scouring --+ Bleaching --+ Drying
-+ Heat selling -- - - -- ----- - ----- - ------ --
1.1) Caution again'' wrinkles from processing
1 I l Fewest drying operations c 2> Difficulty in de,izing
· f 3) Small mcrcc:nzing c:Hc:ct
cKazuo Shiozawa: Te'.\tik Wet Pr<Xessin!! Techmqu~\. p 50. Chijin Shokan. 1991 l
(3) Reduction in processing bath ratio
It is easy 10 understand that a reduction in water use will contribute to energy
conservation in the dyeing process which consists of various wet treatment
and drying unit operations. It is especially desirable to curh the waler
consumption because it is linked to the overall warer supply cost including that
of drainage.
For the reduction of the processing bach ratio, it is necessary to investigate the
following measures:
(a) Treatment with low bath ratio
In general. dyeing and finishing methods are classified into the barch and
continuous processing methods. and it is recommended to use the latter
method where a low bath ratio is desired. However. depending on the derails of
processing requirements, there are often instances in which the batch method
has to be employed. In such cases. batch processing machines which allow
- 24.

lower bath ratios such as the jigger. wince. ht-am. pad roll and jet flow types
should ht- selected as far as the circumstances permit. Figure 16 graphically
shows the relationship belween the bath ratio and the production cost for the
wince dyeing of a conm fabric with a reactive dye (brighl red. medium shade).
It is ea~~ to see that lhe bath ratio has a direct influence on the production cost.
Cost (¥1~)
zoo
100
.,,.,,..
~---C:.:::::ms ~_/ -------
..--· Steam --io:1 Bath ratio
-----·-Water
20:1
Figure 16 Relationship between Bath Ratio and Production Cost in Reactive Dyeing
(Kazuo Shiozawa: Science of Textile Consumption. p.24. Otsuka Textile Design School)
(b) t..:tilization of low bath ratio proc~ing equipment
In order to use a lower bath ratio with the existing machinery intact. a method
to insen a filling material inside the processing equipment. a.~ shown in Figure
17. has been proposed. h has been reported that wit~ this method. the bath
ratio of a wince could decrease from 25:1 to 17:1, and for a beam a
reduction was ~~ible from 15:1to12.S:J, or even down to as low as les.~
than 10: I where the axis of the beam was made off center with resped to
the container body, thus increa5ing the batch-up volume as shown in (8).
More recently. low bath ratio processing machines which arc built in with the
above mechanisms have been developed and put on the market.
- 2S -

Winch
liquOr injedlng pump
Filing malelial
Fabne
(A) Beam dyemg mach:ne
Figure 17 Exampte of Low Bath Ratio Operation of Existing Processing Equipment through Insertion of Fimng Material
(0 H SQUIRE J Soc Dyers Colounsts 92 t09 (t976))
fc) t"tilization of lo" add-on equipment
Several types of proces.'iing equipment with a mechanism to uniformly
apply the fabric ~ith a minimum amount of liquid necessary in semi
continuous and continuous proces.'iing systems are known to be typical
examples of energy conservation techniques. Those in 1-'igure 18 are
typical of them.
26

(_...-
' I Carierrol I I I I
t I I
p I and p 2'$ $CJJ88Zing pressure can be freely adjusted
Liquid resin
Tr8Mfer pedding mangle
%-GJ-0,-1. Mxing tank 2. Filer 3. Pump
4. Flowmeter 5. Sptay
SpreysptMn
Trl8tex llA system
Figure 18 Typical Low Add-on Mllchlnes (Transfer Padding Mangle: P.F.Greenwood. Oyer. 153 25 (1975)) (Tnate:ir MA System: P.T. Nordan: Am. Dyestuff Reporter. 69 35 (Aug. 1980)) (Spray System: H.8.Goldstein.H.W. Smith, TC C. 12 49 (1980})
- 27 -

Cd) Extension of foam pFOaS"'ting technique
Figure 19 is a typical example of foam processing liquid applying equip~•
Tbe foam processing technique is used for the preparatory. dyeing, textik
printing and finishing prOttSSn. witb confirmed effects of promoting
mugy COllS6Vation. but it is desirable to examine details of usage and
other practical conditions prior to applic:atioo.
a) Example of knife coat applying equipment
b) Horizontal pad applying equipment
Sealed blanker
Kmfe coat
c) Vee.foam equipment (Monforts make)
Figure 19 Typical Foam Applying Equipment (a & b) T.F. Cooke: T 1..; C, t5 13 (May 1983)) (c) R.O.Leatt: J. 0-..c. Dyers C<'iounsrs, 98 422 (1982))
2R

(4} Reduction ol proc:mng time
As has been pointed out. being a time saving technique aimed a1 improving
productivity. conrinuous operation wilh an increase in the size of lhe processing
machine ca."l also further energy conservation_ Likewise. for batda processing.
the numbn" or technical f adds is incnasing when the promotion of energy
consenation is dnired through a rflludion in processing time. This
tendency becomes more pronounced as rhe needs of the marke1 become
sophis1ica1ed_ Techriques lo accelerate the processing effect with rapid dyeing
and pla~ma treatment are 1~-pical examples_
(a) Rapid Dyeing
Rapid dyeing which can drastically reduce the dyeing time and achieve
remarkable time savings can also achieve great energy conservation
effects when applied to polyester. In order to attain these effects. it is
necessat} to sclec1 dyes with assistants and .- rovide appropriate dyeing
equipment- Combined with the fwm processing techniq1Je. the rapid dyeing
tedmique may also have a potenrial of leading up ro the development of new
prac1ical dyeing techniques. Figure 20 shows the position of rhe dyeing
techniq<Je in the overall processing bath ratio redt;ction technique.
Reduction in treatment bath ratr
Batch proceSS1ng
SemliContinuous processt:ig
P.;;.i>hca11on of low bath - ratio processrr.~ equ1pmenr ----.
Low add-On equipment Low leave-on equipment 1
A" Ii~ dyeing J....._,____,..------i I I
ln1eqra1•on ...,,n Textile printr~ --- roam prxessmg •--------
~----- tect:n1que ~"--------
( Then-airflow dyeing J- 1ntegra110n with r;tpd _ . proeessmg 1ecnn1que ----------
~-------__J {0es1z1ngtscounn~ach1ngl,_ _____ .,
~~ 1n1eqra1ion with [ Fluorescent whitening J- rorni proces51ng r-------------- t/ 1ecn"'que I sancoward dyeing r
Figure 20 Situation of Dyeing Technique in Processing Bath Ratio Reduction Technique
(Kazuo Shiozawa: Telftile Wet Processing Technologies. p.50. C:hijin Shokan. 1991)
- 29 -

Cbt Accelerating techniques for processing effec:ts
Aiming at a reduction of processing time. the combillc!d use of a number of
new techniques are being studied and it has been reported that processing with
plasma. ultrasound. magnetism and radioactive rays accelerates processing
effects_ Various methods are being investigated to reduce processing time
through accelerating processing effects using these techniques in preprocessing.
postprocessing. simultaneous proceS:iing. etc.
15) Reduction in temperature rise margin
In many cases. unit opcri.\tions of the dyeing pnl\:ess arc carried out at high
temperature. Therd"orc. to reduce the required margin of temperature rise
from heating is nr) important in \iew of achie,ing funda-mental energy
consenation along "·ith reductions in processing time. These measures need
to be addressed from the folio\\ ing two viewpoints:
la) Raising temperature of inlet \\·ater
If the temperature of the inlet water to he used in the dyeing process
becomes relatinly higher. the amount of energy to be consumed in
raising it to the predetermined \·alue ,.-ill he re-duced. for tha, purpose.
cooperation within a company ... .- that involving more than one company
tusin~ lo\\ temperature inlet w~•er at the dyeing factory for cooling purposes.
and the high 1cmpcrature discharge from the cooling system for dyeing
purposes) \hould he investigated. as well as the utilization of natural resources
(for example. geothcnnal and solar energy)
(b} Dt>velopment and introduction of low temperature processing techniques
It is imponan1 to cominue with 1echnological development aimed specifically at
lowering the rrocc-;sing tempera1ure along with raising the inlet water
temperature. II would naturally involve the integration of this method with the
proce,sing 'JlCed accdcrauon techniques dcscrihcd in 141101. Low temperature
~ouring. bleaching. dyeing and curing techniques are some of the practical
examples of this.
- JO -

(6) Re-examination of drying method
An important consideration along with the reduction of the processing bath ratio
is a re-examination of drying operations. A drying operation is, in principle.
inserted after every other unit operation and is an important operation which not
only determines drying efficiency as such but also has a direct influence on the
morphological stability and texture of the final product. For :his reason, various
types of drying equipment have been selected and put to practical use. depending
on the fiber material and form involved. In view of implementing energy saving
meao;ures. it is particularly important to investigate the following three items:
ta) Redudion of drying operation-. in number
As can be seen from Table 7. a detailed study of typical preparatory process
configurations reveals that drying operations are invo!ved in relatively high
numbers. ranging from one to four units or 14'k to 40<k of all unit operations
in the entire process. Therefore. combinations of unit operations should be
sought after !;uch that drying operations between standard unit operations can
be diminared as much as possiMe. It is especially necessary to cut down on
drying operations in preparatory processes which will not directly affect the
product's performance or appearance quality. However. an operation which
would have come after an eliminated drying operation would have to treat wet
fabrics, therehy necessitating special meao;ures that would enable wet or. wet
tn-.atment.
(b) Improvements in drying effkiency
It is desirable to investigate possible improvements in the drying efficiency in
terms of efficiencies of both thr dewatering and drying steps. While it is well
known that the most efficient methods of dewatering and drying are by means
of a mangle and a cylinder dryer. methodo; which have been practiced for a long
time. they arc abo known to have limitations in terms of applicable fiber
matenah and fonns. It is necessary to investigate new drying methods (high
frequency drying. microwave heating. far infrared radiation heating. etc.)
together with other mcao;ures such as utilizing vacuum liquid removal. adding a
drying-facilitating organic solvent to the treatment liquid. and combining foam
treatment systems with non-foam ones .
. 31 -

(c) Recovery of heat ene~
Along with active energy saving measures, it is imponant to carry out the
collection and recycling of the energy used in unit operations. The collection of
heat energy should start with thoroughly grasping the basic energy balance of
each unit operation (eg. Ref.Figure 15).
C7) Shift to solvent processing
In the dyeing process. although water has been used as the only abundant and
cheap resource so far. it is becoming difficult to obtain high quality water in large
quantitie~ at a low cost. The worsening of river pollution coinciding with an
increase in population density is inevitably creating a situarion where the cost :>f
water will gradually increase. including rhe investment for improvements in
waste-water treatment facilities. In addition, although dry-system processing has
been contemplated for a long time due to the fact that most energy is consumed
in the heating and evaporating operations. it ha<> to date only been applied to a
specific area on a limited scale. However. it is a technique which deserves
auemion as a promising process in the mid- to long-term future. This technique
has the following two variations:
(a) Organic solvent proces.-;ing
While the solvents to be used for dyeing processing are categorized into four
main groups--halogenared hydrocarbons. petroleum derivatives, aromatics and
oxygen-containing solvents-halogenared hydrocarbons are generally recom
mended as rhey do not cause a fire or explosion (provided that 1horough
countermeasures to groundwater polluuon are taken). It is well known that
in terms of energy conservation, these solvents have an advantage over
water-based ones in all or these aspects: specific heat. latent heat for
evaporation. heat needed for evaporation and evaporation speed. There are a
number of proposal\ for solvent scouring. solvent dyeing and solvent
finishing. including those already put to practical use as a differentiating
technique.
32

(b) Inorganic solvent processing
Liquid ammonia is one of the agents being considered for dyeing applications
as a inorganic solvent. Of its typical processing techniques. liquid ammonia
mercerizing and liquid ammonia dying are given particular anention.
(8) t..;se of continuous bath
While textile manufacturing techniques which promote the conservation of
natural resources include grea.\C refinement from raw wool. the collection and
recycling of warp sizing agents. and the re-use of alkaline waste liquid arising
from the mercerizing process in a scouring b~nh. in terms of energy
conservation the use of continuous baths which utilize the residual heat of
the system are particularly important in ,·iew of energy consen-ation.
If the continuous use of a processing hath is introduced with the necessary
conditions being met. thus allowing only those materials consumed in the dyeing
process to he replenished. in particular with the unit operations designed for the
hatch method. it will greatly contribute to the recycling of heal energy in aJdition
to achieving the conservation of natur.il resources and the rationalization of
countermeasures to water waste. In the dyeing process with a high heat
consumption. the use of the continuous bath desen·cs particular attention
as a technique whose practical application is an urgent task to help
implement the remaining rationalization mea'tures.
(9) Space saving
With an expansion in the practical use of knit mercerizing and ammonia
mercerizing, the characteristics of the hot mercerizing technique is also attrncting
attention h has been pointed out that, since poor unifonnity associated with the
tradir1onal mercerizing due to the hydrophobic nature of cotton grey fabric is
dis'iolved in hot rnerccri1.ing which usl.''i heated sodium hydroxide. the
rationalization of the preparatory process can he greatly advanced. Figure 21
shows an example of comparing some space s~iving effects achieved hy the
introduction of hot mercerizing. Table H compares operating conditions of the
s;1mc three factories. At the time a new space-efficient factory is hcing built, it is
possible to inrnrpora1c a program 10 introduce such facili1ies as to he complete
wilh factory-wide energy conservation measures.

m Factory A Ania=~~
i.s 2.sll-~~:;~v;b;;;~--=--T~~~-~~~j-=-11 -1 - I
J.O I • I 2-Sll ~'~n9?l Mercerizing I- I ~ - rL. .. A~ • I~
~. . 'j +H _____ ~~-~:c~·~-t:q~~~-=-----------J t 600.~~~~~~~~~~~~~i
m Factory B Area = 495 ~
~ll~i=n~-r~=~-~~~~ga--=.---11 3.0 I • • I G?
iil-lz:?i•f9'0J Bleaching I Marcenzing r-JJ:: nt ___________ 45m ____________ J
m Factory C Area= 275 m2 Tsr--------------. -----.--------1 zsr-1 Hot Mer~rizing/Scounng j Bleach•ng V / DrYi~g/A- •fil~ TI' . . - VL. A • &! I 111
~------------~~------------~
Note Factory A: Although 1t has the same types of machines as Factory B. 1t has introduced a drying operation for each unit operation. emphasizing flex1blhty. Factory .... : Considers the production rationahzauon resulting from continuous processing./ Factory C: It has th9 same production capability as Factory B. but has reduced the preparatory process related to mercerizing
Figure 21 Space Saving Resulting from Introduction of Hot Mercerizing (C Duckworth. L M Wreenall. Soc. Dyers Colour Colounsts. 93 407 (1977))
Table 8 Comparison of Actual Operating Conditions of Three Factories -----------· ----- - ------- - ---- -----·- ----- --r-- -·- --·~ - --- --- --- - - -·- ---- - -- ---~--- --- -- -----
i Fkctric W;11cr wa,ti: 1
lnvc,t- .-\rca Worker-• I Power Stearn
Supply Watl·r I
Factory rncnt I rn-' I 1 pcr,on I (kg/h11un I tkW1 f I/houri f I/hour> ~-- ----- ·- --- - --- J ----· - -· ~- .
..\ llJll' ( 1)11(1 14 242 .".727 14.'i '\'i .... 'd'i
( 200'., ' 1 l:'i:'i'.,' ( 114'i' I L\fl',; ' I 100'.( I f I()()',; t ·-- -·- ------. -· -+- . -- 1 ---- .
4'>~ I 0 2 ! (1 I 4. 'Xfi 14.:'i''i 14.:'i.':'i
H 1ow; I
1 1 ow; , f I()()',; I I I I 00'.'r I I I O!J',I l I 100'.i I ( 100~~)
275 :'i T 114 r 2.:'iOO 7.7X'i 7.785 (" 67''r I
(.'i'i. 'i'( , I 'if>'/, ) I ( )2'.i) ( :'i7'1r) f 'i4'/r) f'i4'4) . -- . - -- -· . J
(C°. Duckworth. I..~. Wrcnnall: J. Soc. Dyer~ Colour Colouri't'. IJ'.\ 407 11977»

3.2. 7 Clothing manufacturing
The energy consumption share of the clothing manufacturing division which consists
of large numbers of small-sized companies and their employees in the overall textile
industry is not necessarily low. as seen from Table I. but the ratio of energy cost tc
the total cost is relatively low. as can be deduced from Figure 25. However. the
energy cost forecast is inevitably a gradual increase under circumstances where the
production of hi~h value-added goods is required. along with the implementation of
labor saving measures. as a result of the challenging market environment
characterized by personalized and di\'crsified consumer needs. high demand for
quality goods. short product cycles. etc. Therefore, it is desirable that a comprehensi\·c
rationalization program be investigated apart from reductions in energy consumption.
4. Actual Conditions of the Textile Industry in Japan
(I, It is widely acknowledged that as a result of tireless rationalization efforts made
by all companies involved. the textile industry has increased its production valw.:
by 10 times since 1955 (when it recorded the largest share in total shipment
value as a bright star in the entire range of export industries1. with a gradual
decline in its share over the same period (Ref. Figure 22). though maintaining a
stable growth as a mature industry.
(2) Structural changes in textile industry
It can he seen that large structural changes occurred in the industry as the
domestic companies carried out measun.:s to overcome severe competition from
overseas. in addition to the already intense competition among themselves.
Figure 23 show" a typical example of this situation.
The shares in shipment value of major 'uhdivi.,ions in the textile i'ldustry have
undergone drastic changes. such as a rapid fall in the fiber production and
weaving divisions and a fast growth in the knitting and sewing divisions.
reflecting the conditions surrounding the international as well as domestic textile
markets.
.15

100 500 1,000 2.000 3.000 4.000
1955 EleCtJ1:al macflinery nl app;r3IUses 162 ("lo)
T~lion machinery and apparalllses 13 8
17 .9 Foods1ufl nl beverage$ 11.7 t--.----
42
42
General~and~f1ockJdilllweaoonsl 9.2
11 . 0 Chemi<3 mduStr) 7 5
Steel indUSIJy 5 7
Hardware 5 .2
Textile induslJy 4.5
PublishllQ nl prilbng 3 7
ceramic. ir!d ear11l and quarryilg 1ndusb'les 3 4 II'------~
Pe1roleum ~ coal indUSlneS 3 2
Plasllc products 3 2 u--------.""
Pulp. paper and processed paper pro<IUCIS 2 8 >------""
Nonferrous metal 2 2
Otllers 7.6
Notes 1 . The graphs were drawn using data from the Tabulated Industrial Statistics. 2. Figures 1nS1de the bar graphs represent shares for tile respective fiscal years.
Figure 22 Changes in Product Shipment Values for Various Industries
1Cl65 12.0
1975 8.1
I
\
' .
I I
12.R
I I
I I
22.9 !
18.1
20.7 13 2
// ~' I , I
I
13 0 IO 7 210 10
1986
1989 a2 r 126 1· 153 [' "·' ( 32 4 t 14.4 J
Chemical Sp;nn1ng weaving Knitl,ng Others 1:1>er ( F aonc Production I
Note Graphs were drawn usin~1 r!ata from the Industrial S!ali'.ltica: Table Sewing combines various texfile manufacturing including clothing manufactunng.
Figure 2J Structural Changes in Textile Industry
. 36

(3) Progress in production rationalization
Table 9 compares and summarizes the progress made in production rationaJiza
tion by some typical subdivisions af the textile industry.
Table 9 Progresses in Production Ra!ionalization by Typical Textile Industry Subdivisions
~ivisioo ·-
19110 I Uni1 Fis.:al Year 1955 1960 1965 1970 1973 1975 1985 1990 I
kg/per.onimonih 507 672 2,237 ~iw
1.0}5 2.097 2.759 4.776 6,021 11.264
Produc1ion YI 0.000/per~on/monlh 14.2 24 7 42.4 90.K 106.!I 101.9 231.9 2116. I 326.5 --- --- ·-'--· ---
r:•'""'"' _kglpmM/mo"'h _ _ 1~'____'1' _ "'--~-£"- 7 Jl '-'"" 1.419 1.655 ---------
YIO.llOO/per.on/monih 14.9 11!.l I 24.0 1fl.2 6CU t\4.9 1111.2 134.6 131.fl --~· -- . ·-·r;------ -·---- ----~------
2,943 3.337 fabric . ~~~/person/m~~---·--~ 17 I .OH 1.215. : .603 1.900 1.703 2.464
1Producuon YIO.f100/pcrson/mon1h II.II 9.7 ! l~.11 25.3 .+I.II .n.7 74.3 91.4 137.7
, ! 4.907 5.451! 7.569 7.431 9.379 9.9M 12.02K 15.424 16.502 1Dycmg and m-/person/mon1h
lfm1shing Y 111.000/pcVion/monih 7.0 11.3 15.1 27.1 42.6 57.3 112.4 11:4.0 119. l
Noles I_ Since quantiries and sums were taken from the 1\nnual Repon on Textile Statistics and 1he Tabula1ed lnduslrial S1a1is1ics. respccli\.'ely. they do not nece~sarily correspond IO each other.
2. Fabric only represent~ woven marerials and d~s nor include knitted ones. J. 1973 i~ rhe year when 1he oil shock broke ou1 and as a result 1cx1ile consumption reached
ir~ maximum. 4. Sums for 1990 are 1he ac1ual resulr~ for 19R9.
Despite a strong tendency iowards multi-line small-volume production in
response to requirements for high value-added products from the fashion
market. there is a marked growth in both per capita monthly production volume
and product value. Regarding future trends, while lhe latter i!'I difficult to estimate
as it depends on the goods' prices, which ar~ in tum to be deteJ"lll;ned by a
balance between demand and supply, the former may be more easily foreseen as
continuing with its increasing trend as a result of advances in the sophistication
of production equipment. if profitability is ignored. However, due to the high
level of r:itionalization already incorporated in \Uch equipment. it will he
reasonable to expect that attempts to achieve funher improvements in this respect
will inevitably meet wilh considr.rahlc difficulty.
-n

(4) Changes in ~'Dergy consumption
Table IO shows changes in the average amount of energy required to make 3 unit
quantity of each textile product over time. It illustrates the course of events as oil
replaced coal as the dominant energy source supporting the backbone of society,
with the textile industry actively introducing lhe fluid energy revolution amid
high economic growth. This took place against the background of a low level
stabilization policy for oil prices made possible by amp1e oil supplies, including
the discovery of large-scale oil fields, as well as oil's convenience in
transportation and utilization It can also be seen that a shift in emphasis from oil
with its sky-rocketing price to electricity occurred as a result of energy saving
measures introduced after 1973_ More recently. energy saving has been
ach·anced. while a rationalized use of diversified energy sources is being pursued
with a global view taking the oil market price etc. into consideration.
Table 10 Changes in Amount of Energy Required for Unit Production
I Produc- : : Fabnc I C>,~ir.g and finishing ( IOOO m~l I 11on Fiber Producuon m Spinning ll Produ.:uon t F1eld m 111;1om~1 I
r;;-.1:~r ~:.:-l::·-~li~~·11 ··:~:t~~:" ~rr~t~ ·~-I l<Jt15 _; 029 1160 11.200 2.H!! 196 I 76 JJ / 144
11970 2.771 % I U7~ 2.459 I 247 : 121 ~ I 2IO -
I ::;: ~ ;'.'. I : ::: ~ ::: I :~; I :;; I ~:; 19110 2.167 l 11"" 2.116~ ]]') I 171 l:'i'.I
:::;~---~-:~~---· ~~; __ --~;~ -- ~:~~~ -~~~~ ____ l __ :~~--~ _;_J ___ ;~-~ -- --~; __ _ Notes I. Dara were: taken from the: Annual Report en Textile Sratistics
2. •shows caregoric:s which have alrc:ma1ivc entries in the: Tabulated Textile: Statistics. such as lll.9'ii and )). Ir,:, for ~pinning and fahri•· production for Fiscal 19110 as the ratio of fuel cosr 10 the total cncri:} i:o't rcspc..:11vc:I}. hut nmmcd from th1' table: a' 1he1r ..:orrc-.pondmg figures for absolute energy consumpuon arc nor known.
·'. Gas comhinc~ the liquefied petroleum and cny gases represcnred sc:pararely in Tahlc 2. and shows their total in volume.

iii ~ "' e
l ,.. ~ c w
Convening each fonn of energy use required to produce a unit quantity of the
product. as shown in Table 9. to its corresponding calorific value. Figure 24
graphically illustrates changes m;er time of the total of these values. It can be
seen from the graph that while the oil shock which took place in 1973
encouraged a move away from oil and increased a relative dependence on
electricity. comprehensive energy saving measures were also successfully
impiemented.
Although the achievement of significant t.-nergy saving can be observed in the
fiber production and dyeing di,·isions. where energy consumption ratios are
particularly high. it is also apparent that their energy consumption ha., actually
been on the increase since 1985.
:I> Fi>er produetion
Synthetic filer (1kg)
'·~. Dyeing & finishing ( 10 ~)
3)
10
Weaving (10 ~)
Spinning (1kg)
1965 1975 1985 I 1990
Frscal year
Notes 1. The graphs were drawn using dala from the Annual Report O'I Textile Stat1s1tes 2. Energy was calculated with the following converSton raliOS
ElectriCtty: 2.000 KcatJKWh eo.1: 7. 400 Kcal/kg Fuel Oil 9.400 Kcal// Gas· 9.900 Kcal1m3 as the average of the ro11ow1ng: Natural gc.>s 9.800 Kca11m3; City gas 10.000 Kca1;in3.
3. 10 ~ ol 100 gtm2 Wetgl'll sncnng can be woven from 1kg of yarn.
Figure 24 Changes In Amount of Energy Required for Unit Production

Fiber production {¥ mllion)
Spinning
(¥ inlionl
F abnC PfOduCtl<>n (¥ milion 1
Dyeing ('¥ rmlkonJ
Sewing ~ r.illilor.1
1969 1973 197: 1~111
fZj Personne1 • Energy cosr cost
19115
,S.7
s 3 10.2
S.3 17 "!
[ "!11) Matenat cost
Nores 1 The graphs are drawn using data from rhe Tabulated lndustna1 Statistics 2 Figures for Fiscal Years 1969 and 1973 involve businesses with 20 or more
employees. with the rest covering those with 30 or more t1mployees
Figure 25 Changes in Cost Compocition Ratios for Textile Products
Given this phenomenon along with the steadily increasing energy use in the
spinning and weaving fields. it can reasonably be assumed that rationalization
efforts are reaching their limits in v~w of the current production structure
designed to cater for rhe needs for multi-line. small-volume production from the
fashion clothing market. Figure 25 summarizes and graphically illustrates
changes in cost compositions for the production of major textile products. as
shown in Table I J. after the oil shock_ It can easil~· be seen that the innuence of
the energy compor . .:nt on the total production cost has been more pronounced
after 197}. while at the same time effects of energy saving efforts are also
noticeable. The gradual increase in energy con'\ump1ion in spinning and fabric
produ.:tion and the upward trend" after 1985 in fiber production and dyeing as
shown in Figure :!.i are both translated into a decrease in terms of the ratio of
energy cost to the total. illustrating that comprehensive energy saving efforts
hm;e been made by the companies concerned.
(5) A~ent of production rationalization level
Although it is generally difficuh to assess the level of production ra1ionali1.ation
in the rextile manufacturing industry in absolute terrm. the dyeing and finishing
subdivision is often pur under scrutiny a'> a typical specialized technical field with
a number of unknown factors. It consumes large quantities of energy carrying
our multi-line processing la!\ks within short periods of time in order to directly
reflect the marker's needs. Table 11 shows the results of calculations to find the
levels of productivity which could he ohrnined from dyeing operations assumed
to have been conducred in a planned manner at some ideal factories, comparing
them with the corresponding average figures for actual Japanese companies
Since productivity dra-.tically changes with the texture or structure of the original
fabric and the details of processing. polyester-cotton blend fabric <shirting of
approx 100 g/m·' assum:<l1. which is more likcl} robe processed in a uniform
manner. wa .. used a.'i the material for this scenario. The table shows that the latest
figure of average per capita productivity for Japanese companie~ is already
comparable to those for hypothetical model plants. highlighting the fact that with
the current level of technological development Japan ha~ also reached a
considerable level of production rationalization.
41 -

Table 11 Example of Productivity Comparison for Hypothetical Model Plants .---------- --- ---- - --, ---- ------ -- --------- - --I
I i A.:tual Result
I Fa.:to~ ~todd A ~fodd B Model C ,\\"of It Comps•
Avof7 Comps•• I
I Bka1;hing/ ! Bka.:hing/ Tc·uik Dyeing and
i Processing Detail' I
Dyeing/ Bleaching/
Dyeing/ Textile Printing
Bkaching/ Dyeing/ Textile
Printing
: Pro.:es .. mg ; Quanrirics
; i I0.1100 m/ycan
: '.'\umhcroi · Er.tploycc'
Printing
2.-tOO
IUil!>l'J
Textile Fini,hing Prinung
~.000 IJ.5911
----·- ----- -- ----- --- -- ---+-
207 ').t I
I. 2195 IUIO.to L20.t2
'.'\oie: • and •• mean 1977 and 1111\X a•Cr;tgc' .. .- figure' for .:ompanie' spcc1ahzing m dyeing \\l!h 1r,1cd 'hare,_
fKazuo Shioza"'a: Te,1ile Wei Processing Technology_ p.30. Chijin Shokan. 1991 l
5. Structures of Textile Markets In general. it i' well known that the devdopmcnral proc~ss of a textile market moves
from a product-oriented stage. where all good-. produced arc sold to a consumer-oriented
srage where the dc-.ired good., arc only rhose which will ....itisfy the consumer's demand.
comprising his wan!\ and purcha,ing power. This i-; via a mass-consumption stage
which is supponcd hy J mass-production system. The characteristic-; of teJr.tile products
demanded in the markch in 1he.,c differcm developmental slages may he classified in10
price--.cn,i:iw rna .. s-produc1ion type hasic clothing. which applies to the earlier stages.
and multi-line. small-volume production type fashion clothing which pcnains to the last
s1agc and needs IO '>atisfy each individual con,umer's taste.
5.1 Basic clothing
A"uming thl· amount of fahric neces,ary for people 10 live a physically comfonahlc
life in a given en\'ironmcm can he derived frorn the weight of dolhc' which is enough lo
keep a cen3in level of hody 1empcrature. given .. uch factor' as air temperature. humidity
and wind velocity prevalent in the region. hasic clothing can he regarded as a cumulative
toral of '\UCh clothes. Figure 26 'ummarizc., the rrlationship hctwecn some clo values
42

and examples of the corresponding clolhes. Table 12 shows the results of calculations to
find the weight of clothes required under average climatic conditions in summer and
winter in three Japanese cities.
0 0.1 0.3 0.5 0.8 1.0 LS 3.0 clo
Figure 26 Typical Relationship between Clothing and Clo Value (P.O.Fanger: "Human Requirements to Indoor Chmate" (1983))
Table 12 Example of Effect of Climatic Conditions on Clo Value and Weight Of Clothing
- ,- - - - ------- --··--·· - - - ·-1·-·· -· -· -----·
I 1 Wind Required Region
I Season T empcrature Humidity I Velocity Clo Value Weight of
I ('C) (~fl (ffi/\eCI Clothing lgl I
Jan -".9 7.J 2.3 .J. I ..;005 : Sapporo i ~--r 21.3 79 2.7 1.2 111!9 ~~¥ ---~- .1. t- . ··---- - --I I Tokyo I Jan .J.7 53 3.1 ll 3034 ~-i
Aug 26.7 75 :rn 0.6 fl..)7 j -. -···----- .. . .
! Fukuoka I Jan 5.7 67 3.7 3.0 2937 i ·-. I Aug 27.3 76 2.9 0.6
~otes l. The do values arc shown assuming an avenge skin temperature of .B.5T. 2. One unit of clo value: is 0.15YC/W/m~.
(J)7
J. The m1uired weight value' are 1.:akulated with Hanada\ formula for female dothing: Y "' 0.0010.\W 0.025
When: Y: Clo Value W· T111al Wc11?hl of Clothing
dapan-Korea Comm1t1cc for the: lnvc:,11ga11on and Re,car<.:h ol lndu,mal S1ru1:turn:·con,ul11ng Engineer' May 199 I Special F..diuon. p. 35 I

Alrhough rhe ulrimately required quantiry is Jifficult to derennine. the per capita
annual rextile consumption c kg/person) can be estimated through multiplying the above
weight by coefficienr a (obtained from lhe service life of a textile product and its number
of units demanded per annum).
5.2 Fashion clothing Although ir is ewn more diffa.."Ult r~ define the amount of fabric consumed in fashion
clothing. a market which has satisfied rhe demand for minimum ba~ic clothes has a
tendency to shift its emphasis towards h:x1ik products with srronger fashion m•crtones
and grow r.tpidly. This is illustr.ucd h~ Figure '17. showing chronological change' in
textile consumption in Japan and the world\ major coumries. and Figure 28. a
graphically expressed corrclatron hctwcen per capita tcxtik consumption and GNP.
2 6 8 I
1946 ~ Italy j
1950 28.0 I J 1955 26.0 I
1965 47.6 (21.2)
1973 49.6 (35.5)
1975 38.5 (32.5)
1985 s· .a (47.9)
1990 54.6 (49.1)
10 12 16 18 20 22 kg
24 I
~/~0] Textile Consumpoon of Wor1d"s MiljOI' Countries
n.yearJ lkg.pe<so West Germany 01975
v,(J P~4~f] ~1985 Franr.e
I Wd Eng1and Umted States
(] I ~/,/l//ija -..,
I _j
, -~ _J
,---, ---"
---, I . . ---· Notes 1 . The figures inside !he bar graphs w1!h and w1lhout brackets are the shares of chemical
and synthetic fibers in the total consumpt1ori. respectively. 2. The broken·hne portions of bar graphs represent the consumption of 1ext1ie goods to
be used as industrial materials 3 The sources are the Annual Statistics on TelC11le Goods for Japan and FAO data for
other countries. respec!lvely
Figure XT Changes in Textile Consumption of Japan and World's Major Countries (Kazuo $h1ozawa TelC11le Wet Processing Technology, p.33. Ch111n Sho,...an. 1991)
44

c 0 a E ~ c 0 0
~ ;c • I-
25
20
5
ll*1d tlllQilY • .
• lbnla
Kolm •Grae • •
Uruted Slales •
Aus1r3lia ,__., I •
Silf;apole • west Gem9'f • I • CRiii • ... • Swiss
Nelll Zslillcl . ..,.,., • • la!linl ~. Dnnilk. • Swed!ll
Kilgdoln • I r:-.
• Hool! Kaig- Austria • ·- ·~ • ~ Ui8ICnlQ
!! t 0 ~- I !!r.11!1
I ·~
0 & ~
Turlley • 1131 ••
E t • ~ Sou:n Afnca
s • • ll4il8f.ili .awa • .Meam . BtiZll
Peru -!:-- • Ttrail1d -:.....-. P!lihpprleS • lbnQ
S.000 :o.ooo 15000
Per Capita GNP (GOP)
Notes 1 Data on developed and developing countnes are tor 1985 and 1984. respectively
18.000 {US.SJ
2. Entries tor Japan. the United Slates. the United Kingdom. France and Italy reflect per capita GNP. while those for China and other countnes are based on per capita income and per capita GOP. respectively
Figure 28 Correlation between Per Capi1a Textile Consumption and GNP (GOP)
(Apparel Handbook. p 193. 1988 Ed, Sooety f.Jr Structural Reform in Textile Industry}
5.3 World's total textile demand and production base distribution Figorc 29 'hnw\ the rela1ion,hip hctween v.orld popula1ion and 1he 101al 1ex1ile
demand. Assuming a global environmem in which world population will grow from the
presem 5.4 billion to 10 billion in 2050, and funher to 11.6 billion in 2150 when it is
ex.,ected to reach a static state, the total textile consumption is forecast to double, even
using the current figure of per capita annual average textile consumption (Rkg/person).
- 4~

I _I
' .' I I , , I /'
I '/ ,'II ,,'I ,'I
--~ Solid 11ne represents ,' I ,'' actual r&Wt ,' '"° ;'
~ ~ I • ,'
y,,< .. ,,/ , I ' . / ~, , , ,
' I , I I , "" , , , , , ,
, I ,' I I , /
,' ,' , ", I I ,' IMO"''
I I , , .,,,..,,.
,' ,' ,' ,"'' _, I , , ,
/ I
/ ,
, , , .,se ,,, ,."' l 1, , ,,,,. ...
,'1,' / ''!''' Caseotpercapitaannual
/
.,.. , /
/
,::/ -''°' COf1SUITl>lion at 2 kg 0 ; 111111 2 4 ---;,- -8---, ... 0----'12--
World population (billion)
Figure 29 Relationship between World Population and World Textile Consumption and Production
(Kazuo Sh1ozawa Science of Textile Consumption. p.24. Otsuka Textile Design School)
The textile industry is traditionally regarded as a typ;cal labor intensive industry
developed on the basis of abundant lahor supply and has a tendency to expand to
over~a' markcl'i once the domc'.'ltic demand i' '.'lall'.'lficd. a'.'I 1llu'.'ltrated by examples ol 1hc
e~tablished textile industries of many developed countries. For this reason. even when
the textile industry of a specific country is to he examined. it is widely recognilcd thal a
business o;trategy taking into consideration 1he global textile industry setup is very
imponaut. Figure 30 shows an example of the schematic representation of such a global
setup of textile industries.
46

Europe
Figure 30 Example of Schematic Representation of World Textile Industry (ADA Staff: .ltm. Dyestuff Reporter. 71.36 (Aug 1982))
5.4 Characteristics of textile market Most textile consumption takes place in apparel products, and the general tendency is
that where further expansion is intended. it will be carried out through the development
of industrial applications in which textile products are used as production materials
(ranging from fishing nets, tire cords and canvas cloth to geotextilel. Therefore, in order
to study the textile manufacturing industry. it is generally sufficient to consider the
production of apparel goods.
(I) Specialized techniques necessary for apparel goods production
Tuer\! are a number of intertwined technical factors involved in various suh
processes or specialized technical fields which make up the overall production
process that fabricates and reshapes the raw fiber material into the final textile
product to be used by the consumer. Figure 31 summarizes typical examples.
- 47 -

(Process)
Allll mal!rB
lrermedliJI! mafenal
Primary product
Secondiry product
(Production)
Spnq.a.ig ;ind !llmlrld
v-nPlllllt.'CIUI
WeMlgand klllltlnQ
(Major Techniques)
0.-S or IRIJllllblon 111-~. SlC"'°'81 Shipe_
lnf-nlSS M)er lei'llll'. ~ lorm. tit
x r- 1U11C1e or 111arnen1s. dlVI! al awnoong. llJllllW'CI melloO. lll!ndrlQ ,. numoer or 1MS1S r1e
x Conslrucbon. use 'Jf yam denSit'/. WIC!lh. length lal>ric weight. etc
(RawStCICk Production Technique)
(Weaving and Textured-yam product10n Technique)
(We!iMng and Knillng T edlntQues)
= Grev Fallnc Stlndarll ~. ([)yetno T ecllnlQue I
(Sewing T !dlnoQue1
II ~olGoods
x (Marketing Gapab1hllesl
l Apparel ConsumpbOn Trends
Figure 31 Specialized Techniques Necessary for Apparel Production (Kazuo Sh1ozawa: T ext11e Wet Processing Technology. Chijin Shokan. 1991)
(2) Comparison of characteristics of speciaiized technical fields
In Fiscal Year 1989. the textile indu-;1ry had a share of 4.4'/( in shipment value
( 19.2'h: in Fiscal 195.5), 14.8% in the numhcr of businesses (20%), and 10.4%.
in the numher of employees 123.3%) in the overall Japanese manufacturing
industries, characterized by a gradual decline in relative share, although in terms
of absolute shipment value it has actually expanded to 1,053% of the Fiscal 195.5
level.
4R

As has been frequently pointed out throughout its development, the Jap~ese
textile industry has a unique organizational structure consisting of groups of
independent companies where all companies in a group belong to one of the
above-mentiClned specialized technical fields and operate in a horizontal
specialization configuration. Table 13 shows a comparison and summary of the
major indices of these company groups. classifying them in accordance with
their specialized technical fields.
From these indices, common company characteristics for each group may
emerge.
Namcl). in terms of business size. the fiber production and spinning
subdivisions are in contrast with the rest of the textile industry where relatively
large numbers of smali businesses coexist. In addition. these groups of small
companies can only stay in business by relying on the supply of abundant cheap
labor. exhibiting a legacy of the textile industry's past as a labor intensive
industry. even on its path towards modernization. Table I compares the energy
consumption shares of various specialized technical fields and it can be seen that
energy consumption is relatively high in the fields of dyeing and finishing. fiber
production. spinning. weaving and clothing manufacturing.
As for water consumption. the share of the textile industry in the entire
manufacturing industries is 5.2q for fresh water and 1.1 % for sea water.
Considering the fact that most of this water is used for easy-to-recycle
temperature control and cooling purpoo;es, the industry's total water consumption
cannot necessarily be regarded as high. However, as is widely accepted, the
dyeing and finishing division is placed in a special position in that its water
consumption is mainly for processing and washing purposes .
. 49 -

~
Table 13 Summary of Major Indices for Japanese Textile Industry (1989)
j hn"tw.l Yarn f Weavtng ] -K111111n~ ir l>yt·tn~ - \ ---- Clo-1h.ng- -- - Olh;;,-- --T -·~;(;("---t _ l'ro"luct~~' \ __ ___ j _ _ __ _ \1a11ut~~l'!_nn ______ _ ' 1.- j H,<J.1llt 9,hHI -l.~46 .\1,094 5,531 62,261 r ~-.!~~ --- 1(!) 'lw ---~-17_K, '}: t 'it>,4 __ ~·: -___ :~~}:'Ji) ___ ~f =---H1J'~~ 'II4377~:
.---·---------~- ... -- " --- - ---,. -- --· -- - --r·- ·-! feo:hn1<4l field · ht-..•r , Sr1rrn1n1t ! Tw1<t1111t
~llMber oi8usm._.sa• ; _l'y~.Ju<l~~fl t· - --(;<J'J-- -+- ~-:---4(, I ~ Su."!lber of E~l·'~"" _j_:=:_ih.--l 5_5 __ f::::!i_{j\i~-~r-Jij:;;~ i'J.
I -\,,11_~ -1-1.1>flj~-M- 1 _2,ti_1 _ _6, __ 1K}t 1 ___ ;1111.0_1~1 ______ ~4~2-~X~s6 1~~Q,Q.~S 13-:04.:!i_oa2 I ~7l ;!08 .!Ill 10-1 138 262 210
; - ti.HI t ~-s---1.-15 ___ ~t-----,--Zil,Y/'l1 -14Y.ti!!h :L:cis'7,4:ij) -~)42~}~1__t}.6ll,342_ L ()~\ l. 021 -- __ (l17l ()_II) _oc_I ___ ~ ----- o.~{L _____ _il __ J_'l
L-~'erogeofArooocT ___ -+----- --~~L- __ 8~ ---r- __ S I Tol&l Sh1rment \'aluc ___ : _l__,~1;-t.S!15 ___ i '15~lUl_ ___ t_J_~.2_,_:!~-1 : A\Cr&ge ,,f Ahcwe I 11.~t-~ L I, \~4 1 lh •------·-·-----r-- -- -----· -- - - --+- -----
~~~~~~;J,i,_w~~:--__ ' \~\~1~_r_ ·:~~/~} t '~t:~--: c';~~~g;"'·---=-----:-~:~- ---~~ '~~T -'-1)'1.-r -ix 1% I Pcnonncl Ill~ 1'7 i l·I''
F ::~-~-:-~=~~~:~-J1:~-I----=~1~:---t·:_ -~ ~--- --i ' SuN:oo:n<I i 1 0 \ 1 ~ 1 .\ _\ ~ 8u•~;R•ll.,J-----r---- ~K-1-----r----.. ~~ t- ~ \ t -
~~ \\'a\cr~~;~~~~-~-:~~~~!.~a_}) __ _.. ~~-=~- ~-~--~--- ---- ' ' f,...hW•le· \,\l'lti.~''f l.~r.116\ t 1~514 i
I Su Wa1er -=--=- ==-- _:= ~.\__!\ -~~\~- --=-_\ .!i__5!1 ·t---- -~ _ i RecydcJ Wuer q II'>;· : ~55% t -1 .\''. I
.___: MoinCu~ ---- --- --:- --c:;:,:,,;-g -11-;:;~r<'.;;;~;-;; -:1.:.;,;;cc.m1ro1) \htl 4%) \33 ~%\ ' (hll.l\%) '
~r~~rc;,;~,Jt·--·c;\1;;-·--f--1;;,~~sin8- t ___1.___l_ti_ti'.~) ~-~:·~-t'-- i_IQ.!''l;_) -~ Ptncrs.s1n1t 1 l'nl..·euU\g < 1-.,ii:.i[l I
-------t-- l'~ -'~_!__ i JiJ.'7_.___) __ I_ l:!__~·1,J l ~•crage w.~, ~I, I ~ti I 3. 7 ti~ ~ I 2
4~ .~If.,
14 1 I)(,
I •I
L r
4~ ~'i.--i ---!l <l ___ J __ ~iL i 14 4 l
h~r· __ :J· <U Io
17 1 _j h.~
1 \ \j j ___ h 2 J - 1J 4
1'_.111_ f 4hll,-l'l __ ~l I i),°4~7 -~-- --------- :l_
:i_\'f.. 1 ___ l'! __ Y'-·_ 111'_Y. l'cmp l "ontn•I I Temp< ·1.-ilrol Tm1p C11n1wl
1-1~ )!~) ! \h_\0%\ (41-0'1.) l~~~~s~1ni- · ·r
1 j~·,;;__~~-ti;· 1 11n, .. ·;;\-u~~
~''~'''-l ___ 1 __ l_l7 ~'ICLl <~-11''4 l Hrui~r _ I_ ( \•1hn_ ~ . l C'oc~hnli' 1·~~·~·) -r ,,~r:L -,- 110MF I
' - ------ ___ J f j
I LOO~"!!__ _____ _. _______ ----'- --------- - - -------- -- l-:'\otcs: The daa \>ere t.aken from the l•hulat•·,l lndu<tnal Stall'll" (111,fmlry and Lan.!, Wal<'r Volume•)
a) Bu•mencs '"th f1>ur '" m••« ~mrl,>)cc< are n>Vcred. b) Swn• ue sh""'" w umt< ul 1111111''" Yen.
'.ff I•:Jti~~~l~ir-l,l_K~,<IHh -~~,Y}L_ ____ L lOl_,£_48 ___ 7,232,441
-~~84 '/ 4% 1 9% JY.9% 39.2%
l'""-•.mn11 ---- -----11;;;1.-;--- -- - p,.,;:;..-;-;,~i ----- coo1111I
<_71_~~-L _______ Q!]_!eJ __ {~~'!~L ___ <4U% ( 'mh1111 Temp Conuul CtM>l111g Temp C:onunl
_(1-1%)_ --- __(_l~:_i~)_ ___ _J_2~J___~J __(_29.7% lcmp l 'ontrnl l'rn<e&1lllM Tmtp Control l'rooa11ng
l_h __7'_Y.•)_ H _ _\___l_l:_:~~l-- ___!__1_1:_'.!__~)___ (2 U'fo) I I ,MK l I'/ 223 10211
c) (\.,st t·omr-l!lH\'l\i arc h~'eJ l'TI tlata. 1t\f N.1!1.tnt~~~t"" wnh 30 or nh\fl' t•rnployc~·\ d) The Bum1es< Rat1<>" the raun ,,f tht>te with ll) 11r more cmrh•Y•'''' m •II hu<inc'"'' wnh 4 or llh>fl' cmployt•t•• e) The .i~ust11.:s for "'atcr .:on<wnru1in uc <h""'" <1llc1 <akul•Un~ frnm the l<lk•I .lalll (hu\lnCHt'< wuh _lll ur mnw cmpluyecs)
6. Conclusions
( l l There is no panacea for achieving energy conservation in the textile manufactur
ing industry.
12) With the actu1I implementation of an c.-nergy conservation program. it is
important to grasp the current le\'el of energy consumption and its actual
.:onditions in detail. set goals I energy consumption and corresponding cost). and
achiew the goab through a company-wide effort as far as possible.
c 31 In the tex1ik manufacturing industry. it is important to thoroughly understand
that. depending on the tri:nd of the market. the company is targeting. con.'umer
requirements for the textik products to toe supplied differ. thereby urging the
implementation of energy conservation measures which arc relevant to the
production of the goods that suit the market.
14) Therefore. it is necessary to expect that. when multi-line. small-volume
production type high value-added goods are produced. energy consumption may
increase rather than decrease with production rationalizatio!l. in contrast with
mass-production type goods.
(5) When differentiated goods arc produced. the share of energy costs in the overall
production cost should he given importance rather than energy consumption.
(6) It is reasonable to consider that ultimately desired energy conservation
promoting techniques will depend on the development and practical application
of innovative technologies in each speciali1xd technical field.
51 ..