Embed Size (px)
Citation preview

1
Handbook of Experimental Game Theory
The Process of Choice in Games
Giorgio Coricelli, Luca Polonio and Alexander Vostroknutov
Abstract
This chapter is about the application of methods from psychophysics to the investigation of
experimental game theory. We show how methods from psychophysics - including the analysis
of reaction time, mouse-lab and eye-tracking, - can be used to improve our understanding of
experimental game theory. The main goal of this chapter is to provide a balanced view of the
possibilities of the process tracing approach, which is the investigation of the processes
underlying choice. In addition, this chapter aims to provide practical understanding of the
methods to enable the reader to evaluate this fast-growing literature. A secondary goal is to
provide an introduction for readers interested in designing their own psychophysics experiments.
Response Time and Strategic Choice
The study of response times (RTs) has a long history in experimental psychology going back to
Donders (1868) who was interested in measuring the time that a particular hypothetical mental
stage involved in a task can take. This was when the idea that response times can help to infer the
mental processes behind psychological phenomena took root (Luce, 1991). Since then “mental
chronometry” (Jensen, 2006) is used by psychologists together with the choice or survey data to
make inferences about the processes underlying choices or to analyze behavior under time
pressure. As it was recently put by Ariel Rubinstein (2007, 2016), measuring response time
allows us to “open the black box of decision making.” The same sentiment is shared in a
thorough review of recent experimental economics studies that use RTs (Spiliopoulos and
Ortmann, 2014).
In spite of the view that RT can be utilized not only in testing hypotheses related to the process
of choice but also in order to better understand preferences (Konovalov and Krajbich, 2016a), its
usage in experimental and behavioral economics was rather limited, if existent, until very
recently (one known exception is Wilcox (1993)). The tide started to change with the advances in
models of procedural rationality and studies of strategic sophistication and deliberation costs
2
(starting with Stahl and Wilson (1994, 1995) and Nagel (1995)), which made RT a natural
candidate for a choice characteristic that allows to uncover the details of the decision process
under the assumptions of bounded rationality. Another reason for the introduction of RT to
experimental economics is the emergence of neuroeconomics, which has brought many
psychological and neuroscientific research tools to light, including mental chronometry.
Response Time in the models of decision process in games
There are two broad classes of models which make explicit predictions about the RT of choice.
The first class is the dual-process theories (DPT, Kahneman (2003)), which assume the presence
of two decision systems: fast intuitive system and slow deliberative system. The former system
(Type 1) is useful in situations when decisions should be made instantaneously. It involves “hot”
emotional responses and has most likely evolved to make choices in rapidly changing situations.
The latter system (Type 2) is slower and “cold,” it is helpful in situations when there is no time
pressure and complex reasoning can help to make the choice.
The second class of theories comes under the titles of sequential sampling, information
accumulation or drift diffusion models (DDM, Ratcliff (1978), Smith and Ratcliff (2004),
Krajbich et al. (2015a)). Here the process of choice among several options is explicitly modeled
as a random process. The idea comes from the neurophysiological observation that neurons in
the brain are noisy and, thus, as information about the available options gets accumulated, the
probability of choice of an option becomes higher the more desirable the option is.
Mathematically this is represented by a random walk with drift and two barriers, A and B (in
case of two options). The crossing of one of the barriers by the random walk represents the time
point of making the choice (A or B). Here the drift is steeper the higher is the difference in
utilities of the two options: the bigger is the difference in utilities the faster the choice will be
made. In the models of this type it is possible to make explicit predictions about the speed-
accuracy trade-off involved in a decision. If the time of the choice is limited (exogenously or
endogenously) then the resulting choice will be fast but not very accurate. However, if the time is
not constrained, the decision will be slow and the probability of choosing the best option will be
high.
The two classes of models raise different questions and utilize different types of data. Both are
also subject to criticism. According to Keren and Schul (2009), dual-process theories are never
precisely formulated: what Type 1 and Type 2 systems are supposed to represent in any given
task is usually decided by the researcher who uses her own intuition without resorting to any
objective procedure. This can lead to far-fetched conclusions which ignore other possible
explanations. Rustichini (2008) provides an overview of pros and cons of dual-process and
unitary theories, which assume that there is only one system that makes decisions by aggregating
information available from different sources. He comes to a conclusion, similar to Keren and
Schul (2009), that one caveat of the dual-process theories is that the characteristics of the Type 1
and 2 systems change depending on the experiment (for example, in some cases Type 1 system is
impulsive and in others reactive to fear).
Drift diffusion models (DDM) are criticized for putting too much emphasis on speed-accuracy
trade-off. For example, Pennycook et al. (2016) point out that in choice situations where there is
3
conflict (for example, when stereotype is not in line with base-rate information (De Neys and
Glumicic, 2008)), the RT, if seen in the light of DDM, might be misinterpreted since RT
increases when conflict is introduced even if discriminability of the options stays the same. Thus,
RT might be modulated not only by the discriminability of the options but also by other factors.
Studies based on Dual Process Theories
One of the most cited, but at the same time, somewhat controversial studies of choice in games
that tests hypotheses based on dual-process theory is Rand et al. (2012). In this article the series
of standard one-shot Public Goods (PG) games with four players were conducted, using Amazon
Mechanical Turk, in order to establish the connection between RT and the contributions to the
public good. With the sample of 212 subjects the authors find that high contributions are
associated with low RT and low contributions with high RT (RT is measured as the time between
the appearance of the decision task on the screen and the submitted answer). In addition, if RT is
forced to be low (time pressure) then contributions tend to be high. Conversely, if RT is forced to
be high (time delay), the contributions are low. The authors conclude that cooperative behavior is
“intuitive” and that the choice to free ride takes mental effort and time.
The results of this study came under close scrutiny after its publication. Tinghög et al. (2013) and
Verkoeijen and Bouwmeester (2014) both failed to replicate the results from Rand et al. (2012).
The authors point towards aberrations with data analysis (exclusion of 50% of subjects from
analysis based on their inability to respond on time) and the presence of many uncontrolled
factors that can influence RT (for example, subjects could forget the rules of the game between
repetitions).
Another line of critique comes from experimental economics studies. Recalde et al. (2015) tested
the main conclusion of Rand et al. (2012) that generosity in Public Goods game is intuitive. The
authors used modified Public Goods games in which unique dominant strategy equilibrium is in
the interior of the action space for each player.1 They showed that, in this case, fast decision
makers’ choices are not influenced by the position of the equilibrium. This implies that for the
Public Goods games with equilibria in the lower half of the action space fast decision makers
tend to be more generous than slow ones. However, if equilibrium is in the upper half of the
action space, fast decision makers become less generous than the slow decision makers. This and
additional tests make the authors conclude that the choices of fast decision makers are best
explained by mistakes (including the prevalence of choices of the actions which are dominated
from both individual and group perspectives) and are not driven by intuitive generosity. Similar
conclusions about mistakes are reached in an experimental study that considers beauty contests
(Kocher and Sutter, 2006). Here fast decision makers are less efficient and are slower to reach
equilibrium in the repeated setting which is also attributed to higher mistake rates.2
In spite of this criticism, some other studies support the “intuitive cooperation” hypothesis.
Cappelen et al. (2016) examine response times in Dictator game (DG) with careful control over
1 For example, if the action space is between 0 and 100, then equilibrium contribution is higher than 0 and less than
100. 2 Gill and Prowse (2017) find that fast decision makers are less efficient in games. However, they also report that
“overthinking” can lead to bad choices.
4
the factors that might influence RT. In particular, the authors conduct additional tests on
swiftness of choice and cognitive ability. Swiftness is measured by the time it takes subjects to
answer three standard demographic questions. Cognitive ability is measured by a 20-item
progressive Raven test. The authors come to the conclusion that, after controlling for swiftness
and cognitive ability, the cooperators are still faster than free riders. Nielsen et al. (2014) obtain
the same result with the large scale Public Goods game and conclude that free riders act slower
than cooperators.
It should be mentioned that these two studies are not immune to the “fast decision makers make
more mistakes” critique discussed above. Moreover, the results for Dictator game should be
considered with caution: Tinghög et al. (2016) conducted large scale experiments with around
1400 subjects from three countries and did not find any differences in giving choices in Dictator
games under time pressure or cognitive load which casts doubts on the findings of Cappelen et
al. (2016).
Grimm and Mengel (2011) look at Ultimatum game (UG) where they deliberately delay the
response of the second movers by around 10 minutes (the subjects answer a questionnaire before
their response decisions). They find that after the delay there are much more accepting choices
than in standard setting. This does not per se support the intuitive cooperation hypothesis, but
rather demonstrates that rejections in UG do result from fast emotional reaction that has to be
expressed immediately after observing the choice of the proposer. In this setting, where only two
actions are available, the change in behavior can hardly be attributed to the mistakes made by
fast decision makers. These findings, thus, support the dual-process theory.
Nishi et al. (2017) extend the intuitive cooperation hypothesis in a follow-up experiment to Rand
et al. (2012) in part as a response to the criticism mentioned above. The authors put forward the
Social Heuristics Hypothesis (SHH) which postulates that people are fast at choosing options
that they use in everyday life, be they cooperative or not. In the environments where reputation
plays a role, cooperative behavior might be ubiquitous (or constitute a social norm), while selfish
choices are uncommon. To the contrary, in environments where selfishness is a norm,
cooperative choices will be considered unusual.3 Thus, from the perspective of dual-process
theory one should expect fast intuitive reaction when an action representing a norm is chosen and
slow deliberative reaction when an action which violates a norm is preferred.
Nishi et al. (2017) conduct repeated social network Public Goods experiments in the US and
India (using Amazon Mechanical Turk). First, they find that overall cooperation rate in the US is
significantly higher than in India (75% versus 44% in neutral environment and 88% versus 37%
in cooperative environment), which suggests that the common behavior is different in the two
countries (cooperation in the US and defection in India). Second, the authors show that the
negative correlation between cooperative choices and response times in the US is reversed in
India: selfish choices are made faster there. These findings directly support the SHH and, in
addition, provide evidence of the primary role of social norms in decision making. It should be
mentioned, however, that completely different interpretation of the differences between the
3 A good example of this distinction is the evidence of social and anti-social punishment reported in Herrmann et al.
(2008). In this study the authors find that in Western societies punishing free riders in repeated PG is prevalent,
while in countries like Saudi Arabia, Ukraine, Russia and Greece a non-negligible proportion of subjects use anti-
social punishment to punish cooperators. This suggests that cooperators in these societies are seen as norm breakers.

5
American and Indian data is possible if RT is considered in the light of drift diffusion models,
which we turn to in the following section.
Studies based on Drift Diffusion Models
Not many studies of strategic choice utilize DDM as the hypothesis generating theory. Drift-
diffusion models were originally used in perception studies in order to predict how the perceptual
systems in the brain discriminate between two, for example, visual, stimuli. Later these models
were adapted to studying individual choice. Many studies have demonstrated a remarkably good
fit of DDM to the binary value-based choices, in particular, the resolution of speed-accuracy
trade-off was shown to be matched very well (for example, Milosavljevic et al. (2010) fit DDM
to the value-based decision making data under time pressure). This literature is still in its infancy
and not many attempts have been made to apply DDM to strategic situations.
Nevertheless, Krajbich et al. (2015b) used DDM in the attempt to clarify the connection between
RT and choices in Dictator and Public Goods games. In part, their goal was to show that the
conclusions about RT in strategic environments made under the assumptions of dual-process
theories should be taken with caution. They conducted several experiments to show that reverse
inference results, which label, say, cooperative behavior as intuitive based on short RT, might be
an artifact of the experimental design. Their argument, derived from DDM, involves the notion
of discriminability: the less is the difference in utilities from the available options, the longer the
choice process will take. Krajbich et al. (2015b) conducted an experiment where subjects were
presented with a series of mini Dictator games that varied in the amount of money that a subject
should have sacrificed in order to increase the payoff of the receiver. To estimate the difference
of the values derived from the choices, the authors fitted inequality averse utility function to the
choices of each subject. It follows directly from DDM that pro-social subjects should make their
preferred choice (more money to the receiver) quicker than the selfish choice. The opposite holds
for selfish subjects: they should make their preferred selfish choice quicker. The data of Krajbich
et al. (2015b) support DDM predictions: the correlation of the RT with the pro-social choice has
opposite signs for pro-social and selfish subjects. Thus, in an experiment, where RT for choosing
selfish or pro-social actions are compared, the faster RT will be found for the action which is
chosen more often. For example, if there are more selfish than pro-social subjects in the
experiment, the selfish choice will have shorter RT and vice versa.
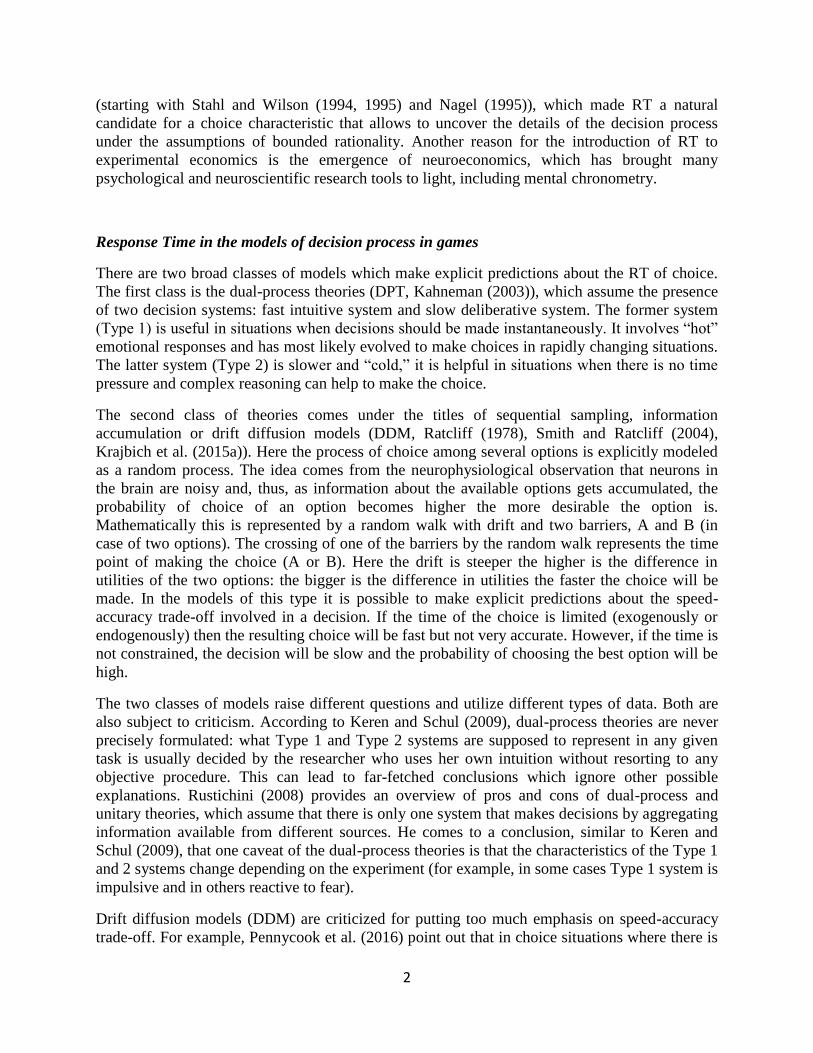
Krajbich et al. (2015b) use this intuition to revisit the results of Rand et al. (2012). They run the
same public goods experiment, but consider three levels of the marginal per capita return from
the public good. Figure 1 presents the results. The authors demonstrate that with the low return
the selfish option is faster than the cooperative one, whereas with high return the cooperative
option is faster (as in Rand et al. (2012)).
6
Figure 1. Average contributions to public good in three experiments with different marginal per capita returns
(MPCR = 0.3, 0.5 and 0.9). Consistent with DDM, in low return condition fast contributions are lower than slow
ones (two-sided t-test, p = 0.00001), while in the high return condition fast contributions are larger than slow ones
(two-sided t-test, p = 0.03). Taken from Krajbich et al. (2015b), Figure 4.
Thus, Krajbich et al. (2015b) conclude that, in line with DDM, the distance in utilities of the two
options and the composition of the subject pool determine which type of action is faster: if a lot
of monetary units should be forgone in order to increase group payoff, selfish choices will be
faster as selfish subjects will find it easier to make such choice. On the contrary, if few monetary
units should be forgone to increase group welfare, pro-social action will be faster since it will be
simpler for pro-social subjects to choose.
Finally, DDM interpretation of the data might also explain the difference in RT observed in
Nishi et al. (2017) discussed in the previous section. Indian population seems to have more
selfish types than American population, thus, according to the argument above, one should
expect faster RT for selfish action in India and faster RT for pro-social action in the US, exactly
what was found in Nishi et al. (2017).
Studies based on Response Competition Dual-Process Theories
Some researchers point out that, as much as the DPT critique of Krajbich et al. (2015b) is on
target, it completely ignores the diversity of models and approaches in DPT literature and, thus,
the results of Krajbich et al. (2015b) should not be taken as an ultimate falsification of DPT. In
particular, the arguments of Krajbich et al. (2015b) go against the (inverse inference) practice of
labeling fast RT choices as intuitive and slow RT choices as deliberative. However, as
Pennycook et al. (2016) observe, there exist other types of DPT which are not at all concerned
7
with the intuition-deliberation dichotomy. Much attention has been paid to the idea of the
competition or conflict between two systems for the “right” to make a choice.4 For example, in
base-rate problems a conflict is artificially created between the overwhelming information that
someone, say Paul, is a nurse and his stereotypical look of a doctor. In these studies (e.g., De
Neys and Glumicic, 2008) it is shown that, in guessing who Paul actually is, the majority of
subjects go with the stereotype and that the RT in the problems with conflict is longer than in the
problems without it no matter what action is eventually chosen. Response Competition DPT give
an answer to the question of why RTs are longer: the conflict between two systems causes the
Type 2 deliberative processing.
This type of effects on RT is not necessarily inconsistent with DDM. The idea of conflict
between options is investigated in at least two studies which involve strategic interactions. Evans
et al. (2015) conducted several experiments with one-shot Prisoner’s Dilemma (PD) and repeated
PG games. They found that RTs follow the inverted-U pattern. Namely, extremely selfish and
extremely cooperative choices were fast, whereas choices in between the two extremes were
slow. In addition, unlike in Rand et al. (2012), this effect did not disappear with repetition.
Response competition DPT explains these results as a consequence of a conflict between a
system that advocates selfish choice and the one that prescribes cooperation. When one of the
two systems is dominating the conflict is quickly resolved, while it takes longer time for the
resolution when the two systems are of comparable strength. Furthermore, these findings are
exactly in line with the Krajbich et al. (2015b) argument which stipulates that subjects with
extreme preferences for either selfishness or pro-sociality should make decisions faster than
those with intermediate preferences.
Similar results are reported by Piovesan and Wengström (2009). The authors measure RTs in a
sequence of mini Dictator games played by each subject. The DGs varied in the degree of
inequality of the allocations and whether Dictator was “rich” or “poor” (Dictator was getting
more or less than receiver). The authors found that RT was correlated with the “social
complexity” of the choice: selfish choices were reached faster than choices that necessitated
social considerations.5 In addition, it took poor subjects longer to reach the decision than rich
subjects, which suggests the involvement of envy in the decisions. All this taken together
supports the conflict resolution hypothesis of longer RTs.
Inferences using Reaction Time
The studies mentioned up to this point were mostly concerned with the consistency of theoretical
accounts with observed data. There is, however, a growing literature where an attempt is made to
use RTs as signals of decision makers’ characteristics. These studies can be divided into two
categories: 1) RTs are used by experimenters to infer subjects’ preferences; 2) RTs are used by
subjects to infer others’ motives or as signals revealing private information.
4 This strand of literature is remarkably close in flavor to the unitary system view discussed above. Rustichini (2008)
argues that the resolution of the conflict between dual and unitary theories may lie in their synthesis. 5 Similar results were obtained by Suter and Hertwig (2011) who studied moral judgment: there were more
deontological than consequentialist choices under time pressure, which in the strategic settings correspond to selfish
and social behavior.
8
In the first category are the studies by Rubinstein (2007, 2013, 2016) who used the unique
dataset with tens of thousands of observations obtained from http://gametheory.tau.ac.il. It was
used to create a typology of subjects using their RTs in 10 games. Later, the predictive power of
this typology was investigated on a set of unrelated games. First, a very large number of
anonymous observations (2 to 13 thousand subjects in each game) from
http://gametheory.tau.ac.il were used to measure the mean RTs of the actions taken in the 10
games (8 normal form games and two extensive form: Ultimatum and Centipede). The RTs then
were divided into two categories: below median and above median. The actions with below
median mean RTs were labeled instinctive and the ones with above median mean RTs
contemplative (notice that the procedure is completely objective and does not involve any ad hoc
assumptions). Next, a series of experiments was conducted where subjects played the same 10
games. The Contemplation Index (CI) for each subject was calculated as a proportion of games
in which a subject took a contemplative action. It was then demonstrated that, in a set of
unrelated games, there was a correlation between action choices and CI of the subjects even
when the mean RTs of the choices where not significantly different. This shows that the division
of the subjects in accordance with their choosing instinctive or contemplative actions can predict
their choices in unrelated games.
In another study Konovalov and Krajbich (2016b) use RT information to infer subjects’
individual preferences. The authors use the insight from DDM that difficult choices (low
discriminability) should be slower than easy choices (high discriminability). To validate this
premise they collected data in three choice experiments including the one with a sequence of
mini Dictator games with varying payoff allocations (akin to Piovesan and Wengström (2009)).
From the data, the utility function parameters were first estimated for each subject (in case of
DG, the parameters of the inequality averse utility function). Then, for each choice task of each
subject, the difference between the utility parameter of the subject and the parameter which
would make the utilities of the options the same was calculated and treated as a measure of task
complexity for that subject: if the absolute difference was small the task was deemed
complicated; if the absolute difference was large, the task was considered easy. The authors
showed that the difficulty of the tasks measured in this way was strongly correlated with the RT:
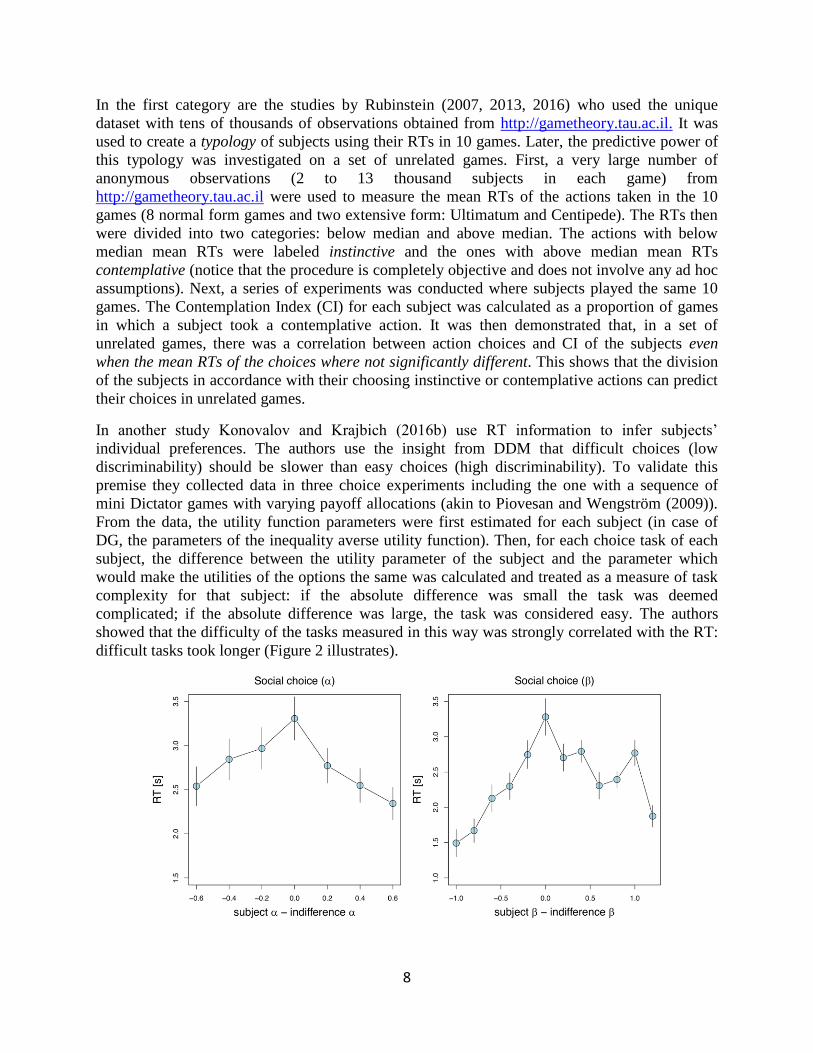
difficult tasks took longer (Figure 2 illustrates).
9
Figure 2. Subjects made 120 choices in a series of mini Dictator games with two options. The inequality averse
social preferences parameters α and β were estimated for each subject (Fehr and Schmidt, 1999), where α
parametrizes the disutility from disadvantageous inequality and β the disutility from advantageous inequality. After
that, indifference α and β were calculated for each game, or, in other words, α and β that made the utility from both
options the same. For each game and a particular choice, the absolute difference between subject’s parameters and
the indifference parameters was taken as a measure of the choice complexity. The graphs demonstrate that RT
increases as the subjects’ preferences get closer to indifference. Taken from Konovalov and Krajbich (2016b),
Figure 2.
In the next step, the authors demonstrated that information about RT can be successfully used to
deduce preferences even with very little data. They showed that the utility parameter inferred
from a single choice and RT was a good predictor of the subsequent choices. In addition, RTs
allowed for the identification of preferences from choice tasks where the majority or all subjects
chose the same option. Overall, this study demonstrates the great potential of using RTs in
decision making experiments.
Two studies utilize RTs in order to test the hypothesis that subjects are able to use information
that RTs convey about other players’ unobserved preferences or private information. Frydman
and Krajbich (2016) investigate choices in a classical information cascade task in two conditions,
with and without subjects’ observing RT of the previous player. The authors make two important
observations: 1) from the perspective of DDM, RTs in information cascade do deliver additional
information about the private signal of a player when her choice is in line with the cascade’s
history of choices; 2) subjects in the experiment are able to use this information contained in RT
to correctly infer the private signal. The first observation builds upon the following argument.
Conditional on player’s choice to be in line with the majority, when her private signal is
congruent with the previous choices, the decision is easy and should be made quickly. When,
however, the private signal is incongruent, the choice is hard and should take longer. Therefore,
RT reveals information about the private signal. The authors showed that the subjects could
extract this information from the RT and change their own choices accordingly.
Evans and van de Calseyde (2017) follow one of the studies discussed above (Evans et al., 2015)
and investigate what kind of information about others subjects are able to infer from observing
RTs. The authors use the data previously collected in a PG game experiment to tell subjects the
RTs of choices and then ask them to evaluate the motives of the players on several Lickert
scales. They find that short RTs are associated in subjects’ minds with the extreme choices,
either full or zero contribution, and long RTs with intermediate contributions. This is in line with
the actual behavior reported in Evans et al. (2015). More interestingly, when the subjects were
told that the players in the actual PG game were exogenously time constrained, the responses
became mixed without any clear pattern. These findings indicate that RTs, when unconstrained,
can be informative about the incentives and the choice process of others in social dilemmas.

10
Eye and Mouse Movements Data in Strategic Interaction
Visual attention in eye-tracking and mouse-lab paradigms
The primary purpose of the visual process is to derive meaning from the world in order to direct
our actions. This is a dynamic process that is computed by the brain through the visual system
and in which attention plays a crucial role. According to Duchowski (2007), attention involves a
cyclical procedure composed of different stages. In a situation in which a stimulus such as an
image is observed by a person for the first time, attention is usually driven by the characteristic
of the visual scene. This is called bottom-up attention, in which an individual starts observing the
entire scene through a low resolution peripheral vision while the important elements of the scene
are captured in the field of view. In the first stage, the features that are considered interesting are
selected for a subsequent, deeper analysis. A second stage includes the disengagement of the
attention from the less attractive elements and the repositioning of the eyes to capture the stimuli
that most attracted the attention (selective attention). Finally, when the fovea is repositioned to
the area that most attracted the attention, all the features of these regions of interest can be
inspected at high resolution. This is a bottom-up model of visual attention that does not take into
account the situations where the eye movements are guided by the voluntary intention to capture
or attend to a specific part of the scene. In this regard, Yarbus (1967) highlighted the role of top-
down factors in modulating the eye movement patterns used by the observer to acquire
information from a scene. When a stimulus, such as an image, is observed by a person for the
first time, the eye movements should be driven by bottom-up processes. Conversely, top-down
factors should have a prominent role in modulating the patterns of eye-movement as soon as the
individual becomes more familiar with the stimulus.
The fact that attention can be mediated by bottom-up or top-down mechanisms has important
implications for the interpretation of the process data because an observed information search
pattern may be the result of a predetermined information search strategy (top-down analysis) or
mainly determined by some features of the visual scene (bottom-up analysis). In eye-tracking
experiments, the characteristics of the task and of the decision maker may significantly affect
how attention is allocated in a visual scene. For example, a bottom-up analysis may be promoted
by the presence of attractors or focal points (Devetag et al., 2016). Conversely, the adoption of
routines may promote a more stable and systematic visual analysis.
In classical mouse-lab experiments, features of the scene like focal points and attractors cannot
drive attention because the information (presented on a computer screen) is hidden in opaque
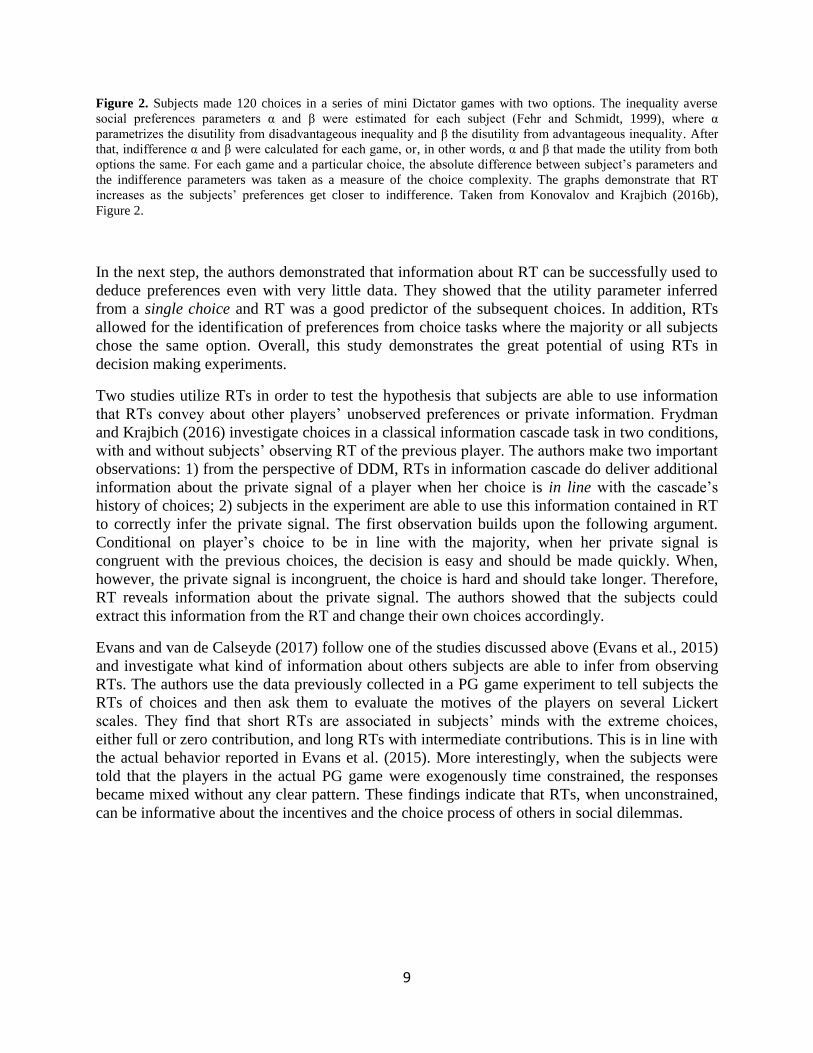
boxes and can be revealed only using the mouse pointer (Figure 3). The way information is
revealed in a typical mouse-lab study can be set by the experimenter and varies depending on the
type of task and the object of study. For example, information can be revealed 1) when the
pointer is moved into the box, 2) when the pointer is moved into the box and the left button of
the mouse is pressed, or 3) when the pointer is moved into the box and the left button is held
down. Mouse-lab techniques can provide high-resolution temporal data about the location of the
pointer (in terms of pixels) and many other analysis metrics such as the number of times a certain
box is opened and for how long. Additionally, more advanced mouse-tracking techniques can
retrace the mouse’s trajectories, examine velocity and acceleration.6 In general, using a mouse-
6 Velocity and acceleration are indexes of the degree of response competition at different time points (Hehman et al.
2015).
11
lab paradigm a researcher can understand how, when, and which information is processed by the
participant, and how the decision processes evolve over time.
Figure 3: Mouse-lab screenshot of a two by two one-shot game. Adapted from Spiliopoulos et al. (2015). In this
example, participants (the row players called “You”) can see the payoffs by moving the cursor over the boxes. The
payoffs of the participants (“your points”) are located in the two left-most columns. The payoffs of the counterpart
(“her/his points”) in the two right-most columns. It is possible for the participant to have only one box open at a
time. Once the participant move the cursor outside the opaque area, the box closes automatically.
However, some studies have pointed out that mouse-lab paradigm may itself have an effect on
the information search process (Billings & Marcus, 1983; Maule, 1994; Lohse and Johnson
1996; Glöckner and Betsch, 2008; Franco-Watkins and Johnson, 2011). For example, attention
cannot be affected by peripheral information and the way it is allocated in a given visual scene is
largely based on top-down processes. Glöckner and Betsch (2008) argue that this research
method, in some cases, promotes deliberation and prevents the activation of automatic decision-
making processes. Moreover, the mouse-lab method significantly increases the amount of time
needed to acquire information compared to the eye-tracking method. In eye-tracking paradigms a
participant can acquire information in a more natural way, whereas in mouse-lab paradigms the
participant is induced to be engaged in a serial consideration of information. Unfortunately, the
use of eye-tracking apparatus is usually costly and the data collection is limited to one participant
at a time, which makes mouse-lab a viable alternative despite its drawbacks.
Eye-tracking system
The eye-tracking system measures the point of gaze (where a subject is looking) and the motion
of one or both eyes relative to the head position. The standard sampling rate of an eye-tracker
varies from a minimum of 60 Hz, to a maximum of 2000 Hz. Modern eye-trackers identify eye-
12
movements and gaze locations by using the contrast between the center of the pupil and the iris.
Moreover, they can create a corneal reflection using an infrared non-collimated light. The system
creates a vector using these two features and, after a calibration procedure, computes gaze
intersection with a surface.
Common analysis metrics include fixations location and their duration, saccades directions,
velocities and amplitudes, smooth pursuit and transitions-based parameters between fixations
and/or region of interest. Eye-tracking systems also allow to measure how much pupils dilate
(expand in width and area). Fixations and saccades are excellent measures of visual attention and
expressed interest. During fixations, the eyes extract information from the visual scene for
further processing. During saccades, visual perception is suppressed (Matin, 1974); however,
differences in speed and accuracy of the eye saccades can affect the amount and the quality of
information processed. Smooth pursuit eye movements allow the eyes to keep the visual
projection of a moving object continuously on the center of the fovea.
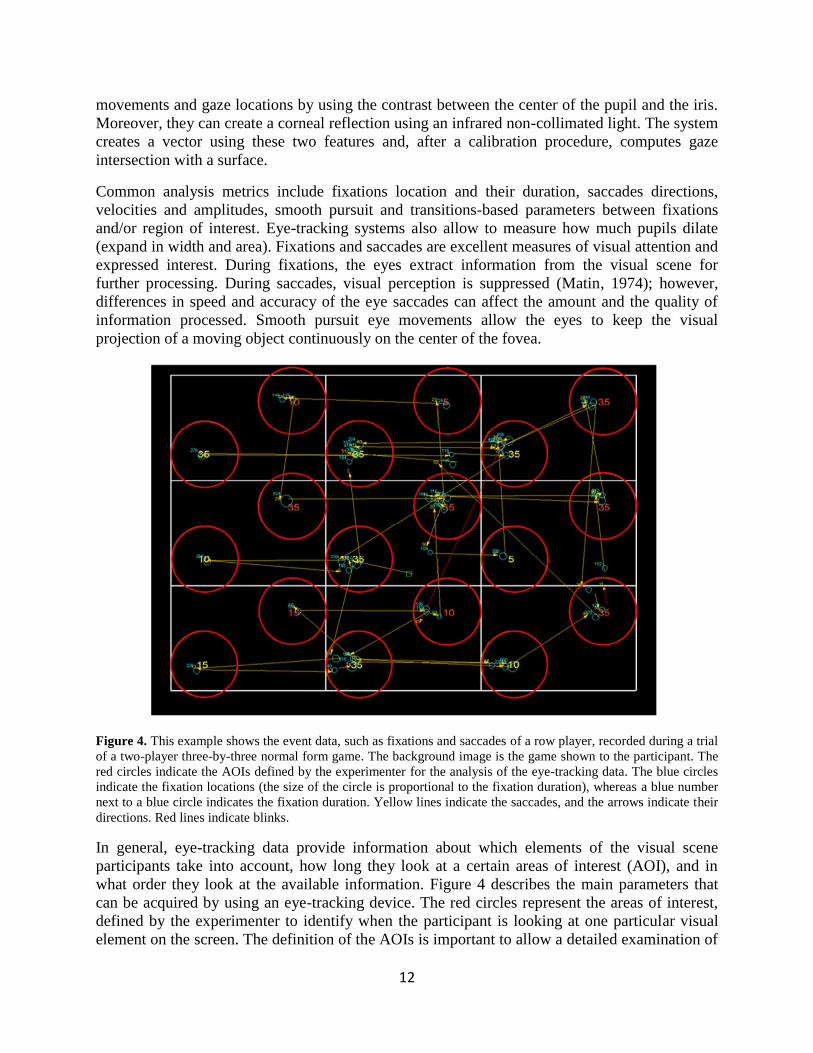
Figure 4. This example shows the event data, such as fixations and saccades of a row player, recorded during a trial
of a two-player three-by-three normal form game. The background image is the game shown to the participant. The
red circles indicate the AOIs defined by the experimenter for the analysis of the eye-tracking data. The blue circles
indicate the fixation locations (the size of the circle is proportional to the fixation duration), whereas a blue number
next to a blue circle indicates the fixation duration. Yellow lines indicate the saccades, and the arrows indicate their
directions. Red lines indicate blinks.
In general, eye-tracking data provide information about which elements of the visual scene
participants take into account, how long they look at a certain areas of interest (AOI), and in
what order they look at the available information. Figure 4 describes the main parameters that
can be acquired by using an eye-tracking device. The red circles represent the areas of interest,
defined by the experimenter to identify when the participant is looking at one particular visual
element on the screen. The definition of the AOIs is important to allow a detailed examination of
13
events data such as fixations and saccades (represented by blue circles and yellow lines
respectively). AOIs are subregions of the displayed stimuli that can be used to understand
whether a respondent is acquiring certain information. They can also be used to measure how
much time passed from stimulus onset until respondents looked into the region (time to first
fixation), how much time the respondents spent in the region, how many fixations they had, and
the number of times the respondents returned to look at that area (number of runs). It is also
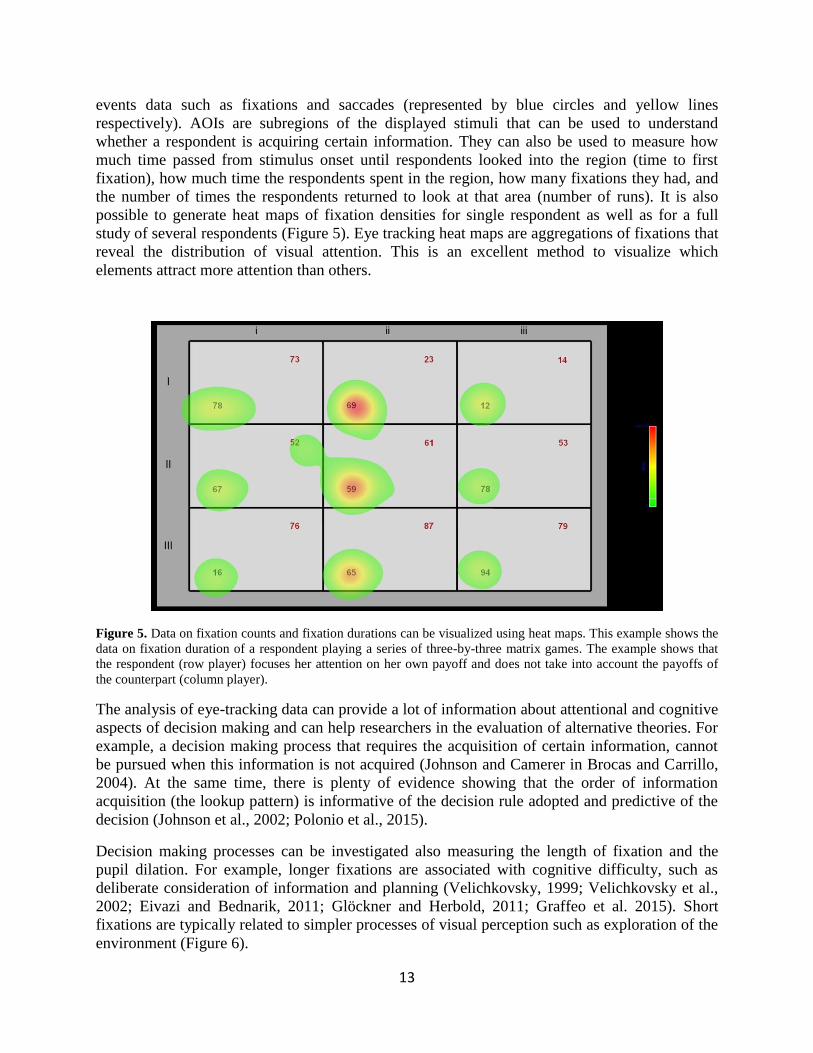
possible to generate heat maps of fixation densities for single respondent as well as for a full
study of several respondents (Figure 5). Eye tracking heat maps are aggregations of fixations that
reveal the distribution of visual attention. This is an excellent method to visualize which
elements attract more attention than others.
Figure 5. Data on fixation counts and fixation durations can be visualized using heat maps. This example shows the
data on fixation duration of a respondent playing a series of three-by-three matrix games. The example shows that
the respondent (row player) focuses her attention on her own payoff and does not take into account the payoffs of
the counterpart (column player).
The analysis of eye-tracking data can provide a lot of information about attentional and cognitive
aspects of decision making and can help researchers in the evaluation of alternative theories. For
example, a decision making process that requires the acquisition of certain information, cannot
be pursued when this information is not acquired (Johnson and Camerer in Brocas and Carrillo,
2004). At the same time, there is plenty of evidence showing that the order of information
acquisition (the lookup pattern) is informative of the decision rule adopted and predictive of the
decision (Johnson et al., 2002; Polonio et al., 2015).
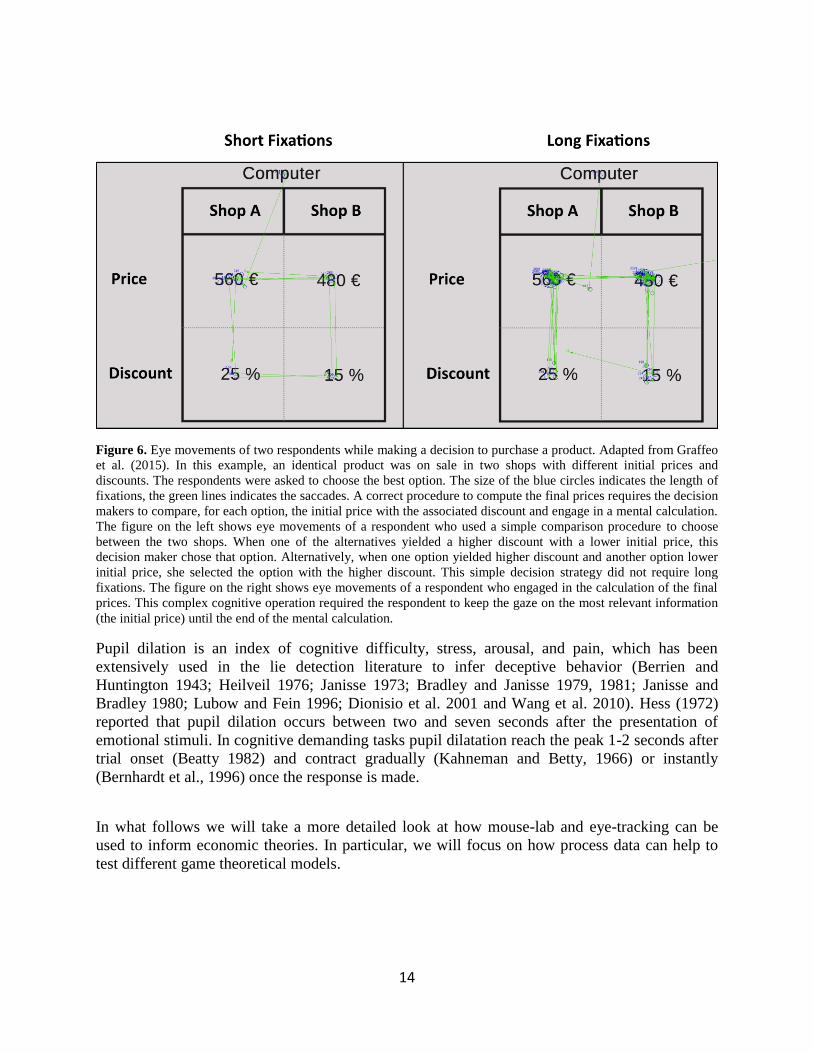
Decision making processes can be investigated also measuring the length of fixation and the
pupil dilation. For example, longer fixations are associated with cognitive difficulty, such as
deliberate consideration of information and planning (Velichkovsky, 1999; Velichkovsky et al.,
2002; Eivazi and Bednarik, 2011; Glöckner and Herbold, 2011; Graffeo et al. 2015). Short
fixations are typically related to simpler processes of visual perception such as exploration of the
environment (Figure 6).
14
Figure 6. Eye movements of two respondents while making a decision to purchase a product. Adapted from Graffeo
et al. (2015). In this example, an identical product was on sale in two shops with different initial prices and
discounts. The respondents were asked to choose the best option. The size of the blue circles indicates the length of
fixations, the green lines indicates the saccades. A correct procedure to compute the final prices requires the decision
makers to compare, for each option, the initial price with the associated discount and engage in a mental calculation.
The figure on the left shows eye movements of a respondent who used a simple comparison procedure to choose
between the two shops. When one of the alternatives yielded a higher discount with a lower initial price, this
decision maker chose that option. Alternatively, when one option yielded higher discount and another option lower
initial price, she selected the option with the higher discount. This simple decision strategy did not require long
fixations. The figure on the right shows eye movements of a respondent who engaged in the calculation of the final
prices. This complex cognitive operation required the respondent to keep the gaze on the most relevant information
(the initial price) until the end of the mental calculation.
Pupil dilation is an index of cognitive difficulty, stress, arousal, and pain, which has been
extensively used in the lie detection literature to infer deceptive behavior (Berrien and
Huntington 1943; Heilveil 1976; Janisse 1973; Bradley and Janisse 1979, 1981; Janisse and
Bradley 1980; Lubow and Fein 1996; Dionisio et al. 2001 and Wang et al. 2010). Hess (1972)
reported that pupil dilation occurs between two and seven seconds after the presentation of
emotional stimuli. In cognitive demanding tasks pupil dilatation reach the peak 1-2 seconds after
trial onset (Beatty 1982) and contract gradually (Kahneman and Betty, 1966) or instantly
(Bernhardt et al., 1996) once the response is made.
In what follows we will take a more detailed look at how mouse-lab and eye-tracking can be
used to inform economic theories. In particular, we will focus on how process data can help to
test different game theoretical models.

15
The relevance of process data in the evaluation of different theories
A fundamental question in game theory is to understand why sometimes players deviate from
equilibrium strategies, especially in those situations where players do not have clear precedents
(one-shot games). In this regard, many theories of bounded rationality were developed in the
attempt to provide more accurate predictions of players’ behavior than those provided by
equilibrium analysis alone. Recently, some studies have begun to evaluate those theories by
combining information about process data with observed choices. The advantage of using
process data is clear since bounded rationality theories make precise assumptions about
processes or factors that lead to out of equilibrium decisions. For example, McKelvey and
Palfrey’s (1995) Quantal Response Equilibrium (QRE) relaxes optimization, but maintains the
assumption of correct beliefs. The model assumes that players form accurate beliefs about the
expected action of their opponent, but best responses are not played with certainty because
players respond noisily to expected payoffs.7 Similarly, in cursed equilibrium (CE), it is assumed
that players are able to estimate the distribution of actions chosen by other players, but
sometimes deviate from equilibrium because they do not fully take into account the correlation
between others’ decisions and private information (Eyster and Rabin, 2005). The validity of the
assumptions of these two theories can be tested in terms of information acquisition. For example,
it can be tested whether players are able to acquire all the relevant information necessary to form
(accurate) beliefs about the expected actions of other players or to estimate the distribution of
actions chosen by others.
Other bounded rationality models of strategic behavior like Level-k (Crawford, 2003; Nagel,
1995; Stahl and Wilson, 1994, 1995) and Cognitive Hierarchy (Camerer et al., 2004; Ho et al.,
1998) explain out-of-equilibrium outcomes by assuming that individuals perform different and
limited levels of iterative strategic thinking due to limited cognitive capacities. In terms of
information acquisition, one may expect that agents do not play equilibrium because they fail to
process relevant information. Hence, to test these theories one should verify whether players
exhibit information search patterns that are consistent with their Level-k.
A rather different picture is that proposed by the theories of social preferences. According to
these theories, deviations from equilibrium are based on a different definition of decision utility.
They reject the assumption that a person’s behavior reflects only the maximization of her own
utility and promote the relevance of competing motives such as altruism, reciprocity, and
inequity aversion (Fehr and Camerer 2007).8 To be supported by process data, theories of social
preferences require that the information acquired by a player reflects her social motive. For
example, a player motivated by fairness should look at the payoffs of others, regardless of
whether these payoffs are strategically relevant or not.
Process data and backward induction
Equilibrium predictions made by game theoretic models of sequential bargaining are typically
not supported by experimental results (Ochs and Roth, 1989). In the literature, there are two
7 QRE is also called trembling hand effect because people would commit errors in the decision phase. 8 In some cases also competition and punishment.
16
possible explanations of this phenomenon: the first is that players deviate from equilibrium
because of their limited cognition and the second is that players are inequity averse or want to
reciprocate cooperation. These two alternative hypotheses were tested by Camerer et al. (1993)
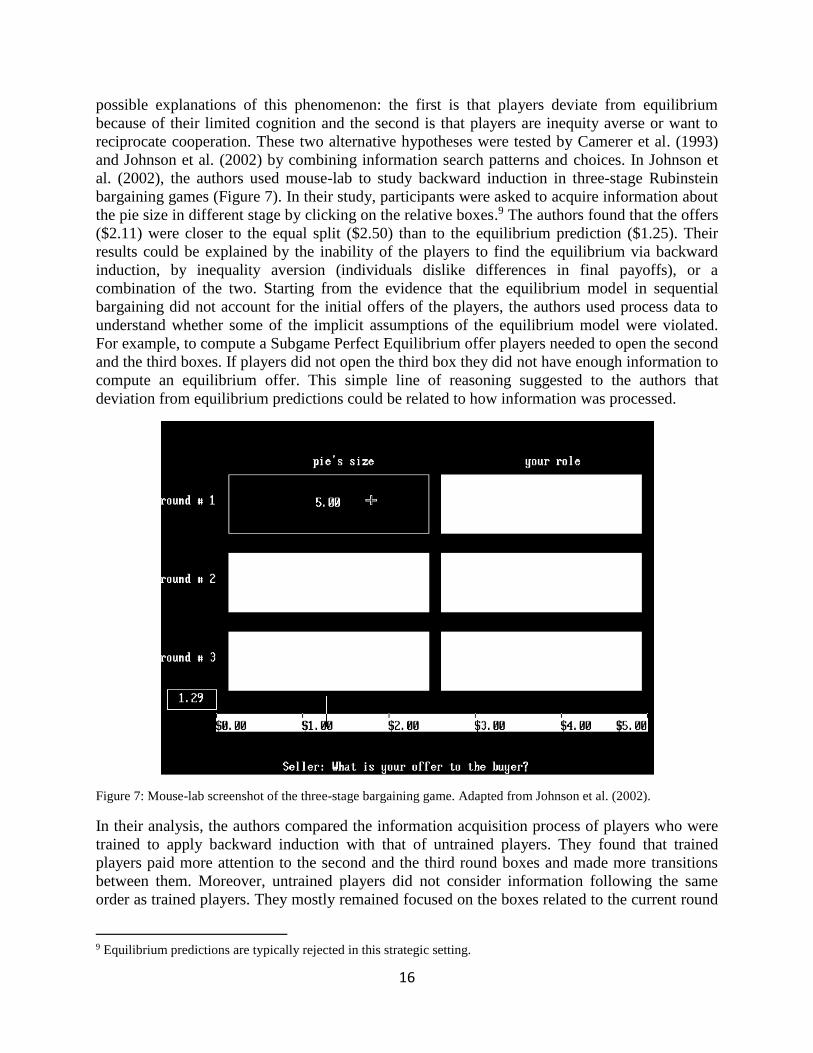
and Johnson et al. (2002) by combining information search patterns and choices. In Johnson et
al. (2002), the authors used mouse-lab to study backward induction in three-stage Rubinstein
bargaining games (Figure 7). In their study, participants were asked to acquire information about
the pie size in different stage by clicking on the relative boxes.9 The authors found that the offers
($2.11) were closer to the equal split ($2.50) than to the equilibrium prediction ($1.25). Their
results could be explained by the inability of the players to find the equilibrium via backward
induction, by inequality aversion (individuals dislike differences in final payoffs), or a
combination of the two. Starting from the evidence that the equilibrium model in sequential
bargaining did not account for the initial offers of the players, the authors used process data to
understand whether some of the implicit assumptions of the equilibrium model were violated.
For example, to compute a Subgame Perfect Equilibrium offer players needed to open the second
and the third boxes. If players did not open the third box they did not have enough information to
compute an equilibrium offer. This simple line of reasoning suggested to the authors that
deviation from equilibrium predictions could be related to how information was processed.
Figure 7: Mouse-lab screenshot of the three-stage bargaining game. Adapted from Johnson et al. (2002).
In their analysis, the authors compared the information acquisition process of players who were
trained to apply backward induction with that of untrained players. They found that trained
players paid more attention to the second and the third round boxes and made more transitions
between them. Moreover, untrained players did not consider information following the same
order as trained players. They mostly remained focused on the boxes related to the current round
9 Equilibrium predictions are typically rejected in this strategic setting.

17
and did not pay sufficient attention to information about the subsequent rounds (for example,
they did not open the second and the third-round boxes 19% and 10% of the times respectively).
These results show that the search pattern of untrained players differs from the one expected for
players who apply backward induction.
To test whether players’ behavior is better explained by limited cognition or inequity aversion,
Johnson et al. (2002) classified players into different types based on their search patterns and
tested whether there was correspondence between how players allocate attention and the decision
rule adopted. The authors made the following predictions: they expected Level-0 players to
remain focused on the first-round boxes, ignoring future rounds. Level-1 players to look one
round ahead and open the second-round boxes. Equilibrium players to open the third-round
boxes and allocate their attention mostly to the second and third-round boxes. The authors found
that the average offers for each type of players was close to that predicted by the Level-k model.
In particular, they found that the average offers of players classified as Level-0 ($2.07) were
significantly higher than those of players classified as Level-1 ($1.71) and that the average offers
of players classified as Level-2 ($1.44) were significantly lower than those of players classified
as Level-1. Importantly, theories of social preferences could not explain these results.
Process data and heterogeneity in strategic sophistication
Results obtained by Camerer et al. (1993) and Johnson et al. (2002) suggest that heterogeneity in
search patterns leads to heterogeneity in players’ choices. This link was also stressed in a mouse-
lab experiment conducted by Costa-Gomes et al. (2001) to study strategic sophistication in one-
shot normal form games (Figure 8). The authors tested the cognitive implications of alternative
models of choice combining choice data and patterns of information search. To explain the
behavior (choices and search patterns) of their players, they specified a priori nine possible types
of players. Four of their types were non-strategic (or alternatively had diffused beliefs) since they
did not require to consider the incentives of the counterpart to predict their decisions. Five of
their types were strategic and required both the formation of beliefs about the expected action of
the counterpart and to best respond to them. The authors assumed that each player’s type first
decides which information search strategy to adopt, and then the information search strategy and
the player’s type both determine the final decision. To describe the link between the decision
process and the choice, they associated each decision type with one (or more than one) search
pattern(s). Despite the fact that they found heterogeneity in both players’ behavior and lookup
patterns, the authors observed that most of their participants exhibited lookups and choices
consistent with the level-k model. They found that about two-thirds of their participants
exhibited action choices and lookups patterns that were consistent with Level-1 or Level-2
models. The Dominance-1 model explained the behavior (choices and lookup patterns) of most
of the remaining participants.10
Mouse-tracking was used also by Costa-Gomes and Crawford (2006) in a study where they
elicited players’ initial responses to a series of two-persons guessing games. Similarly to Costa-
10 Dominance-1 players assign equal probability to the opponent’s undominated actions and zero probability to the
remaining dominated ones.

18
Gomes et al. (2001), they identified different types of players using an econometric analysis and
found that deviation from equilibrium could be predicted and explained assuming a hierarchy of
boundedly rational types.
Figure 8: Mouse-lab screenshot of a two by two one-shot game. Adapted from Costa Gomes et al. (2001). In this
example, participants (the row players called “You”) could see the payoffs one-by-one by left-clicking the mouse
cursor in correspondence to the gray boxes. It was possible for the participant to have only one box open at a time.
To open a new box or enter the decision, the participant had to close the open box by right-clicking the mouse
cursor.
Process data in games with private information
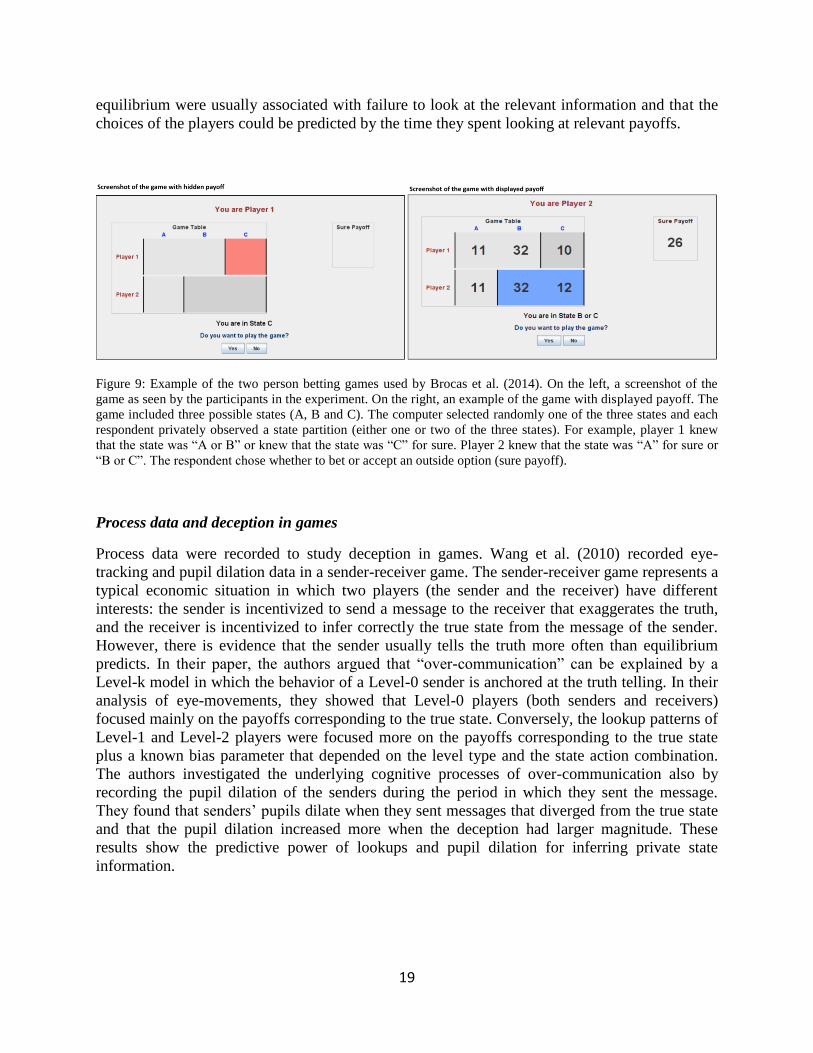
Brocas et al. (2014) investigated the link between information search and decision strategy in
games with private information. The authors used mouse-lab to study strategic thinking in two-
person betting games with three states and two-sided private information (Figure 9). They were
interested in testing the predictions of two different classes of models. The first class includes
models which predict that a player fully analyze the game but make imperfect inferences about
the other player’s action or believe that the counterpart made imperfect inferences about his/her
own action (models of this type include the Quantal Response Equilibrium, the Cursed
Equilibrium, and the Analogy-Based Expectation Equilibrium). The second class of models
assumes that players sometimes have imperfect attention and ignore relevant information
because of their bounded rationality (like in Level-k and Cognitive Hierarchy theories).
The authors used a mixed model cluster analysis to group participants according to their lookup
patterns and choices. They found three clusters which approximately corresponded to Level-3,
Level-2 and Level-1 players and a fourth cluster which included players who fully analyzed the
game but made inferential mistakes. More generally, they found that deviations from Nash
19
equilibrium were usually associated with failure to look at the relevant information and that the
choices of the players could be predicted by the time they spent looking at relevant payoffs.
Figure 9: Example of the two person betting games used by Brocas et al. (2014). On the left, a screenshot of the
game as seen by the participants in the experiment. On the right, an example of the game with displayed payoff. The
game included three possible states (A, B and C). The computer selected randomly one of the three states and each
respondent privately observed a state partition (either one or two of the three states). For example, player 1 knew
that the state was “A or B” or knew that the state was “C” for sure. Player 2 knew that the state was “A” for sure or
“B or C”. The respondent chose whether to bet or accept an outside option (sure payoff).
Process data and deception in games
Process data were recorded to study deception in games. Wang et al. (2010) recorded eye-
tracking and pupil dilation data in a sender-receiver game. The sender-receiver game represents a
typical economic situation in which two players (the sender and the receiver) have different
interests: the sender is incentivized to send a message to the receiver that exaggerates the truth,
and the receiver is incentivized to infer correctly the true state from the message of the sender.
However, there is evidence that the sender usually tells the truth more often than equilibrium
predicts. In their paper, the authors argued that “over-communication” can be explained by a
Level-k model in which the behavior of a Level-0 sender is anchored at the truth telling. In their
analysis of eye-movements, they showed that Level-0 players (both senders and receivers)
focused mainly on the payoffs corresponding to the true state. Conversely, the lookup patterns of
Level-1 and Level-2 players were focused more on the payoffs corresponding to the true state
plus a known bias parameter that depended on the level type and the state action combination.
The authors investigated the underlying cognitive processes of over-communication also by
recording the pupil dilation of the senders during the period in which they sent the message.
They found that senders’ pupils dilate when they sent messages that diverged from the true state
and that the pupil dilation increased more when the deception had larger magnitude. These
results show the predictive power of lookups and pupil dilation for inferring private state
information.
20
Process data and social preferences
The studies described up to now show how process data can be used to characterize players in
terms of their ability to do different steps of iterative strategic thinking. Jiang et al. (2014)
showed that, in certain strategic contexts, process data can be used also to characterize the social
preference of players. The authors started from the assumption that if an individual is motivated
by a certain social preference, the way in which information is acquired should reveal that social
preference. In their study, eye movements were recorded while participants played a simple
three-person (dictator) distribution game. The choices in the game could be characterized
according to three different types of social motives: efficiency (maximize the sum of the
payoffs), maxi-min (maximize the minimum payoff) and envy (minimize the difference between
the highest payoff of a player and the payoff of the dictator player). Their participants performed
a preference based decision making task in which they were free to adopt the decision strategy
they prefer. Then, they performed a second task in which they were instructed and incentivized
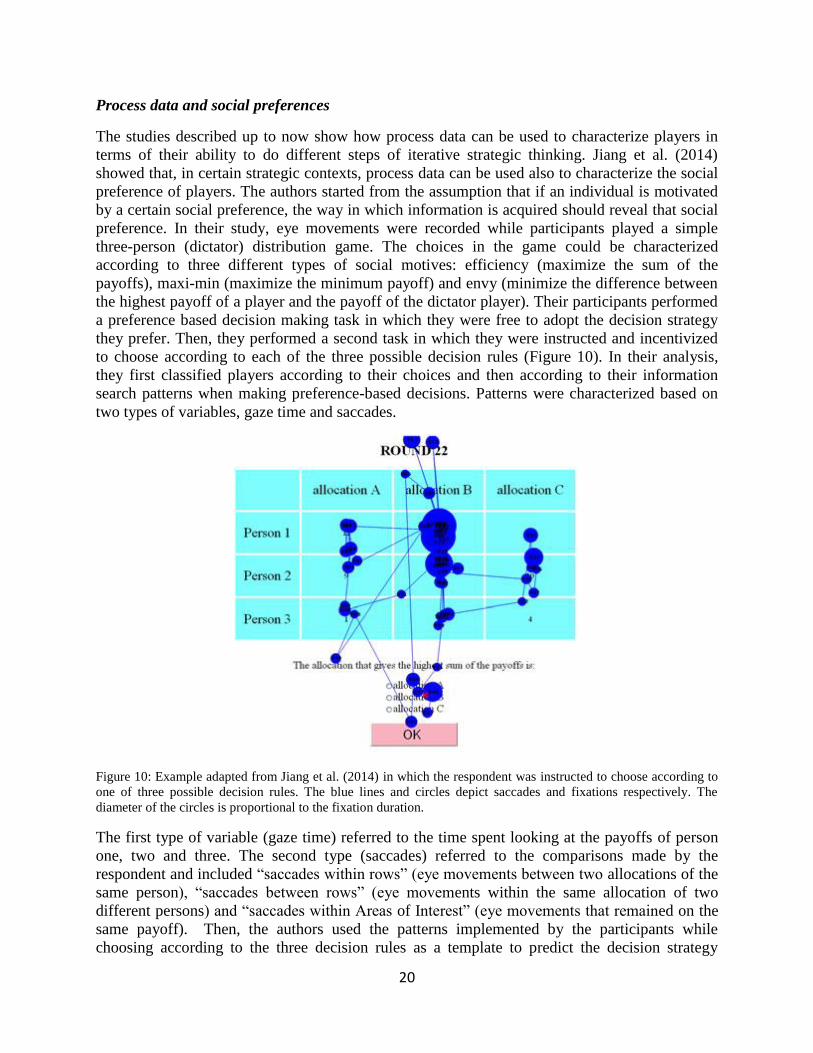
to choose according to each of the three possible decision rules (Figure 10). In their analysis,
they first classified players according to their choices and then according to their information
search patterns when making preference-based decisions. Patterns were characterized based on
two types of variables, gaze time and saccades.
Figure 10: Example adapted from Jiang et al. (2014) in which the respondent was instructed to choose according to
one of three possible decision rules. The blue lines and circles depict saccades and fixations respectively. The
diameter of the circles is proportional to the fixation duration.
The first type of variable (gaze time) referred to the time spent looking at the payoffs of person
one, two and three. The second type (saccades) referred to the comparisons made by the
respondent and included “saccades within rows” (eye movements between two allocations of the
same person), “saccades between rows” (eye movements within the same allocation of two
different persons) and “saccades within Areas of Interest” (eye movements that remained on the
same payoff). Then, the authors used the patterns implemented by the participants while
choosing according to the three decision rules as a template to predict the decision strategy
21
adopted by the players when making preference-based decisions. Finally they compared the level
of correspondence of the two classifications (the one based on eye-movements and the one based
on choices). Their results show that the classification based on eye movements lead to accurate
predictions on players’ choices, supporting the idea that choices are strictly related to the specific
information search analysis adopted by the player.
Combining strategic sophistication and social preferences using process data
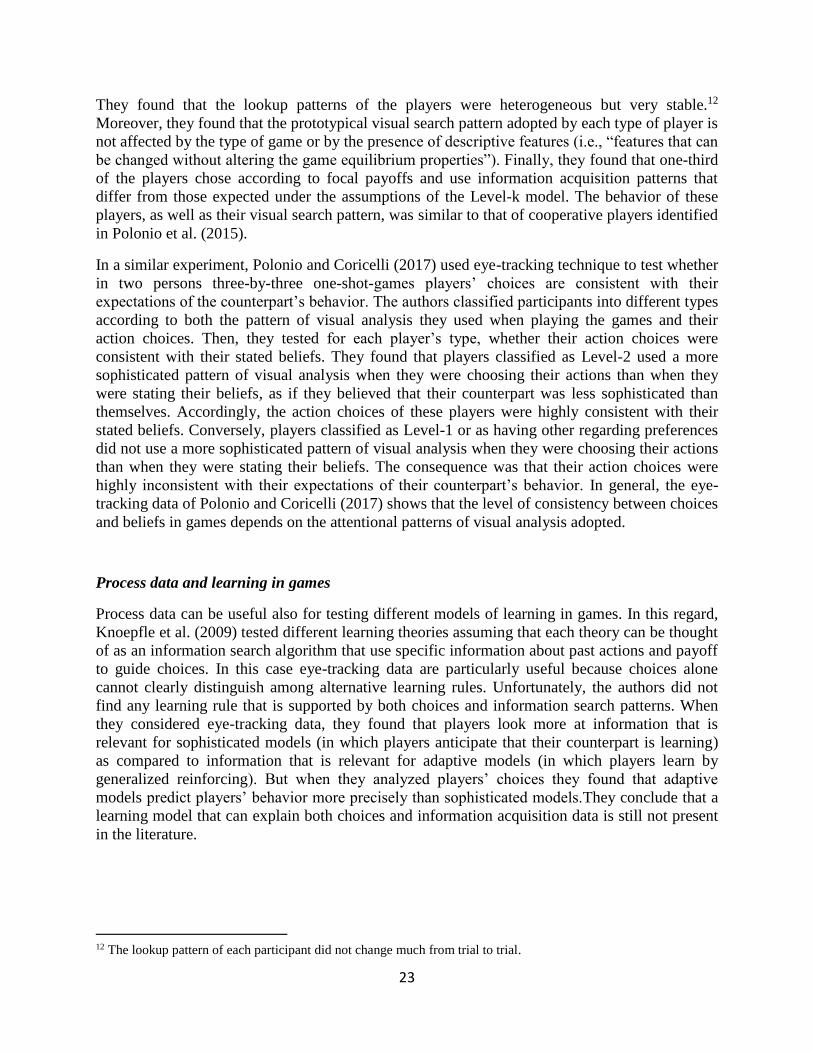
In the studies described up to now, process data was used mostly to investigate strategic
sophistication and social preferences separately, though it is likely that deviation from
equilibrium can be due to both aspects. In this regard, the study of Polonio et al. (2015) started
from the assumption that the strategy adopted by a player depends on two components: her level
of sophistication and her social motive. Following this theoretical framework, they conducted an
eye-tracking study in which participants played two-person two-by-two one-shot normal form
games. The authors tested whether the decision strategy implemented by the players could be
described and predicted by the visual search patterns they used to acquire information about the
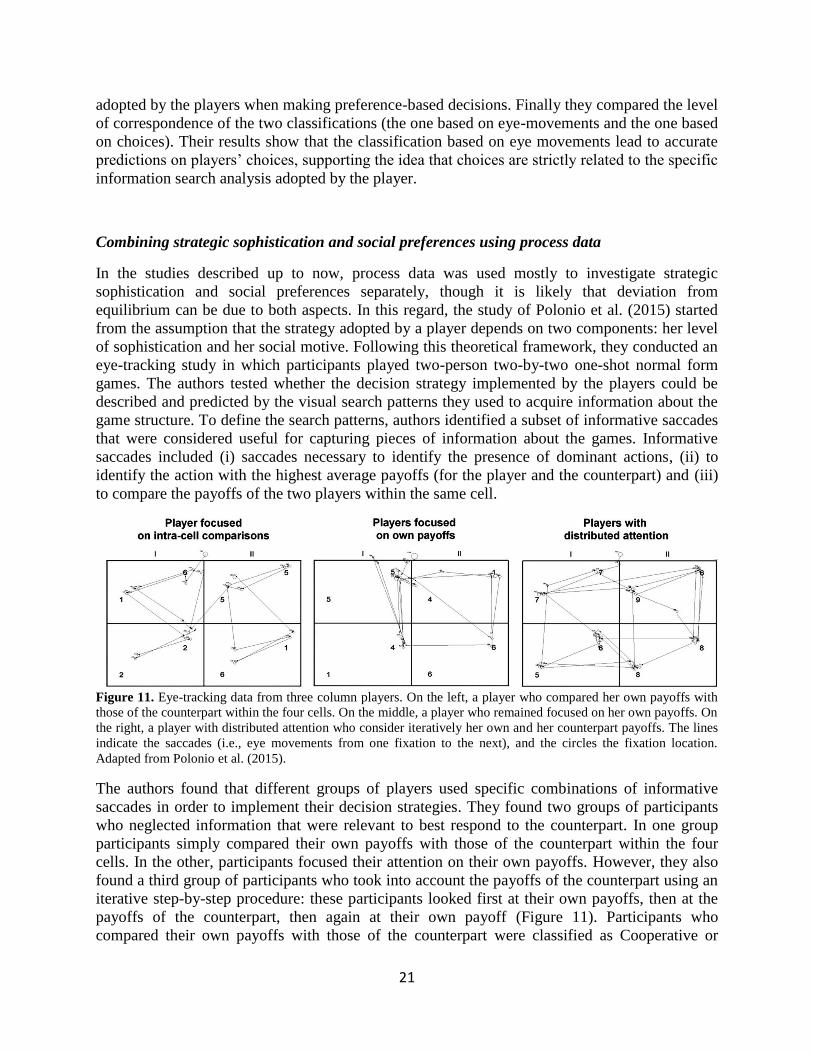
game structure. To define the search patterns, authors identified a subset of informative saccades
that were considered useful for capturing pieces of information about the games. Informative
saccades included (i) saccades necessary to identify the presence of dominant actions, (ii) to
identify the action with the highest average payoffs (for the player and the counterpart) and (iii)
to compare the payoffs of the two players within the same cell.
Figure 11. Eye-tracking data from three column players. On the left, a player who compared her own payoffs with
those of the counterpart within the four cells. On the middle, a player who remained focused on her own payoffs. On
the right, a player with distributed attention who consider iteratively her own and her counterpart payoffs. The lines
indicate the saccades (i.e., eye movements from one fixation to the next), and the circles the fixation location.
Adapted from Polonio et al. (2015).
The authors found that different groups of players used specific combinations of informative
saccades in order to implement their decision strategies. They found two groups of participants
who neglected information that were relevant to best respond to the counterpart. In one group
participants simply compared their own payoffs with those of the counterpart within the four
cells. In the other, participants focused their attention on their own payoffs. However, they also
found a third group of participants who took into account the payoffs of the counterpart using an
iterative step-by-step procedure: these participants looked first at their own payoffs, then at the
payoffs of the counterpart, then again at their own payoff (Figure 11). Participants who
compared their own payoffs with those of the counterpart were classified as Cooperative or

22
Competitive players. Participants focused on their own payoffs were classified as Level-1
players and participants with distributed attention as Level-2 players. Using this classification
based on visual search patterns the authors were able to predict the choices of the four groups of
players in games with different equilibrium structures. Their results support the idea that players
use stable decision strategies that can be identified with precision by looking at their information
acquisition patterns. In a subsequent analysis they established that equilibrium choices in their
two by two matrix games were selected when the information acquisition followed a specific
temporal pattern. According to their data, deviations from this specific temporal pattern leaded to
out of equilibrium choices (Figure 12).
Figure 12. The average proportions of saccades (across games) that occurred between player’s own payoffs (own),
between counterpart’s payoffs (other), and between own and counterpart’s payoffs (intra-cell) over time. Panel A
shows data for equilibrium choices. At the beginning of a trial, participants considered their own payoffs (first 4
saccades). Then, they looked at the other player’s payoffs (saccades 4 to 9) and finally, before making a decision,
they looked again at own payoffs (saccades 10 to 16). Panel B shows data for non-equilibrium choices. This
demonstrates that in order to make an equilibrium choice a certain pattern of analysis should be followed. Adapted
from Polonio et al. (2015).
The results of Polonio et al. (2015) are supported by another eye-tracking study conducted by
Devetag et al. (2016). The authors showed that in two-person three-by-three one-shot-games
players adopt simplified strategies such as “choosing the action with the highest average payoff”
or “the action leading to an attractive and symmetric payoff”.11 They found that many players did
not take into account the other players’ incentives or considered the other player’s payoffs only
for a subset of game outcomes. Their analysis of eye-movements emphasized the strong link
between the patterns of information acquisition used by the players and the strategy adopted.
11 The first strategy is expected of a Level-1 player, whereas the second one is expected of a cooperative player.
23
They found that the lookup patterns of the players were heterogeneous but very stable.12
Moreover, they found that the prototypical visual search pattern adopted by each type of player is
not affected by the type of game or by the presence of descriptive features (i.e., “features that can
be changed without altering the game equilibrium properties”). Finally, they found that one-third
of the players chose according to focal payoffs and use information acquisition patterns that
differ from those expected under the assumptions of the Level-k model. The behavior of these
players, as well as their visual search pattern, was similar to that of cooperative players identified
in Polonio et al. (2015).
In a similar experiment, Polonio and Coricelli (2017) used eye-tracking technique to test whether
in two persons three-by-three one-shot-games players’ choices are consistent with their
expectations of the counterpart’s behavior. The authors classified participants into different types
according to both the pattern of visual analysis they used when playing the games and their
action choices. Then, they tested for each player’s type, whether their action choices were
consistent with their stated beliefs. They found that players classified as Level-2 used a more
sophisticated pattern of visual analysis when they were choosing their actions than when they
were stating their beliefs, as if they believed that their counterpart was less sophisticated than
themselves. Accordingly, the action choices of these players were highly consistent with their
stated beliefs. Conversely, players classified as Level-1 or as having other regarding preferences
did not use a more sophisticated pattern of visual analysis when they were choosing their actions
than when they were stating their beliefs. The consequence was that their action choices were
highly inconsistent with their expectations of their counterpart’s behavior. In general, the eye-
tracking data of Polonio and Coricelli (2017) shows that the level of consistency between choices
and beliefs in games depends on the attentional patterns of visual analysis adopted.
Process data and learning in games
Process data can be useful also for testing different models of learning in games. In this regard,
Knoepfle et al. (2009) tested different learning theories assuming that each theory can be thought
of as an information search algorithm that use specific information about past actions and payoff
to guide choices. In this case eye-tracking data are particularly useful because choices alone
cannot clearly distinguish among alternative learning rules. Unfortunately, the authors did not
find any learning rule that is supported by both choices and information search patterns. When
they considered eye-tracking data, they found that players look more at information that is
relevant for sophisticated models (in which players anticipate that their counterpart is learning)
as compared to information that is relevant for adaptive models (in which players learn by
generalized reinforcing). But when they analyzed players’ choices they found that adaptive
models predict players’ behavior more precisely than sophisticated models.They conclude that a
learning model that can explain both choices and information acquisition data is still not present
in the literature.
12 The lookup pattern of each participant did not change much from trial to trial.
24
Conclusions
In this chapter, we described some research on process tracing in behavioral game theory. We
provided some examples and some critical comments about the methodology in use.
Experimentation in economics has reached a very high standard and a vast range of applications.
Process tracing analysis represents a new frontier. We believe that process tracing approaches
can significantly contribute to a better understanding of the cognitive and the emotional
underpinnings of economic decision making, from how people evaluate the outcomes of their
choices to how they form beliefs about what other people might do.
References
Beatty, J. (1982). Task-Evoked Pupillary Responses, Processing Load, and the Structure of
Processing Resources. Psychological Bulletin, 91(2), 276-292.
Bernhardt, P. C., Dabbs, J. M., & Riad, J. K. (1996). Pupillometry system for use in social
psychology. Behavior Research Methods, 28(1), 61-66.
Berrien, F. K., & Huntington, G. H. (1943). An exploratory study of pupillary responses during
deception. Journal of Experimental Psychology, 32(5), 443.
Billings, R. S., & Marcus, S. A. (1983). Measures of compensatory and noncompensatory
models of decision behavior: Process tracing versus policy capturing. Organizational Behavior
and Human Performance, 31(3), 331-352.
Bradley, M. T., & Janisse, M. P. (1979). Pupil size and lie detection: The effect of certainty on
detection. Psychology: A Journal of Human Behavior.
Bradley, M. T., & Janisse, M. P. (1981). Accuracy demonstrations, threat, and the detection of
deception: Cardiovascular, electrodermal, and pupillary measures. Psychophysiology, 18(3), 307-
315.
Brocas, I., Carrillo, J. D., Wang, S. W., & Camerer, C. F. (2014). Imperfect choice or imperfect
attention? Understanding strategic thinking in private information games. Review of Economic
Studies, 81(3), 944-970.
Camerer, C. F., Ho, T. H., & Chong, J. K. (2004). A cognitive hierarchy model of games. The
Quarterly Journal of Economics, 119(3), 861-898.
Camerer, C. F., Johnson, E., Rymon, T., & Sen, S. (1993). Cognition and framing in sequential
bargaining for gains and losses. Frontiers of game theory, 1, 27-47.
Cappelen, A. W., Nielsen, U. H., Tungodden, B., Tyran, J. R., & Wengström, E. (2016). Fairness
is intuitive. Experimental Economics, 19(4), 727-740.
Costa-Gomes, M., & Crawford, V. (2006). Cognition and Behavior in Two-Person Guessing
Games: An Experimental Study. The American Economic Review, 96(5), 1737-1768.
25
Costa‐Gomes, M., Crawford, V. P., & Broseta, B. (2001). Cognition and behavior in normal‐form games: An experimental study. Econometrica, 69(5), 1193-1235.
Crawford, V. P. (2003). Lying for strategic advantage: Rational and boundedly rational
misrepresentation of intentions. The American Economic Review, 93(1), 133-149.
De Neys, W., & Glumicic, T. (2008). Conflict monitoring in dual process theories of
thinking. Cognition, 106(3), 1248-1299.
Devetag, G., Di Guida, S., & Polonio, L. (2016). An eye-tracking study of feature-based choice
in one-shot games. Experimental Economics, 19(1), 177-201.
Dionisio, D. P., Granholm, E., Hillix, W. A., & Perrine, W. F. (2001). Differentiation of
deception using pupillary responses as an index of cognitive
processing. Psychophysiology, 38(2), 205-211.
Donders, F. C. (1868). Over de snelheid van psychische processen. Onderzoekingen gedaan in
het Physiologisch Laboratorium der Utrechtsche Hoogeschool (1968–1869), 2, 92-120.
Duchowski, A. T. (2007). Eye tracking methodology. Theory and practice, 328.
Eivazi, S., & Bednarik, R. (2011). Predicting problem-solving behavior and performance levels
from visual attention data. In Proc. Workshop on Eye Gaze in Intelligent Human Machine
Interaction at IUI (pp. 9-16).
Evans, A. M., & van de Calseyde, P. P. (2017). The effects of observed decision time on
expectations of extremity and cooperation. Journal of Experimental Social Psychology, 68, 50-
59.
Evans, A. M., Dillon, K. D., & Rand, D. G. (2015). Fast but not intuitive, slow but not reflective:
Decision conflict drives reaction times in social dilemmas. Journal of experimental psychology.
General, 144(5), 951-966.
Eyster, E., & Rabin, M. (2005). Cursed equilibrium. Econometrica, 73(5), 1623-1672.
Fehr, E., & Camerer, C. F. (2007). Social neuroeconomics: the neural circuitry of social
preferences. Trends in cognitive sciences, 11(10), 419-427.
Fehr, E., & Schmidt, K. M. (1999). A theory of fairness, competition, and cooperation. The
quarterly journal of economics, 114(3), 817-868.
Franco-Watkins, A. M., & Johnson, J. G. (2011). Applying the decision moving window to risky
choice: Comparison of eye-tracking and mousetracing methods. Judgment and Decision
Making, 6(8), 740.
Frydman, C., & Krajbich, I. (2016). Using response times to infer others’ beliefs: An application
to information cascades. Mimeo.
Gill, D., & Prowse, V. (2017). Strategic complexity and the value of thinking (No. 1296).
Mimeo, Purdue University, Department of Economics.
26
Glöckner, A., & Betsch, T. (2008). Multiple-reason decision making based on automatic
processing. Journal of experimental psychology: Learning, memory, and cognition, 34(5), 1055.
Glöckner, A., & Herbold, A. K. (2011). An eye‐tracking study on information processing in
risky decisions: Evidence for compensatory strategies based on automatic processes. Journal of
Behavioral Decision Making, 24(1), 71-98.
Graffeo, M., Polonio, L., & Bonini, N. (2015). Individual differences in competent consumer
choice: the role of cognitive reflection and numeracy skills. Frontiers in psychology, 6.
Grimm, V., & Mengel, F. (2011). Let me sleep on it: Delay reduces rejection rates in ultimatum
games. Economics Letters, 111(2), 113-115.
Heilveil, I. (1976). Deception and pupil size. Journal of Clinical Psychology, 32(3), 675-676.
Herrmann, B., Thöni, C., & Gächter, S. (2008). Antisocial punishment across
societies. Science, 319(5868), 1362-1367.
Hess, E. H. (1972). Pupillometrics. In N. S. Greenfield & R. A. Sternbach (Eds.), Handbook of
Psychophysiology (pp. 491-531): Holt, Rinehart & Winston.
Ho, T. H., Camerer, C., & Weigelt, K. (1998). Iterated dominance and iterated best response in
experimental" p-beauty contests". The American Economic Review, 88(4), 947-969.
Janisse, M. P., & Bradley, M. T. (1980). Deception, information and the pupillary
response. Perceptual and Motor Skills.
Jensen, A. R. (2006). Clocking the mind: Mental chronometry and individual differences.
Elsevier.
Jiang, T., Potters, J., & Funaki, Y. (2016). Eye‐tracking Social Preferences. Journal of
Behavioral Decision Making, 29(2-3), 157-168.
Johnson, E. J., & Camerer, C. F. (2004). Thinking backward and forward in games. In: Brocas,
I., Carrillo, J. (Eds.), The Psychology of Economic Decisions, vol. 2: Reasons and Choices.
Oxford Univ. Press, Oxford.
Johnson, E. J., Camerer, C., Sen, S., & Rymon, T. (2002). Detecting failures of backward
induction: Monitoring information search in sequential bargaining. Journal of Economic
Theory, 104(1), 16-47.
Kahneman, D. (2003). Maps of bounded rationality: Psychology for behavioral economics. The
American economic review, 93(5), 1449-1475.
Kahneman, D., & Beatty, J. (1966). Pupil diameter and load on memory. Science, 154, 1583–
1585.
Keren, G., & Schul, Y. (2009). Two is not always better than one: A critical evaluation of two-
system theories. Perspectives on psychological science, 4(6), 533-550.

27
Knoepfle, D. T., Wang, J. T.-y. and Camerer, C. F. (2009), Studying learning in games using
eye-tracking. Journal of the European Economic Association, 7: 388–398.
Kocher, M. G., & Sutter, M. (2006). Time is money—Time pressure, incentives, and the quality
of decision-making. Journal of Economic Behavior & Organization, 61(3), 375-392.
Konovalov, A., & Krajbich, I. (2016a). Over a decade of neuroeconomics: What have we
learned?. Organizational Research Methods, 1094428116644502.
Konovalov, A., & Krajbich, I. (2016b). Revealed indifference: Using response times to infer
preferences (No. 16-01).
Krajbich, I., Armel, C., & Rangel, A. (2010). Visual fixations and the computation and
comparison of value in simple choice. Nature neuroscience, 13(10), 1292-1298.
Krajbich, I., Bartling, B., Hare, T., & Fehr, E. (2015b). Rethinking fast and slow based on a
critique of reaction-time reverse inference. Nature communications, 6.
Krajbich, I., Hare, T., Bartling, B., Morishima, Y., & Fehr, E. (2015a). A common mechanism
underlying food choice and social decisions. PLoS computational biology, 11(10), e1004371.
Lohse, G. L., & Johnson, E. J. (1996). A comparison of two process tracing methods for choice
tasks. Organizational Behavior and Human Decision Processes, 68(1), 28-43.
Lubow, R. E., & Fein, O. (1996). Pupillary size in response to a visual guilty knowledge test:
New technique for the detection of deception. Journal of Experimental Psychology:
Applied, 2(2), 164.
Luce, R. D. (1991). Response Times: Their Role in Inferring Elementary Mental Organization.
Oxford University Press.
Matin, E. (1974). Saccadic suppression: a review and an analysis. Psychological bulletin, 81(12),
899.
Maule, A. J. (1994). A componential investigation of the relation between structural modelling
and cognitive accounts of human judgement. Acta Psychologica, 87(2), 199-216.
McKelvey, R. D., & Palfrey, T. R. (1995). Quantal response equilibria for normal form
games. Games and economic behavior, 10(1), 6-38.
Milosavljevic, M., Malmaud, J., Huth, A., Koch, C., & Rangel, A. (2010). The drift diffusion
model can account for value-based choice response times under high and low time
pressure. Judgment and Decision Making, 5(6), 437-449.
Nagel, R. (1995). Unraveling in guessing games: An experimental study. The American
Economic Review, 85(5), 1313-1326.
Nielsen, U. H., Tyran, J. R., & Wengström, E. (2014). Second thoughts on free
riding. Economics Letters, 122(2), 136-139.

28
Nishi, A., Christakis, N. A., & Rand, D. G. (2017). Cooperation, decision time, and culture:
Online experiments with American and Indian participants. PloS one, 12(2), e0171252.
Ochs, J., & Roth, A. E. (1989). An experimental study of sequential bargaining. The American
Economic Review, 355-384.
Pennycook, G., Fugelsang, J. A., Koehler, D. J., & Thompson, V. A. (2016). Commentary:
Rethinking fast and slow based on a critique of reaction-time reverse inference. Frontiers in
psychology, 7.
Piovesan, M., & Wengström, E. (2009). Fast or fair? A study of response times. Economics
Letters, 105(2), 193-196.
Polonio, L., & Coricelli, G. (2017). Testing the level of consistency between choices and beliefs
in games using eye-tracking. Mimeo.
Polonio, L., Di Guida, S., & Coricelli, G. (2015). Strategic sophistication and attention in games:
an eye-tracking study. Games and Economic Behavior, 94, 80-96.
Rand, D. G., Greene, J. D., & Nowak, M. A. (2012). Spontaneous giving and calculated
greed. Nature, 489(7416), 427-430.
Ratcliff, R. (1978). A theory of memory retrieval. Psychological review, 85(2), 59.
Recalde, M. P., Riedl, A., & Vesterlund, L. (2015). Error prone inference from response time:
The case of intuitive generosity in public-good games. Mimeo, University of Pittsburgh
Department of Economics WP, 2015, 15-004.
Rubinstein, A. (2007). Instinctive and cognitive reasoning: A study of response times. The
Economic Journal, 117(523), 1243-1259.
Rubinstein, A. (2013). Response time and decision making: An experimental study. Judgment
and Decision Making, 8(5), 540-551.
Rubinstein, A. (2016). A typology of players: Between instinctive and contemplative. The
Quarterly Journal of Economics, 131(2), 859-890.
Rustichini, A. (2008). Dual or unitary system? Two alternative models of decision
making. Cognitive, Affective, & Behavioral Neuroscience, 8(4), 355-362.
Smith, P. L., & Ratcliff, R. (2004). Psychology and neurobiology of simple decisions. Trends in
neurosciences, 27(3), 161-168.
Spiliopoulos, L., & Ortmann, A. (2014). The BCD of response time analysis in experimental
economics. Experimental Economics, 1-51.
Spiliopoulos, L., Ortmann, A., & Zhang, L. (2015). Complexity, attention and choice in games
under time constraints: A process analysis. Mimeo.
Stahl, D. O., & Wilson, P. W. (1994). Experimental evidence on players' models of other
players. Journal of economic behavior & organization, 25(3), 309-327.
29
Stahl, D. O., & Wilson, P. W. (1995). On players′ models of other players: Theory and
experimental evidence. Games and Economic Behavior, 10(1), 218-254.
Suter, R. S., & Hertwig, R. (2011). Time and moral judgment. Cognition, 119(3), 454-458.
Tinghög, G., Andersson, D., Bonn, C., Böttiger, H., Josephson, C., Lundgren, G., ... &
Johannesson, M. (2013). Intuition and cooperation reconsidered. Nature, 498(7452), E1-E2.
Tinghög, G., Andersson, D., Bonn, C., Johannesson, M., Kirchler, M., Koppel, L., & Västfjäll,
D. (2016). Intuition and moral decision-making–the effect of time pressure and cognitive load on
moral judgment and altruistic behavior. PloS one, 11(10), e0164012.
Velichkovsky, B. M. (1999). From levels of processing to stratification of cognition Converging
evidence from three domains of research. Stratification in cognition and consciousness, 15, 203.
Velichkovsky, B. M., Rothert, A., Kopf, M., Dornhöfer, S. M., & Joos, M. (2002). Towards an
express-diagnostics for level of processing and hazard perception. Transportation Research Part
F: Traffic Psychology and Behaviour, 5(2), 145-156.
Verkoeijen, P. P., & Bouwmeester, S. (2014). Does Intuition Cause Cooperation?. PLoS
ONE, 9(5).
Wang, J., Spezio, M., & Camerer, C. (2010). Pinocchio's Pupil: Using Eyetracking and Pupil
Dilation to Understand Truth Telling and Deception in Sender-Receiver Games. The American
Economic Review, 100(3), 984-1007.
Wilcox, N. T. (1993). Lottery choice: Incentives, complexity and decision time. The Economic
Journal, 103(421), 1397-1417.
Yarbus, A. L. (1967). Eye movements during perception of complex objects. In Eye movements
and vision (pp. 171-211). Springer US.