Embed Size (px)
Citation preview

0
HAND BOOK ON CIVIL AVIATION STATISTICS
a glimpse of aviation statistics…..
2016-17

1
DGCA OVERVIEW
The Directorate General of Civil Aviation (DGCA) is a regulatory body in the field of Civil
Aviation primarily dealing with Air Safety issues. It is responsible for regulation of air
transport services to/from/within India and for enforcement of civil air regulations, air
safety and air worthiness standards. It also interfaces with all the regulatory functions of
International Civil Aviation Organization.
DGCA’s Vision Statement:
“Endeavour to promote safe and efficient Air Transportation through regulation and
proactive safety oversight system.”
DGCA has several directorates and divisions under its purview to carry out its functions and
services. Apart from this, there are 5 regional offices and 10 sub-regional offices as shown
below.

2
Sl. No. CONTENTS PAGE No.
1. PASSENGER TRAFFIC STATISTICS 1-5
2. FREIGHT TRAFFIC STATISTICS 6-7
3. AIRCRAFT STATISTICS 8-10
4. NSOP STATISTICS 11-12
5. OPERATING ECONOMICS STATISTICS 13-15
6. HUMAN RESOURCE STATISTICS 16-19
7. AIR SAFETY STATISTICS 20
8. OTHER AVIATION RELATED STATISTICS 21-23

1
PASSENGER TRAFFIC
Air Passenger Traffic in India, both domestic and international witnessed a positive growth in the year 2016-17 compared to the previous year.
TABLE 1: PASSENGER TRAFFIC AT A GLANCE
PASSENGER TRAFFIC UNIT 2016-17 2015-16
Domestic Passengers Departing Passengers
103.75 million
(21.77)
85.20 million (21.58)
Domestic Airline Demand Revenue Passenger Kilometers (RPK)
98.64 billion (21.82)
80.97 billion (20.81)
Domestic Airline Capacity Available Seat Kilometers (ASK)
116.94 billion (19.66)
97.73 billion (15.23)
International Passengers Departing and Arriving Passengers
54.68 million
(9.84)
49.78 million (8.85)
Total Passengers (Domestic & International) 158.43 million
(17.37) 134.98 million
(16.54)
Figures in parenthesis refer to percentage change over previous year.
ASK is calculated as the sum of products obtained by multiplying the total number of seats that are available in each flight by the
flight stage distance.
RPK is calculated as the sum of the product obtained by multiplying the number of revenue passengers carried on each flight stage
by the stage distance.
The domestic passenger traffic registered a compound annual growth rate (CAGR) of 9.89% during the period 2007-08 to 2016-17 while the international passenger traffic grew at 8.07% (CAGR) during the same period.
During the years from 2007-08 to 2016-17, the capacity (ASK) in the domestic market grew at a rate of 7.58% (CAGR) while the demand (RPK) grew at 10.03% (CAGR) during the same period.
44.4 39.545.3
53.860.8 57.6 60.6
70.1
85.2
103.7
27.2 28.9 32.1 35.1 38.1 40.3 43.1 45.7 49.8 54.7
71.6 68.477.4
88.998.9 97.9
103.7115.8
135.0
158.4
0
20
40
60
80
100
120
140
160
180
2007-08 2008-09 2009-10 2010-11 2011-12 2012-13 2013-14 2014-15 2015-16 2016-17
----
-Pas
sen
gers
(In
Mill
ion
)---
--
CHART 1. PASSENGER TRAFFIC CARRIED BY SCHEDULED CARRIERS OVER THE PAST DECADE
DOMESTIC PASSENGERS… INTERNATIONAL PASSENGERS TOTAL PASSENGERS

2
TABLE 2: YEAR ON YEAR COMPARISON OF NUMBER OF PASSENGERS & PASSENGER LOAD FACTOR (PLF)
NAME OF THE AIRLINE
PASSENGERS (In Number)
(2015-16)
PASSENGERS (In Number)
(2016-17)
YoY GROWTH IN
PASSENGERS (%)
PLF (%) (2015-16)
PLF (%) (2016-17)
YoY GROWTH IN PLF (%)
AIR INDIA 12742163 13734192 7.8 79.2 79.2 0.0
AIR INDIA EXPRESS
149217 110881 -25.7 80.1 59.2 -26.1
ALLIANCE AIR 400340 625411 56.2 66.5 68.8 3.4
SPICEJET 10670866 13236143 24.0 92.0 92.9 1.0
JET ARWAYS 15961308 16276098 2.0 80.6 81.8 1.5
INDIGO 31453451 41600088 32.3 84.1 85.2 1.3
GO AIR 7160189 8645969 20.8 83.7 88.0 5.1
JETLITE 2439721 2751042 12.8 79.3 79.2 -0.1
AIR ASIA 1705808 2668553 56.4 80.2 85.6 6.7
AIR COSTA 711836 600581 -15.6 80.7 78.3 -3.1
VISTARA 1422611 2926586 105.7 69.4 78.0 12.4
TRUJET 204588 424809 107.6 80.1 77.8 -
AIR PEGASUS 175577 69927 -60.2 78.5 80.0 -
AIR CARNIVAL - 74725 - 63.3 -
ZOOM AIR - 3593 - 66.7 -
TOTAL 85197675 103748598 21.7 82.9 84.3 1.7
Note: AIR CARNIVAL STARTED ITS OPERATIONS IN AUGUST 2016 AND ZOOM AIR IN FEBRUARY 2017.
The high growth of 21.77 % in the total domestic passengers during 2016-17 is mainly due to the high growth in passengers carried by IndiGo, SpiceJet, Vistara and Go Air.
In the year 2016-17, both ASK and RPK in the domestic market registered a positive growth compared to the previous year. The Passenger Load Factor in the domestic market, which fell to 73.3% in 2013-14, is steadily increasing thereafter.
41
71
8
37
70
4
43
95
9
52
70
7
59
08
4
56
55
3
59
13
9
67
02
3
80
96
6
98
64
1
60
59
0
59
16
0
61
09
1
68
21
6
78
63
9
75
84
3
80
71
6
84
80
5 97
72
8 11
69
45
68.963.7
72.077.3 75.1 74.6 73.3
79.082.8 84.3
0.0
10.0
20.0
30.0
40.0
50.0
60.0
70.0
80.0
90.0
0
20000
40000
60000
80000
100000
120000
140000
2007-08 2008-09 2009-10 2010-11 2011-12 2012-13 2013-14 2014-15 2015-16 2016-17
----
-Pax
Lo
ad F
acto
r (%
)---
--
----
-RP
K &
ASK
(In
Mill
ion
)---
--
CHART 2: CAPACITY V/S DEMAND IN DOMESTIC MARKET OVER THE PAST DECADE
RPK (DEMAND) ASK (CAPACITY) PAX LOAD FACTOR

3
In the year 2016-17, domestic market experienced expansion in capacity as well as demand which is evident
from the Chart 3 as both RPK & ASK witnessed positive growth in all the months as compared to the
corresponding months in the previous year. Also, in most of the months YoY growth in RPK exceeded the YoY
growth in ASK implying an improvement in the passenger load factor and hence efficiency except for the
months of May, June and March.
In the year 2016-17 both in terms of RPK and passengers carried, IndiGo had the maximum market share
followed by Jet Airways, Air India and SpiceJet.
21.4 20.9 20.5
26.2
23.7 23.822.5 22.2
23.8
26.3
16.8
14.7
20.5 21.6 22.5
20.3
18.8 19.021.6 20.4
21.420.6
13.7
16.1
-2.0
-1.0
0.0
1.0
2.0
3.0
4.0
5.0
6.0
0.0
5.0
10.0
15.0
20.0
25.0
30.0
APR MAY JUN JUL AUG SEP OCT NOV DEC JAN FEB MAR
----
Yo
Y G
row
th in
Pax
Lo
ad F
acto
r (%
)---
-
---Y
oY
Gro
wth
in R
PK
& A
SK (
%)-
--
CHART 3: MONTH-WISE YEAR ON YEAR GROWTH IN CAPACITY V/S DEMAND IN DOMESTIC MARKET, 2016-17
YoY Growth in RPK YoY Growth in ASK YoY Growth in PLF
42.51
14.54
13.26
11.85
8.18 2.43
2.84
3.220.52
0.33
0.19
0.06
0.030.03
0.004
0.32
CHART 4: MARKET SHARE(%) IN TERMS OF DOMESTIC MARKET DEMAND (RPK)-2016-17
INDIGO JET AIRWAYS AIR INDIA
SPICEJET GO AIR JETLITE
AIR ASIA VISTARA AIR COSTA
ALLIANCE AIR TRUEJET AIR INDIA EXPRESS
AIR CARNIVAL AIR PEGASUS ZOOM AIR
40.1
15.7
13.2
12.8
8.32.7
2.6
2.80.6
0.6
0.4
0.1
0.1
0.1
0.003
0.66
CHART 5: DOMESTIC MARKET SHARE(%) IN TERMS OF PASSENGERS CARRIED-2016-17
INDIGO JET AIRWAYS AIR INDIA
SPICEJET GO AIR JETLITE
AIR ASIA VISTARA AIR COSTA
ALLIANCE AIR TRUEJET AIR INDIA EXPRESS
AIR CARNIVAL AIR PEGASUS ZOOM AIR

4
In terms of Passenger Load Factor (PLF), a measure of capacity utilisation of airlines, for scheduled domestic operations, SpiceJet registered the highest PLF of 92.9 % followed by Go Air (88.0%), Air Asia (85.6%). SpiceJet also topped the position in terms of scheduled international operations with a PLF of 87.2% followed by Jet Airways (81.2%) and IndiGo (81.0%).
INTERNATIONAL PASSENGER MARKET SHARE
TABLE 3: MARKET SHARE (%) OF INTERNATIONAL PASSENGERS CARRIED BY SCHEDULED INDIAN CARRIERS
AND FOREIGN CARRIERS.
YEAR FOREIGN CARRIERS INDIAN CARRIERS
2004-05 71.1 28.9
2009-10 65.5 34.5
2010-11 63.8 36.2
2011-12 64.1 35.9
2012-13 66.2 33.8
2013-14 61.7 38.3
2014-15 63.0 37.0
2015-16 63.4 36.6
2016-17 62.3 37.7
92.988.0 85.6 85.2
81.8 80.0 79.2 79.2 78.3 78.0 77.8
68.8 66.763.3
59.2
87.281.0 81.2
75.2 76.1
0.0
10.0
20.0
30.0
40.0
50.0
60.0
70.0
80.0
90.0
100.0--
---P
ax L
oad
fca
tor
(%)-
----
CHART 6: PASSENGER LOAD FACTOR (PLF) OF SCHEDULED INDIAN CARRIERS, 2016-17
DOMESTIC INTERNATIONAL

5
TABLE 4: MARKET SHARE (%) OF TOP 15 SCHEDULED OPERATORS – INTERNATIONAL OPERATIONS, 2016-17.
NAME OF THE AIRLINE SHARE (%)
JET AIRWAYS 14.5
AIR INDIA 10.6
EMIRATES AIRLINE 9.9
AIR INDIA EXPRESS 6.0
ETIHAD AIRLINES 5.0
QATAR AIRWAYS 3.9
INDIGO 3.5
AIR ARABIA 3.2
OMAN AIR 3.2
SPICEJET 3.1
SAUDIA 2.8
SRILNKAN AIRWAYS 2.5
THAI AIRWAYS 2.4
LUFTHANSA 2.2
SINGAPORE AIRLINES 2.0
Out of total 92 scheduled international operators, top 6 operators accounted for nearly 50% of total international Passenger traffic and top 15 operators accounted for three fourth of the total international Passenger traffic in the year 2016-17 . Jet Airways had the maximum market share (14.5%) followed by Air India (10.6%), Emirates Airline (9.9%), Air India Express (6.0%), Etihad Airways (5.0%) and Qatar Airways (3.9%).
More than half of the passenger traffic to and from India is accounted for by the countries in the Africa &
Middle East.
56.325.1
12.24.1
2.3
CHART 7: DISTRIBUTION OF INDIA'S INBOUND INTERNATIONAL
PASSENEGER TRAFFIC, 2016 -17
AFRICA & MIDDLE EAST ASIA PACIFIC
EUROPE CHINA & NORTH ASIA
THE AMERICAS
56.225.0
12.44.1
2.4
CHART 8: DISTRIBUTION OF INDIA'S OUTBOUND INTERNATIONAL
PASSENGER TRAFFIC, 2016-17
AFRICA & MIDDLE EAST ASIA PACIFIC
EUROPE CHINA & NORTH ASIA
THE AMERICAS

6
FREIGHT TRAFFIC
Air cargo carried by scheduled airline operators, both domestic and international witnessed a positive growth
in 2016-17.
TABLE 5: FREIGHT TRAFFIC AT A GLANCE
The domestic cargo traffic registered a growth of 6.3% (CAGR) over the period from 2007-08 to 2016-17 while International cargo traffic grew at 4.4% (CAGR) during the same period.
Dedicated cargo refers to the cargo carried by aircrafts solely meant for freight carriage.
The proportion of the total domestic cargo carried as belly cargo to the total domestic cargo has generally been
declining over the years since 2005-06 with the exception of 2014-15.
368 342 394 465 453 452 508 591 624 638
1025 10721139
1292 1219 1238 12621368 1404
1513
0
500
1000
1500
2000
2500
2007-08 2008-09 2009-10 2010-11 2011-12 2012-13 2013-14 2014-15 2015-16 2016-17
--Fr
eig
ht
(Th
ou
san
d M
etr
ic
Ton
ne
)--
CHART 9: FREIGHT TRAFFIC CARRIED BY SCHEDULED CARRIERS OVER THE PAST DECADE
DOMESTIC INTERNATIONAL
86.0 83.3 82.1 79.7 78.8 76.9 80.0 79.9 79.8
14.0 16.7 17.9 20.3 21.2 23.1 20.0 20.1 20.2
0.0
20.0
40.0
60.0
80.0
100.0
120.0
2005-06 2009-10 2010-11 2011-12 2012-13 2013-14 2014-15 2015-16 2016-17
CHART 10: PROPORTION OF DOMESTIC CARGO CARRIED AS BELLY CARGO AND IN DEDICATED FREIGHTERS
BELLY CARGO DEDICATED CARGO
FREIGHT TRAFFIC 2016-17 2015-16
DOMESTIC 6.38 Lakh MT
(2.24) 6.24 Lakh MT
(5.41)
INTERNATIONAL 15.13 Lakh MT
(7.76) 14.04 Lakh MT
(2.63)
Figures in parenthesis refer to percentage change over previous year; MT: Metric Tonne.

7
TABLE 6: PROPORTION OF INTERNATIONAL CARGO CARRIED BY INDIAN AND FOREIGN CARRIERS
Freight traffic is coming to India in almost equal proportion from around the World except the freight traffic
from the Americas while from India, more than half of the freight traffic is carried to the countries in the
Africa & Middle East.
28.1
26.6
23.9
20.3
1.1
CHART 11: DISTRIBUION OF INDIA'S INBOUND INTERNATIONAL FREIGHT
TRAFFIC, 2016-17
AFRICA & MIDDLE EAST EUROPE
ASIA PACIFIC CHINA & NORTH ASIA
THE AMERICAS
53.2
22.4
16.3
6.9
1.2
CHART 12: DISTRIBUTION OF INDIA'S OUTBOUND INTERNATIONAL FREIGHT
TRAFFIC, 2016-17
AFRICA & MIDDLE EAST EUROPE
ASIA PACIFIC CHINA & NORTH ASIA
THE AMERICAS
YEAR INDIAN CARRIERS (%) FOREIGN CARRIERS (%)
2004-05 13.6 86.4
2009-10 16.1 83.9
2010-11 20.3 79.7
2011-12 21.1 78.9
2012-13 17.7 82.3
2013-14 18.3 81.7
2014-15 17.8 82.2
2015-16 16.9 83.1
2016-17 18.8 81.2
8
AIRCRAFT
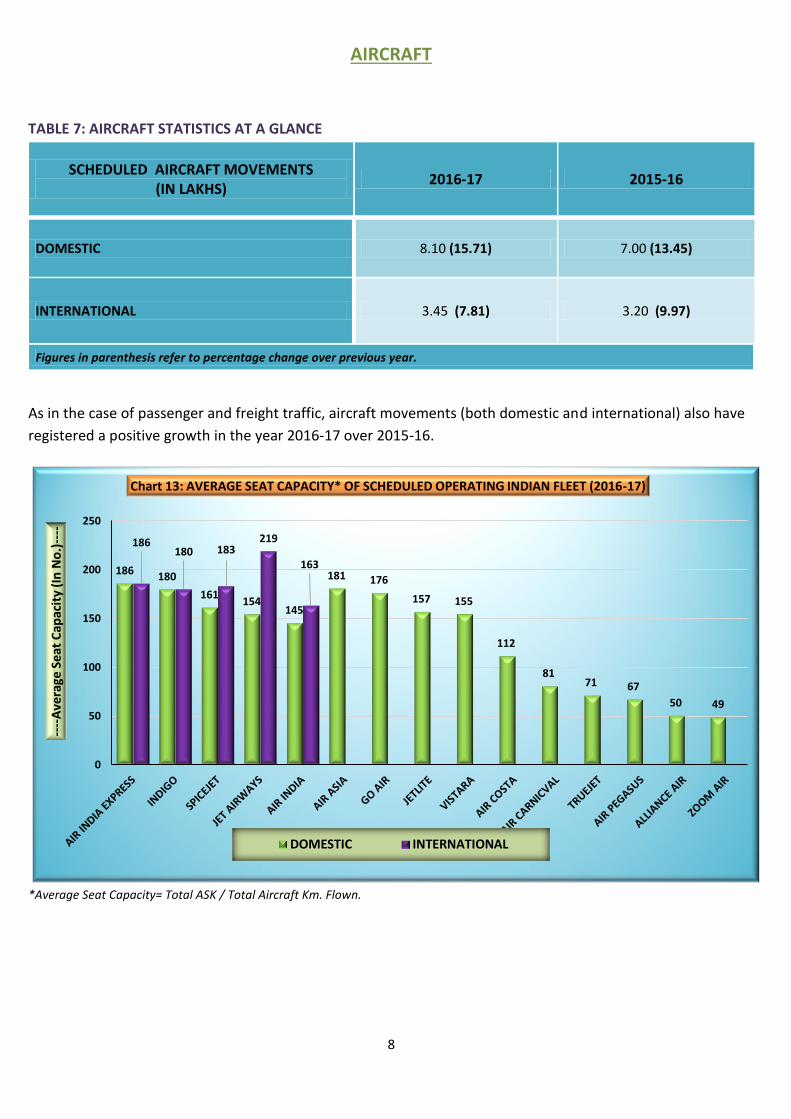
TABLE 7: AIRCRAFT STATISTICS AT A GLANCE
SCHEDULED AIRCRAFT MOVEMENTS (IN LAKHS)
2016-17 2015-16
DOMESTIC 8.10 (15.71) 7.00 (13.45)
INTERNATIONAL 3.45 (7.81) 3.20 (9.97)
Figures in parenthesis refer to percentage change over previous year.
As in the case of passenger and freight traffic, aircraft movements (both domestic and international) also have
registered a positive growth in the year 2016-17 over 2015-16.
*Average Seat Capacity= Total ASK / Total Aircraft Km. Flown.
186 180
161154
145
181 176
157 155
112
8171 67
50 49
186180 183
219
163
0
50
100
150
200
250
----
Ave
rage
Sea
t C
apac
ity
(In
No
.)--
--
Chart 13: AVERAGE SEAT CAPACITY* OF SCHEDULED OPERATING INDIAN FLEET (2016-17)
DOMESTIC INTERNATIONAL

9
TABLE 8: FLEET STATISTICS OF SCHEDULED INDIAN OPERATORS AS ON 31st MARCH, 2016.
NAME OF THE OPERATOR TYPE OF AIRCRAFT NUMBER OF AIRCRAFTS
SEAT CAPACITY
AIR INDIA
Boeing747-400 5 423
777-200LR 3 238
777-300ER 12 342
B-787 21 256
A-319 22 122/144
A-320 24 150/168/180
A-321 20 182
Total (All Types) 107
AIR INDIA EXPRESS Boeing 737-800 18 186
ALLIANCE AIR
ATR 42-320 3 48
CRJ-700 3 71
ATR-72-212A(600) 5 70
Total (All Types) 11
INDIGO A320-200 107 180
SPICEJET
Boeing 737-800 21 186
Boeing 737-900ER 4 206
DH8 13 78
A319BH 1 150
A320BH 2 180
737-700 2 149
Total (All Types) 43
GO AIR A320 19 180
JETLITE
Boeing 737-700 3 134
Boeing 737-800 5 168
Total (All Types) 8
BLUE DART Boeing 757-200 5 Freighter
JET AIRWAYS
B-737-700 3 134
B-737-800 59 168
B-737-900 6 184
ATR72-500/600 18 68
A330-200/300 12 293
B-777-300ER 10 346
Total (All Types) 108
AIR COSTA
Embraer and ERJ 190 -100 STD (VT-LBR)
1 112
Embraer and ERJ 190 -100 STD (VT-LVR)
1 112
Embraer and ERJ 190 -100 LR (VT-LVR) 1 110
Total (All Types) 3
VISTARA Airbus A320-232, SHARKLETS 9 148/158
AIR ASIA Airbus A320 6 180
AIR PEGASUS ATR-72-212A 2 66
TRUJET ATR-72-212A/VT-TMK 1 72
ATR-72-212A/VT-TMP 1 72
Total All Airlines (All Types) 448

10
STAGE LENGTH
TABLE 9: AVERAGE STAGE LENGTH* FLOWN (IN KILOMETRES) BY SCHEDULED INDIAN FLEET, 2016-17.
NAME OF THE AIRLINE DOMESTIC OPERATION INTERNATIONAL OPERATION
AIR INDIA 1039.3 6405.1
INDIGO 952.6 2252.5
JET AIRWAYS 757.2 2912.7
SPICEJET 751.1 1844.3
AIR INDIA EXPRESS 277.1 2574.2
VISTARA 1098.4
NO INTERNATIONAL OPERATIONS
AIR ASIA 1037.2
GO AIR 931.5
AIR COSTA 837.1
ZOOM AIR 830.6
JETLITE 814.5
ALLIANCE AIR 735.0
TRUEJET 443.9
AIR PEGASUS 395.7
AIR CARNIVAL 358.6
*Average Stage Length is calculated by dividing the total aircraft km flown by the total number of aircraft departure.
TABLE 10: SUMMARY OF AIR OBJECTS REGISTERED WITH DGCA AS ON 15th May, 2017.
OPERATOR TYPE
AIR
CR
AFT
HEL
ICO
PTE
R
BA
LLO
ON
HA
NG
GLI
DER
GLI
DER
MO
TOR
GLI
DER
ULT
RA
-LIG
HT
EXP
ERIM
ENTA
L
TOTA
L
SCHEDULED 518 0 0 0 0 0 0 0 518
NON-SCHEDULED 218 224 11 0 1 0 0 0 454
GOVERNMENT 116 37 0 5 43 0 0 4 205
PRIVATE 131 46 14 17 8 0 9 0 225
TRAINING 314 0 0 0 19 1 8 0 342
MISCELLANEOUS 0 0 0 3 0 0 26 0 29
GRAND TOTAL 1297 307 25 25 71 1 43 4 1773
Source: Directorate of Air Worthiness, DGCA.

11
NON-SCHEDULED OPERATORS (NSOP)
Source: Directorate of Air Transport- I.
Out of the total 71 NSOP domestic (aircraft) operators, top 15 operators accounted for more than half of the
total number of domestic flights operated in the year 2016-17.
156183
229
272
327
370
409 412
366 361
393406
353
4456 66
99122 127 134
147125 120 126 123 116
0
50
100
150
200
250
300
350
400
450
----
---N
um
ber
----
---
CHART 14: NON-SCHEDULED OPERATORS
Number of aircrafts (including helicopters) Number of OperatorsAs on 31st March
10.2
9.5
7.9
6.2
3.2
2.9
2.8
2.8
2.6
2.3
2.2
2.1
2.0
2.0
2.0
0.0 2.0 4.0 6.0 8.0 10.0 12.0
Reliance Commercial Dealers Ltd.
Air Charter Services Ltd.
Trans Bharat Aviation Pvt. Ltd
A R Airways Pvt. Ltd
VRL Logistics Ltd.
B.G. Shirke Construction Tech. Pvt. Ltd.
Pinnacle Air Pvt. Ltd.
Orbit Aviation Pvt. Ltd.
Ligare Aviation
Air One Aviation
Airmid Aviation Services Ltd.
Himalayaputra Aviation Ltd.
Karnavati Aviation Pvt. Ltd.
Span Air Pvt. Ltd.
Zest Aviation Pvt. Ltd.
CHART 15: TOP 15* NSOP-DOMESTIC (AIRCRAFT) OPERATIONS (% SHARE)- 2016-17
* In terms of number of flights operated.

12
Out of the total 32 non-scheduled international (aircraft) operators, top 15 operators accounted for more
than 85% of the total number of international flights operated in the year 2016-17.
Out of the total 55 non-scheduled Helicopter operators, top 3 operators accounted for more than 80% of
the total number of flights operated in the year 2016-17
20.6
11.0
7.9
7.5
7.0
6.6
4.5
3.8
3.4
3.2
2.7
2.3
2.3
2.2
2.2
0.0 5.0 10.0 15.0 20.0 25.0
Reliance Commercial Dealers Ltd.
Reliance Transport & Travels Pvt. Ltd.
Poonawalla Aviation Pvt. Ltd.
Air Charter Services Ltd.
VRL Logistics Ltd.
Zest Aviation Pvt. Ltd.
Airmid Aviation Services Ltd.
Karnavati Aviation Pvt. Ltd.
Indian Flysafe Aviation Ltd.
Raymond Limited
Orbit Aviation Pvt. Ltd.
L&T Aviation services Pvt. Ltd.
Ashley Aviation Ltd.
Coromandel Travels Ltd.
Taj Air Limited
CHART 16: TOP 15* NSOP-INTERNATIONAL (AIRCRAFT) OPERATIONS (% SHARE)- 2016-17
* In terms of number of flights operated.
35.6
30.9
17.9
0.0 5.0 10.0 15.0 20.0 25.0 30.0 35.0 40.0
Global Vectra Helicorp
Pawan Hans Limited
Himalayan Heli Services
CHART 17: TOP 3* NON-SCHEDULED HELICOPTER OPERATORS (% SHARE)- 2016-17
* In terms of number of flights operated.

13
OPERATING ECONOMICS
A higher PLF implies that an airline is successful in selling available seats. However, higher PLF may not result
in higher operating profit. When PLF is less than break-even load factor, the airline in question is running
losses. Evidently, in the year 2015-16, only Air India Express, Indigo, Go Air, SpiceJet, Jet Airways and Air
India were operating at a PLF higher than break-even load factor (BELF).
While decomposing the airline industry cost structure, it can be seen that Fuel cost accounts for (30%) of
the Operating Cost of Indian aviation industry (scheduled operations) followed by General and
Administrative costs (10.9%), Rental of Flight Equipment (13.3%) and User Charges (including landing and
associated airport charges and Air Navigation charges) (9.1%).
142.1
112.0102.3 98.8
85.0 81.2 79.4 78.1 77.9 77.5 75.1 71.062.9
80.169.4
80.2 80.7
90.678.5 79.3
66.5
82.6 83.7 75.5 84.0 82.4
0.0
20.0
40.0
60.0
80.0
100.0
120.0
140.0
160.0
----
BEL
F &
PLF
(%
)---
-
CHART 18: COMPARISON OF PASSENGER LOAD FACTOR (PLF) AND BREAK-EVEN LOAD FACTOR (BELF), 2015-16
BELF PLF
PLF=RPK/ASK BELF=Operating Cost Per ASK/ Operating Revenue per RPK
30.0
10.913.3
9.1
6.2
8.8
5.7
10.4 3.5 2.0
CHART 19: APPROXIMATE COST STRUCTURE OF AVIATION INDUSTRY IN INDIA, 2015-16
Fuel
General and Administrative
Rentals of Flight Equipment
User charges
Ticketing sales and Promotion
Other Expenses
Depreciation and amortization
MRO
Pax Services
Flight Crew salary & Expenses
The chart depicting the general trend of cost structure of aviation industry has beenworked out from available information in AT-II division, DGCA.

14
The cost comparison was undertaken before and after adjusting Operating Cost to Average Stage Length.
Because of high fixed cost of airlines unit cost decrease as distance increases. Hence, a stage length
adjustment is necessary for fairer comparison. In the year 2015-16, in terms of cost efficiency of airlines,
IndiGo and Go Air had the least operating cost (adjusted for stage length) per ASK, of Rs 3.1 each, followed
by SpiceJet (Rs 3.2) and JetLite (Rs 3.6).
Passenger yield is a measure of average fare paid per passenger km flown, calculated by dividing Passenger
Revenue by Revenue Passenger Kilometers. In the year 2015-16, Air Asia had the lowest passenger yield
followed by Go Air and Air India Express.
0.0
500.0
1000.0
1500.0
2000.0
2500.0
3000.0
0.0
2.0
4.0
6.0
8.0
10.0
12.0
---A
vera
ge S
tage
Len
gth
(In
Kilo
me
ters
)---
-
----
Op
erat
ing
Co
st P
er
ASK
(In
Ru
pe
es)
----
Chart-20: OPERATING COST PER ASK, 2015-16
UNADJUSTED OPERATING COST PER ASK ADJUSTED OPERATING COST PER ASK AVERAGE STAGE LENGTH
9.1
7.3
6.0
5.0 4.94.6
4.3 4.2 4.1 4.1 4.0 3.83.3
0.0
1.0
2.0
3.0
4.0
5.0
6.0
7.0
8.0
9.0
10.0
----
-Ru
pee
s P
er
RP
K (
In N
um
ber
)---
--
CHART-21: COMPARISON OF PASSENGER YIELD OF SCHEDULED INDIAN CARRIERS, 2015-16
Passenger YieldPassenger Yield=Passenger Revenue/RPK

15
TABLE 11: FINANCIAL SUMMARY OF ALL SCHEDULED INDIAN CARRIERS- 2015-16
(RS. IN MILLION)
OPERATING REVENUE OPERATING EXPENSES OPERATING RESULT
SCHEDULED NATIONAL CARRIERS
AIR INDIA 1,99,923.30 1,98,873.30 1,050
AI EXPRESS 29,179.57 22,283.43 6,896.13
ALLIANCE AIR 2,738.58 3,241.62 -476.04
SUB TOTAL (A) 2,31,841.45 2,24,371.35 7,470.09
SCHEDULED DOMESTIC PRIVATE CARRIERS
JET AIRWAYS 2,11,117.71 1,99,085.39 12,032.33
JET LITE (P) LTD. 11,136.46 11,154.11 -17.65
GO AIR 28,816.96 26,704.43 2,112.53
SPICE JET 50,880.72 47,735.05 3,145.67
INDIGO 1,61,399.09 1,36,370.73 25,028.36
AIR COSTA 3,191.13 3,904.73 -713.60
AIR ASIA 6,588.42 8,405.43 -1,817.01
VISTARA 6,913.73 11,154.68 -4,240.95
AIR PEGASUS 539.63 558.32 -18.70
TRUJET 649.24 1,151.54 -502.30
BLUE DART 5,938.10 5,719.70 218.40
SUB TOTAL (B) 4,87,171.19 4,51,944.11 35,227.08
GRAND TOTAL (A+B) 7,19,012.64 6,76,315.46 42,697.17

16
HUMAN RESOURCE
TABLE 12: PERSONNEL STATISTICS OF SCHEDULED INDIAN OPERATORS FOR THE YEAR 2015-16. NAME OF THE
AIRLINE Pilots & Co-Pilots
Other Flight Crew
Cabin Crew
Maintenance & Overhaul
Personal Overhaul
Ticketing & Sales
Personnel
All Other Personnel
Total
AIR INDIA 1411 - 2116 913 4577 3863 12880
AIR INDIA EXPRESS 269 - 387 181 - 151 988
ALLIANCE AIR 77 - 149 - - 281 507
JET AIRWAYS 1575 387 3539 2223 1092 5940 14756
JETLITE 134 1 236 317 - 52 740
INDIGO 1747 132 3218 876 65 6324 12362
SPICEJET 467 36 858 528 371 3105 5365
GO AIR 265 86 423 347 454 842 2417
AIR COSTA 68 12 65 110 191 409 855
AIR ASIA 99 12 169 109 110 258 757
VISTARA 114 - 274 17 46 497 948
TRUJET 10 - 27 95 82 55 269
AIR PEGASUS 16 - 16 29 60 53 174
BLUE DART 58 - - 142 - 874 1074
TOTAL 6310 666 11477 5887 7048 22704 54092
Out of the total airline staff of 54092, 27.3% is employed by Jet Airways followed by Air India Ltd (23.8%),
IndiGo (22.9%) and SpiceJet (9.9%).
Source: Directorate of Training & Licensing, DGCA.
CPL- Commercial Pilot License; ATPL-Air Transport Pilot License; PPL- Private Pilot License.
395
66
461492
65
557
384
47
431 419
41
460
156
26
182 162
15
177
0
100
200
300
400
500
600
MALE FEMALE TOTAL MALE FEMALE TOTAL
2015-16 2016-17
----
-Nu
mb
er o
f Li
cen
ses
issu
ed--
---
CHART-22: PILOT LICENCES ISSUED BY DGCA
CPL ATPL PPL

17
ASK PER EMPLOYEE
Available Seat Kilometer (ASK) per Employee is an indicator of efficiency both in terms of capacity planning
and utilization of work force and is calculated by dividing Available Seat Kilometers by Number of Employees.
In terms of the ASK per employee, JetLite is the most efficient after the National airlines.
REVENUE PER EMPLOYEE
Revenue per employee is an indicator of productivity of human resource of an airline and is calculated by dividing Operating Revenue by Number of Employees. Employee productivity was highest for National Airlines followed by JetLite and Jet Airways.
4.2
3.63.5 3.3
3.2 3.1
2.42.2
0.80.5
0.4
0.0
0.5
1.0
1.5
2.0
2.5
3.0
3.5
4.0
4.5
----
-ASK
Pe
r Em
plo
yee
(In
Mill
ion
)---
--
CHART-23: ASK PER EMPLOYEE, (2015-16)
ASK Per Employee
* National Airlines Includes Air India, Air India Express & Alliance Air.
16.115.0
14.313.1
11.9
9.58.7
7.3
5.5
3.73.1
2.4
0.0
2.0
4.0
6.0
8.0
10.0
12.0
14.0
16.0
18.0
----
-Rev
enu
e P
er
Emp
loye
e (R
s. In
Mill
ion
)---
-
CHART 24: REVENUE PER EMPLOYEE- 2015-16
Revenue Per Employee
* National Airlines Includes Air India, Air India Express & Alliance Air.

18
TABLE 13: DGCA APPROVED AME TRAINING INSTITUTES (AS ON 15th May, 2017)
REGION STATE NUMBER OF AME INSTITUTES
NORTH-16
Delhi 3
Haryana 3
Uttar Pradesh 5
Rajasthan 2
Himachal Pradesh 1
Uttarakhand 1
Punjab 1
EAST-4
West Bengal 1
Assam 1
Bihar 1
Odisha 1
WEST-15
Maharashtra 10
Gujarat 2
Madhya Pradesh 3
SOUTH-16
Tamil Nadu 5
Kerala 5
Karnataka 3
Telangana 3
TOTAL 51
Source: Directorate of Air Worthiness, DGCA.

19
TABLE 14: DGCA APPROVED FLYING TRAINING ORGANISATIONS (AS ON 31st March, 2017).
STATE OWNERSHIP NUMBER OF FLYING ORGANIZATION
TELANGANA
Private/Public Ltd. 3
State Govt. 1
GUJARAT Private/Public Ltd. 2
HARYANA State Govt. 1
KARNATAKA
State Govt. 1
Private 1
MADHYA PRADESH Private/ Trust/ Public Ltd. 4
MAHARASHTRA
Society 1
Private 3
State Govt. 1
BIHAR State Govt. 1
ODISHA State Govt. 1
PUNJAB State Govt. 1
RAJASTHAN Private 1
UTTAR PRADESH
Private/Trust 5
Central Govt. 1
UTTRAKHAND Private 1
KERALA State Govt. 1
TOTAL 30
Source: Directorate of Flying Training, DGCA.

20
AIR SAFETY
TABLE 15: YEAR-WISE NUMBER OF ACCIDENTS.
TABLE 16: YEAR-WISE NUMBER OF SERIOUS INCIDENTS.
YEAR
TYPE OF OPERATOR
SCHEDULED OPERATORS
NON-SCHEDULED OPERATORS
FLYING TRAINING INSTITUTE
GOVT. OPERATORS
PRIVATE OPERATORS
FOREIGN OPERATORS
TOTAL ACCIDENTS
2011 0 6 2 2 0 1 11
2012 0 3 2 2 2 0 9
2013 0 5 2 1 0 0 8
2014 1 2 2 1 0 0 6
2015 4 5 1 0 0 0 10
2016 3 3 0 1 0 0 7
2017* 0 1 0 0 0 0 1
*Till March 2017. Source: Directorate of Air Safety, DGCA.
Year
TYPE OF INCIDENT
ENGINEERING OPERATIONAL RUNWAY
EXCURSION WEATHER MISCELLANEOUS
TOTAL INCIDENTS
2011 1 1 1 1 1 5
2012 3 4 0 0 0 7
2013 2 3 1 0 0 6
2014 6 1 1 1 2 11
2015 1 3 0 0 1 5
2016 10 1 0 0 0 11
Source: Directorate of Air Safety, DGCA.
21
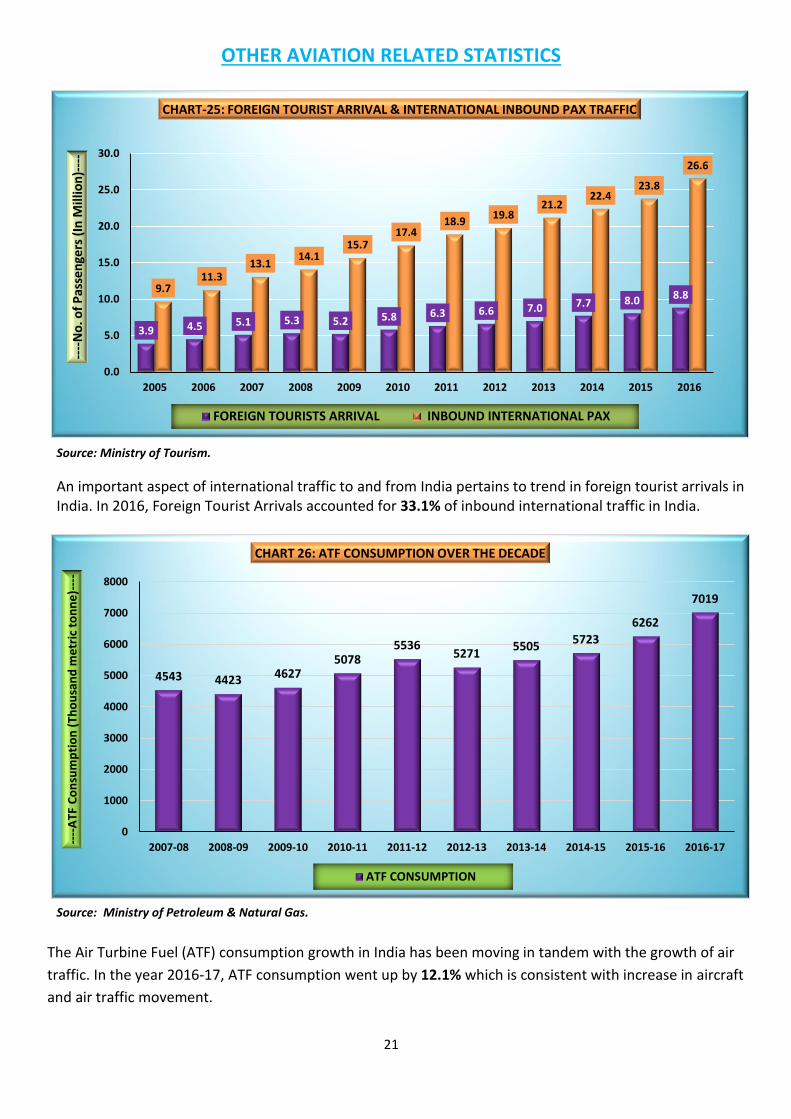
OTHER AVIATION RELATED STATISTICS
Source: Ministry of Tourism.
An important aspect of international traffic to and from India pertains to trend in foreign tourist arrivals in India. In 2016, Foreign Tourist Arrivals accounted for 33.1% of inbound international traffic in India.
Source: Ministry of Petroleum & Natural Gas.
The Air Turbine Fuel (ATF) consumption growth in India has been moving in tandem with the growth of air
traffic. In the year 2016-17, ATF consumption went up by 12.1% which is consistent with increase in aircraft
and air traffic movement.
3.9 4.5 5.1 5.3 5.2 5.8 6.3 6.6 7.0 7.7 8.0 8.89.7
11.313.1
14.115.7
17.418.9
19.821.2
22.423.8
26.6
0.0
5.0
10.0
15.0
20.0
25.0
30.0
2005 2006 2007 2008 2009 2010 2011 2012 2013 2014 2015 2016
----
No
. of
Pas
sen
gers
(In
Mill
ion
)---
-
CHART-25: FOREIGN TOURIST ARRIVAL & INTERNATIONAL INBOUND PAX TRAFFIC
FOREIGN TOURISTS ARRIVAL INBOUND INTERNATIONAL PAX
4543 4423 46275078
55365271
55055723
6262
7019
0
1000
2000
3000
4000
5000
6000
7000
8000
2007-08 2008-09 2009-10 2010-11 2011-12 2012-13 2013-14 2014-15 2015-16 2016-17
----
ATF
Co
nsu
mp
tio
n (
Tho
usa
nd
me
tric
to
nn
e)-
---
CHART 26: ATF CONSUMPTION OVER THE DECADE
ATF CONSUMPTION

22
Source: Ministry of Petroleum & Natural Gas.
TABLE 17: AIRPORTS IN INDIA (AS ON 31st March, 2017).
TOTAL INTERNATIONAL AIRPORTS 24
AAI Airports 18
Civil Enclave 3
Private Airports (JVs) 3
TOTAL CUSTOMS AIRPORTS 8 AAI Airports 4
Civil Enclave 4
TOTAL DOMESTIC AIRPORTS 101 AAI Operational Airports 49
AAI Operational Civil Enclave 18
AAI Non-Operational 30
STATE/ PRIVATE GOVERNMENT 4
Additional Airports being developed/ proposed (Pakyong, Bareilly(C), Adampur(CE) (Jallandhar)
3
TOTAL AIRPORTS (ALL TYPES) 133 Source: Airport Authority of India.
GLIDER TRAINING CENTRES IN INDIA*
1. Gliding Centre, Pune, Maharashtra: - It is attached with DGCA and its gliders belong to Government of India.
2. Deolali Gliding Club, Nasik, Maharashtra:- It is registered under Society Act, 1816 by Charitable Commissioner F68
and the gliders of this club belong to Government of India.
*Source: Directorate of Air Worthiness, DGCA
0.0
2.0
4.0
6.0
8.0
10.0
12.0
14.0
16.0
18.0
20.0
0.0
100.0
200.0
300.0
400.0
500.0
600.0
700.0
----
Yo
Y G
row
th in
ATF
Co
nsu
mp
tio
n (
%)-
---
----
ATF
Co
nsu
mp
tio
n (
00
0 m
etr
ic t
on
ne
)---
-Chart 27: YoY GROWTH OF ATF CONSUMPTION, 2016-17
2015-16 2016-17 YoY Growth in ATF Consumption

23
INTERNATIONAL JOINT VENTURE/ PRIVATE AIRPORTS WHERE CNS/ATM IS PROVIDED BY AAI
Sl. No. NAME OF AIRPORT
1. Bangalore International Airport Limited (BIAL)
2. Cochin International Airport Limited (CIAL)
3. Hyderabad International Airport Limited (HIAL)
DOMESTIC PRIVATE/STATE GOVT./ U.T AIRPORTS WHERE CNS/ATM IS APPROVED BY AAI
Sl. No. NAME OF AIRPORT
1. Lengpui Airport (Mizoram)
2. Mundra Airport (Gujarat)
3. Nanded Airport (Maharashtra)
PRIVATE GREENFIELD AIRPORT
Sl. No. NAME OF AIRPORT
1. Durgapur (West Bengal)
Source: Airport Authority of India.

24
OFFICERS AND STAFF OF DIRECTORATE OF AIR TRANSPORT-II, DGCA ASSOCIATED WITH THE PUBLICATION
Notes:
1. Sources of data: Directorate of Air Transport- II, unless otherwise specified.
2. Data published in the handbook is provisional.
DEPUTY DIRECTOR GENERAL (SAG)
Sh. P C Cyriac
DEPUTY DIRECTOR
Sh. P K Srivastava
Sh. Narendra Singh
ASSISTANT DIRECTOR
Sh. Devendra Kumar
Sh. Mukund Bihari
STATISTICAL OFFICER
Sh. Mani Bhushan
Smt. Shweta Sharma
Sh. Ravi Kant Soni
Sh. Sandeep Verma