Embed Size (px)
Citation preview

1
Hampshire County Council Childcare Sufficiency Annual Update 31 March 2017 Area: Hart Period: 1 April 2016 – 31 March 2017 Report by: Julia Freemantle Childcare Development & Business Officer (CDBO) and Carey Owen Childcare Information and Communications Officer 1. Area demographic profile
This information is provided by the Local Development Team (LDT) and indicates any known changes in the demographic profile in the area. Some of the data may not be statistical but what is known locally from networking with agencies and settings. Number and ages of Children The overall Hart area child population aged 0 and 4 years old is projected to slightly decrease between 2015 and 2022 reducing by just 86 - 1.51% The high level trend projection to 2022 is shown below (Figure1). Within Hart area there is projected to be gradual declines in child populations within this age group with the exception of the one and two old age groups which are expected to show a small increase. The population forecast will have an impact on childcare and school places in the district which is outlined in the Hampshire School Places Plan 2017 – 2021. Sources: Hampshire County Environment Department’s based Small Area Population Forecasts http://www.hants.gov.uk/factsandfigures/population-statistics/pop-estimates/small-area-pop-stats.htm Hampshire School Places Plan https://www.hants.gov.uk/educationandlearning/schoolplacesplan

2
Figure1 Source: CSA 2015 SAPF district by age Hampshire only
Families accessing benefits at 31 March 2017 Previous childcare sufficiency reports contained information about families accessing working tax credits and lone parents accessing benefits. The Office for National Statistics (ONS) has changed the way this data is reported as follows. The Universal Credit (UC), a single payment for people who are looking for work or are on a low income, was first piloted in 2013, and then rolled out in phases nationally to Jobcentre Plus offices (JCPs). Local JCPs in Hampshire started to go ‘live’ in April 2015 (Southampton), while all of Hampshire’s JCPs are scheduled to go ‘live’ during 2017/2018. In light of the number of JCPs recording ‘live’ Universal Credit data, the Office for National Statistics (ONS) published the new experimental Claimant Counts on 11 November 2015. This data records eligible persons claiming Jobseeker's Allowance plus new or transferred claimants who are out counts based only on JSA are still collected and published, but referred to as the Jobseekers Allowance. Users need to be aware of these differences. The ONS decided to replace the number of people claiming only Jobseeker's Allowance as the headline indicator for the number of people claiming benefits, principally for the reason of being unemployed, and use the new Claimant Count as the headline i.e. JSA + Universal Credit.

3
This change will impact on those areas where Universal Credit data has already gone ‘live’. Locally, this will be in Southampton and Eastleigh, where collection has taken place over a longer period. For other areas, there will be no immediate or noticeable difference between the ‘old’ JSA and the new claimant count. Eventually, all unemployed claimants will be transferred to the Universal Credit. The new Claimant Count Dataset does not currently publish claimants by duration or sought occupation. The two tables in the Labour Market Bulletin that captures this data will continue to be published, but using the JSA only data i.e. it will not include any new Universal Credit (UC) claimants. The number of lone parent families accessing benefits in Hart is 230 (0.4%), lower than the Hampshire average of 0.8% and the Great Britain figure of 1%. However this does not include those that may also be claiming Employment Support Allowance (ESA) and Lone Parent benefits would be counted under ESA and so forth. Source: Labour Market Bulletin March 2017 http://documents.hants.gov.uk/Economy/HampshireLMBMarch2017.pdf Job creation and planned developments There are no significant developments reported in the Hampshire Labour Market Bulletin for March 2017 which affect the Hart area. In the bulletin for December 2016 it was reported that Flagship Europe, the Hook-based foodservice supplier, is to be acquired by OSI Group of the US. The bulletin for June 2016 reported that Mrs Crimble's, the Odiham-based gluten-free foods manufacturer, has been acquired by Wessanen of the Netherlands. Housing Developments The Hart household count is 35,510 and the average household size is 2.56 people: the national average is 2.40. Source: Hampshire Hub Hart profile http://data.hampshirehub.net/search Hart District Council is due to consult on the Draft Local Plan Strategy and Sites 2011-2032 from 26 April to 9 June 2017. Hart District Council intends to publish a Pre-Submission Local Plan for comments before the end of the year. Link to the Draft Local Plan: https://www.hart.gov.uk/sites/default/files/4_The_Council/Policies_and_published_documents/Planning_policy/Local_Plan/Draft%20Local%20Plan%20Strategy%20and%20Sites%202011-2032.pdf The South East Plan (2009): https://www.hart.gov.uk/sites/default/files/4_The_Council/Policies_and_published_documents/Planning_policy/Policy-NRM6.pdf set out regional policies for the South East up to 2026. However, in May 2013, the Government revoked the South East Plan with the exception of Policy NRM6, which relates to the Thames Basin Heaths Special Protection Area (TBHSPA). This policy affects much of Hart District and is therefore relevant in preparing the Local Plan.

4
The District is part of the Enterprise M3 Local Enterprise Partnership (LEP). The LEP covers mid and north Hampshire and south west Surrey. It stretches from the hinterland of London, along the corridor of the M3 motorway to the New Forest. The LEP has set out strategic growth aspirations in its Strategic Economic Plan and this wider economic strategy therefore informs local plans and strategies. National planning policy requires Hart to meet its full objectively assessed housing needs for market and affordable homes (OAHN) in the Housing Market Area (HMA). The HMA within which the District falls comprises the administrative areas of Hart, Rushmoor and Surrey Heath. In 2016 together with HMA partners, Hart commissioned an updated Strategic Housing Market Assessment 2016 (2016 SHMA) to understand how many new homes need to be provided. The 2016 SHMA identifies Hart District’s OAHN to be 382 new homes per annum. This equates to 8,022 new homes over the plan period (2011-2032). In addition, there is a separate policy decision to include an additional uplift to help meet the priority need for subsidised affordable rented homes. This means that in total Hart are planning to deliver 10,185 new homes over the plan period.
Details of houses in development as at 31 January 2017 Hart District's need for new Homes (2011-2032)
10,185
New homes built as at 31 January 2017
-2,160
New homes planning permission as at 31 January 2017
-3,144
Windfall Allowance on Small sites -290 New homes left to Plan (NHLtP) 4,591 For Odiham, the Neighbourhood Plan has identified specific site allocations (119 new homes) that the community itself has chosen how to manage which land will come forward for development. In the parishes of Hook and Crondall the respective Neighbourhood Plans are being prepared on the basis that they too will allocate sites (Hook 87 new homes and Crondall 66 new homes). This amounts to 272 new homes in total. The following areas have also been identified as areas suitable for development Crookham Village 100 Eversley 124 Land adjacent to Riseley 83 Long Sutton 10 South Warnborough 34 Yateley 88 Total 439 New settlements can meet the need for new homes. The new settlement option was also the most favoured option by the public in the 2016 Refined Housing Options consultation. The two best performing opportunities are Murrell Green (up 1,800 new

5
homes), or a 3,000 new home settlement (up to 2,200 new homes within the Local Plan period) centred on the area around Winchfield Station. Based on current judgements, Murrell Green (up to 1,800 new homes) is the most favoured option - It is deliverable and considered the most suited to meeting the housing needs of the District within the plan period.
Hampshire County Council’s response to Local Plan Development Documents (LDD) http://intranet.hants.gov.uk/environment/projects-env/local-development-documents/hart_dc.htm The Hampshire School Places Plan sets out the identified need for extra mainstream school places. The plan covers Hampshire up to the year 2021 for:
The primary sector (4 to 11 year olds)
The secondary sector (11 to 16 year olds) Odiham and Fleet are areas under review. https://www.hants.gov.uk/educationandlearning/schoolplacesplan For information on the developer’s contribution towards Childrens Services facilities information see links to documents: http://documents.hants.gov.uk/education/DeveloperContributionGuidanceDocumentApril2017.docx and https://www.hants.gov.uk/educationandlearning/schoolplacesplan 2 Childcare places analysis
2.1 Childcare mix known at 31 March 2017
This data is produced by the Services for Young Children Local Development Team (LDT) of Ofsted registered childcare from known changes in the childcare market that have occurred in the period.
Table 1: Childcare Places Source: All Services Report, Capita
Provider type
Total number of providers gained or settings that have extended places
Total number of registered places gained (if known)
Total number of providers lost
Total number of registered spaces lost (if known)
Net growth or loss of places since the last quarter (- / + )
Childminders
Q1 2 Q2 4 Q3 7 Q4 -
6 12 21 -
5 7 3 3
15 21 9 9
-9 -9
+12 -9
Home child carers
Q1 2 Q2 - Q3 -
2 - -
1 4 4
1 4 4
+1 -4 -4

6
Q4 -
- 1 1 -1
EYE Non domestic premises – full day care
Q1 - Q2 - Q3 - Q4 -
- - - -
- - - -
- - - -
- - - -
EYE Non domestic premises – term-time care
Q1 - Q2 - Q3 - Q4 -
- - - -
- - - -
- - - -
- - - -
Holiday playschemes
Q1 - Q2 - Q3 - Q4 -
- - - -
- -
1 -
- -
40 -
- -
-40 -
Out of School clubs (inc. Breakfast and After School)
Q1 1 Q2 - Q3 - Q4 -
10 - - -
- - - -
- - - -
+10 - - -
Comment: During this year there has been nominal change to the childcare places. An after school club opened during quarter 1 in the Odiham ward, creating 10 new childcare places. Quarter 3 saw the closure of a holiday playscheme in the Eversley ward of 40 places. There is no other holiday playscheme provision in this ward (apart from services delivered by 3 childminders in the ward), which would suggest that further review is required. There has been a total net loss of 15 childcare places with childminders (based on each childminder providing an average of 3 places). There was a further loss of 8 childcare places with home child carers (based on each home child carer providing an average of 1 place). In the year there is a net loss of 53 childcare places across all childcare provisions. 2.2 New childcare and early years provision known at 31 March 2017 This is data that is known to the Local Development Team of childcare developments that have completed registration in the period. That data includes all types of provision including childminders.

7
Table 2 New Provisions Source: All Services Report, Capita ONE
Ward Postcode Age range Registered places
Type of setting FDC/SC/OSC/CM/
HC
Church Crookham GU52
0-8 3 Childminder
Church Crookham GU52
0-8 3 Childminder
Eversley RG27
0-8 1 Home Child Carer
Fleet Courtmoor GU52
0-8 3 Childminder
Fleet North GU51
0-8 3 Childminder
Fleet North GU51
0-8 3 Childminder
Fleet North GU51
0-8 3 Childminder
Hartley Wintney RG27
0-8 3 Childminder
Hartley Wintney RG27
0-8 3 Childminder
Hartley Wintney RG27
0-8 1 Home Child Carer
Hook RG27
0-8 3 Childminder
Hook RG27
0-8 3 Childminder
Long Sutton RG29
0-8 3 Childminder
Odiham RG7
5-7 10 Out of School Care
Yateley North GU46
0-8 3 Childminder
Yateley West GU46
0-8 3 Childminder
Total - 51 -
Comment: New known Ofsted registered childcare places created by settings or childminders during this reporting period are shown above. A total of 51 places were created.
2.3 Proposed childcare and early years provision known at 31 March 2017 This is proposed provision known to the Local Development Team. These provisions are expected to register with Ofsted but have not done so at the date of this report.
Table 3: Proposed Provision Source: All Services Report, Capita ONE
Ward Postcode Age range Registered places Type of setting FDC/SC/OSC/C
M/HC
Church Crookham West
GU52
0-8 3 Childminder

8
Fleet North GU51
0-8 1 Home Child Carer
Fleet West GU51
0-8 3 Childminder
Long Sutton RG29
0-8 1 Childminder
Yateley East GU46
0-8 3 Childminder
Total: - 11 -
Comment: There is no known childcare on domestic premises proposed as 31 March 2017. A total of 11 places are proposed. 2.4 Early years and childcare provision under threat of closure known at 31 March 2017 This data is provided by the Local Development Team to indicate areas where childcare operations are known to have difficulty in the childcare market. Table 4: Provision under threat of closure Source: LDT Quarterly Reports
Ward Postcode Age range Registered places Type of setting FDC/SC/OSC/C
M/HC
Fleet Central GU51 2-7 26 Sessional Care
Hartley Wintney RG27 0-5 56 Full Day Care
Total - 82 -
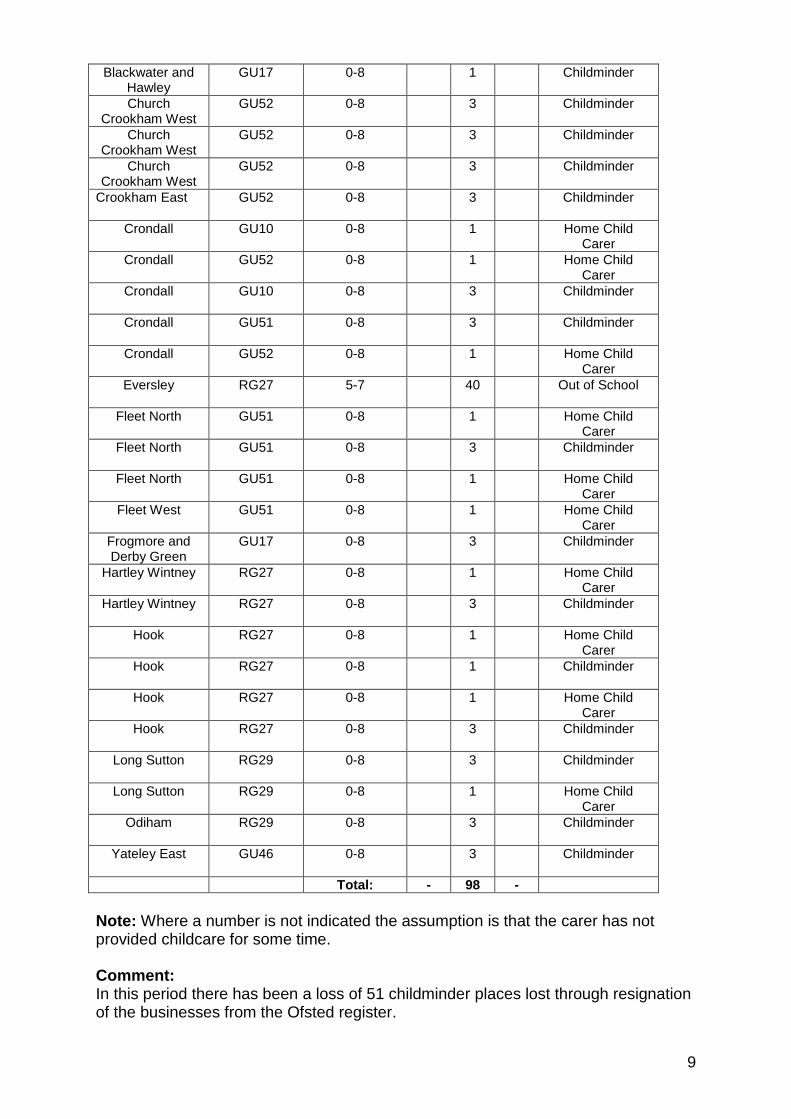
Comment: A pre-school in the Fleet Central ward is at high risk of closing if they are unable to find an alternative building as they have to be out of their current premises by April 2018. A day nursery in the Hartley Wintney ward received an ‘Inadequate’ Ofsted outcome and was at potential risk of closure. The LDT team worked with the setting and on re-inspection (6 March 2017) received a ‘Good’ Ofsted outcome. 2.5 Early years and childcare provision closed at 31 March 2017 This data provided by Local Development Team of known closures of childcare operations in the period. Table 5: Provision Closed Source: All Services Report, Capita ONE
Ward Postcode Age range Registered places Type of setting FDC/SC/OSC/C
M/HC
Blackwater and Hawley
GU17
0-8 3 Childminder
Blackwater and Hawley
GU17
0-8 1 Home Child Carer
Blackwater and Hawley
GU17
0-8 3 Childminder
9
Blackwater and Hawley
GU17
0-8 1 Childminder
Church Crookham West
GU52
0-8 3 Childminder
Church Crookham West
GU52
0-8 3 Childminder
Church Crookham West
GU52
0-8 3 Childminder
Crookham East GU52
0-8 3 Childminder
Crondall GU10
0-8 1 Home Child Carer
Crondall GU52
0-8 1 Home Child Carer
Crondall GU10
0-8 3 Childminder
Crondall GU51
0-8 3 Childminder
Crondall GU52
0-8 1 Home Child Carer
Eversley RG27
5-7 40 Out of School
Fleet North GU51
0-8 1 Home Child Carer
Fleet North GU51
0-8 3 Childminder
Fleet North GU51
0-8 1 Home Child Carer
Fleet West GU51
0-8 1 Home Child Carer
Frogmore and Derby Green
GU17
0-8 3 Childminder
Hartley Wintney RG27
0-8 1 Home Child Carer
Hartley Wintney RG27
0-8 3 Childminder
Hook RG27
0-8 1 Home Child Carer
Hook RG27
0-8 1 Childminder
Hook RG27
0-8 1 Home Child Carer
Hook RG27
0-8 3 Childminder
Long Sutton RG29
0-8 3 Childminder
Long Sutton RG29
0-8 1 Home Child Carer
Odiham RG29
0-8 3 Childminder
Yateley East GU46
0-8 3 Childminder
Total: - 98 -
Note: Where a number is not indicated the assumption is that the carer has not provided childcare for some time.
Comment: In this period there has been a loss of 51 childminder places lost through resignation of the businesses from the Ofsted register.

10
The closure of a holiday playscheme in the Eversley ward has appeared not to cause any known issues in the market as yet, although this together with the net loss of 51 childminder places continues to be monitored due to known housing developments. NB: Ofsted inspections are resulting in removal from the Early Years Register of childminders who are currently not working with early years children. Where a childminder has no child under 5 years of age they are moved to the Childcare Register (5-8 years). Indications are that many childminders hold on to their Early Year’s registration due to the higher cost of the Childcare Register only option. 2.6 Summary of Childcare Places In overall terms the summary data for Hart PVI places in group settings and childminders is shown in table 6 below. The information is shown by ward, and number of places including the number of available 2YO places and suggested 30 hour places. Table 6: Places summary Source: All Services Report, Capita ONE and 30 hours participation survey
Row Labels
Total number of places at Ward level
Number of Universal places at Ward level
Number of 2YO places at Ward level
Number of 30 hours places at Ward level
Hart District 2546 1662 529 1021
Blackwater and Hawley 109 82 22 20
Church Crookham East 0 0 0 0
Church Crookham West 7 8 3 7
Crondall 240 111 39 45
Crookham East 148 76 35 53
Crookham West and Ewshot 90 55 13 55
Eversley 110 74 8 13
Fleet Central 305 192 98 192
Fleet Courtmoor 72 78 16 48
Fleet North 345 163 22 136
Fleet Pondtail 53 53 13 43
Fleet West 43 23 20 23
Frogmore and Derby Green 80 69 38 52
Hartley Wintney 224 114 41 60
Hook 205 133 57 59
Long Sutton 61 40 18 40
Odiham 63 63 9 9
Yateley East 194 188 29 42
Yateley North 36 33 13 27
Yateley West 129 79 31 79
(blank) 32 28 4 18
Grand Total 2546 1662 529 1021

11
2.7 Development of childminder EYE provision Childminders play an important role in meeting parent’s childcare needs. Childminders usually look after between 3 and 6 children and are often flexible in catering for parent’s needs working in partnership with other settings and out of school clubs. In Hart there are a total of 192 Ofsted registered childminders, of which 94 deliver the free entitlement. Of those, 81 also deliver funded places for eligible two year olds. Table 7: Hart Childminder Distribution Source: All Services Report, Capita ONE
Row Labels Number of Childminders
Number of EYE Childminders
Number of 2yr accredited Childminders
Hart District Blackwater and Hawley 7 3 3
Church Crookham East 7 3 1
Church Crookham West 14 5 4
Crondall 1 1 Crookham East 7 7 7
Crookham West and Ewshot 5 5 4
Eversley 3 2 2
Fleet Central 10 5 5
Fleet Courtmoor 8 3 3
Fleet North 15 9 7
Fleet Pondtail 9 4 4
Fleet West 13 7 7
Frogmore and Derby Green 11 7 7
Hartley Wintney 12 4 3
Hook 25 6 5
Long Sutton 7 4 4
Odiham 3 1 1
Yateley East 10 7 4
Yateley North 16 8 7
Yateley West 9 3 3
Grand Total 192 94 81
Comment: In the ward areas of Crondall, Everlsey and Odiham there are low numbers of childminders delivering the free early years entitlement which suggests a further review, taking into account other provision in these areas. In the Crondall ward area there is only one early years childminder who is not currently providing services for eligible funded 2YO’s. Similarly there is only one early years childminder in the Odiham ward. Although they are accredited for 2YO funding, this could also be an area of concern in terms of sufficient provision to meet demand where the current take up of 2 YO places in Odiham is at 57% (see Table 8).

12
3.1 Early Years Education for Two Year Olds This is part of a national offer from the Department for Education (DfE) and has been developed to improve outcomes for identified two year olds who meet or their family’s income or circumstances meet, certain eligibility criteria. Further details can be found at http://www.hants.gov.uk/childrens-services/childcare/parents/cis/eye/2-year-old-offer-2.htm The take up of 2 year funding is monitored against the list of eligibility provided by the Department for Work and Pensions (DWP). The average take up of funded places is at 79% as of 21 April 2017 (with a further 3% added for non Hampshire residents). Take up is 85% in Hart, with the Crookham East, Crookham West, Hook and Yateley West wards indicating the highest number of children taking up their funded places. In contract the lowest numbers of children taking up their funded places are in the wards of Yateley East and Odiham. Only having one 2YO accredited childminder in the Odiham ward may have some bearing on this. According to the data provided by the DWP as at 7 September 2016 (table 8); the likely take up of 2YO funding by eligible children was more than double the actual take up of places during the spring 2017 term in the Yateley East ward. Further review is required to see if this is an ongoing situation and whether further promotion may be needed to parents, as well as further development of provision. Table 8: Spring 2017 take up against the DWP list of likely eligible 2 year children by ward Source: Hart DWP Data (2 Year Olds)
Spring Term data provided by DWP as at 7 September 2016 Capita One headcount - spring
2017. New Early Years Reporting Tool
- data extracted 21.04.17
Ward
1 Term: Jan - 17
2 Terms: Jan - 17, Apr - 17
3 Terms: Jan - 17, Apr - 17, Sep - 17
Grand Total %
No children % take-up
Blackwater and Hawley 4 1 5 10 7.9% 8 80%
Crookham East 1 3 1 5 4.0% 7 140%
Crookham West and Ewshot 4 5 7 16 12.7%
17 106%
Fleet Central 6 2 7 15 11.9% 12 80%
Fleet East 3 2 4 9 7.1% 8 89%
Fleet West 3 5 7 15 11.9% 13 87%
Hartley Wintney 7 4 8 19 15.1% 17 89%
Hook 4 1 5 10 7.9% 10 100%

13
Odiham 2 2 3 7 5.6% 4 57%
Yateley East 8 1 6 15 11.9% 6 40%
Yateley West 2 3 5 4.0% 5 100%
Hart 42 28 56 126 100% 107 85%
DWP list priority areas % DWP Hartley Wintney 15.1
Crookham West and Ewshot 12.7
Fleet Central 11.9 Yateley East 11.9 total % 51.6
3.2 Take up of the free Early Years Education entitlement by two, three and four year olds:
Take up of EYE funding by number of children, average funded hours and average additional hours is shown in Table 9. Where there is an increase in numbers of children from one period to the next and a reduction in average funded hours, it is possible that take up hours are being compressed to cater for additional children. SfYC monitors this situation closely to ensure that wherever possible parents are able to maximise their entitlement. See Appendix 1 for Table 9 Take up by ward and average funded hours. Comment: For the spring 2016/17 funded period the children in Hart accessed a lower amount of universal funded hours (12.78 hrs) per week then the Hampshire average of 13.12 hrs. During the same period children were accessing on average 5.24 additional hours per week compared to the Hampshire average of 4.37 hours. When this is calculated across the funding period Hart children were accessing on average 63.71 additional hours, compared to the Hampshire average of 52.82 hours. This data suggests that with the introduction of the extended free entitlement of early years education (’30 Hours Childcare’) that current parental requirements can be met within the market. What needs to be assessed is whether childcare providers will choose to provide these current additional hours based on the terms and conditions in place for the extended entitlement delivery. Table 10 shows take up against the small areas population figures (SAPF) by ward as of spring 2016/17 funded period. Where take up exceeds 100% against SAPF this indicates parents take their childcare in adjacent or nearby wards.

14
Table 10: Claims by ward measured against Small Area Population forecast figures Source: HCC Early Years Reporting Tool (Tab 9b)
District2yr old
Claims
2yr old
SAPF
% 2yr old
Take Up
3yr old
Claims
3yr old
SAPF
% 3yr old
Take Up
4yr old
Claims
4yr old
SAPF
% 4yr old
Take Up
Hart 110 1110 9.9% 1024 1145 89.4% 1185 1151 103.0%
Blackwater and Hawley Ward 8 86 9.3% 59 82 72.0% 86 81 106.2%
Crookham East Ward 8 77 10.4% 80 87 92.0% 83 85 97.6%
Crookham West and Ewshot Ward18 166 10.8% 153 161 95.0% 159 132 120.5%
Fleet Central Ward 13 90 14.4% 85 93 91.4% 101 105 96.2%
Fleet East Ward 8 91 8.8% 95 99 96.0% 90 106 84.9%
Fleet West Ward 11 134 8.2% 118 149 79.2% 141 139 101.4%
Hartley Wintney Ward 19 101 18.8% 89 95 93.7% 120 116 103.4%
Hook Ward 9 99 9.1% 90 91 98.9% 106 93 114.0%
Odiham Ward 4 103 3.9% 109 109 100.0% 117 118 99.2%
Yateley East Ward 6 87 6.9% 67 87 77.0% 101 93 108.6%
Yateley West Ward 6 76 7.9% 79 92 85.9% 81 83 97.6%
Grand Total 110 1110 9.9% 1024 1145 89.4% 1185 1151 103.0% Hampshire Total 2787 15432 18.1% 14741 15902 92.7% 16008 16306 98.2%
Comment: The SAPF data is a forecast and comparing actual take up of places to this suggests that the Hart district take up of 2 and 3 year old early years education is below the Hampshire average, though 4 year old take up is higher than the Hampshire average. The take up data suggests that further investigation is required to support take up of 2 and 3 year old places in the district. 4 Development for 30 Hours Childcare Assessing the potential demand for 30 hours childcare from September 2017 is currently a key priority for both the local authority and providers. SfYC have developed a forecaster to help providers assess the potential numbers of eligible parents who may take up their entitlement. This may be found at: http://www.hants.gov.uk/childrens-services/childcare/providers/eye-eysff/thirtyhours-childcare.htm Table 11 indicates the likely number of hours required to fulfil possible demand from eligible parents. The main assumptions behind the modelling are that 89% of the numbers for working families with 3 and 4 year olds are likely to meet the eligibility criteria and that of this number 80% are highly likely to require their increased entitlement. Two year old children are not eligible for the increased entitlement. The numbers of two year olds are provided for indication purposes as they will most likely form the basis of the three year cohort in September 2017 and many funded two year olds are from low income working families who will see the benefit to the 30 hours offer.

15
Table 11: Potential 30 hours requirement by ward Source: Early Years Forecaster (30 Hours tab)
Row Labels
Child
Population
(dependent
on age
selection)
Population
in Working
Family
(dependent
on age
selection)
Earnings
Eligible
(89% of
Hampshire)
Children
with
SEND
(6.2%)
SEND
Support
Claimant
s (1.9%)
Sum of
80%
likely
take up
Sum of
Total
possible
hours
needed
Hart
Blackwater and Hawley
3yo 86 64 57 4 1 45 1365
4yo 85 21 19 1 0 15 459
Blackwater and Hawley Total 171 85 76 5 2 61 1823
Crookham East
3yo 80 60 54 4 1 43 1292
4yo 78 20 18 1 0 14 428
Crookham East Total 158 81 72 5 2 57 1720
Crookham West and Ewshot
3yo 173 130 116 8 2 93 2782
4yo 144 37 33 2 1 26 787
Crookham West and Ewshot Total 317 167 149 10 3 119 3569
Fleet Central
3yo 92 66 58 4 1 47 1399
4yo 103 25 22 2 0 18 533
Fleet Central Total 195 90 80 6 2 64 1932
Fleet East
3yo 91 66 58 4 1 47 1399
4yo 99 24 22 2 0 17 518
Fleet East Total 190 90 80 6 2 64 1917
Fleet West
3yo 143 101 90 6 2 72 2154
4yo 135 32 29 2 1 23 691
Fleet West Total 278 133 119 8 3 95 2846
Hartley Wintney
3yo 87 60 53 4 1 43 1281
4yo 113 26 24 2 1 19 566
Hartley Wintney Total 200 86 77 5 2 62 1847
Hook
3yo 94 70 63 4 1 50 1502
4yo 97 25 22 2 0 18 527
Hook Total 191 95 85 6 2 68 2029
Odiham
3yo 129 89 79 5 2 63 1891
4yo 117 27 24 2 1 19 583
Odiham Total 246 116 103 7 2 82 2475
Yateley East
3yo 80 60 53 4 1 43 1280
4yo 90 23 20 1 0 16 489
Yateley East Total 170 83 74 5 2 59 1769
Yateley West
3yo 85 66 59 4 1 47 1419
4yo 85 23 20 1 0 16 482
Yateley West Total 170 89 79 6 2 63 1901
Hart Total 2286 1116 993 69 21 794 23828

16
Comment: The information provided is a forecast based on assumption. With this in mind the data indicates that in the Crookham West and Ewshot, Fleet West and Odiham wards there is potentially a likely higher take up of the extended entitlement hours. Looking at the current services delivered by childminders in these wards (Table 7) there is an opportunity to engage with a number of them in the Fleet West and to a smaller extent, Odiham wards, in order to develop further early years education provision. The 1021 places available for ’30 Hours’ that are identified in the Places Summary (Table 6) suggests that there will be sufficient places provided by PVI settings and childminders in order to meet the forecasted parental requirements of 794 places. Based on the Hampshire parent survey undertaken in summer 2016 it is likely that not all parents will take up their full entitlement. The survey suggests 80% of respondents would take up some or all of their free hours. 5 Quality of the Ofsted Registered provision: Development of high quality childcare provision is essential to good outcomes for children and the improvement of parental choice. Table 12 indicates the numbers of Private, Voluntary and Independent (PVI) provider per ward by Ofsted outcome. In the year 2017 there were three provisions in Hart where Ofsted have judged the provision to ‘Requires Improvement’. Where Ofsted ratings are less than ‘Good’ the Local Development Team have a statutory duty to offer advice, support and guidance to improve the quality of their provision. These settings have accepted this support and are working hard to improve their provision.

17
Table 12: Ofsted outcome by number of settings by ward Source: All Services Report, Capita ONE
Row Labels Good Met
Not Met
(with
actions) Outstanding
Requires
Improvemen
t Satisfactory
Grand
Total
Hart District
Basing 1 1
Blackwater and Hawley 7 1 8
Church Crookham East 4 1 2 3 10
Church Crookham West 4 3 1 8
Crondall 1 1 3 5
Crookham East 5 6 11
Crookham West and Ewshot 3 3 6
Eversley 2 1 2 1 6
Fleet Central 9 2 3 14
Fleet Courtmoor 5 2 2 9
Fleet North 10 4 1 4 1 20
Fleet Pondtail 3 2 5 10
Fleet West 7 5 5 17
Frogmore and Derby Green 10 1 3 14
Hartley Wintney 7 5 4 16
Hook 13 3 11 27
Long Sutton 3 3 1 7
Odiham 2 1 1 2 6
Yateley East 6 5 11
Yateley North 10 2 2 1 15
Yateley West 8 1 1 10
Hart District Total 119 35 6 67 3 1 231 6 Development of provision for Special Needs Services for Young Children’s Inclusion Team are committed to ensuring that all eligible children are able to attend an early years or childcare setting irrelevant of any disability or additional support need. Ideally we would see this happening in the child’s local setting or parents choice of setting, however where a child’s needs cannot be met by this provider we will work with partners to support the identification of an appropriate alternative. The Inclusion Team will use a range of resources to support settings to be able to provide quality care for all children. This will include:
the provision of additional funding through the Inclusion Fund process
direct support from the Area Inclusion team
outreach support from one of the contracted expert providers
support from the Portage Service, and training or support groups. Table 13: Support provided for SEN children Source: SfYC Hart & Rushmoor Inclusion Team
Hart
No. of children supported by area inclusion team
87
Portage case load core 18
Portage Plus 0
Portage Outreach 12

18
No. of settings receiving early years outreach
8
7. Development of out of school and holiday provision The provision of out of school care and holiday club places continues to be an important component of the childcare market. The Local Development Team is not aware of parents whose needs are not being met in this sector. However the position continues to be monitored, particularly in the light of the 30 hour childcare policy which is likely to require partnership working between childminders and settings to enable eligible parents to access their entitlement. Table 14 below sets out the availability and type of out of school places by ward in Hart. An after school club opened during quarter 1 in the Odiham ward, creating 10 new childcare places. Quarter 3 saw the closure of a holiday playscheme in the Eversley ward of 40 places. Table 14: Number of Out of School settings by ward Source: All Services Report, Capita ONE
Number of providers Column Labels
Row Labels After School club
Breakfast Clubs
Holiday Playscheme
Grand Total
Hart District Church Crookham East 1 1 1 3
Church Crookham West 1
1
Crondall 1
1
Fleet Courtmoor
1 1
Fleet North 2
2
Fleet West 1 1
2
Frogmore and Derby Green 1 1
2
Hartley Wintney
1
1
Hook
1 1
Long Sutton
1 1
Odiham 1
1
St Michael 1
1
Yateley East
1 1
Yateley West 1 1 1 3
Hart District Total 10 5 6 21
Comment: There is out of school provision in every ward though due to the sparsity of the number of settings an assumption could be made that childminders are providing a significant amount of out of school care in the district. The wards of Fleet Courtmoor, Hartley Wintney, Hook, Long Sutton and Yateley East do not have after school group setting provision and eight wards do not have holiday playscheme provision.

19
Further development of group settings may be required in order to provide more choice for working parents.
8. Parental demand There have been no instances of un-met parent demand in the Hart area in the period covered by this report. This suggests there are generally sufficient places to meet parents’ needs across all sectors. This may change with the extended entitlement of early years education (‘30 Hours Childcare’) for eligible families; so this will be monitored. 9. Conclusion The key elements of our sufficiency duty and actions for 2017 are detailed in the CSA action plan attached. There are generally sufficient places in Hart to support demand as 31 March 2017. While it is noted that 10 additional after school places have been created there has been no movement in the number of sessional or full day care childcare places. However there are specific focus areas receiving attention where there are stresses in balancing the supply of places to demand. Linking to the action plan (Appendix 2), the priority is to continue to monitor take up, identify where this needs to be maximised and to ensure that take up continues to meet the needs of parents. This work is ongoing. The Childcare Development and Business Officers across the county have also begun to explore ways of working with Job Centre Plus sites to help the DWP staff teams identify childcare opportunity for parents seeking to return to work.

20
Appendix 1 Table 9 – take up by ward and average funded hours Source: HCC Early Years Reporting Tool (Tab 9b)
Child Ward2016/2017
Autumn
2016/2017
Spring
2017/2018
Summer
2016/2017
Autumn
2016/2017
Spring
2017/2018
Summer
2016/2017
Autumn
2016/2017
Spring
2017/2018
Summer
2016/2017
Autumn
2016/2017
Spring
2017/2018
Summer
Blackwater and Hawley 82 106 122 57.62 35.53 34.46 13.56 13.19 13.04 4.14 3.01 2.79
Crookham East 95 122 132 107.06 78.80 92.15 13.10 12.76 12.97 7.30 6.59 6.15
Crookham West and Ewshot 165 237 284 94.85 73.90 84.84 13.23 12.84 12.76 6.51 6.07 5.71
Fleet Central 116 147 168 84.07 63.39 89.42 12.57 12.62 12.67 5.49 5.16 5.28
Fleet East 113 143 167 101.23 71.86 110.06 12.58 12.53 12.55 6.36 5.78 6.47
Fleet West 164 195 224 114.68 66.58 122.43 12.79 13.06 13.22 7.86 5.51 8.27
Hartley Wintney 151 179 200 60.32 48.26 65.66 12.31 12.41 12.25 4.37 4.00 4.47
Hook 114 142 162 113.00 77.27 125.66 12.58 12.73 12.37 7.32 6.23 7.08
Odiham 138 173 188 75.18 69.82 61.18 12.41 12.64 12.77 5.28 5.81 4.46
Yateley East 111 130 146 47.07 43.84 31.07 12.92 12.88 12.72 3.40 3.71 2.54
Yateley West 86 115 138 79.24 58.57 34.29 12.92 13.04 12.63 5.02 4.77 2.50
1335 1689 1931 86.11 63.71 80.55 12.78 12.78 12.72 5.83 5.24 5.28
Number of Children Average Additional Hours Week Average Additional Hours Period Average of Funded Hours
21
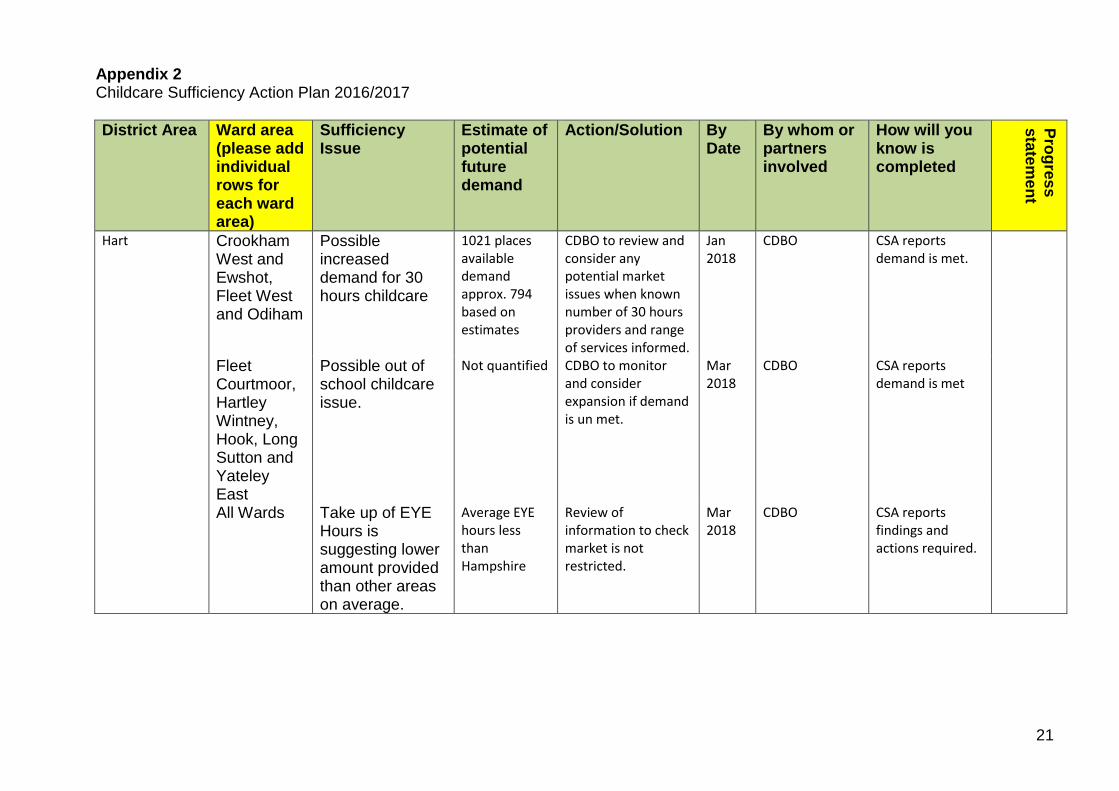
Appendix 2 Childcare Sufficiency Action Plan 2016/2017
District Area Ward area (please add individual rows for each ward area)
Sufficiency Issue
Estimate of potential future demand
Action/Solution By Date
By whom or partners involved
How will you know is completed
Pro
gre
ss
sta
tem
en
t
Hart Crookham West and Ewshot, Fleet West and Odiham
Possible increased demand for 30 hours childcare
1021 places available demand approx. 794 based on estimates
CDBO to review and consider any potential market issues when known number of 30 hours providers and range of services informed.
Jan 2018
CDBO CSA reports demand is met.
Fleet Courtmoor, Hartley Wintney, Hook, Long Sutton and Yateley East
Possible out of school childcare issue.
Not quantified CDBO to monitor and consider expansion if demand is un met.
Mar 2018
CDBO CSA reports demand is met
All Wards Take up of EYE Hours is suggesting lower amount provided than other areas on average.
Average EYE hours less than Hampshire
Review of information to check market is not restricted.
Mar 2018
CDBO CSA reports findings and actions required.