Embed Size (px)
Citation preview
R.E.A. HOLDINGS PLC
Half yearly report
2017

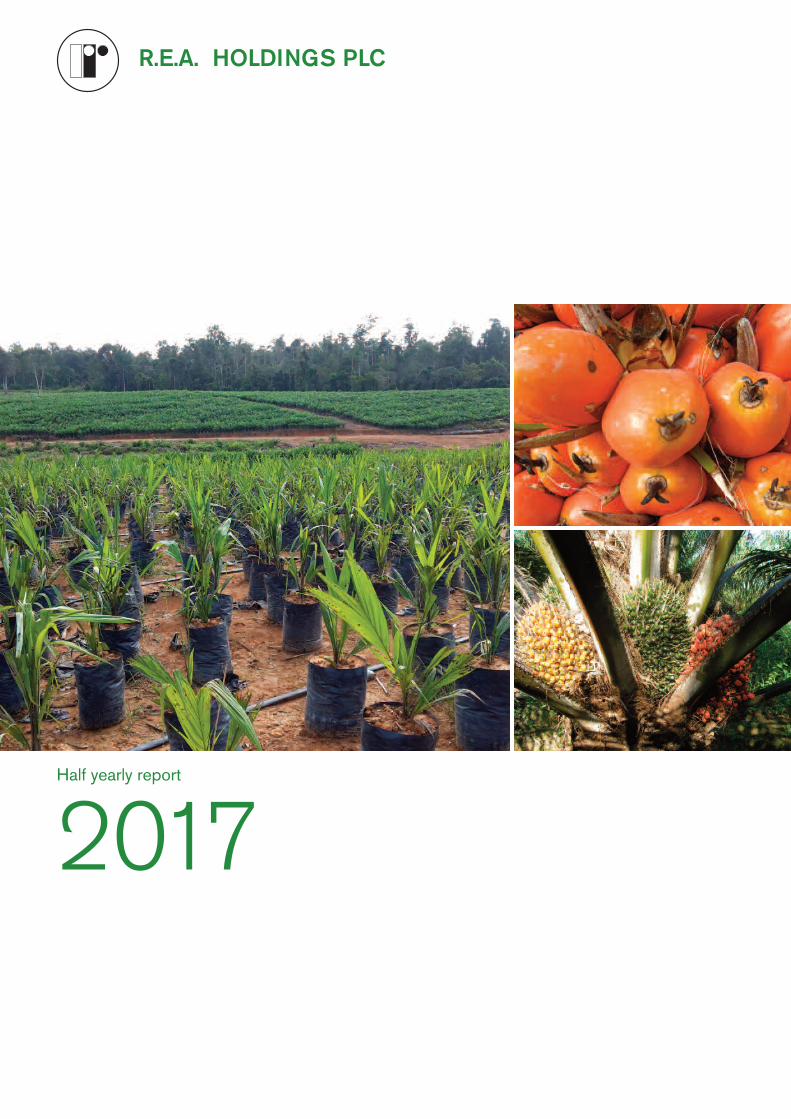
R.E.A. Holdings plc (“REA”) is a UK company of whichthe shares are admitted to the Official List and totrading on the main market of the London StockExchange.
The REA group is principally engaged in the cultivationof oil palms in the province of East Kalimantan inIndonesia and in the production and sale of crude palmoil (“CPO”) and crude palm kernel oil (“CPKO”).
1R.E.A. Holdings plc Half yearly report 2017
6 months 6 monthsto 30 June to 30 June
2017 2016
Results ($’000)Revenue 46,275 39,337Earnings before interest, tax,
depreciation and amortisation 8,348 7,477Loss before tax (15,708) (5,190)Loss for the period (14,449) (4,437)Loss attributable to
ordinary shareholders (14,144) (7,911)Cash (utilised)/generated by operations (799) 1,165
Loss per share (US cents) (34.6) (21.5)
Average exchange ratesIndonesian rupiah to US dollar 13,344 13,479US dollar to pound sterling 1.27 1.43
FFB crops (tonnes)Group harvested 241,235 225,171Third party harvested 52,780 48,249
Total 294,015 273,420
Production (tonnes)FFB processed 288,477 271,317FFB sold 5,892 2,443CPO 63,867 64,618Palm kernels 12,776 12,967CPKO 4,583 4,863
Extraction rates (percentage)CPO 22.1 23.8Palm kernel 4.4 4.8CPKO 37.2 31.9
References to group companies in this report are as definedunder the map on page 3.
References to “dollars” and “$” are to the lawful currency ofthe United States of America.
References to “rupiah” are to the lawful currency of Indonesia.
Key statistics Contents
Key statistics 1
Overview and highlights 2
Maps 3
Interim management report 4
Risks and uncertainties 10
Going concern 11
Directors’ responsibilities 12
Consolidated income statement 13
Consolidated balance sheet 14
Consolidated statement of comprehensive income 15
Consolidated statement of changes in equity 15
Consolidated cash flow statement 16
Notes 17

2
Overview
Financial
• Revenues up 18 per cent to $46.3 million (2016: $39.3million) reflecting the recovery in operational performancein May and June and firmer selling prices
• Cost of sales increased to $39.1 million (2016: $32.5million) reflecting increased volumes, increased paymentsfor external FFB and investment in rehabilitation of themature areas
• EBITDA increased to $8.3 million (2016: $7.5 million),after $1.1 million of one off costs related to staff changesand the reorganisation of Indonesian offices
• Pre-tax loss of $15.7 million (2016: $5.2 million) – mainlydue to mark-to-market movements on foreign currencyliabilities and produce stocks
• Average selling prices for CPO of $622 (2016: $516)and for CPKO of $1,290 (2016: $985)
• Two year refinancing of group indebtedness largelycomplete, with £8.3m sterling notes due December 2017
Agricultural operations
• Improved crop in May and June contributing to increase inFFB to 241,235 tonnes (2016: 225,171 tonnes)
• Third party FFB of 52,780 tonnes (2016: 48,249 tonnes)
• Extraction rates slightly lower at 22.1 per cent (2016:23.8 per cent), reflecting harvesting and logisticsdifficulties in the first four months of the period; ratesimproved in May and June
• Strong recovery in July and August: combined FFB of95,000 tonnes (July and August 2016: 45,000 tonnes)and extraction rate of 23.2 per cent
• Conclusion of PU land transaction
• After taking account of adverse weather impact, revisedtarget of 3,000 hectares of new plantings in 2017, with1,000 hectares carried over to first quarter of 2018
Stone and coal operations
• Operations started on limestone quarry adjacent to thePBJ property, with 12,000 tonnes of stone now deliveredto the crushing facility at PBJ
• Arrangements proceeding for mining Kota Bangun coalconcession and acquiring port access for loading andbarging, as well as sale of the existing coal stockpile
Sustainability
• RSPO recertification of Cakra and Perdana oil millsachieved
• RSPO and ISCC surveillance audits completedsuccessfully
• Third biennial sustainability report to be published shortly
Outlook
• Significant increase in crop production - combined cropfor July and August more than double the same periodlast year
• Expected FFB crop for 2017 around 600,000 tonnes(2016: 468,000 tonnes); in excess of 700,000 tonnes in2018
• Increasing revenues and improving extraction rates with adirect positive impact on profits in second half due tofixed cost base
R.E.A. Holdings plc Half yearly report 2017
Operationally the group has turned around. The accompanying results reflect the problems of the difficult past two years whichare now largely behind us. FFB production in the second half of 2017 is expected to be 50 per cent higher than in the first half.Crops started to recover in May and the recovery has been strengthening month by month since then, driven by improvements inharvesting, the increased fertiliser programme and optimisation of field disciplines. Incentive targets for harvesters are supportingthe increase in production while rehabilitation of infrastructure is improving field access and crop evacuation. There should befurther significant progress in 2018 with an FFB crop projected at comfortably over 700,000 tonnes against 468,000 tonnes in2016.
Since revenues from additional crops and higher extraction rates fall largely through to the bottom line, financial performanceshould mirror operational performance with significantly better results in the second half of 2017 and again better in 2018.
Highlights

3
Maps
The smaller map shows the location of the group’s operations within the context of South East Asia. Thelarger map provides a plan of the operational areas and of the river system by which access is obtained to themain areas.
KeyMethane capture plantOil millStone sourceCoal concessionTank storage
EAST KALIMANTAN
Muara Ancalong
Bontang
Kota BangunTenggarong
Tabang
Kembang Janggut
Balikpapan
Sentekan River
Mahakam River
Belayan River
Mahakam River
▼
0 10 20 30 40 50 km
Senyiur River
Kedang Kepala River
MAKASSAR STRAIT
Samarinda
MM
R.E.A. Holdings plc Half yearly report 2017
CompaniesCDM PT Cipta Davia MandiriKKS PT Kartanegara KumalasaktiKMS PT Kutai Mitra SejahteraPBJ PT Putra Bongan JayaPBJ2 PT Persada Bangun JayaREAK PT REA Kaltim PlantationsSYB PT Sasana Yudha BhaktiPU PT Prasetia UtamaSYB SYB land transfer

4
Results
Salient items, group revenue and loss before tax for the sixmonths to 30 June 2017, with comparative figures for 2016,were as follows:
6 months 6 months Year to to 30 June to 30 June 31 December 2017 2016 2016 $’m $’m $’mMark-to-market items (6.0) 1.3 8.4One off items (1.1) 1.1 1.1 (7.1) 2.4 9.5
Revenue 46.3 39.3 79.3Other net costs (54.9) (46.9) (98.1) (8.6) (7.6) (18.8)
Loss before tax (15.7) (5.2) (9.3)
As reported under “Agricultural operations” below, the year2017 to-date has seen a progressive and marked recovery inoperational performance and the group is confident that thiswill continue. However, crops only started to improve fromMay so that crops to end June were only slightly ahead ofthose of 2016. With better prices largely offset by additionalcosts incurred on rehabilitation of the mature areas and anincrease of $1.8 million in the depreciation charge, it was tobe expected that the operating loss for the first half of 2017would be not dissimilar from that of the corresponding periodin 2016 and this proved to be the case.
The increased loss before tax principally reflected adversemovements between the six months to 30 June 2017 and thecorresponding period of 2016 of $2.2 million in respect ofone off items and of $7.3 million in respect of mark to marketdifferences on foreign currency liabilities and produce stocks.The one off item of $1.1 million in 2017 comprised costsrelated to staff changes and the reorganisation of the group’sIndonesian offices while 2016 benefited from a one offreceipt of $1.1 million booked in investment revenues.
Earnings before interest, depreciation, amortisation and taxamounted to $8.3 million for the six months to 30 June 2017(2016: $7.5 million).
Specific components of the results
Cost of sales for the six months to 30 June 2017, withcomparative figures for 2016, was made up as follows:
6 months 6 months Year to to 30 June to 30 June 31 December 2017 2016 2016 $’m $’m $’mDepreciation and amortisation 10.8 9.0 21.0Purchase of external FFB 7.1 3.8 9.1Estate operating costs 21.2 19.7 41.7 39.1 32.5 71.8
As noted in previous reports, the amendment of IAS 41Agriculture effective 1 January 2016 has resulted in thediscontinuation of the previous movement in the fair value ofbiological assets and its replacement by a depreciation charge.Whilst this change has no effect on the group’s cash flows, itmeans that the group now reports a depreciation charge thatis higher and profits that are lower than they would have beenapplying the previous accounting provisions of IAS 41.
The increased cost of purchasing external fresh fruit bunches(“FFB”) reflected a slight increase in the volume purchased,the payment of higher purchase prices than in 2016 and thepayments of premia for better quality FFB. The prices for thirdparty fruit are set monthly by a local government authority andare based on prices prevailing in the preceding month. In aperiod of falling prices, such as occurred in the six months to30 June 2017, the prices set will be above prevailing spotprices. Margins earned by the group on milling external FFBduring this period were therefore lower than normal.
The reported increase in operating costs of $1.5 millionrepresented additional expenditure on harvesting, road upkeepand weeding as part of the work on the rehabilitation of themature areas referred to above.
Administrative expenses at $7.3 million were much in line withthe $7.2 million reported in 2016. The 2017 figure wouldhave been lower were it not for the one off costs alreadymentioned in relation to staff changes and the combination ofthe former Jakarta and Samarinda offices into the group’s newoffice in Balikpapan.
Investment revenues in the six months to 30 June 2016 of$1.2 million included interest of $1.1 million in respect of a taxrefund. This was a one off item and, as a result, investmentrevenues for the six months to 30 June 2017 weresubstantially lower at $0.3 million.
Finance costs amounted to $13.5 million (2016: $4.9 million).A major component of the increase was exchange losses of$4.2 million in 2017 (arising from the strengthening of sterlingand the rupiah against the dollar over the first six months of2017) against exchange gains of $2.1 million in 2016.
Interim management report
R.E.A. Holdings plc Half yearly report 2017

5
Interest incurred was also higher due to the combination of anincreased level of borrowings and a greater proportion of bankloans being denominated in rupiah (with rupiah borrowingscarrying interest at significantly higher rates than dollarborrowings).
The tax credit for the six months to 30 June 2017 of $1.3million has been stated after providing $0.9 million againstdeferred tax credits previously recorded against losses whichmay not now be capable of use prior to time expiry and afterdeduction of a further $1.4 million in respect of interestcharges disallowed in certain of the Indonesian subsidiariesfollowing the recent introduction of legislation limiting thedeductibility of interest.
Ordinary dividend
In line with previous indications and in view of the currentfinancial performance and the need to fund the continuingdevelopment programme that is important to the group’sfuture, the directors do not consider it appropriate to declarean interim ordinary dividend in respect of 2017. If cropscontinue to recover as expected, prices for the group’s palmproducts are maintained at around current levels and the coaloperations start to return cash to the group, the directors hopethat the payment of ordinary dividends can be resumed at anearly date.
Agricultural operations
The key agricultural statistics were as follows:
6 months 6 months to 30 June to 30 June 2017 2016FFB crops (tonnes)Group harvested 241,235 225,171Third party harvested 52,780 48,249
Total 294,015 273,420
Production (tonnes)Total FFB processed 288,477 271,317CPO 63,867 64,618Palm kernels 12,776 12,967CPKO 4,583 4,863
Extraction rates (percentage)CPO 22.1 23.8Palm kernel 4.4 4.8CPKO 37.2 31.9
Rainfall (mm)Average across the estates 2,034 1,574
As previously reported, the harvesting and transportationdifficulties experienced at the end of 2016 continued into thefirst half of 2017 but the operating situation steadily improved
R.E.A. Holdings plc Half yearly report 2017
over the period and this improvement is continuing into thesecond half. Crops started to recover in May and subsequentfurther recovery has been such that the combined crop forJuly and August amounted to 95,000 tonnes against 45,000tonnes in 2016. Third party fruit purchases are alsoincreasing.
Harvester numbers are now close to their full complement andmore rigorous incentive targets are supporting the drive toincrease production. As previously reported, increasedfertiliser programmes were introduced into the mature areas in2016 and the benefit of these programmes and othermeasures to optimise field disciplines, supported by advicefrom the recently engaged agronomy adviser, are becomingprogressively evident.
Action to strengthen the group’s road infrastructure is steadilyimproving access to the mature areas and evacuation ofharvested crop to the group’s mills. Out of a total of some 244kilometres of main roads and collection roads, 120 kilometresare targeted for resurfacing in the coming months.
Mill extraction rates to June 2017 reflect the harvesting andtransportation difficulties of the first four months of the yearbut are also recovering. The CPO extraction rate for July andAugust combined was 23.2 per cent.
Works to improve the resilience of the group’s newest mill atSatria and to refurbish the last of four boilers in the older millsare now expected to be completed by mid 2018. Existingprocessing capacity is sufficient for the group’s ownprocessing requirements and to process expected crops fromsmallholders; the works currently in hand should ensure thatthere is adequate processing capacity at least until 2019when a further mill is envisaged at PBJ.
The CPO price, CIF Rotterdam, started the year in strongfashion rising from $790 per tonne at the beginning ofJanuary to $857 per tonne by the middle of the month on theback of generally lower production. Thereafter, with stocklevels increasing and expectations of significant productiongrowth in the second half of the year, the price drifteddownward reaching a low point of $645 at the end of June.Subsequent indications that production in the second half of2017 may be less buoyant than initially expected have beenaccompanied by some recovery in the price to its current levelof $737 per tonne and may be expected to support the priceremaining at this level into 2018.
CPKO prices in January maintained the exceptionally highpremia over CPO experienced in the last quarter of 2016,reaching a price of $1,800 per tonne, CIF Rotterdam, at theend of January. Prices then declined to approximately $1,000per tonne in late June before recovering to a current level of$1,300 per tonne, reflecting concerns at the continuedinadequacy of supplies of coconut oil for which CPKO can bea substitute.

Interim management reportcontinued
6
The average selling price for the group's CPO for the six-month period to 30 June 2017, on an FOB basis at the port ofSamarinda and after payment of export imposts, was $622per tonne (2016: $516 per tonne). The average selling pricefor the group's CPKO on the same basis was $1,290 pertonne (2016: $985 per tonne). In addition, the group wasable to realise a premium of $5.20 per tonne on 14,536tonnes of CPO sold as ISCC certified and a premium of $50per tonne on 1,500 tonnes of CPKO sold under the massbalance system during the half year to 30 June 2017.
Development work at PBJ and CDM was hampered by theweather conditions in the first half of 2017 as extensionplanting at both estates, planned to occur predominantly inlower lying areas, had to be delayed until consistently drierweather would permit bunding for flood control to becompleted. With drier weather settling in since August,construction of the bunding on the north west section of PBJis expected to be completed within the next few weeks.Bunding at CDM is also progressing well. In both cases, thenew bunding is to the same specification as the previouslyconstructed bunding at PBJ that proved completely effectivethroughout the heavy rains of the first half of the year.
The group had planned to plant 4,000 hectares across thePBJ and CDM estates during 2017, but the speed at whichthis planting can be completed will be dependent uponweather conditions and, as respects a limited portion of thearea, resolution of certain land matters. The group has nowset a target of completing 3,000 hectares in 2017 and thebalance of 1,000 hectares in the first quarter of 2018.
Cumulative development to 30 June 2017 is detailed below:
Six months to 30 June 2017 Hectares
Cleared, not yet planted at 1 January 2017 1,581
Cleared during the period 393Cleared, not yet planted
at end of period (1,733)Planted during the period 241
Sales of renewable energy to PLN, the Indonesian nationalelectricity company, for distribution to local villages amountedto over $305,000 in the six month period to the end of June2017 (2016: $278,000) with household take-up continuing togrow each month.
Implementing agreements were executed in July 2017 inrespect of the arrangements that were finalised late in 2015to sell land held by the group’s subsidiary company, SYB andacquire land held by PU. The agreements provided that SYBtransfer to an Indonesian company, PT Ade Putra Tanrajeng
(“APT”), land areas of 3,554 hectares held by SYB that overlapwith mineral rights held by APT. In exchange, ownership ofPU, an associate of APT that holds 9,097 hectares of fullytitled agricultural land, would be transferred to SYB and itslocal partner. The transfer of the PU shares has now beencompleted (with SYB taking 95 per cent of the shares) andAPT and its associates have been granted access to the SYBmining overlap areas pending the transfer of land titles relatingto those areas which will be completed in due course.
SYB now has full legal access to this additional land bank andplans to establish nurseries on the PU land and to negotiatecompensation arrangements with local villages that have landoverlapping the PU area, in preparation for the planting out ofareas designated for oil palm development.
Stone and coal operations
The limestone quarry adjacent to the group’s PBJ propertycommenced operations in May 2017 and some 12,000tonnes of stone have been delivered to the crushing facilitythat has been established on PBJ’s land. Crushing operationscommenced in early September. A proportion of the crushedstone is to be purchased by PBJ for road hardening, which isdue to begin later in 2017, and the balance sold to thirdparties.
Further consideration is being given to the development of thegroup’s andesite stone concession with a recent feasibilitystudy indicating a reduced upfront cost of opening a quarry atthis concession of some $3 million and the prospect of apayback in a few months. The group remains of the view thatthere is local demand for stone in the volumes that thefeasibility study assumes. For the moment, to the extent thatany further capital is to be committed to its stone and coaloperations, the group is giving priority to the reopening of itscoal concessions, as it believes that these offer greatercertainty of quicker returns with lower risk than the andesiteconcession.
Of the group’s two coal concessions, the most important is theKota Bangun concession as this principally contains highvalue semi-soft coking coal which is currently in good demand.The group is at an advanced stage in discussions with theowners of an adjacent mine and the local Indonesianauthorities with a view to acquiring from the adjacent ownerand relicensing an established loading point on the MahakamRiver, together with a coal conveyor crossing the group’sconcession and running to the loading point. At the sametime, the group is seeking to obtain rights to use the adjacentmine to access coal on the border of the group’s concession.Dewatering has been deferred pending completion of thesediscussions but can start immediately they are successfullyconcluded. The group is also taking steps to complete thesale of the existing coal stockpile at the concession of some16,000 tonnes, as soon as access to the loading point on theMahakam has been confirmed.
R.E.A. Holdings plc Half yearly report 2017

7
Efforts are continuing to conclude arrangements in respect ofthe group’s Liburdinding concession similar to those applicableto the Kota Bangun concession whereby a third party wouldmine on a basis that would give the group a guaranteedminimum revenue. Past discussions with potentially interestedparties have proved abortive but it is hoped that, with coalprices now at much better levels than for some time, apotentially interested party that is currently undertaking alimited drilling programme on the concession will be willing toproceed to an agreement following completion of that drilling.
Sustainability
The group’s third sustainability report will be published shortlyand will be available for download from the group’s website:www.rea.co.uk. This report monitors the group’s progress inmeeting its sustainability commitments and describes ingreater detail environmental and social challenges faced bythe group through 2015 and 2016.
After a delay of over a year following the RSPO recertificationaudits conducted in May 2016, the outstanding certificate forCakra oil mill (“COM”) was finally issued by the certifying bodyin August 2017. This means that both of the group’s oldermills, Perdana oil mill (“POM”) and COM, which are subject toaudits every five years under the RSPO system, are nowsuccessfully recertified. The newer Satria oil mill (“SOM”) hasyet to be audited owing to the continuing process of resolvingSYB's outstanding High Conservation Value (“HCV”)compensation liability in respect of 20 hectares, which wereinadvertently cleared without completion of the required RSPOprocedures. Resolution of this issue should be concluded inthe coming months.
As the HCV compensation process has progressed, the grouphas constructed further housing, healthcare and wastefacilities at SYB ensuring that villages meet the requiredstandards for the RSPO assessment. Internal audits havebeen conducted at SOM and Satria estate in preparation forthe eventual RSPO audit. All other audits conducted duringthe first half of 2017 have been concluded successfully: theannual RSPO surveillance audits were conducted by a thirdparty assessor for POM and its supply base in April 2017;ISCC audits for COM were conducted in February and forPOM and SOM in May.
For all new oil palm developments, the group follows theRSPO's New Planting Procedure (“NPP”). Following thereassignment in July 2017 of a land area held by PBJ2(known as PBJ2-Bongan) to PBJ, the NPP for PBJ has hadto be revised and resubmitted. The necessary assessments bya third party consultant are in the final stages and oncecompleted will be submitted to the RSPO for verification andapproval. The NPP for the area held by PBJ2 adjacent to SYB(PBJ2-Satria) has been audited by consultants and will shortly
be submitted to the RSPO for verification and approval. Nowthat the shares of PU have been transferred, PU can move tocomplete the NPP assessment process. The NPP for theKKS area to the north of CDM is at a less advanced stage butthe requisite documents have been prepared and a third partyconsultant is being engaged to complete the full assessmentprocess.
From 1 January 2017, the group ceased using the GreenPalmplatform to sell certificates derived from the sale of CPO andCPKO. Instead, the group now uses the RSPO's own bookand claim platform, PalmTrace, to facilitate the sale of RSPOcredits with one RSPO credit equivalent to one tonne ofRSPO certified CPO or CPKO. The RSPO no longerendorses GreenPalm and has replaced this with PalmTrace tomake the trading of credits more user friendly, cost effectiveand easier for members to register and trace their sustainableCPO and CPKO volumes.
Demand for book and claim credits is expected to weaken inthe future as global demand for segregated sustainable CPOincreases. Producing segregated sustainable CPO offers theprospect of larger sustainability premia than the mass balancesystem. However, as long as the group receives FFB fromnon-certified smallholders, its CPO production and sales mustfollow the mass balance supply chain model. Refusing toprocess non-RSPO certified smallholder FFB could have asignificant negative socio-economic impact on the localcommunities and could damage the relationships with thesecommunities that are now well established.
The group is therefore investigating the possibility ofreconfiguring its supply base, production and transportlogistics so as to allow one of the RSPO-certified mills toproduce segregated sustainable CPO, using FFB exclusivelyfrom the group’s own certified plantations, while maintainingthe mass balance approach at the other mills. This strategypresents significant logistical challenges that will requirecapital investment, but the group believes that it representsthe best option for achieving the higher premia available forsegregated CPO sales while securing the most sustainableand prosperous future for local communities and the group’sbusiness.
Financing
At 30 June 2017, the group continued to be financed by acombination of debt and equity (comprising ordinary andpreference share capital). There was a decrease in totalequity including non-controlling interests to $296.7 millionfrom $309.5 million at 31 December 2016.
Group indebtedness and related engagements at 30 June2017 totalled $238.5 million against $229.7 million at 31December 2016. Against this indebtedness, the group held
R.E.A. Holdings plc Half yearly report 2017

Interim management reportcontinued
8
cash and cash equivalents of $3.0 million (31 December2016: $24.6 million). The composition of the resultant netindebtedness of $235.5 million was as follows:
$’m
7.5 per cent dollar notes 2022(“2022 dollar notes”) ($24.0 million nominal) 23.6
9.5 per cent guaranteed sterling notes 2015/17 (“2017 sterling notes”) (£8.3 million nominal) 10.8
8.75 per cent guaranteed sterling notes 2020(“2020 sterling notes”) (£31.9 million nominal) 39.9
Loan from related party 5.4Loans from non-controlling shareholder 29.5Indonesian term bank loans 72.0Drawings under revolving credit facilities 57.3
238.5Cash and cash equivalents (3.0)
Net indebtedness 235.5
The above statement reflects the receipt in the period ofadditional loans from the non-controlling shareholder, DharmaSatya Nusantara Tbk (“DSN”) and its subsidiaries, of $11.7million and £3.9 million, a related party loan of $5.4 million, thesale of $4.9 million nominal of the 2022 dollar notes held bythe group in treasury at the end of 2016 and the repayment of$20.2 million nominal of 2017 dollar notes on 30 June 2017.
Since 30 June 2017, a further $1.0 million nominal of the2022 dollar notes held by the group in treasury at end 2016have been sold leaving $4.0 million still available for sale. Inaddition, the group has received a refund of previouslyoverpaid taxes equivalent to $4.7 million and, as a result ofthis refund, a further $750,000 from DSN as additionalconsideration for DSN’s acquisition of the 15 per cent interestin REAK that DSN acquired in 2016. The revolving creditfacilities provided by the group’s principal Indonesian bankerswere rolled over for a further twelve months at the end of July2017.
As previously reported, the group’s financial position has beenmuch improved over the last two years by the subscription ofsome $28.0 million for additional ordinary and preferencecapital, the issue of replacement sterling and dollar notes,maturing in, respectively, 2020 and 2022, totalling $65.0million, the loan and equity investment by the group’s newIndonesian partners, DSN, of $44.0 million, a new Indonesianterm bank loan equivalent to $18.0 million and extensions tothe maturity of other Indonesian bank borrowings. As a result,the refinancing of the group’s indebtedness is nowsubstantially complete, leaving £8.3 million of 2017 sterlingnotes falling due for redemption at the end of 2017.
To the extent that markets permit, during the coming months,the directors will seek to refinance a proportion of the 2017sterling notes by placing additions to existing issues of fixed
interest securities. At the same time, the group is continuing,and expects successfully to conclude, discussions with anumber of parties to increase the group’s immediate resourcesand to provide further funding going forward for the plannedextension planting programme and expansion of millingcapacity.
Whilst the foregoing measures should continue to ensureavailability of the funding that the group requires, the grouprecognises that it is now incurring a relatively high level ofinterest charges. As an immediate step to address this, thegroup is currently discussing with its principal Indonesianbankers the conversion of a substantial proportion of its rupiahdenominated borrowings into dollar denominated borrowings,upon which the group would then be charged interest at dollarinterest rates which are significantly lower than rupiah interestrates. The group is also exploring the possible divestment ofcertain outlying plantation assets which, if effected, wouldmaterially reduce the group’s overall borrowings.
Staff
Following the resignation of Mark Parry in February 2017,Carol Gysin assumed the position of group managing directorand George Kapitan moved from the role of PresidentCommissioner of REA Kaltim to that of President Director.With the appointment of an Indonesian President Director, thegroup has been able to assuage the concerns expressed bythe Indonesian authorities that contributed to Mark Parry’sresignation and cordial relations with the authorities have beenrestored.
A number of changes have been made to strengthen thesenior staff in the agricultural operations. A new head of millshas recently joined the group and two new estate controllerswill be joining in the next few weeks. All three of these newstaff members are expatriates with many years of experienceworking on plantations in Indonesia. This will further assist thereturn to best agricultural practices.
The group has also made changes to enhance coordinationbetween senior staff in London and Indonesia. The group’schief financial and legal officers, Martin Cooper and MatthewSalthouse, who are based in Singapore continue regularly tovisit Indonesia for extended periods to oversee theimplementation of the group’s strategies and policies.Matthew Salthouse is also a director of REAK. Similarly, LukeRobinow, who lives in Indonesia and is a commissioner ofREAK, provides the group with oversight of operationalactivities.
The group completed the relocation of its Indonesian headoffice to Balikpapan, in East Kalimantan, during the first half of2017 with the transfer to Balikpapan of the remaining stafffrom the finance and administration office in Samarinda.Combining all administrative activities within a single location,
R.E.A. Holdings plc Half yearly report 2017

9
closer to the group’s operations, is facilitating improvedinternal communication and other efficiencies.
Outlook
Crop yields are showing a material improvement and bunchcensuses indicate that cropping should continue at goodlevels for the rest of 2017. The overall FFB crop for the year(excluding third party fruit) should be in the region of 600,000tonnes. This would represent a 50 per cent increase insecond half crops over those of the first half. With improveddisciplines in the field, yields gradually benefiting from a moreintensive fertiliser regime and improved transport conditions,the directors have confidence that crops will continue torecover. The directors expect to budget for an FFB cropcomfortably in excess of 700,000 tonnes in 2018 and alsoexpect that crops will continue to grow for several yearsthereafter.
The resumption of coal mining activities, with operational risksbeing undertaken by third parties, now provides theopportunity to realise value from the group’s investment in coalconcessions where activity has been suspended since 2014.This will provide additional capital to fund the plannedextension planting programme. At the same time, the recentcompletion of the acquisition of PU surmounts a critical hurdlein ensuring the continuance of extension planting.
The group’s financial performance is driven by crop levels,extraction rates and prices. For a given mature area, costs ofagricultural operations are for the most part fixed andtherefore the major part of the extra revenue that should begenerated by the projected 50 per cent increase in crop in thesecond half of 2017, and the projected further increases in2018 and beyond, can be expected to flow through to profit.Such flow through will be further enhanced by anyimprovement in extraction rates. Self-evidently the group has,in recent years, been through a difficult period but, with priceslikely to remain stable into next year, the impact on profits ofincreased crops and improved extraction rates should not onlyprovide clear evidence that the financial condition of the groupis being restored but also progressively enable the group toachieve a level of returns commensurate with its capital base.
Approved by the board on 21 September 2017 and signed onits behalf by
DAVID J BLACKETTChairman
R.E.A. Holdings plc Half yearly report 2017
Risks and uncertainties
10 R.E.A. Holdings plc Half yearly report 2017
The principal risks and uncertainties, as well as mitigating and other relevant considerations, affecting the business activities ofthe group as at the date of publication of the 2016 annual report (the “annual report”) were set out on pages 36 to 41 of thatreport, under the heading “Risks and uncertainties”. A copy of the report may be downloaded from the company’s website atwww.rea.co.uk. Such risks and uncertainties in summary comprise:
Agricultural operationsClimatic factors Material variations from the normCultivation risks Impact of pests and diseasesOther operational factors Logistical disruptions to the production cycle, including transportation and input
shortages or cost increasesProduce prices Consequences of lower realisations from sales of CPO and CPKOExpansion Delays in securing land or funding for the extension planting programmeEnvironmental, social andgovernment practices Failure to meet expected standardsCommunity relations Disruptions arising from issues with local stakeholders
Stone and coal operationsOperational factors Failure by external contractors to achieve agreed targetsPrices Consequences of stone or coal price weaknessEnvironmental, social andgovernment practices Failure to meet expected standards
GeneralCurrency risk Adverse exchange movements between sterling or the Indonesian rupiah and the
dollarFunding Meeting liabilities as they fall due in periods of weaker produce pricesCounterparty risk Default by suppliers, customers or financial institutionsRegulatory and country exposure Failure to meet or comply with expected standards or applicable regulations; adverse
political or legislative changes in Indonesia
At the date of the annual report, the directors considered the risks in relation to climatic and other operational factors, produceprices and funding to be of particular significance. In the case of climatic and other operational factors and produce prices, thedirectors’ assessment reflected the negative impact on revenues that could be caused by adverse climatic conditions oroperational circumstances and, in the case of funding, the possibility that the group’s expansion programme might have to becurtailed.
More stable selling prices for the group’s produce combined with increasing production are improving revenues, which, togetherwith the further planned measures to improve the group’s funding position (as described under “Financing” in the Interimmanagement report above) are mitigating the funding risk. Subject to that, the directors consider that the principal risks anduncertainties for the second six months of 2017 continue to be those set out in the annual report as summarised above.
In reaching the above conclusion, the directors have also considered the implications of termination of UK membership of theEuropean Union in the context of the group and its operations. Any further weakness of sterling will positively impact the groupas its operations are essentially dollar denominated and, accordingly, costs and borrowings incurred in sterling will be reduced indollar terms.

11R.E.A. Holdings plc Half yearly report 2017
Going concern
In the statements regarding viability and going concern on pages 43 and 44 of the 2016 annual report published in April 2017,the directors set out consideration with respect to the group’s capital structure and their assessment of liquidity and financingadequacy.
As noted under “Financing” in the Interim management report above, the group’s financial position has been strengthened by thereceipt in April 2017 of further loans from the Dharma Satya Nusantara Tbk group (“DSN”), by rollover of the group’s workingcapital facilities in Indonesia in July 2017, by the sale since the beginning of 2017 of $5.9 million nominal of the 7.5 per centdollar notes 2022 (the “2022 dollar notes”) held in treasury and by a significant recovery of previously overpaid Indonesian taxand a related further payment by DSN. In addition, the group expects successfully to conclude current discussions to increasethe cash resources immediately available to the group and to provide funding going forward for planned expansion.
These measures, combined with increasing cash flows from the plantation operations and the sale in due course of the remaining$4.0 million nominal of 2022 dollar notes held in treasury, will underpin the group’s improving liquidity. That position will be furtheraugmented if, as is proposed, the group refinances a proportion of the £8.3 million nominal of 9.5 per cent sterling notes 2017 byplacing additions to existing issues of fixed interest securities.
Accordingly, the directors have a reasonable expectation that the company and the group have adequate resources to continue inoperational existence for the foreseeable future and they continue to adopt the going concern basis of accounting in preparingthe accompanying financial statements.

Directors’ responsibilities
12 R.E.A. Holdings plc Half yearly report 2017
The directors are responsible for the preparation of this halfyearly financial report.
The directors confirm that:
• the accompanying condensed set of financialstatements has been prepared in accordance with IAS34 “Interim Financial Reporting”
• the “Interim management report” and “Risks anduncertainties” sections of this half yearly report include afair review of the information required by rule 4.2.7R ofthe Disclosure and Transparency Rules of the FinancialConduct Authority, being an indication of importantevents that have occurred during the first six months ofthe financial year and their impact on the condensed setof financial statements, and a description of the principalrisks and uncertainties for the remaining six months ofthe year; and
• note 14 in the notes to the consolidated financialstatements includes a fair review of the informationrequired by rule 4.2.8R of the Disclosure andTransparency Rules of the Financial Conduct Authority,being related party transactions that have taken place inthe first six months of the current financial year and thathave materially affected the financial position orperformance of the group during that period, and anychanges in the related party transactions described inthe 2016 annual report that could do so.
The current directors of the company are as listed on page 42of the company’s 2016 annual report.
Approved by the board on 21 September 2017
DAVID J BLACKETTChairman

13R.E.A. Holdings plc Half yearly report 2017
Consolidated income statementfor the six months ended 30 June 2017
6 months to 6 months to Year to 30 June 30 June 31 December 2017 2016 2016 Note $’000 $’000 $’000Revenue 2 46,275 39,337 79,265Net (loss) / gain arising from changes in fair value of agricultural inventory 4 (1,830) (660) 632Cost of sales:Depreciation and amortisation (10,837) (9,007) (20,959)Other costs (28,280) (23,531) (50,868)
Gross profit 5,328 6,139 8,070Other operating income 2 – – 1Distribution costs (563) (508) (1,110)Administrative expenses 5 (7,254) (7,161) (11,987)
Operating loss (2,489) (1,530) (5,026)Investment revenues 2 263 1,238 1,742Finance costs 6 (13,482) (4,898) (6,005)
Loss before tax (15,708) (5,190) (9,289)Tax 7 1,259 753 (2,019)
Loss for the period (14,449) (4,437) (11,308)
Attributable to:Ordinary shareholders (14,144) (7,911) (17,800)Preference shareholders 3,720 3,901 7,402Non-controlling interests (4,025) (427) (910)
(14,449) (4,437) (11,308)
Loss per 25p ordinary share (US cents) 8 (34.6) (21.5) (48.2)
All operations in all periods are continuing

14
Consolidated balance sheetas at 30 June 2017
R.E.A. Holdings plc Half yearly report 2017
30 June 30 June 31 December 2017 2016 2016 $’000 $’000 $’000Non-current assetsGoodwill 12,578 12,578 12,578Intangible assets 3,956 – 4,176Property, plant and equipment 472,469 476,066 471,922Prepaid operating lease rentals 34,761 34,460 34,230Stone and coal interests 38,232 36,063 37,208Deferred tax assets 12,702 13,970 12,781Non-current receivables 2,142 1,870 3,136
Total non-current assets 576,840 575,007 576,031
Current assetsInventories 10,379 8,761 15,767Biological assets 1,832 – 2,037Investments 4,930 1,954 9,880Trade and other receivables 43,611 36,531 42,554Cash and cash equivalents 2,974 4,463 24,593
Total current assets 63,726 51,709 94,831
Total assets 640,566 626,716 670,862
Current liabilitiesTrade and other payables (19,267) (27,517) (43,426)Current tax liabilities (8) (3,175) (317)Bank loans (29,398) (54,992) (28,628)Sterling notes (10,803) – (10,103)US dollar notes – (33,725) (20,048)Other loans and payables (5,400) (117) (519)
Total current liabilities (64,876) (119,526) (103,041)
Non-current liabilitiesBank loans (99,844) (67,274) (97,771)Sterling notes (39,877) (50,522) (37,037)US dollar notes (23,614) – (23,646)Deferred tax liabilities (79,124) (81,005) (80,830)Other loans and payables (36,553) (16,060) (18,987)
Total non-current liabilities (279,012) (214,861) (258,271)
Total liabilities (343,888) (334,387) (361,312)
Net assets 296,678 292,329 309,550
EquityShare capital 121,426 120,288 121,426Share premium account 42,585 30,683 42,585Translation reserve (33,473) (41,365) (39,127)Retained earnings 147,338 181,188 161,839
277,876 290,794 286,723Non-controlling interests 18,802 1,535 22,827
Total equity 296,678 292,329 309,550

15R.E.A. Holdings plc Half yearly report 2017
Consolidated statement of comprehensive incomefor the six months ended 30 June 2017
6 months to 6 months to Year to 30 June 30 June 31 December 2017 2016 2016 $’000 $’000 $’000Loss for the period (14,449) (4,437) (11,308)
Other comprehensive incomeItems that may be reclassified to profit or loss:Actuarial losses – – (569)Deferred tax on actuarial losses – – 143
– – (426)Items that will not be reclassified to profit or loss:Exchange differences on translation of foreign operations 5,575 2,551 5,222Exchange differences on deferred tax (278) 2,125 2,617
5,297 4,676 7,413
Total comprehensive income for the period (9,152) 239 (3,895)
Attributable to:Ordinary shareholders (8,847) (3,813) (10,387)Preference shareholders 3,720 4,479 7,402Non-controlling interests (4,025) (427) (910)
(9,152) 239 (3,895)
Consolidated statement of changes in equityfor the six months ended 30 June 2017
Non-Share Share Translation Retained controlling Total
capital premium reserve earnings Sub total interests equity2017 $’000 $’000 $’000 $’000 $’000 $’000 $’000
At 1 January 2017 121,426 42,585 (39,127) 161,839 286,723 22,827 309,550Total comprehensive income – – 5,654 (10,781) (5,127) (4,025) (9,152)Dividends to preference shareholders – – - (3,720) (3,720) – (3,720)
At 30 June 2017 121,426 42,585 (33,473) 147,338 277,876 18,802 296,678
2016
At 1 January 2016 120,288 30,683 (46,282) 187,481 292,170 1,652 293,822Total comprehensive income – – 4,917 (4,479) 438 (199) 239Dividends to preference shareholders – – – (3,901) (3,901) – (3,901)
At 30 June 2016 120,288 30,683 (41,365) 179,101 288,707 1,453 290,160Total comprehensive income – – 2,238 (6,345) (4,107) (27) (4,134)Sale of shareholding in sub-group – – – (7,416) (7,416) 21,401 13,985Issue of new ordinary shares (cash) 1,138 11,902 – – 13,040 – 13,040Dividends to preference shareholders – – – (3,501) (3,501) – (3,501)
At 31 December 2016 121,426 42,585 (39,127) 161,839 286,723 22,827 309,550

16
Consolidated cash flow statementfor the six months ended 30 June 2017
R.E.A. Holdings plc Half yearly report 2017
6 months to 6 months to Year to 30 June 30 June 31 December 2017 2016 2016 Note $’000 $’000 $’000Net cash (used in) / from operating activities 12 (13,253) (6,658) 2,598
Investing activitiesInterest received 263 1,238 1,742Proceeds on disposal of property, plant and equipment – – 61Purchases of property, plant and equipment (11,871) (8,486) (31,137)Expenditure on prepaid operating lease rentals (701) (165) (367)Investment in stone and coal interests (1,024) (725) (1,860)
Net cash used in investing activities (13,333) (8,138) (31,561)
Financing activitiesPreference dividends paid (3,720) (3,901) (7,402)Repayment of bank borrowings (1,544) (7,552) (11,004)Proceeds of issue of ordinary shares, less costs of issue – – 13,040Proceeds of issue of US dollar notes, less costs of issue – – (44)Redemption of US dollar notes (20,048) – (45)Proceeds of issue / sale of sterling notes, less costs of issue – – 1,922Proceeds of sale of investments 4,925 – –Proceeds of sale of shareholding in subsidiary – – 13,985New borrowings from non-controlling shareholder and related party 22,000 10,000 12,446New bank borrowings drawn 3,222 4,614 14,939
Net cash from financing activities 4,835 3,161 37,837
Cash and cash equivalentsNet (decrease) / increase in cash and cash equivalents 13 (21,751) (11,635) 8,874Cash and cash equivalents at beginning of period 24,593 15,758 15,758Effect of exchange rate changes 132 340 (39)
Cash and cash equivalents at end of period 2,974 4,463 24,593

17R.E.A. Holdings plc Half yearly report 2017
Notes to the consolidated financial statements
1. Basis of accounting
The condensed consolidated financial statements for the six months ended 30 June 2017 comprise the unaudited financialstatements for the six months ended 30 June 2017 and 30 June 2016, neither of which has been reviewed by the company’sauditor, together with audited financial statements for the year ended 31 December 2016.
The information shown for the year ended 31 December 2016 does not constitute statutory accounts within the meaning of section435 of the Companies Act 2006, and is an abridged version of the group's published financial statements for that year which havebeen filed with the Registrar of Companies. The auditor’s report on those statements was unqualified and did not contain anystatements under section 498(2) or (3) of the Companies Act 2006.
The condensed consolidated financial statements for the six months ended 30 June 2017 have been prepared in accordance withIAS 34, “Interim Financial Reporting” as adopted by the European Union, and should be read in conjunction with the annual financialstatements for the year ended 31 December 2016 which were prepared in accordance with International Financial ReportingStandards (“IFRS”) as adopted by the European Union.
The accounting policies and methods of computation adopted in the preparation of the condensed consolidated financial statementsfor the six months ended 30 June 2017 are the same as those set out in the group's annual report for 2016.
For the reasons given under “Going concern” above, the financial statements have been prepared on the going concern basis.
The condensed consolidated financial statements for the six months ended 30 June 2017 were approved by the Board of Directorson 21 September 2017.
2. Revenue 6 months to 6 months to Year to 30 June 30 June 31 December 2017 2016 2016 $’000 $’000 $’000Sales of goods 45,708 38,100 77,642Revenue from services 567 1,237 1,623
46,275 39,337 79,265Other operating income – – 1Investment revenue 263 1,238 1,742
Total revenue 46,538 40,575 81,008
3. Segment information
The group continues to operate in two segments, being the cultivation of oil palms and the stone and coal operations, togetherwith head office made up of the activities of the UK, European and Singaporean subsidiaries. In the period ended 30 June 2017,the relevant measures for the stone and coal operations continued to fall below the quantitative thresholds set out in IFRS 8.Accordingly, no segment information is included in these financial statements.
4. Agricultural produce inventory movement
The net (loss) / gain arising from changes in fair value of agricultural produce inventory represents the movement in the fair valueof that inventory less the amount of the movement in such inventory at historic cost (which is included in cost of sales).

18
Notes to the consolidated financial statementscontinued
R.E.A. Holdings plc Half yearly report 2017
5. Administrative expenses 6 months to 6 months to Year to 30 June 30 June 31 December 2017 2016 2016 $’000 $’000 $’000Net foreign exchange (gains) / losses – (33) 1,290Loss on disposal of property, plant and equipment – – 12Indonesian operations 6,184 5,309 9,621Head office 3,520 3,530 5,377
9,704 8,806 16,300Amount included as additions to fixed assets (2,450) (1,645) (4,313)
7,254 7,161 11,987
6. Finance costs 6 months to 6 months to Year to 30 June 30 June 31 December 2017 2016 2016 $’000 $’000 $’000Interest on bank loans and overdrafts 7,505 5,123 12,617Interest on US dollar notes 1,639 1,362 2,899Interest on sterling notes 2,324 2,776 5,184Interest on other loans 760 – 273Change in value of sterling notes arising from exchange fluctuations 3,069 (5,641) (10,470)Change in value of loans arising from exchange fluctuations 1,110 3,573 1,378Other finance charges 468 570 251
16,875 7,763 12,132Amount included as additions to property, plant and equipment (3,393) (2,865) (6,127)
13,482 4,898 6,005
7. Tax 6 months to 6 months to Year to 30 June 30 June 31 December 2017 2016 2016 $’000 $’000 $’000Current tax:UK corporation tax 136 106 1Overseas withholding tax 494 586 1,604Foreign tax 16 20 38Foreign tax - prior year - – 3
Total current tax 646 712 1,646
Deferred tax:Current year (2,830) (1,465) 373Prior year 925 – –
Total deferred tax (1,905) (1,465) 373
Total tax (1,259) (753) 2,019
The tax credit for the period of $1.3 million (2016: $0.8 million) is based on the reported results of the operations in each jurisdiction,using relevant rates of tax, adjusted for items which include non-taxable income/expense, prior year reduction in the carrying valueof Indonesian tax losses and Indonesian withholding taxes not utilisable in the UK. If the income mix in the second half of 2017differs materially from that of the first half, it may result in a disproportionate movement in the effective rate of taxation for the fullyear.

19R.E.A. Holdings plc Half yearly report 2017
8. Loss per share 6 months to 6 months to Year to 30 June 30 June 31 December 2017 2016 2016 $’000 $’000 $’000Loss for the purpose of calculating loss per share* (14,144) (7,911) (17,800)* being net loss attributable to ordinary shareholders
’000 ’000 ’000Weighted average number of ordinary shares for the purpose of loss per share 40,510 36,840 36,950
9. Dividends 6 months to 6 months to Year to 30 June 30 June 31 December 2017 2016 2016 $’000 $’000 $’000Amounts recognised as distributions to equity holders: Preference dividends of 9p per share per annum (2016: 9p per share) 3,720 3,901 7,402
3,720 3,901 7,402
10. Capital expenditure on property, plant and equipment and capital commitments
In the period, there were additions to property, plant and equipment of $11.9 million (31 December 2016: $31.1 million, 30 June2016: $8.5 million).
Capital commitments contracted, but not provided for by the group as at 30 June 2017, amounted to $2.4 million (31 December2016: $1.4 million, 30 June 2016: $0.4 million).

Notes to the consolidated financial statementscontinued
20 R.E.A. Holdings plc Half yearly report 2017
11. Fair values of financial instruments
The table below provides an analysis of the book values and fair values of financial instruments, excluding receivables and tradepayables and Indonesian coal interests, as at the balance sheet date. Cash and deposits, US dollar notes and sterling notes areclassified as level 1 in the fair value hierarchy prescribed by IFRS 7 “Financial instruments: disclosures”. (Level 1 includesinstruments where inputs to the fair value measurements are quoted prices in active markets). All other financial instrumentsare classified as level 3 in the fair value hierarchy. (Level 3 includes instruments which have no observable market data toprovide inputs to the fair value measurements). No reclassifications between levels in the fair value hierarchy were madeduring 2017 (2016: none). 30 June 30 June 30 June 30 June 31 December 31 December 2017 2017 2016 2016 2016 2016 Book value Fair value Book value Fair value Book value Fair value $’000 $’000 $’000 $’000 $’000 $’000
Cash and deposits* 2,974 2,974 4,463 4,463 24,593 24,593Debt-within one year* (29,398) (29,398) (64,992) (64,992) (28,628) (28,628)Debt-after more than one year* (99,844) (99,844) (67,274) (67,274) (97,771) (97,771)Loan from related party-within one year* (5,400) (5,400) – – – –Loans from non-controlling
shareholder-after more than one year* (29,516) (29,516) – – (12,469) (12,469)US dollar notes-repayable 2017** – – (33,725) (29,930) (20,048) (20,206)US dollar notes-repayable 2022** (23,614) (23,915) – – (23,646) (24,035)Sterling notes-repayable 2017** (10,803) (10,651) (9,496) (10,842) (10,103) (10,143)Sterling notes-repayable 2020** (39,877) (41,479) (41,026) (41,060) (37,037) (38,553)
Net debt and related engagements (235,478) (237,229) (212,050) (209,635) (205,109) (207,212)
* bearing interest at floating rates** bearing interest at fixed rates
The fair values of cash and deposits and bank debt approximate their carrying values since these carry interest at currentmarket rates. The fair value of investments approximates their carrying value. The fair values of the US dollar notes and sterlingnotes are based on the latest prices at which those notes were traded prior to the balance sheet dates.
A one per cent increase in interest applied to those financial instruments shown in the table above which carry interest at floatingrates would have resulted over a period of one year in a pre-tax profit (and equity) decrease of approximately $1.6 million (2016:pre-tax profit (and equity) decrease of $1.2 million).
12. Reconciliation of operating profit to operating cash flows 6 months to 6 months to Year to 30 June 30 June 31 December 2017 2016 2016 $’000 $’000 $’000Operating loss (2,489) (1,530) (5,026)Amortisation of intangible assets 201 – 74Depreciation of property, plant and equipment 10,467 9,181 20,766Decrease / (increase) in fair value of agricultural produce inventory 1,830 660 (632)Amortisation of prepaid operating lease rentals 169 – 432Amortisation of sterling and US dollar note issue expenses 547 306 584Loss on disposal of property, plant and equipment – – 12
Operating cash flows before movements in working capital 10,725 8,617 16,210Decrease / (increase) in inventories (excluding fair value movements) 3,558 1,770 (3,944)(Increase) / decrease in receivables (10,461) (4,110) 760(Decrease) / increase in payables (6,227) (2,982) 13,136Exchange translation differences 1,606 (2,130) (791)
Cash (utilised) / generated by operations (799) 1,165 25,371Taxes paid (34) (52) (2,313)Tax refunds received – – 241Interest paid (12,420) (7,771) (20,701)
Net cash (to) / from operating activities (13,253) (6,658) 2,598

21R.E.A. Holdings plc Half yearly report 2017
13. Movements in net borrowings 6 months to 6 months to Year to 30 June 30 June 31 December 2017 2016 2016 $’000 $’000 $’000Change in net borrowings resulting from cash flows:(Decrease) / increase in cash and cash equivalents (21,619) (11,635) 8,874Net increase in borrowings (1,678) (7,062) (3,935)Increase in non-controlling shareholder and related party borrowings (22,966) – (12,469) (46,263) (18,697) (7,530)Issue of US dollar notes – – (345)Amortisation of sterling notes expenses (471) (218) (318)Amortisation of US dollar notes expenses (76) (88) (266)Redemption of US dollar notes 20,048 – – (26,762) (19,003) (8,459)Currency translation differences (3,607) 5,639 2,036Net borrowings at beginning of period (205,109) (198,686) (198,686)
Net borrowings at end of period (235,478) (212,050) (205,109)
14. Related parties
Transactions between the company and its subsidiaries, which are related parties, have been eliminated on consolidation and arenot disclosed in this note.
During the period the company has drawn a short term unsecured dollar loan from R.E.A. Trading Limited, a company controlled byMr R M Robinow and his family, on normal commercial terms as to interest. At 30 June 2017, the loan amounted to $5.4 million.Other than this loan during the first six months of 2017 there have been no other new material related party transactions and onlythose related transactions which were disclosed in the company’s 2016 annual report have continued.
15. Events after the reporting period
Resolution of competing rights over certain plantation areas
Implementing agreements were executed in July 2017 in respect of the arrangements that were finalised in late 2015 to sell landheld by the group’s subsidiary company, SYB and acquire land held by PT Prasetia Utama ("PU"). Under the agreements, SYB isto sell 3,554 hectares of its land areas that overlap with mineral rights held by an Indonesian third party company, PT Ade PutraTanrajeng ("APT”), and SYB and its local partner is to purchase shares in PU, an associate of APT, that holds 9,097 hectares offully titled land areas. The acquisition of the PU shares by SYB and its local partner has now been completed (with SYB taking 95per cent of the PU shares). Meanwhile APT and its associates have been granted access to the SYB mining overlap areas pendingcompletion of the legal formalities relating to the land titles for such areas, which will take place in due course.
16. Rates of exchange 30 June 2017 30 June 2016 31 December 2016Closing Average Closing Average Closing Average
Indonesian rupiah to US dollar 13,319 13,344 13,180 13,479 13,436 13,369US dollar to pound sterling 1.2990 1.27 1.3428 1.43 1.2226 1.36
Reference to “dollars” and “$” are to the lawful currency of the United States of America.
17. Cautionary statement
This document contains certain forward-looking statements relating to R.E.A. Holdings plc (“the group”). The group considers anystatements that are not historical facts as “forward-looking statements”. They relate to events and trends that are subject to riskand uncertainty that may cause actual results and the financial performance of the group to differ materially from those containedin any forward-looking statement. These statements are made by the directors in good faith based on information available to themand such statements should be treated with caution due to the inherent uncertainties, including both economic and business riskfactors, underlying any such forward-looking information.

R.E.A. HOLDINGS PLC
R.E.A. Holdings plcFirst Floor32-36 Great Portland StreetLondonW1W 8QX
www.rea.co.uk
Registered number00671099 (England and Wales)


![RUNO Half Yearly Reporting TEMPLATE 4.3 [LIBERIA] PROJECT ...moj.gov.lr/data/uploads/downloads/half-year... · RUNO Half Yearly Reporting TEMPLATE 4.3 [LIBERIA] PROJECT HALF YEARLY](https://img.dokumen.tips/doc/110x75/5fb2e6765197404e462e00b5/runo-half-yearly-reporting-template-43-liberia-project-mojgovlrdatauploadsdownloadshalf-year.jpg)