Embed Size (px)
Citation preview
Half Year ResultsPresentation
25th February 2009
2
AgendaOverview & HighlightsJohn Grill
Financial ResultsDavid Housego
OutlookJohn Grill

3
Operational Highlights
Strong six month resultSolid pipeline in existing major projects and Improve brownfieldprojectsMajor contracts secured
Excellent cash flow resultRefinanceStarting to realise impact of operational overhead reduction initiativesHeadcount 31,700 - reductions in Australia and Canada but increasing elsewhere
BP GoM Offshore SAMREF Kashagan FFD ChemaWEyaat
4
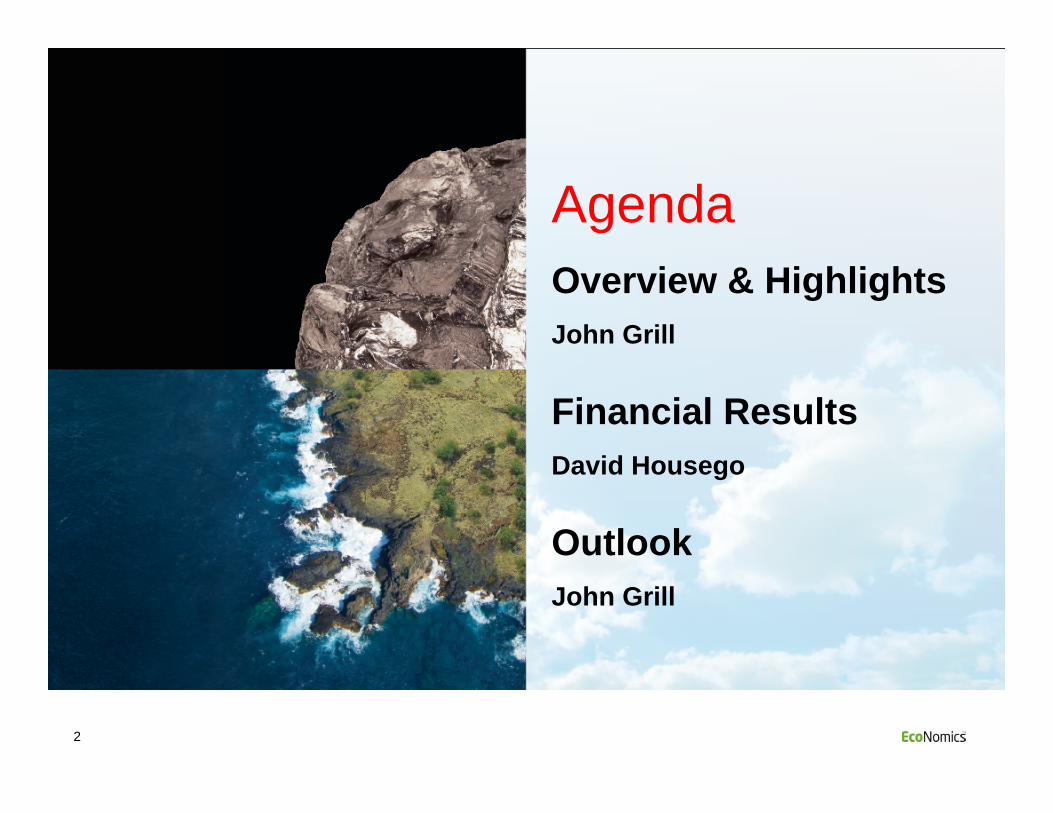
Financial Highlights
Net profit of $197.5m, up 29.3%
Aggregated Revenue $3,259.6m
Half year EBITDA growth 34.7%
Operating cash flow $234.5m
Basic EPS up 28.9% to 81.6 cps
Interim dividend 38.0 cents per share
(franked at 76%)
US$300m debt facility increase and
refinance
5
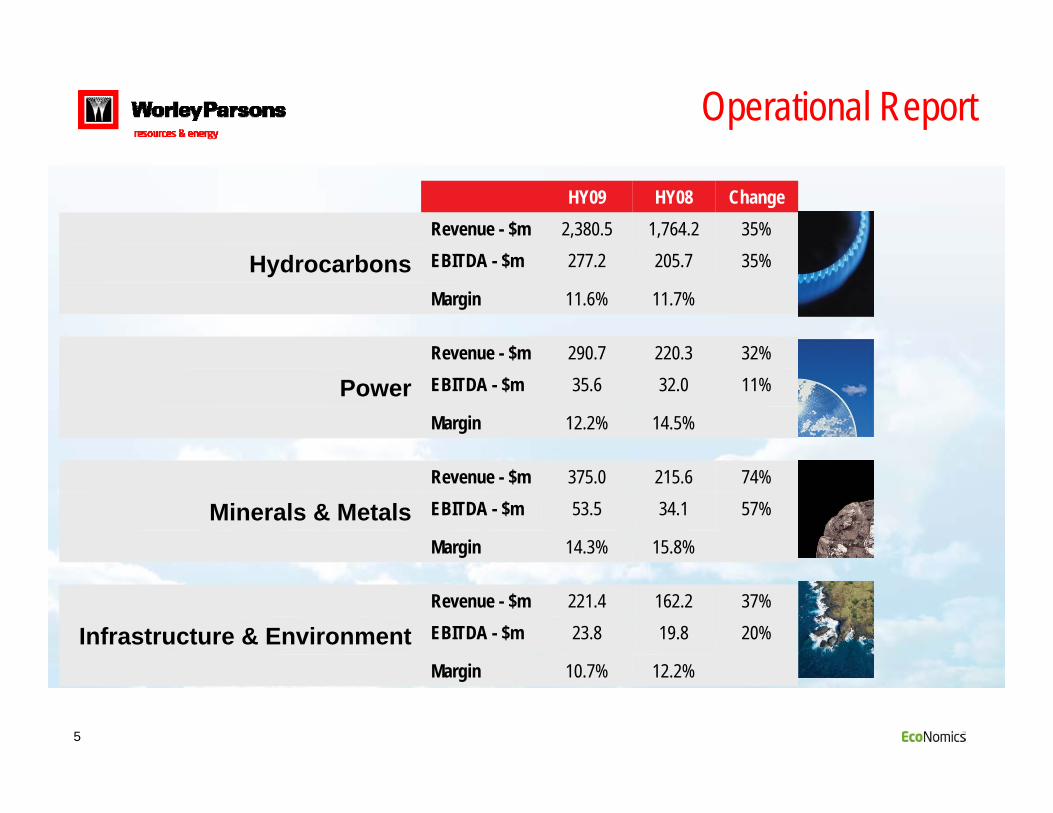
Operational Report
HY09 HY08 ChangeRevenue - $m 2,380.5 1,764.2 35%
Hydrocarbons EBITDA - $m 277.2 205.7 35%
Margin 11.6% 11.7%
Revenue - $m 290.7 220.3 32%
Power EBITDA - $m 35.6 32.0 11%
Margin 12.2% 14.5%
Revenue - $m 375.0 215.6 74%
Minerals & Metals EBITDA - $m 53.5 34.1 57%
Margin 14.3% 15.8%
Revenue - $m 221.4 162.2 37%
Infrastructure & Environment EBITDA - $m 23.8 19.8 20%
Margin 10.7% 12.2%
6
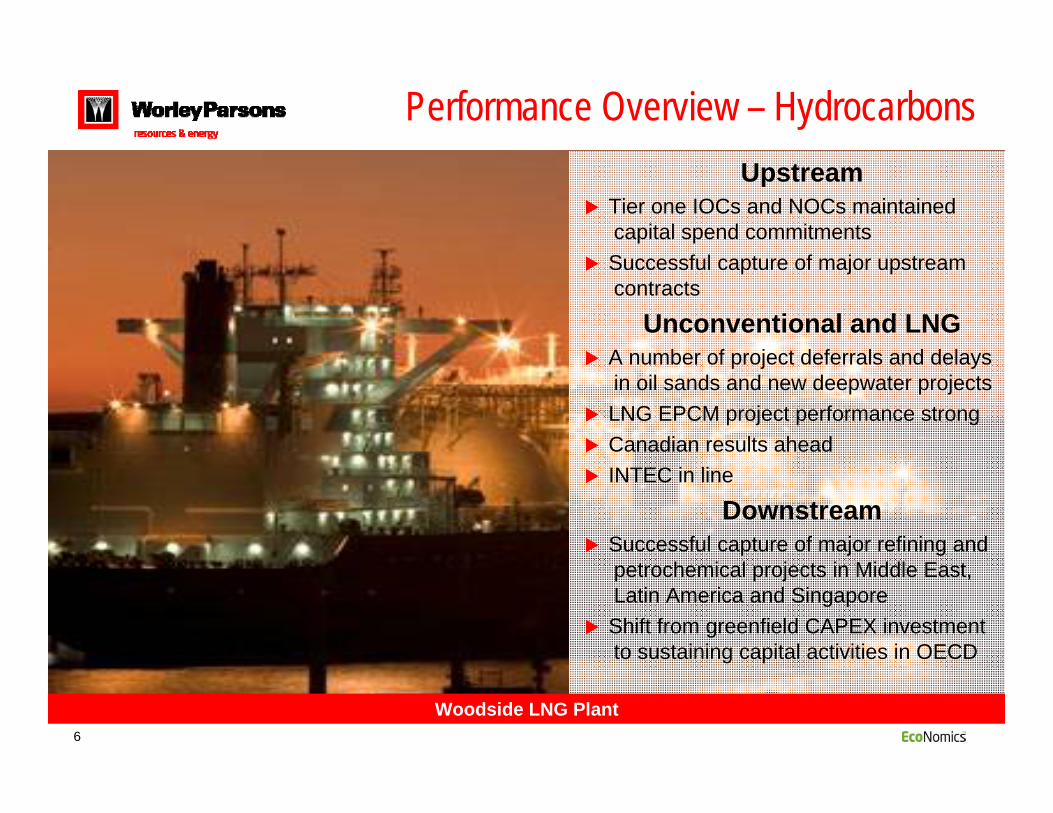
Performance Overview – HydrocarbonsUpstream
Tier one IOCs and NOCs maintained capital spend commitmentsSuccessful capture of major upstream contracts
Unconventional and LNGA number of project deferrals and delays in oil sands and new deepwater projects LNG EPCM project performance strongCanadian results aheadINTEC in line
DownstreamSuccessful capture of major refining and petrochemical projects in Middle East, Latin America and SingaporeShift from greenfield CAPEX investment to sustaining capital activities in OECD
Woodside LNG Plant
7
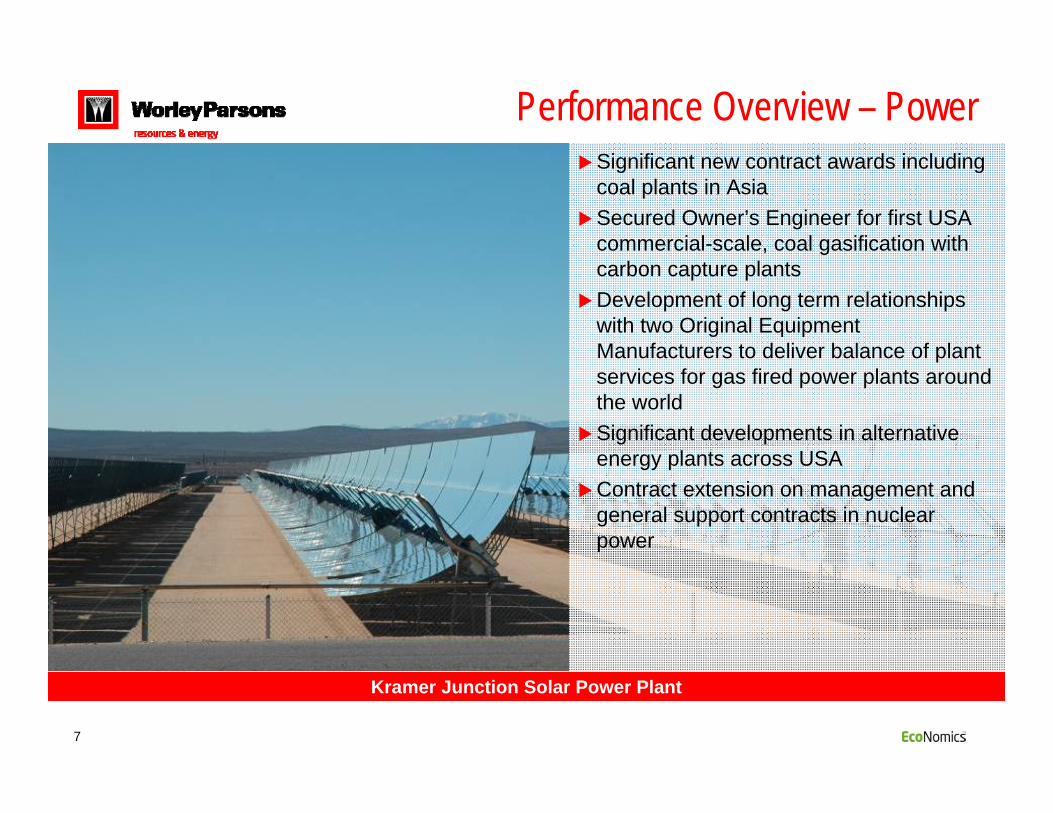
Performance Overview – PowerSignificant new contract awards including coal plants in AsiaSecured Owner’s Engineer for first USA commercial-scale, coal gasification with carbon capture plantsDevelopment of long term relationships with two Original Equipment Manufacturers to deliver balance of plant services for gas fired power plants around the worldSignificant developments in alternative energy plants across USAContract extension on management and general support contracts in nuclear power
Kramer Junction Solar Power Plant
8
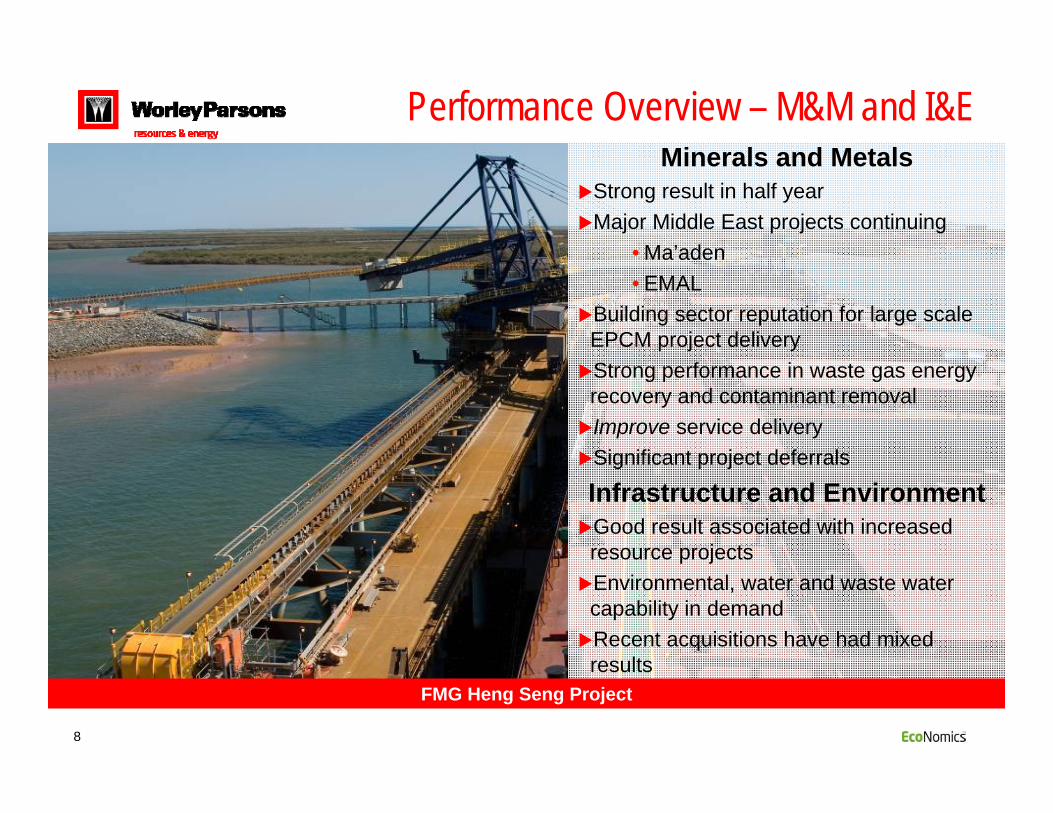
Performance Overview – M&M and I&EMinerals and Metals
Strong result in half yearMajor Middle East projects continuing
• Ma’aden• EMAL
Building sector reputation for large scale EPCM project deliveryStrong performance in waste gas energy recovery and contaminant removalImprove service deliverySignificant project deferrals
Infrastructure and EnvironmentGood result associated with increased resource projects Environmental, water and waste water capability in demandRecent acquisitions have had mixed results
FMG Heng Seng Project

9
Material ASX Contracts
BP’s Gulf of Mexico Engineering and Project Management Services provider for offshore topsides facilities Commenced June 2008 for a four year term with option for extension Largest hydrocarbons Improve contract in USA – (300 personnel)Executed by Houston operations
SAMREF Clean Fuels ProjectImportant environment project to reduce sulphur levels in gasoline and dieselOne of the largest clean fuels projects in the worldPhased construction project. Expected plant start-up in 2013Prime contractor on reimbursable basisKashagan Phase 2 Full Field Development FEEDFEED to be completed in 2011 – additional options extend work 8 yrsLargest proposed oil and gas development in the worldJV- WorleyParsons (45%), CB&I, Aker Engineering & TechnologyWorleyParsons JV performed Phase 1

10
Material ASX Contract - Improve
Woodside North West Shelf Venture contract renegotiationCommenced renegotiation discussions for a four year extension toTransfield Worley for the delivery of capital works programs – through to 2013 - 5 LNG trains & 3 offshore platformsAdditionally an extension of the maintenance services contract for a further 12 monthsShell Martinez Refinery Brownfield Services contract extensionContract through to December 31, 2010 WorleyParsons Improve alliance staff onsite for over 20 yearsOver 3 million man-hours of work have been performed without a recordable injury
ConocoPhillips Master Services Contract- Australian assetsThree year contract with options for 2 year extensionsThis contract covers an ongoing portfolio of projects and modifications for Bayu Undan in the Timor Sea and the Darwin LNG Plant in Northern Territory

11
Other Contracts
Shell Canada National AgreementRenewal of national agreement with WorleyParsons CanadaSupporting the Sarnia and Edmonton facilities Contract extends through to November 2011Colt commenced work on the sites 15 years ago
ChemaWEyaat Petrochemical Complex Frame AgreementPreviously announced LOI and have now signed a frame agreement for the engineering and management services associated with the ChemaWEyaat complex in Abu DhabiFirst stage includes the world’s largest and most integrated complex of chemicals of more than six million tons/per year productionProduction planned for 2014

12
Deferrals
A number of contracts previously announced have been deferred:
Suncor Energy Firebag Pads and Gathering EPCM
Suncor Energy Firebag Pads and Gathering fabrication
Moly Mines EPCM
Pilbara Iron Ore and Infrastructure Project Phase 2 expansion

13
Awards - Select
Power plant air emissions improvement project - USANucor heat recovery projects - ChinaWintershall Sour Gas Project - UKTight gas field development - OmanARPG Jazan Refinery - Saudi ArabiaTotal JNMP – Pre-project study -CanadaWoodside Sunrise Pre-FEED - AustraliaWest Delta Deep Phase 8 pre-FEED -EgyptIOC oilfield development planning and tender support - Iraq Iberdrola Solar Studies - USACanpotex Ridley Island Potash terminal -Canada
Colorado Governor’s Energy Office Environmental Studies - USAVale Serra Sul Mining Infrastructure Study - BrazilAlberta Oil Sands Water Use Strategy Study - CanadaClimate Change Engineering Risk Assessment, Global, Acclimatise & International Finance Corporation -GlobalClimate Change Study, London, World Bank. - GlobalUltra Clean Coal Assessment - USANuclear powered Aluminium smelting feasibility study - RussiaDenali Gas Treatment Plant Pre-FEED -Alaska, USA
14
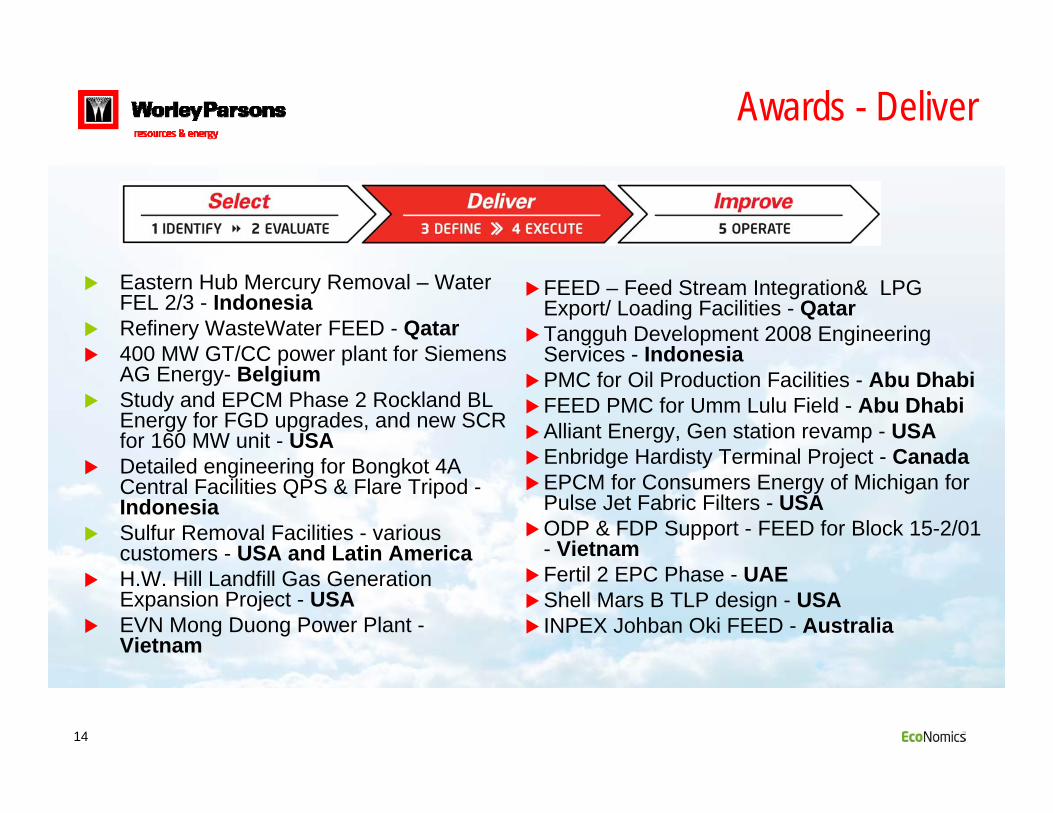
Awards - Deliver
Eastern Hub Mercury Removal – Water FEL 2/3 - IndonesiaRefinery WasteWater FEED - Qatar400 MW GT/CC power plant for Siemens AG Energy- BelgiumStudy and EPCM Phase 2 Rockland BL Energy for FGD upgrades, and new SCR for 160 MW unit - USADetailed engineering for Bongkot 4A Central Facilities QPS & Flare Tripod -IndonesiaSulfur Removal Facilities - various customers - USA and Latin AmericaH.W. Hill Landfill Gas Generation Expansion Project - USAEVN Mong Duong Power Plant -Vietnam
FEED – Feed Stream Integration& LPG Export/ Loading Facilities - QatarTangguh Development 2008 Engineering Services - IndonesiaPMC for Oil Production Facilities - Abu DhabiFEED PMC for Umm Lulu Field - Abu DhabiAlliant Energy, Gen station revamp - USAEnbridge Hardisty Terminal Project - CanadaEPCM for Consumers Energy of Michigan for Pulse Jet Fabric Filters - USAODP & FDP Support - FEED for Block 15-2/01 - VietnamFertil 2 EPC Phase - UAEShell Mars B TLP design - USAINPEX Johban Oki FEED - Australia

15
Awards - Deliver
Enbridge Christina Lake Fabrication -CanadaSenoko Power Stage II Repoweringconsultancy services - SingaporeDow Chemicals LER Project - ChinaPenta Ocean MCE C485 - SingaporePony Hull and SURF FEED - AmericaDiamond Wood Nanjing Project - ChinaPTC Jubail Polysilicon PMC - Saudi ArabiaHESS - CPP & AUP Detailed Engineering Services - IndonesiaDesign (FEED) for LPG Export and Loading Facility - QatarLiddell PS Solar Feedwater Heating, Solar Heat and Power - AustraliaSouthern Peru Copper Tia Maria Copper Concentrator EPCM - Chile
GE Wind Turbine factory - ChinaQatar Petroleum LPG Export and Loading Facility FEED - QatarNCP Petrochemical Complex Phase 4 -Saudi ArabiaStroyTransGaz Dolphin TaweelahFajairah Pipeline - Abu DhabiBP Tubular Bells Subsea PreFEED -USAConsumers Energy AQC Phase 2 - USALADWP Hayes/ Scattergood OE - USAVale Mine Equipment Modules - BrazilDow Corning Silane Storage & Loading Facilities - USACogentrix solar design - USABorouge -3 : EcoNomics™ Assessment of cooling water options - Abu Dhabi
16
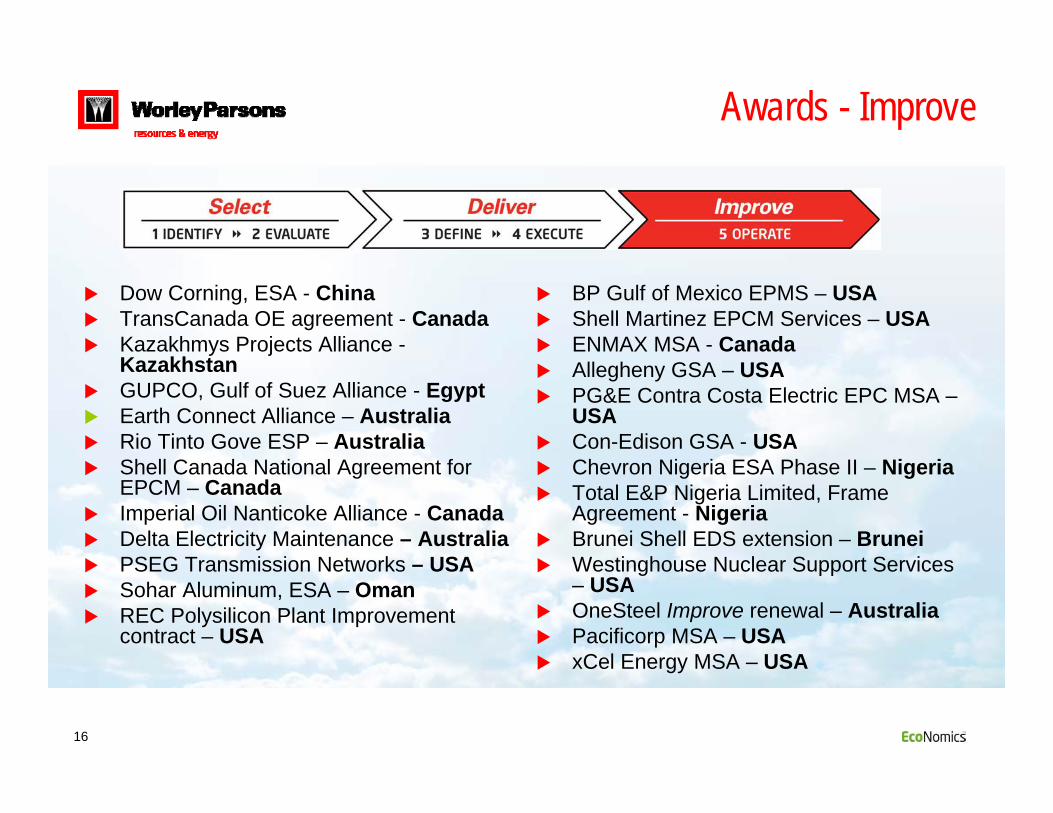
Awards - Improve
Dow Corning, ESA - ChinaTransCanada OE agreement - CanadaKazakhmys Projects Alliance -KazakhstanGUPCO, Gulf of Suez Alliance - Egypt Earth Connect Alliance – AustraliaRio Tinto Gove ESP – AustraliaShell Canada National Agreement for EPCM – CanadaImperial Oil Nanticoke Alliance - CanadaDelta Electricity Maintenance – Australia PSEG Transmission Networks – USASohar Aluminum, ESA – OmanREC Polysilicon Plant Improvement contract – USA
BP Gulf of Mexico EPMS – USAShell Martinez EPCM Services – USAENMAX MSA - Canada Allegheny GSA – USAPG&E Contra Costa Electric EPC MSA –USACon-Edison GSA - USAChevron Nigeria ESA Phase II – NigeriaTotal E&P Nigeria Limited, Frame Agreement - NigeriaBrunei Shell EDS extension – BruneiWestinghouse Nuclear Support Services – USAOneSteel Improve renewal – AustraliaPacificorp MSA – USAxCel Energy MSA – USA

17
Total Recordable Case Frequency Rate (TRCFR) improved 0.15Lost Workday Case Frequency Rate (LWCFR) steady 0.02Maintained momentum with our process of refreshing our management systems and engaging our people, contractors and suppliers in HSE improvement -OneWay™A number of major safety milestones achieved in projects and offices during the period
Performance Overview – HSE

18
Performance Overview – EconomicsTM
Significant increase in EcoNomicsTM
projects across regions and marketsOver 1,000 senior professionals formally trained in EcoNomicsTM
processes and toolsKey differentiator in securing a number of projects across all four sectorsCustomer base maintaining commitments to sustainability targets and projects
19
Financial ResultsDavid Housego
20
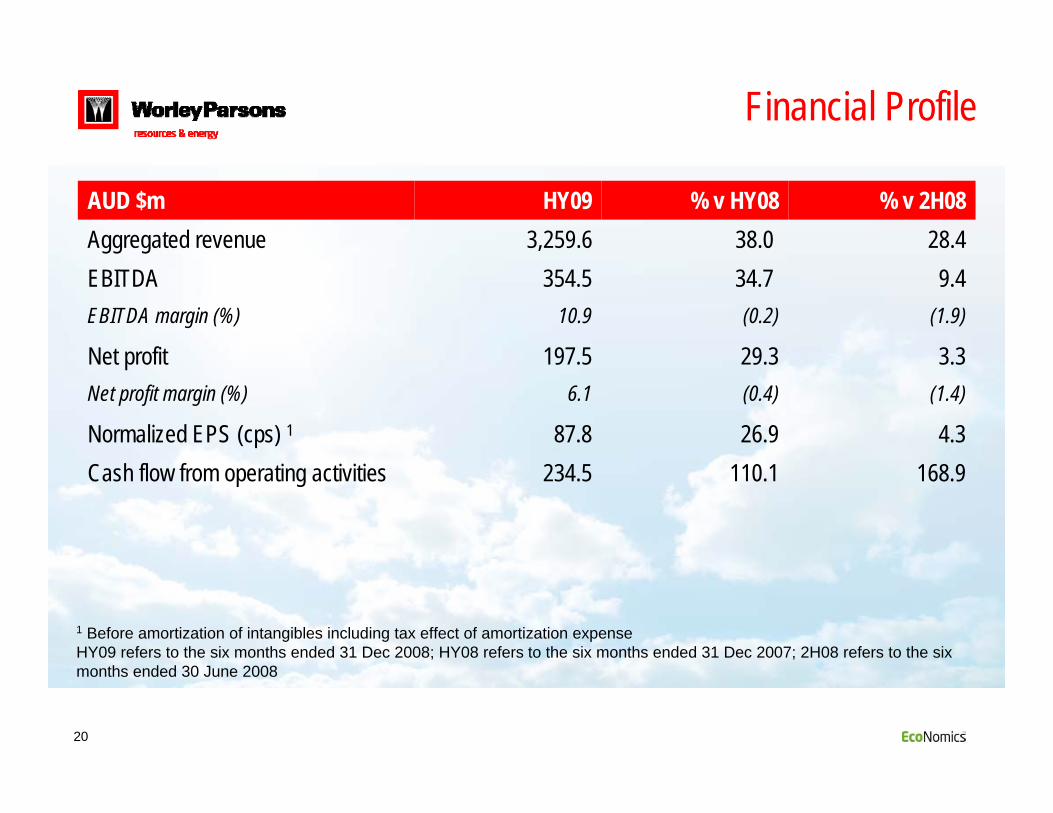
Financial Profile
AUD $m HY09 % v HY08 % v 2H08Aggregated revenue 3,259.6 38.0 28.4EBITDA 354.5 34.7 9.4EBITDA margin (%) 10.9 (0.2) (1.9)
Net profit 197.5 29.3 3.3Net profit margin (%) 6.1 (0.4) (1.4)
Normalized EPS (cps) 1 87.8 26.9 4.3Cash flow from operating activities 234.5 110.1 168.9
1 Before amortization of intangibles including tax effect of amortization expenseHY09 refers to the six months ended 31 Dec 2008; HY08 refers to the six months ended 31 Dec 2007; 2H08 refers to the six months ended 30 June 2008
21
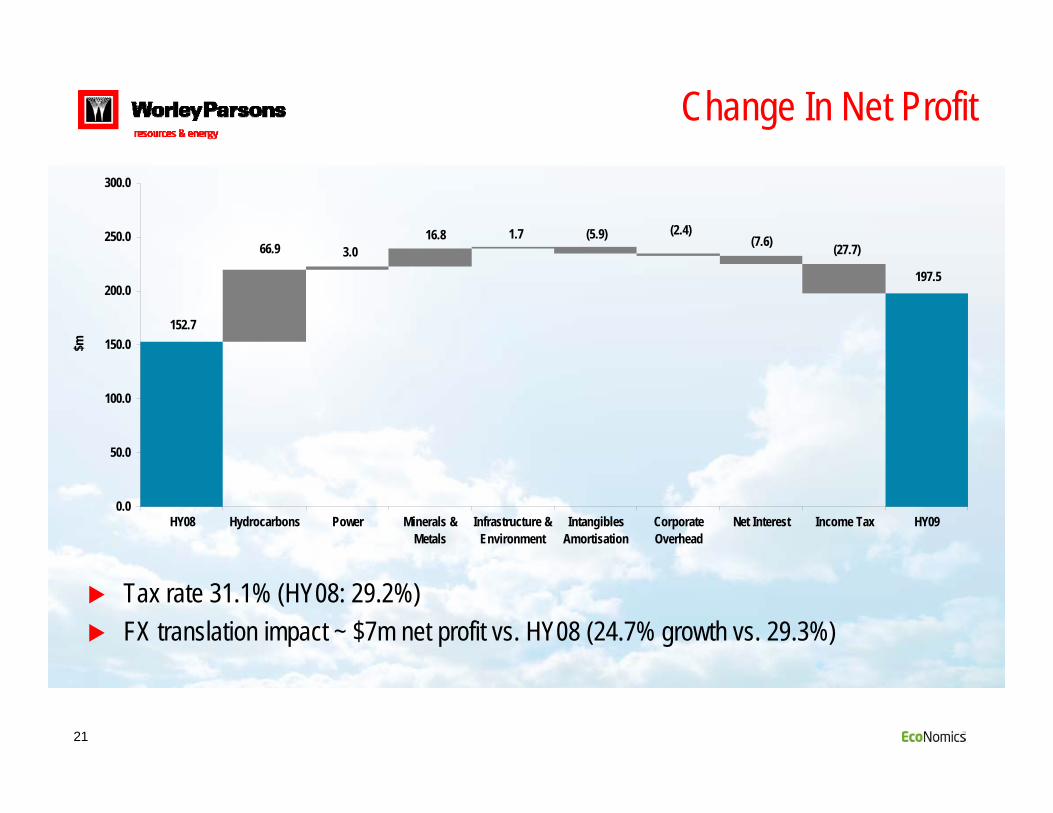
Change In Net Profit
Tax rate 31.1% (HY08: 29.2%)FX translation impact ~ $7m net profit vs. HY08 (24.7% growth vs. 29.3%)
152.7
66.9 3.016.8 1.7 (5.9) (2.4)
(7.6) (27.7)
197.5
0.0
50.0
100.0
150.0
200.0
250.0
300.0
HY08 Hydrocarbons Power Minerals &Metals
Infrastructure &Environment
IntangiblesAmortisation
CorporateOverhead
Net Interest Income Tax HY09
$m
22
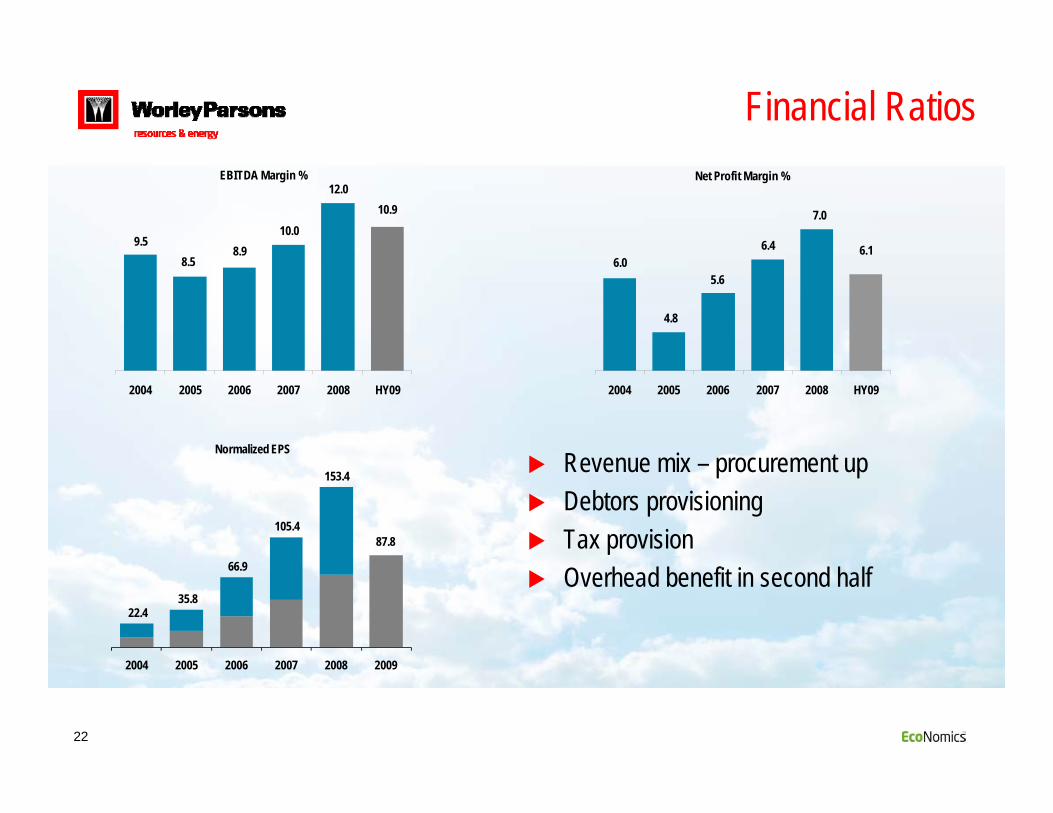
Financial Ratios
Revenue mix – procurement up Debtors provisioningTax provisionOverhead benefit in second half
Net Profit Margin %
6.16.0
4.8
5.6
6.4
7.0
2004 2005 2006 2007 2008 HY09
EBITDA Margin %
10.9
9.58.5
8.910.0
12.0
2004 2005 2006 2007 2008 HY09
87.8
22.4 35.8
66.9
105.4
153.4
2004 2005 2006 2007 2008 2009
Normalized EPS

23
Cash Flow
$m HY09 FY08 HY08EBITDA less interest and tax paid 251.6 449.6 188.1Working capital (17.1) (250.8) (76.5)Cash flow from operations 234.5 198.8 111.6
Property, plant & equipment 78.3 79.0 36.9
Focus on billing cycle and cash collection resulted in strong operational cash flowIncreased spend in HY09 on PPE and systems, expect to be less in the 2nd halfInterim dividend 38cps (franking 28.9cps) same as HY08
24
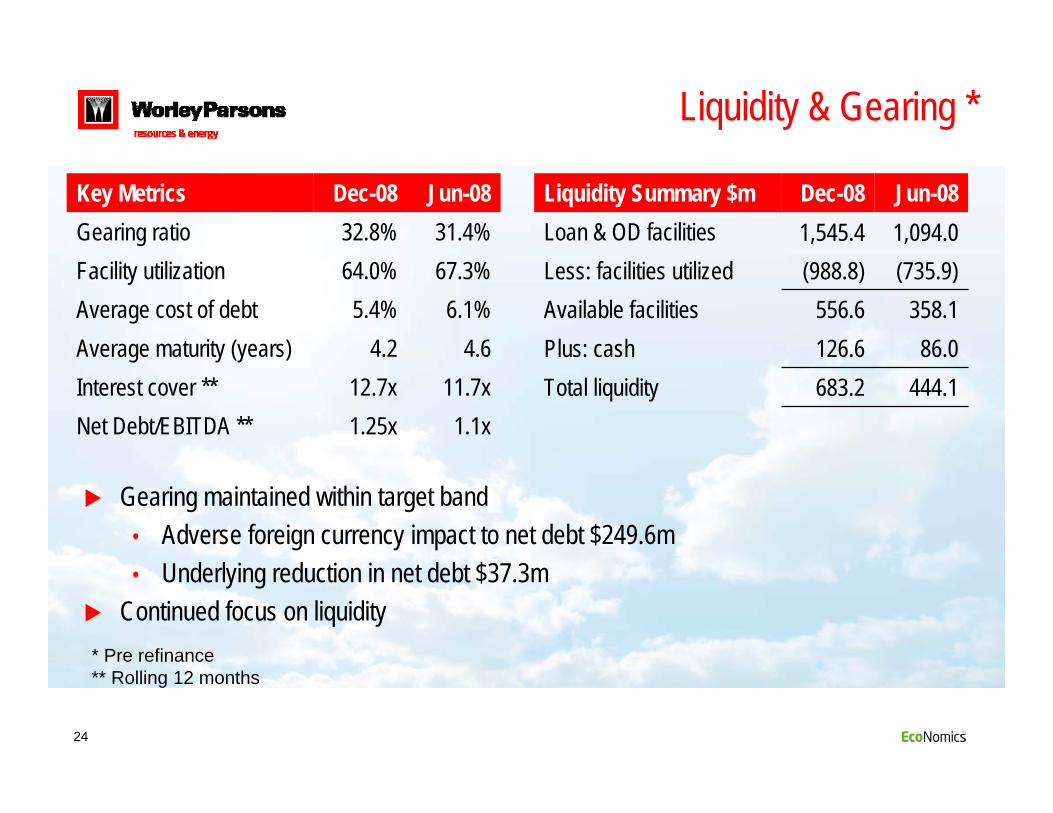
Liquidity & Gearing *
Liquidity Summary $m Dec-08 Jun-08Loan & OD facilities 1,545.4 1,094.0Less: facilities utilized (988.8) (735.9)Available facilities 556.6 358.1Plus: cash 126.6 86.0Total liquidity 683.2 444.1
Key Metrics Dec-08 Jun-08Gearing ratio 32.8% 31.4%Facility utilization 64.0% 67.3%Average cost of debt 5.4% 6.1%Average maturity (years) 4.2 4.6Interest cover ** 12.7x 11.7xNet Debt/EBITDA ** 1.25x 1.1x
Gearing maintained within target band• Adverse foreign currency impact to net debt $249.6m• Underlying reduction in net debt $37.3m
Continued focus on liquidity* Pre refinance** Rolling 12 months
25
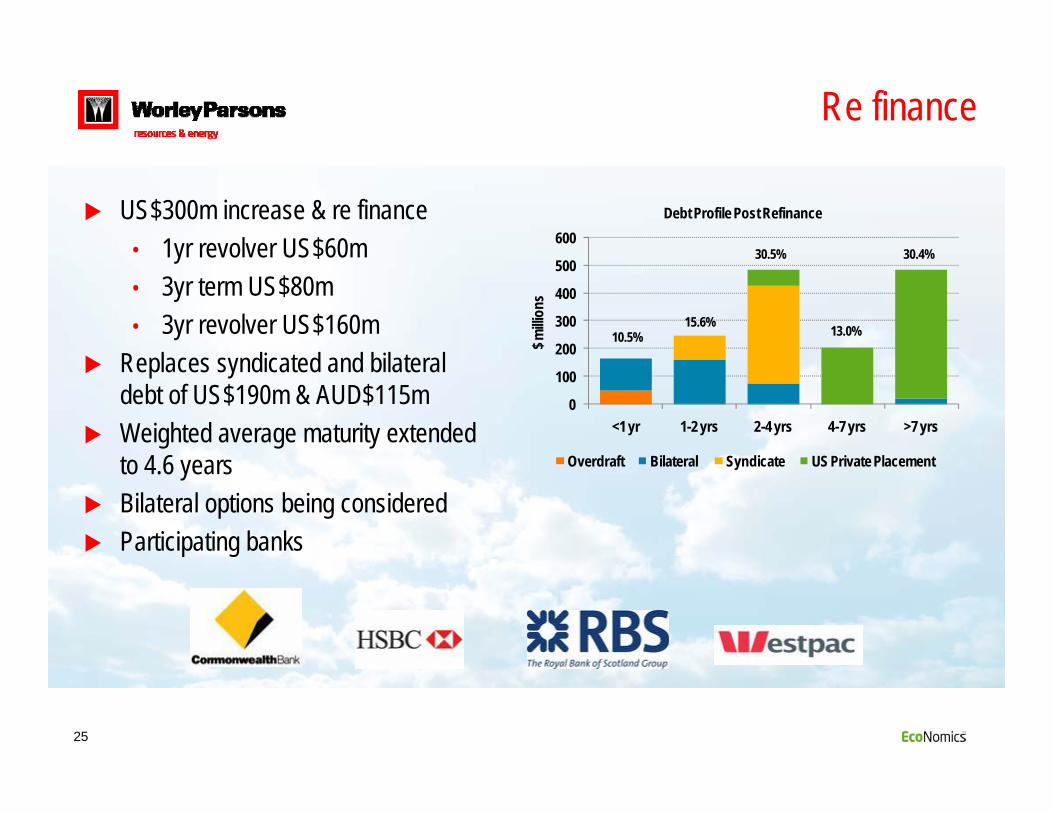
Re finance
US$300m increase & re finance• 1yr revolver US$60m• 3yr term US$80m• 3yr revolver US$160m
Replaces syndicated and bilateral debt of US$190m & AUD$115mWeighted average maturity extended to 4.6 yearsBilateral options being consideredParticipating banks
0
100
200
300
400
500
600
<1 yr 1-2 yrs 2-4 yrs 4-7 yrs >7 yrs
$ milli
ons
Debt Profile Post Refinance
Overdraft Bilateral Syndicate US Private Placement
10.5%15.6%
30.5%
13.0%
30.4%
26
OutlookJohn Grill
27
Outlook - Operational
Continued focus on operating cash flow and reduction in operational costs
Focus remains on major IOCs and NOCs
Increased focus on Improve services across sectors
Anticipated shift in services sought remains in our area of capability strength
EcoNomics increasingly attractive as carbon trading impacts market
2010+ strategy update underway
Anticipate and ready for further M&A opportunities
Increased use of workshare across the globe
28
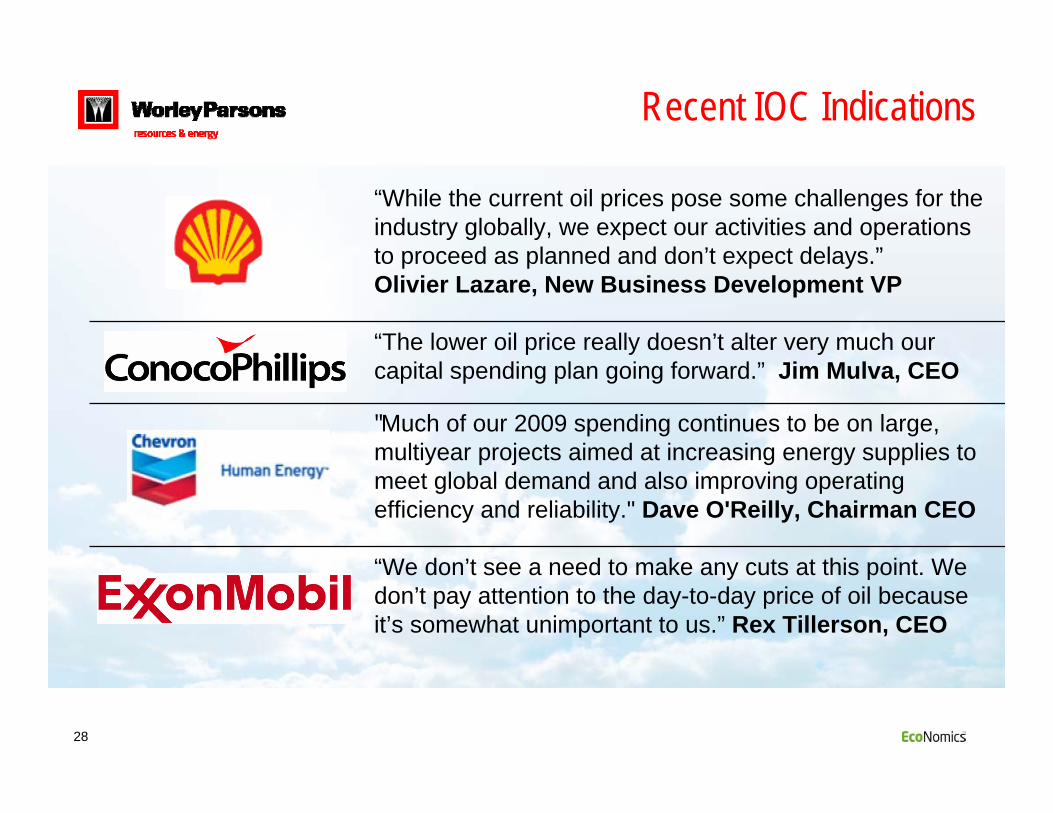
Recent IOC Indications
“While the current oil prices pose some challenges for the industry globally, we expect our activities and operations to proceed as planned and don’t expect delays.”Olivier Lazare, New Business Development VP
“The lower oil price really doesn’t alter very much our capital spending plan going forward.” Jim Mulva, CEO
"Much of our 2009 spending continues to be on large, multiyear projects aimed at increasing energy supplies to meet global demand and also improving operating efficiency and reliability." Dave O'Reilly, Chairman CEO
“We don’t see a need to make any cuts at this point. We don’t pay attention to the day-to-day price of oil because it’s somewhat unimportant to us.” Rex Tillerson, CEO
29
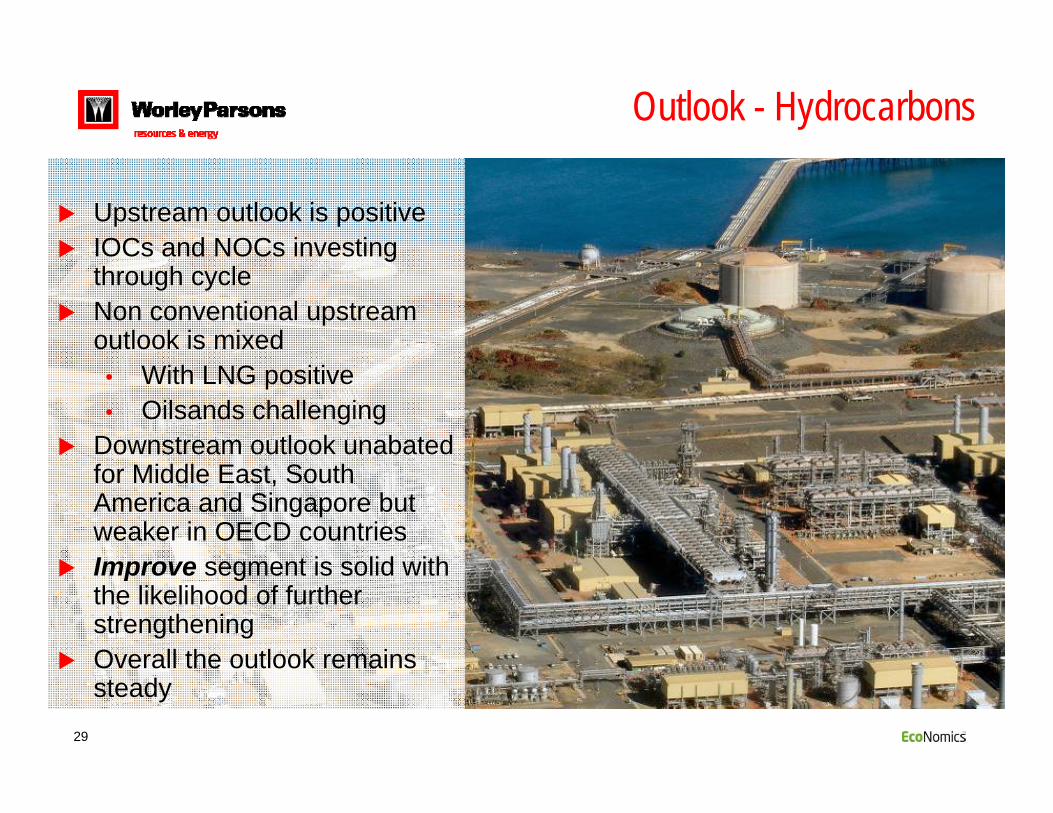
Outlook - Hydrocarbons
Upstream outlook is positive IOCs and NOCs investing through cycleNon conventional upstream outlook is mixed
• With LNG positive• Oilsands challenging
Downstream outlook unabated for Middle East, South America and Singapore but weaker in OECD countriesImprove segment is solid with the likelihood of further strengtheningOverall the outlook remains steady

30
Outlook - Power
Anticipate modest growth Customer uncertainty on technology and carbon remainsEurope, South America and the Middle East provide opportunities for growth Fuel choice uncertainty delaying activity in the US Winning significant study contracts for solar and advanced coal projectsNew nuclear contracts in Eastern and Western Europe and plant support contracts in the US and CanadaGrowth in T&D sector expected
31
Outlook – Minerals and Metals
Significant curtailment of capital expenditure across the industry – particularly Australia, FSUSelect activities will remain in demandOpportunities for growth in Middle East, Africa and South AmericaMaintaining close engagement with all customers through extensive Improve contract base
32
Outlook –Infrastructure & Environment
Outlook is mixedEconomic stimulus funding programs in US and Australia provide opportunitiesOpportunities still exist in several emerging marketsMaintain focus on ports & harbour, environmental services, remediation and water management

33
Outlook – EcoNomicsTM
EcoNomics™ continues to be an important differentiator particularly as the world moves toward emissions or carbon tradingOpportunities in energy usage reduction and improved plant efficiency will be enhanced by the increasing focus of developed countries on carbon trading initiativesSolar• Location studies progressing• Project assessments in US and
Australia including large scale Solar Thermal Power stations and Photo Voltaic solutions
Energy Recovery projects
34
Outlook
Looking ahead for the remainder of this year in these uncertain times is difficult. The company has taken a number of significant initiatives to position itself appropriately for these conditions. Despite some projects and sectors being affected by the global economic crisis the outlook in other sectors remains positive.
We expect the recently announced contract awards, amongst the largest in the company’s history, will support earnings in the 2010 financial year and beyond. We continue to benefit from a lower Australian dollar compared to other currencies. Currently we expect to report good growth for the 2009 financial year.
35
Appendices

36
FX Translation Impact
FX translation impact ~AUD $7m net profit vs. HY08 (24.7% growth vs. 29.3%)
Currency Annualized AUD $m NPAT translation impact of 1c ∆
AUD:CAD 1.6AUD:GBP 1.1AUD: USD 2.3
Currency HY08 HY09 HY08 ∆
AUD:CAD 87.8 87.1 (0.7%)AUD:GBP 42.6 44.9 5.4%AUD: USD 86.5 78.8 (8.9%)
Aggregated Revenue HY09
Asia & Middle East
15%
Europe & Africa13%
Americas18%Canada
26%
Australia & New Zealand
28%
Movement in Major Currencies
55.060.065.070.075.080.085.090.095.0
100.0105.0110.0
Jul-0
8
Sep-
08
Nov-
08
Jan-
09
USD GBP CAD
37
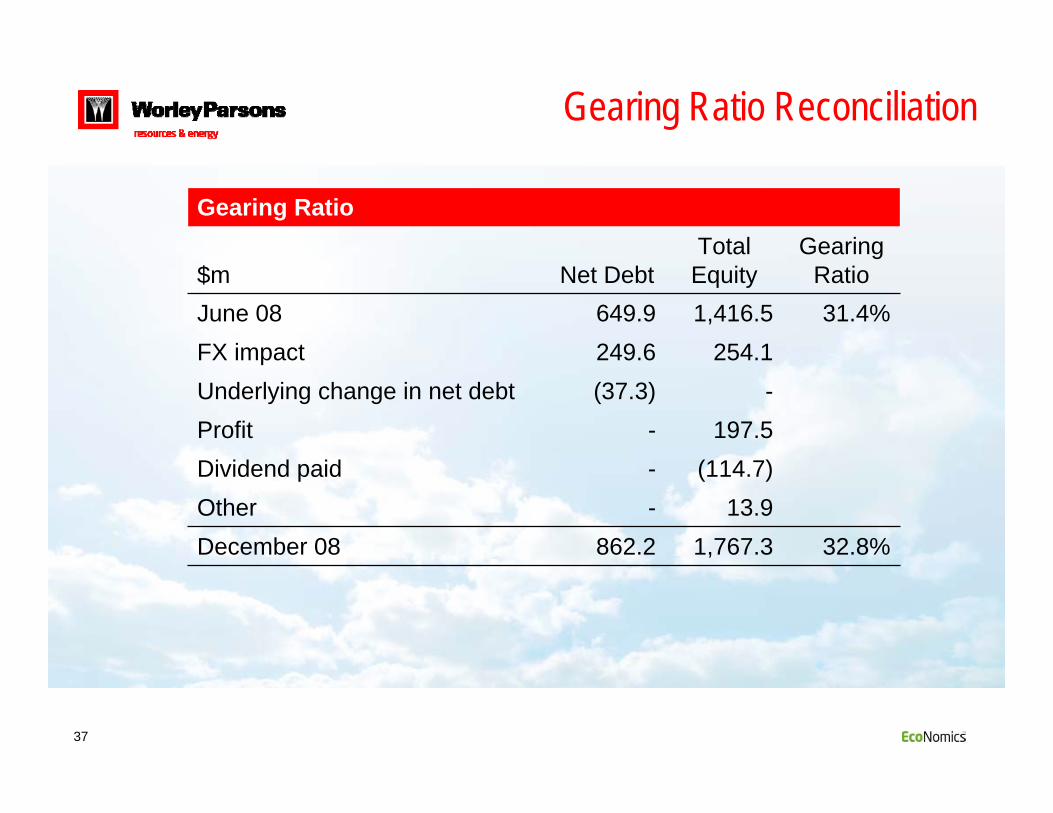
Gearing Ratio Reconciliation
Gearing Ratio
$m Net DebtTotal
EquityGearing
RatioJune 08 649.9 1,416.5 31.4%FX impact 249.6 254.1Underlying change in net debt (37.3) -Profit - 197.5Dividend paid - (114.7)Other - 13.9December 08 862.2 1,767.3 32.8%
38
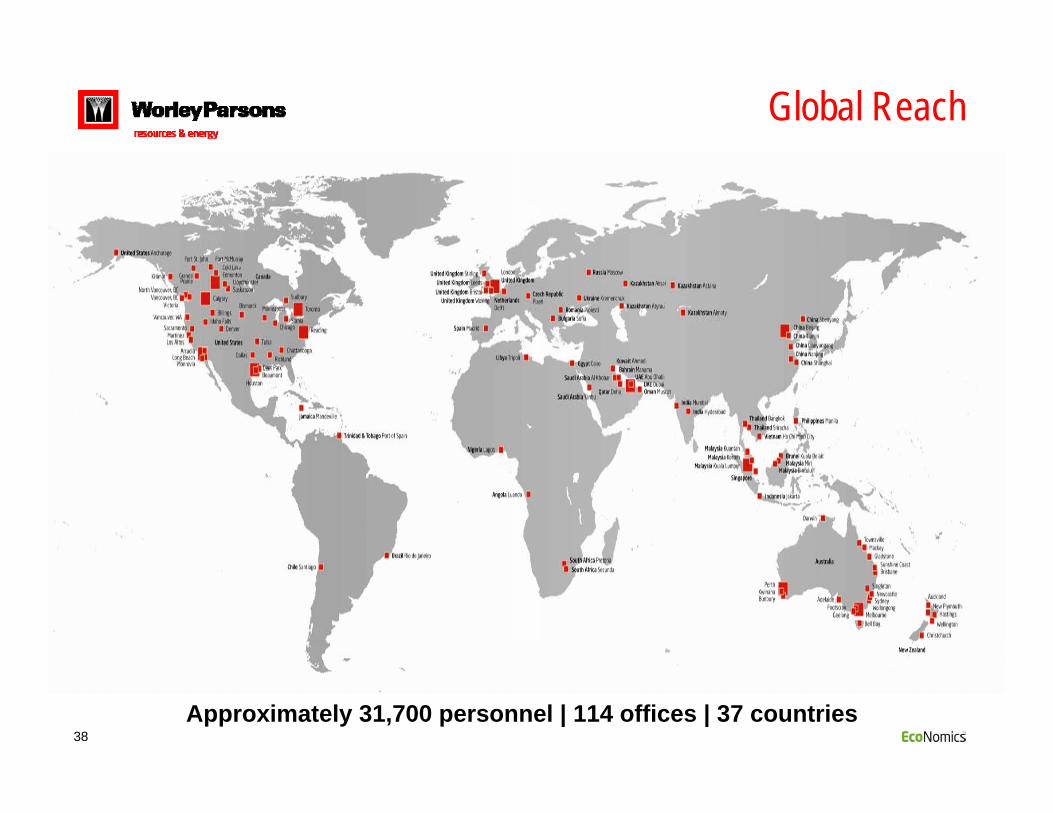
Global Reach
Approximately 31,700 personnel | 114 offices | 37 countries

39
Contractual Acronyms
EDS – Engineering and Design ServicesE&P – Engineering and ProcurementEPC - Engineering, Procurement and ConstructionEPCM – Engineering, Procurement and Construction ManagementESA – Engineering Services AgreementESP – Engineering Services ProviderFEED – Front End Engineering and DesignFEL – Front End LoadingGSA – General Services AgreementOE – Owners EngineerPMC – Project Management Consultancy