Embed Size (px)
Citation preview
Half year financial report
Six-month period ended June 30, 2018
Condensed Consolidated Financial Statements Management Report CEO Attestation Statutory Auditors’ Review Report

Schneider Electric – Half year financial report as at June 30, 2018 2
Table of contents Condensed consolidated financial statements ......................................................................................... 3
Consolidated statement of income............................................................................................................................3
Consolidated statement of other comprehensive income .........................................................................................4
Consolidated statement of cash-flows ......................................................................................................................5
Consolidated balance sheet .....................................................................................................................................6
Consolidated statement of changes in equity ...........................................................................................................8
Notes to the consolidated financial statements .........................................................................................................9
Management report for the period ended June 30, 2018 ................................................................... 21
Review of the consolidated financial statements .................................................................................................... 21
Comments to the consolidated Cash-Flow ............................................................................................................. 28
Significant events of the period ............................................................................................................................... 30
Main risks and areas of uncertainty ........................................................................................................................ 30
Claims, litigations and other risks ........................................................................................................................... 30
Transactions with related parties ............................................................................................................................ 30
CEO attestation ................................................................................................................................................ 31
Statutory Auditors’ review report on the six-month period financial information .......................... 32

Schneider Electric – Half year financial report as at June 30, 2018 3
1. Consolidated statement of income (in millions of euros except for earnings per share) Note First half
2018 First half
2017
Revenue 3 12,317 12,173
Cost of sales (7,499) (7,458)
Gross profit 4,818 4,715
Research and development 4 (278) (263)
Selling, general and administrative expenses (2,771) (2,734)
EBITA adjusted* 1,769 1,718
Other operating income and expenses 5 (64) 71
Restructuring costs 6 (87) (156)
EBITA** 1,618 1,633
Amortization and impairment of purchase accounting intangibles 7 (79) (61)
Operating income 1,539 1,572
Interest income 27 31
Interest expense (125) (145)
Finance costs, net (98) (114)
Other financial income and expense 8 (61) (70)
Net financial income/(loss) (159) (184)
Profit from continuing operations before income tax 1,380 1,388
Income tax expense 9 (318) (361)
Income of discontinued operations, net of income tax (35) (76)
Share of profit/(loss) of associates 36 34
PROFIT FOR THE PERIOD 1,063 985
• attributable to owners of the parent 1,020 958
• attributable to non-controlling interests 43 27
Basic earnings (attributable to owners of the parent) per share
(in euros per share)
1.83 1.72
Diluted earnings (attributable to owners of the parent) per share
(in euros per share)
1.82 1.71
* Adjusted EBITA Earnings Before Interests, Taxes, Amortization of Purchase Accounting Intangibles). Adjusted EBITA corresponds to operating profit before amortization and impairments of purchase accounting intangible assets before goodwill impairment; other operating income and expenses and restructuring costs. ** EBITA (earnings Before Interest, Taxes and Amortization of Purchase Accounting Intangibles). EBITA corresponds to operating profit before amortization and impairment of purchase accounting intangible assets and before goodwill impairment. The accompanying notes are an integral part of the consolidated financial statements.

Schneider Electric – Half year financial report as at June 30, 2018 4
Other comprehensive income
(in millions of euros) Note First half 2018
First half 2017
Profit for the year 1,063 985
Other comprehensive income:
Translation adjustment 183 (907)
Cash-flow hedges (28) (69)
Income tax effect of Cash-flow hedges 6 22
Net gains (losses) on available-for-sale financial assets - (4)
Income tax effect of Net gains (losses) on available-for-sale
financial assets
- -
Actuarial gains (losses) on defined benefits plans 116 (2)
Income tax effect of Actuarial gains (losses) on defined benefits
plans
(20) (10)
Other comprehensive income for the year, net of tax 257 (970)
• out of which to be recycled in income statement ultimately 161 (958)
• out of which not to be recycled in income statement
ultimately
96 (12)
TOTAL COMPREHENSIVE INCOME FOR THE YEAR 1,320 15
Attributable:
• to owners of the parent 1,274 (8)
• to non-controlling interests 46 23 The accompanying notes are an integral part of the consolidated financial statements.

Schneider Electric – Half year financial report as at June 30, 2018 5
2. Consolidated statement of cash flows
(in millions of euros) Note First half 2018
First half 2017
Profit for the period 1,063 985
Loss/(gain) from discontinued operations 35 76
Share of (profit)/losses of associates, net of dividends received (36) (34)
Adjustments with no impact on cash-flow :
Depreciation of property, plant and equipment 182 199
Amortization of intangible assets other than goodwill 210 209
Impairment losses on non-current assets 46 3
Increase/(decrease) in provisions (38) -
Losses/(gains) on disposals of fixed assets 4 (114)
Difference between tax paid and tax expense (4) (11)
Other non-cash adjustments 53 54
Net cash provided by operating activities before changes
in operating assets and liabilities
1,515 1,367
Decrease/(increase) in accounts receivable (82) 63
Decrease/(increase) in inventories and work in process (552) (343)
(Decrease)/increase in accounts payable 72 42
Change in other current assets and liabilities (295) (277)
Change in working capital requirement (857) (515)
Total I - Cash flows from operating activities 658 852
Purchases of property, plant and equipment (210) (204)
Proceeds from disposals of property, plant and equipment 31 21
Purchases of intangible assets (129) (171)
Proceeds from disposals of intangible assets - 3
Net cash used by investment in operating assets (308) (351)
Net financial investments 2 (713) (189)
Proceeds from sale of financial assets 2 15 747
Others long-term investments 35 (19)
Increase in long-term pension assets (139) (135)
Sub-total (802) 404
Total II - Cash flows from/(used in) investing activities (1,110) 53
Issuance of bonds 17 740 -
Repayment of bonds 17 - (97)
Increase/(reduction) in other financial debt 17 1,309 537
Proceeds from issuance of shares 4 10
Sale/(purchase) of own shares (164) -
Dividends paid by Schneider Electric SE (1,223) (1,133)
Dividends paid to non-controlling interests (21) (24)
Total III - Cash flows from/(used in) financing activities 645 (707)
IV - Net foreign exchange difference: 62 (31)
V - Effect of discontinued operations (23) 78
Increase/(decrease) in cash and cash equivalents: I + II
+ III + IV + V
232 245
Cash and cash equivalents at January 1st 2,767 2,530
Increase/(decrease) in cash and cash equivalents 232 245
CASH AND CASH EQUIVALENTS AT JUNE 30 17 2,999 2,775 The accompanying notes are an integral part of the consolidated financial statements.

Schneider Electric – Half year financial report as at June 30, 2018 6
3. Consolidated balance sheet
Assets (in millions of euros) Note June 30,
2018 Dec.31, 2017
NON-CURRENT ASSETS
Goodwill, net 10 18,267 16,423
Intangible assets, net 4,783 4,335
Property, plant and equipment, net 2,444 2,490
Total tangible and intangible assets 11 7,227 6,825
Investments in associates 12 528 547
Non-current financial assets 13 575 436
Deferred tax assets 2,111 2,097
Total non-current assets 28,709 26,328
CURRENT ASSETS
Inventories and work in progress 3,372 2,844
Trade and other operating receivables 5,827 5,763
Other receivables and prepaid expenses 1,885 1,693
Current financial assets 13 46 32
Cash and cash equivalents 17 3,249 3,045
Total current assets 14,379 13,377
Discontinued operations 110 144
TOTAL ASSETS 43,198 39,849
The accompanying notes are an integral part of the consolidated financial statements.

Schneider Electric – Half year financial report as at June 30, 2018 7
Liabilities (in millions of euros) Note June 30,
2018 Dec.31, 2017
Equity 14
Share capital 2,306 2,388
Additional paid-in capital 2,827 5,147
Retained earnings 14,848 12,768
Translation reserve (325) (506)
Equity attributable to owners of the parent 19,656 19,797
Non-controlling interests 1,524 145
Total equity 21,180 19,942
Non-current provisions
Pensions and other post-employment benefit obligations 15 1,690 1,783
Other non-current provisions 16 1,373 1,431
Total non-current provisions 3,063 3,214
Non-current financial liabilities
Bonds 17 5,890 5,626
Other non-current debt 17 16 24
Non-current financial liabilities 5,906 5,650
Deferred tax liabilities 1,011 996
Other non-current liabilities 10 10
Total non-current liabilities 9,990 9,870
Current liabilities
Trade and other operating payables 4,368 4,148
Accrued taxes and payroll costs 2,011 2,250
Current provisions 16 864 842
Other current liabilities 1,321 1,018
Current debt 17 3,402 1,691
Total current liabilities 11,966 9,949
Discontinued operations 62 88
TOTAL EQUITY AND LIABILITIES 43,198 39,849
The accompanying notes are an integral part of the consolidation financial statements.

Schneider Electric – Half year financial report as at June 30, 2018 8
4. Consolidated statement of changes in equity
(in millions of
euros except for
number of
shares)
Number of
shares
(thousands)
Capital Additional
paid-in
capital
Treasury
shares
Retained
earnings
Translation
reserve
Equity
attributable
to owners
of the
parent
Non-
controlling
interests
TOTAL
Dec.31, 2016 592,499 2,370 6,232 (1,880) 12,775 997 20,494 159 20,653
Restatement
IFRS 9 (100) (100) (100)
Jan. 1st, 2017
restated 592,499 2,370 6,232 (1,880) 12,675 997 20,394 159 20,553
Profit for the
year 2,150 2,150 60 2,210
Other
comprehensive
income
(202) (1,503) (1,705) (14) (1,719)
Comprehensive
income for the
year
1,948 (1,503) 445 46 491
Capital increase 2,413 10 132 - 142 - 142
Exercise of
stock options 2,004 8 16 (6) 18 - 18
Dividends (1,133) - (1,133) (64) (1,197)
Change in
treasury shares (154) (17) (171) - (171)
Share-based
compensation
expense
102 102 - 102
Other (100) (119) 219 - 4 4
Dec.31, 2017 596,916 2,388 5,147 (2,153) 14,921 (506) 19,797 145 19,942
Profit for the
year 1,020 1,020 43 1,063
Other
comprehensive
income
74 181 255 3 258
Comprehensive
income for the
year
1,094 181 1,275 46 1,320
Exercise of
stock options 1,633 6 3 (6) 3 - 3
Dividends (1,107) (116) (1,223) (21) (1,244)
Change in
treasury shares (22,000)* (88)* (1,126)* (164) 1,214 (164) - (164)
Share-based
compensation
expense
73 73 - 73
AVEVA
acquisition
impact**
- - 1,333 1,333
Other (90) (15) (105) 21 (84)
June 30, 2018 576,549 2,306 2,827 (2,317) 17,165 (325) 19,656 1,524 21,180
* Cancellation of 22 000 000 treasury shares following the Board’s decision.
** Cf. AVEVA’s acquisition described in note 2.1.
The accompanying notes are an integral part of the consolidated financial statements.

Schneider Electric – Half year financial report as at June 30, 2018 9
5. Notes to the Consolidated Financial Statements
All amounts in millions of Euros unless otherwise indicated. The accompanying notes are an integral part of the consolidated financial statements. The Schneider Electric Group’s consolidated financial statements for the financial half year ended June 30, 2018 were drawn up by the board of directors on July 25, 2018.
Note 1 - Summary of significant accounting policies
➢ Accounting standards and basis of preparation
The consolidated financial statements for the six months ended June 30, 2018 have been prepared in accordance with IAS 34 - Interim Financial Reporting. As condensed financial statements, they do not include all the disclosures required by International Financial Reporting Standards (IFRS) and should be read in conjunction with the December 31, 2017 annual consolidated financial statements included in the Annual Report filed with the French securities regulator (AMF) under no. D.18-0138, except for the differences in accounting treatment between the annual and interim financial statements described below. The interim consolidated financial statements have been prepared in compliance with the international accounting standards adopted by the European Union as of June 30, 2018. The same accounting methods were used as for the consolidated financial statements for the year ended December 31, 2017, except for the application of IFRS 15 - Revenue from Contracts with Customers as of January 1, 2018. The Group did not apply the following standards and interpretations that have not yet been adopted by the European Union as of June 30, 2018 or that were not mandatory for January 1, 2018:
• Standards adopted by the European Union:
- amendments to IFRS 9 - Prepayment Features with Negative Compensation - IFRS 16 - Leases
• Standards not adopted by the European Union:
- IFRS 17 - Insurance Contracts
- IFRIC 23 - Uncertainty over Income Tax Treatments
- amendments to IAS 28 - Long-term Interests in Associates and Joint Ventures
- amendments to IFRS 10/IAS 28 - Sales or contributions of assets between an investor and its
associate/joint venture
- annual Improvements to IFRSs 2015-2017 Cycle (December 2017)
- amendments to IAS 19 - Plan amendment, Curtailment or Settlement
- amendments to References to the Conceptual Framework in IFRS Standards
Finally, the standards applied by Schneider Electric as of June 30, 2018 are consistent with the IFRS standards issued by the International Accounting Standards Board (IASB). Schneider Electric is currently assessing the potential effect on the Group’s consolidated financial statements of the standards not yet applicable, notably the impacts of IFRS 16 – Leases, which is mandatory for annual periods beginning after January 1, 2019. This standard requires all leases other than short-term leases and leases of low-value assets to be recognized in the lessee’s balance sheet in the form of a right-of-use asset, with a corresponding financial liability. Currently, leases classified as “operating leases” are reported as off-balance sheet items (Cf. note 29 from Chapter 5 of Registration Document 2017).
➢ First application of IFRS 15 - Revenue from Contracts with Customers On October 29, 2016, the European Union adopted IFRS 15 “Revenue from Contracts with Customers”, which is applied since January 1, 2018. The Group has performed analysis on each of the revenue streams: transactional sales, service revenue and long-term contracts. Regarding long-term contracts, IFRS 15 requires that both the existence of enforceable right to payment and the absence of alternative use are demonstrated, to be able to recognize revenue over time using the percentage of completion method. The Group has adjusted its long-term contracts internal processes to comply fully with all IFRS 15 requirements. For transactional and services revenue, the Group current accounting practices were already compliant to the new standard.
Schneider Electric – Half year financial report as at June 30, 2018 10
The analysis carried out on the commercial rebates granted to certain distributors evidenced an undervaluation of the accruals for rebates, resulting in a decrease of EUR 129 million in the opening consolidated reserves (disclosed in the line Others on the statement of change in equity) as of June 30, 2018.
➢ Application of IFRS 9 – Financial Instruments IFRS 9, “Financial Instruments”, released by the IASB in July 2014 and adopted by the European Union on November 29, 2016, replaces IAS 39 “Financial Instruments: Recognition and Measurement”, and is mandatory starting January 1, 2018 (except for Phase 3 on hedge accounting, as explained below). The new standard is comprised of 3 phases: (i) Classification and measurement of financial assets and liabilities; (ii) Impairment of financial assets; and (iii) Hedge accounting. Phases 1 and 2 have been early applied by the Group as of January 1, 2017. Comparative information as of June 30, 2017 was restated to include IFRS 9 requirements on phase 1 and 2, with no significant impacts. The changes brought by phase 3 aim to reconcile the accounting treatments with the companies’ risk management. In accordance with IFRS 9 (paragraph 6.1.3), the Group decided to keep applying IAS 39 hedge accounting requirements.
➢ Discontinued operations
On April 20, 2017, the Group announced the disposal of its Solar activity (“Solar”), and is currently implementing the necessary measures and procedures to formalize this transaction. At the end of this ongoing process, the Group will have a minority representation on Solar’s board. This activity used to be reported within the Low Voltage (Building) business segment of Schneider Electric. Solar activity net loss of EUR (35) million has been reclassified to discontinued operations in the Group consolidated financial statements.
➢ Impairment of assets No indication of impairment on long term assets at June 30, 2018 was identified, thus no impairment tests on these assets were implemented to date.
➢ Seasonal variations The Group faces seasonal variations on its activities that may impact the level of revenue from one quarter to another. Therefore, the half-year results are not necessarily as significant as the full year figures.
➢ Income tax expense Current and deferred taxes for interim periods are calculated by applying the estimated average effective tax rate for the current year to pre-tax profit for the period.
Schneider Electric – Half year financial report as at June 30, 2018 11
Note 2 - Changes in the scope of consolidation
2.1 Acquisitions and disposals
➢ Acquisitions & disposals of the period Acquisitions
AVEVA
On September 5, 2017, the Group announced that it had reached agreement with AVEVA Group plc on the terms and conditions of a Combination of AVEVA and Schneider Electric Software business, to create a global leader in engineering and industrial software. On February 28, 2018, the transaction was finalized, following the issue of ordinary shares in the capital of AVEVA to Schneider Electric. The Group owns 60% of the enlarged AVEVA Group, on a fully diluted basis, which is fully consolidated in the Industrial Automation (Industry) business since March 1, 2018. The consideration paid amounts EUR 1,994 million, of which EUR 577 million paid in cash (net of acquired cash). The purchase accounting resulting from the acquisition is not completed at the closing date. As at June 30, 2018, the Group recognized intangible assets for a preliminary amount of EUR 529 million (trademark, patents and customer relationship). The impact on non-controlling interests reflects 40% of the AVEVA total consideration combined with the carrying value of the Schneider Electric Software business evaluated at the time of the acquisition of INVENSYS Group by Schneider Electric.
IGE+XAO
On November 8, 2017, the Group announced the signing of a memorandum of understanding, pursuant to which SEI SAS have filed with the Autorité des Marchés Financiers (AMF) a voluntary public tender offer for the shares of IGE+XAO. On January 25, 2018, after the successful public tender offer and following the delivery of the shares tendered to the offer, the Group announced that SEI SAS owned directly and indirectly 70.57% of the share capital of IGE+XAO, and therefore has taken the control of the Company. Since February 22, 2018, after the reopening of the public tender, the Group owns 70.69% of the share capital of IGE+XAO. IGE+XAO, is fully consolidated in the Low Voltage (Building) business since February 1, 2018. The consideration paid amounts EUR 86 million (net of acquired cash). The purchase accounting resulting from the acquisition is not completed at the closing date.
➢ Follow-up on acquisitions and divestments occurred in 2017 with significant effect in 2018
Acquisitions
On July 27, 2017, Schneider Electric announced that it has signed an agreement to acquire Asco Power Technologies (“ASCO”), a leader in the Automatic Transfer Switch (“ATS”) market for a consideration of circa USD 1,258 million in an all cash transaction. The transaction was finalized on October 31, 2017. ASCO is fully consolidated in the Low Voltage (Building) business since November 1, 2017. The purchase accounting resulting from the acquisition of ASCO is not completed at the closing date. As at June 30, 2018, the Group recognized intangible assets for a preliminary amount of EUR 451 million (trademark, patents and customer relationship. The Group also acquired the minority interest of Luminous in the first semester 2017. Disposals
On April 3, 2017, the Group announced that it has signed an agreement to sell its Telvent DTN business, to TBG AG. On May 31, 2017, the transaction was finalized with a final base sale price established at USD 900 million.

Schneider Electric – Half year financial report as at June 30, 2018 12
2.2 Impact of changes in the scope of consolidation on the Group cash flow
Changes in the scope of consolidation at June 30, 2018, described in note 2.1, decreased the Group’s cash position by a net EUR 698 million outflow, as described below:
First Half 2018
First Half 2017
Acquisitions (713) (189)
Cash and cash equivalents paid (786) (189)
Cash and cash equivalents acquired 73 -
Disposals 15 747
FINANCIAL INVESTMENTS NET OF DISPOSALS (698) 558
Note 3 - Segment information
The Group is organized into four businesses: Low Voltage (Building), Medium Voltage (Infrastructure), Industrial Automation (Industry) and Secure Power (IT): • Low Voltage (Building) provides low voltage power and building automation products and solutions that
address the needs of all end markets from buildings to industries and infrastructure to data centers to help customers improve the energy efficiency of the buildings;
• Medium Voltage (Infrastructure) combines all Medium Voltage activities; the business is in charge of the end-customer segments Electric Utilities, and Transportation when it relates to integrated solutions;
• Industrial Automation (Industry), which includes Automation & Control and four end-customer segments: OEMs, Water, Mining Minerals & Metals, Oil & Gas, and Food & Beverages when it relates to solutions integrating the offers of several activities from the Group;
• Secure Power (IT), which covers Critical Power & Cooling Services and three end-customer segments (Data centers, Finance, Cloud computing and Telecom).
Expenses concerning General Management that cannot be allocated to a particular segment are presented under “Corporate costs”. Operating segment data is identical to that presented to the board of directors, which has been identified as the “main decision-making body” for allocating resources and evaluating segment performance. Performance assessments used by the board of directors are notably based on Adjusted EBITA. Share-based payment is presented under “Corporate costs”. The board of directors does not review assets and liabilities by Business. The same accounting principles governing the consolidated financial statements apply to segment data. Details are provided in the Management Report.
3.1 Information by operating segment
First Half 2018
Low Voltage
(Building)
Medium Voltage
(Infrastructure)
Industrial Automation (Industry)
Secure Power
(IT)
Corporate costs
Total
Revenue 5,630 1,932 3,064 1,691 - 12,317
Adjusted EBITA* 1,176 162 528 246 (343) 1,769
Adjusted EBITA (%) 20.9% 8.4% 17.3% 14.6% 14.4% * Adjusted EBITA: EBITA before restructuring costs and other operating income and expense.

Schneider Electric – Half year financial report as at June 30, 2018 13
First Half 2017
Low Voltage
(Building)
Medium Voltage
(Infrastructure)
Industrial Automation (Industry)
Secure Power
(IT)
Corporate costs
Total
Revenue 5,341 2,156 2,907 1,769 - 12,173
Adjusted EBITA* 1 ,111 180 487 256 (316) 1,718
Adjusted EBITA (%) 20.8% 8.4% 16.7% 14.5% 14.1%
* Adjusted EBITA: EBITA before restructuring costs and other operating income and expense.
3.2 Information by region
The geographic regions covered by the Group are: - Western Europe, - North America (including Mexico), - Asia-Pacific, - and Rest of the World (Eastern Europe, Middle East, Africa, South America). Non-current assets include net goodwill, net intangible assets and net property, plant and equipment. First Half 2018
Western Europe
Asia-Pacific
North America
Rest of the world
Total
Sales by country market 3,385 3,566 3,375 1,991 12,317
Non-current assets 11,062 3,844 9,372 1,216 25,494
First Half 2017
Western Europe
Asia-Pacific
North America
Rest of the world
Total
Sales by country market 3,322 3,334 3,433 2,084 12,173
Non-current assets 8,899 4,033 8,700 1,309 22,941
Moreover, the Group follows the share of new economies in revenue:
First half 2018 First half 2017
Revenue - Mature countries 7,142 7,148
Revenue - New economies 5,175 5,025
TOTAL 12,317 12,173
Note 4 - Research and development
Research and development costs are as follows:
First half 2018
First half 2017
Research and development costs in costs of sales (200) (183)
Research and development costs in commercial expenses (1) (278) (263)
Capitalized development costs (129) (164)
TOTAL RESEARCH AND DEVELOPMENT COSTS FOR THE PERIOD (607) (610) (1) of which EUR 22 million of research and development tax credit in first half 2018 and EUR 24 million in first half 2017.
Amortization of capitalized development costs came to EUR 123 million in the first half of 2018 and EUR 126 million in the first half of 2017.

Schneider Electric – Half year financial report as at June 30, 2018 14
Note 5 - Other operating income and expense
Other operating income and expenses are as follows:
First half 2018
First half 2017
Impairment losses (33) 11
Gains/Losses on asset disposals (2) (3)
Costs of acquisition and disposals (30) (18)
Gains/Losses on business disposals 14 117
Others (13) (36)
OTHER OPERATING INCOME AND EXPENSES (64) 71
In 2017, gains on business disposals mostly include the impact of the disposal of the Telvent DTN business.
Note 6 - Restructuring costs
Restructuring costs in six-month period ended June 30, 2018 totaled EUR 87 million and primarily stemmed from
the reorganization of manufacturing operations and support functions.
Note 7 - Amortization and impairment of purchase accounting intangibles
First half 2018
First half 2017
Amortization of purchase accounting intangibles (73) (61)
Impairment of purchase accounting intangibles (6) -
AMORTIZATION AND IMPAIRMENT OF PURCHASE ACCOUNTING INTANGIBLES
(79) (61)
Note 8 - Other financial income and expenses
First half 2018
First half 2017
Exchange gains and losses, net 7 (3)
Financial component of defined benefit plan cost (30) (39)
Net gains/(losses) on disposal of assets available for sale - (2)
Other financial expenses, net (38) (26)
OTHER FINANCIAL INCOME AND EXPENSES (61) (70)
Note 9 - Income tax
Wherever the regulatory environment allows it, Group entities file consolidated tax returns. Schneider Electric SE files a consolidated tax return with its French subsidiaries held directly or indirectly through Schneider Electric Industries SAS.
9.1 Analysis of income tax expense
First half 2018
First half 2017
Current taxes (338) (303)
Deferred taxes 20 (58)
INCOME TAX (EXPENSE) / BENEFIT (318) (361)
Schneider Electric – Half year financial report as at June 30, 2018 15
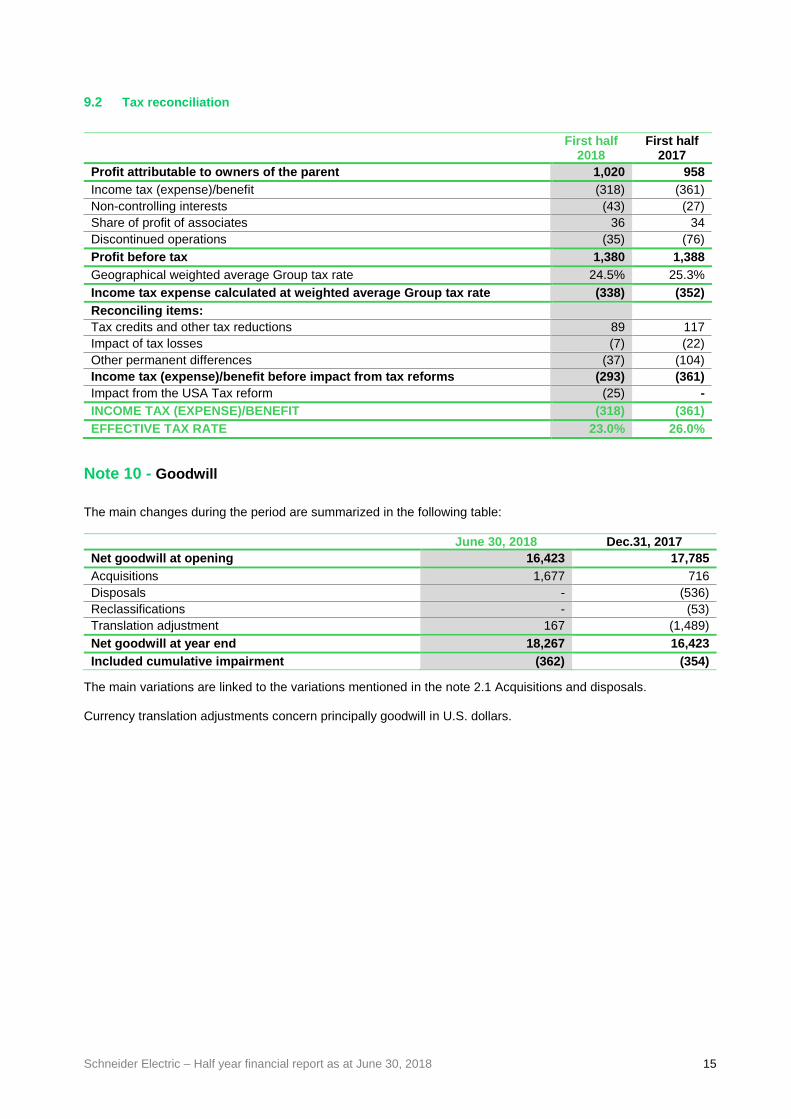
9.2 Tax reconciliation
First half
2018 First half
2017
Profit attributable to owners of the parent 1,020 958
Income tax (expense)/benefit (318) (361)
Non-controlling interests (43) (27)
Share of profit of associates 36 34
Discontinued operations (35) (76)
Profit before tax 1,380 1,388
Geographical weighted average Group tax rate 24.5% 25.3%
Income tax expense calculated at weighted average Group tax rate (338) (352)
Reconciling items:
Tax credits and other tax reductions 89 117
Impact of tax losses (7) (22)
Other permanent differences (37) (104)
Income tax (expense)/benefit before impact from tax reforms (293) (361)
Impact from the USA Tax reform (25) -
INCOME TAX (EXPENSE)/BENEFIT (318) (361) EFFECTIVE TAX RATE 23.0% 26.0%
Note 10 - Goodwill
The main changes during the period are summarized in the following table:
June 30, 2018 Dec.31, 2017
Net goodwill at opening 16,423 17,785
Acquisitions 1,677 716
Disposals - (536)
Reclassifications - (53)
Translation adjustment 167 (1,489)
Net goodwill at year end 18,267 16,423
Included cumulative impairment (362) (354)
The main variations are linked to the variations mentioned in the note 2.1 Acquisitions and disposals. Currency translation adjustments concern principally goodwill in U.S. dollars.

Schneider Electric – Half year financial report as at June 30, 2018 16
Note 11 - Intangible assets and property, plant and equipment
Changes in intangible assets and property, plant and equipment over the six-month period from January 1, 2018 are mainly related to the variations mentioned in the note 2.1 Acquisitions and disposals.
Note 12 - Investments in associates
The variations of the period correspond mainly to the share of profit and loss of investment in associates. Main contributor is Delixi investment with a net result of EUR 30 million for the six-month period ended June 30, 2018 compared to EUR 18 million for the six-month period ended June 30, 2017.
Note 13 - Financial assets
13.1 Non-current financial assets
Non-current financial assets amount to EUR 575 million as of June 30, 2018.
13.2 Current financial assets
Current financial assets amount EUR 46 million as of June 30, 2018 and mainly comprise non-monetary short-term investments.
Note 14 - Shareholder’s equity
14.1 Share-based payments
A total of 1.6 million Schneider Electric SE shares were issued during six-month period ended June 30, 2018 upon exercise of stock options and performance shares grant. Based upon the assumptions described in the notes to the 2017 consolidated financial statements, the expense recorded under "Selling, general and administrative expenses" for stock option or stock grant plans totaled EUR 73 million in six-month period ended June 30, 2018 (EUR 55 million for the six-month period ended June 30, 2017). This expense was booked as an adjustment to “Retained earnings” in Shareholders’ Equity.

Schneider Electric – Half year financial report as at June 30, 2018 17
Note 15 - Pensions and other post-employment benefit obligations
Changes in provisions for pensions and other post-employment benefit obligations were as follows:
Pensions and termination
benefits
Other Post-employment
and long-term benefits
Provisions for pensions and
other post-employment
benefits
Dec. 31, 2017 1,324 277 1,601
Surplus of plans recognized as assets (182) - (182)
Provisions recognized as liabilities 1,506 277 1,783
Net cost recognized in the statement of income 47 7 54
▪ Service cost 22 3 25
▪ Interest cost 127 4 131
▪ Interest income (102) - (102)
Benefits paid (11) (15) (26)
Plan participants’ contributions (139) - (139)
Actuarial gains and losses recognized in equity (115) (1) (116)
Translation adjustment 8 5 13
Change in the scope of consolidation 5 - 5
June 30, 2018 1,119 273 1,392
Surplus of plans recognized as assets (298) - (298)
Provisions recognized as liabilities 1,417 273 1,690
Following the agreement reached with the Trustee of the Invensys Pension Scheme in the UK on February 7, 2014, Schneider Electric SE guaranteed all obligations of the Invensys subsidiaries which participate in the Scheme, up to a maximum amount of GBP 1.75 billion. At June 30, 2018, plan assets exceed the value of obligations subject to this guarantee and thus this guarantee cannot be called. The pension net assets are included in other non-current financial assets.
Note 16 - Provisions
Economic
risks
Customer
risks
Products
risks
Environmental
risks
Restructuring Other
risks
Provisions
Dec. 31,
2017 821 94 445 290 154 469 2,273
Of which
long-term
portion
615 64 153 276 8 315 1,431
Additions 45 3 57 2 47 88 242
Utilizations (81) (11) (51) (12) (60) (118) (333)
Reversals of
surplus
provisions
(12) (1) (3) - (1) - (17)
Translation
adjustments 2 1 (1) 7 (1) 6 14
Changes in
the scope of
consolidation
and other
27 (1) - 22 1 9 58
June 30,
2018 802 85 447 309 140 454 2,237
Of which
long-term
portion
553 63 153 273 12 319 1,373

Schneider Electric – Half year financial report as at June 30, 2018 18
Note 17 - Net debt
Net debt breaks down as follows:
June 30, 2018
Dec.31, 2017
Bonds 7,139 6,375
Bank and other borrowings 31 23
Employees profit sharing 3 4
Short-term portion of convertible and non-convertible bonds (1,249) (749)
Short-term portion of long-term debt (18) (3)
NON-CURRENT FINANCIAL LIABILITIES 5,906 5,650
Commercial paper 1,571 330
Accrued interest 90 58
Other short-term borrowings 224 273
Bank overdrafts 250 278
Short-term portion of convertible and non-convertible bonds 1,249 749
Short-term portion of long-term debt 18 3
Short-term debt 3,402 1,691
TOTAL CURRENT AND NON-CURRENT FINANCIAL LIABILITIES (A) 9,308 7,341
Marketable securities 1,475 1,393
Negotiable debt securities and short-term deposits 31 107
Cash and cash equivalents 1,743 1,545
Total cash and cash equivalents (B) 3,249 3,045
Bank overdrafts (C) (250) (278)
NET CASH AND CASH EQUIVALENTS (B + C) 2,999 2,767
NET DEBT (A – B) 6,059 4,296 Cash and cash equivalents net of short-term bank loans and overdrafts totaled EUR 2,999 million, corresponding to the amount reported in the consolidated cash flow statement. Non-recourse factoring of trade receivables was realized during the six-month period ended June 30, 2018 for a total amount of EUR 50 million, compared with EUR 60 million during the six-month period ended June 30, 2017. Marketable securities generally consist of highly liquid instruments traded on regulated markets that are readily convertible into known amounts of cash, such as commercial paper, mutual funds and equivalents. All the financial instruments are usually evaluated at fair value, except the long-term debt. The non-current financial liabilities contain convertible bonds for which fair value as at June 30, 2018 is EUR 7,400 million.
Note 18 - Derivative instruments
18.1 Foreign currency
As a significant proportion of Group's transactions are denominated in currencies other than the euro, the Group is exposed to currency risk. The Group uses derivative instruments to hedge its exposure to exchange rates mainly through futures and natural hedge. Furthermore, some long-term loans and borrowings granted to the affiliates are considered as net investment according to IAS 21.
June 30, 2018 IFRS designation Carrying amount Nominal amount
Sale Purchase
Futures - cash flow hedges CFH * (26) 555 527
Futures - net investment hedges NIH * 3 1,137 -
Futures - hedges of balance sheet items Trading (52) 4,780 3,209
(75) 6,472 3,736
Schneider Electric – Half year financial report as at June 30, 2018 19
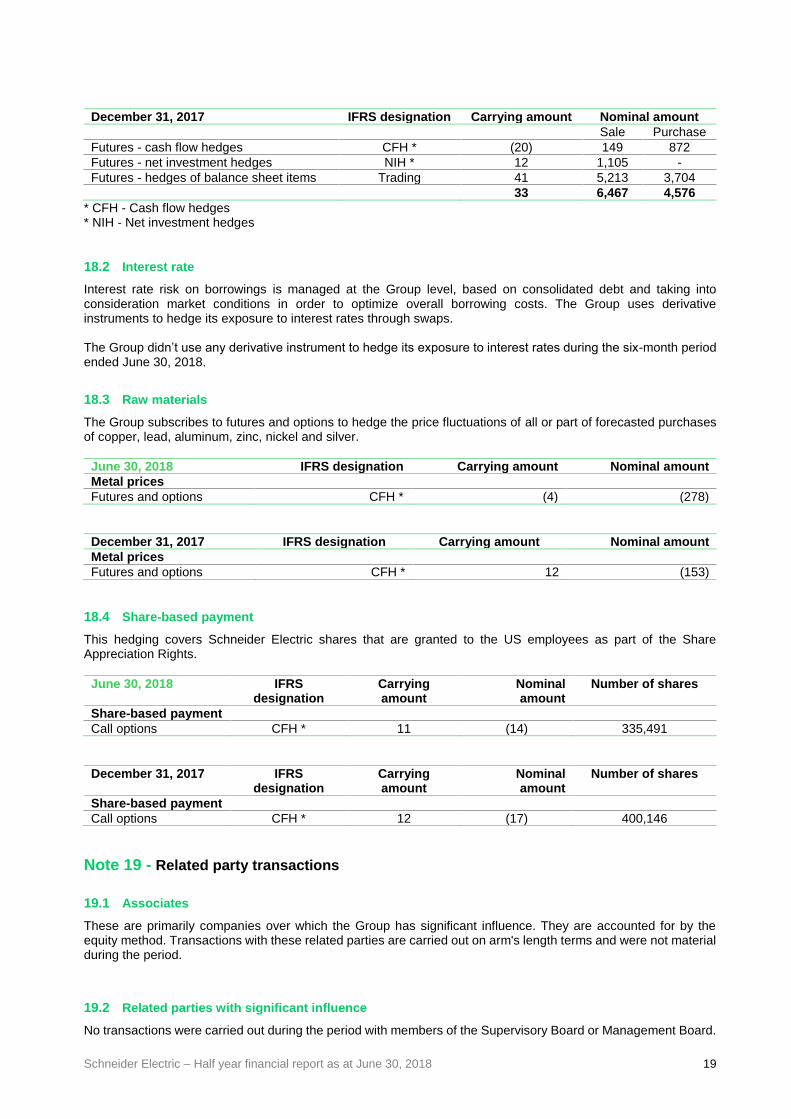
December 31, 2017 IFRS designation Carrying amount Nominal amount
Sale Purchase
Futures - cash flow hedges CFH * (20) 149 872
Futures - net investment hedges NIH * 12 1,105 -
Futures - hedges of balance sheet items Trading 41 5,213 3,704
33 6,467 4,576
* CFH - Cash flow hedges * NIH - Net investment hedges
18.2 Interest rate
Interest rate risk on borrowings is managed at the Group level, based on consolidated debt and taking into consideration market conditions in order to optimize overall borrowing costs. The Group uses derivative instruments to hedge its exposure to interest rates through swaps. The Group didn’t use any derivative instrument to hedge its exposure to interest rates during the six-month period ended June 30, 2018.
18.3 Raw materials
The Group subscribes to futures and options to hedge the price fluctuations of all or part of forecasted purchases of copper, lead, aluminum, zinc, nickel and silver.
June 30, 2018 IFRS designation Carrying amount Nominal amount
Metal prices
Futures and options CFH * (4) (278)
December 31, 2017 IFRS designation Carrying amount Nominal amount
Metal prices
Futures and options CFH * 12 (153)
18.4 Share-based payment
This hedging covers Schneider Electric shares that are granted to the US employees as part of the Share Appreciation Rights.
June 30, 2018 IFRS designation
Carrying amount
Nominal amount
Number of shares
Share-based payment
Call options CFH * 11 (14) 335,491
December 31, 2017 IFRS designation
Carrying amount
Nominal amount
Number of shares
Share-based payment
Call options CFH * 12 (17) 400,146
Note 19 - Related party transactions
19.1 Associates
These are primarily companies over which the Group has significant influence. They are accounted for by the equity method. Transactions with these related parties are carried out on arm's length terms and were not material during the period.
19.2 Related parties with significant influence
No transactions were carried out during the period with members of the Supervisory Board or Management Board.

Schneider Electric – Half year financial report as at June 30, 2018 20
Note 20 - Commitments and contingent liabilities
20.1 Guarantees given and received
Guarantees given and received amounted to EUR 3,353 million and EUR 80 million, respectively, as of June 30, 2018.
20.2 Contingent liabilities
Management is confident that balance sheet provisions for known disputes in which the Group is involved are sufficient to ensure that these disputes do not have a material impact on its financial position or profit. This is notably the case for the potential consequences of a current dispute in Belgium involving former senior executives and managers of the Group. The loan agreements related to the Group's long-term debt do not include any rating triggers.
Note 21 - Subsequent events
➢ Issuance of shares to employees
Schneider Electric gives its employees the opportunity to become group shareholders thanks to employee share issues. Employees in countries that meet legal and fiscal requirements have been proposed the classic plan.
Under the classic plan, employees may purchase Schneider Electric shares at a 15% discount to the price quoted for the shares on the stock market. Employees must then hold their shares for five years, except in certain cases provided for by law. The share-based payment expense recorded in accordance with IFRS 2 is measured by reference to the fair value of the discount on the locked-up shares. The lock-up cost is determined on the basis of a two-step strategy that involves first selling the locked-up shares on the forward market and then purchasing the same number of shares on the spot market (i.e., shares that may be sold at any time) using a bullet loan.
This strategy is designed to reflect the cost the employee would incur during the lock-up period to avoid the risk of carrying the shares subscribed under the classic plan. The borrowing cost corresponds to the cost of borrowing for the employees concerned, as they are the sole potential buyers in this market. It is based on the average interest rate charged by banks for an ordinary, non-revolving personal loan with a maximum maturity of five years granted to an individual with an average credit rating.
As regards the first semester 2018, Schneider Electric gave its employees the opportunity to purchase shares at a price of EUR 64.47 per share, depending on the country, as part of its commitment to employee share ownership. This represented a 15% discount to the reference price of EUR 75.86 calculated as the average opening price quoted for the share during the 20 days preceding the Management Board’s decision to launch the employee share issue.
Altogether, 2.4 million shares were subscribed, increasing the Company’s capital by EUR 155 million as of July 10, 2018. Due to significant changes in valuation assumptions, specifically the interest rate available to market participant, the value of the lock-up period is higher than the discount cost since 2012. Therefore, the Group did not recognize any cost related to the transaction.

Schneider Electric – Half year financial report as at June 30, 2018 21
MANAGEMENT REPORT FOR THE PERIOD ENDED JUNE 30, 2018
Consolidated financial statements
Business and Statement of Income highlights
Changes in the scope of consolidation
Acquisitions during the period
AVEVA On September 5, 2017, the Group announced that it had reached agreement with AVEVA Group plc on the terms and conditions of a Combination of AVEVA and Schneider Electric Software business, to create a global leader in engineering and industrial software. On February 28, 2018, the transaction was finalized, following the issue of ordinary shares in the capital of AVEVA to Schneider Electric. The Group owns 60% of the enlarged AVEVA Group, on a fully diluted basis, which is fully consolidated in the Industrial Automation (Industry) business since March 1, 2018. The consideration paid amounts EUR 1,994 million, of which EUR 577 million paid in cash (net of acquired cash). The purchase accounting resulting from the acquisition is not completed at the closing date. As at June 30, 2018, the Group recognized intangible assets for a preliminary amount of EUR 529 million (trademark, patents and customer relationship). IGE+XAO
On November 8, 2017, the Group announced the signing of a memorandum of understanding, pursuant to which SEI SAS have filed with the Autorité des Marchés Financiers (AMF) a voluntary public tender offer for the shares of IGE+XAO. On January 25, 2018, after the successful public tender offer and following the delivery of the shares tendered to the offer, the Group announced that SEI SAS owned directly and indirectly 70.57% of the share capital of IGE+XAO, and therefore has taken the control of the Company. Since February 22, 2018, after the reopening of the public tender, the Group owns 70.69% of the share capital of IGE+XAO. IGE+XAO, is fully consolidated in the Low Voltage (Building) business since February 1, 2018. The consideration paid amounts EUR 86 million (net of acquired cash). The purchase accounting resulting from the acquisition is not completed at the closing date.
Follow-up on acquisitions occurred in 2017 with significant effect in 2018
On July 27, 2017, Schneider Electric announced that it has signed an agreement to acquire Asco Power Technologies (“ASCO”), a leader in the Automatic Transfer Switch (“ATS”) market for a consideration of circa USD 1,258 million in an all cash transaction. The transaction was finalized on October 31, 2017. ASCO is fully consolidated in the Low Voltage (Building) business since November 1, 2017. The purchase accounting resulting from the acquisition of ASCO is not completed at the closing date. As at June 30, 2018, the Group recognized intangible assets for a preliminary amount of EUR 451 million (trademark, patents and customer relationship. The Group also acquired the minority interest of Luminous in the first semester 2017.
Follow-up on disposals occurred in 2017 with significant effect in 2018
On April 3, 2017, the Group announced that it has signed an agreement to sell its Telvent DTN business, to TBG AG. On May 31, 2017, the transaction was finalized with a final base sale price established at USD 900 million.

Schneider Electric – Half year financial report as at June 30, 2018 22
Discontinued operations
On April 20, 2017, the Group announced the disposal of its Solar activity (“Solar”), and is currently implementing the necessary measures and procedures to formalize this transaction. At the end of this ongoing process, the Group will have a minority representation on Solar’s board. This activity used to be reported within the Low Voltage (Building) business segment of Schneider Electric. Solar activity net loss of EUR (35) million has been reclassified to discontinued operations in the Group consolidated financial statements.
Exchange rate changes
Fluctuations in the euro exchange rate had a negative impact in six-month period ended June 30, 2018, decreasing consolidated revenue by EUR (796) million and adjusted EBITA by EUR (141) million, due mainly to the negative effect of the US Dollar compared to the Euro.

Schneider Electric – Half year financial report as at June 30, 2018 23
Results of Operations
The following table sets forth our results of operations for the six-month period ended June 30, 2018 and 2017:
(in millions of Euros except for earnings per share)
1st half-year 2018
1st half-year 2017
% variance
Revenue 12,317 12,173 1.2%
Cost of sales (7,499) (7,458) 0.5%
Gross profit 4,818 4,715 2.2%
% Gross profit 39.1% 38.7%
Research and development (278) (263) 5.7%
Selling, general and administrative expenses (2,771) (2,734) 1.4%
Adjusted EBITA 1,769 1,718 3.0%
% Adjusted EBITA 14.4% 14.1%
Other operating income and expenses (64) 71 -190.1%
Restructuring costs (87) (156) -44.2%
EBITA 1,618 1,633 -0.9%
% EBITA 13.1% 13.4%
Amortization and impairment of purchase accounting intangibles
(79) (61) 29.5%
Operating income 1,539 1,572 -2.1%
% Operating income 12.5% 12.9%
Interest income 27 31 148.4%
Interest expense (125) (145) 20.7%
Finance costs, net (98) (114) -14.0%
Other financial income and expense (61) (70) -12.9%
Net financial income/loss (159) (184) -13.6%
Profit from continued operations before income tax
1,380 1,388 -0.6%
Income tax expense (318) (361) -11.9%
Income of discontinued operations, net of income tax
(35) (76) -53.9%
Share of profit/(losses) of associates 36 34 5.9%
Profit for the period 1,063 985 7.9%
-Attributable to owners of the parent 1,020 958 6.5%
-Attributable to non-controlling interests 43 27 59.3%
Basic earnings per share –attributable to owners of the parent (in Euros per share)
1.83 1.72 6.4%
Revenue
Consolidated revenue totaled EUR 12,317 million for the period ended June 30, 2018, up 1.2% on a current structure and currency basis from the year-earlier period. Organic growth was positive for 7.0%, acquisitions net of acquisitions and disposals accounted for 1.4% and the
currency effect for -7.2% due mainly to the negative effect of the US dollar compared to the Euro.

Schneider Electric – Half year financial report as at June 30, 2018 24
Breakdown by business
The following table sets forth our revenue by business segment for the six-month periods ended June 30, 2018 and 2017.
(in millions of Euros)
Low Voltage Medium Voltage
Industrial Automation
Secure Power
Total
June 30, 2018 5,630 1,932 3,064 1,691 12,317
June 30, 2017 5,341 2,156 2,907 1,769 12,173
Low Voltage (Building) (45% of H1 revenues) was up +9.1% organically for the first half of 2018 with growth in all four regions. Residential and small buildings offer continued strong growth, up +9% organic and continuing four years of growth. The business performed well in key segments such as CIB & Datacenter.
Secure Power (IT) (14% of H1 revenues) was up +3.8% organically for the first half of 2018 with New Economies up circa +8% and despite some component shortages. Smaller Secure Power offers grew, benefitting from investment at the edge while non-IT end markets were up driven by the Group’s complete integrated Energy Management offers. The business recorded strong sales to datacenters (up mid-single digit), which enabled strong sales for the entire Group portfolio in this segment. Services were up mid-single digit.
Industrial Automation (Industry) (25% of H1 revenues) was up +10.0% organically for the first half of 2018 with strong growth across Discrete, Process and Hybrid automation markets, and with all regions posting growth. The business saw improving demand in process industries from electro-intensive customers while the Group’s offers for OEM grew strongly across regions despite pressure on supply chain. Adoption of Group’s EcoStruxure offers progressed well.
Medium Voltage (Infrastructure) (16% of H1 revenues) was up +0.4% organically for the first half of 2018. Transactional Sales & Services yielded high-single digit growth in H1 with good growth in China and the U.S. The project part of the business was down with a decline in Western Europe resulting from a low backlog last year and difficult conditions in some new economies. The Grid Automation business had multiple wins supporting the energy transition of our customers.
Gross margin Gross margin increased to EUR 4,818 million for the six-month period ended June 30, 2018 (EUR 4,715 million for the six-month period ended June 30, 2017) mainly linked to an increase in revenue. As a percentage of revenues, gross profit is improving to 39.1% in first half of 2018 from 38.7% in first half of 2017, thanks to strong industrial productivity and positive pricing.
Support Function costs: Research and development and selling, general and administrative expenses
Research and development expenses, net of capitalized development costs and excluding research and development costs booked in costs of sales, increased by 5.7% from EUR 263 million for the six-month period ended June 30, 2017 to EUR 278 million for the six-month period ended June 30, 2018. As a percentage of revenues, the net cost of research and development is increasing slightly to 2.3% of revenues for six-month period ended June 30, 2018 (2.2% for the six-month period ended June 30, 2017).
Total research and development expense, including capitalized development costs and development costs reported as cost of sales (see Note 4 to the Audited Consolidated Financial Statements) decreased by 0.5% from EUR 610 million for the six-month period ended June 30, 2017 to EUR 607 million for the six-month period ended June 30, 2018. As a percentage of revenues, total research and development expenses decreased slightly to 4.9% for the six-month period ended June 30, 2018 (5.0% for the six-month period ended June 30, 2017).
On the first semester 2018, the net effect of capitalized development costs and amortization of capitalized development costs amounts to EUR 6 million on operating income (EUR 38 million on the first semester 2017).
Selling, general and administrative expenses increased by 1.4% to EUR 2,771 million for the six-month period ended June 30, 2018 (EUR 2,734 million for the six-month period ended June 30, 2017). As a percentage of revenues, selling, general and administrative expenses remained stable at 22.5% for the six-month period ended June 30, 2018 (22.5% for the six-month period ended June 30, 2017).

Schneider Electric – Half year financial report as at June 30, 2018 25
Combined, total support function costs, that is, research and development expenses together with selling, general and administrative costs, totaled EUR 3,049 million six-month period ended June 30, 2018 compared to EUR 2,997 million six-month period ended June 30, 2017, an increase of 1.7%. As a result, support functions costs to sales ratio increased from 24.6% for the six-month period ended June 30, 2017 to 24.8% for the six-month period ended June 30, 2018.
Other operating income and expenses
For the six-month period ended June 30, 2018, other operating income and expenses amounted to a net expense of EUR (64) million, mainly including costs of acquisitions and disposals of EUR (30) million, impairment of assets for EUR (33) million and EUR 14 million gain on business disposal.
Restructuring costs
For the six-month period ended June 30, 2018, restructuring costs amounted to EUR 87 million compared to EUR
156 million for the six-month period ended June 30, 2017, attributed to Support Function Costs improvement initiatives. EBITA and Adjusted EBITA
We define adjusted EBITA as EBITA before restructuring costs and before other operating income and expenses, which includes acquisition, integration and separation costs. We define EBITA as earnings before interest, taxes and amortization of purchase accounting intangibles. EBITA comprises operating profit before amortization and impairment of purchase accounting intangible assets and before goodwill impairment. Adjusted EBITA amounted to EUR 1,769 million for the six-month period ended June 30, 2018, compared to EUR 1,718 million for the six-month period ended June 30, 2017, an increase of 3.0%. As a percentage of revenues, adjusted EBITA improved from 14.1% for the six-month period ended June 30, 2017 to 14.4% for the six-month period ended June 30, 2018 (+0.3 points versus last year). EBITA decreased by 0.9% from EUR 1,633 million for the six-month period ended June 30, 2017 to EUR 1,618 million for the six-month period ended June 30, 2018, due to the deterioration in other operating income and expenses. As a percentage of revenues, EBITA decreased to 13.1% for the six-month period ended June 30, 2018 (13.4% for the six-month period ended June 30, 2017).
Adjusted EBITA by business segment
The following table sets out EBITA and adjusted EBITA by business segment:
(in millions of Euros)
Low Voltage
(Building)
Medium Voltage
(Infrastructure)
Industrial Automation (Industry)
Secure Power (IT)
Corporate costs
Total
June 30, 2018
Revenues 5,630 1,932 3,064 1,691 - 12,317
Adjusted EBITA* 1,176 162 528 246 (343) 1,769
Adjusted EBITA (%) 20.9% 8.4% 17.3% 14.6% 14.4% * Adjusted EBITA: EBITA before restructuring costs and before other operating income and expenses.
(in millions of Euros)
Low Voltage
(Building)
Medium Voltage
(Infrastructure)
Industrial Automation (Industry)
Secure Power (IT)
Corporate costs
Total
June 30, 2017
Revenues 5,341 2,156 2,907 1,769 - 12,173
Adjusted EBITA* 1,111 180 487 256 (316) 1,718
Adjusted EBITA (%) 20.8% 8.4% 16.7% 14.5% 14.1% * Adjusted EBITA: EBITA before restructuring costs and before other operating income and expenses.

Schneider Electric – Half year financial report as at June 30, 2018 26
Low Voltage (Building) adjusted EBITA for the six-month period ended June 30, 2018 reached EUR 1,176 million, or 20,9% of revenues up +0.1 points (circa +0.4 points organic) year on year. Medium Voltage (Infrastructure) adjusted EBITA was EUR 162 million, or 8.4% of revenues, flat year-on-year and up circa +1.1 points organic, thanks to higher system gross margin and lean cost structure implementation in the power system organization.
Industrial Automation (Industry) generated an adjusted EBITA of EUR 528 million, or 17.3% of revenues, up +0.6 points versus H1 2017, and circa +0.1 points organic, including the impact of digital investments and higher inflation.
Secure Power (IT) business reported an adjusted EBITA of EUR 246 million, 14.6% of revenues, up +0.1 points compared to 2017 (around flat organic). Corporate costs in H1 2018 amounted to EUR 343 million or 2.8% of revenue.
Operating income (EBIT)
Operating income, after amortization and depreciation of purchased intangibles, decreased from EUR 1,572 million for the six-month period ended June 30, 2017 to 1,539 million for the six-month period ended June 30, 2018, a decrease of 2.1% linked to a decrease of EBITA and an increase of amortization and impairment of purchase accounting intangibles of EUR 18 million (EUR 79 million on the six-month period ended June 30, 2018 compared to EUR 61 million six-month period ended June 30, 2017).
Net financial income/loss
Net financial loss amounted to EUR 159 million for the six-month period ended June 30, 2018, compared to EUR 184 million for the six-month period ended June 30, 2017. This decrease is explained both by the decrease of cost of net financial debt to EUR 98 million for the six-month
period ended June 30, 2018, compared to EUR 114 million for the six-month period ended June 30, 2017, and a favorable foreign exchange rates effect, generating a foreign exchange gain of EUR 7 million on the six-month period ended June 30, 2018, compared to a EUR 3 million loss for the six-month period ended June 30, 2017.
Tax
The effective tax rate was 23% for the six-month period ended June 30, 2018, and 26% for the six-month period ended June 30, 2017. The corresponding income tax expense decreased from EUR 361 million for the six-month period ended June 30, 2017 to EUR 318 million for the six-month period ended June 30, 2018.
Share of profit/ (losses) of associates
The share of associates was a EUR 36 million profit for the six-month period ended June 30, 2018, compared to EUR 34 million profit for the six-month period ended June 30, 2017.
Discontinued activities
The net effect of discontinued activities totaled EUR 35 million loss for the six-month period ended June 30, 2018, including the net result after tax over six months of Solar activities, compared to a EUR 76 million loss for the six-month period ended June 30, 2017, including the net result after tax of Solar activities and the impairment in valuation of the Solar business.
Non-controlling interests

Schneider Electric – Half year financial report as at June 30, 2018 27
Minority interests in net income for the six-month period ended June 30, 2018 totaled EUR 43 million, compared to EUR 27 million for the six-month period ended June 30, 2017. This represents the share in net income attributable, in large part, to the minority interests of certain Chinese companies.
Profit for the period (to owners of the parent)
Profit for the period attributable to the equity holders of our parent company amounted to EUR 1,020 million for the six-month period ended June 30, 2018, compared to EUR 958 million profit for the six-month period ended June 30, 2017.
Earnings per share
Earnings per share amounted to EUR 1.83 per share for the six-month period ended June 30, 2018 and EUR 1.72 per share for the six-month period ended June 30, 2017.

Schneider Electric – Half year financial report as at June 30, 2018 28
Comments to the consolidated Cash-flow
The following table sets forth our cash-flow statement for the six-month period ended June 30, 2018 and 2017:
(in millions of euros) Note First half 2018
First half 2017
Profit for period 1,063 985
Loss/(gain) from discontinued operations 35 76
Share of (profit)/losses of associates, net of dividends received (36) (34)
Adjustments with no impact on cash-flow :
Depreciation of property, plant and equipment 182 199
Amortization of intangible assets other than goodwill 210 209
Impairment losses on non-current assets 46 3
Increase/(decrease) in provisions (38) -
Losses/(gains) on disposals of fixed assets 4 (114)
Difference between tax paid and tax expense (4) (11)
Other non-cash adjustments 53 54
Net cash provided by operating activities before changes
in operating assets and liabilities
1,515 1,367
Decrease/(increase) in accounts receivable (82) 63
Decrease/(increase) in inventories and work in progress (552) (343)
(Decrease)/increase in accounts payable 72 42
Change in other current assets and liabilities (295) (277)
Change in working capital requirement (857) (515)
Total I - Cash flows from operating activities 658 852
Purchases of property, plant and equipment (210) (204)
Proceeds from disposals of property, plant and equipment 31 21
Purchases of intangible assets (129) (171)
Proceeds from disposals of intangible assets - 3
Net cash used by investment in operating assets (308) (351)
Net financial investments (713) (189)
Proceeds from sale of financial assets 15 747
Other long-term investments 35 (19)
Increase in long-term pension assets (139) (135)
Sub-total (802) 404
Total II - Cash flows from/(used in) investing activities (1,110) 53
Issuance of bonds 740 -
Repayment of bonds - (97)
Increase/(reduction) in other financial debt 1,309 537
Proceeds from issuance of shares 4 10
Sale/(purchase) of own shares (164) -
Dividends paid by Schneider Electric SE (1,223) (1,133)
Dividends paid to non-controlling interests (21) (24)
Total III - Cash flows from/(used in) financing activities 645 (707)
IV - Net foreign exchange difference: 62 (31)
V - Effect of discontinued operations (23) 78
Increase/(decrease) in cash and cash equivalents: I + II
+ III + IV + V
232 245
Cash and cash equivalents at January 1st 2,767 2,530
Increase/(decrease) in cash and cash equivalents 232 245
CASH AND CASH EQUIVALENTS AT JUNE 30 2,999 2,775 The accompanying notes are an integral part of the consolidated financial statements.

Schneider Electric – Half year financial report as at June 30, 2018 29
Operating Activities
Net cash provided by operating activities before changes in operating assets and liabilities reached EUR 1,515 million for the six-month period ended June 30, 2018, increasing compared to EUR 1,367 million for the six-month period ended June 30, 2017. It represents 12.3% of revenues for first half 2018 (11.2% of revenues from first half 2017). Change in working capital requirement consumed EUR 857 million in cash in the six-month period ended June 30, 2018, compared to EUR 515 million in consumption in the six-month period ended June 30, 2017, reflecting normal cash-flow seasonality. In all, net cash provided by operating activities decreased from EUR 852 million in the six-month period ended June 30, 2017 to EUR 658 million in the six-month period ended June 30, 2018.
Investing Activities
Net capital expenditure, which included capitalized development projects, decreased, at EUR 308 million for the six-month period ended June 30, 2018, compared to EUR 351 million for the six-month period ended June 30, 2017, and representing 2.5% of sales on first half 2018 compared to 2.9% of sales on first half 2017. The net acquisitions represented a cash out of EUR 713 million (net of acquired cash) for the six-month period ended June 30, 2018, compared with EUR 189 million for the six-month period ended June 30, 2017.
Financing Activities
The net increase of financial debts amounted to EUR 1,303 million during the six-month period ended June 30, 2018, compared to a net increase of financial debts of EUR 440 million during the six-month period ended June 30, 2017. The dividend paid by Schneider Electric was EUR 1,223 million the six-month period ended June 30, 2018, compared with EUR 1,133 million the six-month period ended June 30, 2017.
2018 Targets
Following a very good H1, the Group revises its 2018 growth target upward and is now aiming at an organic growth of the adj. EBITA between +7% and +9% (vs. around +7% initially). This strong performance would be generated by a combination of dynamic top line growth and margin expansion. The Group expects: • Organic sales growth for 2018 to reach +5% to +6% (vs +3% to +5% initially) reflecting the success of the Group’s strategy • +30 to +50 bps organic improvement of the adj. EBITA margin, taking into account investments needed to drive top line growth as well as some increase in costs such as currently anticipated tariff impacts

Schneider Electric – Half year financial report as at June 30, 2018 30
Significant events of the period
In addition to the events described above, there were no major events.
Main risks and areas of uncertainty for the second half of 2018 The main risks and areas of uncertainty for the second half of the year are the same as those outlined in Chapter 1, paragraph 7 (Risk Factors) of the 2017 Registration Document filed with AMF on March 16, 2018.
Claims, litigations and other risks (update to the Registration Document – page 43) No significant event occurred since Registration Document date.
Transactions with related parties These transactions are described in Note 19 to the interim consolidated financial statements.

Schneider Electric – Half year financial report as at June 30, 2018 31
Attestation I hereby declare that, to the best of my knowledge, the half-year financial statements as at June 30, 2018 have been prepared in accordance with applicable accounting standards, that they present fairly, in all material respects, the assets, financial position and results of the company and the consolidated group. To the best of my knowledge, the Management Report presents fairly the information mentioned in Article 222-6 of AMF’s general regulations. Rueil-Malmaison, July 25, 2018 On behalf of the Board of Directors, Jean-Pascal TRICOIRE Chairman of the Board of Directors and CEO
Schneider Electric – Half year financial report as at June 30, 2018 32
Statutory Auditors' Review Report on the first half-yearly information
This is a free translation into English of the statutory auditors’ review report on the condensed half-yearly consolidated
financial statements issued in French and it is provided solely for the convenience of English-speaking users. This
report also includes information relating to the specific verification of information given in the Group’s half-year
management report. This report should be read in conjunction with and construed in accordance with French law and
professional standards applicable in France.
To the Shareholders,
In compliance with the assignment entrusted to us by your Annual General Meeting and in accordance with
the requirements of article L. 451-1-2 III of the French Monetary and Financial Code (“Code monétaire et
financier”), we hereby report to you on:
• the review of the accompanying condensed half-yearly consolidated financial statements of Schneider
Electric S.E., for the period from January 1 to June 30, 2018,
• the verification of the information presented in the half-yearly management report.
These condensed half-yearly consolidated financial statements are your Board of Directors’ responsibility.
Our role is to express a conclusion on these financial statements based on our review.
1. Conclusion on the financial statements
We conducted our review in accordance with professional standards applicable in France. A review of
interim financial information consists of making inquiries, primarily of persons responsible for financial and
accounting matters, and applying analytical and other review procedures. A review is substantially less in
scope than an audit conducted in accordance with professional standards applicable in France and
consequently does not enable us to obtain assurance that we would become aware of all significant
matters that might be identified in an audit. Accordingly, we do not express an audit opinion.
Based on our review, nothing has come to our attention that causes us to believe that the accompanying
condensed half-yearly consolidated financial statements are not prepared, in all material respects, in
accordance with IAS 34 – standard of the IFRSs as adopted by the European Union applicable to interim
financial information.
Without qualifying our conclusion, we draw your attention to the matter set out in Paragraph “First
application of IFRS 15 – Revenue from Contracts with Customers” of note 1 “Summary of significant
accounting policies” to the condensed half-yearly consolidated financial statements.

Schneider Electric – Half year financial report as at June 30, 2018 33
2. Specific verification
We have also verified the information presented in the half-yearly management report on the condensed
half-yearly consolidated financial statements subject to our review.
We have no matters to report as to its fair presentation and its consistency with the condensed half-yearly
consolidated financial statements.
Courbevoie and Paris-La Défense, July 25, 2018
The statutory auditors
French original signed by
MAZARS ERNST & YOUNG et Autres
Loïc Wallaert Jean-Yves Jégourel
Alexandre Resten