Embed Size (px)
Citation preview

HALF-YEAR 2021 REPORT

02 Holcim Half-Year Report 2021

Contents In this report Page
Shareholders’ letter and management discussion & analysis
Shareholders’ letter 4Management discussion & analysis 5
04 — 10
Financial information
Condensed consolidated financial statements 11Notes to the condensed consolidated financial statements 19Reconciliation of non-GAAP measures 34Responsibility statement 36
11 — 37
HALF-YEAR 2021
CHF 12,556m +16.6%¹
Net salesH1 2020: CHF 10,693m
CHF 814m +8.6%Free Cash Flow after leasesH1 2020: CHF 749m
KEY FIGURES
CHF 1.43 +77.8%Earnings per share²H1 2020: CHF 0.80
CHF 1,983m +72.2 %¹
Recurring EBITH1 2020: CHF 1,194m
¹ Percentage change figures compare 2021 and 2020 on a like-for-like basis. The non-GAAP measures used in this report are defined on page 31.² Before impairment and divestments.
03Holcim Half-Year Report 2021

SHAREHOLDERS’ LETTER
DEAR SHAREHOLDERS,
As we close the first half of 2021 under our new Group identity, we sincerely thank all members of the Holcim family for the teamwork and resilience they continue to demonstrate to navigate the challenges of the pandemic. We are proud of how our 70,000 colleagues around the world are protecting our people and communities, with health and safety top of mind, while supporting our customers.
In the first half of 2021 we set new records in Recurring EBIT, Free Cash Flow¹ and Earnings per share². We congratulate our teams for this remarkable achievement and for giving us the confidence to revise our 2021 guidance for Recurring EBIT growth to at least 18 percent on a like-for-like basis.
Net sales of CHF 12,556 million for the first half of 2021 were up by 16.6 percent on a like-for-like basis compared to the prior year. The record increase was driven by volume growth in all regions and segments. Net sales growth was further supported by 5.2 percent of positive scope impact, mostly driven by the acquisition of Firestone Building Products.
The appreciation of the Swiss franc against several currencies negatively impacted Net sales by 4.4 percent.
Recurring EBIT reached a record CHF 1,983 million for the first half of 2021, up by 72.2 percent compared to the prior year period. This record result was driven by significant margin improvement in all business segments.Recurring EBIT growth was further supported by 5.1 percent of positive scope impact, mostly driven by the acquisition of Firestone Building Products.
¹after leases²before impairment and divestments
The appreciation of the Swiss franc against several currencies negatively impacted Recurring EBIT by 11.2 percent.
Earnings per share² increased by 77.8 percent to reach CHF 1.43 for the first half of 2021 versus CHF 0.80 for the first half of 2020.
Free cash flow after leases was at CHF 814 million in the first half of 2021 versus CHF 749 million in the first half of 2020, up by 8.6 percent, as the measures taken to protect the business during the global pandemic continued to deliver efficiencies.
With the acquisition of Firestone Building Products officially closed as of 31 March 2021, the company experienced strong demand in all product lines and regions with volumes up by 21 percent in the second quarter of 2021. Firestone Building Products has already begun to leverage the Holcim global procurement and sales network, notably in Latin America, where Holcim Mexico introduced GacoFlex TechoProtec. Holcim also continued to develop its portfolio through seven bolt-on acquisitions signed in the first half of 2021, building capacity in mature European and North American markets, primarily in aggregates and ready-mix concrete.
Pursuing its ongoing portfolio optimization, in the first half of 2021 Holcim entered agreements to divest operations in Zambia, Malawi and the Indian Ocean. Closing of all transactions is planned by year-end, subject to receipt of regulatory approvals.
Holcim continued to progress in its sustainability ambitions by introducing ECOPlanet, an innovative range of green cement that delivers at least 30 percent lower carbon footprint with equal to superior performance. ECOPlanet will be distributed across 15 markets in 2021. This builds on the success of ECOPact, the world’s broadest range of green concrete, which is now available in 24 markets across all regions.
2021 OUTLOOK
Holcim expects the growth momentum to continue in all regions, supported as of the second half of 2021 from various stimulus programs. The company expects to continue the growth of Firestone Building Products, while pursuing further bolt-on acquisitions and to accelerate progress towards its 2030 sustainability targets.
For 2021, the Group will deliver the following, with upgraded guidance on Recurring EBIT growth:
• Over-proportional growth in Recurring EBIT of at least 18 percent on a like-for-like basis (up from 10 percent).
• Capex less than CHF 1.4 billion.• Return on Invested Capital above 8
percent.
Moreover, Holcim expects to achieve all Strategy 2022 targets one year in advance.
Beat HessChairman
Jan JenischChief Executive Officer
29 July 2021
04 Holcim Half-Year Report 2021

Q1 20 Q2 20 Q3 20 Q4 20 Q1 21 Q1 20 Q2 20 Q3 20 Q4 20 Q1 21
% like-for-like
-17%
-3% -3%
+7%+1%
+26%
Q2 21 Q2 21
-26%
-3%
+10%
+131%
+14%
+56%
NET SALES
RECURRING EBIT
H1 2021 Unaudited
H1 2020 Unaudited ±%
±% like-for-like
Sales of cement million t 99.0 87.2 +13.5% +13.2%Sales of aggregates million t 123.0 113.8 +8.1% +6.2%Sales of ready-mix concrete million m 3 22.1 19.2 +15.6% +13.9%Net sales million CHF 12,556 10,693 +17.4% +16.6%Recurring Operating costs million CHF (9,834) (8,717) +12.8% +10.7%Recurring EBITDA after leases million CHF 2,928 2,152 +36.1% +40.2%Recurring EBIT million CHF 1,983 1,194 +66.1% +72.2%Recurring EBIT margin % 15.8 11.2Operating profit (EBIT) million CHF 1,794 1,005 +78.6%Net income Group share million CHF 839 347 +142.1%Net income before impairment and divestments Group share million CHF 881 501 +76.0%Earnings per share before impairment and divestments CHF 1.43 0.80 +77.8%Cash flow from operating activities million CHF 1,457 1,330 +9.5%Capex million CHF 468 412 +13.5%Free Cash Flow after leases million CHF 814 749 +8.6%Net financial debt million CHF 12,438 10,652 +16.8%
MANAGEMENT DISCUSSION & ANALYSIS 2021
PROFITABLE GROWTH CONTINUES, RECORD RESULTS
• After an excellent first quarter, the second quarter financial metrics have been very strong again, with high double digit organic growth in both Net Sales and Recurring EBIT.
• Recurring EBIT recorded an over-proportional growth of 72.2% like-for-like, when compared to the first half of 2020, demonstrating our ability to implement operational efficiencies and to mitigate the increases in energy prices which have been witnessed this year.
05Holcim Half-Year Report 2021

FIRESTONE BUILDING PRODUCTSA SUCCESSFUL START AS OF APRIL 1ST, 2021
Strong market DEMANDGrowth in all product lines and all regionsVolumes up 21%in Q2
Expansion in
LATAMHolcim GacoFlex TechoProteclaunched in Mexico
Industry leader in
INNOVATIONEnvironmental and energy efficient solutions
New FullForce highly reflective, self-adhering membrane Thammasat University Rooftop Farm, ThailandAsia’s largest rooftop farm with UltraPly TPO covering 20’000 m2
green roof
GacoFlex “TechoProtec” liquid applied waterproofing and roofing solutions for residential and commercial applications
FIRESTONE BUILDING PRODUCTS A SUCCESSFUL START
The transaction to buy Firestone Building Products successfully closed on 31 March 2021. The acquisition represents a milestone in the transformation of Holcim to become the global leader in innovative and sustainable building solutions.
With the acquisition of Firestone Building Products, the company experienced strong demand in all product lines and regions with volumes up by 21 percent in the second quarter of 2021.
Firestone Building Products has already begun to leverage the Holcim global procurement and sales network, notably in Latin America, where Holcim Mexico introduced GacoFlex TechoProtec.
Holcim has a strong balance sheet and a strong liquidity position. As at the end of the semester, the company had secured liquidity of more than CHF 8 billion in cash and unused committed credit lines.
Firestone Building Products is the market leader in commercial roofing and building envelope solutions in the United States with net sales above USD 1.8 billion in 2020, 15 manufacturing facilities, 1,800 distribution points and three R&D laboratories. It will remain headquartered in Nashville, Tennessee.
These strengths were confirmed on 19 March 2021 when S&P revised the outlook from BBB/ stable to BBB/ positive and when Moody's reaffirmed its rating of Baa2/ stable on 12 April 2021.
The company also executed successful refinancing during the first half of the year by issuing bonds in the total amount of CHF 2.1 billion (for more information see note 16).
LIQUIDITY
06 Holcim Half-Year Report 2021

HEALTH & SAFETY
In 2021, Holcim's focus is on critical risk management, worker engagement and continuous improvement. The Group has made strong progress with new training, systems and tools going live across our operations.
Vigeo Eiris (V.E), part of Moody’s ESG Solutions, recently published its Sustainability rating for Holcim. The company obtained an A1+ Sustainability Rating. This leading Sustainability Rating ranks Holcim among the top 2% of companies in V.E’s global ESG assessment universe and first in the European building materials sector.
This view was further endorsed with Holcim's net zero pledge recognized as the 2021 edie Sustainability Leaders Awards "Net Zero Carbon Strategy of the Year". The edie Sustainability Leaders Awards recognizes excellence across the spectrum of green business and represents the UK’s largest and most prestigious sustainability awards initiative.
Holcim has expanded its engagement on sustainability, joining the MIT Climate and Sustainability Consortium as a founding member. Holcim has furthermore joined the “Oxford Initiative on Rethinking Performance” (ORP) by the Oxford Saïd Business School, strengthening the company’s distinguished academic network. The company has additionally joined the World Ocean Council for sustainable
ocean stewardship to scale up action for sustainable marine ecosystems, building on Holcim's long standing commitment in this area.
Expanding its role as the leader in innovative and sustainable building solutions, 17 Holcim green building solutions have been endorsed by the “Solar Impulse Efficient Solution” label, recognizing world-leading technologies that protect the environment in a profitable way. The labelled Holcim solutions include ECOPact green concrete, (now available in 24 countries), which enables carbon-neutral building; bio-active reef concrete that restores marine ecosystems and 3D printing technologies to accelerate affordable and efficient housing and infrastructure, such as a 3D printed school in Malawi and the Striatus bridge, recently inaugurated in Venice.
Holcim continued to progress in its sustainability ambitions by introducing ECOPlanet, an innovative range of green cement that delivers at least 30% lower carbon footprint with equal to superior performance.
SUSTAINABILITY
Holcim is broadening its collaboration with other leading players, exploring together with Schlumberger New Energy, the development of Carbon Capture and Storage (CCS) solutions. Holcim currently has over 20 carbon capture projects in Europe and North America. Examples of advanced pilots include Westkuste 100 in Germany, CO2MENT in Canada and the USA and Carbon2Product in Austria.
A memorandum of understanding has also been signed with GE Renewable Energy to develop circular economy solutions to utilize materials from decommissioned wind turbines.
In the first half of 2021, Holcim deployed its industry-leading Transport Analytics Center (TAC) globally to optimize its logistics for enhanced efficiency, safety and sustainability. TAC is currently active across 50 markets worldwide, covering 1.4 billion km each year. This state-of-the-art digital platform contributes to the company’s net zero journey by reducing its Scope 3 emissions, in line with its industry-first target.
At the end of June 2021, the Group's Lost Time Injury Frequency Rate (LTIFR) remained at “best in class” levels - 0.41, compared to 0.40 in the first half of the year 2020; it represents a decrease of 60% since Ambition “0” was launched.
Regrettably, we had 2 employee and 1 contractor fatalities in the first half of the year 2021. Eradicating fatalities in the Group's operations remain a top priority in the Group's journey towards Ambition “0”.
07Holcim Half-Year Report 2021

MANAGEMENT DISCUSSION & ANALYSIS 2021 CONTINUED
ASIA PACIFIC
Asia Pacific has enjoyed a solid performance for the first half of 2021, albeit that India experienced a relatively soft market in the second quarter impacted by the latest wave of COVID-19, but with much more activity than in the same quarter of 2020. A good performance was seen in Australia which has started to benefit from stimulus programs.
In Cement, the region achieved robust growth coupled with healthy pricing, with volumes sold of 35.8 million tons in the first half of 2021, 28.0 percent above the prior year on a like-for-like basis. India drove the growth and volumes in the Philippines and Bangladesh also expanded.
Aggregates sales volumes increased with very strong growth in China. The Ready-mix concrete segment also achieved volume growth, but at a lower rate than the other segments due to ongoing COVID-19 restrictions in urban areas of India.
Net sales to external customers increased by 25.9 percent on a like-for-like basis. Following the fast execution of cost reduction initiatives last year and in the first half of 2021, the region continued with strict cost management discipline, enabling Recurring EBIT to grow by 65.8 percent on a like-for-like basis.
The contribution from the share of net income from joint ventures recognized in Recurring EBIT amounted to CHF 167 million compared to CHF 160 million in the comparative period.
LATIN AMERICA
The Latin America region continued the strong performance seen in the second half of 2020, with all countries delivering double digit sales growth in the first half of 2021 compared with the same period of 2020. Mexico delivered a very strong performance with iconic infrastructure projects boosting growth. The Brazilian market has revived and saw growth in volumes and prices, confirming the turnaround. Argentina performed strongly and Ecuador still had some effects of COVID-19 but witnessed strong growth compared with 2020.
Cement volumes sold in the first half of 2021 stood at 13.3 million tons, increasing 28.3 percent on a like-for-like basis. New cement capacity was added with the completion of a grinding station in Merida, Mexico and a new line in Cordoba, Argentina.
Aggregates volumes sold increased by 33.8 percent compared to the first half of the prior year on a like-for-like basis, mainly due to new operations in Mexico and Colombia. Disensa continued its expansion adding 474 new stores across the region.
Net sales to external customers increased by 48.8 percent on a like-for-like basis benefiting from the strong growth in volumes and the continuous attention paid to pricing. Recurring EBIT increased by 78.7 percent on a like-for-like basis, with the growth in net sales and a strong focus on keeping costs under control, which led to a strong increase in Recurring EBIT margin.
Following the acquisition of Firestone Building Products at the end of the first quarter, the expansion of roofing systems into Latin America has started with the first range of products launched in Mexico in the second quarter.
H1 2021
Sales of cement million t 35.8 Sales of aggregates million t 16.9 Sales of ready-mix concrete million m 3 3.9 Net sales to external customers million CHF 2,998 Like-for-like growth % +25.9%Recurring EBIT million CHF 713 Like-for-like growth % +65.8%
H1 2021
Sales of cement million t 13.3 Sales of aggregates million t 2.9 Sales of ready-mix concrete million m 3 2.3 Net sales to external customers million CHF 1,269 Like-for-like growth % +48.8%Recurring EBIT million CHF 425 Like-for-like growth % +78.7%
08 Holcim Half-Year Report 2021

EUROPE MIDDLE EAST AFRICA
After a first quarter which was slightly behind 2020 in terms of volumes due to the poor weather, the second quarter showed a clear acceleration in demand. In particular, there was a strong pick-up in demand in Western Europe which has more than compensated for the slow first quarter. Growth in Cement volumes continued to be good in Eastern European markets.
Cement volumes sold in the first half of 2021 reached 22.2 million tons, or a 6.2 percent increase on a like-for-like basis compared to 2020. France, Italy, Spain and the United Kingdom were the main contributors, reflecting the fact that these countries suffered some of the more severe lockdowns in 2020.
Aggregates volumes sold in the first half of 2021 stood at 56.1 million tons, up 8.6 percent on a like-for-like basis. Ready-mix concrete volumes sold were 9.9 million cubic meters, an increase of 17.9 percent on a like-for-like basis. In both segments, France and the United Kingdom led the growth.
Net sales to external customers grew by 14.2 percent on a like-for-like basis, driven by the volumes growth and also supported by good pricing. This led to a Recurring EBIT expansion of 58.5 percent on a like-for-like basis.
The Middle East Africa region has gained momentum as the year has progressed. Notably, Nigeria and Iraq led the growth in the region whilst South Africa has seen a positive turnaround in its results thanks to the actions implemented by management. Egypt and Algeria see strong competitive domestic environments and were able to achieve growth in volumes thanks to exports. East Africa saw recovery in the first half of 2021 with Kenya, in particular, benefitting from infrastructure spending.
Cement volumes sold reached 17.8 million tons, or 11.7 percent higher on a like-for-like basis compared to the first half of the prior year. The region has seen growing demand in most countries, and has benefited from growth in exports.
Additionally, volumes in the aggregates and ready-mix concrete business segments grew by 43.3 percent and 8.0 percent, respectively, on a like-for-like basis and compared to the first half of 2020.
In the first half of 2021, net sales to external customers increased by 15.1 percent on a like-for-like basis, driven by a combination of higher volumes and favourable pricing. Consequently, Recurring EBIT increased by 76.7 percent on a like-for-like basis. The region as a whole has reported an increase in Recurring EBIT margin of 4.8 percentage points.
H1 2021
Sales of cement million t 22.2 Sales of aggregates million t 56.1 Sales of ready-mix concrete million m 3 9.9 Net sales to external customers million CHF 3,886 Like-for-like growth % +14.2%Recurring EBIT million CHF 469 Like-for-like growth % +58.5%
H1 2021
Sales of cement million t 17.8 Sales of aggregates million t 2.0 Sales of ready-mix concrete million m 3 1.4 Net sales to external customers million CHF 1,162 Like-for-like growth % +15.1%Recurring EBIT million CHF 198 Like-for-like growth % +76.7%
09Holcim Half-Year Report 2021

NORTH AMERICA
North America has delivered good performance due to price discipline, continued operational improvements and a strong performance in the Canadian markets, overcoming unusually extreme weather in the early part of the year.
Cement volumes sold were 9.1 million tons, or a 2.3 percent increase on a like-for-like basis versus the first half of 2020, with Canada performing particularly well.
Aggregates volumes sold were 45.2 million tons, reflecting a like-for-like decrease of 0.9 percent, but with robust performance in Eastern Canada. Ready-mix concrete volumes sold were 4.7 million cubic meters, reflecting a like-for-like increase of 3.0 percent, also with a strong result from Eastern Canada.
Net sales to external customers grew by 1.4 percent on a like-for-like basis over the first half of the prior year. Recurring EBIT improved by 31.7 percent on a like-for-like basis, as a result of strong operational performance and ongoing cost reduction initiatives.
Firestone Building Products joined the Group effective from 31 March 2021 and saw a strong second quarter with volume growth of 21 percent under its new ownership.
H1 2021
Sales of cement million t 9.1 Sales of aggregates million t 45.2 Sales of ready-mix concrete million m 3 4.7 Net sales to external customers million CHF 2,984 Like-for-like growth % +1.4%Recurring EBIT million CHF 380 Like-for-like growth % +31.7%
10 Holcim Half-Year Report 2021

FINANCIAL INFORMATION
Condensed Consolidated Statement of Income 12
Condensed Consolidated Statement of Comprehensive Income 13
Condensed Consolidated Statement of Financial Position 14
Condensed Consolidated Statement of Changes in Equity 16
Condensed Consolidated Statement of Cash Flows 17
Principal exchange rates 18
Notes to the interim condensed consolidated financial statements 19
Independent auditor’s report on the review of interim condensed consolidated financial statements 30
11Holcim Half-Year Report 2021

CONDENSED CONSOLIDATED STATEMENT OF INCOME OF HOLCIM
Million CHF Notes
H1 2021 Unaudited
H1 2020 Unaudited
Net sales 12,556 10,693 Production cost of goods sold (7,248) (6,610)Gross profit 5,308 4,083 Distribution and selling expenses (2,975) (2,666)Administration expenses (745) (588)Share of profit of joint ventures 207 176 Operating profit 1,794 1,005 Profit on disposals and other non-operating income 6 20 9 Loss on disposals and other non-operating expenses 7 (63) (52)Share of (loss) / profit of associates (19) 4 Financial income 8 40 62 Financial expenses 9 (312) (378)Net income before taxes 1,460 650 Income taxes 10 (389) (203)Net income 1,072 447
Net income attributable to:Shareholders of Holcim Ltd 839 347 Non-controlling interest 233 100
Earnings per share in CHFEarnings per share 11 1.36 0.55Fully diluted earnings per share 11 1.35 0.55
12 Holcim Half-Year Report 2021
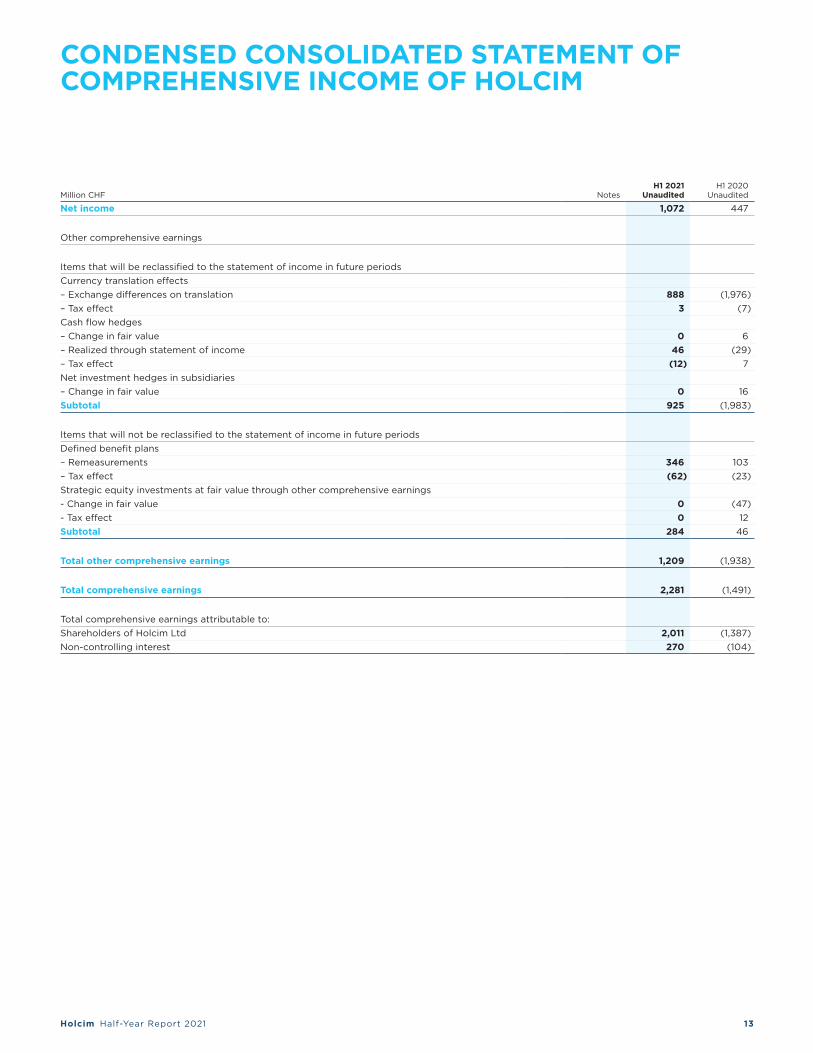
CONDENSED CONSOLIDATED STATEMENT OF COMPREHENSIVE INCOME OF HOLCIM
Million CHF NotesH1 2021
UnauditedH1 2020
Unaudited
Net income 1,072 447
Other comprehensive earnings
Items that will be reclassified to the statement of income in future periodsCurrency translation effects– Exchange differences on translation 888 (1,976)– Tax effect 3 (7)Cash flow hedges– Change in fair value 0 6 – Realized through statement of income 46 (29)– Tax effect (12) 7 Net investment hedges in subsidiaries– Change in fair value 0 16 Subtotal 925 (1,983)
Items that will not be reclassified to the statement of income in future periodsDefined benefit plans– Remeasurements 346 103 – Tax effect (62) (23)Strategic equity investments at fair value through other comprehensive earnings- Change in fair value 0 (47)- Tax effect 0 12 Subtotal 284 46
Total other comprehensive earnings 1,209 (1,938)
Total comprehensive earnings 2,281 (1,491)
Total comprehensive earnings attributable to:Shareholders of Holcim Ltd 2,011 (1,387)Non-controlling interest 270 (104)
13Holcim Half-Year Report 2021

CONDENSED CONSOLIDATED STATEMENT OF FINANCIAL POSITION OF HOLCIM
Million CHF Notes30.06.2021 Unaudited
31.12.2020 Audited
30.06.2020 Unaudited
Assets
Cash and cash equivalents 3,465 5,190 3,736 Short-term derivative assets 63 30 14 Current financial receivables 184 247 220 Trade accounts receivable 3,653 2,305 2,946 Inventories 2,509 1,983 2,244 Prepaid expenses and other current assets 1,102 1,017 1,077 Assets classified as held for sale 12 104 114 88 Total current assets 11,079 10,886 10,326 Long-term financial investments and other long-term assets 914 859 934 Investments in associates and joint ventures 3,580 3,473 3,216 Property, plant and equipment 24,849 24,220 25,524 Goodwill 13 14,680 12,413 12,848 Intangible assets 1,532 533 583 Deferred tax assets 766 513 694 Pension assets 482 257 409 Long-term derivative assets 36 70 31 Total non-current assets 46,838 42,338 44,239 Total assets 57,917 53,224 54,565
14 Holcim Half-Year Report 2021

Million CHF Notes30.06.2021 Unaudited
31.12.2020 Audited
30.06.2020 Unaudited
Liabilities and shareholders' equity
Trade accounts payable 3,918 3,351 3,155 Current financial liabilities 2,536 2,064 2,736 Current income tax liabilities 484 473 566 Other current liabilities 2,218 1,967 2,083 Short-term provisions 454 323 354 Total current liabilities 9,610 8,178 8,895 Long-term financial liabilities 13,465 11,710 11,697 Defined benefit obligations 952 1,091 1,492 Long-term income tax liabilities 409 348 354 Deferred tax liabilities 2,127 1,885 2,002 Long-term provisions 1,775 1,389 1,473 Total non-current liabilities 18,728 16,422 17,019 Total liabilities 28,337 24,600 25,913 Share capital 1,232 1,232 1,232 Capital surplus 20,367 21,597 21,596 Treasury shares (238) (197) (185)Reserves 5,473 3,439 3,249 Total equity attributable to shareholders of Holcim Ltd 26,835 26,071 25,892 Non-controlling interest 2,745 2,553 2,760 Total shareholders' equity 29,580 28,625 28,652 Total liabilities and shareholders' equity 57,917 53,224 54,565
15Holcim Half-Year Report 2021

CONDENSED CONSOLIDATED STATEMENT OF CHANGES IN EQUITY OF HOLCIM
Million CHFShare
capitalCapital surplus
Treasury shares
Currency translation
adjustments
Other Re-serves and
Retained earnings
Total equity attributa-
ble to shareholders
of Holcim Ltd
Non-con-trolling interest
Total shareholders'
equity
Equity as at 1 January 2021 1,232 21,597 (197) (17,452) 20,891 26,071 2,553 28,625 Net income 839 839 233 1,072 Other comprehensive earnings 856 317 1,173 37 1,209 Total comprehensive earnings 856 1,156 2,011 270 2,281 Payout (1,222) (1,222) (91) (1,313)Subordinated fixed rate resettable notes (12) (12) (12)Assets and liabilities revaluation including hyperinflation 31 31 5 36 Change in treasury shares (41) 4 (36) (36)Share-based remuneration (8) (8) (8)Capital repaid to non-controlling interest (1) (1)Capital paid-in by non-controlling interests 2 2 Acquisition of participation in Group companies 5 5 Change in participation in existing Group companies (2) 2 Equity as at 30 June 2021 (Unaudited) 1,232 20,367 (238) (16,598) 22,071 26,835 2,745 29,580
Equity as at 1 January 2020 1,232 22,811 (121) (14,527) 19,172 28,566 2,933 31,499 Net income 347 347 100 447 Other comprehensive earnings (1,765) 32 (1,733) (205) (1,938)Total comprehensive earnings (1,765) 379 (1,387) (104) (1,491)Payout (1,224) (1,224) (55) (1,279)Subordinated fixed rate resettable notes (11) (11) (11)Assets and liabilities revaluation including hyperinflation 6 6 (14) (8)Change in treasury shares (64) (4) (68) (68)Share-based remuneration 10 10 10 Acquisition of participation in Group companies 1 1 1 Change in participation in existing Group companies (1) (1) 1 Equity as at 30 June 2020 (Unaudited) 1,232 21,596 (185) (16,292) 19,541 25,892 2,760 28,652
16 Holcim Half-Year Report 2021

CONDENSED CONSOLIDATED STATEMENT OF CASH FLOWS OF HOLCIM
Million CHF NotesH1 2021
UnauditedH1 2020
Unaudited
Net income 1,072 447 Income taxes 389 203 Loss on disposals and other non-operating items, net 43 37 Share of profit of associates and joint ventures, net (187) (180)Financial expenses, net 8,9 272 316 Depreciation, amortization and impairment of operating assets 1,135 1,292 Employee benefits and other operating items (13) (7)Change in inventories (242) 133 Change in trade accounts receivables (925) (165)Change in trade accounts payables 293 (311)Change in other receivables and liabilities (6) 29 Cash generated from operations 1,830 1,795 Dividends received 156 38 Interest received 45 54 Interest paid (244) (304)Income taxes paid (328) (254)Cash flow from operating activities (A) 1,457 1,330
Purchase of property, plant and equipment (519) (442)Disposal of property, plant and equipment 51 30 Acquisition of participation in Group companies (3,220) (41)Disposal of participation in Group companies 32 (21)
Purchase of financial assets, intangible and other assets (59) (68)Disposal of financial assets, intangible and other assets 54 57 Cash flow from investing activities (B) (3,660) (486)
Payout on ordinary shares 11 (1,222) (1,224)Dividends paid to non-controlling interest (80) (52)Capital paid from (repaid to) non-controlling interest 1 (3)Movements of treasury shares (67) (79)Coupon paid on subordinated fixed rate resettable notes (7) (6)Net movement in current financial liabilities 633 378 Proceeds from long-term financial liabilities 16 2,121 799 Repayment of long-term financial liabilities 16 (931) (683)Repayment of long-term lease liabilities (176) (169)Increase in participation in existing Group companies (2) (2)Cash flow from financing activities (C) 272 (1,042)
Decrease in cash and cash equivalents (A + B + C) (1,931) (198)
Cash and cash equivalents as at the beginning of the period (net) 5,101 4,014 Decrease in cash and cash equivalents (1,931) (198)Currency translation effects 209 (215)Cash and cash equivalents as at the end of the period (net)1 3,380 3,601
1 Cash and cash equivalents at the end of the period include bank overdrafts of CHF 85 million (2020: CHF 133 million) disclosed in current financial liabilities.
17Holcim Half-Year Report 2021

PRINCIPAL EXCHANGE RATES
The following table summarizes the principal exchange rates that have been used for translation purposes.
Statement of income Average exchange rates
in CHF
Statement of financial position Closing exchange rates
in CHFH1 2021 H1 2020 30.06.2021 31.12.2020 30.06.2020
Unaudited Unaudited Unaudited Audited Unaudited
1 Argentine Peso ARS 0.01 0.01 0.01 0.01 0.011 Australian Dollar AUD 0.70 0.64 0.69 0.68 0.651 Brazilian Real BRL 0.17 0.20 0.19 0.17 0.181 Canadian Dollar CAD 0.73 0.71 0.74 0.69 0.701 Chinese Renminbi CNY 0.14 0.14 0.14 0.13 0.13100 Algerian Dinar DZD 0.68 0.78 0.68 0.67 0.731 Egyptian Pound EGP 0.06 0.06 0.06 0.06 0.061 Euro EUR 1.09 1.06 1.10 1.08 1.071 British Pound GBP 1.26 1.22 1.27 1.20 1.17100 Indian Rupee INR 1.24 1.30 1.24 1.21 1.26100 Mexican Peso MXN 4.50 4.51 4.65 4.43 4.12100 Nigerian Naira NGN 0.18 0.26 0.17 0.19 0.25100 Philippine Peso PHP 1.88 1.91 1.89 1.83 1.911 US Dollar USD 0.91 0.97 0.92 0.88 0.95
18 Holcim Half-Year Report 2021

NOTES TO THE INTERIM CONDENSED CONSOLIDATED FINANCIAL STATEMENTSAS USED HEREIN, THE TERMS “HOLCIM” OR THE “GROUP” REFER TO HOLCIM LTD TOGETHER WITH THE COMPANIES INCLUDED IN THE SCOPE OF CONSOLIDATION.
1. ACCOUNTING POLICIES
1.1 Basis of preparationThe unaudited interim condensed consolidated financial statements of Holcim Ltd, hereafter “interim financial statements”, are prepared in accordance with IAS 34 Interim Financial Reporting. The accounting policies used in the preparation and presentation of the interim financial statements are consistent with those used in the consolidated financial statements for the year ended 31 December 2020 (hereafter “annual financial statements”) except for the amended standards adopted during the period (see details below).
The interim financial statements should be read in conjunction with the annual financial statements as they provide an update of previously reported information.
At the Annual General Meeting of the Group on 4 May 2021, the General Assembly decided to change the name of LafargeHolcim Ltd to Holcim Ltd.
Due to rounding, numbers presented throughout this report may not add up precisely to the totals provided. All ratios and variances are calculated using the underlying amounts rather than the presented rounded amounts.
The preparation of interim financial statements requires management to make estimates and assumptions that affect the reported amounts of revenues, expenses, assets, liabilities and disclosure of contingent liabilities at the date of the interim financial statements. If in the future, such estimates and assumptions, which are based on management’s best judgment at the date of the interim financial statements, deviate from the actual circumstances, the original estimates and assumptions will be modified as appropriate during the period in which the circumstances change.
The segment information corresponds to the information required by IAS 34 Interim Financial Reporting.
1.2 Adoption of amended standardsIn 2021, Holcim adopted the following amended standards relevant to the Group:
Amendments to IFRS 9, IAS 39, IFRS 7, IFRS 4 and IFRS 16
Interest Rate Benchmark Reform (Phase 2)
Amendments to IFRS 9, IAS 39, IFRS 7, IFRS 4 and IFRS 16 - Interest Rate Benchmark Reform (Phase 2)As detailed in the 2020 Integrated Annual Report (note 1.2), the adoption of the amendments to IFRS 9, IAS 39, IFRS 7, IFRS 4 and IFRS 16 – Interest Rate Benchmark Reform (Phase 2) have not materially impacted the financial statements and Holcim will monitor closely any changes in the future.
2. SEASONALITY
Demand for cement, aggregates, ready-mix concrete and other construction materials and services is seasonal because climatic conditions affect the level of activity in the construction sector.
Holcim usually experiences a reduction in sales during the first and fourth quarters reflecting the effect of the winter season in its principal markets in Europe and North America and tends to see an increase in sales in the second and third quarters reflecting the effect of the summer season. This effect can be particularly pronounced in harsh winters.
19Holcim Half-Year Report 2021

NOTES TO THE CONDENSED CONSOLIDATED FINANCIAL STATEMENTS CONTINUED
3. CHANGES IN THE SCOPE OF CONSOLIDATION
3.1 Acquisition of Firestone Building ProductsIn January 2021, Holcim signed an agreement to acquire Firestone Building Products, a leader in commercial roofing and building envelope solutions based in the United States.
The business combination was accounted for as of 31 March 2021, being the effective date of the acquisition since Holcim controlled Firestone Building Products from that date by acquiring 100% of the voting equity shares for a consideration of CHF 3,205 million (USD 3,400 million) in cash.
For accounting purposes, the acquisition method has been applied. The identifiable assets and liabilities of Firestone Building Products have been fair valued at the effective date of the acquisition.
The excess of the consideration transferred over the fair value of the Firestone Building Products identifiable net assets is recorded as goodwill.
The provisional recognized amounts of the identifiable assets acquired and liabilities assumed are as follows:
Million CHF 31 March 2021
Cash and cash equivalents 22 Trade accounts receivable 299 Inventories 218 Prepaid expenses and other current assets 13 Total Current Assets 553 Property, plant and equipment 234 Intangible assets 1,008 Deferred tax assets 88 Total non-current assets 1,330 Trade accounts payable (139)Current financial liabilities (18)Other current liabilities (16)Short-term provisions (65)Total Current Liabilities (238)Long-term financial liabilities (55)Defined benefit obligations (8)Long-term provisions (396)Total non-current liabilities (458)Provisional fair value of net assets acquired 1,186 Cash consideration for business combination 3,205 Provisional Goodwill 2,019
20 Holcim Half-Year Report 2021

The amounts disclosed above were determined provisionally pending the finalization of the valuation for those assets and liabilities. Up to twelve months from the effective date of the acquisition are permitted for further adjustments to be made to the fair values assigned to the identifiable assets acquired and liabilities assumed. Hence the resulting goodwill and its allocation to cash-generating units are also provisional.
The fair value of the acquired receivables substantially equals the gross contractual amount to be collected.
The provisional goodwill arising from this transaction amounts to CHF 2,019 million. The goodwill is attributable to the favorable presence of synergies, industrial know-how, assembled workforce and economies of scale expected from the acquisition. The goodwill recognized is expected to be largely deductible for income tax purposes.
Firestone Building Products contributed net sales of CHF 499 million to the Group for the period from 31 March 2021 to 30 June 2021. If the acquisition had occurred on 1 January 2021, Firestone Building Products contribution to Group net sales would have been CHF 898 million.
The results of Firestone Building Products are reported in the product line Solutions & Products and the majority of the results are reported within the reportable segment North America.
3.2 Other scope changesIn the first half of 2021, the Group in addition acquired:
• Edile Commerciale (S.P.A.), a ready-mix concrete supplier in Milan, Italy (February 2021)
• Eugène Bühler & Fils SA, an aggregates supplier in Switzerland (February 2021)
• Cemex Rhone Alpes, a ready-mix concrete and aggregates supplier in Lyon, France (April 2021)
• Beton Mobile du Quebec, a ready-mix business in Quebec, Canada (April 2021)
In the first half of 2021, the Group acquired the remaining 50% of Lafarge Emirates Cement LLC resulting in the Group obtaining the control of its subsidiary (April 2021).
In the first half of 2020, the Group acquired Sibelco in Australia, comprising of three sand operations in Mount Compass (Glenshera) in South Australia, Lang Lang in Victoria and Salt Ash in New South Wales (April 2020).
21Holcim Half-Year Report 2021

NOTES TO THE CONDENSED CONSOLIDATED FINANCIAL STATEMENTS CONTINUED
4. INFORMATION BY REPORTABLE SEGMENT
Asia Pacific Europe Latin America Middle East Africa North America² Corporate/ Eliminations Total GroupH1 (unaudited) 2021 2020 2021 2020 2021 2020 2021 2020 2021 2020 2021 2020 2021 2020
Capacity and volumes soldAnnual cement production capacity (Million t)1 87.3 87.3 73.6 73.6 39.2 38.6 59.0 56.3 32.0 32.0 291.1 287.8 Sales of cement (Million t) 35.8 28.0 22.2 20.9 13.3 10.4 17.8 15.6 9.1 8.9 0.7 3.4 99.0 87.2 Sales of aggregates (Million t) 16.9 13.1 56.1 51.9 2.9 2.2 2.0 1.4 45.2 45.2 123.0 113.8 Sales of ready-mix concrete (Million m 3) 3.9 3.6 9.9 8.3 2.3 1.6 1.4 1.2 4.7 4.5 22.1 19.2
Statement of income (Million CHF)Net sales to external customers 2,998 2,413 3,886 3,274 1,269 980 1,162 1,177 2,984 2,566 256 283 12,556 10,693 Net sales to other segments 45 48 13 7 57 17 21 (136) (72)TOTAL NET SALES 2,998 2,413 3,931 3,321 1,283 987 1,218 1,194 3,005 2,566 120 212 12,556 10,693 Recurring EBIT 713 437 469 288 425 275 198 137 380 260 (202) (203) 1,983 1,194 Recurring EBIT margin in % 23.8 18.1 11.9 8.7 33.2 27.9 16.2 11.5 12.6 10.1 15.8 11.2 OPERATING PROFIT (LOSS) 703 431 435 279 425 254 187 8 330 246 (286) (213) 1,794 1,005 Operating profit (loss) margin in % 23.5 17.9 11.1 8.4 33.2 25.7 15.4 0.7 11.0 9.6 14.3 9.4
Statement of financial position (Million CHF)1
Invested capital 7,656 7,264 11,335 10,671 2,263 2,354 5,254 5,208 13,615 9,937 694 453 40,816 35,887 Investments in associates and joint ventures 1,866 1,781 218 218 49 39 1,394 1,379 53 56 3,580 3,473 Total assets 10,342 9,801 16,783 15,974 3,822 3,813 5,741 5,525 17,562 14,127 3,667 3,984 57,917 53,224 Total liabilities 3,761 3,666 7,645 7,159 1,549 1,514 2,467 2,169 8,416 5,652 4,500 4,439 28,337 24,600
Reconciliation of measures of profit and loss to the consolidated statement of incomeRecurring EBIT 713 437 469 288 425 275 198 137 380 260 (202) (203) 1,983 1,194 Impairment of operating assets (4) (11) (18) (9) (121) (13) (151)Restructuring, litigation and other non-recurring costs (10) (6) (30) 2 (3) (1) (8) (50) (14) (84) (10) (175) (39)OPERATING PROFIT (LOSS) 703 431 435 279 425 254 187 8 330 246 (286) (213) 1,794 1,005 Profit on disposals and other non-operating income 20 9 Loss on disposals and other non-operating expenses (63) (52)Share of profit of associates (19) 4 Financial income 40 62 Financial expense (312) (378)NET INCOME BEFORE TAXES 1,460 650
1 Prior-year figures as of 31 December 2020.2 The results of Firestone Building Products are reported in the product line Solutions & Products and the majority of the results are reported within the reportable segment
North America (for more information see note 3.1).
22 Holcim Half-Year Report 2021

4. INFORMATION BY REPORTABLE SEGMENT
Asia Pacific Europe Latin America Middle East Africa North America² Corporate/ Eliminations Total GroupH1 (unaudited) 2021 2020 2021 2020 2021 2020 2021 2020 2021 2020 2021 2020 2021 2020
Capacity and volumes soldAnnual cement production capacity (Million t)1 87.3 87.3 73.6 73.6 39.2 38.6 59.0 56.3 32.0 32.0 291.1 287.8 Sales of cement (Million t) 35.8 28.0 22.2 20.9 13.3 10.4 17.8 15.6 9.1 8.9 0.7 3.4 99.0 87.2 Sales of aggregates (Million t) 16.9 13.1 56.1 51.9 2.9 2.2 2.0 1.4 45.2 45.2 123.0 113.8 Sales of ready-mix concrete (Million m 3) 3.9 3.6 9.9 8.3 2.3 1.6 1.4 1.2 4.7 4.5 22.1 19.2
Statement of income (Million CHF)Net sales to external customers 2,998 2,413 3,886 3,274 1,269 980 1,162 1,177 2,984 2,566 256 283 12,556 10,693 Net sales to other segments 45 48 13 7 57 17 21 (136) (72)TOTAL NET SALES 2,998 2,413 3,931 3,321 1,283 987 1,218 1,194 3,005 2,566 120 212 12,556 10,693 Recurring EBIT 713 437 469 288 425 275 198 137 380 260 (202) (203) 1,983 1,194 Recurring EBIT margin in % 23.8 18.1 11.9 8.7 33.2 27.9 16.2 11.5 12.6 10.1 15.8 11.2 OPERATING PROFIT (LOSS) 703 431 435 279 425 254 187 8 330 246 (286) (213) 1,794 1,005 Operating profit (loss) margin in % 23.5 17.9 11.1 8.4 33.2 25.7 15.4 0.7 11.0 9.6 14.3 9.4
Statement of financial position (Million CHF)1
Invested capital 7,656 7,264 11,335 10,671 2,263 2,354 5,254 5,208 13,615 9,937 694 453 40,816 35,887 Investments in associates and joint ventures 1,866 1,781 218 218 49 39 1,394 1,379 53 56 3,580 3,473 Total assets 10,342 9,801 16,783 15,974 3,822 3,813 5,741 5,525 17,562 14,127 3,667 3,984 57,917 53,224 Total liabilities 3,761 3,666 7,645 7,159 1,549 1,514 2,467 2,169 8,416 5,652 4,500 4,439 28,337 24,600
Reconciliation of measures of profit and loss to the consolidated statement of incomeRecurring EBIT 713 437 469 288 425 275 198 137 380 260 (202) (203) 1,983 1,194 Impairment of operating assets (4) (11) (18) (9) (121) (13) (151)Restructuring, litigation and other non-recurring costs (10) (6) (30) 2 (3) (1) (8) (50) (14) (84) (10) (175) (39)OPERATING PROFIT (LOSS) 703 431 435 279 425 254 187 8 330 246 (286) (213) 1,794 1,005 Profit on disposals and other non-operating income 20 9 Loss on disposals and other non-operating expenses (63) (52)Share of profit of associates (19) 4 Financial income 40 62 Financial expense (312) (378)NET INCOME BEFORE TAXES 1,460 650
1 Prior-year figures as of 31 December 2020.2 The results of Firestone Building Products are reported in the product line Solutions & Products and the majority of the results are reported within the reportable segment
North America (for more information see note 3.1).
23Holcim Half-Year Report 2021
NOTES TO THE CONDENSED CONSOLIDATED FINANCIAL STATEMENTS CONTINUED
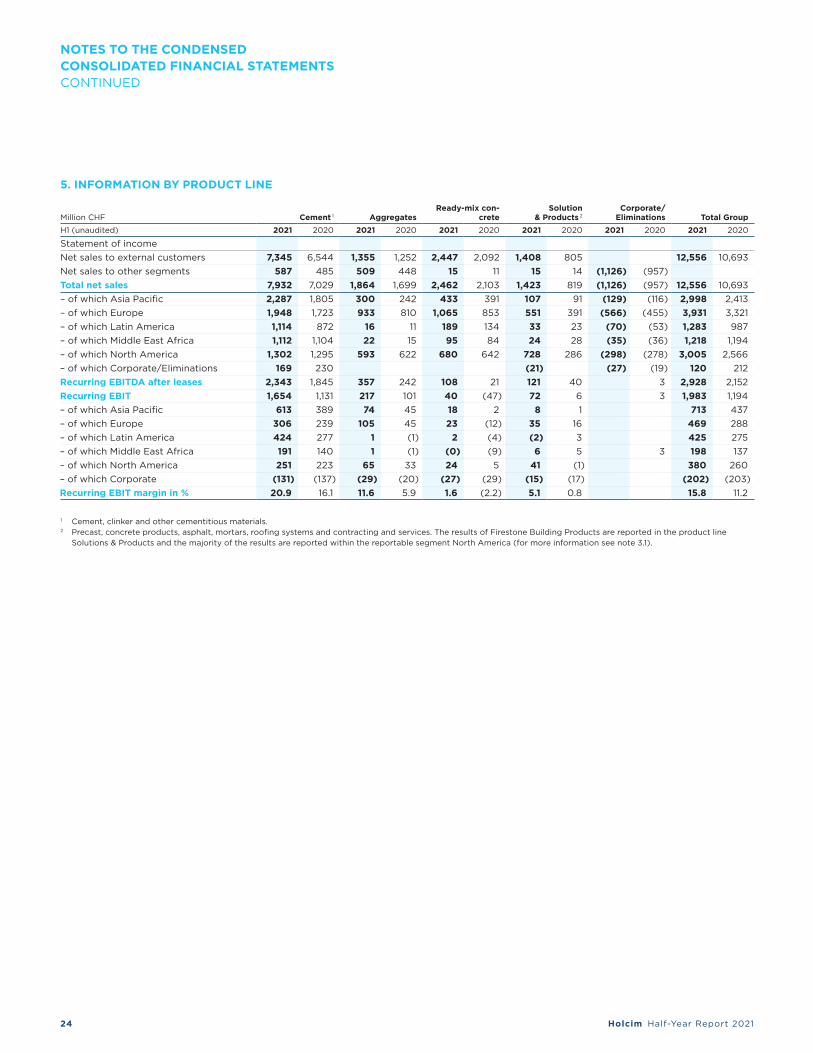
5. INFORMATION BY PRODUCT LINE
Million CHF Cement 1 AggregatesReady-mix con-
creteSolution
& Products 2Corporate/
Eliminations Total GroupH1 (unaudited) 2021 2020 2021 2020 2021 2020 2021 2020 2021 2020 2021 2020
Statement of incomeNet sales to external customers 7,345 6,544 1,355 1,252 2,447 2,092 1,408 805 12,556 10,693 Net sales to other segments 587 485 509 448 15 11 15 14 (1,126) (957)Total net sales 7,932 7,029 1,864 1,699 2,462 2,103 1,423 819 (1,126) (957) 12,556 10,693 – of which Asia Pacific 2,287 1,805 300 242 433 391 107 91 (129) (116) 2,998 2,413 – of which Europe 1,948 1,723 933 810 1,065 853 551 391 (566) (455) 3,931 3,321 – of which Latin America 1,114 872 16 11 189 134 33 23 (70) (53) 1,283 987 – of which Middle East Africa 1,112 1,104 22 15 95 84 24 28 (35) (36) 1,218 1,194 – of which North America 1,302 1,295 593 622 680 642 728 286 (298) (278) 3,005 2,566 – of which Corporate/Eliminations 169 230 (21) (27) (19) 120 212 Recurring EBITDA after leases 2,343 1,845 357 242 108 21 121 40 3 2,928 2,152 Recurring EBIT 1,654 1,131 217 101 40 (47) 72 6 3 1,983 1,194 – of which Asia Pacific 613 389 74 45 18 2 8 1 713 437 – of which Europe 306 239 105 45 23 (12) 35 16 469 288 – of which Latin America 424 277 1 (1) 2 (4) (2) 3 425 275 – of which Middle East Africa 191 140 1 (1) (0) (9) 6 5 3 198 137 – of which North America 251 223 65 33 24 5 41 (1) 380 260 – of which Corporate (131) (137) (29) (20) (27) (29) (15) (17) (202) (203)Recurring EBIT margin in % 20.9 16.1 11.6 5.9 1.6 (2.2) 5.1 0.8 15.8 11.2
1 Cement, clinker and other cementitious materials.2 Precast, concrete products, asphalt, mortars, roofing systems and contracting and services. The results of Firestone Building Products are reported in the product line
Solutions & Products and the majority of the results are reported within the reportable segment North America (for more information see note 3.1).
24 Holcim Half-Year Report 2021

6. PROFIT ON DISPOSALS AND OTHER NON-OPERATING INCOME
Million CHFH1 2021
UnauditedH1 2020
Unaudited
Dividends earned 1 1 Net gain on disposal before taxes 19 7 Other 0 1 Total 20 9
In 2021 and 2020, the position “Net gain on disposal before taxes “, includes several gains on disposal of property plant and equipment.
7. LOSS ON DISPOSALS AND OTHER NON-OPERATING EXPENSES
Million CHFH1 2021
UnauditedH1 2020
Unaudited
Depreciation, amortization and impairment of non-operating assets (15) (7)Net loss on disposal before taxes 0 (15)Other (48) (30)Total (63) (52)
In 2021, the position “Other” includes expenses incurred in connection with assets which are non-operating, abandoned, not part of the operating business cycle or impairment of associates or impairment losses recognized by applying the Fair value less cost of disposal methodology.
In 2020, the position “Other” includes expenses incurred in connection with assets which are non-operating, abandoned, not part of the operating business cycle or impairment of associates.
8. FINANCIAL INCOME
Million CHFH1 2021
UnauditedH1 2020
Unaudited
Interest earned on cash and cash equivalents 30 48 Other financial income 10 15 Total 40 62
The position “Other financial income” relates primarily to interest income from loans and receivables.
25Holcim Half-Year Report 2021

9. FINANCIAL EXPENSES
Million CHFH1 2021
UnauditedH1 2020
Unaudited
Interest expenses (181) (210)Interest expenses on lease liabilities (30) (35)Net interest expense on retirement benefit plans (12) (18)Other financial expenses (89) (115)Total (312) (378)
The position “Interest expenses” relates primarily to financial liabilities measured at amortized cost, including amortization on bonds and private placements of CHF 3 million (2020: CHF 1 million).
The position “Other financial expenses" includes notably accruals for interest related to ongoing legal and tax cases, bank charges and foreign exchange impact.
10. TAXES
Excluding impairment and divestments, the Group’s effective tax rate is 26 percent for the six months ended 30 June 2021 (26 percent for the six months ended 30 June 2020).
11. EARNINGS PER SHARE
H1 2021 Unaudited
H1 2020 Unaudited
Earnings per share in CHF 1.36 0.55Net income attributable to shareholders of Holcim Ltd – as per statement of income (in million CHF) 839 347 Coupon relating to the Perpetual Subordinated Notes 1 (9) (9)Adjusted net income attributable to shareholders of Holcim Ltd 830 338 Weighted average number of shares outstanding 611,321,223 612,710,115
Fully diluted earnings per share in CHF 1.35 0.55Adjusted net income used to determine diluted earnings per share (in million CHF) 830 338 Weighted average number of shares outstanding 611,321,223 612,710,115 Adjustment for assumed exercise of share options and performance shares 970,642 444,833 Weighted average number of shares for diluted earnings per share 612,291,865 613,154,948
1 Holcim (LafargeHolcim at the time of issuance) issued two perpetual subordinated notes: EUR 500 million at an initial fixed coupon of 3 percent in April 2019 and CHF 200 million at an initial fixed coupon of 3.5 percent in November 2018.
In conformity with the decision taken at the annual general meeting of shareholders on 4 May 2021, a dividend of CHF 2.00 per registered share for the financial year 2020 was paid out of the foreign capital reserves from tax capital contributions on 12 May 2021.
NOTES TO THE CONDENSED CONSOLIDATED FINANCIAL STATEMENTS CONTINUED
26 Holcim Half-Year Report 2021

12. ASSETS AND RELATED LIABILITIES CLASSIFIED AS HELD FOR SALE
The net assets classified as held for sale as of 30 June 2021 amount to CHF 104 million (31 December 2020: CHF 114 million).
Million CHFJune 2021 Unaudited
December 2020 Audited
Property, plant and equipment 70 81 Goodwill and intangible assets 33 33 Assets classified as held for sale 104 114 Net assets classified as held for sale 104 114
13. GOODWILL
The table below summarizes the changes in goodwill for the period 1 January 2021 until 30 June 2021:
Million CHF (unaudited) Goodwill
2021At cost of acquisition 14,422 Accumulated amortization/impairment (2,009)Net book value as at 1 January 2021 12,413 Change in consolidation scope 1 2,037 Hyperinflation 5 Currency translation effects 225 Net book value as at 30 June 2021 14,680 At cost of acquisition 16,734 Accumulated amortization/impairment (2,054)Net book value as at 30 June 2021 14,680
1 Includes the impact of Firestone Building Products for CHF 2,019 million, for more information see note 3.1
27Holcim Half-Year Report 2021

14. FINANCIAL ASSETS AND LIABILITIES RECOGNIZED AND MEASURED AT FAIR VALUE
The following tables present the Group’s financial instruments that are recognized and measured at fair value
as of 30 June 2021 and as of 31 December 2020. No changes in the valuation techniques of the items below have occurred since the last annual financial statements.
Million CHF 30.06.2021 (unaudited)
Fair value level 1
Fair value level 2 Total
Financial assetsFair value through other comprehensive earnings- Strategic equity investments 146 146 Fair value through profit and loss- Other current assets- Derivatives held for hedging 93 93 - Derivatives held for trading 5 5
Financial liabilitiesDerivatives held for hedging 133 133 Derivatives held for trading 10 10
Million CHF 31.12.2020 (audited)
Fair value level 1
Fair value level 2 Total
Financial assetsFair value through other comprehensive earnings - Strategic equity investments 143 143 Fair value through profit and loss- Other current assets- Derivatives held for hedging 87 87 - Derivatives held for trading 13 13
Financial liabilitiesDerivatives held for hedging 10 10 Derivatives held for trading 9 9
15. LEASE LIABILITIES
As of 30 June 2021, the current portion of the lease liabilities included in the position "current financial liabilities" amounts to CHF 303 million (31 December 2020: CHF 283 million) and the long-term portion of the lease liabilities included in the position "long-term financial liabilities" amounted to CHF 1,116 million (31 December 2020: CHF 1,053 million).
NOTES TO THE CONDENSED CONSOLIDATED FINANCIAL STATEMENTS CONTINUED
28 Holcim Half-Year Report 2021
16. BONDS
On 11 May 2021, Holcim Finance (Luxembourg) S.A. redeemed a EUR 413 million Schuldschein loan with a coupon of 1.04% which was issued on 11 May 2016.
On 11 May 2021, Holcim International Finance Ltd redeemed a USD 40 million Schuldschein loan with a coupon of 2.8% which was issued on 11 May 2016.
On 10 June 2021, Holcim Overseas Finance Ltd. redeemed a CHF 335 million bond with a coupon of 3.375% which was issued on 10 June 2011.
On 15 June 2021, Lafarge Africa PLC redeemed an NGN 33'614 million bond with a coupon of 14.75% which was issued on 15 June 2016.
On 19 January 2021, Holcim Finance (Luxembourg) S.A. issued a EUR 500 million bond with a coupon of 0.125%, term 2021-2027. The bond was swapped into USD and floating interest rates at inception.
On 19 January 2021, Holcim Finance (Luxembourg) S.A. issued a EUR 650 million bond with a coupon of 0.625%, term 2021-2033. The bond was swapped into USD and floating interest rates at inception.
On 18 March 2021, Holcim Helvetia Finance Ltd issued a CHF 300 million bond with a coupon of 0.25%, term 2021-2027.
On 6 April 2021, Holcim Finance (Luxembourg) S.A. issued a EUR 500 million bond with a coupon of 0.625%, term 2021-2030.
17. PROVISIONS AND CONTINGENCIES
At 30 June 2021, provisions amounted to CHF 2,229 million (31 December 2020: CHF 1,712 million). This variation includes the impact of the acquisition of Firestone Building Products as reported in note 3.1.
At 30 June 2021, the Group’s contingencies amounted to CHF 1,988 million (31 December 2020: CHF 1,644 million).
Referring to the disclosures on legal and tax matters in note 16.3 of the 2020 Integrated Annual Report, there have been no material developments since the last reporting period, except for the cases that are described below.
Subsequent to the conclusion and public disclosure of the independent internal investigation, conducted under the supervision of the Holcim Board of Directors, and the initiation of the criminal proceedings currently pending with investigating judges in Paris, France, the Group received inquiries from time to time relating to the legacy conduct of Lafarge Cement Syria.
Such inquiries included informal requests for information on the matter from the U.S. Department of Justice (the "DOJ"). The Group has been responding to these informal inquiries.
Discussions have recently begun with the DOJ concerning the potential for resolution on the matter. These discussions remain at an early stage at which no assessment can be made of whether a resolution will be reached, the financial or other terms of such resolution, or the potential enforcement action, if any, that the DOJ would pursue if no resolution can be reached.
The criminal proceedings in France related to the alleged dealings of Lafarge Cement Syria with terrorist organizations in the years 2013 and 2014 are currently pending with the investigating judges in Paris. The Court of Appeal decided on 7 November 2019 to drop one of the charges, complicity in crimes against humanity. The Supreme Court is reviewing the Court of Appeal's decision and was due to make a decision on 15 July 2021, which has now been postponed to 7 September 2021.
A Group subsidiary has an investment in a joint venture, which owns a cement plant in Cuba. A waiver of Title III of the Helms-Burton Act (formally known as Cuban Liberty and Democratic Solidarity Act of 1996) lapsed as of 2 May 2019. Title III allows certain persons to file lawsuits in U.S. courts relating to certain property allegedly confiscated by the Cuban government since 1959. A Title III claim was filed in the Federal Court in Florida. An agreement, which resulted in the dismissal of the claim was reached in the first half of the year 2021 finally resolving this matter, which has been fully reflected in the half year results.
On 6 July 2020, a class action was filed against the main Cement players in Colombia including Holcim claiming damages based on an alleged price agreement for the years 2010 to 2012. The action was dismissed by the court on 24 September 2020 and the plaintiff appealed the decision. On 13 May 2021, the first instance court admitted the class action. Holcim appealed the decision and is waiting for the final decision regarding the admission.
At 30 June 2021, the Group’s guarantees issued in the ordinary course of business amounted to CHF 902 million (31 December 2020: CHF 867 million). The increase is mainly due to surety bonds and letter of credits.
At 30 June 2021, the Group’s commitments amounted to CHF 2,576 million (31 December 2020: CHF 2,306 million). The increase is mainly related to various purchase commitments.
At 30 June 2021, the Group’s contingent assets amounted to CHF 0 million (31 December 2020: CHF 26 million).
18. EVENTS AFTER THE REPORTING PERIOD
There are no significant events after the reporting period.
19. AUTHORIZATION OF THE INTERIM FINANCIAL STATEMENTS FOR ISSUE
The interim condensed financial statements were authorized for issuance by the Board of Directors of Holcim Ltd on 29 July 2021.
29Holcim Half-Year Report 2021

TO THE BOARD OF DIRECTORS OF HOLCIM LTD, ZUGZURICH, 29 JULY 2021
INDEPENDENT AUDITOR'S REPORT ON THE REVIEW OF INTERIM CONDENSED CONSOLIDATED FINANCIAL STATEMENTS
IntroductionWe have reviewed the interim condensed consolidated financial statements of Holcim Ltd, which comprise the condensed consolidated statement of financial position as at 30 June 2021, and the condensed consolidated statement of income, the condensed consolidated statement of comprehensive earnings, the condensed consolidated statement of changes in equity, the condensed consolidated statement of cash flows for the six-months period then ended and a summary of significant accounting policies and other explanatory notes presented on pages 12 to 29. Management is responsible for the preparation and fair presentation of this interim condensed consolidated financial information in accordance with International Accounting Standard IAS 34 – “Interim Financial Reporting”. Our responsibility is to express a conclusion on this interim condensed consolidated financial information based on our review.
Scope of ReviewWe conducted our review in accordance with International Standard on Review Engagements 2410, “Review of Interim Financial Information Performed by the Independent Auditor of the Entity.” A review of interim financial information consists of making inquiries, primarily of persons responsible for financial and accounting matters, and applying analytical and other review procedures. A review is substantially less in scope than an audit conducted in accordance with International Standards on Auditing and consequently does not enable us to obtain assurance that we would become aware of all significant matters that might be identified in an audit. Accordingly, we do not express an audit opinion.
ConclusionBased on our review, nothing has come to our attention that causes us to believe that the interim condensed consolidated financial statements are not prepared, in all material respects, in accordance with International Accounting Standard IAS 34 – “Interim Financial Reporting”.
Deloitte AG
David Quinlin Licensed Audit Expert
Alexandre DubiLicensed Audit Expert
30 Holcim Half-Year Report 2021
DEFINITION OF NON-GAAP MEASURES
Like-for-likeLike-for-like information is information factoring out changes in the scope of consolidation (such as divestments and acquisitions occurring in 2021 and 2020) and currency translation effects (2021 figures are converted with 2020 exchange rates in order to calculate the currency effects).
Recurring fixed costsRecurring fixed costs refer to all recurring costs not directly related to volumes such as maintenance, personnel cost in production, administration, marketing and sales expenses, third party services and depreciation of right-of-use assets. Recurring fixed costs are part of the Recurring operating costs.
Recurring variable costsRecurring variable costs include recurring operating costs directly related to volumes such as raw materials and finished goods purchases, inventory variation, energy, quarry outsourcing and distribution costs. The addition of Recurring fixed costs and Recurring variable costs equals the total Recurring operating costs.
Recurring operating costsThe Recurring operating costs is an indicator representing all recurring costs. It is defined as: +/– Recurring EBITDA after leases; – Net sales; and – Share of profit of joint ventures.
Recurring EBITDA The Recurring EBITDA (earnings before interest, tax, depreciation and amortization) is an indicator to measure the performance of the Group excluding the impacts of non-recurring items. It is defined as: +/– Operating profit/loss (EBIT); – Depreciation, amortization and impairment of operating assets; and – Restructuring, litigation and other non-recurring costs.
Recurring EBITDA after leasesThe Recurring EBITDA after leases (earnings before interest, tax, depreciation and amortization) is an indicator to measure the performance of the Group including the impacts of lease depreciation and excluding the impacts of non-recurring items. It is defined as the Recurring EBITDA less the depreciation of right-of-use assets.
Recurring EBITThe Recurring EBIT is defined as Operating profit/loss (EBIT) adjusted for restructuring, litigation and other non-recurring costs and for impairment of operating assets.
Recurring EBIT marginThe Recurring EBIT margin is an indicator to measure the profitability of the Group excluding the impacts of non-recurring items. It is defined as the Recurring EBIT divided by net sales.
Restructuring, litigation and other non-recurring costsRestructuring, litigation and other non-recurring costs comprise significant items that, because of their exceptional nature, cannot be viewed as inherent to the Group’s ongoing performance, such as strategic restructuring, major items relating to antitrust fines and other business-related litigation cases.
Profit/loss on disposals and other non-operating itemsProfit/loss on disposals and other non-operating items comprise capital gains or losses on the sale of Group companies and of material property, plant and equipment and other non-operating items that are not directly related to the Group’s normal operating activities such as revaluation gains or losses on previously held equity interests, impairment losses recognized by applying the Fair value less cost of disposal methodology and cost related to other non business-related litigation cases.
Operating profit/loss (EBIT) before impairmentThe Operating profit/loss (EBIT) before impairment is an indicator that measures the profit earned from the Group’s core business activities excluding impairment charges which, because of their exceptional nature, cannot be viewed as inherent to the Group’s ongoing activities. It is defined as: +/– Operating profit/loss; – impairment of goodwill and long-term assets.
Net income/loss before impairment and divestmentsNet income/loss before impairment and divestments excludes impairment charges and capital gains and losses arising on disposals of investments which, because of their exceptional nature, cannot be viewed as inherent to the Group’s ongoing activities. It is defined as: +/– Net income/loss; – Gains and losses on disposals of Group companies; and – Impairment of goodwill and long-term assets.
EPS (Earnings Per Share) before impairment and divestmentsThe EPS (Earnings Per Share) before impairment and divestments is an indicator that measures the theoretical profitability per share of stock outstanding based on a net income/loss before impairment and divestments. It is defined as Net income/loss before impairment and divestments attributable to the shareholders of Holcim Ltd divided by the weighted average number of shares outstanding.
31Holcim Half-Year Report 2021

Capex or Capex Net (Net Maintenance and Expansion Capex)The Capex or Capex Net (Net Maintenance and Expansion Capex) is an indicator to measure the cash spent to maintain or expand its asset base. It is defined as: + Expenditure to increase existing or create additional capacity to produce, distribute or provide services for existing products (expansion) or to diversify into new products or markets (diversification); + Expenditure to sustain the functional capacity of a particular component, assembly, equipment, production line or the whole plant, which may or may not generate a change of the resulting cash flow; and – Proceeds from sale of property, plant and equipment.
Employee benefits and other operating itemsEmployee benefits and other operating items reflect the non-cash impact on the operating profit of the employee benefits schemes net of any cash payments, the non- cash impact of the specific business risks provisions net of any cash payments, the non-cash share based compensation expenses and any other non-cash operating expenses.
Change in other receivables and liabilitiesChange in other receivables and liabilities includes the net change of other receivables and liabilities that are not already disclosed separately in the consolidated statement of cash flows or that are not of a tax or of a financial nature.
Free Cash Flow after leasesThe Free Cash Flow after leases is an indicator to measure the level of cash generated by the Group after spending cash to maintain or expand its asset base. It is defined as: +/– Cash flow from operating activities; – Net Maintenance and Expansion Capex; and – Repayment of long-term lease liabilities.
Net financial debt (“Net debt”)The Net financial debt (“Net debt”) is an indicator to measure the financial debt of the Group after deduction of the cash. It is defined as: + Financial liabilities (short-term and long-term) including derivative liabilities; – Cash and cash equivalents; and – Derivative assets (short-term and long-term).
Debt leverageThe Net financial debt to Recurring EBITDA ratio is used as an indicator of financial risk and shows how many years it would take the Group to pay back its debt.
Working capital days on salesThe Working Capital days on sales is an efficiency ratio which measures the level of trade accounts receivable, trade accounts payable and inventories in comparison to sales on a 12 months rolling basis. For better comparability, this indicator is calculated factoring out any changes in scope and exchange rates. It is defined as: + Days sales outstanding; + Days inventories outstanding; – Days payables outstanding.
Invested CapitalThe Invested Capital is an indicator that measures total funds invested by shareholders, lenders and any other financing sources. It is defined as: + Total shareholders’ equity; + Net financial debt; – Assets classified as held for sale; + Liabilities classified as held for sale; – Current financial receivables; and – Long-term financial investments and other long-term assets.
Net Operating Profit/loss After Tax (“NOPAT”)It is defined as: +/– Net Operating Profit/loss (being the Recurring EBIT and share of profits of associates) – Standard Taxes (being the taxes applying the Group’s tax rate to the Net Operating Profit/loss as defined above)
ROIC (Return On Invested Capital)The ROIC (Return On Invested Capital) measures the Group’s ability to efficiently use invested capital. It is defined as Net Operating Profit/loss After Tax (NOPAT) divided by the average Invested Capital. The average is calculated by adding the Invested Capital at the beginning of the period to that at the end of the period and dividing the sum by 2 (based on a rolling 12-month calculation).
Cash conversionThe cash conversion is an indicator that measures the Group’s ability to convert profits into available cash. It is defined as Free Cash Flow after leases divided by Recurring EBITDA after leases.
Personnel (FTE)Personnel (FTE) measures the number of full time equivalent own personnel (FTE) assigned to functions and tasks.
Net CO2 emissions (kg per ton of cementitious material)Net CO2 emissions are CO2 emissions from the calcination process of the raw materials and the combustion of traditional kiln and non-kiln fuels. Cementitious materials refer to clinker production volumes, mineral components consumed in cement production and mineral components processed and sold externally.
DEFINITION OF NON-GAAP MEASURES CONTINUED
32 Holcim Half-Year Report 2021

Waste reused in operations (million tons)The total volume of waste derived resources includes the following components: alternative fuels, alternative raw materials, industrial mineral components consumed and/or processed and sold externally, industrial gypsum, alternative aggregate produced and/or consumed and returned asphalt recycled.
Freshwater withdrawal (liter per ton of cementitious material)Total volume of freshwater withdrawn by the cement plant divided by the total production of cementitious material.
Lost time injury frequency rate (LTIFR)Number of on-the-job injuries that require a person to stay away from work for a day or more per one million hours worked.
TonRefers to a Metric ton, or 1,000 kg.
The full set of definitions can be found on our website: www.holcim.com/non-gaap-measures
33Holcim Half-Year Report 2021
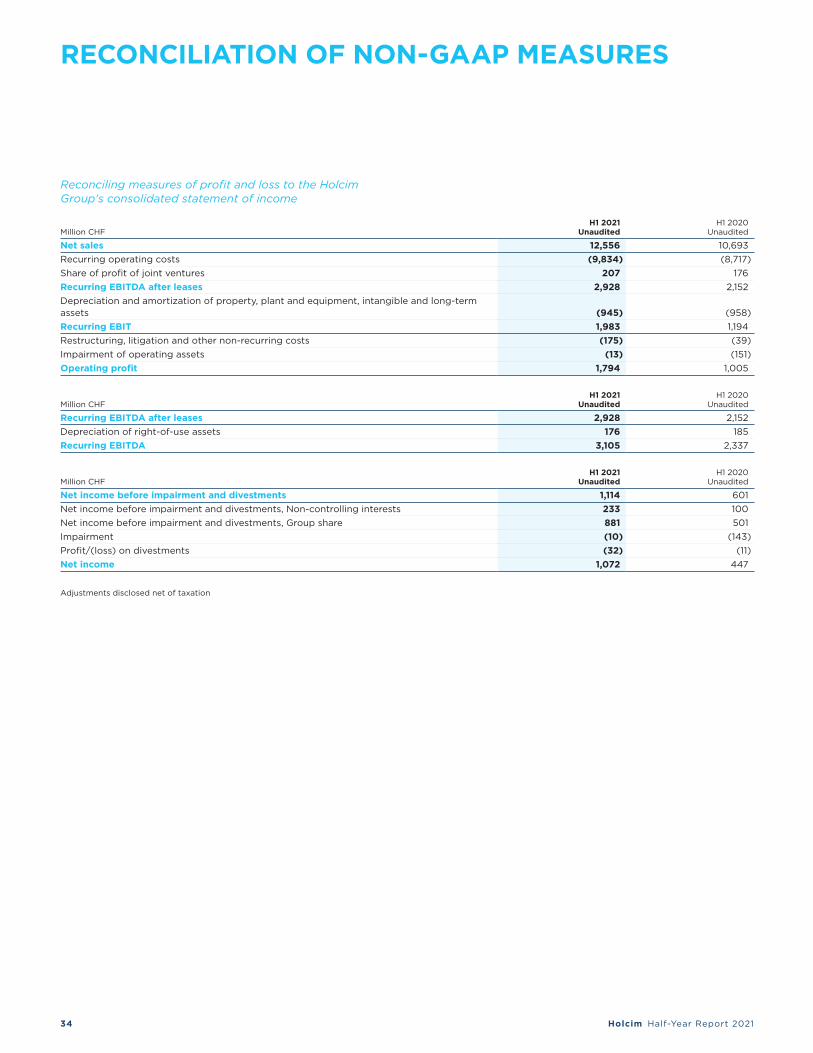
Reconciling measures of profit and loss to the Holcim Group's consolidated statement of income
Million CHFH1 2021
UnauditedH1 2020
Unaudited
Net sales 12,556 10,693 Recurring operating costs (9,834) (8,717)Share of profit of joint ventures 207 176 Recurring EBITDA after leases 2,928 2,152 Depreciation and amortization of property, plant and equipment, intangible and long-term assets (945) (958)Recurring EBIT 1,983 1,194 Restructuring, litigation and other non-recurring costs (175) (39)Impairment of operating assets (13) (151)Operating profit 1,794 1,005
Million CHFH1 2021
UnauditedH1 2020
Unaudited
Recurring EBITDA after leases 2,928 2,152 Depreciation of right-of-use assets 176 185 Recurring EBITDA 3,105 2,337
Million CHFH1 2021
UnauditedH1 2020
Unaudited
Net income before impairment and divestments 1,114 601 Net income before impairment and divestments, Non-controlling interests 233 100 Net income before impairment and divestments, Group share 881 501 Impairment (10) (143)Profit/(loss) on divestments (32) (11)Net income 1,072 447
Adjustments disclosed net of taxation
RECONCILIATION OF NON-GAAP MEASURES
34 Holcim Half-Year Report 2021

Reconciling measures of the Free Cash Flow after leases to the Holcim Group's consolidated statement of cash flows
Million CHFH1 2021
UnauditedH1 2020
Unaudited
Cash flow from operating activities 1,457 1,330 Purchase of property, plant and equipment (519) (442)Disposal of property, plant and equipment 51 30 Repayment of long-term lease liabilities (176) (169)Free Cash Flow after leases 814 749
Reconciling measures of Net financial debt to the Holcim Group's consolidated statement of financial position
Million CHFH1 2021
UnauditedH1 2020
Unaudited
Current financial liabilities 2,536 2,736 Long-term financial liabilities 13,465 11,697 Cash and cash equivalents 3,465 3,736 Short-term derivative assets 63 14 Long-term derivative assets 36 31 Net financial debt 12,438 10,652
35Holcim Half-Year Report 2021

We certify that, to the best of our knowledge and having made reasonable inquiries to that end, the financial statements have been prepared in accordance with applicable accounting standards and give a true and fair view of the assets and liabilities, and of the financial position and results of the Company and of its consolidated subsidiaries, and that this interim report provides a true and fair view of the evolution of the business, results and financial condition of the Company and of its consolidated subsidiaries.
Zug, 29 July 2021
Jan Jenisch Chief Executive Officer
Géraldine PicaudChief Financial Officer
RESPONSIBILITY STATEMENT
36 Holcim Half-Year Report 2021
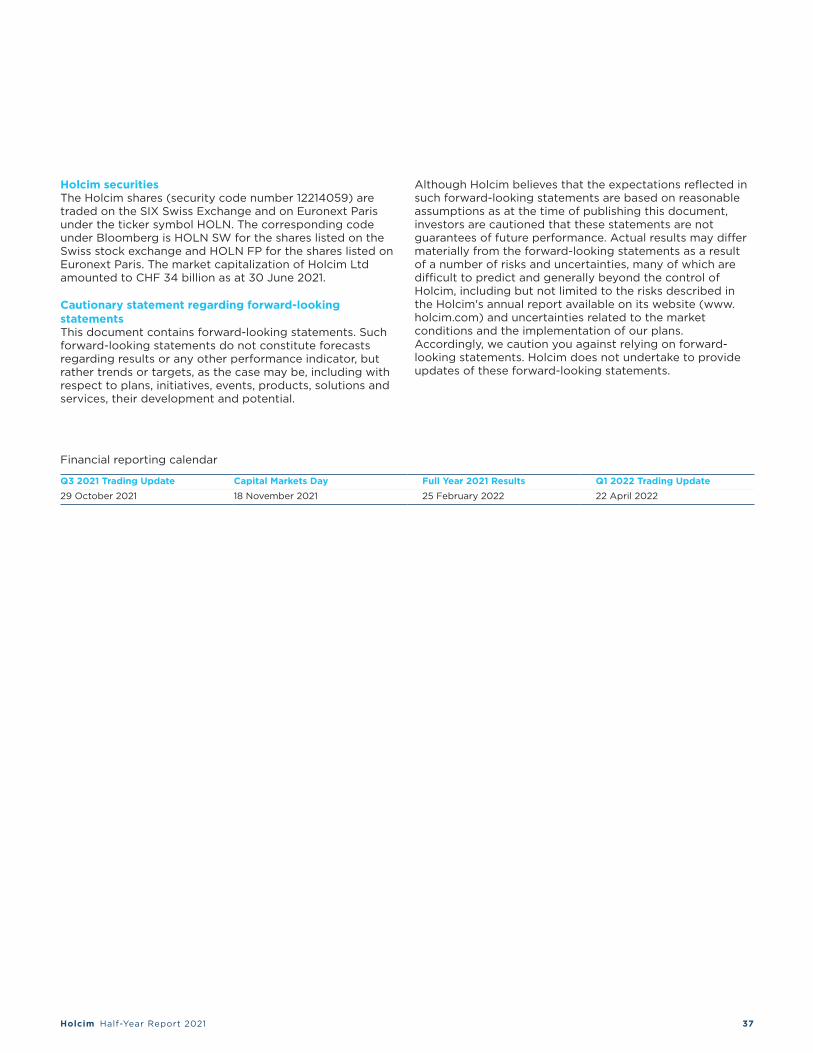
Holcim securitiesThe Holcim shares (security code number 12214059) are traded on the SIX Swiss Exchange and on Euronext Paris under the ticker symbol HOLN. The corresponding code under Bloomberg is HOLN SW for the shares listed on the Swiss stock exchange and HOLN FP for the shares listed on Euronext Paris. The market capitalization of Holcim Ltd amounted to CHF 34 billion as at 30 June 2021.
Cautionary statement regarding forward-looking statementsThis document contains forward-looking statements. Such forward-looking statements do not constitute forecasts regarding results or any other performance indicator, but rather trends or targets, as the case may be, including with respect to plans, initiatives, events, products, solutions and services, their development and potential.
Although Holcim believes that the expectations reflected in such forward-looking statements are based on reasonable assumptions as at the time of publishing this document, investors are cautioned that these statements are not guarantees of future performance. Actual results may differ materially from the forward-looking statements as a result of a number of risks and uncertainties, many of which are difficult to predict and generally beyond the control of Holcim, including but not limited to the risks described in the Holcim's annual report available on its website (www.holcim.com) and uncertainties related to the market conditions and the implementation of our plans. Accordingly, we caution you against relying on forward-looking statements. Holcim does not undertake to provide updates of these forward-looking statements.
Financial reporting calendar
Q3 2021 Trading Update Capital Markets Day Full Year 2021 Results Q1 2022 Trading Update29 October 2021 18 November 2021 25 February 2022 22 April 2022
37Holcim Half-Year Report 2021