Embed Size (px)
Citation preview

Half Year Results.
26 February 2020
2020.
For
per
sona
l use
onl
y

Macquarie Telecom Group
Key Business Highlights.
| Half Year Results 2020
2
● Eleven consecutive halves of revenue and EBITDA growth ● EBITDA CAGR of 18.5% over the last 3 years (excluding AASB16 13.3%) (g A13.3%)● All Business Units grew revenue with particularly strong growth in Cloud and
Government● Government signed agreement with ATO to provide Secure Internet Gateway
(SIG) and cyber security services ● Construction of Intellicentre 3 East (IC3 East), commenced in January with a
12 month build timeframe. Update to be provided later in the year● Remaining undrawn debt facility of $93m with a syndicate of banks executed to
fund the build of IC3 data centre● Telecom continue to migrate services to the nbn network in line with plan● Primary focus on customer service with an ASX leading net promoter score of +71
2
For
per
sona
l use
onl
y

Macquarie Telecom Group
Business Summary.
H120
54% 31%
Revenue EBITDA
3
46% 69%
Revenue EBITDA
For
per
sona
l use
onl
y

Macquarie Telecom Group
Macquarie Telecom● #1 in Asia Pacific for SDWAN● Half of Macquarie customers successfully migrated to NBN● Strong cross sell of Cloud Services solutions into Telecom’s
customers● Launching of Cloud PBX Product “Hello”
Business Highlights Summary.
Macquarie Cloud Services● Continues to grow successfully leveraging the Hybrid IT
megatrend● Managed Azure Practice developing a pathway to public cloud● 2019 Dell EMC Rising Star award● 2019 Great Place to Work – Top 20
Macquarie Government● 42% of Australian Government agencies● ASD certified cloud for classified / protected workloads● ATO cyber security contract, $20m over the initial 3 year term● Investing in upgrading the whole of Government Secure Internet
Gateway, across our data centres
Macquarie Data Centres● Construction of IC3 East commenced in January 2020 ● Macquarie Park Data Centre Campus expansion to 43 MW ● Full half of billing for Stage 3 of our Fortune 100 customer● Significant demand from hyperscale customers
| Half Year Results 2020
44
For
per
sona
l use
onl
y

Macquarie Telecom Group | Half Year Results 2020
A Differentiated Offering.
For
per
sona
l use
onl
y

Macquarie Telecom Group
Customer focus.• Our continued focus on providing a great
customer experience is core to our service offering & differentiation
• Macquarie’s net promoter score (NPS) is +71 for Q2 FY20 – Australian leading NPS
• NPS is the measure of customer experience that is assessed on a scale of -100 to +100, where a score of greater than +50 is excellent
• NPS is calculated on the single question "how likely is it that you would recommend our company to a friend or colleague?"
• Growth in our NPS is good for our investors
Company purpose.To make a difference in markets that are underserved and overcharged.
| Half Year Results 2020
+71NPS
6
For
per
sona
l use
onl
y

Macquarie Telecom Group
Quality Infrastructure.
For
per
sona
l use
onl
y

Macquarie Telecom Group
Data Centre Portfolio expansion.Intellicentre 3 East
● Construction commenced in January 2020
● Initial build capex $82-$85M (excluding additional power) comprising of:
– MEP and fit out $45M
– Initial Capacity 2.4MW
● Modular fit out based on customer demand in years ahead
● IC3 East building area 13,400 sqm
● Keppel contribution to core and shell build cost $26-$36M
| Half Year Results 2020
8
Intellicentre 3 East
Intellicentre 2 (existing)
For
per
sona
l use
onl
y
Macquarie Telecom Group
Macquarie Park Campus expansionfrom 10MW to 43MW total load.
● Modularised build for core and shell phases
● Carrier Neutral
● Designed for global hyperscalers, enterprise and Government customers
Total Campus Load 43MW● Intellicentre 2 (IC2) 10MW existing
● Intellicentre 3 (IC3) East/West 33MW
Intellicentre 3 East
Intellicentre 2 (existing)
Intellicentre 3 EastIntellicentre 3 West
Intellicentre 2 (existing)
Intellicentre 3 East & West
| Half Year Results 2020
9
For
per
sona
l use
onl
y
Macquarie Telecom Group
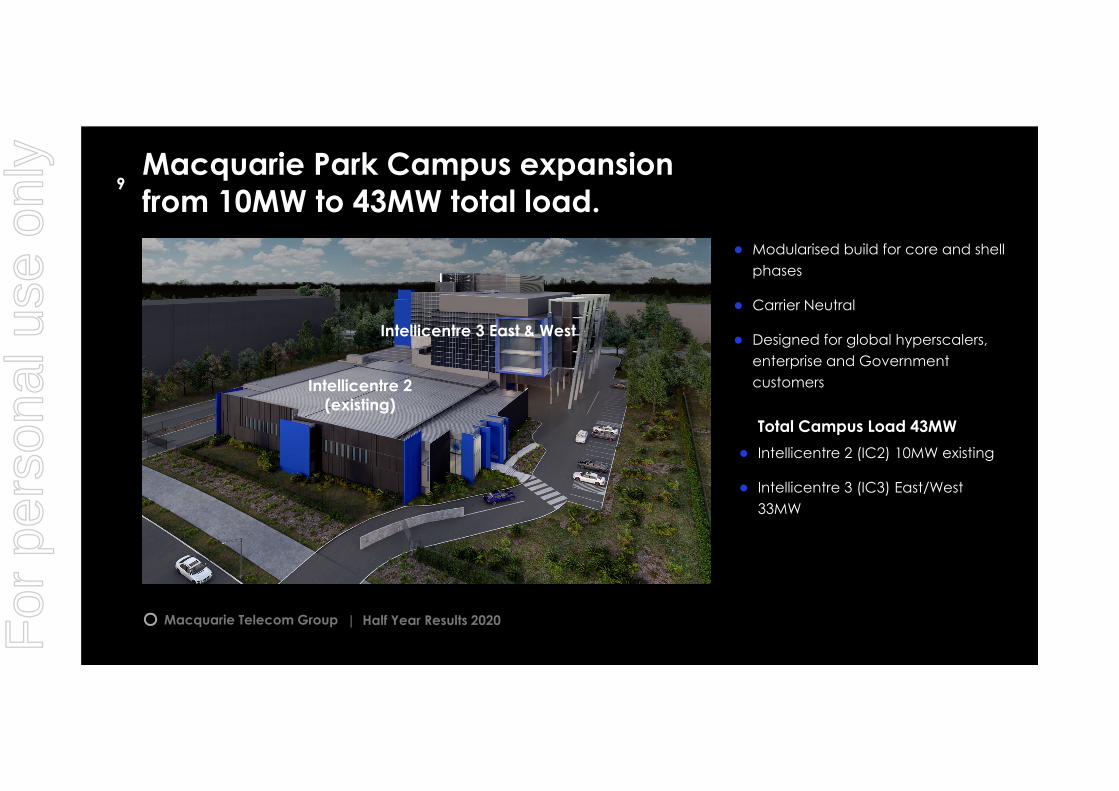
Our private cloud is a key source of data centre utilisationand generates higher revenue per rack.
Underlying infrastructureanonymised as we sell
outcome focused solutions
10
For
per
sona
l use
onl
y

Macquarie Telecom Group
Financials.
| Half Year Results 2020For
per
sona
l use
onl
y
Macquarie Telecom Group
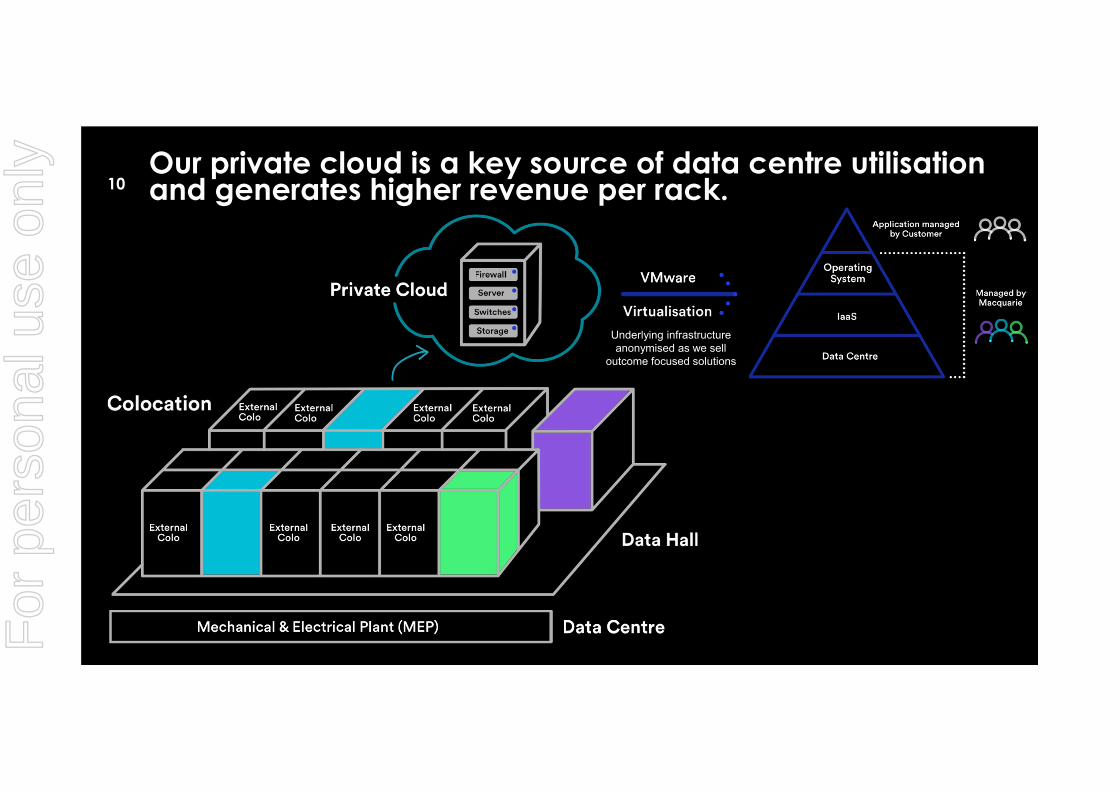
Financial Results.
| Half Year Results 2020
• Inter-segment revenue relates to services provided by the Hosting segment to the Telecom segment, eliminated on consolidation• EBITDA post AASB16 has increased by $4.0m as rent is excluded under AASB16. Instead lease obligations are recognized on the balance
sheet as right of use assets and lease liabilities. This results in $3.5m of depreciation of the right of use asset and $1.8m interest from the lease liability
12
$m 1H19 2H19 1H20 pre AASB16
1H20 v 1H19 pre AASB16
% change pre AASB16
1H20 post AASB16
Impact of AASB16
Total RevenueTelecom 70.4 70.4 71.8 1.4 2% 71.8 0.0 Host ing 53.0 57.6 62.7 9.7 18% 62.7 0.0 Inter-segment (2.4) (2.4) (2.6) (0.2) (2.6) 0.0
Total Revenue 121.0 125.6 131.9 10.9 9% 131.9 0.0 EBITDA
Telecom 10.1 9.8 9.1 (1.1) (10%) 9.9 0.8 Host ing 15.3 16.9 18.6 3.3 21% 21.7 3.1
Total EBITDA 25.5 26.7 27.6 2.1 8% 31.6 4.0 Depreciat ion & Amort isat ion (13.6) (15.0) (16.5) (2.9) (20.0) (3.5)
EBIT 11.9 11.7 11.1 (0.8) (6%) 11.6 0.5 Interest 0.2 (0.3) (0.4) (0.6) (2.2) (1.8)
NPBT 12.1 11.4 10.7 (1.3) (11%) 9.4 (1.3) Tax (3.8) (3.0) (3.1) 0.7 (2.7) 0.4
NPAT 8.3 8.3 7.6 (0.6) (7%) 6.7 (0.9)
For
per
sona
l use
onl
y

Macquarie Telecom Group
Group Financial Performance.
• Over the last 3 years:– Revenue CAGR of 7.2%– EBITDA CAGR of 18.5% (excluding AASB16 13.3%)– EBITDA margin improved from 17.7% (1H17) to 24.0% (1H20) (excluding AASB16 20.9%)
• Impact of AASB16 increases EBITDA by $4.0m (as per graph)
| Half Year Results 2020
13
For
per
sona
l use
onl
y

Macquarie Telecom Group
44.1 46.149.5
53.057.6
62.7
2H17 1H18 2H18 1H19 2H19 1H20
Hosting Revenue ($m)
Financial Performance – Hosting
| Half Year Results 2020
• Over the last 3 years:− Revenue CAGR of 18.3%− EBITDA CAGR of 30.8% (excluding AASB16 24.0%)− EBITDA margin improved from 25.6% (1H17) to 34.6% (1H20) (excluding AASB16 29.5%)
• Highly leveraged business with improving margins as infrastructure utilisation increases• Strong Government cyber security growth and Cloud growth• Impact of AASB16 increases EBITDA by $3.2m (as per graph)
14
For
per
sona
l use
onl
y
Macquarie Telecom Group
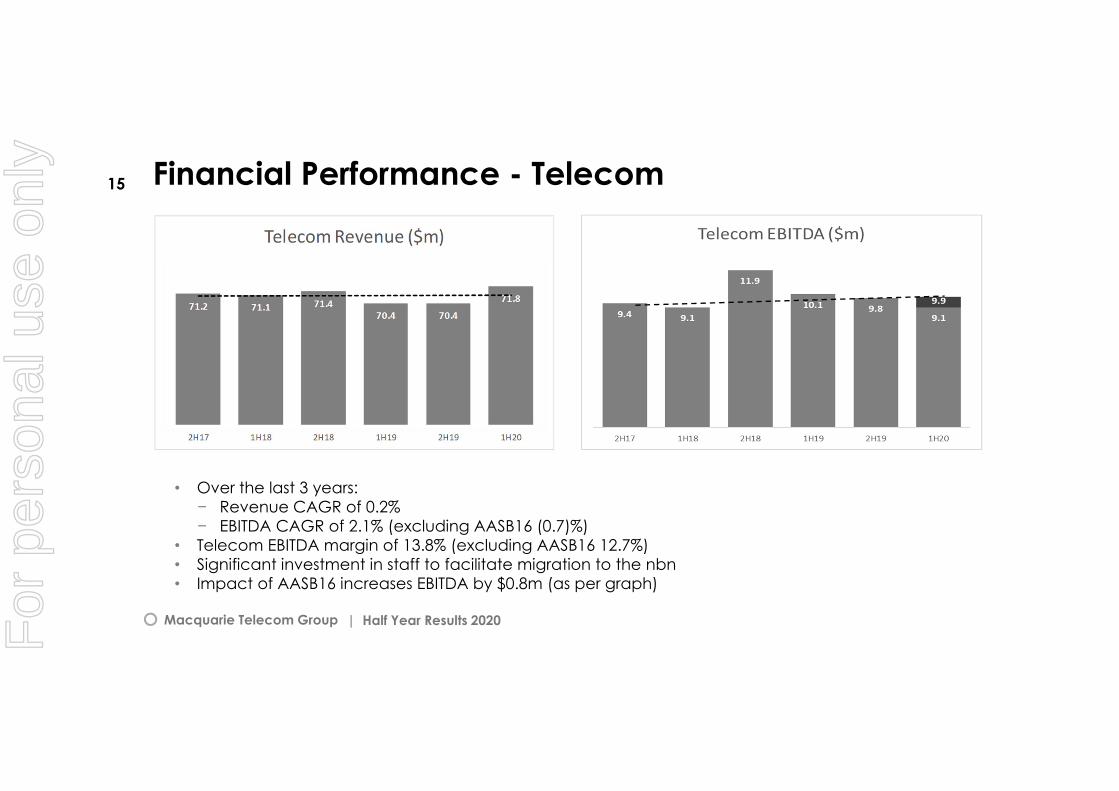
Financial Performance - Telecom
| Half Year Results 2020
• Over the last 3 years: − Revenue CAGR of 0.2%− EBITDA CAGR of 2.1% (excluding AASB16 (0.7)%)
• Telecom EBITDA margin of 13.8% (excluding AASB16 12.7%)• Significant investment in staff to facilitate migration to the nbn• Impact of AASB16 increases EBITDA by $0.8m (as per graph)
15
For
per
sona
l use
onl
y

Macquarie Telecom Group
● Growth Capex is for the building of new data centre capacity, increased power supply, new technology creation & transformational investment
● In the Hosting business, a current example is the Secure Internet Gateway services for the ATO
● In the Telecom business, a current example is investment in SDWAN and nbn migrations
● IC3 spend not included in growth capex
● Growth Capex was $5.5m in 1H FY20
● Customer Growth Capex is for additional cabling, racks, servers & storage that enable us to provision new customer orders
● Customer Growth Capex was $11.6m in 1H FY20 reflective of our data centre sales success & product mix
Maintenance Capex.
Growth Capex. Customer Growth Capex.
● Most of the remaining Capex is infrastructure refresh and internal software development known as Maintenance Capex
● Maintenance Capex was $6.0m for 1H FY20
| Half Year Results 2020
16
For
per
sona
l use
onl
y

Macquarie Telecom Group
Balance Sheet & Cash Flows.● Cash and cash equivalents of $6.9m. First draw down
of $7m in Oct19 with remaining undrawn debt facility of $93m with a syndicate of banks executed to fund the build of IC3 data centre
● 1H FY20 capital spend of $23.1m ex IC3
- Growth Capex $5.5m
- Customer Growth Capex $11.6m
- Maintenance Capex $6.0m
● IC3 development expenditure will be maintained as WIP in the balance sheet until practical completion where it will form part of the development agreement with Keppel
● Key impact of AASB16 has been to:
- recognise $77.5m of Right-of-use assets (non-current) offset by $78.7m of lease liabilities on the balance sheet at 1 July 2019
- $3.9m of interest and lease payments in financing activities in the cash flow (with nil cash impact)
| Half Year Results 2020
$m 1H19 1H20 post AASB16
Cash flows from Operating Activities 14.3 13.9
Cash flows from Investing Activities (25.0) (26.8)
Cash flows from Financing Activities (5.3) 2.7
Net increase/(decrease) in Cash Held (16.0) (10.2)
Opening Cash and cash equivalents 30.3 17.1
Closing Cash and cash equivalents 14.3 6.9
17 $m FY19 1H20 pre AASB16
1H20 post AASB16
Cash and cash equivalents 17.1 6.9 6.9
Other current assets 29.5 35.1 34.6
Non-current assets 114.7 130.1 204.4
Total Assets 161.3 172.1 245.9
Creditors 34.1 29.1 29.1
Other Liabilit ies 20.4 28.2 102.9
Total Liabilities 54.5 57.3 132.0
Total Equity 106.8 114.8 113.9
For
per
sona
l use
onl
y

Macquarie Telecom Group
Outlook.● Underpinned by strong sales growth, full year FY20
EBITDA is expected to be approximately $63 to $66 million ($55 to $58 million pre AASB16)
● Telecom continue to win customers from legacy data and IP carriers with our nbn and SD WAN solutions
● Cloud Services continue to grow successfully leveraging the Hybrid IT megatrend
● Continued demand from our Federal Government Agencies for cybersecurity and secure cloud, including from Tier 1 Agencies like ATO, gives great confidence for future growth in the Government Business
● IC3 development expenditure expected to be in the range of $29 to $32 million for FY20
| Half Year Results 2020
18
$m
63 - 66
55 - 58
Customer Growth Capex 31 - 32
Maintenance Capex 16 - 17
Growth Capex 14 - 15
61 - 64
31 - 33
29 - 32
FY 20
EBITDA
EBITDA pre AASB16
Total CAPEX excluding IC3
Depreciat ion pre AASB16
IC3 Development Expenditure WIP
For
per
sona
l use
onl
y
Macquarie Telecom Group
Disclaimer.
No express or implied warranty is given as to the accuracy or completeness of theinformation in this document or any corresponding presentation. This document maycontain forward looking statements that, while used in good faith, reflect MacquarieTelecom Group Limited’s current intention, plans, expectations, assumptions and beliefsabout future events and are subject to risks, uncertainties and other factors, many ofwhich are outside the control of Macquarie Telecom Group Limited.Factors that could cause actual results to differ materially from the expectationsexpressed or implied in the forward-looking statements include known and unknownrisks. Because actual results could differ materially from Macquarie Telecom GroupLimited’s current intentions, plans, expectations, assumptions and beliefs about thefuture, disclosures herein should not be relied upon as advice to investors or potentialinvestors and should be viewed with caution.
| Half Year Results 2020For
per
sona
l use
onl
y