Embed Size (px)
Citation preview

Half-Year 2017 Results
ASX Limited
17 February 2017

AgendaResults overview Dominic Stevens – CEO
Financial and operational detail Peter Hiom – Deputy CEO
Summary and outlook Dominic Stevens – CEO
Q & A – analysts followed by media

Highlights Macro drivers providing long-term growth opportunities
ListingsExpanding listings franchise, satisfactory
result against record pcp
Derivatives and OTC MarketsInvestment in new products and services
yielding results
Trading ServicesStrong growth in Centre Point and
continued ALC sales success
Equity Post-Trade ServicesSolid growth consistent with activity
levels, investing for the future
1H17
Continued earnings growth
as initiatives gain traction
Outlook
Macro factors and ASX
initiatives providing long-
term growth opportunities
3

Highlights - financial results 1H17Continued profit growth
Operating revenue and operating expenses as per the Group segment reportingVariance relative to the prior comparative period (1H16 pcp) expressed favourable / (unfavourable)
Revenue$386.6m
2.8%
Expenses$90.1m(6.0%)
EBITDA$296.5m
1.9%
EPS113.4c2.9%
DPS102.0c2.9%
NPAT$219.4m
3.0%
Revenue up $10.4 million to $386.6 million with solid performances across all businesses
Expenses up $5.0 million, in line with guidance reflecting current strategic initiatives
Interest and dividend income up 11.3% due to higher margin balances
NPAT up 3.0% to $219.4 million
EPS and DPS both up 2.9%, interim dividend of $1.02 per share fully franked
Capex of $20.3 million, on track for approximately $50 million as per guidance
4

Highlights - activity levelsGrowth in trading, lower capital raisings
1. Consists of futures and options on futures
380.4 417.1 454.3 529.5 539.0
449.2 413.9 512.2
529.6
FY13 FY14 FY15 FY16 FY17
Cash market tradingASX value on-market ($billion)
2H
1H
51.4 58.9 60.3 63.4 69.0
64.2 59.2 66.0 73.4
FY13 FY14 FY15 FY16 FY17
Futures1 - contracts (million)
2H
1H
80.5 63.1 64.2 50.3 50.8
76.8
61.5 56.3 51.2
FY13 FY14 FY15 FY16 FY17
Equity options - contracts (million)
2H
1H
26.2 36.7 38.6
54.6 36.8
20.2
29.3
50.3 24.0
FY13 FY14 FY15 FY16 FY17
Total capital raised ($billion)
2H
1H
5

6.2 4.6 1.9
(2.3)
376.2 386.6
1H16 Listings andIssuer
Services
Derivatives &OTC Markets
TradingServices
Equity Post-Trade Services
1H17
Revenue movement ($million)
304.8 329.3 348.7 376.2 386.6
312.6 329.0 352.0 370.1
FY13 FY14 FY15 FY16 FY17
Revenue ($million)
1H 2H
Highlights - 1H17 revenueSolid diversified revenue growth
Highlights
Revenue $386.6 million, up 2.8%
Listings and Issuer Services
‒ Revenue $103.3 million down 2.1%‒ Lower secondary listing fees versus a record pcp that
included capital raisings by the four major banks
Derivatives and OTC Markets
‒ Revenue $133.0 million up 4.9%‒ Higher futures volume and strong OTC growth
Trading Services
‒ Revenue $96.0 million up 5.0%‒ Growth in equities trading and increased use of Centre
Point. ALC community continues to expand
Equity Post-Trade Services
‒ Revenue $52.9 million up 3.8%‒ Increased volume and use of settlement services
Revenue up 2.8% $10.4m
Operating revenue as per the Group segment reportingVariance relative to the prior comparative period (1H16 pcp)
6

Global leader in A$ and NZ$ markets
Strong core value propositionUnderlying macro drivers plus ASX initiatives drive growth
Core customer value proposition
Listings Trade execution Clearing and settlementInitial and ongoing access to
capitalLower cost of capital
Listings integrityBranding
Ongoing liquidityHedging and risk transfer
Market integrityEfficient and timely access
Data services
Capital efficiencyRisk reduction/nettingOperational efficiencySettlement certainty
Macro growth drivers
Demand for financial assets Savings systemCapital needs
Globalisation of marketsAutomation of OTC markets
24 hour trading
Regulatory developments Operational efficiency goals
Capital efficiency needs
ASX initiatives- World-class infrastructure- Outstanding experience- Investment supermarket
Expansion of listing franchise (NZ, tech, offshore)
ETF/ETP listingsmFund expansion
New futures platformOffshore customer acquisition
20 year bond futuresSerial options
ASX Benchmarks (BBSW)Centre Point innovationALC technical solutions
CHESS replacementOTC Clearing
Futures/OTC cross marginingClient clearingASX Collateral
7

Highlights - strategic initiativesProgress across all businesses
Equity Post-TradeServices
Dual focus on CHESS replacement program- Significant stakeholder consultation. Dedicated demonstration suite showcasing
potential benefits - over 50 presentations, 40 workshops involving 350 people- Building enterprise grade base-level DLT equity post-trade functionality to assist our
decision on next steps late 2017
Trading Services Centre Point continues to grow as trading venue of choice Appointed BBSW administrator, customers transferring, new methodology from mid 2017 Value proposition of ALC driving further users, connections and ASX Net usage
Derivatives and OTC Markets
New futures trading platform post March futures roll with improved functionality Continued growth in OTC Clearing, new functionality rolling out February Increased activity from offshore investors and traders Collateral management balances growing strongly
Listings Expanding listings franchise Enhanced admission rules implemented Regulatory approval for mFund expansion to long-form product disclosure statements
8

Extensive public consultation programWorking with a range of stakeholders to improve market environment
Upgrading Australia’s post-trade equity market infrastructure Business requirements for CHESS replacement (ongoing since September 2016)
Building the cyber awarenessof Australian business ASX 100 Cyber Health Check (November 2016 - March 2017)
Keeping standards and investor confidence high New listings admission rules (May - November 2016)
Promoting systemic stability Raising minimum core capital requirements for clearing participants (June 2016 - January 2017)
Operational excellence and market communication
Engaging with customers and regulators to further refine our operational processes and market communication protocols
Upcoming in first-half of 2017
Giving shareholders their say Bidder shareholder approval for reverse takeovers
Maintaining Australia’s attractiveness for raising capital Review of and new guidance for capital raising rules
9

CHESS replacementEnhanced and ongoing stakeholder engagement
Government- Engagement to support
robust markets
Code of Practice- Increased Business
Committee engagement
Technical Committee - Supporting operational
design
Customers- Over 50 presentations,
40 workshops, 350 attendees
Market consultation- 40 responses received
- Secondary consultation underway
10
RBA- FSS compliance
- Systemic risk considerations
ASIC - Market structure
- Engagement to support users

Peter Hiom – Deputy CEO
Financial and operational detail

27%
Revenue contribution
Highlights
Revenue $103.3 million, down 2.1%
• Annual listing $39.3 million, up 7.3%‒ Increases in market capitalisation and fee changes
• Initial listing $9.7 million, down 17.2%‒ Increase in number of new listings offset by lower capital raised per listing
• Secondary capital raisings $26.7 million, down 8.0%‒ Lower capital raised, pcp included $18.1 billion of capital raised
by the four major Australian banks
• Issuer Services $22.6 million, down 2.4%‒ Lower holding statements
Listings and Issuer ServicesExpanding listings franchise, satisfactory result against record pcp
Operating revenue as per the Group segment reportingVariance relative to the prior comparative period (1H16 pcp) expressed favourable / (unfavourable)
12
0
20
40
60
80
100
0
10
20
30
40
50
60
1H13 2H13 1H14 2H14 1H15 2H15 1H16 2H16 1H17
Total capital raised ($billion) and number of IPOs
Secondary capital IPO capital
Scrip-for-scrip Number of IPOs (RHS)
1H17 1H16 Var $ Var %Revenue ($million) 103.3 105.6 (2.3) (2.1%)
Listings 80.7 82.4 (1.7) (2.0%)Issuer Services 22.6 23.2 (0.6) (2.4%)
Key driversNumber of IPOs 86 77 9 11.7%IPO capital ($billion) 11.1 13.5 (2.4) (17.8%)Secondary capital ($billion) 25.8 41.1 (15.3) (37.3%)CHESS holding statements (million) 7.3 7.4 (0.1) (2.0%)

Listings and Issuer ServicesForeign and technology listings, and expanding the investment product offering
ASX initiatives
New products and services
• New listing rules from 19 December 2016 further strengthen ASX brand as a premier listing venue
• Longer form funds on mFund approved by ASIC
Sales and distribution
• New Zealand – simplified dual listings process; 7 listings in 1H17, 51 entities now listed
• Tech sector – 15 listings¹ in 1H17, 190 entities now listed
• Exchange-traded products (ETPs) – 24 listings in 1H17, 199 ETPs listed, total value $25.8 billion
• Unlisted managed funds through mFund service – 56 fund managers offering 170 funds via 18 brokers
Customer service
• Updated and improved guidance notes for companies to meet ASX standards
1. Includes IPOs and backdoor listings
0102030405060708090
1H13 2H13 1H14 2H14 1H15 2H15 1H16 2H16 1H170
10
20
30
40
50
60New Zealand companies
Total market cap A$billion Total number ASX-listed NZ companies (RHS)
13
0
5
10
15
20
25
30
1H13 2H13 1H14 2H14 1H15 2H15 1H16 2H16 1H170
50
100
150
200
250ETP/ETF
Market cap value ($billion) No. of ETPs (RHS)

Highlights
Revenue $133.0 million, up 4.9%
• Futures and OTC $97.2 million, up 6.2%‒ Futures contracts traded up 8.8%‒ OTC value cleared $2,159.7 billion, $817.4 billion pcp‒ 1H17 interest rate futures rebate $8.2 million; FY17 estimate
$18-20 million, $14.4 million pcp
• Equity options $11.0 million, down 3.0%‒ Contracts traded up 1.1%‒ Change in product and customer mix
• Austraclear $24.8 million, up 3.7% ‒ Holdings balance up 5.3%, transactions down 1.0%
Derivatives and OTC MarketsInvestment in new products and services yielding results
Operating revenue as per the Group segment reportingVariance relative to the prior comparative period (1H16 pcp) expressed favourable / (unfavourable)
4 122 102
704 817
1,925 2,160
1H13 2H13 1H14 2H14 1H15 2H15 1H16 2H16 1H17
OTC notional value cleared ($billion)
34%
Revenue contribution
14
1H17 1H16 Var $ Var %Revenue ($million) 133.0 126.8 6.2 4.9%
Futures and OTC 97.2 91.6 5.6 6.2%Equity options 11.0 11.3 (0.3) (3.0%)Austraclear 24.8 23.9 0.9 3.7%
Key drivers (millions)Futures volumes 69.0 63.4 5.6 8.8%OTC cleared value ($billion) 2,159.7 817.4 1,342.3 164.2%Equity options volumes 50.8 50.3 0.5 1.1%Austraclear transactions 0.7 0.7 (0.0) (1.0%)

26%
36%
0%
5%
10%
15%
20%
25%
30%
35%
40%
0
5
10
15
20
25
30
1H13 2H13 1H14 2H14 1H15 2H15 1H16 2H16 1H17
Proprietary trader contracts (million) and % contribution
Derivatives and OTC MarketsFocus on global distribution and OTC service extension
ASX initiativesNew products and services
• Growth in 20 year bond futures, average daily volume 2,600, open interest 24,000
• Weekly and serial equity options, average daily volume 11,800
Sales and distribution
• Growth in offshore futures traders and activity
• Futures trading platform replacement on track
• Eight active OTC Clearing participants with $2.2 trillion value cleared, open interest $2.0 trillion
• OTC Clearing extended trading hours, client clearing enhancements from early 2017
• Collateral management balance $11.7 billion as at December. Service enhancements introduced November 2016
Customer service
• Austraclear applications processed online delivering transparency and efficiency to the onboarding process
• Implementation of eGAINS, the industry invoicing standard for brokerage on give-ups
15
16%
30%
0
5
10
15
20
25
30
35
40
45
0%
5%
10%
15%
20%
25%
30%
35%
FY09 FY10 FY11 FY12 FY13 FY14 FY15 FY16
Futures night session contracts (million)and % contribution

25%
Revenue contribution
Highlights
Revenue $96.0 million, up 5.0%
• Cash market trading $23.3 million, up 14.7%‒ Centre Point activity up 51.2%‒ Higher daily average on-market value traded‒ Trading rebate discontinued, $1.0 million pcp
• Information services $39.9 million, down 1.8%‒ Fee changes and stable activity levels‒ Lower index royalties
• Technical services $32.8 million, up 7.6%‒ Increased service connections, automated data feeds and lower latency services‒ Number of customer cabinets hosted in the ALC increased from 219 to 270
Trading ServicesStrong growth in Centre Point and continued ALC sales success
Operating revenue as per the Group segment reportingVariance relative to the prior comparative period (1H16 pcp) expressed favourable / (unfavourable)
16
1H17 1H16 Var $ Var %Revenue ($million) 96.0 91.4 4.6 5.0%
Cash Markets 23.3 20.3 3.0 14.7%Information Services 39.9 40.6 (0.7) (1.8%)Technical Services 32.8 30.5 2.3 7.6%
Key drivers ($billion)On-market value 539.0 529.5 9.5 1.8%Auctions value 113.7 103.7 10.0 9.6%Centre Point value 54.0 35.7 18.3 51.2%Number of ALC customers 111 99 12 12.1%
0.00
0.05
0.10
0.15
0.20
0
100
200
300
400
500
600
1H13 2H13 1H14 2H14 1H15 2H15 1H16 2H16 1H17
ASX on-market value traded ($billion) and average trading fee per side per $ value (bps)
Open trading Auctions tradingCentre Point Avg trading fee (RHS)

Trading ServicesFocus on distribution, community growth and commercialising ASX data
ASX initiatives
New products and services
• ASX appointed administrator of BBSW interest rate benchmark by AFMA effective January 2017
Sales and distribution
• On-market trading market share 87.9% (88.4% pcp)
• Centre Point value traded up 51.2% on pcp, 10.0% of ASX on-market value traded
• First customer connected through Hong Kong hub
• Growth in hosting as customers utilise ALC as primary data centre; further capacity available
• Increased diversity of ASX Net content
Customer service
• Response times on operational customer queries reduced by 50% and on resolution by 40% across ASX
• Single source of information for communications on system outages, utilised in NTP, extending to core platforms early 2017
0
200
400
600
800
1000
0
50
100
150
200
250
300
1H13 2H13 1H14 2H14 1H15 2H15 1H16 2H16 1H17
Australian Liquidity Centre
ALC cabinets (LHS) ALC service connections (RHS)
17
0
10
20
30
40
50
60
1H13 2H13 1H14 2H14 1H15 2H15 1H16 2H16 1H17
Centre Point value traded ($billion)
Standard Block Sweep Preference Single fill Dark limit

Highlights
Revenue $52.9 million, up 3.8%
• Clearing $26.8 million, down 1.4%‒ Value cleared up 2.8%‒ Clearing fees reduced 10% from 1 July 2016‒ Revenue sharing rebate nil, $1.7 million pcp
• Settlement $26.1 million, up 9.8%‒ Dominant settlement messages up 10.3%‒ Revenue sharing rebate $1.1 million, pcp $0.8 million
Equity Post-Trade ServicesGood growth consistent with increased activity levels, investing for the future
0
100
200
300
400
500
600
700
1H13 2H13 1H14 2H14 1H15 2H15 1H16 2H16 1H17
Value cleared ($billion)
Operating revenue as per the Group segment reportingVariance relative to the prior comparative period (1H16 pcp) expressed favourable / (unfavourable)
14%
Revenue contribution
18
1H17 1H16 Var $ Var %Revenue ($million) 52.9 51.0 1.9 3.8%
Cash Market Clearing 26.8 27.2 (0.4) (1.4%)Cash Market Settlement 26.1 23.8 2.3 9.8%
Key driversOn-market value cleared ($billion) 574.7 559.3 15.4 2.8%Dominant settlement messages 9.4 8.5 0.9 10.3%Avg trades per day (million) 1.0 0.8 0.2 19.9%

Equity Post-Trade ServicesBuilding the next generation platform
CHESS replacement
• Purpose built suite at Exchange Square for demonstrations and workshops
• Stakeholder consultation commenced in Q4 2016 to gather and prioritise business requirements
‒ Supplementary consultation paper issued in December 2016
‒ Summary of consultation papers and ASX response to be released in Q1 2017
‒ Business requirements (including ISO 20022 messaging) to be refined during 2017
• Decision in late 2017 on which technology to use
– Building base-level DLT equity post-trade functionality
– Testing enterprise-grade capabilities of DLT (eg scale, speed, persistence, security)19
ASX demonstration suite

4.5
0.5
85.1 90.1
1H16 Staff Other 1H17
Expense movement ($million)
1H17 ExpensesIn line with guidance
Highlights
Operating expenses up 6.0%
Higher investment in staff to support customer and growth-related initiatives
• Staff costs up 8.9%‒ Average headcount up 6.2% to 556 FTEs‒ Increase focused in business development and
technology‒ Annual remuneration increases
• Other costs up 1.6%‒ Higher equipment costs supporting new technology
platforms
• FY17 guidance 6.0% increase (unchanged)‒ Inclusive of new costs to support BBSW (these will
be offset by new revenue)
Expenses up 6.0% $5.0m
71.3 77.2 81.4 85.1 90.1
74.9 76.4 78.7 85.5
FY13 FY14 FY15 FY16 FY17
Expenses ($million)
1H 2H
Operating expenses as per the Group segment reportingVariance relative to the prior comparative period (1H16 pcp) expressed favourable / (unfavourable)
20

Highlights
• ASX Group net interest income down 16.9% due to lower interest rates
• Net interest on collateral balances up 32.7%
‒ Average collateral and commitment balances up 28.5% to $5.6 billion from $4.3 billion pcp
‒ Driven by heightened margins from Brexit to US elections
‒ Investment spread 41 bps (37 bps pcp)
• Portfolio transition in line with regulatory standards underway. Investment spread in 2H17 expected to be between 25-30 bps
Interest and dividend incomeCollateral increases driving net interest income
$million 1H17 1H16 Var $ Var %
ASX Group net interest income 9.4 11.3 (1.9) (16.9%)
Net interest earned oncollateral balances 23.2 17.5 5.7 32.7%
Total net interest income 32.6 28.8 3.8 13.2%
Dividend income 4.9 4.9 - 0.0%
Interest and dividend income 37.5 33.7 3.8 11.3%
Variance expressed favourable / (unfavourable)
3.4 3.7 3.9 3.8 3.8 3.74.1
5.9 5.8
1H13 2H13 1H14 2H14 1H15 2H15 1H16 2H16 1H17
Margin balance at period end ($billion)
21

Capital expenditureContinued investment in systems and technology
Highlights
• Futures trading platform on track for March 2017 go-live
• Additional enhancements post outage handled within ongoing capex envelope
• Inclusive of DLT development for potential CHESS replacement
• FY17 guidance approximately $50 million (unchanged)
22
15.4
23.5
18.6
24.6
13.0
31.4
18.7
31.5
20.3
1H13 2H13 1H14 2H14 1H15 2H15 1H16 2H16 1H17
$million

Dominic Stevens – CEO
Summary and outlook
Highlights
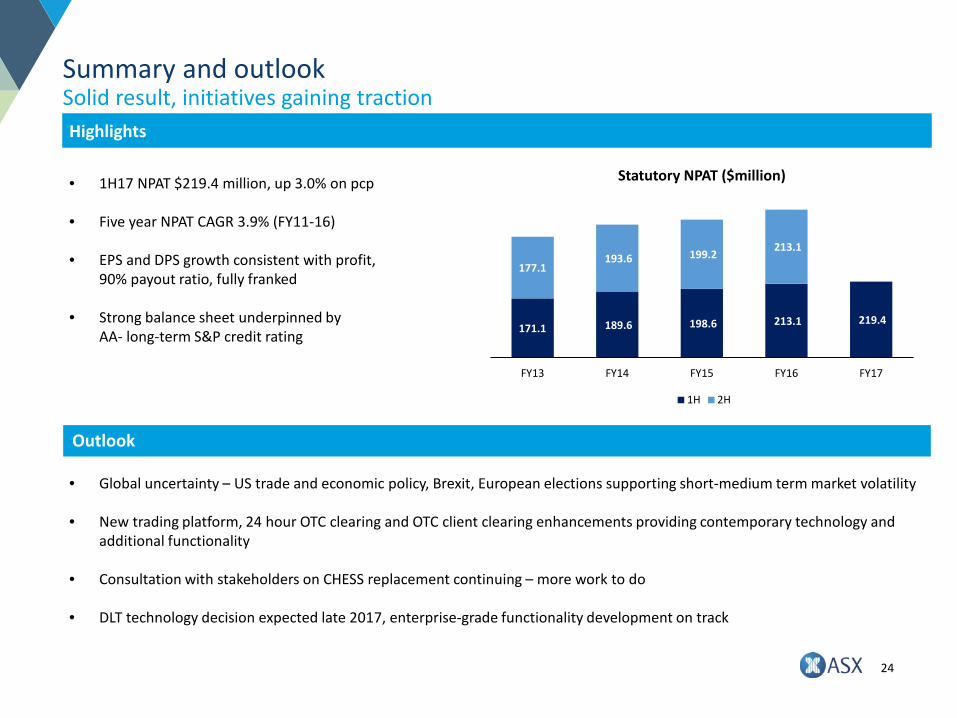
• 1H17 NPAT $219.4 million, up 3.0% on pcp
• Five year NPAT CAGR 3.9% (FY11-16)
• EPS and DPS growth consistent with profit,90% payout ratio, fully franked
• Strong balance sheet underpinned by AA- long-term S&P credit rating
• Global uncertainty – US trade and economic policy, Brexit, European elections supporting short-medium term market volatility
• New trading platform, 24 hour OTC clearing and OTC client clearing enhancements providing contemporary technology and additional functionality
• Consultation with stakeholders on CHESS replacement continuing – more work to do
• DLT technology decision expected late 2017, enterprise-grade functionality development on track
24
171.1 189.6 198.6 213.1 219.4
177.1193.6 199.2 213.1
FY13 FY14 FY15 FY16 FY17
Statutory NPAT ($million)
1H 2H
Summary and outlookSolid result, initiatives gaining traction
Outlook

Q & A

Appendices
1. Income statement
2. Balance sheet
3. Key financial ratios
4. Transaction and activity levels
5. Free cash flow summary
6. Capital attribution
7. Cash market clearing and settlement income statement
8. Post balance date activity levels

1. Income statement1H15
$million2H15
$million1H16
$million2H16
$million1H17
$million
Annual listing fees 34.8 35.9 36.7 38.5 39.3
Initial listing fees 11.4 9.5 11.7 6.9 9.7
Subsequent listing fees 21.2 21.5 29.0 16.1 26.7
Other listing fees 3.5 5.5 5.0 5.5 5.0
Listings 70.9 72.4 82.4 67.0 80.7
Issuer Services 20.4 19.8 23.2 20.1 22.6
Listings and Issuer Services 91.3 92.2 105.6 87.1 103.3
Cash market trading 17.7 18.4 20.3 20.4 23.3
Information services 36.7 37.0 40.6 39.5 39.9
Technical services 30.2 29.9 30.5 31.5 32.8
Trading Services 84.6 85.3 91.4 91.4 96.0
Cash market clearing 23.1 24.2 27.2 26.9 26.8
Cash market settlement 22.5 22.0 23.8 24.1 26.1
Equity Post-Trade Services 45.6 46.2 51.0 51.0 52.9
Equity options 12.8 11.8 11.3 11.8 11.0
Futures and OTC clearing 90.4 91.2 91.6 102.7 97.2
Austraclear 23.6 24.2 23.9 24.5 24.8
Derivatives and OTC Markets 126.8 127.2 126.8 139.0 133.0
Other revenue 0.4 1.1 1.4 1.6 1.4
Operating revenue 348.7 352.0 376.2 370.1 386.6
27Operating revenues and operating expenses as per the Group segment reporting

1. Income statement1H15
$million2H15
$million1H16
$million2H16
$million1H17
$million
Staff 49.9 46.5 50.7 50.4 55.2
Occupancy 6.7 7.0 6.8 7.3 7.3
Equipment 11.8 12.2 13.1 13.9 14.6
Administration 8.4 8.8 9.9 9.4 8.1
Variable 2.8 2.3 3.1 3.1 3.4
ASIC supervision levy 1.8 1.9 1.5 1.4 1.5
Operating expenses 81.4 78.7 85.1 85.5 90.1
EBITDA 267.3 273.3 291.1 284.6 296.5
Depreciation and amortisation 18.6 20.0 20.8 21.9 22.1
EBIT 248.7 253.3 270.3 262.7 274.4
Net interest income 14.9 12.0 11.3 11.0 9.4
Net interest on participants’ balances 14.6 17.7 17.5 20.2 23.2
Dividend revenue 4.9 7.8 4.9 8.2 4.9
Interest and dividend income 34.4 37.5 33.7 39.4 37.5
Underlying profit before tax 283.1 290.8 304.0 302.1 311.9
Income tax expense (84.5) (86.2) (90.9) (89.0) (92.5)
Underlying profit after tax 198.6 204.6 213.1 213.1 219.4
Significant items (net of tax) - (5.4) - - -
Statutory profit after tax 198.6 199.2 213.1 213.1 219.4
28
Operating revenues and operating expenses as per the Group segment reporting

2. Balance sheet31 Dec 14
$million30 Jun 15
$million31 Dec 15
$million30 Jun 16
$million31 Dec 16
$million
Assets
Cash and available-for-sale financial assets 5,027.3 4,879.0 5,356.3 7,072.8 7,002.2
Goodwill 2,317.6 2,317.6 2,317.6 2,317.6 2,317.6
Investments 394.6 376.8 373.6 424.8 473.2
Other Assets 341.5 485.2 527.9 636.4 462.8
Total assets 8,081.0 8,058.6 8,575.4 10,451.6 10,255.8
Liabilities
Amounts owing to participants (including funded commitments) 3,997.4 3,886.2 4,308.5 6,088.2 5,987.7
Other liabilities 331.7 412.7 479.7 539.3 394.0
Total liabilities 4,329.1 4,298.9 4,788.2 6,627.5 6,381.7
Equity
Capital 3,027.2 3,027.2 3,027.2 3,027.2 3,027.2
Retained earnings 505.6 526.3 555.5 576.9 604.8
Reserves 219.1 206.2 204.5 220.0 242.1
Total equity 3,751.9 3,759.7 3,787.2 3,824.1 3,874.1
29

3. Key financial ratios1H15 2H15 1H16 2H16 1H17
Basic EPS (including significant items) 102.7c 103.0c 110.2c 110.2c 113.4c
Diluted EPS (including significant items) 102.7c 103.0c 110.2c 110.2c 113.4c
Underlying EPS (excluding significant items) 102.7c 105.7c 110.2c 110.2c 113.4c
Dividend per share – interim 92.3c - 99.1c - 102.0c
Dividend per share – final - 95.1c - 99.0c -
Statutory return on equity (including significant items) 10.8% 10.8% 11.4% 11.3% 11.5%
Underlying return on equity 10.8% 11.0% 11.4% 11.3% 11.5%
EBITDA / operating revenue 76.6% 77.6% 77.4% 76.9% 76.7%
EBIT / operating revenue 71.3% 71.9% 71.9% 71.0% 71.0%
Total expenses (including depreciation and amortisation) / operating revenue 28.7% 28.1% 28.1% 29.0% 29.0%
Capital expenditure ($m) $13.0 $31.4 $18.7 $31.5 $20.3
Net tangible asset backing per share $6.97 $6.97 $7.12 $7.25 $7.45
Net asset backing per share $19.38 $19.42 $19.56 $19.75 $20.01
Shareholders’ equity as a % of total assets (excluding participants’ balances) 91.9% 90.1% 88.8% 87.6% 90.8%
Shareholders’ equity as a % of total assets (including participants’ balances) 46.4% 46.7% 44.2% 36.6% 37.8%
Share price at end of period $36.74 $39.90 $42.46 $45.76 $49.74
Ordinary shares on issue at end of period 193,595,162 193,595,162 193,595,162 193,595,162 193,595,162
Weighted average number of ordinary shares (excluding treasury shares) 193,413,893 193,413,893 193,413,893 193,413,893 193,416,713
Market value of ordinary shares on issue ($m) $7,113 $7,724 $8,220 $8,859 $9,629
Market to book ratio 1.90 2.05 2.17 2.32 2.49
Full-time equivalent permanent staff – number at period end 523 515 534 546 547
Full-time equivalent permanent staff – average during the period 526 522 523 544 556
30

4.1 Listing and Issuer Services0 1H15 2H15 1H16 2H16 1H17
Total domestic market capitalisation ($bn) – period end $1,575 $1,612 $1,629 $1,620 $1,760
Total number of listed entities (includes all stapled entities) - period end 2,208 2,220 2,238 2,204 2,215
Number of new listings 71 49 77 47 86
Average annual listing fee $15,752 $16,192 $16,381 $17,467 $17,752
Average initial listing fee $160,588 $193,630 $152,508 $146,415 $113,020
Average fee per $m of secondary capital $1,082 $706 $707 $1,156 $1,037
Initial capital raised ($m) $18,956 $19,960 $13,477 $10,110 $11,080
Secondary capital raised ($m) $17,746 $21,041 $35,597 $9,702 $23,619
Other secondary capital raised including scrip-for-scrip ($m) $1,860 $9,310 $5,501 $4,203 $2,137
Total capital raised (including other) ($m) $38,562 $50,311 $54,575 $24,015 $36,836
Number of new warrant series quoted 1,507 1,396 1,290 1,669 915
Total warrant series quoted 3,107 3,050 2,925 2,886 2,804
Number of CHESS holding statements issued (m) 6.7 6.4 7.4 6.6 7.3
26.220.2
36.729.3
38.6
50.354.6
24.0
36.8
1H13 2H13 1H14 2H14 1H15 2H15 1H16 2H16 1H17
Total capital raised (including other) ($bn)
31

4.2 Trading Services – cash market trading1H15 2H15 1H16 2H16 1H17
Trading days 130 124 130 124 129
Total cash market trades ('000) 92,984 97,663 110,091 125,832 130,984
Average daily cash market trades 715,263 787,602 846,853 1,014,772 1,015,381
Open trading ($bn) $326.180 $372.135 $390.115 $380.690 $371.262
Auctions trading ($bn) $91.469 $101.823 $103.701 $105.711 $113.659
Centre Point ($bn) $36.657 $38.276 $35.725 $43.216 $54.034
Trade reporting ($bn) $72.258 $73.651 $75.727 $69.264 $76.518
Total cash market value ($bn) $526.564 $585.885 $605.268 $598.881 $615.473
Average daily on-market value ($bn) $3.495 $4.131 $4.073 $4.271 $4.178
Average daily value (including trade reporting) ($bn) $4.050 $4.725 $4.656 $4.830 $4.771
Average trade size ($) $5,663 $5,999 $5,498 $4,759 $4,699
Total billable value ($bn) $519.707 $573.092 $596.515 $592.647 $607.884
Average fee per dollar of value (bps)1 1.18 1.08 1.15 1.17 1.22
Velocity (total value / average market capitalisation) 2 80% 85% 92% 92% 89%
1. Average fee earned (both sides) for Trading, Clearing and Settlement
2. Total value transacted on all venues
2.9493.651 3.208 3.365 3.495
4.131 4.073 4.271 4.178
1H13 2H13 1H14 2H14 1H15 2H15 1H16 2H16 1H17
Average daily on-market value ($bn)
32

4.2 Trading Services – technical services1H15 2H15 1H16 2H16 1H17
Technical services (number at period end)
Liquidity access
ASX sessions 1,277 1,185 1,141 1,113 1,074
ASX gateways 221 207 197 192 184
ASX liquidity cross-connects 60 55 59 57 58
Futures gateways 230 228 222 208 199
ASX ITCH access 30 31 35 39 40
ASX OUCH access 45 44 56 58 68
Futures liquidity cross-connects 353 357 288 306 292
Futures ITCH access 33 36 41 45 53
Community and connectivity
ASX Net connections 135 126 122 116 112
ASX Net service feeds 363 358 370 382 389
Australian Liquidity Centre service connections 689 679 746 819 907
Application services
ASX trader workstations / ASX Best terminals 283 277 268 251 243
Hosting
Australian Liquidity Centre cabinets 179 188 219 231 270
Other data centre cabinets 7 8 8 8 11
33

4.3 Equity options1H15 2H15 1H16 2H16 1H17
Trading days 130 124 130 124 129
Single stock equity options (‘000) 58,515 51,031 44,050 44,651 45,241
Index options (‘000) 5,685 5,273 6,201 6,567 5,580
Total contracts (‘000) 64,200 56,304 50,251 51,218 50,821
Average daily options contracts 493,843 454,070 386,549 413,049 393,960
Average fee per options contract $0.20 $0.21 $0.23 $0.23 $0.22
623,855 624,518
485,055 500,287 493,843 454,070 386,549 413,049 393,960
1H13 2H13 1H14 2H14 1H15 2H15 1H16 2H16 1H17
Options average daily contracts
34

4.3 Futures and OTC Markets1H15 2H15 1H16 2H16 1H17
Trading days 130 126 130 127 129
Total contracts - futures ('000)
ASX SPI 200 5,171 5,130 5,919 6,186 6,040
90 day bank bills 13,942 14,764 13,728 15,839 14,061
3 year bonds 24,117 25,600 23,708 26,397 25,431
10 year bonds 13,707 15,791 15,996 20,083 20,038
20 year bonds¹ - - 192 231 336
30 day interbank cash rate 1,169 2,509 1,817 2,295 1,467
Agricultural 88 47 75 57 58
Electricity 130 94 105 152 158
Other 19 88 83 54 52
NZD 90 day bank bills 523 871 898 1,017 690
Total futures 58,866 64,894 62,521 72,311 68,331
351. Introduced 21 September 2015

4.3 Futures and OTC Markets1H15 2H15 1H16 2H16 1H17
Total contracts - options on futures ('000)
ASX SPI 200 313 141 189 174 120
3 year bonds 108 137 137 219 119
Overnight 3 year bonds 496 400 249 330 194
Intra-day 3 year bonds 523 404 329 331 250
Other 39 20 16 17 25
Total options on futures 1,479 1,102 920 1,071 708
Total futures and options on futures contract volume ('000) 60,345 65,996 63,441 73,382 69,039
Daily average contracts - futures and options 464,196 523,776 488,009 577,819 535,185
Average fee per contract - futures and options $1.50 $1.38 $1.44 $1.40 $1.41
OTC markets
Total notional cleared value ($bn)1 $101.671 $704.198 $817.445 $1,924.557 $2,159.682
398,834 509,194
453,007 469,548 464,196 523,776 488,009
577,819 535,185
1H13 2H13 1H14 2H14 1H15 2H15 1H16 2H16 1H17
Futures and options average daily contracts
1. Cleared notional value is double-sided36

4.3 Austraclear1H15 2H15 1H16 2H16 1H17
Settlement days 130 124 130 124 129
Transactions ('000)
Cash transfers 299 303 300 290 292
Fixed interest securities 379 395 363 354 367
Discount securities 80 77 75 75 74
Foreign exchange 11 11 6 5 4
Other 5 4 2 0 1
Total transactions 774 790 746 724 738
Average daily settlement volume 5,956 6,366 5,736 5,838 5,724
Securities holdings (monthly average $bn) $1,620.9 $1,722.2 $1,828.2 $1,887.1 $1,930.5
Securities holdings (period end $bn) $1,692.8 $1,752.5 $1,849.0 $1,895.6 $1,947.3
Average settlement and depository fee (including portfolio holdings)per transaction (excludes registry services revenue) $14.77 $14.98 $15.62 $16.39 $16.74
6,005 6,432 6,287 6,310 5,956 6,366 5,736 5,838 5,724
1H13 2H13 1H14 2H14 1H15 2H15 1H16 2H16 1H17
Austraclear average daily settlement volume
37

4.4 CCP participant collateral balances1H15
$million2H15
$million1H16
$million2H16
$million1H17
$million
Balances at period end
ASX Clear – initial margins 450.5 673.7 583.5 815.7 445.5
ASX Clear (Futures) – initial margins House 727.3 746.0 853.3 1,293.7 1,425.8
ASX Clear (Futures) – initial margins Client 2,407.1 2,067.7 2,495.7 3,278.6 3,728.0
ASX Clear (Futures) – additional and excess 212.5 198.8 176.0 500.2 188.4
Total margins held on balance sheet (excluding commitments) 3,797.4 3,686.2 4,108.5 5,888.2 5,787.7
Average daily margin balance during the period (excluding commitments) 3,571.1 3,915.5 4,136.0 4,509.6 5,370.8
ASX Clear – guarantees and equity collateral held off balance sheet 3,901.8 3,641.2 3,508.5 3,400.3 3,758.5
3.4 3.7 3.9 3.8 3.8 3.7 4.1
5.9 5.8
1H13 2H13 1H14 2H14 1H15 2H15 1H16 2H16 1H17
Total margins held on balance sheet ($bn) (at period end)
38

5. Free cash flow summary1H15
$million2H15
$million1H16
$million2H16
$million1H17
$million
ASX Group cash
Total cash and short-term investments 5,027.3 4,879.0 5,356.3 7,072.8 7,002.2
Less participants’ margins and commitments – cash backed (3,997.4) (3,886.2) (4,308.5) (6,088.2) (5,987.7)
ASX Group own cash reserves 1,029.9 992.8 1,047.8 984.6 1,014.5
Less specific own cash allocations (768.3) (768.3) (768.3) (768.3) (768.3)
Available free cash 261.6 224.5 279.5 216.3 246.2
Free cash flow
Free cash flow at period open 261.2 261.6 224.5 279.5 216.3
Add:
Cash generated from business activities (including changes in fair value) 257.6 166.5 262.9 177.3 273.6
Less:
Cash used for payment of dividends (173.9) (178.5) (183.9) (191.7) (191.5)
Cash used for other non current assets (16.4) (25.1) (24.0) (24.4) (36.0)
Payments for investments (66.9) - - (24.4) (16.2)
Free cash flow at period end 261.6 224.5 279.5 216.3 246.2
39

6. Capital attribution
31 Dec 14$million
30 Jun 15$million
31 Dec 15$million
30 Jun 16$million
31 Dec 16$million
ASX Group shareholders’ equity 3,751.9 3,759.7 3,787.2 3,824.1 3,874.1
Capital attribution
ASX Clear – default fund contributed by ASX (held in ASX Clear) 250.0 250.0 250.0 250.0 250.0
ASX Clear (Futures) – default fund contributed by ASX (held in ASX Clear (Futures)) 450.0 450.0 450.0 450.0 450.0
Business risk capital – ASX Clear and ASX Clear (Futures) 75.0 75.0 75.0 75.0 75.0
Business risk capital – ASX Settlement and Austraclear 161.0 165.8 169.2 170.6 174.3
Operational, fixed assets and investment risk 156.0 172.1 170.0 206.1 223.8
Total capital attribution 1,092.0 1,112.9 1,114.2 1,151.7 1,173.1
Total paid in clearing default fund
ASX Clear 250.0 250.0 250.0 250.0 250.0
ASX Clear (Futures) 650.0 650.0 650.0 650.0 650.0
40

7. Cash market clearing and settlement income statementCash
market clearing
1H17$million
Cashmarket
clearing1H16
$million
Cashmarket
settlement1H17
$million
Cashmarket
settlement1H16
$million
Operating revenue 26.9 27.3 26.5 24.1
Operating expenses 5.9 5.7 7.1 6.9
EBITDA 21.0 21.6 19.4 17.2
Depreciation and amortisation 1.0 1.0 0.1 0.1
EBIT 20.0 20.6 19.3 17.1
Interest income 1.6 2.0 0.9 1.2
Profit before tax 21.6 22.6 20.2 18.3
Income tax expense (6.5) (6.8) (6.1) (5.5)
Profit after tax 15.1 15.8 14.1 12.8
Economic profit after capital charge 4.4 5.8 7.4 6.0
EBITDA margin 78.1% 79.1% 73.1% 71.5%
Total capital 238.1 218.1 143.9 143.2
Return on equity (per annum) 12.6% 14.4% 19.5% 17.8%
41

8. Post balance date activity levels
42
1 Jan – 14 Feb 2017
1 Jan – 14 Feb 2016 Variance %
Listings and Issuer Services (January month only)
Initial capital raised ($million) 99 37 168%
Secondary capital raised including scrip-for-scrip ($million) 754 292 158%
Total capital raised ($million) 853 329 160%
Derivatives and OTC Markets
Futures average daily volume (number of contracts) 406,600 503,126 (19.2%)
Equity options average daily volume (number of contracts) 351,299 350,113 0.3%
OTC clearing cleared notional value ($billion) 625.809 296.790 110.9%
Cash Market Trading
ASX on-market average daily value ($million) 3.781 4.045 (6.5%)

Disclaimer
The material contained in this document is a presentation of general information about the ASX Group’s activities current as at thedate of this presentation (17 February 2017). It is provided in summary and does not purport to be complete. You should not relyupon it as advice for investment purposes, as it does not take into account your investment objectives, financial position or needs.These factors should be considered, with or without professional advice, when deciding if an investment is appropriate.
To the extent permitted by law, no responsibility for any loss arising in any way (including by way of negligence) from anyone actingor refraining from acting as a result of this material is accepted by the ASX Group, including any of its related bodies corporate.
This document may contain forward-looking statements with respect to the financial condition, results of operations, and businessstrategy of the ASX Group. These forward-looking statements are based on estimates, projections and assumptions made by the ASXGroup about circumstances and events that have not yet taken place. Although the ASX Group believes the forward-lookingstatements to be reasonable, they are not certain. Forward-looking statements involve known and unknown risks, uncertainties andother factors that are in some cases beyond the ASX Group’s control, and which may cause actual results, performance orachievements to differ materially from those expressed or implied by the forward-looking statements (and from past results). TheASX Group makes no representation or warranty as to the accuracy of any forward-looking statements in this document and unduereliance should not be placed upon such statements.
Forward-looking statements may be identified by words such as “aim”, “anticipate”, “assume”, “continue”, “could”, “estimate”,“expect”, “intend”, “may”, “plan”, “predict”, “should”, “will”, or “would” or the negative of such terms or other similar expressionsthat are predictions of or otherwise indicate future events or trends.
The forward-looking statements included in this document speak only as of the date of this document. The ASX Group does notintend to update the forward-looking statements in this document in the future.
43