Embed Size (px)
Citation preview

Haldimand County | 2018 Community Profile
2017
`
Community Profile 2018
Haldimand County

Haldimand County | 2018 Community Profile
V 1.0 August 2017
© 2017 Haldimand County Updated March 28, 2018
Information in this document is subject to change without notice. Although all data is believed to be the most accurate and up-to-date, the reader is advised to verify all data before making any
decisions based upon the information contained in this document.
For further information, please contact:
Lidy Romanuk B.A., EcD. CEcD. Manager, Economic Development & Tourism Economic Development & Tourism Division
Haldimand County
Cayuga Administration Building 45 Munsee St N, Cayuga, ON N0A 1E0
Tel: 905-318-5932 x6342
Or 1-800-863-9607 Fax: 905-772-3542
www.HaldimandCounty.on.ca
Community Profile 2013

Haldimand County | 2018 Community Profile
Table of Contents DATA SOURCES ...................................................................................................................... 1
INTRODUCTION ....................................................................................................................... 2 Location ........................................................................................................................... 3 Climate ............................................................................................................................ 4
DEMOGRAPHICS ..................................................................................................................... 5 Population Size and Growth ............................................................................................ 5 Age Profile ....................................................................................................................... 6 Income ............................................................................................................................. 8 Mobility Characteristics ................................................................................................. 11 Language Characteristics ............................................................................................. 12 Level of Education ......................................................................................................... 13
LABOUR FORCE .................................................................................................................... 15 Key Indicators ................................................................................................................ 15 Labour Force by Occupation ......................................................................................... 16 Labour Force by Industry .............................................................................................. 17 General Wages by Occupation ..................................................................................... 18 Largest Employers ........................................................................................................ 19 Place of Work ................................................................................................................ 20
TRANSPORTATION AND SHIPPING .................................................................................... 22 Highways ....................................................................................................................... 22
5.1.1 Average Annual Daily Traffic (AADT) ........................................................................................................ 22 5.1.2 Market Access .......................................................................................................................................... 23
Rail Services ................................................................................................................. 24 Airports .......................................................................................................................... 25 Ports .............................................................................................................................. 25
TAXES AND UTILITIES .......................................................................................................... 26 Local Property Tax Rates .............................................................................................. 26 Federal and Provincial Income Tax Rates .................................................................... 26 Water/Wastewater and Waste Management ................................................................ 28 Electricity ....................................................................................................................... 29 Natural Gas ................................................................................................................... 30
LAND, PLANNING AND DEVELOPMENT ............................................................................. 31 Industrial and Commercial Land and Buildings ............................................................. 31 Building and Planning Fees .......................................................................................... 31 Development Charges and Fees .................................................................................. 32
BUSINESS SUPPORT PROGRAMS AND SERVICES .......................................................... 33 National and Provincial Support .................................................................................... 33 Local/Regional Support ................................................................................................. 34 Community Improvement Plan (CIP) Programs ............................................................ 35 Real Estate .................................................................................................................... 35 Financial Agencies ........................................................................................................ 36 Education and Training ................................................................................................. 37
QUALITY OF LIFE .................................................................................................................. 38 Housing Characteristics ............................................................................................... 39 Social and Community Services ................................................................................... 40 Elementary and Secondary Education .......................................................................... 41 Recreational Facilities ................................................................................................... 42 Events ........................................................................................................................... 43 Local Media ................................................................................................................... 44 Communications Infrastructure ..................................................................................... 45
APPENDIX – PROVINCIAL AND FEDERAL INCENTIVES ......................................................... 46

Haldimand County | 2018 Community Profile
List of Tables
Table 1: Average Climate Data for Haldimand County (°C), 1961-1990 ................... 4
Table 2: Census Population Change .................................................................................................. 5
Table 3: Age Distribution, 2017 .............................................................................................................. 7
Table 4: Total Individual Income Levels, 2016 ............................................................................. 9
Table 5: Family Income Levels, 2016 ................................................................................................. 9
Table 6: Household Income Levels, 2016 ..................................................................................... 10
Table 7: Mobility Rates, 2017................................................................................................................. 11
Table 8: Knowledge of Official Languages, 2017 ..................................................................... 12
Table 9: Most Common Non-Official Languages Spoken, 2017 .................................... 12
Table 10: Educational Attainment, 2017 ........................................................................................... 13
Table 11: Major Field of Study, Population Aged 15 Years or Older, 2017 .............. 14
Table 12: Labour Force Characteristics, 2017 .............................................................................. 15
Table 13: Labour Force by Occupation, 2017 ............................................................................... 16
Table 14: Labour Force by Industry, 2017 ....................................................................................... 17
Table 15: General Wages by Occupation......................................................................................... 18
Table 16: Largest Private Sector Employers .................................................................................. 19
Table 17: Largest Public-Sector Employers.................................................................................... 19
Table 18: Where the Haldimand Resident Labour Force Works, 2011 ....................... 20
Table 19: Place of Residence for Persons Working in Haldimand, 2011 ................... 21
Table 20: Distance to Urban Centres .................................................................................................. 23
Table 21: Distance to Major US Border Crossings .................................................................... 23
Table 22: Regional Airports ........................................................................................................................ 25
Table 23: Regional Ports .............................................................................................................................. 25
Table 24: Local Property Tax Rates, 2017 ...................................................................................... 26
Table 25: Corporate Taxes – General Corporation (2017 – 2018) ................................. 26
Table 26: Corporate Taxes – Canadian Controlled (2017 – 2018) ................................. 26
Table 27: Sales Tax, 2017 .......................................................................................................................... 27
Table 28: Combined Federal and Ontario Personal Income Tax, 2017 ...................... 27
Table 29: Average Customer Impacts, Water and Wastewater 2017 ........................... 28
Table 30: Landfill Information .................................................................................................................... 28
Table 31: Natural Gas Rates for Industrial and Commercial Users ............................... 30
Table 32: Building and Planning Fees, 2017 ................................................................................. 31
Table 33: Area Specific Development Charge, Effective May 2017 .............................. 32
Table 34: Business Support Programs ............................................................................................... 33
Table 35: Local Business Support ......................................................................................................... 34
Table 36: Dwelling Characteristics, 2017 ......................................................................................... 39
Table 37: Social and Community Services ...................................................................................... 40
Table 38: Primary and Secondary Schools ..................................................................................... 41
Table 39: Radio .................................................................................................................................................. 44
Table 40: Television ........................................................................................................................................ 44
Table 41: Print ..................................................................................................................................................... 44
Table 42: Communications Infrastructure......................................................................................... 45

Haldimand County | 2018 Community Profile
List of Figures Figure 1: Haldimand Location Map....................................................................................................... 3
Figure 2: 2016 Temperature departures from the 1961-1990 average ..................... 4
Figure 3: Changes in Census Population Age Profile, 2006 to 2016 ............................ 5
Figure 4: Age Distribution Chart, 2017 ............................................................................................... 6
Figure 5: Rosa Flora, Dunnville .............................................................................................................. 7
Figure 6: Battlefield International, Cayuga ......................................................... 8 Figure 7: Total Individual Income Levels, 2016 ........................................................................... 8
Figure 8: Agricultural Landscape, Haldimand County ........................................ 9 Figure 9: Income Distribution of Private Households, 2016 .............................................. 10
Figure 10: Knowledge of Official Languages, 2017 ................................................................... 12
Figure 11: Educational Attainment, Age Group 25-64, 2017 .............................................. 13
Figure 12: Major Field of Study, Population Aged 15 Years or Older, 2017 ............ 14
Figure 13: Hewitt’s Dairy, Hagersville ................................................................ 15 Figure 14: Labour Force by Occupation, 2017 ............................................................................. 16
Figure 15: Imperial Oil, Nanticoke ...................................................................... 21 Figure 16: Hewitt’s Dairy, Hagersville ................................................................................................. 21
Figure 17: CGC Inc., Hagersville ....................................................................... 32 Figure 18: From left to right: Haldimand County, Port Maitland, and Caledonia 38 Figure 19: Caledonia pool, Haldimand County .................................................. 39 Figure 20: Caledonia Fair, Haldimand County ................................................... 43

Haldimand County | 2018 Community Profile
BusinessHaldimand.ca

Haldimand County | 2018 Community Profile
BusinessHaldimand.ca

Haldimand County | 2018 Community Profile
BusinessHaldimand.ca

Haldimand County | 2018 Community Profile
HaldimandCounty.ca Page 1
Data Sources Please note that every effort has been made to use the most current data available. The major sources of information for this document are:
The 2006, 2011, and 2016 Census from Statistics Canada
SuperDemographics 2017 from Manifold Data Mining Inc. The most recent Census was conducted in May 2016. Statistics Canada has indicated that all the 2016 census results will be released before the end of 2017. SuperDemographics 2017 is the most up to date estimation of population characteristics, based on mathematical models that draw from various data sources. Manifold Projection Method: Manifold SuperDemographics estimates demographic data annually, including population projections for 5 and 10 years in the future. Manifold methodologies are based on the following techniques:
Enhanced cohort survival methods
Nearest neighborhood and regression techniques
Structural coherence techniques
Manifold Data Sources include:
Statistics Canada Real Estate Boards/Companies
Health Canada Canadian Bankers Association
Regional Health Ministries Bank of Canada
Citizenship and Immigration Canada Canada Post Corporation
Regional School Boards Consumer and business directories and books
Brisc International Inc. Publication of hospitals, CMHC, BBM and partners
Flyer Distribution Association Proprietary survey and research

Haldimand County | 2018 Community Profile
HaldimandCounty.ca Page 2
Introduction
Located within Ontario’s most populous region,
Haldimand County is the perfect choice to locate your business. Within the Greater Golden Horseshoe, Haldimand is a 1 to 2 hours drive to major cities like Hamilton, Toronto, and Buffalo (New York), making us centrally located for access to key markets. Situated between the City of Hamilton and Niagara Region, Haldimand benefits from the low cost of living and reasonably priced industrial lands.
A tactical location and employment area.
Haldimand County is within a day’s drive of 130 million people. Local highways provide easy access to Ontario’s transportation networks, including the 400 series highways. Hamilton International Airport is a 10-minute drive from the north border of the County and Toronto’s Pearson International Airport is 90 minutes away. Existing rail spurs add to the infrastructure with potential seaway access.
Key Economic Sectors:
Tourism; Food and beverage stores, Accommodation and food services, Retail
Manufacturing; Petroleum, and Primary metal manufacturing
Agri-food processing; Poultry & egg production, Food manufacturing, and Animal & crop production
To find out more about Economic Development opportunities in Haldimand County, please see BusinessHaldimand.ca or contact the Economic Development Office. [email protected] 1-800-863-9607 Haldimand County Economic Development and Tourism Division 45 Munsee Street North P.O. Box 400 Cayuga, ON N0A 1E0

Haldimand County | 2018 Community Profile
HaldimandCounty.ca Page 3
Location
Haldimand County enjoys a central location with first-class access to vast North American markets. Within its borders, the County includes Highway 3, Highway 6, and Highway 54, with the latter two connecting to the 400 series highways and providing strong east-west and north-south access across the province and into the United States. Figure 1: Haldimand Location Map
Source: Haldimand County, 2017
Haldimand County

Haldimand County | 2018 Community Profile
HaldimandCounty.ca Page 4
Climate
Table 1 illustrates precipitation levels, average and extreme temperatures for 1961-1990. These are baseline, historic averages, used in analysis by Environment Canada to show warming trends on a year by year basis.
Table 1: Historic Average Climate Data for Haldimand County (°C), 1961-1990
Temp. (°C) Jan Feb Mar Apr May Jun Jul Aug Sep Oct Nov Dec
Daily Average
-5.1 -4.4 0.6 6.9 13.1 18.7 21.9 20.8 16.6 10.3 4.5 -1.9
Daily Maximum
-1.3 -0.4 4.6 11.6 18.4 24.1 27.2 25.8 21.5 14.8 8.1 1.5
Daily Minimum
-9 -8.4 -3.5 2.1 7.8 13.2 16.5 15.7 11.8 5.8 0.9 -5.3
Extreme Maximum
14.4 16.7 25 31 35 36.5 38.8 37.8 37.8 32.2 26.1 21.2
Extreme Minimum
-28.3 -26.2 -21.7 -12.2 -2 2.2 7.2 3.6 -0.7 -6.1 -14.4 -25.7
Precipitation (mm)
58.7 54.8 73.3 71.4 71.2 72 72.4 90.3 78.4 67 77.2 80.2
Source: Environment Canada, Station. Temperature and Precipitation Graph for 1961 to 1990: http://bit.ly/2uFiZ81
Figure 2 shows warming trends across Canada. The map indicates that in 2016, Haldimand County and Ontario experienced average temperatures that were approximately 1.5° C above the baseline averages (defined as the mean over the 1961-1990 reference period). Figure 2: Temperature departures from the 1961-1990 average - annual 2016
Source: Environment Canada, http://www.ec.gc.ca/sc-cs/default.asp?lang=En&n=439E7F88-1
Haldimand County | 2018 Community Profile
HaldimandCounty.ca Page 5
Demographics
The statistics in this report (Sections 3 and 4) show the most up to date population estimates available provided by Manifold 2017 SuperDemographics. Section 3.1 shows census population, one of many sources for Manifold data.
Population Size and Growth
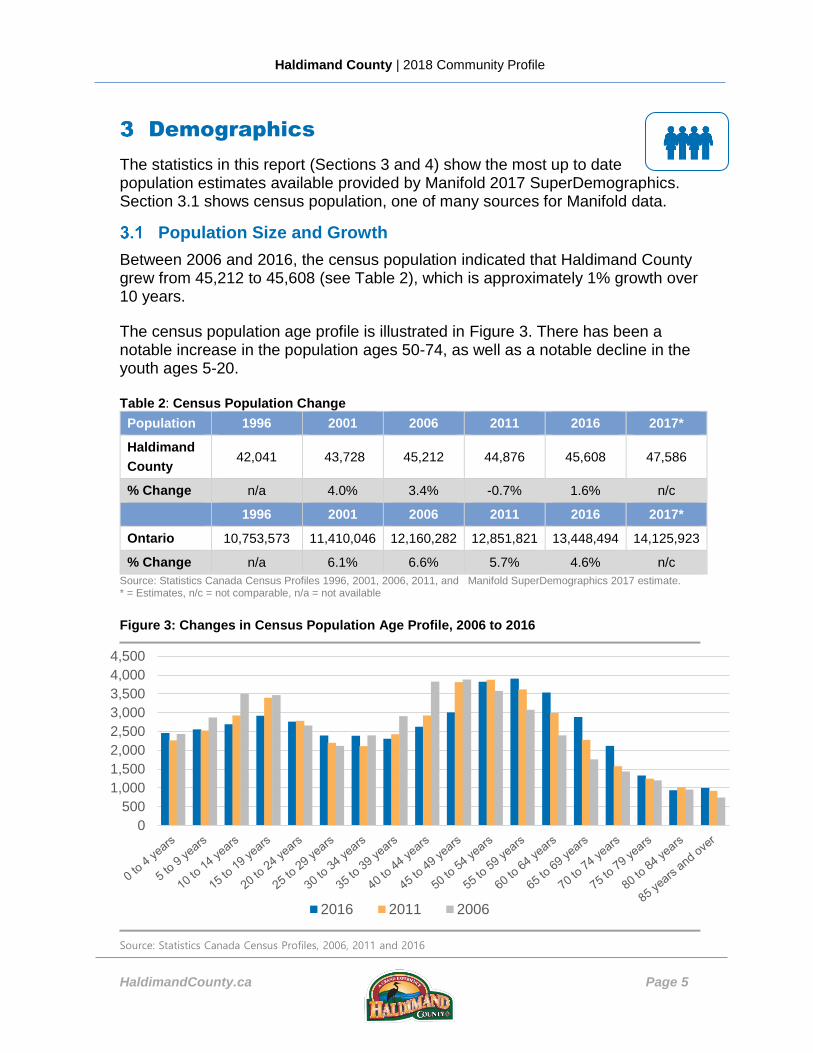
Between 2006 and 2016, the census population indicated that Haldimand County grew from 45,212 to 45,608 (see Table 2), which is approximately 1% growth over 10 years.
The census population age profile is illustrated in Figure 3. There has been a notable increase in the population ages 50-74, as well as a notable decline in the youth ages 5-20. Table 2: Census Population Change
Population 1996 2001 2006 2011 2016 2017*
Haldimand
County 42,041 43,728 45,212 44,876 45,608 47,586
% Change n/a 4.0% 3.4% -0.7% 1.6% n/c
1996 2001 2006 2011 2016 2017*
Ontario 10,753,573 11,410,046 12,160,282 12,851,821 13,448,494 14,125,923
% Change n/a 6.1% 6.6% 5.7% 4.6% n/c
Source: Statistics Canada Census Profiles 1996, 2001, 2006, 2011, and Manifold SuperDemographics 2017 estimate. * = Estimates, n/c = not comparable, n/a = not available
Figure 3: Changes in Census Population Age Profile, 2006 to 2016
Source: Statistics Canada Census Profiles, 2006, 2011 and 2016
0
500
1,000
1,500
2,000
2,500
3,000
3,500
4,000
4,500
2016 2011 2006

Haldimand County | 2018 Community Profile
HaldimandCounty.ca Page 6
Age Profile
In Figure 4, a density chart is used to illustrate the Haldimand County estimated 2017 population by age, compared to that of Ontario. The County has a slightly lower percentage of people ages 0-9 and 25-50 and a large percentage concentrated around ages 50-79. Figure 4: Age Distribution Chart, 2017
Source: McSweeney & Associates from Manifold Data Mining Inc. SuperDemographics 2017.
The median age in the community is estimated to be 44, compared to 42 in Ontario, while the average age was 42, which is the same as the province. Table 3 has 2017 population estimates by age group. It compares the percentage of total population by age group against Ontario.
0.0%1.0%2.0%3.0%4.0%5.0%6.0%7.0%8.0%9.0%
Haldimand C ounty % Ontario %

Haldimand County | 2018 Community Profile
HaldimandCounty.ca Page 7
Table 3: Age Distribution, 2017
Characteristics Haldimand Haldimand Ontario
Total Population 47,586 100.0% 14,125,923
0 to 4 years 2,151 4.5% 5.3%
5 to 9 years 2,318 4.9% 5.4%
10 to 14 years 2,617 5.5% 5.4%
15 to 19 years 2,950 6.2% 5.6%
20 to 24 years 3,444 7.2% 6.4%
25 to 29 years 3,066 6.4% 6.5%
30 to 34 years 2,419 5.1% 6.2%
35 to 39 years 2,246 4.7% 6.2%
40 to 44 years 2,429 5.1% 6.4%
45 to 49 years 2,965 6.2% 6.9%
50 to 54 years 3,794 8.0% 7.7%
55 to 59 years 4,040 8.5% 7.6%
60 to 64 years 3,751 7.9% 6.6%
65 to 69 years 3,069 6.4% 5.6%
70 to 74 years 2,423 5.1% 4.3%
75 to 79 years 1,577 3.3% 3.1%
80 to 84 years 1,085 2.3% 2.2%
85 years and over 1,242 2.6% 2.3%
Source: McSweeney & Associates from Manifold Data Mining Inc. SuperDemographics 2017.
Figure 5: Rosa Flora, Dunnville

Haldimand County | 2018 Community Profile
HaldimandCounty.ca Page 8
Income
Figure 7 illustrates the individual income distribution in Haldimand County. Over 50% of the population earns $40,000 per year or less. 25% of the population earns an income between $20,000 - $39,999 annually. Table 4 (following page) shows a breakdown of the percentage population by total individual income segment. The most common income level (attained by 12.4% of residents in the County) is $20,000 - $29,000. Figure 7: Total Individual Income Levels1, 20162
Source: McSweeney & Associates from Manifold Data Mining Inc. SuperDemographics 2017 *(2016 incomes).
1 Total of income from all sources, including employment income, income from government programs, pension income,
investment income and any other money income 2 Please note that the 2017 Manifold data uses 2016 income data, as it is the most recent information available.
0.0%
2.0%
4.0%
6.0%
8.0%
10.0%
12.0%
14.0%Haldimand County %
Ontario%
Figure 6: Battlefield International, Cayuga

Haldimand County | 2018 Community Profile
HaldimandCounty.ca Page 9
Table 4: Total Individual Income Levels, 2016
Characteristic Haldimand Haldimand Ontario
Population 15 years and over 40,500 100.0% 100.0%
Without income 2,024 5.0% 5.3%
With income 38,475 95.0% 94.7%
Under $5,000 3,455 8.5% 9.5%
$5,000 to $9,999 2,979 7.4% 7.0%
$10,000 to $14,999 3,249 8.0% 8.1%
$15,000 to $19,999 3,406 8.4% 8.4%
$20,000 to $29,999 5,034 12.4% 12.4%
$30,000 to $39,999 4,851 12.0% 10.9%
$40,000 to $49,999 4,005 9.9% 9.4%
$50,000 to $59,999 2,890 7.1% 7.5%
$60,000 to $79,999 3,772 9.3% 9.0%
$80,000 to $99,999 2,658 6.6% 5.8%
$100,000 to $124,999 2,175 5.4% 3.2%
$125,000 and over 1,307 3.2% 3.4%
Median total income $ $35,029 $34,243
Average total income $ $45,343 $49,938 Source: McSweeney & Associates from Manifold Data Mining Inc. SuperDemographics 2017 *(2016 incomes).
The median individual income in Haldimand is slightly higher than Ontario. The average individual income is slightly lower than in Ontario. In 2016, Haldimand had a slightly lower median Economic Family Income3 (by less than 1%) than Ontario (Table 5). The average Family Income in Haldimand however, was 12% lower than the province. Table 5: Family Income Levels, 2016
Characteristic Haldimand Ontario
Total number of economic families 14,300 4,167,857
Median family income $ $96,940 $97,218
Average family income $ $108,592 $121,508 Source: McSweeney & Associates from Manifold Data Mining Inc. SuperDemographics 2017 (2016 incomes)
3 Economic family income - The total income of an economic family is the sum of the total incomes of all members of that Family. Economic Family is defined as: a group of two or more persons who live in the same dwelling and are related to each other by blood, marriage, common-law union, adoption or a foster relationship. A couple may be of opposite or same sex.
Figure 8 Agricultural Landscape, Haldimand County

Haldimand County | 2018 Community Profile
HaldimandCounty.ca Page 10
Table 6 shows Haldimand County’s 2016 average Household Income4 was lower than that of Ontario. The largest household income segment in Haldimand County is $60,000 to $79,999 annually.
Table 6: Household Income Levels, 2016
Characteristic Haldimand Haldimand Ontario
Total number of private households 18,339 100.0% 100.0%
Under $5,000 311 1.7% 2.3%
$5,000 to $9,999 262 1.4% 1.9%
$10,000 to $14,999 359 2.0% 2.9%
$15,000 to $19,999 645 3.5% 4.4%
$20,000 to $29,999 1,260 6.9% 7.4%
$30,000 to $39,999 1,533 8.4% 8.3%
$40,000 to $49,999 1,559 8.5% 8.7%
$50,000 to $59,999 1,807 9.9% 8.9%
$60,000 to $79,999 2,424 13.2% 12.8%
$80,000 to $99,999 2,499 13.6% 11.8%
$100,000 to $124,999 2,356 12.8% 11.1%
$125,000 to $149,999 1,664 9.1% 7.9%
$150,000 and over 1,659 9.0% 11.6%
Median household income $ $73,539 $74,648
Average household income $ $93,710 $99,778 Source: McSweeney & Associates from Manifold Data Mining Inc. SuperDemographics 2017 (2016 incomes).
Figure 9 illustrates the distribution of household incomes for Haldimand and Ontario. More than half of the households earn over $60,000 annually. Figure 9: Income Distribution of Private Households, 2016
Source: McSweeney & Associates from Manifold Data Mining Inc. SuperDemographics 2017 (2016 incomes).
4 Household income - The total income of a household is the sum of the total incomes of all members of that household. Household refers to a person or group of persons who occupy the same dwelling and do not have a usual place of residence elsewhere in Canada or abroad. The household may consist of: a family group such as a census family, two or more families sharing a dwelling, a group of unrelated persons, or a person living alone.
0.0%2.0%4.0%6.0%8.0%
10.0%12.0%14.0%16.0%
Haldimand County % Ontario %

Haldimand County | 2018 Community Profile
HaldimandCounty.ca Page 11
Mobility Characteristics
The mobility statistics describe the relationship between a person's usual place of residence on Census Day, and his or her usual place of residence one or five years earlier. A person is classified as a non-mover if no difference exists between their current and previous address. Otherwise, a person is classified as a mover and this categorization is called Mobility status (e.g. 1 year ago).
Haldimand County had more “migrants” (movers residing in a different census subdivision (CSD) one year earlier) (4.1%) compared to non-migrant movers (3.5%). Those indicating Haldimand County in their new living address are most likely relocating from within the province, rather than outside of Ontario or Canada.
Table 7: Mobility Rates, 2017
Characteristics Haldimand Haldimand Ontario
Mobility status – place of residence year ago
Total population 47,586 100.0% 100.0%
Non-movers5 43,995 92.5% 87.9%
Movers6 3,591 7.5% 12.1%
Non-migrants7 1,659 3.5% 7.1%
Migrants8 1,932 4.1% 5.0%
Internal migrants 1,879 3.9% 4.0%
Intra-provincial migrants 1,808 3.8% 3.6%
Interprovincial migrants 71 0.1% 0.5%
External migrants 53 0.1% 1.0%
Mobility status – place of residence status five years ago
Total population 47,586 100.0% 100.0%
Non-movers 35,807 75.2% 61.1%
Movers 11,779 24.8% 38.9%
Non-migrants 5,844 12.3% 21.5%
Migrants 5,935 12.5% 17.4%
Internal migrants 5,806 12.2% 13.4%
Intra-provincial migrants 5,356 11.3% 11.8%
Interprovincial migrants 450 0.9% 1.5%
External migrants 129 0.3% 4.1% Source: McSweeney & Associates from Manifold Data Mining Inc. SuperDemographics 2017.
5 Non-movers are persons who, on Census Day, were living at the same address as the one at which they resided one year earlier. 6 Movers are persons who, on Census Day, were living at a different address from the one at which they resided one year earlier. 7 Non-migrants are movers who, on Census Day, were living at a different address, but in the same census subdivision (CSD) as the one they lived in one year earlier. 8 Migrants are movers who, on Census Day, were residing in a different CSD one year earlier (internal migrants) or who were living outside Canada one year earlier (external migrants).

Haldimand County | 2018 Community Profile
HaldimandCounty.ca Page 12
Language Characteristics
Table 8 and Figure 10 illustrate knowledge of Canada’s official languages. At least 96% of the Haldimand County resident’s primary language is English, which is above the provincial figure. Knowledge of French and English is less common in Haldimand County compared to the province (3.0% of residents vs. 11.0% in Ontario). Table 8: Knowledge of Official Languages, 2017
Characteristics Haldimand Haldimand Ontario
Total population 47,586 100.0% 100.0%
English 46,062 96.8% 86.4%
French 21 0.0% 0.3%
English and French 1,434 3.0% 11.0%
Neither English nor French 69 0.1% 2.3%
Source: McSweeney & Associates from Manifold Data Mining Inc. SuperDemographics 2017.
Figure 10: Knowledge of Official Languages, 2017
Source: McSweeney & Associates from Manifold Data Mining Inc. SuperDemographics 2017.
Table 9 illustrates the most common languages outside of the official languages. No single aboriginal language is commonly spoken, however aboriginal languages as a whole represent a significant subset of the population. Table 9: Most Common Non-Official Languages Spoken, 2017
Characteristics Haldimand Haldimand %
Total population 47,586 100.0%
Dutch 920 1.9%
German 358 0.8%
Italian 280 0.6%
Portuguese 259 0.5%
Spanish 187 0.4%
Polish 173 0.4%
Korean 108 0.2%
Aboriginal Languages 78 0.2%
Source: McSweeney & Associates from Manifold Data Mining Inc. SuperDemographics 2017.
Haldimand County Languages
English
French
English and French
Neither English nor French

Haldimand County | 2018 Community Profile
HaldimandCounty.ca Page 13
Level of Education
Figure 11 and Table 10 illustrate educational attainment for residents ages 25 to 64. Approximately 30% obtained just a high school diploma, while over 50% reached post-secondary education. University level was reached by approximately 14% of the population, of which 7.6% corresponds to education at the Bachelor level. Figure 11: Educational Attainment, Age Group 25-64, 2017
Source: McSweeney & Associates from Manifold Data Mining Inc. SuperDemographics 2017.
Table 10: Educational Attainment, 2017
Characteristics9 Haldimand Haldimand Ontario
Total population 25 to 64 years 24,710 100.0% 100.0%
No certificate, diploma, or degree 3,165 12.8% 11.5%
Certificate, diploma, or degree 21,545 87.2% 88.5%
High school certificate or equivalent 7,486 30.3% 24.1%
Postsecondary certificate, diploma, or degree 14,059 56.9% 64.4%
Apprenticeship or trades certificate or diploma 3,404 13.8% 7.5%
College, or other non-university certificate or diploma 7,272 29.4% 23.7%
University certificate, diploma, or degree 3,383 13.7% 33.1%
University certificate or diploma below bachelor level 580 2.3% 4.4%
University certificate or degree 2,803 11.3% 28.7%
Bachelor's degree 1,872 7.6% 17.7%
University certificate or diploma above bachelor level 931 3.8% 11.1% Source: McSweeney & Associates from Manifold Data Mining Inc. SuperDemographics 2017.
9 By highest certificate, diploma or degree obtained may not add up to 100% due to nested categories.
0% 5% 10% 15% 20% 25% 30% 35%
No certificate, diploma or degree
High school certificate or equivalent
Apprenticeship or trades certificate ordiploma
College, CEGEP or other non-universitycertificate or diploma
University certificate, diploma or degree
Haldimand County | 2018 Community Profile
HaldimandCounty.ca Page 14
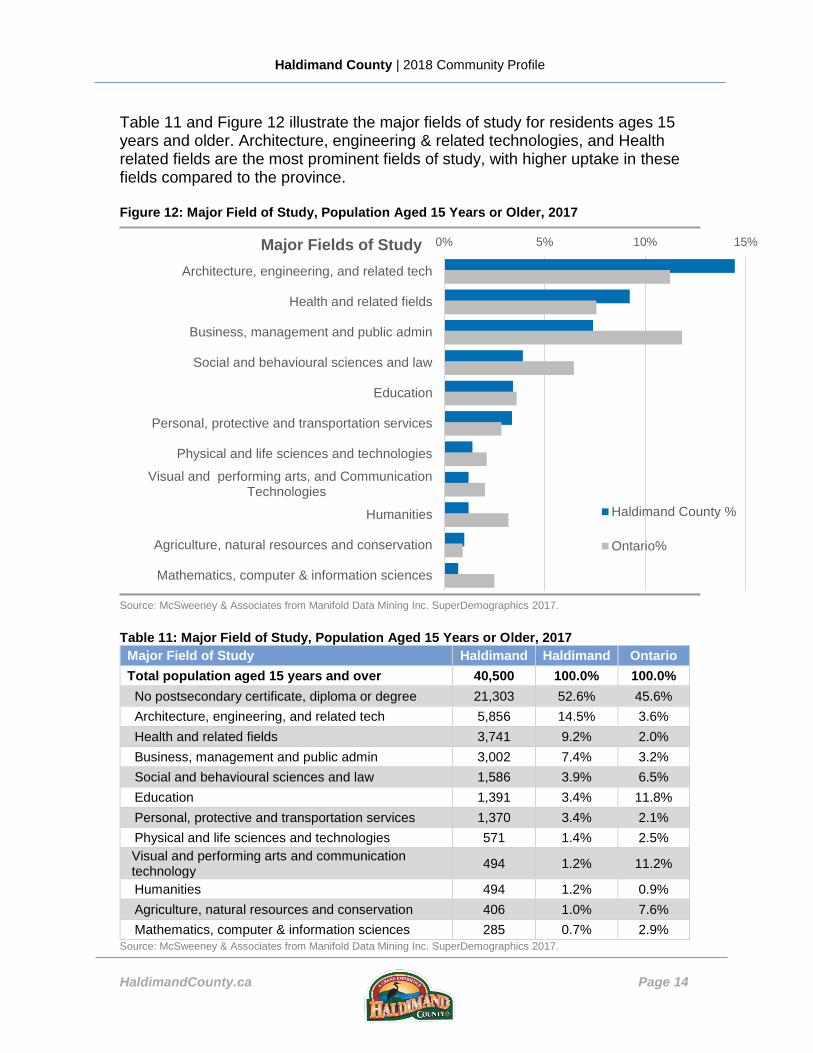
Table 11 and Figure 12 illustrate the major fields of study for residents ages 15 years and older. Architecture, engineering & related technologies, and Health related fields are the most prominent fields of study, with higher uptake in these fields compared to the province. Figure 12: Major Field of Study, Population Aged 15 Years or Older, 2017
Source: McSweeney & Associates from Manifold Data Mining Inc. SuperDemographics 2017.
Table 11: Major Field of Study, Population Aged 15 Years or Older, 2017
Major Field of Study Haldimand Haldimand Ontario
Total population aged 15 years and over 40,500 100.0% 100.0%
No postsecondary certificate, diploma or degree 21,303 52.6% 45.6%
Architecture, engineering, and related tech 5,856 14.5% 3.6%
Health and related fields 3,741 9.2% 2.0%
Business, management and public admin 3,002 7.4% 3.2%
Social and behavioural sciences and law 1,586 3.9% 6.5%
Education 1,391 3.4% 11.8%
Personal, protective and transportation services 1,370 3.4% 2.1%
Physical and life sciences and technologies 571 1.4% 2.5%
Visual and performing arts and communication technology
494 1.2% 11.2%
Humanities 494 1.2% 0.9%
Agriculture, natural resources and conservation 406 1.0% 7.6%
Mathematics, computer & information sciences 285 0.7% 2.9%
Source: McSweeney & Associates from Manifold Data Mining Inc. SuperDemographics 2017.
0% 5% 10% 15%
Architecture, engineering, and related tech
Health and related fields
Business, management and public admin
Social and behavioural sciences and law
Education
Personal, protective and transportation services
Physical and life sciences and technologies
Visual and performing arts, and CommunicationTechnologies
Humanities
Agriculture, natural resources and conservation
Mathematics, computer & information sciences
Major Fields of Study
Haldimand County %
Ontario%

Haldimand County | 2018 Community Profile
HaldimandCounty.ca Page 15
Labour Force
Key Indicators
Haldimand County is home to a labour force of more than 27,000 persons. As illustrated in Table 12, the labour force participation and employment rates are above that of Ontario. The unemployment rate is lower than that of the province.
Table 12: Labour Force Characteristics, 2017
Characteristic Haldimand Ontario
Total population aged 15 years and older 40,500 11,839,798
In the labour force10 27,181 7,801,243
Employed 25,609 7,263,691
Unemployed 1,572 537,552
Not in the labour force 13,318 4,038,555
Participation rate % 67.11 65.89
Employment rate % 63.23 61.35
Unemployment rate % 5.78 6.89 Source: McSweeney & Associates from Manifold Data Mining Inc. SuperDemographics 2017.
10 Labour force - Refers to persons who were either employed or unemployed. Unemployed - Refers to persons 15 years and over, excluding institutional residents, who, during the week (Sunday to Saturday) prior to Census Day, were without paid work or without self-employment work and were available for work and either: (a) had actively looked for paid work in the past four weeks; (b) were on temporary lay-off and expected to return to their job; (c) had definite arrangements to start a new job in four weeks or less.
Figure 13: Hewitt’s Dairy, Hagersville

Haldimand County | 2018 Community Profile
HaldimandCounty.ca Page 16
Labour Force by Occupation
Figure 14 and Table 13 illustrate Haldimand County`s labour force make up by occupation: Trades, transport and equipment operators and related jobs represent the largest occupational group (24%) in the community.
Figure 14: Labour Force by Occupation11, 2017
Source: McSweeney & Associates from Manifold Data Mining Inc. SuperDemographics 2017.
Table 13: Labour Force by Occupation, 2017
Characteristic Haldimand Haldiman
d Ontario
Total labour force 15 years and over 27,181 100.0% 100.0%
Occupation - Not applicable 484 1.8% 2.7%
All occupations 26,698 98.2% 97.3%
Trades, transport, and equipment operators and related
6,548 24.1% 12.6%
Sales and service occupations 5,065 18.6% 22.4%
Business, finance and administration occupations 3,578 13.2% 16.7%
Management occupations 2,636 9.7% 11.3%
Occupations in education, law and social, community, and government services
2,550 9.4% 11.7%
Health occupations 1,899 7.0% 5.7%
Occupations in manufacturing and utilities 1,668 6.1% 5.1%
Natural and applied sciences and related occupations 1,157 4.3% 7.3%
Natural resources, agriculture, and related production occupations
1,096 4.0% 1.6%
Occupations in art, culture, recreation, and sport 501 1.8% 3.0%
10Occupation data are produced according to the NOC 2011: http://www.statcan.gc.ca/eng/subjects/standard/noc/2011/index
0% 5% 10% 15% 20% 25%
Trades, transport and equipment operators and related
Sales and service occupations
Business, finance and administration
Management occupations
Education, law and social, community and government services
Health occupations
Occupations in manufacturing and utilities
Natural and applied sciences and related occupations
Natural resources, agriculture and related production
Occupations in art, culture, recreation and sport
Haldimand County % Ontario%

Haldimand County | 2018 Community Profile
HaldimandCounty.ca Page 17
Source: McSweeney & Associates from Manifold Data Mining Inc. SuperDemographics 2017. Labour Force by Industry
As show in Table 14, the largest employing industries, by percentage of the labour force, are manufacturing (16%), healthcare and social assistance (12%), and retail trade (11%). Other important industries in the Haldimand economy which account for larger percentages of the population compared to the same industries in Ontario include construction (10%), transportation and warehousing (6%) and agriculture, forestry, fishing and hunting (6%). Table 14: Labour Force by Industry, 2017
(NAICS code) - Industries 12 Haldimand Haldimand Ontario
Total labour force 15 years and over 27,181 100.0% 100.0%
Industry - not applicable13 484 1.8% 2.7%
All industries 26,698 98.2% 97.3%
31-33 Manufacturing 4,215 15.5% 10.2%
62 Health care and social assistance 3,201 11.8% 10.1%
44-45 Retail trade 2,920 10.7% 10.9%
23 Construction 2,750 10.1% 6.0%
61 Educational services 1,782 6.6% 7.3%
48-49 Transportation and warehousing 1,521 5.6% 4.5%
11 Agriculture, forestry, fishing and hunting 1,514 5.6% 1.5%
72 Accommodation and food services 1,429 5.3% 6.0%
81 Other services (except public administration) 1,175 4.3% 4.3%
91 Public administration 1,175 4.3% 6.8%
56 Administrative and support, waste management and remediation services
974 3.6% 4.5%
41 Wholesale trade 848 3.1% 4.5%
54 Professional, scientific and technical services 835 3.1% 7.5%
52 Finance and insurance 689 2.5% 5.4%
22 Utilities 503 1.9% 0.8%
71 Arts, entertainment and recreation 500 1.8% 2.1%
53 Real estate and rental and leasing 319 1.2% 2.0%
21 Mining, quarrying, and oil and gas extraction 182 0.7% 0.4%
51 Information and cultural industries 166 0.6% 2.6%
12 North American Industry Classification System 2012: http://www23.statcan.gc.ca/imdb/p3VD.pl?Function=getVD&TVD=118464 13 Data are available for: (a) the employed person; (b) the labour force - persons who were either employed or unemployed
in the reference period. Unemployed persons who worked prior to the reference period, or who never worked, are shown in the data under the category 'Industry- Not applicable'; (c) persons with recent work experience; they are those who have worked at some point in the reference period, regardless of whether or not they were in the labour force in the reference period.

Haldimand County | 2018 Community Profile
HaldimandCounty.ca Page 18
Source: McSweeney & Associates from Manifold Data Mining Inc. SuperDemographics 2017.
General Wages by Occupation
Below is a sampling of wage rates associated with various occupations in Haldimand County, collected by the Government of Canada. Salary data is collected by region. Haldimand County belongs to the Hamilton-Niagara Peninsula Region. Table 15: General Wages by Occupation14
Category Low
Wage ($/hour)
Average Wage
($/hour)
High Wage
($/hour)
Senior managers - financial, communications and other business services (NOC 0013-0)
19.23 49.04 76.92
Senior managers - health, education, social and community services and membership organizations (NOC 0014-0)
35.70 43.52 87.18
Engineering managers (NOC 0211-0) 27.88 50.00 72.12
Architecture and science managers (NOC 0212-0) 26.44 38.46 65.38
Human resources professionals (NOC 1121-A) 19.69 28.21 60.44
Data entry clerks (NOC 1422-C) 11.40 15.75 26.00
Transportation route and crew schedulers (NOC 1526-C) 14.02 25.48 30.29
Survey interviewers and statistical clerks (NOC 1454-C) 11.40 17.91 30.00
Industrial and manufacturing engineers (NOC 2141-A) 24.04 36.06 51.28
Software engineers and designers (NOC 2173-A) 26.13 42.35 60.49
Agricultural and fish products inspectors (NOC 2222-B) 11.92 29.20 54.32
Construction estimators (NOC 2234-B) 20.00 28.41 50.00
Physiotherapists (NOC 3142-A) 25.00 35.90 43.27
Nursing co-ordinators and supervisors (NOC 3011-A) 19.23 38.00 48.00
Economists and economic policy researchers and analysts (NOC 4162-A)
23.59 42.13 55.38
Technical sales specialists - wholesale trade (NOC 6221-B) 13.50 26.00 48.08
Cleaning supervisors (NOC 6315-B) 13.50 22.00 30.00
Store shelf stockers, clerks and order fillers (NOC 6622-D) 11.40 11.40 17.50
Paramedical occupations (NOC 3234-B) 25.60 36.50 42.00
Home support workers, housekeepers and related occupations (NOC 4412-C)
12.00 16.00 19.00
Source: Produced by Human Resources and Skills Development Canada's Labour Market Information Service. Last updated November 1st, 2016.
14 For more wage rates please visit: https://www.jobbank.gc.ca/LMI_report_area.do?lang=eng&area=6261&reportOption=wage

Haldimand County | 2018 Community Profile
HaldimandCounty.ca Page 19
Largest Employers
Tables 16 and 17 identify some of the largest private and public employers by NAICS and employment level in Haldimand County. Table 16: Largest Private Sector Employers
Name NAICS # of Employees (approximate)
Stelco (US Steel) Iron and Steel Mills and
Ferro-Alloy Manufacturing 1,500
CGC Inc Gypsum Product
Manufacturing 300
Imperial Oil Petroleum Manufacturing 260
Original Foods All Other Food Manufacturing
150
Rosa Flora Floriculture Production 150
Parkview Christian Retirement Community Care Facilities
for the Elderly 110
Contrans Flatbed Group General Freight Trucking,
Local 100
Charles Jones Industrial Ltd.
Electronic Components, Navigational and
Communications Equipment and Supplies Merchant
Wholesalers
90
Source: Haldimand County
Table 17: Largest Public-Sector Employers
Name NAICS # of Employees (approximate)
Haldimand County Public
Administration 514
Grandview Lodge Nursing Care
Facilities 170
Children’s Aid Society Haldimand Norfolk Business
Association 140
Community Living Haldimand Social Advocacy
Organizations 100
Source: Haldimand County

Haldimand County | 2018 Community Profile
HaldimandCounty.ca Page 20
Place of Work
Tables 18 and 19 provide information on persons reporting a “usual place of work other than in their home or outside of Canada”, and reveal the following regarding labour force commuting:
52% of the workers living in Haldimand County had a usual place of work outside of the County. Most commuted to work in Hamilton, Burlington, or Norfolk County
36% of labour is non-resident and commute to work in Haldimand. Most commuters are coming from Norfolk County and City of Hamilton.
Table 18: Where the Haldimand Resident Labour Force Works, 2016
Place of Work Total Male Female
Haldimand County 8,465 4,010 4,455
Hamilton, City 5,070 2,650 2,415
Norfolk County 655 435 225
Brantford, City 620 165 455
Burlington, City 515 230 280
Toronto, City 300 175 120
West Lincoln, Township 240 185 55
Oakville, Town 205 95 115
Mississauga, City 185 110 80
Grimsby, Town 180 115 70
Brant, County 180 160 25
Welland, County 145 85 60
Niagara Falls, City 105 70 35
St. Catharines, City 105 75 30
Lincoln, Town 80 50 25
Cambridge, City 65 45 15
Port Colborne, County 65 35 0
Wainfleet, Township 60 0 60
Milton, Town 55 35 15
Pelham, Town 55 0 45
Brampton, City 50 10 40
Guelph, City 50 0 50
Thorold, County 35 10 20
Vaughan, City 35 0 25
Fort Erie, Town 35 0 0
Kitchener, County 30 0 0
Woodstock, City 30 30 0
Kincardine, Municipality 20 20 0
Total Resident Labour Force 17,545 8,425 9,150
Total resident labour force with a usual place of work outside of Haldimand County
9,630 4,990 4,670
Percent of residents declaring a place of work outside of Haldimand County
55% 59% 51%
Source: Statistic Canada, 2016 Commuting Flow; http://bit.ly/2AdJ5Vy
Haldimand County | 2018 Community Profile
HaldimandCounty.ca Page 21
Table 19: Place of Residence for Persons Working in Haldimand, 2016 Place of Residence Total Male Female
Haldimand County 7,915 3,435 4,480
Norfolk County 1,880 1,275 605
Hamilton, City 1,290 875 410
Brantford, City 345 215 120
West Lincoln, Township 240 105 130
Wainfleet, Township 170 70 105
Brant, County 125 80 45
Port Colborne, County 95 60 30
Pelham, Town 95 50 50
Burlington, City 85 60 25
Welland, County 85 60 30
Toronto, City 65 40 20
St. Catharines, City 65 35 30
Lincoln, Town 60 30 30
Tillsonburg, Town 55 40 15
Grimsby, Town 45 15 25
Fort Erie, Town 40 35 0
Niagara Falls, City 35 30 10
Mississauga, City 30 15 10
Norwich, Township 25 15 10
Total workforce working in Haldimand County 12,745 6,540 6,180
Total non-resident workforce commuting to work to Haldimand County
4,830 3,105 1,700
Percent of workers (non-residents) commuting to work to Haldimand County
38% 47% 28%
Source: Statistic Canada, 2016 Commuting Flow, http://bit.ly/2AdJ5Vy
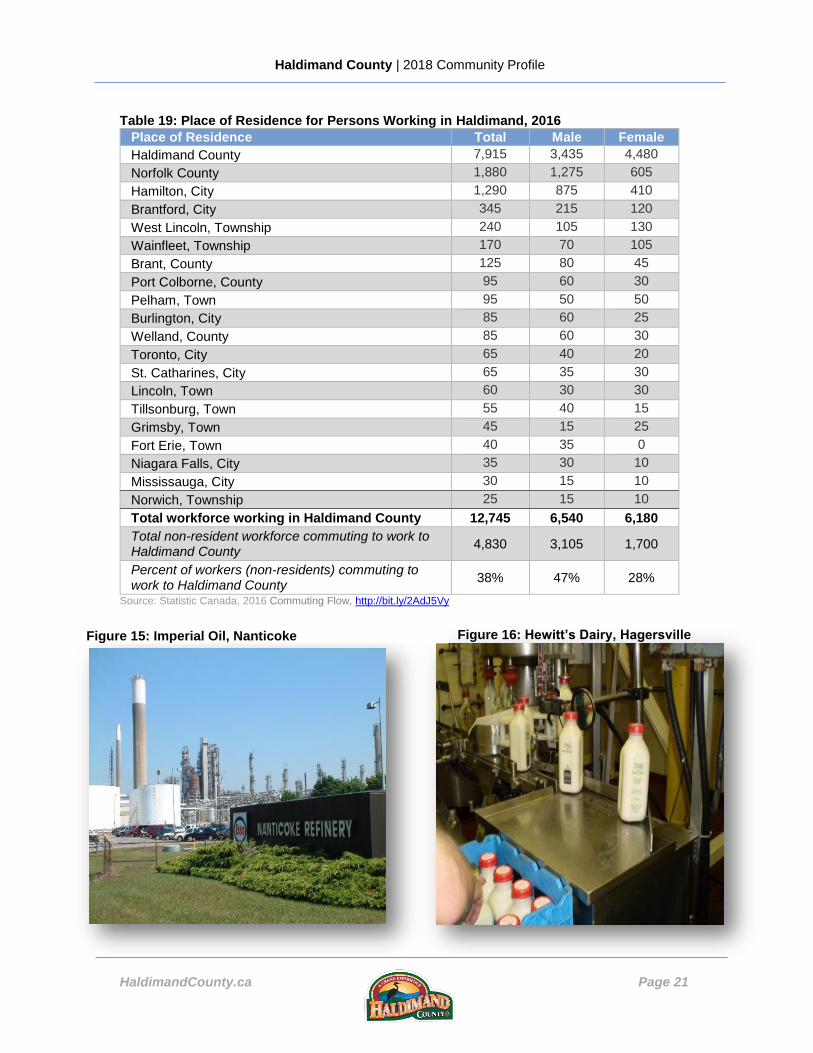
Figure 16: Hewitt’s Dairy, Hagersville
Figure 15: Imperial Oil, Nanticoke
Haldimand County | 2018 Community Profile
HaldimandCounty.ca Page 22
Transportation and Shipping
Highways
Haldimand County's main connecting roads are:
Highway 6, running north-south through the County and linking it with
Hamilton, ON, and Ontario's 400-series highway network
Highway 3, running east-west through the County and linking it with Buffalo, NY, and Detroit, MI (see figure 1)
A rich system of secondary highways connects Haldimand with nearby cities, such as Hamilton, St. Catharines and Niagara Falls. Many County roads are built for high traffic volumes and heavy truck traffic.
Highway 403 lies within a 15 minute drive of the northern tip of Haldimand County, leading to Ontario’s Queen Elizabeth Way (QEW). This access point to the province’s 400-series highways leads east to the United States, west to the Québec-Windsor Corridor and north to the Greater Toronto Area (GTA). Through these access routes, Haldimand County connects to much of the North American industrial market in just one day.
5.1.1 Average Annual Daily Traffic (AADT)
Highway 403: From Hamilton 52 to Trinity Road Underpass Distance (km): 6.9 Annual Average Daily Traffic (AADT): 50,000 Highway 3: From Robinson Road (North) to Haldimand Road 17 Distance (km): 12.3 Annual Average Daily Traffic (AADT): 6,300 Highway 6: From Upper James (Old Highway 6) to White Church Road Distance (km): 0.9 Annual Average Daily Traffic (AADT): 22,100 Source: Dynamic traffic volumes lookup for the year 2016: http://bit.ly/2s9hT4J

Haldimand County | 2018 Community Profile
HaldimandCounty.ca Page 23
5.1.2 Market Access
The table below indicates the distance to key markets and border crossings from Haldimand County: Table 20: Distance to Urban Centres
Distance to Major Urban Centres
Location Distance (km) Distance (miles)
Hamilton 19 11
St. Catharines 70 43
Kitchener-Waterloo 80 50
Toronto 89 46
London 100 62
Windsor 283 176
Kingston 349 217
Ottawa 471 293
Montreal 629 391 Source: McSweeney & Associates from Google Maps
Table 21: Distance to Major US Border Crossings
Distance to Border Crossings
Border Crossing Distance (km) Distance (miles)
Niagara Falls/Niagara Falls 100 62
Buffalo/Fort Erie 116 72
Lewiston/Queenston 120 75
Port Huron/Sarnia 200 124
Detroit/Windsor 283 176 Source: McSweeney & Associates from Google Maps

Haldimand County | 2018 Community Profile
HaldimandCounty.ca Page 24
Rail Services
Freight rail access for Haldimand County is provided by:
Southern Ontario Railway, connecting Lake Erie Industrial Park with Brantford, by way of Caledonia and Hagersville
Canadian Pacific (CP) Railway, connecting Port Maitland with Hamilton, stemming at Smithville toward Dunnville
Canadian National (CN) services Lake Erie Industrial Park as the long-haul rail service
Southern Ontario Railway The Canadian subsidiary of Genesee & Wyoming Inc. operates 74 km (46 miles) of track from Brantford to Nanticoke, Ontario. It has interchanges with the Canadian National Railway at Hamilton via trackage rights, Brantford and Paris, and interchanges with the Canadian Pacific Railway at Hamilton. gwrr.com Closest Transload Facility: 52 Tuscarora St Hagersville, ON N0A 1E0 514-948-6993 Canadian Pacific CP has numerous routing options across Canada and through the U.S. as well as excellent North American reach through gateways with all Class I railways. CP has extensive Canadian and U.S. short line partners and serves leading Atlantic and Pacific port facilities. cpr.ca/ Closest Transload Facility: 42 Centre Street Welland, ON L3B 5N9 905-735-5529 Canadian National CN is Canada's largest railway, in terms of both revenue and the physical size of its rail network, and is Canada's only transcontinental railway company, spanning Canada from the Atlantic coast in Nova Scotia to the Pacific coast in British Columbia. cn.ca Closest Intermodal Facility: 76 Intermodal Drive Brampton, ON L6T 5K1 1 (888)-MOVIN-CN

Haldimand County | 2018 Community Profile
HaldimandCounty.ca Page 25
Airports
The following is a list of regional airports and their specifications. Table 22: Regional Airports
Name About Location Website
John C. Munro Hamilton International Airport
Distance from community: 30 km Type: Commercial
Customs: Yes Elevation: 238 m
Runways: 2 Longest Runway: 10,006 ft
Hours of operation: 24/7
Mount Hope, Ontario
Code: YHM flyhamilton.ca
Toronto Pearson Airport
Distance from community: 110 km Type: Commercial
Customs: Yes Elevation: 173 m
Runways: 5 Longest Runway: 11,120 ft
Hours of operation: 24/7
Mississauga, Ontario,
Code: YYZ torontopearson.com
Niagara Falls International Airport
Distance from community: 100 km Type: Commercial
Customs: Yes Elevation: 180 m
Runways: 2 Longest Runway: 10,825 ft
Hours of operation: 24/7
Niagara Falls, New York, USA
Code: IAG niagarafallsairport.com
Buffalo Airport
Distance from community: 120 km Type: Commercial
Customs: Yes Elevation: 222 m
Runways: 2 Longest Runway: 8,829 ft Hours of operation: 24/7
Buffalo, New York, USA
Code: BUF buffaloairport.com
Source: McSweeney & Associates from Google Maps
Ports
The following is a list of key ports in the region for the local economy: Table 23: Regional Ports
Name Location/contact Website
Hamilton Port Authority
605 James St. North, 6th Floor, Hamilton, ON L8L 1K1
hamiltonport.ca
Port of Toronto (Ocean Port)
60 Harbour Street, Toronto, ON M5J 1B7
torontoport.com
Great Lakes St. Lawrence Seaway System
508 Glendale Ave, St. Catharines, ON L2R 6V8
greatlakes-seaway.com
Source: McSweeney & Associates from Google Maps
Haldimand County | 2018 Community Profile
HaldimandCounty.ca Page 26
Taxes and Utilities
This section describes the taxes (local, provincial and federal), cost of water and sewer connection, waste management sites, and natural gas and electricity rates.
Local Property Tax Rates
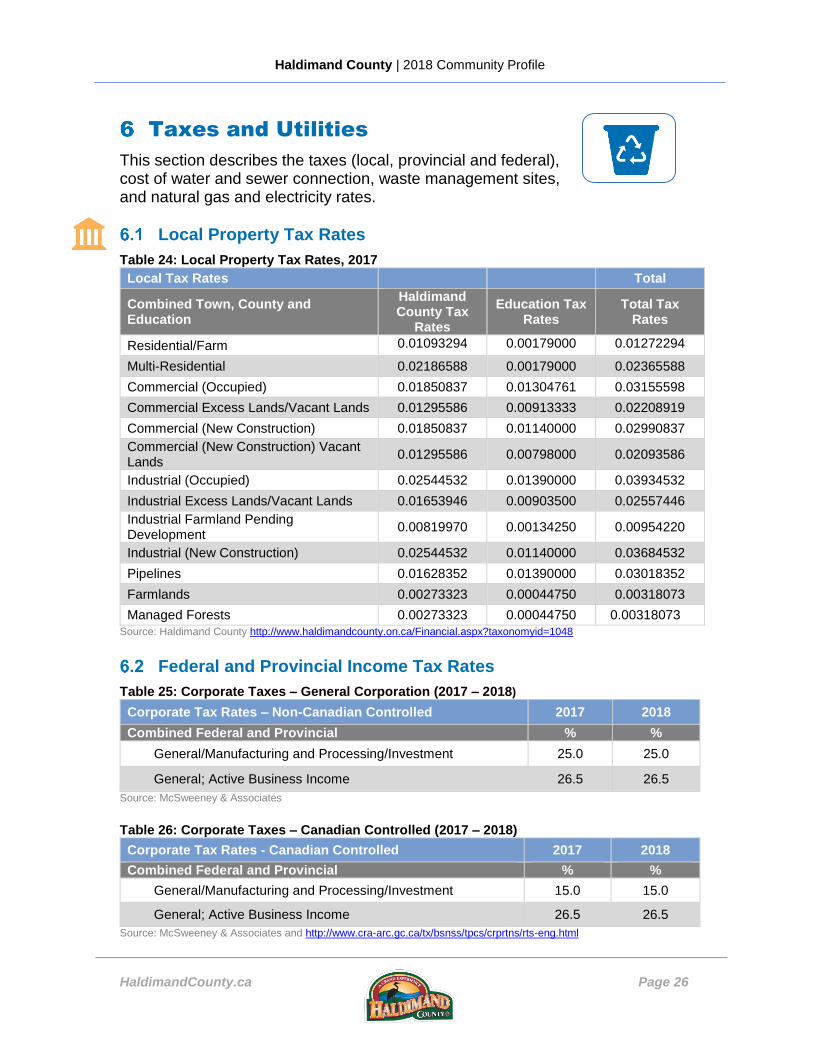
Table 24: Local Property Tax Rates, 2017
Local Tax Rates Total
Combined Town, County and Education
Haldimand County Tax
Rates
Education Tax Rates
Total Tax Rates
Residential/Farm 0.01093294 0.00179000 0.01272294
Multi-Residential 0.02186588 0.00179000 0.02365588
Commercial (Occupied) 0.01850837 0.01304761 0.03155598
Commercial Excess Lands/Vacant Lands 0.01295586 0.00913333 0.02208919
Commercial (New Construction) 0.01850837 0.01140000 0.02990837
Commercial (New Construction) Vacant Lands
0.01295586 0.00798000 0.02093586
Industrial (Occupied) 0.02544532 0.01390000 0.03934532
Industrial Excess Lands/Vacant Lands 0.01653946 0.00903500 0.02557446
Industrial Farmland Pending Development
0.00819970 0.00134250 0.00954220
Industrial (New Construction) 0.02544532 0.01140000 0.03684532
Pipelines 0.01628352 0.01390000 0.03018352
Farmlands 0.00273323 0.00044750 0.00318073
Managed Forests 0.00273323 0.00044750 0.00318073
Source: Haldimand County http://www.haldimandcounty.on.ca/Financial.aspx?taxonomyid=1048
Federal and Provincial Income Tax Rates
Table 25: Corporate Taxes – General Corporation (2017 – 2018)
Corporate Tax Rates – Non-Canadian Controlled 2017 2018
Combined Federal and Provincial % %
General/Manufacturing and Processing/Investment 25.0 25.0
General; Active Business Income 26.5 26.5
Source: McSweeney & Associates
Table 26: Corporate Taxes – Canadian Controlled (2017 – 2018)
Corporate Tax Rates - Canadian Controlled 2017 2018
Combined Federal and Provincial % %
General/Manufacturing and Processing/Investment 15.0 15.0
General; Active Business Income 26.5 26.5
Source: McSweeney & Associates and http://www.cra-arc.gc.ca/tx/bsnss/tpcs/crprtns/rts-eng.html

Haldimand County | 2018 Community Profile
HaldimandCounty.ca Page 27
Table 27: Sales Tax, 2017
Sales Tax 2017
HST (harmonized sales tax) 13%
Source: http://taxtips.ca/salestaxes/sales-tax-rates-2017. htm
Table 28: Combined Federal and Ontario Personal Income Tax, 2017
2017 Marginal Tax Rates
Other Income Capital Gains
Canadian Dividends
Eligible Dividends Non-Eligible Dividends
first $42,201 20.05% 10.03% -6.86% 6.13%
over $42,201 up to $45,916
24.15% 12.08% -1.20% 10.93%
over $45,916 up to $74,313
29.65% 14.83% 6.39% 17.37%
over $74,313 up to $84,404
31.48% 15.74% 8.92% 19.51%
over $84,404 up to $87,559
33.89% 16.95% 12.24% 22.33%
over $87,559 up to $91,831
37.91% 18.95% 17.79% 27.03%
over $91,831 up to $142,353
43.41% 21.70% 25.38% 33.46%
over $142,353 up to $150,000
46.41% 23.20% 29.52% 36.97%
over $150,000 up to $202,800
47.97% 23.98% 31.67% 38.80%
over $202,800 up to $220,000
51.97% 25.98% 37.19% 43.48%
over $220,000 53.53% 26.76% 39.34% 45.30%
Marginal tax rate for dividends is a % of actual dividends received (not grossed-up amount). Marginal tax rate for capital gains is a % of total capital gains (not taxable capital gains).
Federal Basic Personal Amount
2017 Tax Rate
$11,635 15.00% Source: http://www.taxtips.ca/taxrates/on.htm

Haldimand County | 2018 Community Profile
HaldimandCounty.ca Page 28
Water/Wastewater and Waste Management
Table 29: Average Customer Impacts, Water and Wastewater, 2018
Source: Haldimand County http://www.haldimandcounty.on.ca/residents.aspx?id=786
Table 30: Landfill Information
Waste Management
Name of Site Canborough Waste Management Facility
Location 499 James Road, Dunnville (905) 774-9010 HaldimandCounty.ca
Operation Hours Monday-Friday: 8:00 am - 4:15 pm Saturday: 9:00 am - 1:00 pm Sunday: Closed
Materials
Accepted Materials: • Construction & Demolition: drywall, clean wood, concrete; • Bulky Rigid Plastic: kid’s toys, water cooler bottles, plastic furniture; • Electronics: computers monitors, cellphones, speakers, televisions; • Leaf & Yard Waste: leaves, weeds, sticks, plant trimmings; • Metal: scrap metal, metal appliances not containing Freon; • Batteries; • Shingles; • Cardboard; • Tires-without rims; • Textiles-used clothes.
Unacceptable Materials: • Household Hazardous Waste; • Appliances Containing Refrigerants; • Railway Ties; • Soil.
Sources: http://www.haldimandcounty.on.ca/residents.aspx?id=614
Water 36.55$
Sewer 46.20$
Total 82.75$
Water 774.18$
Sewer 1,031.62$
Total 1,805.80$
Water 5,027.76$
Sewer 6,918.81$
Total 11,946.57$
Potable Water Costs (County) 40.10$
Est. Delivery Charge (Private Hauler) 85.45$
Total 125.55$
Treatment Costs (County) 127.90$
Est. Delivery Charge (Private Hauler) 91.57$
Total 219.47$
Average Customer Impacts Bulk Services - Per Use Basis
Bulk Water
(3,000 gallons)
Septic/Holding
(2,000 gallons)
Average Customer Impacts - Monthly Services
Residential
(15 m3)
Commercial
(2" 500 m3)
Industrial
(4" 4,000 m3)

Haldimand County | 2018 Community Profile
HaldimandCounty.ca Page 29
Electricity
Service Provider: Hydro One Networks Inc. P.O. Box 5700, Markham, Ontario L3R 1C8 1-877-955-1155 HydroOne.com
General Service (less than 50 kW demand)1
Demand Energy Urban Energy Electricity – Regulated Price Plan Time-of-Use as of May 1, 2017:
Time-of-Use Prices
Off-Peak 15.7¢ 15.7¢
Mid-Peak 11.3¢ 11.3¢
On-Peak 7.7¢ 7.7¢
Tiered Prices (as of May 1, 2017)
- First 750 kWh per month (adjusted usage - ¢/kWh) 9.1¢ 9.1¢
- Above 750 kWh (metered use - ¢/kWh) 10.6¢ 10.6¢
Delivery (as of January 1, 2017)
Monthly Service Charge ($/month) $82.77 $26.67
Smart Meter Entity Charge ($/month) n/a $0.79
Distribution Volumetric Rate (metered use - ¢/kWh) $0.1342 0.81¢
Retail Transmission Network Service Rate (adjusted use - ¢/kWh)
$2.5038
0.59¢
Retail Transmission Connection Service Rate (adjusted use - ¢/kWh)
$2.1172 0.50¢
Distribution losses See glossary
See Footnotes
Regulatory Charges – as of January 1st, 2017
Supply Service Administration Charge – if applicable ($/month) $0.25 $0.25
Wholesale Market Service Rate (adjusted use - ¢/kWh) 0.36¢ 0.36¢
Rural and Rate Protection Charge (adjusted use - ¢/kWh) 0.21¢ 0.21¢
Ontario Electricity Support Program Charge (adjusted use - ¢/kWh)
0.00¢* 0.00¢*
Debt retirement charge (metered usage - ¢/kWh): 0.7 0.7
Adjustment factor 1.0655 1.0655
Footnotes: *The Ontario Electricity Support Program (OESP) reduces electricity costs for low-income customers. As part of the Fair Hydro Plan, the OESP charge has been removed from bills, effective May 1, 2017. The Province will fund the OESP through provincial revenues. See the Glossary: http://www.hydroone.com/Haldimand/Pages/Glossary.aspx
Source: http://www.hydroone.com/Haldimand/Pages/Rates.aspx

Haldimand County | 2018 Community Profile
HaldimandCounty.ca Page 30
Natural Gas
Service Provider: Union Gas 1-888-774-3111 uniongas.com/business Business rates outlined below typically apply to medium to large commercial and small industrial customers. These customers include small businesses, small greenhouses, restaurants, hotels and retail stores and consume more than 50,000 m3 of natural gas each year. Table 31: Natural Gas Rates for Industrial and Commercial Users
Commercial and Industrial Rates (M2)
Charges Monthly Rates April 1, 2017
Annualized Increase/(Decrease)
Monthly Charge $70.00
Gas Used 15.8578 ¢/m³ -$116.79
Gas Price Adjustment 1.5856 ¢/m³ $788.60
Storage 0.6252 ¢/m³ $0.00
Transportation to Union Gas $0.00 $0.00
Delivery Cost in cents per cubic metre ¢/m³
First 500 8.0196 ¢/m³
Next 1050 7.9319 ¢/m³
Next 4500 7.7450 ¢/m³
Next 7000 7.4256 ¢/m³
Source: https://www.uniongas.com/-/media/aboutus/rates/residential/m2CI.PDF?la=en
Other natural gas providers may be available.

Haldimand County | 2018 Community Profile
HaldimandCounty.ca Page 31
Land, Planning and Development
Industrial and Commercial Land and Buildings
Within Haldimand County, there are several industrial and commercial business properties that would serve a diverse range of businesses. Lake Erie Industrial Park, located in Nanticoke, is one of the largest industrial parks in Ontario. Zoned for heavy industrial, this greenfield industrial park has lots available ranging from 1 to 2000 acres. Frank A. Marshall Business Park is home to a variety of industries, as it is zoned for general industry. Located in Dunnville, the Frank Marshall business park boasts an 11.3-acre Investment Ready Site (certified under Ontario’s Certified Site Program), as well as several smaller lots. Businesses interested in learning more about Haldimand County’s industrial and business parks are encouraged to contact Economic Development and Tourism by calling (905) 318-5932 or emailing [email protected]. Visit BusinessHaldimand.ca for more information.
Building and Planning Fees
Table 32: Building and Planning Fees, 2017
Development-Related Application Fees
Application Fee Range
Building permits $75.00 for the first $3,000 of construction value, plus $13.00 per $1,000.00 of construction fee over the first $3,000.00
Demolition fees $75.00 base fee, $10.00 for each additional 1,000 sq/ft
Official plan amendment only $3,555 - $5,877
Combined official plan and zoning amendment
$4,101 - $6,288
Site plan amendment $1,094 - $2,187
Zoning amendment - regular $2,296
Minor variance to zoning by-law $874 - $1,639
Source: http://www.haldimandcounty.on.ca/Business.aspx?id=964 Note: Development related applications may also be subject to a relevant Conservation Authority plan review service fee. Also note that fee range depends on the nature or complexity of an application.

Haldimand County | 2018 Community Profile
HaldimandCounty.ca Page 32
Development Charges and Fees
Table 33: Area Specific Development Charge, Effective May 2017
Non-Residential Development Charge by Service and Per Square Metre/Square Foot Of GFA
Service Charge (per sq. ft) Charge (per sq. m)
Municipal-wide Services $1.80 $19.38
Stormwater Drainage and Control $0.10 $1.08
Wastewater Services $0.58 $6.24
Water Services $0.51 $5.49
Total Charges Per Sq. Metre/Sq. Foot $2.99 $32.18
Residential Development Charge by Service And Unit Type
Service Singles/Semis -
Detached Dwelling
Apartments - 2 Bedrooms
+
Apartments - Bachelor
and 1 Bedroom
Other Multiples
Municipal-wide Services $7,968.48 $5,447.18 $3,756.34 $6,909.58
Stormwater Drainage and Control Services
$276.47 $188.94 $130.22 $240.18
Wastewater Services $1,892.59 $1,293.74 $892.38 $1,640.66
Water Services $1,646.00 $1,125.09 $776.03 $1,427.18
Grand Total Urban Area $11,783.54 $8,054.95 $5,554.97 $10,217.60
Source: http://bit.ly/2t2BjGi
Figure 17: CGC Inc., Hagersville

Haldimand County | 2018 Community Profile
HaldimandCounty.ca Page 33
Business Support Programs and Services
National and Provincial Support
Below is a list of government programs and not-for-profit agencies involved in business support and development. These government and not-for-profit bodies specialize in knowledge translation, job creation, facilitating commercialization, and capital and business development. Table 34: Business Support Programs
Federal Departments/National Agencies
Name Website
Federation of Canadian Municipalities fcm.ca
Futurpreneur Canada futurpreneur.ca
Business Development Bank of Canada (BDC)
bdc.ca
Federal Economic Development Agency for Southern Ontario (FedDev Ontario)
feddevontario.gc.ca
Canada Business - Business Start-up Assistant
canadabusiness.ca
Export Development Canada edc.ca
Innovation, Science and Economic Development Canada
ic.gc.ca
Provincial Departments/Agencies
Name Website
Service Ontario ontario.ca
The Ontario Network of Entrepreneurs (ONE)
ONEbusiness.ca
Ministry of Economic Development and Growth
ontario.ca
Ontario Ministry of Agriculture, Food and Rural Affairs
omafra.gov.on.ca
Economic Development Council of Ontario
edco.on.ca
Ontario Centers of Excellence oce-ontario.org
Source: McSweeney & Associates

Haldimand County | 2018 Community Profile
HaldimandCounty.ca Page 34
Local/Regional Support
Below is a list of agencies at the local/regional level involved in business support and development. These agencies work in the region to facilitate and support business in various capacities.
Table 35: Local Business Support
Regional/Local/Other Departments/Agencies
Name Website
Haldimand County Economic Development and Tourism
BusinessHaldimand.ca
Grand Erie Business Centre Inc. granderie.com
Fanshawe College Community Career and Employment Services
fanshawec.ca
Workforce Planning Board of Grand Erie
workforceplanningboard.org
Haldimand Employment Services - St. Leonard's Community Services
st-leonards.com
Caledonia Chamber of Commerce caledonia-chamber.com
Caledonia Business Improvement Area
caledoniabia.ca
Cayuga & District Chamber of Commerce
cayugachamber.ca
Dunnville Chamber of Commerce dunnvillechamberofcommerce.ca
Dunnville Business Improvement Area
Hagersville Business Improvement Area
Hagersville District Chamber of Commerce
hagersvillechamber.ca
Jarvis Board of Trade .jarivsboardoftrade.com
Selkirk Chamber of Commerce selkirk-ontario.com
Brantford-Brant Resource Centre brantford.ca
St. Catherine’s Enterprise Centre futurpreneur.ca
Hamilton Small Business Enterprise Centre
investinhamilton.ca
Innovate Niagara innovateniagara.com/
Research Innovation Commercialization Centre
riccentre.ca/
Source: McSweeney & Associates, & Haldimand County

Haldimand County | 2018 Community Profile
HaldimandCounty.ca Page 35
Community Improvement Plan (CIP) Programs
Haldimand County’s CIP programs provide financial incentives to eligible properties. The Downtown Areas CIP provides a suite of funding for properties in the eligible downtown areas. Haldimand County’s Rural Business and Tourism CIP offers a range of property development incentives to business/property owners engaging in value-added agriculture, commercial roofed accommodations as well as businesses operating in the hamlets and Heritage Designated buildings. Contact Haldimand County’s Economic Development and Tourism division for more information, or visit BusinessHaldimand.ca for an overview of the program and eligibility requirements.
Real Estate
Below is a list of active real estate agencies in Haldimand County.
Real Estate Agencies
Company Name Location/Contact
Chase Realty chaserealty.ca
Coldwell Banker K Miller Realty Brokerage
coldwellbanker.ca
Property Guys Norfolk-Haldimand propertyguys.com
Re/Max Escarpment Realty Inc remaxescarpment.com
Royal Lepage Mac Donald Real Estate Ltd
macdog.com
Royal LePage Niagara Real Estate Centre
homesniagara.com
Re/Max Riverside Realty Inc riversiderealty.ca
Source: McSweeney & Associates, & Haldimand County
Haldimand County | 2018 Community Profile
HaldimandCounty.ca Page 36
Financial Agencies
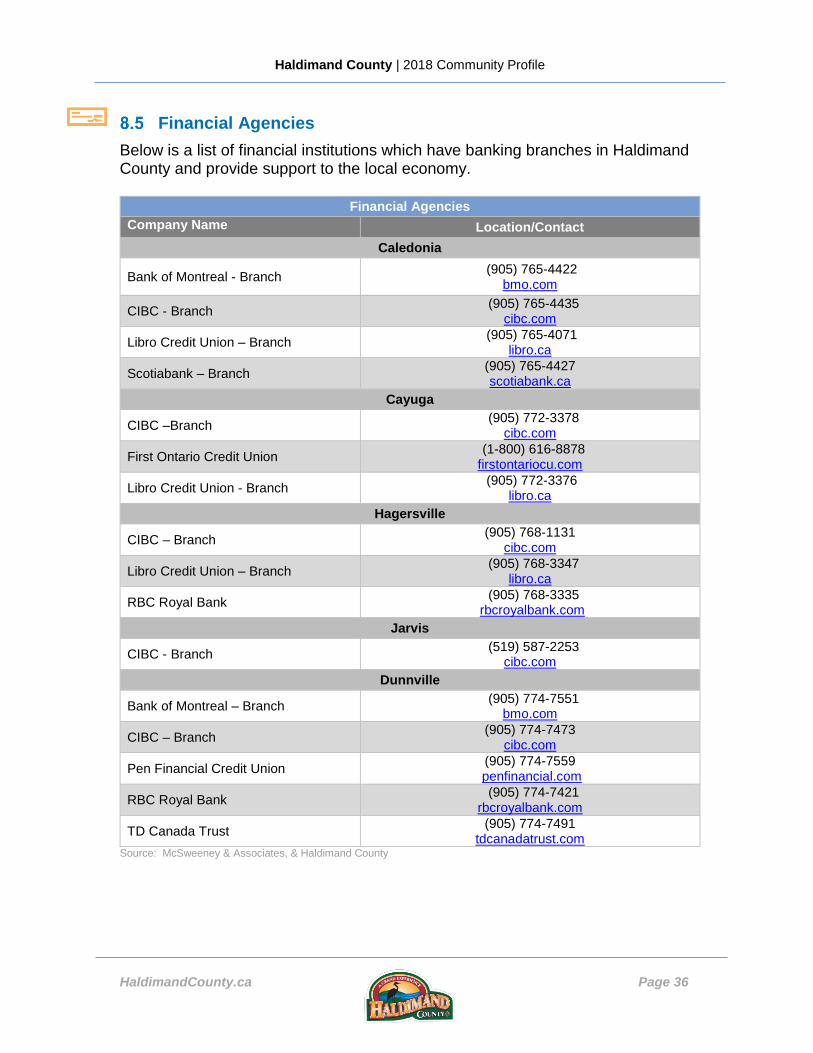
Below is a list of financial institutions which have banking branches in Haldimand County and provide support to the local economy.
Financial Agencies
Company Name Location/Contact
Caledonia
Bank of Montreal - Branch (905) 765-4422
bmo.com
CIBC - Branch (905) 765-4435
cibc.com
Libro Credit Union – Branch (905) 765-4071
libro.ca
Scotiabank – Branch (905) 765-4427 scotiabank.ca
Cayuga
CIBC –Branch (905) 772-3378
cibc.com
First Ontario Credit Union (1-800) 616-8878 firstontariocu.com
Libro Credit Union - Branch (905) 772-3376
libro.ca
Hagersville
CIBC – Branch (905) 768-1131
cibc.com
Libro Credit Union – Branch (905) 768-3347
libro.ca
RBC Royal Bank (905) 768-3335
rbcroyalbank.com
Jarvis
CIBC - Branch (519) 587-2253
cibc.com
Dunnville
Bank of Montreal – Branch (905) 774-7551
bmo.com
CIBC – Branch (905) 774-7473
cibc.com
Pen Financial Credit Union (905) 774-7559
penfinancial.com
RBC Royal Bank (905) 774-7421 rbcroyalbank.com
TD Canada Trust (905) 774-7491
tdcanadatrust.com Source: McSweeney & Associates, & Haldimand County

Haldimand County | 2018 Community Profile
HaldimandCounty.ca Page 37
Education and Training
The following are only a subset of the many recognized universities and colleges within a 100-kilometer radius of Haldimand County.
Universities
University of Toronto Toronto, ON (416) 978-2011 www.utoronto.ca
Ryerson University Toronto, ON (416) 979-5000 www.ryerson.ca
McMaster University Hamilton, ON (905) 525-9140 www.mcmaster.ca
Six Nations Polytechnic Ohsweken, ON (519) 445-0023 www.snpolytechnic.com
Wilfrid Laurier University Waterloo, ON (519) 884-1970 www.wlu.ca
Brock University St. Catharines, ON (905) 688-5550 www.brocku.ca
Redeemer University College Ancaster, ON (905) 648-2131 www.redeemer.ca
University of Waterloo Waterloo, ON (519) 888-4567 www.uwaterloo.ca
State University of New York New York (518) 320-1100 www.suny.edu
University of Western Ontario London, ON (519) 661-211 www.uwo.ca
Colleges
Mohawk College Hamilton, ON (905) 575-1212 www.mohawkcollege.ca
Conestoga College Brantford, ON (519) 756-8228 ext. 5491 conestogac.on.ca/
Fanshawe College Conestoga College Simcoe, ON (519) 426-8260 www.fanshawec.ca/about-fanshawe/campus/simcoe-campus
Niagara College Welland, ON (905) 735-2211 www.niagarac.on.ca
Comprehensive list of Ontario Colleges: http://bit.ly/2o30Pf1 Comprehensive list of Ontario Universities: http://bit.ly/2ptNQE3
Haldimand County | 2018 Community Profile
HaldimandCounty.ca Page 38
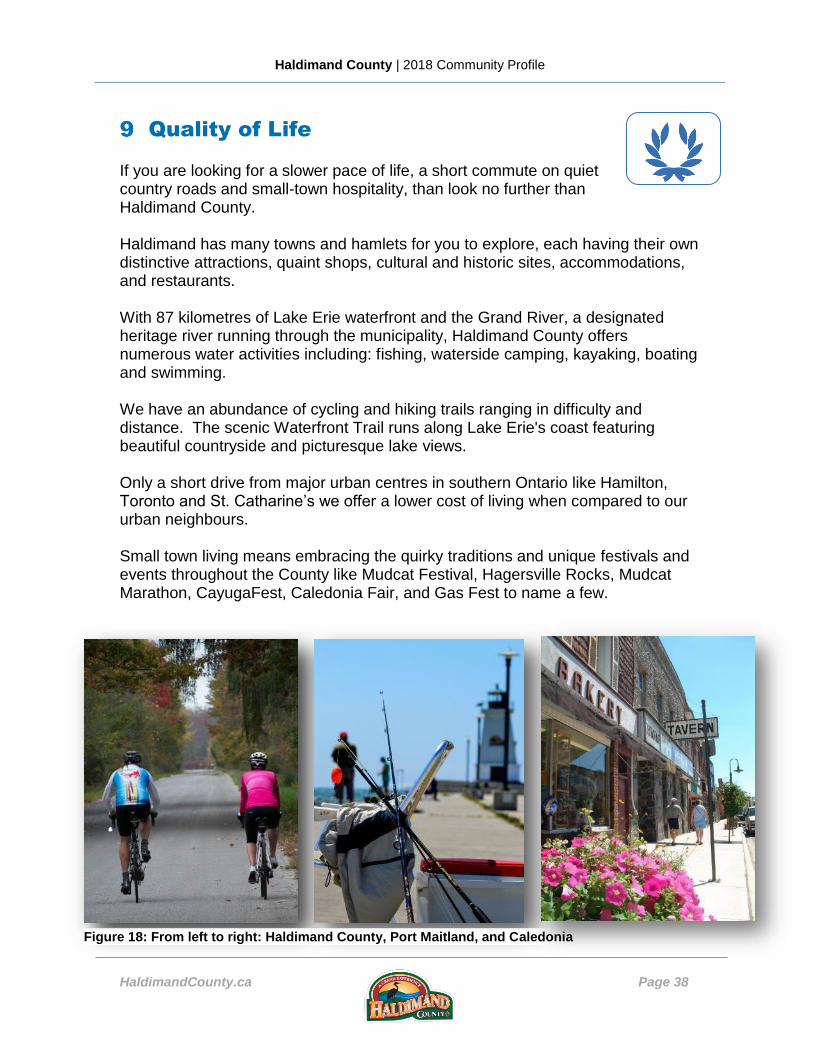
Figure 18: From left to right: Haldimand County, Port Maitland, and Caledonia
Quality of Life If you are looking for a slower pace of life, a short commute on quiet country roads and small-town hospitality, than look no further than Haldimand County. Haldimand has many towns and hamlets for you to explore, each having their own distinctive attractions, quaint shops, cultural and historic sites, accommodations, and restaurants. With 87 kilometres of Lake Erie waterfront and the Grand River, a designated heritage river running through the municipality, Haldimand County offers numerous water activities including: fishing, waterside camping, kayaking, boating and swimming. We have an abundance of cycling and hiking trails ranging in difficulty and distance. The scenic Waterfront Trail runs along Lake Erie's coast featuring beautiful countryside and picturesque lake views. Only a short drive from major urban centres in southern Ontario like Hamilton, Toronto and St. Catharine’s we offer a lower cost of living when compared to our urban neighbours. Small town living means embracing the quirky traditions and unique festivals and events throughout the County like Mudcat Festival, Hagersville Rocks, Mudcat Marathon, CayugaFest, Caledonia Fair, and Gas Fest to name a few.

Haldimand County | 2018 Community Profile
HaldimandCounty.ca Page 39
Housing Characteristics
The community has a booming housing sector. The average number of bedrooms per home is higher than the provincial figure, meanwhile the average dwelling value is below that of the province. Table 36: Dwelling Characteristics, 2017
Characteristics Haldimand Ontario
Total number of occupied private dwellings 18,339 5,441,110
Owned 15,529 3,894,868
Rented 2,810 1,536,034
Average number of rooms 7.5 6.4
Average monthly shelter costs for owned dwellings $1,387 $1,590
Average dwelling value $523,584 $684,176 Source: McSweeney & Associates from Manifold Data Mining Inc. SuperDemographics 2017.
Figure 19: Caledonia pool, Haldimand County

Haldimand County | 2018 Community Profile
HaldimandCounty.ca Page 40
Social and Community Services
There is a wide variety of supports for residents through a variety of social and community services.
Table 37: Social and Community Services
Emergency Services Division
Service Service Provider Contact
Fire Services Haldimand County HaldimandCounty.ca
Medical Services Haldimand County HaldimandCounty.ca
Police and Safety Ontario Provincial Police opp.ca
Emergency Shelters & Resource Centres
Service Service Provider Contact
West Haldimand General Hospital
Ministry of Health whgh.ca
Haldimand War Memorial Hospital
Ministry of Health hwmh.ca
Health Services Haldimand-Norfolk Health Unit (905) 318-3272 or (905) 318-5367
hnhu.org
Women’s Shelter Haldimand-Norfolk Women’s Services (519) 426-8048 or 1-800-265-8076
Women’s Shelter Victim Services of Haldimand –
Norfolk – New Credit 1-800-264-6671
victimserviceshn.com
Youth and Family Services
Haldimand Norfolk REACH (519) 587-2441 or 1-800-265-8087
http://www.hnreach.on.ca
Youth and Family Services
Children’s Aid Society of Haldimand Norfolk
(519) 587-5437 or 1-888-227-5437 Cashn.on.ca
Youth Services Dunnville Youth Impact Inc (905) 774-6233
youthimpactcentre.com
Youth Services Norfolk County Youth Unlimited / Simcoe Upper Deck Youth Centre
(519) 426-9719 swoyfc.com
Youth Services Your Life Counts 1-888-230-3505
opgh.on.ca
Addiction Assessment &
Referral Services Al-anon and Al-ateen Family Groups (519) 752-5981 or 1-888-425-2666
Addiction Assessment
Centre for Addiction and Mental Health, Drug and Alcohol Information
Line
1-800-463-6273 camh.net
Addiction Assessment
Haldimand Norfolk Detoxification & Rehabilitation Service, Holmes
House: (519) 428-1911 or 1-888-999-4966
Stress and Mental Health
Canadian Mental Health Association, Haldimand-Norfolk Branch
(519) 428-2380 or 1-888-750-7778 cmha-hn.ca
Counseling Services Brant Family Counselling Centre (519) 753-4173
Source: McSweeney & Associates and Haldimand County A complete listing of all community resources can be found here: http://www.haldimandcounty.on.ca/residents.aspx?id=12497

Haldimand County | 2018 Community Profile
HaldimandCounty.ca Page 41
Elementary and Secondary Education
Haldimand County is served by the Grand Erie District School Board (www.granderie.ca), and the Brant Haldimand Norfolk Catholic District School Board (www.bhncdsb.ca). Table 38: Primary and Secondary Schools
Elementary Schools
Name Address Contact:
Public
Caledonia Centennial Public 110 Shetland St, Caledonia, ON (905) 765-4860
Caledonia Centennial French Immersion
110 Shetland St, Caledonia, ON (905) 765-4860
Fairview Avenue Public 223 Fairview Ave W, Dunnville, ON (905) 774-6144
Grandview Central Public 11 Thrush St, Dunnville, ON (905) 774-4727
Hagersville Elementary 40 Parkview Rd, Hagersville, ON (905) 768-3012
J L Mitchener Public 60 Munsee ST S, Cayuga, ON (905) 772-5071
Jarvis Public School 14 Monson St. Jarvis, ON (519) 587-2612
Oneida Central Public 661 4th Line, Caledonia, ON (905) 765-4700
Rainham Central Public School 572 Concession Rd 5, Fisherville, ON (905) 779-3404
River Heights Elementary 37 Forfar St E, Caledonia, ON (905) 765-5437
Seneca Central Public 2767 Haldimand Rd 9, York, ON (905) 772-5222
Thompson Creek Elementary 800 W Cross St, Dunnville, ON (905) 774-5460
Walpole North Elementary 480 Concession 10 Walpole,
Townsend, ON (905) 768-5112
Catholic
Notre Dame School 35 Braemar Avenue, Caledonia, ON (905) 765-0649
St. Mary’s School 92 Main St. South Hagersville, ON (905) 768-5151
St. Michael’s School 209 Alder Street West, Dunnville, ON (905) 774-6052
St. Patrick’s School 81 Orkney Street E. Caledonia, ON (905) 765-4626
St. Stephen’s School 17 Brant Street W. Cayuga, ON (905) 772-3863
Private
Limitless Learning Montessori School in Caledonia
172 Argyle St N, York, ON (905) 765-3799
Jarvis Christian School 149 Talbot Road East, Jarvis, ON (519) 587-4444
Dunnville Christian School 37 Robinson Rd, Dunnville, ON (905) 774-5142
Secondary Schools
Cayuga Secondary 70 Highway 54, Cayuga, ON (905) 772-3301
Dunnville Secondary Haldimand, ON (905) 774-7401
Hagersville Secondary 70 Parkview Rd, Hagersville, ON (905) 768-3318
McKinnon Park Secondary 91 Haddington St, Caledonia, ON (905) 765-4466 Source: McSweeney & Associates and Haldimand County

Haldimand County | 2018 Community Profile
HaldimandCounty.ca Page 42
Recreational Facilities
Haldimand County offers a wide range of recreation programs and facilities for its residents:
4 indoor arenas with 5 ice pads total and two walking tracks
3 pools
2 splash pads
1 wading pool
100+ sport fields
250+ hectares of green space and sport fields
30 playground locations
5 skate parks
A total of 14 tennis courts in 4 communities
A variety of summer camps/programs/activities
A growing network of trails and cycling routes
For full listings of all of Haldimand County’s Sporting Facilities (indoor and outdoor), Community Halls and Centres, Outdoor Recreational activities, and Museums, please visit: haldimandcounty.on.ca/residents.aspx?id=116 Haldimand County also offers numerous maps and guides that help navigate the County. Find everything you need, from cycling routes to the best fishing spots by clicking below:

Haldimand County | 2018 Community Profile
HaldimandCounty.ca Page 43
Events
Haldimand County recognizes the importance of community festivals, events and tournaments in enhancing quality of life, tourism, culture, recreation and education, and in providing economic benefits to local businesses. The following is a list of all events in the county. These are the largest reoccurring events in Haldimand County.
Source: Haldimand County. For more festivals and event visit: http://www.haldimandcounty.on.ca/residents.aspx?id=18336
Local Events 2017
Name Date Website
Mudcat Marathon 2nd week of May www.mudcatmarathon.ca
Dunnville Mudcat Festival
2nd weekend in June www.dunnvillemudcatfestival.ca
Cayugafest 3rd weekend in July www.cayugafest.ca
Hagersville Rocks 3rd weekend in July www.hagersvillerocks.com
Selkirk Gasfest 2nd weekend in August www.selkirk-ontario.com/festivals
Dunnville Grand Tour 3rd weekend in August www.dunnvillegrandtour.com
Dunnville Agricultural Fair
3rd weekend in August www.dunnvillefair.ca
Caledonia Fair 4th weekend in September www.caledoniafair.ca
Figure 20: Caledonia Fair, Haldimand County
Haldimand County | 2018 Community Profile
HaldimandCounty.ca Page 44
Local Media
This section identifies the local media resources available in the community. More specifically, it identifies media outlets that produce Haldimand specific content for the Haldimand County residents. Table 39: Radio
Media Channel
92.9 The Grand FM
Table 40: Television
Media Affiliation
Cable 14 TV Hamilton Limited, licensed by CRTC. Cogeco
Communications Holdings Inc. and Rogers Communications Canada Inc.
Table 41: Print
Media Frequency
The Grand River Sachem Weekly
The Haldimand Press Weekly
Haldimand County Social Media:
Haldimand County (Main)
facebook.com/HaldimandCounty/
Haldimand County Public Library
facebook.com/HaldimandLibrary/
Haldimand County Economic Development & Tourism
facebook.com/HaldimandCountyTourism/
Haldimand County (Main)
@HaldimandCounty
Haldimand Fire & Emergency Medical Services
@HaldEmerg

Haldimand County | 2018 Community Profile
HaldimandCounty.ca Page 45
Communications Infrastructure
Haldimand County offers connectivity with high speed internet, cable and phone services available to residents. The table below identifies service providers. Table 42: Communications Infrastructure
Cable Services
Name Contact
Rogers rogers.com
(905) 765-1644
Bell bell.ca
(905) 774-8872
Internet Services
Name Contact
Rogers rogers.com
(905) 765-1644
Bell bell.ca
(905) 774-8872
OptionsDSL optionsdsl.ca
(905) 963-1054
MetroLoop metroloop.net
(905) 667-8945
Xplornet xplorenet.com
(905) 776-5535
Phone Services
Name Contact
Bell bell.ca
(905) 774-8872
Rogers rogers.com
(905) 765-1644
OptionsDSL optionsdsl.ca
(905) 963-1054
MetroLoop metroloop.net
(905)-667-8945
Source: Haldimand County
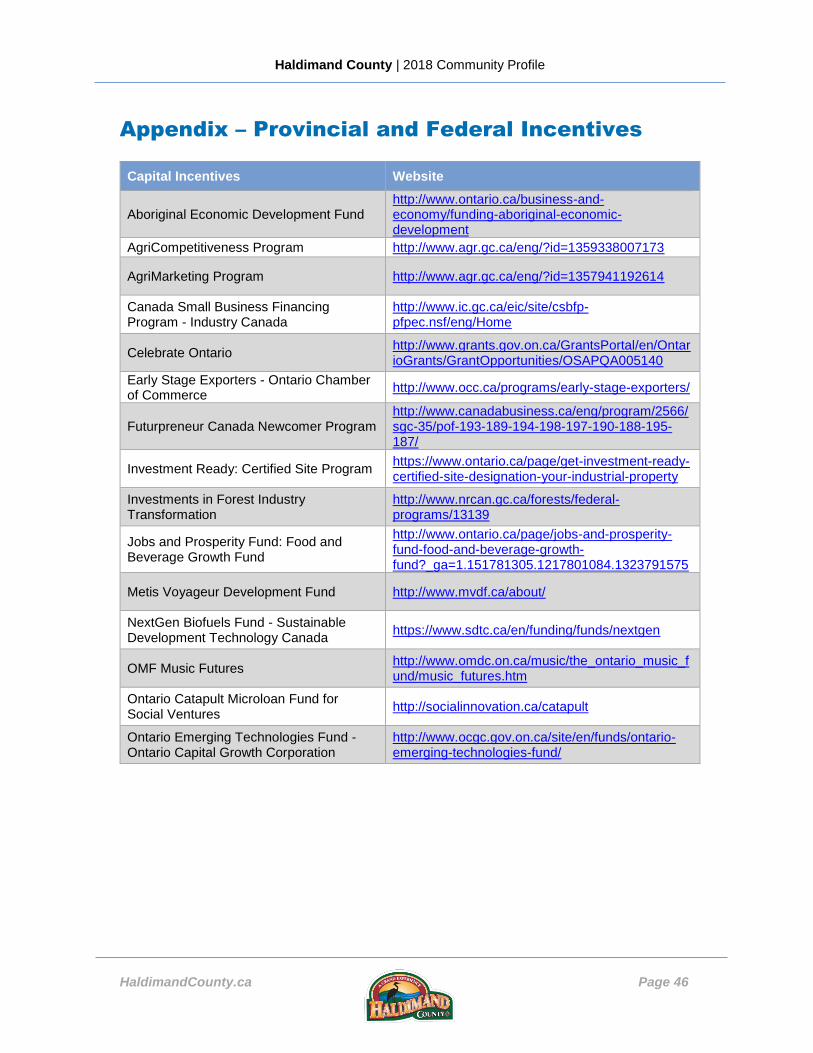
Haldimand County | 2018 Community Profile
HaldimandCounty.ca Page 46
Appendix – Provincial and Federal Incentives
Capital Incentives Website
Aboriginal Economic Development Fund http://www.ontario.ca/business-and-economy/funding-aboriginal-economic-development
AgriCompetitiveness Program http://www.agr.gc.ca/eng/?id=1359338007173
AgriMarketing Program http://www.agr.gc.ca/eng/?id=1357941192614
Canada Small Business Financing Program - Industry Canada
http://www.ic.gc.ca/eic/site/csbfp-pfpec.nsf/eng/Home
Celebrate Ontario http://www.grants.gov.on.ca/GrantsPortal/en/OntarioGrants/GrantOpportunities/OSAPQA005140
Early Stage Exporters - Ontario Chamber of Commerce
http://www.occ.ca/programs/early-stage-exporters/
Futurpreneur Canada Newcomer Program http://www.canadabusiness.ca/eng/program/2566/sgc-35/pof-193-189-194-198-197-190-188-195-187/
Investment Ready: Certified Site Program https://www.ontario.ca/page/get-investment-ready-certified-site-designation-your-industrial-property
Investments in Forest Industry Transformation
http://www.nrcan.gc.ca/forests/federal-programs/13139
Jobs and Prosperity Fund: Food and Beverage Growth Fund
http://www.ontario.ca/page/jobs-and-prosperity-fund-food-and-beverage-growth-fund?_ga=1.151781305.1217801084.1323791575
Metis Voyageur Development Fund http://www.mvdf.ca/about/
NextGen Biofuels Fund - Sustainable Development Technology Canada
https://www.sdtc.ca/en/funding/funds/nextgen
OMF Music Futures http://www.omdc.on.ca/music/the_ontario_music_fund/music_futures.htm
Ontario Catapult Microloan Fund for Social Ventures
http://socialinnovation.ca/catapult
Ontario Emerging Technologies Fund - Ontario Capital Growth Corporation
http://www.ocgc.gov.on.ca/site/en/funds/ontario-emerging-technologies-fund/
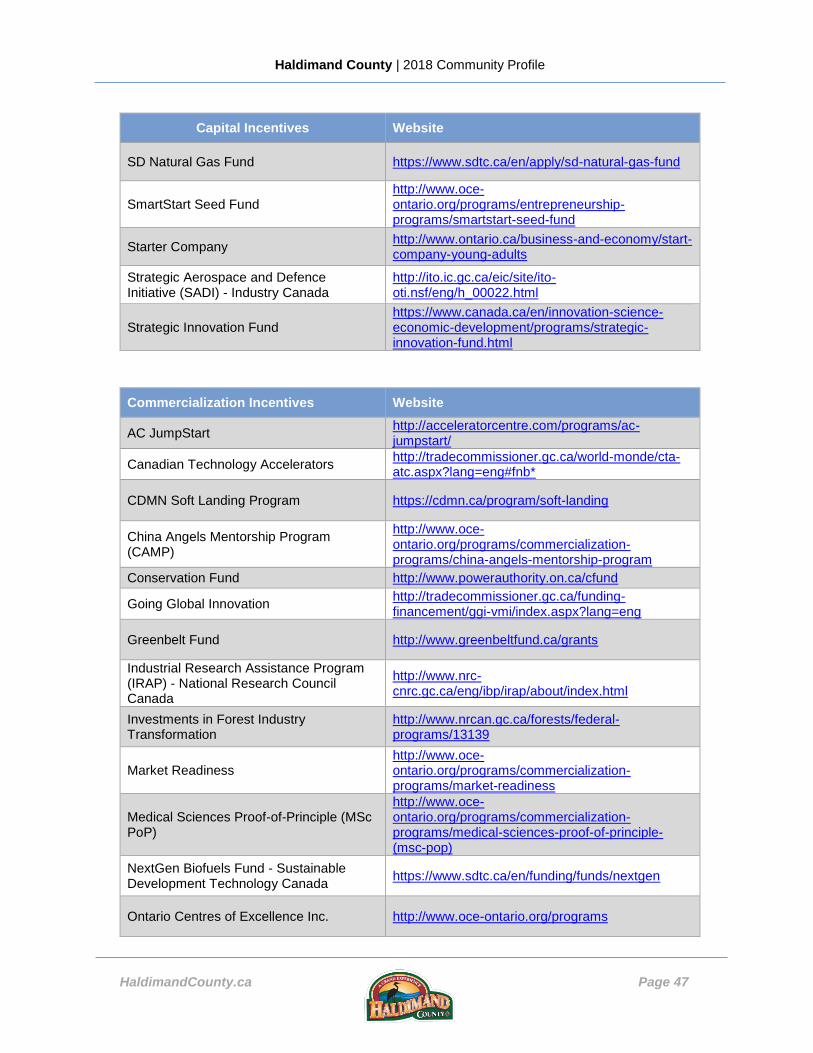
Haldimand County | 2018 Community Profile
HaldimandCounty.ca Page 47
Capital Incentives Website
SD Natural Gas Fund https://www.sdtc.ca/en/apply/sd-natural-gas-fund
SmartStart Seed Fund http://www.oce-ontario.org/programs/entrepreneurship-programs/smartstart-seed-fund
Starter Company http://www.ontario.ca/business-and-economy/start-company-young-adults
Strategic Aerospace and Defence Initiative (SADI) - Industry Canada
http://ito.ic.gc.ca/eic/site/ito-oti.nsf/eng/h_00022.html
Strategic Innovation Fund https://www.canada.ca/en/innovation-science-economic-development/programs/strategic-innovation-fund.html
Commercialization Incentives Website
AC JumpStart http://acceleratorcentre.com/programs/ac-jumpstart/
Canadian Technology Accelerators http://tradecommissioner.gc.ca/world-monde/cta-atc.aspx?lang=eng#fnb*
CDMN Soft Landing Program https://cdmn.ca/program/soft-landing
China Angels Mentorship Program (CAMP)
http://www.oce-ontario.org/programs/commercialization-programs/china-angels-mentorship-program
Conservation Fund http://www.powerauthority.on.ca/cfund
Going Global Innovation http://tradecommissioner.gc.ca/funding-financement/ggi-vmi/index.aspx?lang=eng
Greenbelt Fund http://www.greenbeltfund.ca/grants
Industrial Research Assistance Program (IRAP) - National Research Council Canada
http://www.nrc-cnrc.gc.ca/eng/ibp/irap/about/index.html
Investments in Forest Industry Transformation
http://www.nrcan.gc.ca/forests/federal-programs/13139
Market Readiness http://www.oce-ontario.org/programs/commercialization-programs/market-readiness
Medical Sciences Proof-of-Principle (MSc PoP)
http://www.oce-ontario.org/programs/commercialization-programs/medical-sciences-proof-of-principle-(msc-pop)
NextGen Biofuels Fund - Sustainable Development Technology Canada
https://www.sdtc.ca/en/funding/funds/nextgen
Ontario Centres of Excellence Inc. http://www.oce-ontario.org/programs

Haldimand County | 2018 Community Profile
HaldimandCounty.ca Page 48
Commercialization Incentives Website
Ontario Research Fund - Research Excellence (ORF-RE)
http://www.ontario.ca/business-and-economy/ontario-research-fund-research-excellence
Ontario Tax Exemption for Commercialization
https://www.ontario.ca/page/ontario-tax-exemption-commercialization
SD Natural Gas Fund https://www.sdtc.ca/en/apply/sd-natural-gas-fund
SMART Green Projects http://www.cme-smart.ca/smart-green
The Jobs and Prosperity Fund Strategic Partnership Stream
https://www.ontario.ca/page/jobs-and-prosperity-fund
Voucher for Commercialization
http://www.oce-ontario.org/programs/industry-academic-collaboration/collaboration-voucher-program/voucher-for-commercialization-(vc)/how-it-works
Digital Media Incentives Website
Canadian Media Fund: Convergent Stream
http://www.cmf-fmc.ca/funding-programs/convergent-stream/
Canadian Media Fund: Experimental Stream
http://www.cmf-fmc.ca/funding-programs/experimental-stream/
Film Fund - Ontario Media Development Fund
http://www.omdc.on.ca/film_and_tv/Funding/Film_Fund.htm
Film or Video Production Services Tax Credit (PSTC)
http://www.pch.gc.ca/eng/1268740529145
Industry Development Program - Ontario Media Development Corporation
http://www.omdc.on.ca/film_and_tv/Funding/Industry_Development_Program.htm
Interactive Digital Media Fund (IDM) - Ontario Media Development Corporation
http://www.omdc.on.ca/interactive/Interactive_Digital_Media_Fund/Production_and_Concept_Definition.htm
OMDC Research Grants http://www.omdc.on.ca/film_and_tv/research_and_industry_information/Research_Funded_by_OMDC.htm
Ontario Book Publishing Tax Credit (OBPTC)
http://www.omdc.on.ca/book/tax_credits/OBPTC.htm
Ontario Computer Animation and Special Effects Tax Credit (OCASE)
http://www.omdc.on.ca/film_and_tv/tax_credits/OCASE.htm
Ontario Film and Television Tax Credit (OFTTC)
http://www.omdc.on.ca/film_and_tv/tax_credits/OFTTC.htm

Haldimand County | 2018 Community Profile
HaldimandCounty.ca Page 49
Digital Media Incentives Website
Ontario Interactive Digital Media Tax Credit
http://www.omdc.on.ca/interactive/Tax_Credits.htm
Ontario Production Services Tax Credit (OPSTC)
http://www.omdc.on.ca/film_and_tv/tax_credits/OPSTC.htm
EDO-Community Infrastructure Incentives
Website
Natural Gas Grant Program http://www.infrastructureontario.ca/NGGP/
Infrastructure Lending http://www.infrastructureontario.ca/Infrastructure-Lending/
The Ontario Trillium Foundation http://www.trilliumfoundation.org/cms/en/index.aspx?menuid=57
Aboriginal Economic Development Fund http://www.ontario.ca/business-and-economy/funding-aboriginal-economic-development
Economic Development Initiative (EDI) http://fednor.gc.ca/eic/site/fednor-fednor.nsf/eng/h_fn03152.html
Invest Canada-Community Initiatives (ICCI) (Federal)
http://www.tradecommissioner.gc.ca/eng/funding/icci/home.jsp
Investment Ready: Certified Site Program https://www.ontario.ca/page/get-investment-ready-certified-site-designation-your-industrial-property
New Building Canada Fund (NBCF) http://www.infrastructure.gc.ca/plan/nbcf-nfcc-eng.html
Rural Economic Development (RED) Program
http://www.omafra.gov.on.ca/english/rural/red/
Canada Foundation for Innovation http://www.innovation.ca/en/OurFunds
New Relationship Fund https://www.ontario.ca/business-and-economy/new-relationship-fund

Haldimand County | 2018 Community Profile
HaldimandCounty.ca Page 50
Energy Incentives Website
Canadian Industry Program for Energy Conservation (CIPEC)
http://www.nrcan.gc.ca/energy/efficiency/industry/cipec/5153
Conservation Fund http://www.powerauthority.on.ca/cfund
ecoENERGY Efficiency for Industry Program: ISO 50001
http://www.nrcan.gc.ca/energy/efficiency/industry/financial-assistance/5387
Feed-in Tariff Program - Ontario Power Authority
http://fit.powerauthority.on.ca/fit-program
Industrial Electricity Incentive (IEI) Program
http://www.powerauthority.on.ca/iei
NextGen Biofuels Fund - Sustainable Development Technology Canada
https://www.sdtc.ca/en/funding/funds/nextgen
Ontario Green Investment Fund https://www.ontario.ca/page/green-investment-fund
Save on Energy https://www.saveonenergy.ca/Business.aspx
SD Natural Gas Fund https://www.sdtc.ca/en/apply/sd-natural-gas-fund
Smart Grid Fund http://www.energy.gov.on.ca/en/smart-grid-fund/
Export Incentives Website
Canadian Commercial Corporation (CCC) http://www.ccc.ca/
Export Development Canada http://www.edc.ca/
New Exporters to Border States (NEBS) http://www.canadabusiness.ca/eng/program/2229/
CanExport Program http://international.gc.ca/canexport/index.aspx?lang=eng
Expanding Market Opportunities Program http://www.nrcan.gc.ca/forests/federal-programs/13133
Export Development Canada http://www.edc.ca/
Export Market Access - A Global Expansion Program
http://exportaccess.ca/en/home
Investment Accelerator Fund (IAF) http://www.marsdd.com/aboutmars/partners/iaf/
Mining Supply & Services Export Assistance Program
http://investnorthernontario.com/index.aspx?l=0,1,6,269
Ontario Exporters Fund http://www.ontarioexporters.ca/home/

Haldimand County | 2018 Community Profile
HaldimandCounty.ca Page 51
Human Resources and Training Incentives
Website
Abilities Connect Fund - Ontario Chamber of Commerce
http://www.occ.ca/programs/accessibility-works/abilities-connect/
Aboriginal Participation Fund Values Mapping and Related Projects Stream
http://www.grants.gov.on.ca/GrantsPortal/en/OntarioGrants/GrantOpportunities/PRDR015178
Apprenticeship Enhancement Fund (AEF) - Ontario Ministry of Training, Colleges and Universities
http://www.tcu.gov.on.ca/eng/eopg/programs/aef_guide.html
Apprenticeship Job Creation Tax Credit - Canada Revenue Agency
http://www.cra-arc.gc.ca/tx/ndvdls/tpcs/ncm-tx/rtrn/cmpltng/ddctns/lns409-485/412/jctc-eng.html
Apprenticeship Training Tax Credit (ATTC) - Ministry of Finance
http://www.rev.gov.on.ca/en/credit/attc/
Canada Ontario Job Grant http://www.tcu.gov.on.ca/eng/eopg/cojg/index.html
Canada Summer Jobs http://www.servicecanada.gc.ca/eng/epb/yi/yep/programs/scpp.shtml
Canada-Ontario Job Grant http://www.tcu.gov.on.ca/eng/employmentontario/employers/jobGrant.html
Canadian Institutes of Health Research http://www.cihr-irsc.gc.ca/e/37788.html
Concierge Service - Government of Canada
http://concierge.portal.gc.ca/about-us
Cooperative Education Tax Credit (CETC) http://www.fin.gov.on.ca/en/credit/cetc/
Employer Signing Bonus - Ministry of Training, Colleges and Universities
http://www.tcu.gov.on.ca/eng/employers/emp_bonus.html
Human Resources and Training http://www.tcu.gov.on.ca/eng/eopg/programs/aef_guide.html
Industrial Research Assistance Program (IRAP) - National Research Council Canada
http://www.nrc-cnrc.gc.ca/eng/ibp/irap/about/index.html
Mitacs Accelerate http://www.mitacs.ca/accelerate
MITACS Elevate https://www.mitacs.ca/en/programs/elevate/program-details
Mushkegowuk Council Employment & Training Services
http://www.mushkegowuk.com/?page_id=2100

Haldimand County | 2018 Community Profile
HaldimandCounty.ca Page 52
Human Resources and Training Incentives
Website
NSERC CRD http://www.nserc-crsng.gc.ca/Professors-Professeurs/RPP-PP/CRD-RDC_eng.asp
Ontario Centres of Excellence Inc. http://www.oce-ontario.org/programs
Ontario Labour Market Partnerships http://www.tcu.gov.on.ca/eng/employers/labourMarket.html
Ontario Youth Apprenticeship Program (OYAP)
http://oyap.com/en/index.cfm
Pre-Apprenticeship Training Program - Ontario Ministry of Training, Colleges and Universities
http://www.tcu.gov.on.ca/eng/apprentices/pre_apprent.html
Skills Link Program http://www.servicecanada.gc.ca/eng/epb/yi/yep/newprog/skillslink.shtml
Summer Company
http://www.ontario.ca/business-and-economy/summer-company-program-guidelines-2013
The Canada-Ontario Job Grant: Customized Training
http://www.tcu.gov.on.ca/eng/eopg/cojg/index.html#applypilot
The Canada-Ontario Job Grant: UpSkill http://www.tcu.gov.on.ca/eng/eopg/cojg/index.html#applypilot
Work-Sharing Program - Human Resources and Skills Development Canada
http://www.servicecanada.gc.ca/eng/work_sharing/index.shtml
Youth Employment Fund http://www.tcu.gov.on.ca/eng/employmentontario/youthfund/
Youth Employment Program - National Research Council Canada
http://www.nrc-cnrc.gc.ca/eng/irap/services/youth_initiatives.html

Haldimand County | 2018 Community Profile
HaldimandCounty.ca Page 53
Research and Development Incentives Website
AgriInnovation Program http://www4.agr.gc.ca/AAFC-AAC/display-afficher.do?id=1354301302625&lang=eng
Canada Foundation for Innovation http://www.innovation.ca/en/OurFunds
Canadian Institutes of Health Research http://www.cihr-irsc.gc.ca/e/37788.html
Canadian International Innovation Program (CIIP)
http://tradecommissioner.gc.ca/funding-financement/ciip-pcii/ciip-pcii.aspx?lang=eng
Communications Research Centre Canada - Industry Canada
http://www.crc.gc.ca/eic/site/069.nsf/eng/h_00022.html
Early Researcher Awards
http://www.ontario.ca/business-and-economy/funding-academic-research-early-researcher-awards
Food Safety Research Program - OMAFRA http://www.omafra.gov.on.ca/english/research/foodsafety/fsresearchprogram.html
Growing Forward 2 (GF2) - OMAFRA http://www.omafra.gov.on.ca/english/about/growingforward/gf2-index.htm
Automotive Partnership Canada http://www.mitacs.ca/accelerate
Canada Foundation for Innovation http://www.omafra.gov.on.ca/english/research/new_directions/ndresearchprogram.html
Canadian Institutes of Health Research https://www.sdtc.ca/en/funding/funds/nextgen
Canadian International Innovation Program (CIIP)
http://www.oce-ontario.org/programs
CDMN Soft Landing Program http://www.ocgc.gov.on.ca/site/en/funds/ontario-emerging-technologies-fund/
Collaborative Research and Development Grants
http://www.rev.gov.on.ca/english/credit/oitc/index.html
College and Community Innovation Program & Applied Research and Development Grants
http://www.rev.gov.on.ca/en/credit/ordtc/index.html
Communications Research Centre Canada - Industry Canada
http://www.ontario.ca/business-and-economy/ontario-research-fund-research-excellence
Early Researcher Awards http://www.omafra.gov.on.ca/english/research/onqc_research/index.html

Haldimand County | 2018 Community Profile
HaldimandCounty.ca Page 54
Research and Development Incentives Website
Industrial Research Assistance Program (IRAP) - National Research Council Canada
http://www.cra-arc.gc.ca/sred/
Industrial Research Chairs Grants https://www.sdtc.ca/en/apply/sd-natural-gas-fund
Mitacs Accelerate http://ito.ic.gc.ca/eic/site/ito-oti.nsf/eng/h_00022.html
New Directions Research Program - OMAFRA
http://ito.ic.gc.ca/eic/site/ito-oti.nsf/eng/h_00837.html
NextGen Biofuels Fund - Sustainable Development Technology Canada
http://www.omafra.gov.on.ca/english/research/uofgagreement/uofgpartnership.html#research
NSERC Engage R&D http://www.nrc-cnrc.gc.ca/eng/irap/services/youth_initiatives.html
Ontario Centres of Excellence Inc. https://www.sdtc.ca/en/apply/sd-tech-fund
Ontario Emerging Technologies Fund - Ontario Capital Growth Corporation
https://www.ontario.ca/page/jobs-and-prosperity-fund
Source: McSweeney & Associates