Embed Size (px)
Citation preview

17-08-2021
Prashanti Sharma
Photo: DoFPS, Bhutan
Habitat suitability modeling
of landscape-scale
umbrella species

What is spatial data
Data related to or containing information about a specific
location on the Earth’s surface
VectorRaster

Attributes information Projection system
Geographic and projected co-ordinate system
Components of Spatial Data

To study and simulate spatial objects or
phenomena that occur in the real world tofacilitate problem solving and planning.
The Key elements are:
• Scale
• Pattern
• Noise
Accuracy and Precision
Geospatial
modeling
Hazard analysis using geospatial modelling

Wildlife habitat models represent the presumed or known
relationships between a species and the various environmental
components that are needed for survival and reproduction
(Cushman et 2013)
Important building block of connectivity models – A resistance
raster
Habitat suitability modeling

• Overlay analysis:
Raster overlay
Weighted overlay
• Species distribution model:
includes species presence/absence data
Regression Models
Machine learning Models
Ensemble model
Habitat suitability modeling
DEM Distance from road Distance from settlement
Bioclimatic Land cover Human-footprint index
equation

Among the world’s most important global resources, the HKH—Hindu Kush Himalaya—sits at the peak.
Habitat suitability of Leaf deer, Takin and Red
panda in the eastern Himalayan landscape
Source: Uddin et al., 2019
Predicted range expansion of Ageratina adenophora
and Bidens pilosa for year 2050 and 2070 at different
climatic scenario
Source: Thapa et al., 2018

Weighted overlay analysis for habitat
suitability

Liberal models
Types of overlay analysis:
Additive mean – calculated using addition of data layers
Geometric mean - calculated using geometric mean of data layers
Overview of Weighted Overlay analysis
Source: Arc GIS

1. Define objective
2. Determine evaluation criteria
3. Acquire spatial datasets for criteria
4. Provide scores within criteria
5. Evaluate weights for each criteria
6. Perform overlay analysis
7. Evaluate and interpret results
Steps in Weighted Overlay analysis

To develop habitat suitability map for
Kangchenjunga landscape for umbrella species
Defining objective

Determining criteria
• Land cover/ Land use pattern
Surface
• Human infrastructureTransportation network
Settlement
Utilities
• Terrain characteristicsElevationTopographic position
Slope
• Climate considerationTemperature
Precipitation
• Surface hydrology
• Geology
• Soil characteristics

Criteria used in the
study
Land cover – ICIMOD Regional database system for HKH
Distance to all road- Road line layer: Open Street Map
Distance to major settlement- Point layer- Open Street Map (Cities and Towns)
Topographic position- Raster layer: Derived from Elevation
Elevation- Raster layer: Shuttle Radar Topography Mission (SRTM)
Distance to river- Line vector layer: ICIMOD Regional database system for HKH

• Is it available in spatial format
• Source of the dataset
• Spatial resolution of dataset
• What is the latest available dataset
Some of the globally available data set for:
• Climate: World clim, NCAR CommunityClimate System Model (CCSM)
• Hydrology: HdroSHEDS, JRC Global Surface Water,
• Landover: Copernicus global land cover, USGS GLCC, SERVIR HKH RLCM (available
shortly)
Acquiring spatial data

Defining scoresProvide scores based on suitability classes
Ranges or discrete classes are provided with
score/rank to each categories based on
suitability
All criteria must be scored in the same scale
Mathematical function such as linear scaling
are also used to provide scores and form
continuous raster
Forest cover type
Needle leave forest 4
Broad leave forest 4
Mixed forest 2
Thorn forest 1
Distance to nearest road
<0.5 km 4
0.5 km - 2 km 3
2 km - 8 km 2
>8 km 1

• Reclassify tool to set scores
• Euclidean distance to road layer
• Reclassify road layer closet as least suitable
and furthest as most suitable
• Carry out this steps for all raster criteria layers
Example for reclassifying road
(continuous) layer

Determining weightsMost commonly used method:
Saaty’s (2012) Analytical Hierarchy Process using pairwise comparison
among criteria
Based on:
Best judgement
Expert knowledge
Literature
Stakeholder consultation(preference)
Land
coverHydrology Remoteness
Habitat 1 Habitat 2
Habitat of Red
Panda
Level 1: GOAL
Level 2: CRITERIA
Level 3: ALTERNATIVES

Saaty's Pairwise comparison scale
Extremely important9
8
V. strongly more important7
6
Strongly more important5
4
Moderately more important3
2
Equally important 1
Criteria Land cover Dist to roadDist to major settlement
Topographic position Elevation Dist to rivers
Landcover 1 4 4 4 3 4
Dist to road 1/4 1 1/2 1/3 1/3 1/2
Dist to major settlement 1/4 2 1 1/3 1/3 1/2
Topographic position 1/4 3 3 1 1/3 3
Elevation 1/3 3 3 3 1 3
Distance to rivers 1/4 2 2 1/3 1/3 1
SUM 2.333333 15 13.5 9 5.33333 12
CriteriaLand cover Dist to road
Dist to major settlement
Topographic position Elevation
Dist to rivers AVERAGE Weights
Final Weights*
Land cover 0.43 0.267 0.29 0.44 0.56 0.3 0.38 38.86 39%
Dist to road 0.11 0.067 0.03 0.03 0.06 0.04 0.058 5.86 6%
Dist to major settlement 0.11 0.13 0.07 0.03 0.06 0.04 0.075 7.59 8%
Topographic position 0.11 0.2 0.22 0.1 0.06 0.25 0.158 15.88 16%
Elevation 0.14 0.2 0.22 0.3 0.18 0.25 0.22 22.1 22%
Dist to rivers 0.11 0.13 0.14 0.03 0.062 0.083 0.095 9.52 10%
*Weights should add up to 100

• Weighted Overlay Analysis – Arc GIS tool
Additive mean
Sum(creiteria1*Weight1+ creiteria2*Weight2+ criteria3*W3 +………)
• Weighted Geometric mean
Formula:
HSI= Product((Criteria1^Weight1)*(Criteria2^Weight2)*(Criteria3^Weight3))^(1/ sumWn)
Overlay Analysis
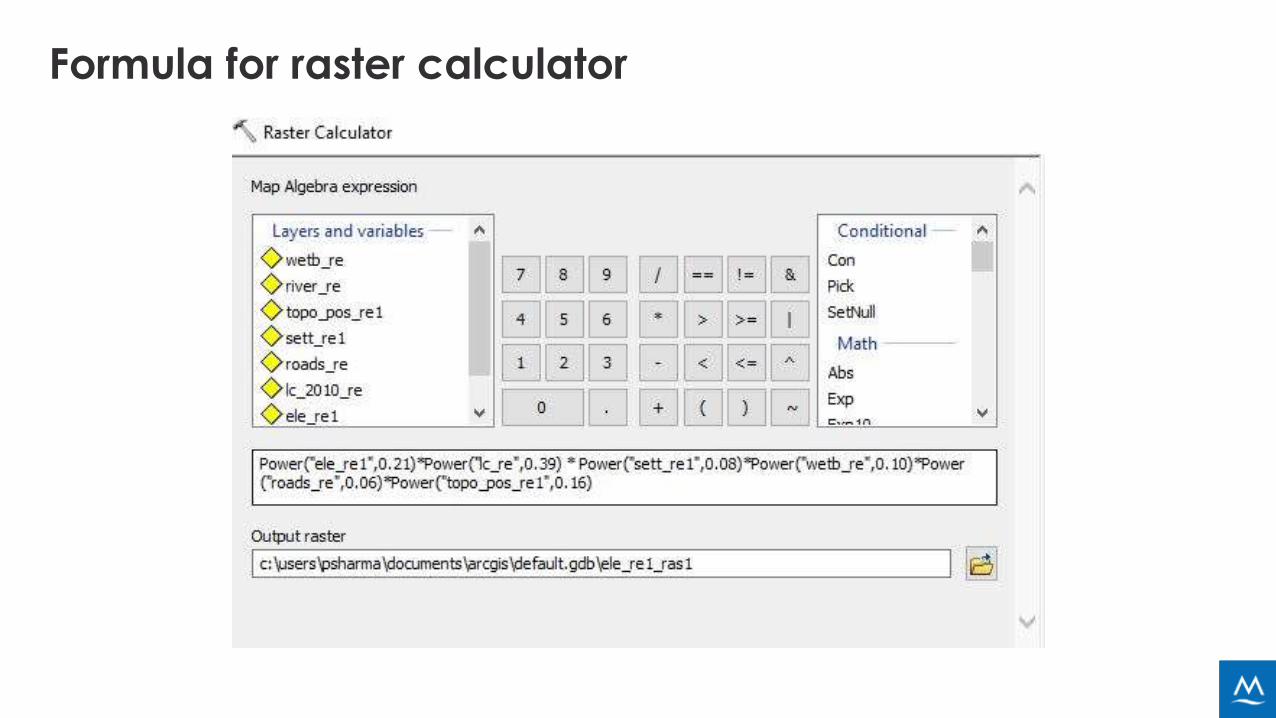
Formula for raster calculator

Habitat suitability map generated from overlay analysis

Classified habitat suitability for terrestrial wildlife of the Kangchenjunga landscape

Conclusion
Weighted Overlay analysis can be used in areas of presence-absence
data
Selection of and justification of weights could problematic.
Species distribution software like MaxEnt can be explored if data allows
Species level information is necessary to reach certain degree to
accuracy and validation.

• Arc Map guide to Overlay analysis: https://desktop.arcgis.com/en/arcmap/10.3/tools/spatial-
analyst-toolbox/how-weighted-overlay-works.htm
• Suitability analayis : Helmut Flitter et al., http://www.gitta.info/Suitability/en/text/Suitability.pdf
• GIS-Based Multicriteria Evaluation of Land Suitability for Grasslands Conservation in
Chihuahua, Mexico: Vázquez-Quintero et al.,
• A GIS-based habitat suitability model for commercial yield estimation of Tapes
philippinarum in a Mediterranean coastal lagoon (Sacca di Goro, Italy)
Reading materials

Thank you
Protect the pulse.