Embed Size (px)
Citation preview

H2 at Scale Houston May 23, 2017 1
November 8, 2018Brussels, Belgium
H2@Scale: Energy System Wide Benefits of Increased Hydrogen Implementation
THEAmesLab
Presented by Bryan PivovarNational Renewable Energy Lab
Expanded content included in this presenation available athttps://www.hydrogen.energy.gov/pdfs/review18/h2000_pivovar_2018_o.pdfhttps://www.hydrogen.energy.gov/pdfs/review18/tv045_ruth_2018_o.pdfhttp://energy.gov/eere/fuelcells/downloads/h2-scale-potential-opportunity-webinar

H2 at Scale Houston May 23, 2017 2
Air Quality – Downtown Denver
Thursday12/29/16
27 September 2016 | GENEVA - A new WHO air quality model confirms that 92% of the world’s population lives in places where air quality levels exceed WHO limits.
http://www.cnn.com/2014/03/25/health/who-air-pollution-deaths/
WHO: Air pollution caused one in eight deaths / March 25, 2014
Wednesday12/28/16

3
Select (Relevant) Megatrends
• Increased global focus on emissions, increased policy regulations (market impact)
• Low, cost intermittent renewable electrons
• Increased electrification
• Connectivity, Autonomy, Machine Learning
Katia Irma
Jose
Wildfires
12/29/16
The Great Barrier Reef’s catastrophic coral bleaching, in one map
When the Planet Looks Like a Climate-Change Ad (9/12/17)https://www.theatlantic.com/science/archive/2017/09/an-extraordinary-week-in-north-american-weather/539544/
Downtown Denver from NREL’s Energy System Integration Facility

4
Changing Energy System – Policy
Wildfires
Renewable Portfolio Standards (RPS)Senate Bill 100, signed by Gov. Edmund G. Brown, Jr. codifies 60% by 2030 & 100% by 2045 RPS (2018)http://www.energy.ca.gov/renewables/
Zero Emission Vehicles (ZEV)2016 ZEV Action Plan toward 1.5 million ZEVs by 2025.https://www.gov.ca.gov/docs/2016_ZEV_Action_Plan.pdf
Renewable Gas StandardSB-687 Renewable gas standardhttp://leginfo.legislature.ca.gov/faces/billNavClient.xhtml?bill_id=201520160SB687
WA: 15% x 2020*
OR: 50%x 2040* (large utilities)
CA: 50%
x 2030
MT: 15% x 2015
NV: 25% x
2025* UT: 20% x
2025*†
AZ: 15% x
2025*
ND: 10% x 2015
NM: 20%x 2020
(IOUs)
HI: 100% x 2045
CO: 30% x 2020
(IOUs) *†
OK: 15% x
2015
MN:26.5%
x 2025 (IOUs)31.5% x 2020 (Xcel)
MI: 10% x
2015*†WI: 10%
2015
MO:15% x
2021
IA: 105 MWIN:
10% x
2025†IL: 25%
x 2026
OH: 12.5%
x 2026
NC: 12.5% x 2021 (IOUs)
VA: 15%
x 2025†KS: 20% x 2020
ME: 40% x 2017
29 States + Washington
DC + 3 territories have a
Renewable Portfolio
Standard as of August 2016(8 states and 1 territories have
renewable portfolio goals)Renewable portfolio standard
Renewable portfolio goal Includes non-renewable alternative resources* Extra credit for solar or customer-sited renewables
†
U.S. Territories
DC
TX: 5,880 MW x 2015*
SD: 10% x 2015
SC: 2% 2021
NMI: 20% x 2016
PR: 20% x 2035
Guam: 25% x 2035
USVI: 30% x 2025
NH: 24.8%x 2025
VT: 75% x 2032
MA: 15% x 2020(new resources)
6.03% x 2016 (existing resources)
RI: 38.5% x 2035
CT: 27% x 2020
NY:50% x 2030
PA: 18% x 2021†
NJ: 20.38% RE x 2020 + 4.1% solar by 2027
DE: 25% x 2026*
MD: 20% x 2022
DC: 20% x 2020
https://www.c2es.org/us-states-regions/policy-maps/zev-program

H2 at Scale Houston May 23, 2017 5
Renewable electricity price trends
Source: (Arun Majumdar) 1. DOE EERE Sunshot Q1’15 Report, 2. DOE EERE Wind Report, 2015

H2 at Scale Houston May 23, 2017 6
Renewable Challenges
-5,000
0
5,000
10,000
15,000
20,000
25,000
30,000
35,000
PV Penetration and Hour
Ge
ne
rati
on
(M
W)
PV
Gas
TurbinePumped
StorageHydro
Combined
CycleImports
Coal
Nuclear
Wind
Geo
Exports
Base 2% 6% 10%
(no PV)
Denholm et al. 2008

7
Energy System Challenge
• Multi-sector requirements
o Transportation
o Industrial
o Grid
How do we supply all these services in the
best way?

8
•Dwight D. Eisenhower
"If you can't solve a problem, enlarge it"
9
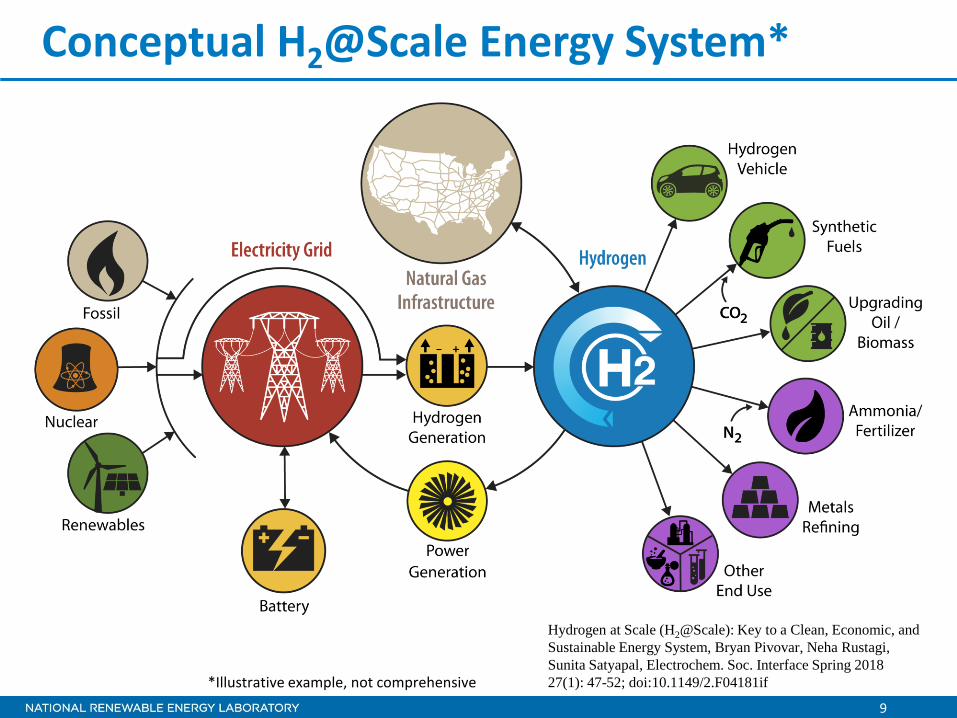
Conceptual H2@Scale Energy System*
*Illustrative example, not comprehensive
Hydrogen at Scale (H2@Scale): Key to a Clean, Economic, and
Sustainable Energy System, Bryan Pivovar, Neha Rustagi,
Sunita Satyapal, Electrochem. Soc. Interface Spring 2018
27(1): 47-52; doi:10.1149/2.F04181if

10
H2@Scale Vision
• Attributeso Cross-sectoral and temporal energy impact
o Clean, efficient end use
• Benefitso Economic factors (jobs, GDP)
o Enhanced Security (energy, manufacturing)
o Environmental Benefits (air, water)
Getting all these benefits in a single energy system significantly enhances value proposition.

11
Changing times for H2

H2 at Scale Houston May 23, 2017 12
H2 is different and changing fast• H2 Council*
o Launched in January 2017 its members include leading companies with over $10 billion in investments along the hydrogen value chain, including transportation, industry, and energy exploration, production, and distribution.
*Steering members shown, additional supporting memberswww.hydrogencouncil.com
32 steering members and 20 supporting members (Nov 2018).
13 members (Jan 2017).

13
Real-world H2@Scale Examples
Real World H2 Implementation/Plans (LDV)
>5,000 Fuel Cell Vehicles and 35 commercial H2 fueling stations open in CA.
https://www.energy.gov/sites/prod/files/2018/08/f54/fcto-h2-scale-kickoff-2018-14-bouwcamp.pdf

14
Real-world H2@Scale Examples
Real World H2 Implementation/Plans (HDV)
1,000 kg/day hydrogen stations to be deployed in 14-28 locations for fuel cell
trucks (2018; Nikola, Nel)
8.08 AM CEST / 28-Jun-2018 / NEL ASA (OSE:NEL)
Nel ASA: Awarded multi-billion NOK
electrolyzer and fueling station contract by Nikola
https://www.energy.gov/sites/prod/files/2018/08/f54/fcto-h2-scale-kickoff-2018-17-schneider.pdf

15
Real-world H2@Scale Examples
Integration of 1.5-MW of electrolysis with wind and tidal power in Orkney, Scotland
(2018; BIG HIT project)
750,000 tonne/year ammonia plant using by-product hydrogen opens in Freeport, TX
(2018; Yara, BSF)

H2 at Scale Houston May 23, 2017 16
H2@Scale CRADA Call Selections
Selections and subsequent working group
assignments are subject to negotiation.
First round of Selections Include 24 Applications from:
Component R&D
• California Go-Biz Office
• Frontier Energy
• HyET• Honda• NanoSonic• RIX• Tatsuno
Hydrogen Integration
• Electric Power Research Institute
• Exelon
• Southern Company / Terrestrial Energy
• Nikola Motor • Pacific Gas & Electric• TerraPower
Hydrogen Production R&D
• Honda• C4-MCP, Inc.
• GinerELX
• GTA, Inc.
H2 Station Risk Analysis
• Air Liquide
• California Energy Commission
• Connecticut Center for Advanced
Technology
• PDC Machines
• Quong & Associates, Inc.

NREL | 17
Approach: Analyze the Technical and Economic Potential of the H2@Scale Concept
Figure Source: Brown, A., P. Beiter, D. Heimiller, C. Davidson, P. Denholm, J. Melius, A. Lopez, D. Hettinger, D. Mulcahy, and G. Porro. 2015. Estimating Renewable Energy Economic Potential in the United States: Methodology and Initial Results. Golden, CO: National Renewable Energy Laboratory. NREL/TP-6A20-64503
Technical potential – market and resource potential that is constrained by existing end-uses, real-world geography, and system performance. Not constrained by economics.Economic potential – subset of the technical potential where hydrogen is less expensive than other options that can supply the end use.

NREL | 18
* MMT: Million metric tonnes§ CPI: Chemical Processing Industry not including metals, ammonia, methanol, or biofuelsLight duty vehicle calculation basis: 190,000,000 light-duty FCEVs from http://www.nap.edu/catalog/18264/transitions-to-alternative-vehicles-and-fuels
Current U.S. market: ≈ 13 MMT/yrIncluding captive generation for ammonia and refining
Technical Potential Demand: 87 MMT/yr
Accomplishment: Estimated Technical Potential Hydrogen Demand
Demand Technical potential (MMT* / year)
Refineries & CPI§
8
Metals 6
Ammonia 5
Methanol 1
Biofuels 1
Natural Gas 7
Light Duty Vehicles
28
Other Transport
3
Electricity Storage
28
Total 87
}

NREL | 19
Pri
ce
Quantity
Demand Curve Demand Curve: how much are consumers willing and able to pay for a good?
Pri
ce
Quantity
Supply Curve
Pri
ce
Quantity
Economic Equilibrium
Supply
Demand
Supply Curve: how much are producers willing and able to produce at various prices?
Economic Equilibrium: Quantity where the demand price is equal to the supply price. • No excess supply or demand. • Market will push price and quantity to
equilibrium.Schwartz, Robert A. Micro Markets A Market Structure Approach to Microeconomic Analysis. Wiley Finance. Chichester: Wiley, 2010.
Approach: Estimate Economic Potential as Hydrogen Prices and Quantities at Market Equilibria

NREL | 20
Accomplishment: Developed Four Economic Potential Scenarios
Estimated hydrogen market size: 20-31 MMT/yr with AEO Low Oil & Gas Resource Scenario natural gas prices.
Supply Supply
Demand Demand

NREL | 21
Accomplishment: Initiated Analysis of Spatial and Temporal Issues
In the H2@Scale Success Upper Bound scenario, most of the hydrogen is produced from wind power in the middle of the country and
demand is dispersed, but mainly on the coasts.
Electrolysis includes low-temperature and high-temperature electrolysis

NREL | 22
Accomplishment: Initiated Analysis of Spatial and Temporal Issues
In the H2@Scale Success Upper Bound scenario, initial analyses indicate pipeline transport is the most economic method to get
hydrogen from production to demand for most corridors.
Electrolysis includes low-temperature and high-temperature electrolysis

23
Improving the economics of H2@Scale Use Potential
MMT/yr
Refineries & CPI 8
Metals 6
Ammonia 5
Methanol 1
Biofuels 1
Natural Gas 7
Light Duty Vehicles 28
Other Transport 3
Electricity Storage 28
Total 87
Early-stage research is required to evolve and de-risk the technologies
Decreasing cost of H2 production
Optimizing H2 storage and distribution
Leveraging of national laboratories’ early-stage R&D capabilities needed
to develop affordable technologies for
production, delivery, and end use applications.
https://www.hydrogen.energy.gov/pdfs/review18/tv045_ruth_2018_o.pdf
Preliminary
STOREImproved Bulk Storage Technologies

H2 at Scale Houston May 23, 2017 24
H2 at Scale Big Idea Teams/Acknowledgement
Steering Committee: Bryan Pivovar (lead, NREL), Amgad Elgowainy (ANL),
Richard Boardman (INL), Adam Weber (LBNL), Rod Borup (LANL), Mark Ruth (NREL), Jamie Holladay (PNNL), Chris
Moen (SNL), Don Anton (SRNL)
Low T Generation:
Rod Borup (lead, LANL); Jamie
Holladay (PNNL); Christopher San
Marchi (SNL); Hector Colon Mercado (SRNL); Kevin
Harrison (NREL); Ted Krause (ANL); Adam Weber (LBNL); David
Wood (ORNL)
High T Generation:
Jamie Holladay (lead, PNNL); Jim
O'Brien (INL); Tony McDaniel (SNL); Ting He (INL); Mike Penev (NREL); Bill Summers (SRNL); Maximilian Gorensek (SRNL); Jeffery Stevenson
(PNNL); Mo Khaleel(ORNL)
Utilization: Richard Boardman
(lead, INL); Don Anton (SRNL);
Amgad Elgowainy (ANL); Bob Hwang
(SNL); Mark Bearden (PNNL); Mark Ruth
(NREL); Colin McMillan (NREL);
Ting He (INL); Michael Glazoff
(INL); Art Pontau (SNL); Kriston Brooks
(PNNL); Jamie Holladay (PNNL); Christopher San
Marchi (SNL); Mary Biddy (NREL) ; Geo
Richards (NETL)
Storage and Distribution:
Don Anton (lead, SRNL); Chris San
Marchi (SNL); Kriston Brooks (PNNL); TroySemelsberger
(LANL); Salvador Aceves (LLNL); Thomas
Gennett (NREL); Jeff Long (LBNL); Mark
Allendorf (SNL); Mark Bowden PNNL;
Tom Autrey PNNL
Future Electric Grid:
Charles Hanley (lead, SNL); Art
Anderson (NREL); Bryan Hannegan (NREL); Chris San
Marchi (SNL); Ross Guttromson (SNL); Michael Kintner-
Meyer (PNNL); Jamie Holladay (PNNL);
Rob Hovsapian (INL)
Foundational Science:
Adam Weber (lead, LBNL); Voja
Stamekovic (ANL); Nenad Markovic
(ANL); Frances Houle (LBNL); Morris
Bullock (PNNL); Aaron Appel (PNNL);
Wendy Shaw (PNNL); Tom
Jaramillo (SLAC);Jens Norskov (SLAC);
Mark Hartney(SLAC), Vitalij
Pecharsky (Ames); Alex Harris (BNL)
Analysis: Mark Ruth (lead,
NREL); Amgad Elgowainy (co-lead, ANL); Josh Eichman (NREL); Joe Cordaro
(SRNL); Salvador Aceves (LLNL); Max Wei (LBNL); Karen Studarus (PNNL); Todd West (SNL);
Steve Wach (SRNL); Richard Boardman
(INL); David Tamburello (SRNL);
Suzanne Singer (LLNL)
H2@Scale has moved beyond this National Lab team to include DOE offices, and industrial/other stakeholders.

H2 at Scale GM Brown Bag March 23, 2017 25
Thank You