Embed Size (px)
Citation preview

© OCR 2016 H081/01 Turn over [601/8665/3] DC (…) R10051/13
Oxford Cambridge and RSA
AS Level Geography H081/01 Landscape and place Sample Question Paper
Date – Morning/Afternoon Time allowed: 1 hour 45 minutes
You must have:
• the Resource Booklet
• the OCR 12–page Answer Booklet
(OCR 12 sent with general stationary)
You may use:
• a ruler (cm/mm)
• a piece of string
• a scientific or graphical calculator
* 0 0 0 0 0 0 *
INSTRUCTIONS
• Use black ink. You may use an HB pencil for graphs and diagrams. • Section A: Choose one option and answer all parts of the question in the option.
• Section B: Answer all questions.
• Section C: Answer all questions.
• Write your answer to each question in the Answer Booklet. • Additional paper may be used if required but you must clearly show your candidate
number, centre number and question number(s). • Do not write in the bar codes.
• The separate Resource Booklet will be found inside this document.
INFORMATION
• The total mark for this paper is 82. • The marks for each question are shown in brackets [ ]. • Quality of extended responses will be assessed in questions marked with an asterisk (*).
• This document consists of 8 pages.
SPECIMEN

© OCR 2016 H081/01
2
Turn over
Section A – Landscape Systems
Choose one option and answer all parts of the question in the option.
Option A – Coastal Landscapes
1 (a) Fig. 1 shows sediment size of beach material collected on two beaches.
(i) Using evidence from Fig. 1, compare and contrast the two sets of data.
[3]
(ii) Suggest reasons for the differences between the two samples in Fig. 1.
[4]
(b) Explain the formation of tombolos.
[8]
(c)* Assess the extent to which human activity has unintentionally rather than intentionally
caused change within coastal landscape systems.
[14]
OR
Option B – Glaciated Landscapes
2 (a) Fig. 2 shows sediment size of material collected from a till sheet and from an outwash plain.
(i) Using evidence from Fig. 2, compare and contrast the two sets of data.
[3]
(ii) Suggest reasons for the differences between the two samples in Fig. 2.
[4]
(b) Explain the formation of kames.
[8]
(c)* Assess the relative significance of the change caused by human activity within periglacial
and glacial landscape systems.
[14]
OR
Option C – Dryland Landscapes
3 (a) Fig. 3 shows sediment size of material collected from an alluvial fan and from a wadi.
(i) Using evidence from Fig. 3, compare and contrast the two sets of data.
[3]
(ii) Suggest reasons for the differences between the two samples in Fig. 3.
[4]
(b) Explain the formation of barchans.
[8]
(c)* Assess the relative importance of economic activity and water supply issues in causing
change within dryland landscape systems.
[14]
SPECIMEN

© OCR 2016 H081/01
3
Turn over
Section B – Changing Spaces; Making Places
Answer all questions.
4 (a) Explain the types of evidence that could be used to show social inequality.
[4]
(b) Fig. 4 shows an inner city area in the UK.
(i) Using Fig. 4 state one piece of evidence which shows that this area is in need of
rebranding.
[1]
(ii) With reference to Fig.4, suggest two appropriate strategies for rebranding this area.
[4]
(c) Using evidence from Fig. 5, suggest why government expenditure on education is unequal.
[6]
(d)* ‘Community groups are the most important players in the placemaking process.’ To what
extent do you agree with this statement?
[14]
SPECIMEN

© OCR 2016 H081/01
4
Section C – Fieldwork
Answer all questions.
5 (a) Study Fig. 6, an OS map extract of an area in which it is proposed to carry out an AS level
geography investigation.
(i) Suggest a geographical question or issue that can be investigated in the area shown.
Justify using map evidence.
[4]
(ii) State two examples of different types of secondary data that you would use to aid the
investigation suggested in (a)(i).
[2]
(iii) Explain one suitable method you would use to collect data for the investigation
suggested in (a)(i).
[6]
(b) With reference to a fieldwork investigation you have carried out, to what extent was your
investigation successful?
[12]
SPECIMEN

© OCR 2016 H081/01
5
BLANK PAGE
SPECIMEN

© OCR 2016 H081/01
6
BLANK PAGE
SPECIMEN

© OCR 2016 H081/01
7
BLANK PAGE
SPECIMEN

© OCR 2016 H081/01
8
Copyright Information:
OCR is committed to seeking permission to reproduce all third–party content that it uses in the assessment materials. OCR has attempted to
identify and contact all copyright holders whose work is used in this paper. To avoid the issue of disclosure of answer–related information to
candidates, all copyright acknowledgements are reproduced in the OCR Copyright Acknowledgements booklet. This is produced for each
series of examinations and is freely available to download from our public website (www.ocr.org.uk) after the live examination series.
If OCR has unwittingly failed to correctly acknowledge or clear any third–party content in this assessment material, OCR will be happy to correct
its mistake at the earliest possible opportunity.
For queries or further information please contact the Copyright Team, First Floor, 9 Hills Road, Cambridge CB2 1GE.
OCR is part of the Cambridge Assessment Group; Cambridge Assessment is the brand name of University of Cambridge Local Examinations
Syndicate (UCLES), which is itself a department of the University of Cambridge.
SPECIMEN

R10051/13
…day June 20XX – Morning/Afternoon
AS Level Geography
H081/01 Landscape and place
SAMPLE MARK SCHEME Duration: 1 hour 45 minutes
MAXIMUM MARK 82
DRAFT
This document consists of 36 pages
SPECIMEN

H081/01 Mark Scheme June 20xx
2
MARKING INSTRUCTIONS PREPARATION FOR MARKING
SCORIS
1. Make sure that you have accessed and completed the relevant training packages for on–screen marking: scoris assessor Online Training; OCR Essential Guide to Marking.
2. Make sure that you have read and understood the mark scheme and the question paper for this unit. These are posted on the RM Cambridge Assessment Support Portal http://www.rm.com/support/ca
3. Log–in to scoris and mark the required number of practice responses (“scripts”) and the required number of standardisation responses.
YOU MUST MARK 10 PRACTICE AND 10 STANDARDISATION RESPONSES BEFORE YOU CAN BE APPROVED TO MARK LIVE SCRIPTS.
TRADITIONAL
Before the Standardisation meeting you must mark at least 10 scripts from several centres. For this preliminary marking you should use pencil and
follow the mark scheme. Bring these marked scripts to the meeting.
MARKING
1. Mark strictly to the mark scheme.
2. Marks awarded must relate directly to the marking criteria.
3. The schedule of dates is very important. It is essential that you meet the scoris 50% and 100% (traditional 50% Batch 1 and 100% Batch 2) deadlines. If you experience problems, you must contact your Team Leader (Supervisor) without delay.
4. If you are in any doubt about applying the mark scheme, consult your Team Leader by telephone, email or via the scoris messaging system.
SPECIMEN

H081/01 Mark Scheme June 20xx
3
5. Work crossed out: a. where a candidate crosses out an answer and provides an alternative response, the crossed out response is not marked and gains no
marks b. if a candidate crosses out an answer to a whole question and makes no second attempt, and if the inclusion of the answer does not
cause a rubric infringement, the assessor should attempt to mark the crossed out answer and award marks appropriately. 6. Always check the pages (and additional objects if present) at the end of the response in case any answers have been continued there. If the
candidate has continued an answer there then add a tick to confirm that the work has been seen.
7. There is a NR (No Response) option. Award NR (No Response) - if there is nothing written at all in the answer space - OR if there is a comment which does not in any way relate to the question (e.g. ‘can’t do’, ‘don’t know’) - OR if there is a mark (e.g. a dash, a question mark) which isn’t an attempt at the question. Note: Award 0 marks – for an attempt that earns no credit (including copying out the question).
8. The scoris comments box is used by your Team Leader to explain the marking of the practice responses. Please refer to these comments when checking your practice responses. Do not use the comments box for any other reason. If you have any questions or comments for your Team Leader, use telephone, email or the scoris messaging system.
9. Assistant Examiners will send a brief report on the performance of candidates to their Team Leader (Supervisor) via email by the end of the marking period. The report should contain notes on particular strengths displayed as well as common errors or weaknesses. Constructive criticism of the question paper/mark scheme is also appreciated.
SPECIMEN

H081/01 Mark Scheme June 20xx
4
10. Annotations
Annotation Meaning
SPECIMEN

H081/01 Mark Scheme June 20xx
5
11. Subject–specific Marking Instructions
INTRODUCTION Your first task as an Examiner is to become thoroughly familiar with the material on which the examination depends. This material includes:
the specification, especially the assessment objectives
the question paper and its rubrics
the mark scheme.
You should ensure that you have copies of these materials. You should ensure also that you are familiar with the administrative procedures related to the marking process. These are set out in the OCR booklet Instructions for Examiners. If you are examining for the first time, please read carefully Appendix 5 Introduction to Script Marking: Notes for New Examiners. Please ask for help or guidance whenever you need it. Your first point of contact is your Team Leader.
SPECIMEN

H081/01 Mark Scheme June 20xx
6
USING THE MARK SCHEME
Please study this Mark Scheme carefully. The Mark Scheme is an integral part of the process that begins with the setting of the question paper and
ends with the awarding of grades. Question papers and Mark Schemes are developed in association with each other so that issues of
differentiation and positive achievement can be addressed from the very start.
This Mark Scheme is a working document; it is not exhaustive; it does not provide ‘correct’ answers. The Mark Scheme can only provide ‘best
guesses’ about how the question will work out, and it is subject to revision after we have looked at a wide range of scripts.
The Examiners’ Standardisation Meeting will ensure that the Mark Scheme covers the range of candidates’ responses to the questions, and that all
Examiners understand and apply the Mark Scheme in the same way. The Mark Scheme will be discussed and amended at the meeting, and
administrative procedures will be confirmed. Co–ordination scripts will be issued at the meeting to exemplify aspects of candidates’ responses and
achievements; the co–ordination scripts then become part of this Mark Scheme.
Before the Standardisation Meeting, you should read and mark in pencil a number of scripts, in order to gain an impression of the range of
responses and achievement that may be expected.
In your marking, you will encounter valid responses which are not covered by the Mark Scheme: these responses must be credited. You will
encounter answers which fall outside the ‘target range’ of Bands for the paper which you are marking. Please mark these answers according to the
marking criteria.
Please read carefully all the scripts in your allocation and make every effort to look positively for achievement throughout the ability range. Always
be prepared to use the full range of marks.
SPECIMEN

H081/01 Mark Scheme June 20xx
7
LEVELS OF RESPONSE QUESTIONS: The indicative content indicates the expected parameters for candidates’ answers, but be prepared to recognise and credit unexpected approaches where they show relevance. Using ‘best–fit’, decide first which set of level descriptors best describes the overall quality of the answer. Once the level is located, adjust the mark concentrating on features of the answer which make it stronger or weaker following the guidelines for refinement. Highest mark: If clear evidence of all the qualities in the level descriptors is shown, the HIGHEST Mark should be awarded.
Lowest mark: If the answer shows the candidate to be borderline (i.e. they have achieved all the qualities of the levels below and show limited evidence of meeting the criteria of the level in question) the LOWEST mark should be awarded.
Middle mark: This mark should be used for candidates who are secure in the level. They are not ‘borderline’ but they have only achieved some of the qualities in the level descriptors. Be prepared to use the full range of marks. Do not reserve (e.g.) highest level marks ‘in case’ something turns up of a quality you have not yet
seen. If an answer gives clear evidence of the qualities described in the level descriptors, reward appropriately.
Quality of extended response will be assessed in questions marked with an (*). Quality of extended response is not attributed to any single
assessment objective but instead is assessed against the entire response for the question.
SPECIMEN

H081/01 Mark Scheme June 20xx
8
AO1 AO2 AO3 Quality of extended response
Comprehensive A wide range of detailed and accurate knowledge that demonstrates fully developed understanding that shows full relevance to the demands of the question. Precision in the use of question terminology.
Knowledge and understanding shown is consistently applied to the context of the question, in order to form a: clear, developed and convincing analysis that is fully accurate. clear, developed and convincing interpretation that is fully accurate. detailed and substantiated evaluation that offers secure judgements leading to rational conclusions that are evidence based.
Quantitative, qualitative and/or fieldwork skills are used in a consistently appropriate and effective way and with a high degree of competence and precision.
There is a well-developed line of reasoning which is clear and logically structured. The information presented is relevant and substantiated.
Thorough A range of detailed and accurate knowledge that demonstrates well developed understanding that is relevant to the demands of the question. Generally precise in the use of question terminology.
Knowledge and understanding shown is mainly applied to the context of the question, in order to form a : clear and developed analysis that shows accuracy. clear and developed interpretation that shows accuracy. detailed evaluation that offers generally secure judgements, with some link between rational conclusions and evidence.
Quantitative, qualitative and/or fieldwork skills are used in a suitable way and with a good level of competence and precision.
There is a line of reasoning presented with some structure. The information presented is in the most-part relevant and supported by some evidence. SPECIM
EN

H081/01 Mark Scheme June 20xx
9
Reasonable Some sound knowledge that demonstrates partially developed understanding that is relevant to the demands of the question. Awareness of the meaning of the terms in the question.
Knowledge and understanding shown is partially applied to the context of the question, in order to form a: sound analysis that shows some accuracy. sound interpretation that shows some accuracy. sound evaluation that offers generalised judgements and conclusions, with limited use of evidence.
Quantitative, qualitative and/or fieldwork skills are used in a mostly suitable way with a sound level of competence but may lack precision.
The information has some relevance and is presented with limited structure. The information is supported by limited evidence.
Basic Limited knowledge that is relevant to the topic or question with little or no development. Confusion and inability to deconstruct terminology as used in the question.
Knowledge and understanding shows limited application to the context of the question in order to form a: simple analysis that shows limited accuracy. simple interpretation that shows limited accuracy. Un-supported evaluation that offers simple conclusions.
Quantitative, qualitative and/or fieldwork skills are used inappropriately with limited competence and precision.
The information is basic and communicated in an unstructured way. The information is supported by limited evidence and the relationship to the evidence may not be clear.
SPECIMEN

H081/01 Mark Scheme June 20xx
10
Question Answer Marks Guidance
1 (a) (i) Using evidence from Fig. 1, compare and contrast
the two sets of data.
The distributions differ in shape as Beach B is more
even but Beach A is almost bi–modal ()
There is a very similar mean ()
The both have the same mode 100-120 mm ()
Beach B is more skewed - negatively ()
Beach A has more varied frequencies (5-28 mm rather
than 13-27 mm) ()
3 AO3 x3
AO3 – 3 marks
Compare means identifying similarities; contrast means identifying differences. Both are required for maximum marks. 3 x 1 () for each valid point.
(ii) Suggest reasons for the differences between the two
samples in Fig. 1.
Different geology of sediment, sample A has more
variation ()
Wave energy determines geomorphic processes (e.g.
rates of erosion), longshore drift and distance material
travels ()
Role of longshore or onshore drift grading material
Impact of geomorphic processes on sediment size (e.g.
attrition) ()
Distance from debris source, smaller material travels a
greater distance (experiencing greater erosion) ()
4 AO2 x4
AO2 – 4 marks
4 x 1 () for each valid reason suggested for the differences
between the two samples
SPECIMEN
H081/01 Mark Scheme June 20xx
11
Question Answer Marks Guidance
Impact of storms or tides, causing different beach levels
as suggested in A ()
Human impacts such as beach replenishment ()
Source of sediment, whether material is from terrestrial
or offshore ()
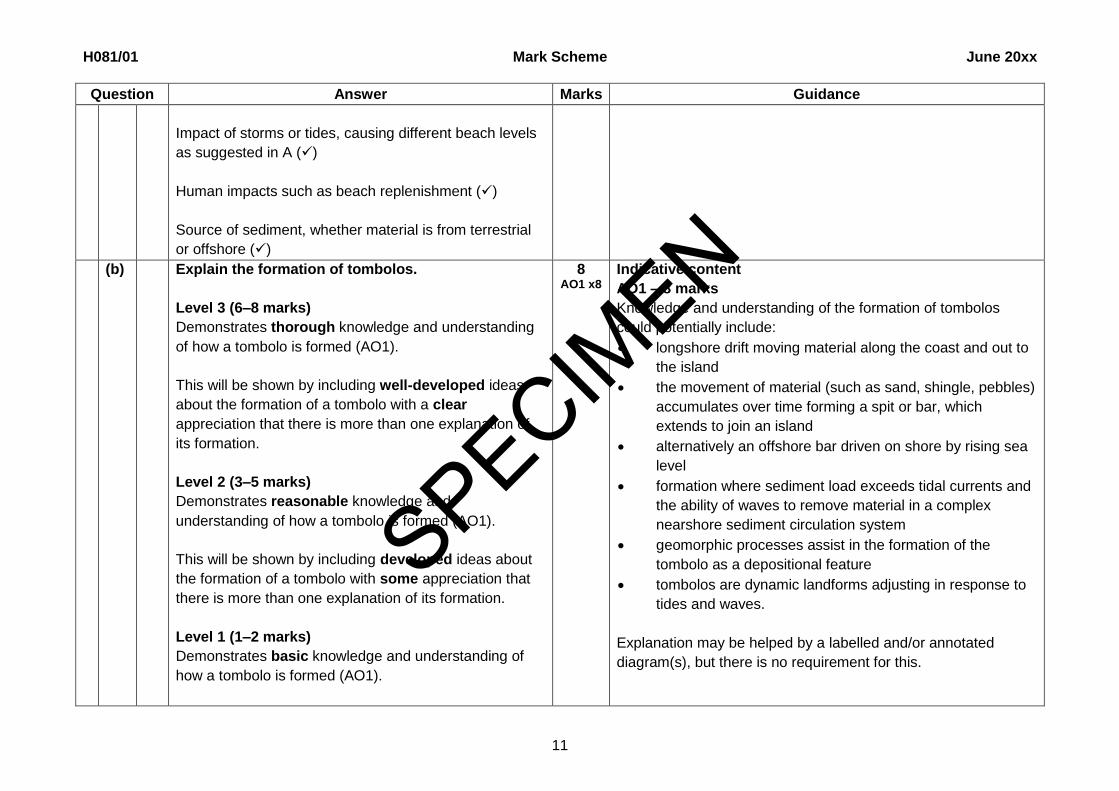
(b) Explain the formation of tombolos.
Level 3 (6–8 marks)
Demonstrates thorough knowledge and understanding
of how a tombolo is formed (AO1).
This will be shown by including well-developed ideas
about the formation of a tombolo with a clear
appreciation that there is more than one explanation of
its formation.
Level 2 (3–5 marks)
Demonstrates reasonable knowledge and
understanding of how a tombolo is formed (AO1).
This will be shown by including developed ideas about
the formation of a tombolo with some appreciation that
there is more than one explanation of its formation.
Level 1 (1–2 marks)
Demonstrates basic knowledge and understanding of
how a tombolo is formed (AO1).
8 AO1 x8
Indicative content
AO1 – 8 marks
Knowledge and understanding of the formation of tombolos
could potentially include:
longshore drift moving material along the coast and out to
the island
the movement of material (such as sand, shingle, pebbles)
accumulates over time forming a spit or bar, which
extends to join an island
alternatively an offshore bar driven on shore by rising sea
level
formation where sediment load exceeds tidal currents and
the ability of waves to remove material in a complex
nearshore sediment circulation system
geomorphic processes assist in the formation of the
tombolo as a depositional feature
tombolos are dynamic landforms adjusting in response to
tides and waves.
Explanation may be helped by a labelled and/or annotated
diagram(s), but there is no requirement for this.
SPECIMEN

H081/01 Mark Scheme June 20xx
12
Question Answer Marks Guidance
This will be shown by including simple ideas about the
formation of a tombolo with no or limited appreciation
that there is more than one explanation of its formation.
0 marks
No response or no response worthy of credit.
(c*) Assess the extent to which human activity has
unintentionally rather than intentionally caused
change within coastal landscape systems.
AO1
Level 3 (6–8 marks)
Demonstrates comprehensive knowledge and
understanding of the changes in coastal landscape
systems that have been caused by human activity, both
intentionally and unintentionally.
The answer should include accurate place-specific
detail. Amount of place-specific detail determines credit
within the level.
Level 2 (3–5 marks)
Demonstrates thorough knowledge and understanding
of the changes in coastal landscape systems that have
been caused by human activity, both intentionally and
unintentionally.
The answer should include some place-specific detail
which is partially accurate. Amount of place-specific
detail determines credit within the level.
14 AO1 x8
AO2 x6
Indicative content
AO1 – 8 marks
Knowledge and understanding of changes in coastal landscape
systems intentionally or unintentionally caused by human activity
could potentially include:
human activities causing intentional changes within coastal landscape systems e.g. coastal management (groyne construction) and / or off-shore dredging (for sands and gravels)
human activities causing unintentional changes within coastal landscape systems e.g. tourist resort development, building ports and / or power stations
port development or tourist resort development reducing input of sediment from coastal erosion along developed coastlines
breakwaters/harbour wall construction can reduce wave energy and obstruct longshore sediment movements
off-shore dredging to obtain gravel for the construction industry can lead to sediment imbalance off-shore
groyne installation can trap material being moved by longshore drift increasing beach width and depth but, also causes sediment starvation downdrift leading to increased erosion rates
credit any relevant activities and/or changes caused by human activity in coastal landscape systems.
SPECIMEN

H081/01 Mark Scheme June 20xx
13
Question Answer Marks Guidance
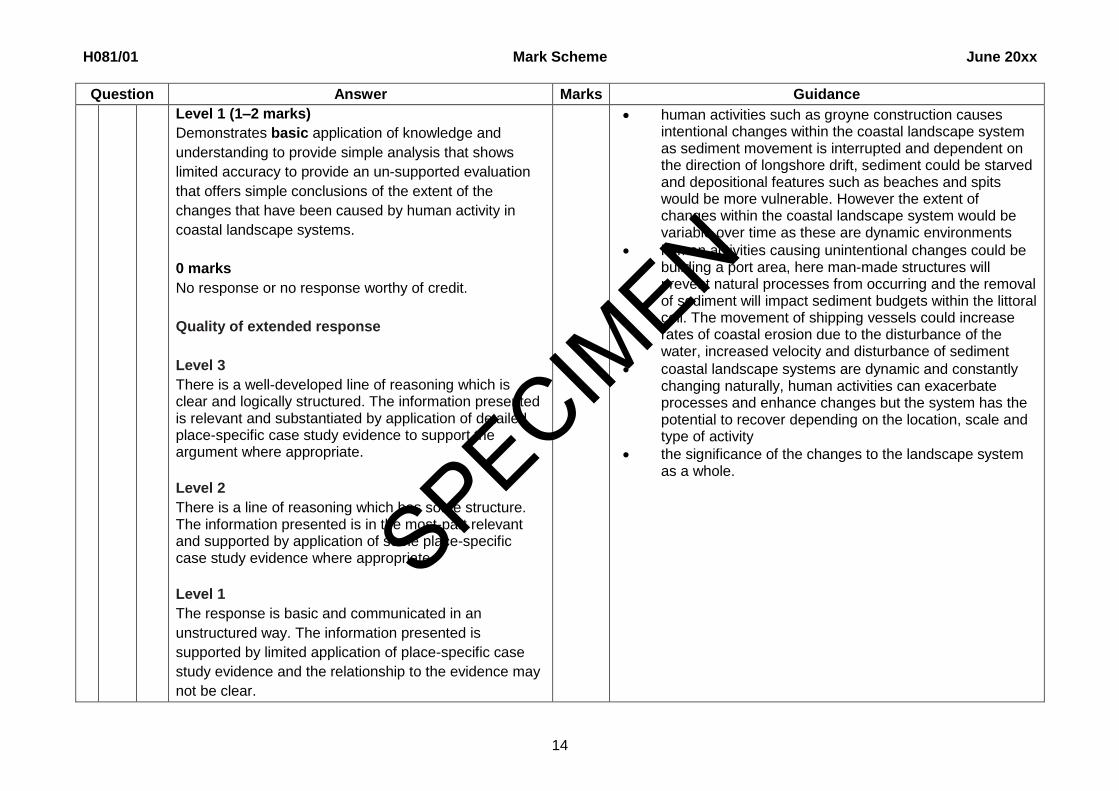
Level 1 (1–2 marks)
Demonstrates basic knowledge and understanding of
the changes in coastal landscape systems that have
been caused by human activity, both intentionally and
unintentionally.
There is an attempt to include place-specific detail but it
is inaccurate.
0 marks
No response or no response worthy of credit.
AO2
Level 3 (5–6 marks)
Demonstrates comprehensive application of knowledge
and understanding to provide clear and developed
analysis that shows accuracy to provide a detailed
evaluation that offers generally secure judgements, with
some link between rational conclusions and evidence, of
the extent of the changes that have been caused by
human activity in coastal landscape systems.
Level 2 (3–4 marks)
Demonstrates thorough application of knowledge and
understanding to provide sound analysis that shows
some accuracy to provide a sound evaluation that offers
generalised judgements and conclusions, with limited
use of evidence, of the extent of the changes that have
been caused by human activity in coastal landscape
systems.
AO2 – 6 marks
Apply knowledge and understanding to analyse and evaluate the
extent to which human activity has unintentionally rather than
intentionally caused change within coastal landscape systems
could potentially include:
coastal landscape system with its inputs, processes and outputs includes human activities although these can disturb systems in equilibrium where inputs and outputs become imbalanced and resultant positive or negative feedback
human activities could cause changes to geomorphic processes (e.g. wave, fluvial, aeolian erosion, transportation and deposition) material (e.g. source, size, composition) and/or energy flows which in turn influence landform development as part of the coastal system
consideration of the “extent” could include scale, significance and/or range of the changes
whether intentional or unintentional changes have the greatest extent. Both cause changes (at a range of scales) within the coastal landscape systems as they disturb the system inputs (sediment), processes (rates) and outputs (landforms)
SPECIMEN
H081/01 Mark Scheme June 20xx
14
Question Answer Marks Guidance
Level 1 (1–2 marks)
Demonstrates basic application of knowledge and
understanding to provide simple analysis that shows
limited accuracy to provide an un-supported evaluation
that offers simple conclusions of the extent of the
changes that have been caused by human activity in
coastal landscape systems.
0 marks
No response or no response worthy of credit.
Quality of extended response
Level 3
There is a well-developed line of reasoning which is clear and logically structured. The information presented is relevant and substantiated by application of detailed place-specific case study evidence to support the argument where appropriate.
Level 2
There is a line of reasoning which has some structure. The information presented is in the most-part relevant and supported by application of some place-specific case study evidence where appropriate
Level 1
The response is basic and communicated in an
unstructured way. The information presented is
supported by limited application of place-specific case
study evidence and the relationship to the evidence may
not be clear.
human activities such as groyne construction causes intentional changes within the coastal landscape system as sediment movement is interrupted and dependent on the direction of longshore drift, sediment could be starved and depositional features such as beaches and spits would be more vulnerable. However the extent of changes within the coastal landscape system would be variable over time as these are dynamic environments
human activities causing unintentional changes could be building a port area, here man-made structures will prevent natural processes from occurring and the removal of sediment will impact sediment budgets within the littoral cell. The movement of shipping vessels could increase rates of coastal erosion due to the disturbance of the water, increased velocity and disturbance of sediment
coastal landscape systems are dynamic and constantly changing naturally, human activities can exacerbate processes and enhance changes but the system has the potential to recover depending on the location, scale and type of activity
the significance of the changes to the landscape system as a whole.
SPECIMEN

H081/01 Mark Scheme June 20xx
15
Question Answer Marks Guidance
2 (a) (i) Using evidence from Fig. 2, compare and contrast
the two sets of data.
The distributions differ in shape as the outwash plain is
finer than the till sheet ()
Till sheet has a higher mean ()
Till sheet is uni-modal (100-120 mm) whereas outwash
plain is bi-modal (0-20 mm and 20-40 mm) ()
Till sheet has a higher mode (100-120 mm) ()
Till sheet is more negatively skewed to higher values ()
3 AO3 x3
AO3 – 3 marks
Compare means identifying similarities; contrast means identifying differences. Both are required for maximum marks. 3 x 1 () for each valid point.
(ii) Suggest reasons for the differences between the two
samples in Fig. 2.
Outwash is finer as sorted and eroded by water. Till is
coarser as less water sorting ()
Different geology of sediment. Till sheet (e.g. clay, sand,
gravels and boulders) and Outwash plain (e.g. from
boulders to silt) ()
Outwash may have travelled some distance from source,
so it is eroded via attrition ()
Outwash is older so weathered down more ()
Distance from glacier front, so outwash material is sorted
4 AO2 x4
Indicative content
AO2 – 4 marks
4 x 1 () for each valid reason suggested for the differences
between the two samples
SPECIMEN

H081/01 Mark Scheme June 20xx
16
Question Answer Marks Guidance
()
Till is closer to the glacier front, only finer materials can
be carried far from the glacial snout as energy falls ()
(b) Explain the formation of kames.
Level 3 (6–8 marks)
Demonstrates thorough knowledge and understanding
of how kames are formed (AO1).
This will be shown by including well-developed ideas
about the formation of kames with a clear appreciation
that there is more than one explanation of their
formation.
Level 2 (3–5 marks)
Demonstrates reasonable knowledge and
understanding of how kames are formed (AO1).
This will be shown by including developed ideas about
the formation of kames with some appreciation that
there is more than one explanation of their formation.
Level 1 (1–2 marks)
Demonstrates basic knowledge and understanding of
how a kame is formed (AO1).
This will be shown by including simple ideas about the
formation of kames with no or limited appreciation that
there is more than one explanation of their formation.
0 marks
8 AO1 x8
Indicative content
AO1 – 8 marks
Knowledge and understanding of the formation of kames could
potentially include:
kames are fans formed as debris laden water flows off or
through the ice where load is greater than energy
if water loses energy by falling or going into a small lake
on the glacial surface so deposits occur. Repetition of
this seasonally leads to bedded deposits
as ice melts, kame is left as isolated mound or as a
terrace at the valley side, these often slump
hollows on the surface of a melting glacier would fill up
with sediment which gradually goes down to lower levels
as the ice melted, ultimately forming a mound on the
surface
kames can be formed in the ice (via moulin) or by water
flowing off the snout of the glacier or flanks
notion of post-glacial modification is valid.
Explanation may be helped by a labelled and/or annotated
diagram(s), but there is no requirement for this.
SPECIMEN

H081/01 Mark Scheme June 20xx
17
Question Answer Marks Guidance
No response or no response worthy of credit.
(c*) Assess the relative significance of the change
caused by human activity within periglacial and
glacial landscape systems.
AO1
Level 3 (6–8 marks)
Demonstrates comprehensive knowledge and
understanding of the change caused by human activity
in periglacial and glacial landscape systems.
The answer should include accurate place-specific
detail. Amount of place-specific detail determines credit
within the level.
Level 2 (3–5 marks)
Demonstrates thorough knowledge and understanding
of the change caused by human activity in periglacial
and glacial landscape systems.
The answer should include some place-specific detail
which is partially accurate. Amount of place-specific
detail determines credit within the level.
Level 1 (1–2 marks)
Demonstrates basic knowledge and understanding of
the change caused by human activity in periglacial and
glacial landscape systems.
There is an attempt to include place-specific detail but it
is inaccurate.
14 AO1 x8
AO2 x6
Indicative content
AO1 – 8 marks
Knowledge and understanding of the impact of human activity
in causing change within periglacial and glacial landscape
systems could potentially include:
resource extraction, such as the oil industry in Alaska
the construction of buildings and infrastructure can lead to heat generation and increased energy flow through the periglacial system
the permafrost itself can be thawed, leading to the development of thermokarst, including thaw lakes and alases
the removal of surface vegetation may also contribute to these changes
as permafrost thaws stored methane and CO2 are released into the atmosphere store
dam construction in glacial valleys results in trapping of sediment
increases in energy levels below dams leads to higher rates of erosion
sediment loads of rivers affected by flushing
channel contraction and drying up downstream.
SPECIMEN

H081/01 Mark Scheme June 20xx
18
Question Answer Marks Guidance
0 marks
No response or no response worthy of credit.
AO2
Level 3 (5–6 marks)
Demonstrates comprehensive application of knowledge
and understanding to provide clear and developed
analysis that shows accuracy to provide a detailed
evaluation that offers generally secure judgements, with
some link between rational conclusions and evidence, of
the relative significance of the changes caused by
human activity within periglacial and glacial landscape
systems.
Level 2 (3–4 marks)
Demonstrates thorough application of knowledge and
understanding to provide sound analysis that shows
some accuracy to provide a sound evaluation that offers
generalised judgements and conclusions, with limited
use of evidence, of the relative significance of the
changes caused by human activity within periglacial and
glacial landscape systems.
Level 1 (1–2 marks)
Demonstrates basic application of knowledge and
understanding to provide simple analysis that shows
limited accuracy to provide an un-supported evaluation
that offers simple conclusions of the extent of the relative
significance of the changes caused by human activity
within periglacial and glacial landscape systems.
AO2 – 6 marks
Apply knowledge and understanding to analyse and evaluate
the significance of the change caused by human activity within
periglacial and glacial landscape systems could potentially
include:
periglacial and glacial landscape systems with inputs, processes and outputs includes human activities although these can disturb systems in equilibrium where inputs and outputs become imbalanced and resultant positive or negative feedback
consideration of the scale, significance and/or range of the changes e.g. periglacial areas are fragile where permafrost is easily disrupted by thawing and can lead to subsidence (thermokarst) whereas people had a limited impact on glaciers, this is increasing due to global warming
the assessment of the impact of human activity e.g. resource extraction and / or dam construction in causing change as opposed to physical impacts in the landscape system
changes may be to geomorphic processes (e.g. glacial erosion, mass movement, nivation, transport and deposition), material and/or energy flows
periglacial and glacial landscape systems are dynamic and constantly changing naturally, human activities can exacerbate processes and enhance changes but the system has the potential to recover depending on the location, scale and type of activity
consideration of the “extent” could include scale, significance and/or range of the changes
SPECIMEN

H081/01 Mark Scheme June 20xx
19
Question Answer Marks Guidance
0 marks
No response or no response worthy of credit.
Quality of extended response
Level 3
There is a well-developed line of reasoning which is clear and logically structured. The information presented is relevant and substantiated by application of detailed place-specific case study evidence to support the argument where appropriate.
Level 2
There is a line of reasoning which has some structure. The information presented is in the most-part relevant and supported by application of some place-specific case study evidence where appropriate
Level 1
The response is basic and communicated in an
unstructured way. The information presented is
supported by limited application of place-specific case
study evidence and the relationship to the evidence may
not be clear.
consideration of whether the extent of the changes is greater in periglacial or glacial systems
the significance of the changes to the landscape system as a whole.
SPECIMEN

H081/01 Mark Scheme June 20xx
20
Question Answer Marks Guidance
3 (a) (i) Using evidence from Fig. 3, compare and contrast
the two sets of data.
The distributions differ in shape as wadi is more even
and alluvial fan has smaller material ()
The mean of the wadi data is bigger ()
The alluvial fan data is bi-modal (0-20 mm and 20-40
mm) whereas the wadi data is uni-modal (0-20mm) ()
The alluvial fan data is more positively skewed ()
The alluvial fan data is more uneven with 3 groups with a
frequency of 0 ()
3 AO3 x3
AO3 – 3 marks
Compare means identifying similarities; contrast means identifying differences. Both are required for maximum marks. 3 x 1 () for each valid point.
(ii) Suggest reasons for the differences between the two
samples in Fig. 3.
Different geology of materials, the larger material
comprised of tougher more resistant rocks ()
The conditions in which the alluvial fan and wadi were
formed through the intensity of flow. The alluvial fan is
depositional whilst the wadi is more likely to be an
erosional landform ()
Distance from source of alluvial fan or wadi. The further
from the source, the energy in the water falls, only finer
materials are carried ()
Age of the alluvial fan or wadi, the older landform the
4 AO2 x4
Indicative content
AO2 – 4 marks
4 x 1 () for each valid reason suggested for the differences
between the two samples
SPECIMEN

H081/01 Mark Scheme June 20xx
21
Question Answer Marks Guidance
finer the material can be ()
Role of other dryland processes e.g. wind in re–sorting
deposited materials ()
(b) Explain the formation of barchans.
Level 3 (6–8 marks)
Demonstrates thorough knowledge and understanding
of how barchans are formed (AO1).
This will be shown by including well-developed ideas
about the formation of barchans with a clear appreciation
that there is more than one stage in, and/or trigger for,
their formation.
Level 2 (3–5 marks)
Demonstrates reasonable knowledge and
understanding of how barchans are formed (AO1).
This will be shown by including developed ideas about
the formation of barchans with some appreciation that
there is more than one stage in, and/or trigger for, their
formation.
Level 1 (1–2 marks)
Demonstrates basic knowledge and understanding of
how barchans are formed (AO1).
This will be shown by including simple ideas about the
formation of barchans with no or limited appreciation
that there is more than one stage in, and/or trigger for,
8 AO1 x8
Indicative content
AO1 – 8 marks
Knowledge and understanding of the formation of barchans
could potentially include:
uniform wind direction carrying sand low down (saltation)
nucleus collecting heavier sand
idea of a critical height needed to accumulate sand and its
mechanism of movement
if wind changes direction, the shape of the dune is lost
obstacles such as a bush or rock slows wind, acting as a
barrier so load is greater than energy and deposition
occurs
alternatively, saltating sand grains may reach a patch of
soft ground and not rebound, and so are deposited
shape reflects this mono–directional wind, the horns are
formed as wind is faster at the dune edges where there is
less friction
dune moves down wind by rolling over on itself and sand
is dropped in the still air on the far side of the dune.
formation may be related to positive feedback mechanism
once deposition has commenced.
Explanation may be helped by a labelled and/or annotated
diagram(s), but there is no requirement for this.
SPECIMEN

H081/01 Mark Scheme June 20xx
22
Question Answer Marks Guidance
their formation.
0 marks
No response or no response worthy of credit.
(c*) Assess the relative importance of economic activity
and water supply issues in causing change within
dryland landscape systems.
AO1
Level 3 (6–8 marks)
Demonstrates comprehensive knowledge and
understanding of the change caused by water supply
issues and economic activity in dryland landscape
systems.
The answer should include accurate place-specific
detail. Amount of place-specific detail determines credit
within the level.
Level 2 (3–5 marks)
Demonstrates thorough knowledge and understanding
of the change caused by water supply issues and
economic activity in dryland landscape systems.
The answer should include some place-specific detail
which is partially accurate. Amount of place-specific
detail determines credit within the level.
Level 1 (1–2 marks)
Demonstrates basic knowledge and understanding of
the change caused by water supply issues and economic
14 AO1 x8
AO2 x6
Indicative content
AO1 – 8 marks
Knowledge and understanding of economic activity and water
supply issues within dryland landscape systems could
potentially include:
economic activities in dryland areas e.g. tourism, recreation, agriculture and the exploitation of resources (minerals)
water supply issues e.g. dam building, water abstraction, high demand from hotels (for tourism), leisure activities these affect water table levels
damage is caused to brittle, fragile cryptobiotic crusts and the sparse vegetation due to activities such as dune buggying
deposition may lead to formation of alluvial fans and bajadas
eroded sediment may then be blown to marginal areas where it accumulates as loess
SPECIMEN

H081/01 Mark Scheme June 20xx
23
Question Answer Marks Guidance
activity in dryland landscape systems.
There is an attempt to include place-specific detail but it
is inaccurate.
0 marks
No response or no response worthy of credit.
AO2
Level 3 (5–6 marks)
Demonstrates comprehensive application of knowledge
and understanding to provide clear and developed
analysis that shows accuracy to provide a detailed
evaluation that offers generally secure judgements, with
some link between rational conclusions and evidence, of
the extent to which water supply issues and economic
activity have caused change within dryland landscape
systems.
Level 2 (3–4 marks)
Demonstrates thorough application of knowledge and
understanding to provide sound analysis that shows
some accuracy to provide a sound evaluation that offers
generalised judgements and conclusions, with limited
use of evidence, of the extent to which water supply
issues and economic activity have caused change within
dryland landscape systems.
Level 1 (1–2 marks)
Demonstrates basic application of knowledge and
understanding to provide simple analysis that shows
AO2 – 6 marks
Application of knowledge and understanding to analyse and
evaluate the relative importance of economic activity and water
supply issues in causing change within dryland landscape
systems could potentially include:
dryland landscape systems with inputs, processes and outputs includes human activities although these can disturb systems in equilibrium where inputs and outputs become imbalanced and resultant positive or negative feedback
exposed surfaces are subjected to higher erosion rates as there is no protection against aeolian erosion or flash floods causing fluvial erosion, leading to an increase in loose material in the system
dams trap sediment and reduce river load, this leads to an decrease in loose material in the system and may lead to degradation of alluvial fans and bajadas. Dams can be both an economic activity and an attempt to resolve water supply issues, their scale and the volume of water being moved causes changes in the deposition of sediment and therefore landforms. Within the land scape system both processes and outputs have been impacted by dam building
changes may be to processes, material and/or energy flows
SPECIMEN
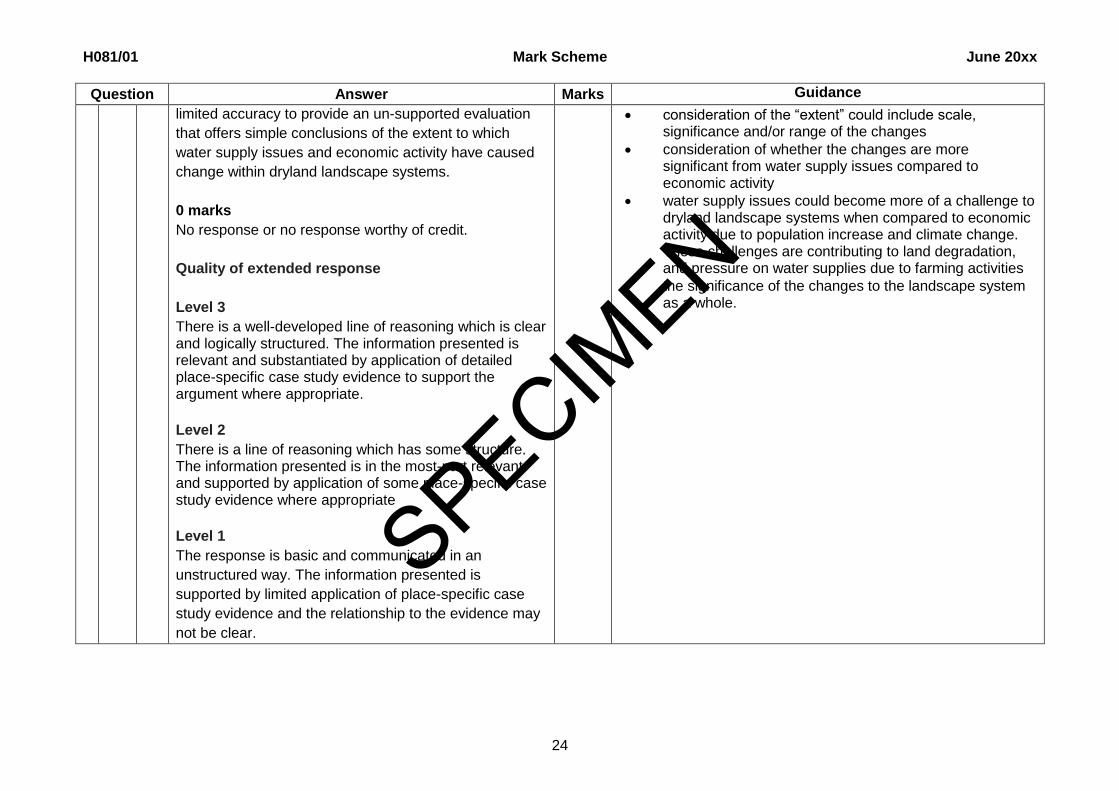
H081/01 Mark Scheme June 20xx
24
Question Answer Marks Guidance
limited accuracy to provide an un-supported evaluation
that offers simple conclusions of the extent to which
water supply issues and economic activity have caused
change within dryland landscape systems.
0 marks
No response or no response worthy of credit.
Quality of extended response
Level 3
There is a well-developed line of reasoning which is clear and logically structured. The information presented is relevant and substantiated by application of detailed place-specific case study evidence to support the argument where appropriate.
Level 2
There is a line of reasoning which has some structure. The information presented is in the most-part relevant and supported by application of some place-specific case study evidence where appropriate
Level 1
The response is basic and communicated in an
unstructured way. The information presented is
supported by limited application of place-specific case
study evidence and the relationship to the evidence may
not be clear.
consideration of the “extent” could include scale, significance and/or range of the changes
consideration of whether the changes are more significant from water supply issues compared to economic activity
water supply issues could become more of a challenge to dryland landscape systems when compared to economic activity due to population increase and climate change. These challenges are contributing to land degradation, and pressure on water supplies due to farming activities
the significance of the changes to the landscape system as a whole.
SPECIMEN

H081/01 Mark Scheme June 20xx
25
Question Answer Marks Guidance
4 (a) Explain the types of evidence that could be used to show social inequality. Explanation could focus on a range of quantitative measures, such as: use of indices as listed in the specification e.g. housing, healthcare, education and access to services ()
combinations of indices such as HDI (Human Development Index) () evidence from population data e.g. unemployment, poverty () measures that consider a wider range of social inequality such as the Happiness index ().
But also more informal, qualitative, evidence such as: levels of pollution e.g. litter, waste and graffiti () reputation and image () quality of the environment e.g. amount of ‘green space’ ()
4
AO1 x4
AO1 – 4 marks
4 x 1 () for each point explaining types of evidence that could
be used to show inequality
Candidates do need to ensure there is a clear focus on the social element; for example, economic indices such as Income or GNP per capita would need to be linked clearly to social inequality.
(b) (i) Using Fig. 4 state one piece of evidence which
shows that this area is in need of rebranding.
The single dwelling suggests there has been clearance
of older housing ().
Derelict land, fenced-off with warning notices, suggests
security problems ().
1 AO3 x1
AO3 – 1 marks
1 x 1 mark () for statement which identifies evidence that the area is in need of rebranding, which is explicitly linked to the image provided in Fig.4.
SPECIMEN

H081/01 Mark Scheme June 20xx
26
Question Answer Marks Guidance
The litter and graffiti pollution is an aspect of urban blight
().
Street lighting is limited which causes safety concerns
for people at night ().
The old factory building with hoarding around it, which is
probably disused ().
There is limited green space in this densely packed
urban area ().
(ii) With reference to Fig.4, suggest two appropriate
strategies for rebranding this area.
Market-led development by private investors such as
new build housing construction or conversion of existing
buildings (). This is appropriate for the derelict land and
disused factory shown in Fig.4 following demolition or
redevelopment (DEV).
Flagship development of a large-scale one-off project
which is multipurpose (). The space available in the
photograph and road link would be sufficient for a
mixture of housing, business and amenity development
(DEV).
Regeneration strategies could be basis for turning the
old factory in Fig.4 (DEV) into an art gallery or another
cultural event ().
Large-scale retail development and multi-storey car park
4 AO2 x4
AO2 – 4 marks
2x1 () for appropriate strategy for rebranding the area in the resource. 2x1 (DEV) for interpreting the resource to indicate why this
strategy is appropriate
SPECIMEN

H081/01 Mark Scheme June 20xx
27
Question Answer Marks Guidance
() is a possibility on the brownfield site in the
photograph (DEV).
A sports arena () is possible given the scale of the
derelict space available for redevelopment in the
photograph (DEV).
(c) Using evidence from Fig. 5, suggest why government expenditure on education is unequal. Level 3 (5-6 marks) Demonstrates thorough application of knowledge and understanding to provide a clear and developed analysis that shows accuracy to explain spatial inequality in government expenditure on education (AO2). Demonstrates reasonable investigation and interpretation of the resource to fully evidence why there is spatial inequality in government expenditure on education. There must be sound ideas linking resource evidence to spatial inequalities in government expenditure on education (AO3). Level 2 (3–4 marks) Demonstrates reasonable application of knowledge and understanding to provide a sound analysis that shows some accuracy to explain spatial inequality in government expenditure on education (AO2). Demonstrates basic investigation and interpretation of the resource to evidence why there is spatial inequality in government expenditure on education. There must be limited ideas linking resource evidence to spatial inequalities in government expenditure on education (AO3).
6 AO2 x4
AO3 x2
Indicative content
AO2 – 4 marks
Application of knowledge and understanding to analyse why
government expenditure on education is unequal could
potentially include:
number of educational establishments including schools,
universities and apprenticeship schemes in each region
proportion of primary and secondary schools in a region,
which is related to size and structure of school age
population and the different funding at each level
number of employees in education in a region such as
academic, administrative and support staff which affects
expenditure on salaries and pension contributions
variation in transport to school subsidies which may also
depend on differences in density and distribution of
schools within a region
the level of funding for schools varies often because it is
still influenced by the legacy of an unequal grant system
set up in the 1980s based on how much authorities spent
at that time
funding per pupil varies between regions and proportions
may vary according to levels of deprivation in an area –
eligibility for pupil premiums for children from
disadvantaged backgrounds or those with special
SPECIMEN

H081/01 Mark Scheme June 20xx
28
Question Answer Marks Guidance
Level 1 (1–2 marks) Demonstrates basic application of knowledge and understanding to provide a simple analysis that shows limited accuracy to explain spatial inequality in government expenditure on education (AO2). Demonstrates basic investigation and interpretation of the resource to providing limited evidence why there is spatial inequality in government expenditure on education. There are limited ideas about spatial inequalities in government expenditure on education with limited or no link to resource evidence (AO3). 0 marks No response or no response worthy of credit.
educational needs is a factor
there is weighting of funding for schools in London to
allow for higher costs.
AO3 – 2 marks
Evidence from investigation and interpretation of the resource
could potentially include:
highest expenditure on education is in London and the
South East (£3-5 billion) – higher population / greater
number of schools and higher weighting of funding. Least
expenditure in North East (£1-2 billion)
other high values (over £2.4 billion) where there are large
urban areas such as North West (Manchester and
Merseyside), West Midlands (Birmingham / Coventry
conurbation) and Yorkshire and the Humber (Leeds,
Bradford, Sheffield, Hull). Urban areas with higher
proportions of disadvantaged children have higher
education expenditure grants
relatively low expenditure in Wales (£1-2 billion) may
reflect lower population / fewer schools of the region
expenditure on education in Scotland (£2-3 billion) may
reflect number of schools in large urban areas plus need
to subsidise transport / keep small schools open in more
remote rural / Highland and Island areas
London has double Scotland’s expenditure on education
despite significant differences in size of geographical
area covered.
SPECIMEN

H081/01 Mark Scheme June 20xx
29
Question Answer Marks Guidance
(d*) ‘Community groups are the most important players in the placemaking process’. To what extent do you agree with this statement? AO1 Level 3 (6–8 marks) Demonstrates comprehensive knowledge and understanding of the role of community groups and other players in the placemaking process. The answer should include accurate place-specific
detail. Amount of place-specific detail determines credit
within the level.
Level 2 (3–5 marks) Demonstrates thorough knowledge and understanding of the role of community groups and other players in the placemaking process. The answer should include some place-specific detail
which is partially accurate. Amount of place-specific
detail determines credit within the level.
Level 1 (1–2 marks) Demonstrates basic knowledge and understanding of the role of community groups and other players in the placemaking process. There is an attempt to include place-specific detail but it
is inaccurate.
0 marks No response or no response worthy of credit.
14 AO1 x8
AO2 x6
Indicative content
AO1 – 8 marks
Knowledge and understanding of the roles and importance of
players in the placemaking process, with community groups a
focus.
Community groups could potentially include:
formal community groups e.g. local resident associations, schools, churches, councils and ‘friends of’ groups
individual pressure groups
informal groups e.g. Neighbourhood Watch
local businesses / private companies
heritage associations
environmental organisations e.g. Friends of the Earth. Their roles in the placemaking process could potentially include:
their involvement in consultation, planning, design and management.
evidence of players working in partnership successfully
the importance of cooperation in the placemaking process
the coordination of the differing roles of other important players in the placemaking process
protection or management of an area
organising funding Other players in the place making process could potentially include:
local and national government
corporate and organisations e.g. Cambridge Ahead and Home Group
architects and planners
SPECIMEN

H081/01 Mark Scheme June 20xx
30
Question Answer Marks Guidance
AO2 Level 3 (5–6 marks) Demonstrates thorough application of knowledge and
understanding to provide clear and developed analysis
that shows accuracy to provide a detailed evaluation that
offers generally secure judgements, with some link
between rational conclusions and evidence, of the
relative importance of community groups and other
players in the placemaking process.
Level 2 (3–4 marks) Demonstrates reasonable application of knowledge and understanding to provide sound analysis that shows some accuracy to provide a sound evaluation that offers generalised judgements and conclusions, with limited use of evidence, of the relative importance of community groups in the placemaking process. Level 1 (1–2 marks) Demonstrates basic application of knowledge and understanding to provide simple analysis that shows limited accuracy to provide an un-supported evaluation that offers simple conclusions of the relative importance of community groups and other players in the placemaking process. 0 marks No response or no response worthy of credit.
Quality of extended response
Level 3
There is a well-developed line of reasoning which is clear and logically structured. The information presented
AO2 – 6 marks
Application of knowledge and understanding to analyse and
evaluate whether community groups are the most important
players in the placemaking process could potentially include:
the range and the roles of other types of groups and
bodies involved in placemaking such as:
o governments, potentially at various scales from
local councils to international like the EU
o large scale property developers
o architects
o large corporate groups of companies e.g.
Cambridge Ahead
o environmental authorities
the role of social media and communication in the
placemaking process
recognition that the importance of the players may vary
with scale, time and type of place
role of community group and their importance, bottom up
empowerment e.g. sponsor a park, mural neighbourhood
design, street party, make over vacant land. Shad
Thames Area Management Plan (STAMP) organises
walking tours of Shad Thames area (London) to
celebrate and highlight the rich history
perhaps ‘all’ players are key in placemaking at a variety
of scales with no one more important than another
the placemaking process is dynamic, continuous as well
as evolving and players have a role at various points in
time.
SPECIMEN

H081/01 Mark Scheme June 20xx
31
Question Answer Marks Guidance
is relevant and substantiated by application of detailed place-specific case study evidence to support the argument where appropriate.
Level 2
There is a line of reasoning which has some structure. The information presented is in the most-part relevant and supported by application of some place-specific case study evidence where appropriate
Level 1
The response is basic and communicated in an unstructured way. The information presented is supported by limited application of place-specific case study evidence and the relationship to the evidence may not be clear.
SPECIMEN

H081/01 Mark Scheme June 20xx
32
Question Answer Marks Guidance
5 (a) (i) Suggest a geographical question or issue that can
be investigated in the area shown. Justify using map
evidence.
There are a vast range of possible questions or issues
that can be identified as possible in the area shown on
the map. Investigations could include questions which
focus on the following:
Physical – beach sediment survey (),
measuring rate of coastal drift of material ()
Human – traffic survey (), image of place survey
(), service areas ()
Physical and human – impact of relief on land
use ()
The key skill is the justification of the question or issue
by linking it to map evidence such as place names,
scales, distances, directions and practical considerations
such as access, safety, time.
Three Cliffs Bay, exposed 2.3km bay area to
complete beach survey, access via Wales coast
path (DEV)
Traffic survey to be carried out in South Gate, this
could be conducted north and south of the village
to ensure a fair representation of patterns (DEV)
4 AO3 x4
AO3 – 4 marks
1 x 1 () mark for a valid/appropriate question or issue.
3 x 1 (DEV) marks for justification with credit per point using
map evidence or practical considerations
SPECIMEN

H081/01 Mark Scheme June 20xx
33
Question Answer Marks Guidance
(ii) State two examples of different types of secondary
data that you would use to aid the investigation
suggested in (a)(i).
Population structure data from the census to study the
place profile of the area ()
Land use maps for information on local businesses ()
Satellite images to annotate fieldwork locations ()
Newspapers to investigate local people’s attitudes to a
particular issue at a point in time ()
Previous investigations to study historical changes in the
area ()
2 AO3 x2
AO3 – 2 marks
2 x 1 () marks for two appropriate examples of secondary data
to aid the investigation suggested in question 5(a)(i).
Generic answers gain no credit.
It should be clear what the data is providing e.g. ‘census’ tells us
little but ‘population structure data from the census’ provides the
context and gains full credit.
Do not credit vague sources such as ‘the internet’ – answer
should state what aspect of the internet to gain credit.
(iii) Explain one suitable method you would use to
collect data for the investigation suggested in (a)(i).
Level 3 (5–6 marks)
Demonstrates a thorough understanding of the method
used to collect data to investigate the geographical
question suggested (AO3) to explain its suitability and
relevance.
Level 2 (3–4 marks)
Demonstrates a reasonable understanding of the
method used to collect data to investigate the
geographical question suggested (AO3) to explain its
suitability and relevance.
6 AO3 x6
Indicative content
AO3 – 6 marks
This is a question linked to the investigation stated in a(i) so it
should be an appropriate method for collecting relevant data
from the location.
Method could potentially include:
sampling type (e.g. systematic, random and stratified) and
size of sample
design and use of questionnaire(s) including piloting
equipment type e.g. ranging poles and clinometer and use
e.g. measure beach profile across the width of the beach.
Staring at low tide mark, systematically measure the angle
of the beach between the two ranging poles using the
clinometer
SPECIMEN

H081/01 Mark Scheme June 20xx
34
Question Answer Marks Guidance
Level 1 (1–2 marks)
Demonstrates a basic understanding of the method
used to collect data to investigate the geographical
question suggested (AO3) to explain its suitability and
relevance.
0 marks
No response or no response worthy of credit.
strategies for ensuring accuracy and reliability e.g. when
data recorded, how, number of times (potential for
averages to be calculated) and duration
If describe more than one method credit the most appropriate.
If a sound method but not relevant to the chosen investigation
then max top of Level 1.
(b) With reference to a fieldwork investigation you have
carried out, to what extent was your investigation
successful?
Level 4 (10–12 marks)
Demonstrates a comprehensive conclusion as to the
extent to which the investigation was successful with a
comprehensive argument to explain this level of
success relating directing to the fieldwork investigation
carried out.
This will be shown by including well-developed ideas
about the fieldwork investigation and how successful it
was.
Level 3 (7–9 marks)
Demonstrates a thorough conclusion as to the extent to
which the investigation was successful with a thorough
argument to explain this level of success relating
directing to the fieldwork investigation carried out.
This will be shown by including well-developed ideas
about either the fieldwork investigation or how successful
12 AO3
x12
Indicative content
AO3 – 12 marks
A conclusion of the relative success of the investigation with a
clear reference back to the question or issue from the fieldwork
investigation carried out by the candidate.
Answers may also include explanation of the relative level of
success or otherwise such as:
sample size / variety
repeating measurements at different times or for longer
periods
using reliable or effective equipment, this could be low-
tech and digital methods to give variety and to cross check
data
finding further sources of data, could be secondary
sources
sampling data / piloting questionnaires allowing for
reflections and modifications to data collection techniques
to ensure quality and accuracy of ‘data’ collected
willingness of people to participate in surveys and / or
questionnaires, how these people were selected
(sampling) and the accuracy of their responses
SPECIMEN

H081/01 Mark Scheme June 20xx
35
Question Answer Marks Guidance
it was and developed ideas about the other question
focus.
Level 2 (4–6 marks)
Demonstrates a reasonable conclusion as to the extent
to which the investigation was successful with a
reasonable argument to explain this level of success
relating directing to the fieldwork investigation carried
out.
This will be shown by including developed ideas about
either the fieldwork investigation or how successful it was
and simple ideas about the other question focus.
Level 1 (1–3 marks)
Demonstrates a basic conclusion as to the extent to
which the investigation was successful with a basic
argument to explain this level of success relating
directing to the fieldwork investigation carried out.
This will be shown by including simple ideas about the
fieldwork investigation and how successful it was.
0 marks
No response or no response worthy of credit.
organisational aspects such as better team work with
allocated roles
accessibility of the site / area for data collection
use of hypothesis and / or key questions and their
relevance to the data collected and ability to draw
conclusions
quality of data collected and variety of analytical tools
used
analytical tools and ability to construct arguments and
draw conclusions
SPECIMEN
H081/01 Mark Scheme June 20xx
36
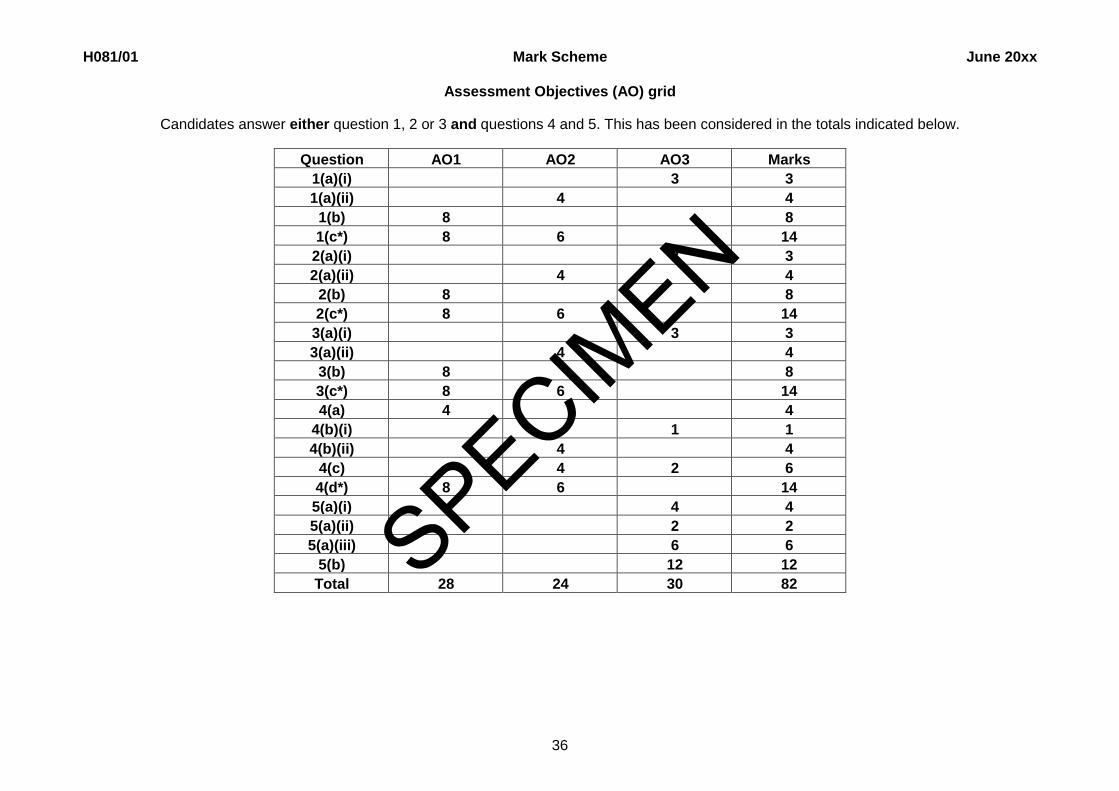
Assessment Objectives (AO) grid
Candidates answer either question 1, 2 or 3 and questions 4 and 5. This has been considered in the totals indicated below.
Question AO1 AO2 AO3 Marks
1(a)(i) 3 3
1(a)(ii) 4 4
1(b) 8 8
1(c*) 8 6 14
2(a)(i) 3 3
2(a)(ii) 4 4
2(b) 8 8
2(c*) 8 6 14
3(a)(i) 3 3
3(a)(ii) 4 4
3(b) 8 8
3(c*) 8 6 14
4(a) 4 4
4(b)(i) 1 1
4(b)(ii) 4 4
4(c) 4 2 6
4(d*) 8 6 14
5(a)(i) 4 4
5(a)(ii) 2 2
5(a)(iii) 6 6
5(b) 12 12
Total 28 24 30 82
SPECIMEN