Embed Size (px)
Citation preview

H lth Lif E tHealthy Life Expectancy among Older Americans in Rural and
Urban Areas
Sarah B. Laditka, PhD
James N. Laditka, DA, PhD
Keith Elder, PhD
Bankole Olatosi, MHA
REVES 2005 ~ Beijing, China
Arnold School of Public HealthCHSPR / Office for the Study of Aging

BackgroundBackground• Evidence that the prevalence of disability and
bidit b hi h i lmorbidity may be higher in rural areas.
• Access and availability for health care and other services is more limited in rural areas.
• Recent work emphasizes the urban health p“advantage.”
• Few studies have examined effects of areas of e stud es a e e a ed e ects o a eas oresidence on healthy life expectancy.
Arnold School of Public HealthOffice for the Study of Aging

Urban “Health Advantage” versus Urban“Health Penalty” – Emerging Evidence
Proximity of wealth helps sustain social organizationsProximity of wealth helps sustain social organizations in neighborhoods, increase political power to attract funding, support civil groups.funding, support civil groups.
Greater social support and cohesion.
Improved access to services and commodities, fruits and vegetables.
Better environment for physical activity.
Greater political mobili ation for health ser icesGreater political mobilization for health services.
Sources: Vlahov & Galea, J Urban Health, 2002; Vlahov et al. J Urban Health 2005
Arnold School of Public HealthOffice for the Study of Aging

ObjectivesObjectives
T i ti t diff i HLE ILETo investigate differences in HLE, ILE, and TLE, among groups of older individuals in rural or urban areas
To examine the health burden of area of residence throughout the older liferesidence throughout the older life course, and the differential impact of
id ithi d b tresidence area within and between groups
Arnold School of Public HealthOffice for the Study of Aging

DataData
NLTCS (1982 1984 1989 1999) n 6 300NLTCS (1982, 1984, 1989, 1999), n ≈ 6,300Representative sample of Americans with 1+ ADL impairments at baseline (having lasted or expected toimpairments at baseline (having lasted, or expected to last, 3 or more months at the time of the baseline survey). y)Many of these individuals recovered by the time of the 1984 follow-up.Nonetheless, this cohort is more impaired than the average older American.This cohort is of interest because it is most likely to require long term care services
Arnold School of Public HealthOffice for the Study of Aging

Cohort ADL Prevalence U S 1982-1994Cohort ADL Prevalence, U.S. 1982 1994(Includes “cannot do”, receives help, or uses assistive device)
NLTCS Weighted 4-Wave ADL PrevalenceAges 65-69 in 1982, n = 3440
0.20E ti
0.15
ence
Eating
I/O Bed
0.10
L Pr
eval
e
Mobility
Dressing
0.05AD
L g
Bathing
0.001982 1984 1989 1994 Year
Toileting
1982 1984 1989 1994 YearSource: Authors’ analysis, 1982-1999 National Long-Term Care Survey

Challenges of Longitudinal DataChallenges of Longitudinal DataMonths1 2 3 4 5 . . . 24 . . . . 48
A U I IPersons SurveyedA . U . . . . . . I . . . I
B . . . I . D
U=Unimpaired; I=Impaired; D=DeadC I . . . . . . . ? . U . .
Arnold School of Public HealthOffice for the Study of Aging
U=Unimpaired; I=Impaired; D=Dead

Analytical Strategy OverviewAnalytical Strategy, Overview
1. Estimate parameters of functional status transition
2. Conduct microsimulation
3. Analyze simulated population
Arnold School of Public HealthOffice for the Study of Aging

Analytical Strategy 1aAnalytical Strategy, 1aEstimate functional status transition parameters
Identify embedded Markov chain that most l l d th b d d tclosely reproduces the observed data
Estimation with maximum likelihood
Trichotomous logistic regression
• Unimpaired• Impaired (1+ ADL limitations)Impaired (1+ ADL limitations)• Dead
Arnold School of Public HealthOffice for the Study of Aging

Analytical Strategy 1bAnalytical Strategy, 1bFunctional status transition probabilities
An individual of a given age, gender, rural or urban id d t f ti l t t h t iresidence, and current functional status has a certain
probability of remaining in the same functional status from one month to the next another probability forfrom one month to the next, another probability for transitioning to a different status, and another for dying.y g
Monthly probabilities, estimated from the lived i f ti ll t ti l fexperience of a nationally representative sample of
impaired older Americans.
Arnold School of Public HealthOffice for the Study of Aging

Analytical Strategy, 2aMicrosimulation
1 B li i l t d l ti di bilit fil l t i i d1. Baseline simulated population disability profile equal to impaired American population at age 65, separately by rural/urban residence and gender.g
2. Based on estimated monthly transition probabilities.
3 For each month generate transition probability for each possible3. For each month, generate transition probability for each possible state in the next month, given the current month’s status, age, sex, rura/lurban residence.
4. Map these Ps onto 0-1 interval & random draw.
5 Repeat until death5. Repeat until death.
6. Simulate 1 million individual lives for each group (e.g., rural women) from age 65 through death
Arnold School of Public HealthOffice for the Study of Aging
women), from age 65 through death.

Analytical Strategy 2bAnalytical Strategy, 2bMicrosimulation
Having created the simulated population, apply g p p , pp ystandard population measures:
M b f th i i dMean number of months unimpaired
Mean number of months impairedMean number of months impaired
Mean number of months to death
Variation around means
Arnold School of Public HealthOffice for the Study of Aging

Results ~ TLE ALE ILE in YearsResults TLE, ALE, ILE in Years
TLE ALE ILETLE ALE ILEMean (SD) Mean (SD) Mean (SD)
R F l 9 55 (6 93) 4 07 (4 65) 5 50 (5 13)R-Female 9.55 (6.93) 4.07 (4.65) 5.50 (5.13)U-Female 8.99 (6.66) 3.83 (4.33) 5.18 (4.86)% diff R U 6 15 6 09 6 17% diff., R-U 6.15 6.09 6.17
R M l 6 83 (5 44) 3 51 (4 23) 3 34 (3 64)R-Male 6.83 (5.44) 3.51 (4.23) 3.34 (3.64)R-Male 6.36 (5.13) 3.28 (3.89) 3.09 (3.41)% diff R U 7 43 6 91 7 95% diff., R-U 7.43 6.91 7.95
Arnold School of Public HealthOffice for the Study of Aging
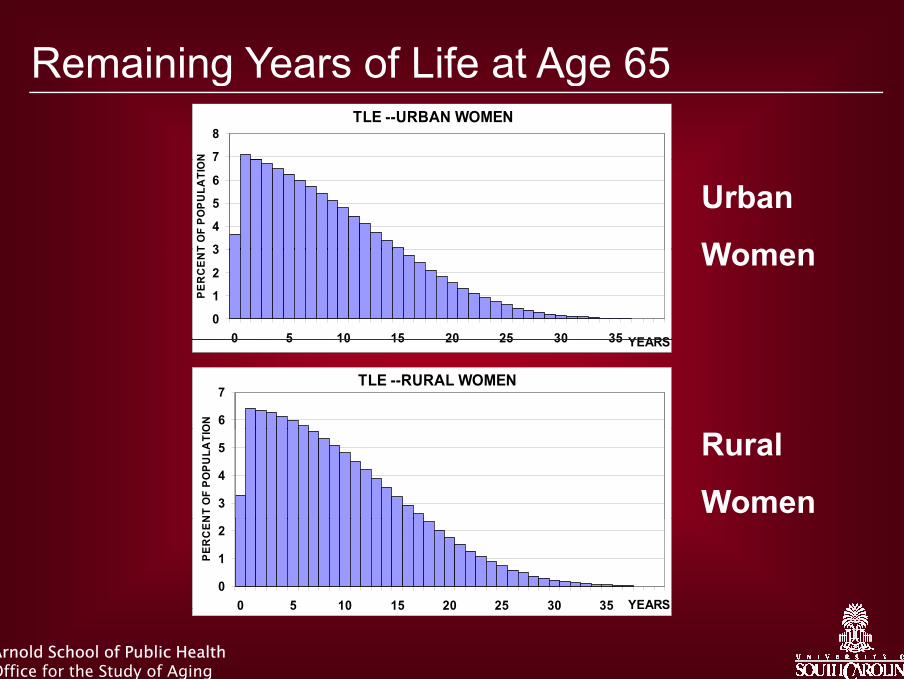
Remaining Years of Life at Age 65Remaining Years of Life at Age 65 TLE --URBAN WOMEN
7
8
NUrban
Women3
4
5
6
7
T O
F PO
PULA
TIO
N
Women
0
1
2
3
0 5 10 15 20 25 30 35 YEARS
PER
CE
NT
0 5 10 15 20 25 30 35 YEARS
TLE --RURAL WOMEN
6
7
ON
Rural
Women3
4
5
NT
OF
POPU
LATI
O
0
1
2
0 5 10 15 20 25 30 35 YEARS
PER
CEN
Arnold School of Public HealthOffice for the Study of Aging
0 5 10 15 20 25 30 35 S

Remaining Years of Unimpaired LifeRemaining Years of Unimpaired LifeILE --URBAN WOMEN
14
16
NUrban
Women8
10
12
14
OF
POPU
LATI
ON
Women
0
2
4
6
PER
CEN
T
0 5 10 15 20 25 YEARS
ILE --RURAL WOMEN
14
16
ON
Rural
Women6
8
10
12
T O
F PO
PULA
TIO
0
2
4
6
PER
CEN
T
Arnold School of Public HealthOffice for the Study of Aging
0 5 10 15 20 25 YEARS
ResultsResultsIn both urban and rural areas, compared with men, , p ,women live longer, and live a greater proportion of remaining life impaired. At age 65, rural women live 6% longer than urban women, divided about equally between ILE and ALE.At age 65, rural men live about 7.4% longer than urban men, with a slightly larger proportion of remaining life spent impairedremaining life spent impaired.Rural women live about 4 more months with impairment than urban womenimpairment than urban women.Rural men live about 3 more months with impairment than urban men.
Arnold School of Public HealthOffice for the Study of Aging
LimitationsLimitationsBaseline sample did not include those pinstitutionalized.
Conditional on having lived to age 65Conditional on having lived to age 65• More of those dying before age 65 may have resided in
either rural or urban areas• Those who resided in rural areas who died before age 65
may have had greater disease burden• Thus findings may underestimate life course impact ofThus, findings may underestimate life course impact of
rural residenceSimplifying first-order Markov assumption.Need for expanded state model, including moderately and severely impaired, with additional controls, race/ethnicity, and education.
Arnold School of Public HealthOffice for the Study of Aging

Policy ImplicationsPolicy ImplicationsNational costs of services for “extra time” lived with impairment for rural residents may be great National Costs ≈ (costs of long term care
+ health care and therapies+ health care and therapies,+ informal caregiving,
+ lost work and health effects for caregivers+ lost work and health effects for caregivers,+ assistive devices)
x (3 to 4 months) x (number of older rural residents).
National need for services is greater in rural areas gthan in urban areas, yet services are generally less available and accessible in rural areas.
Arnold School of Public HealthOffice for the Study of Aging

Healthy Life Expectancy among OlderHealthy Life Expectancy among Older Americans in Rural and Urban Areas
~ Thank You ~
Sarah B. Laditka, PhD
James N. Laditka, DA, PhD
Keith Elder, PhD
Bankol Olatosi, MHA
This research is supported by a grant from the Office of Rural Health Policy, Health Resources and Services Administration
Arnold School of Public HealthCHSPR / Office for the Study of Aging
![Lif & H [lth Insur[n] Our Lady of San Juan Ready to Serve ...d2y1pz2y630308.cloudfront.net/2817/bulletins/20150913.pdf24th Ordinary Sunday Email: sanjuanshrine@att.net Domingo 24 Tiempo](https://img.dokumen.tips/doc/110x75/5f3e12bb1505521ebb358577/lif-h-lth-insurn-our-lady-of-san-juan-ready-to-serve-24th-ordinary.jpg)


![[XLS]pulse.sgcib.com · Web viewRX LIF REXAM RY LIF ROYAL & SU RZ LIF RANDGOLD LIF STNDRD LIF LIF SMTH & NPH LIF SMITHS GRP S3 LIF STND CHRTD S4](https://img.dokumen.tips/doc/110x75/5aadecb77f8b9a59478b658c/xlspulsesgcibcom-viewrx-lif-rexam-ry-lif-royal-su-rz-lif-randgold-lif-stndrd.jpg)
![Lif & H [lth Insur[n] Our Lady of San Juan Ready to Serve ...sanjuanshrinesa.com/bulletins/20150726.pdf · Hablamos Español y Servimos al Publico ... maravilloso himno de la carta](https://img.dokumen.tips/doc/110x75/5b1d0df77f8b9aa6308b7a31/lif-h-lth-insurn-our-lady-of-san-juan-ready-to-serve-hablamos-espanol.jpg)


![Lif & H [lth Insur[n] Our Lady of San Juan Ready to Serve](https://img.dokumen.tips/doc/110x75/6175ff7e618bb0133f498fe9/lif-amp-h-lth-insurn-our-lady-of-san-juan-ready-to-serve-.jpg)