Embed Size (px)
Citation preview

H-1B Workers in Washington Helping Fill an IT Skills Gap
Workforce Training and Education Coordinating Board
128 10th Avenue SW, PO Box 43105, Olympia, 98504-3105
Phone: 360-709-4600, Fax 360-586-5862
October 2011

2
H-1B Workers in Washington: Helping Fill an IT Skills Gap Foreign workers who come to Washington through the federal H-1B guest worker visa
program do not constitute a large percentage of this state’s workforce. Even so, their
numbers are worth a closer look, especially within our state’s information technology (IT)
industry. In 2010, just over 20 percent of Washington’s H-1B workers were employed by
Microsoft, and another 9 percent by Amazon.
These highly educated workers, whose average wage in Washington tops $90,000, speak to
the demand Washington’s employers have for workers with a specific skill set. When
employers cannot find sufficiently skilled Washington workers—or workers from another part
of the U.S.—they must expand their recruiting efforts to other parts of the world.
This report looks at this state’s H-1B program in detail and answers the following questions.
Which countries do these workers come from?
Where do they go work?
What skills and education do they bring to Washington’s business sector?
And perhaps, just as importantly, what can we learn about our state’s workforce needs?
In 2001, Washington imported an estimated 29,000 foreign workers.1 The numbers have
fluctuated at a much lower level since that time—
largely between 12,000 and 16,000 workers per year.
In 2010, 17,800 H1-B workers were employed in
Washington. That’s compared to the state’s overall
workforce of nearly 3.5 million.2 Altogether, H-1B workers comprise one half of 1 percent of
Washington’s workforce.
1 This report defines H-1B workers as the number of positions requested on each certified H-1B petition granted to an employer. Employers may or may not fill every position requested on a petition. 2 Washington State Employment Security Department, Labor Market and Economic Analysis Branch. “Monthly Employment Report for October 2011.” http://www.workforceexplorer.com/cgi/career/?PAGEID=3&SUBID=148
Washington had the 8th highest number of H-1B visa
petitions in 2010.

3
The H-1B Visa: What is it?
An H-1B is a type of guest worker visa. Guest worker visas allow foreign citizens to work in the United States for a specified amount of time. An H-1B is a non-immigrant visa for a foreign worker who will be employed temporarily in a specialty occupation or field.
The H-1B is initially issued for three years and can be renewed for another three years. The H-1B can also be renewed on an annual basis if the employer is sponsoring the foreign worker for a green card.
The employer holds the visa, not the worker. If a worker is terminated there is no grace period, the worker must leave the country or petition for a change of visa status (usually to a B-2 tourist visa). A visa petition can be for more than one worker.
Of H-1B beneficiaries, 99 percent hold a bachelor’s degree or higher.
Limited Cap on H-1B Visas
Congress created the H-1B visa program in 1990. The number of initial employment H-1B visas issued per fiscal year was capped at 65,000 by law. Since 1990, the cap has fluctuated with legislative changes.3 Currently, the annual cap remains at 65,000 H-1B visas per fiscal year, although the U.S. Citizenship and Immigration Services (USCIS) does offer exceptions for:
The first 20,000 petitions for foreign citizens with U.S. Master’s degrees. Institutions of higher education. Nonprofit and government organizations that conduct research.
There is no cap for the number of continuing employment visas that are issued each year. Since 2005, approximately one-third of all annual H-1B petitions submitted were subject to the cap, while two-thirds of the petitions were exempt or for continuing employment. In 2008 and 2009 the cap was reached within the first week of the USCIS accepting applications, in 2010 and 2011 it took between 8 and 9 months to reach the cap.
H-1B Fees
Submitting an initial H-1B petition that is subject to either the regular cap or the Master’s degree exemption cap requires a number of fees to be paid by the employer:
3 See GAO report 11-26, Appendix V: Selected H-1B Program Laws for a chronological list of major laws and provisions regarding H-1B visas.
Specialty occupations require theoretical and
practical application of a body of specialized
knowledge with at least a bachelor’s degree.
-U.S. Citizenship and Immigration Services
(USCIS)

4
A base filing fee ($325 per petition). A data collection and filing fee.
o $750 for employers with 1 to 25 full-time equivalent employees. o $1,500 for employers with 26 or more full-time equivalent employees.
A fraud prevention and detection fee ($500 per H-1B beneficiary). o A third of this fee is used by the State Department to prevent and detect
fraud. o A third of this money is available to the Department of Homeland Security for
fraud detection and prevention. o The last third is used by the U.S. Department of Labor for enforcement
programs and activities. A premium processing fee ($1,225 for faster processing). An additional fee for companies with more than 50 percent of U.S. employees on H-1B ($2,000 per petition).
The GAO found that the median reported combined legal and filing fee was $3,820 in 2009. Also in 2009, the U.S. Department of Labor’s Wage and Hour Division identified 78 instances of fraud committed by employers who required or accepted payment of these fees by the H-1B worker.
Annual H-1B Petitions Filed and Approved
As shown in the table below, in fiscal year 2009 there were nearly 250,000 petitions filed for H-1B visas. The U.S. Citizenship and Immigration Service (USCIS) approved 82 percent of the petitions for initial employment and 90 percent of the petitions for continuing employment. The number of petitions filed declined by 15 percent between fiscal year 2008 and 2009. The
GAO reports that over the last decade nearly 30 percent of all H-1B workers were hired by large firms, which make up less than 1 percent of all employers.
Cumulative Number of H-1B Workers
The cumulative number of H-1B workers in the United States at any one point in time is unknown due to data limitations. The data is managed by three federal agencies:
The Department of Homeland Security’s USCIS determines eligibility qualifications. The U.S. Department of Labor (DOL) reviews the proposed wage information. The Department of State’s Consular Office issues the visa.
2009 H-1B VisasPetitions
FiledPetitions Approved
Initial Employment 105,775 86,300Continuing Employment 140,872 127,971
Total 246,647 214,271

5
The data systems of these agencies are not linked, and H-1B workers are not assigned a unique identifier that allows for easy tracking.
Protections for U.S. Workers
Each employer must submit a certified DOL Labor Condition Application (LCA -Form ETA 9035) when filing a petition for H-1B visas. This LCA certifies the wage offered to the visa beneficiary equals or exceeds the prevailing wage for that specific occupation in their geographical area. This ensures wages paid to U.S. workers will not be lowered as foreign workers enter the workforce. It also protects the H-1B workers from exploitation by employers paying lower wages.
In addition to the wage protections, employers must also attest that:
The H-1B beneficiary will be given the same benefits offered to other workers with similar jobs.
Notice of the LCA has been given to current employees. The place of employment is not experiencing a labor dispute involving a strike or
lockout.
Characteristics of H-1B Beneficiaries Information regarding the characteristics of H-1B beneficiaries comes from three sources; the Department of Homeland Security,4 the Government Accountability Office,5 and the FLC Data Center.6 Country of Origin
H-1B workers come from many different countries, but disproportionately from India and China. Between 2000 and 2009 nearly half of all H-1B workers came from India. India-based outsourcing firms/IT solution firms like Wipro Technologies, Tata Consultancy Services and Infosys are responsible for the high number (49.6 percent) of Indian H-1B beneficiaries. Critics say these firms misuse the H-1B visa to outsource jobs to India.i Between 2000 and 2009, 9 percent of workers came from China and 4.3 percent of workers came from Canada. Other countries with large numbers of H-1B workers are the United Kingdom, Pakistan, Taiwan and the Philippines.
4 Characteristics of H-1B Specialty Occupation Workers. U.S. Department of Homeland Security, Fiscal Year 2009 Annual Report. 5 H-1B Program: Reforms Needed to Minimize the Risks and Costs of Current Program. Government Accountability Office, GAO 11-26, January 2011. 6 http://www.flcdatacenter.com/CaseH1B.aspx
6
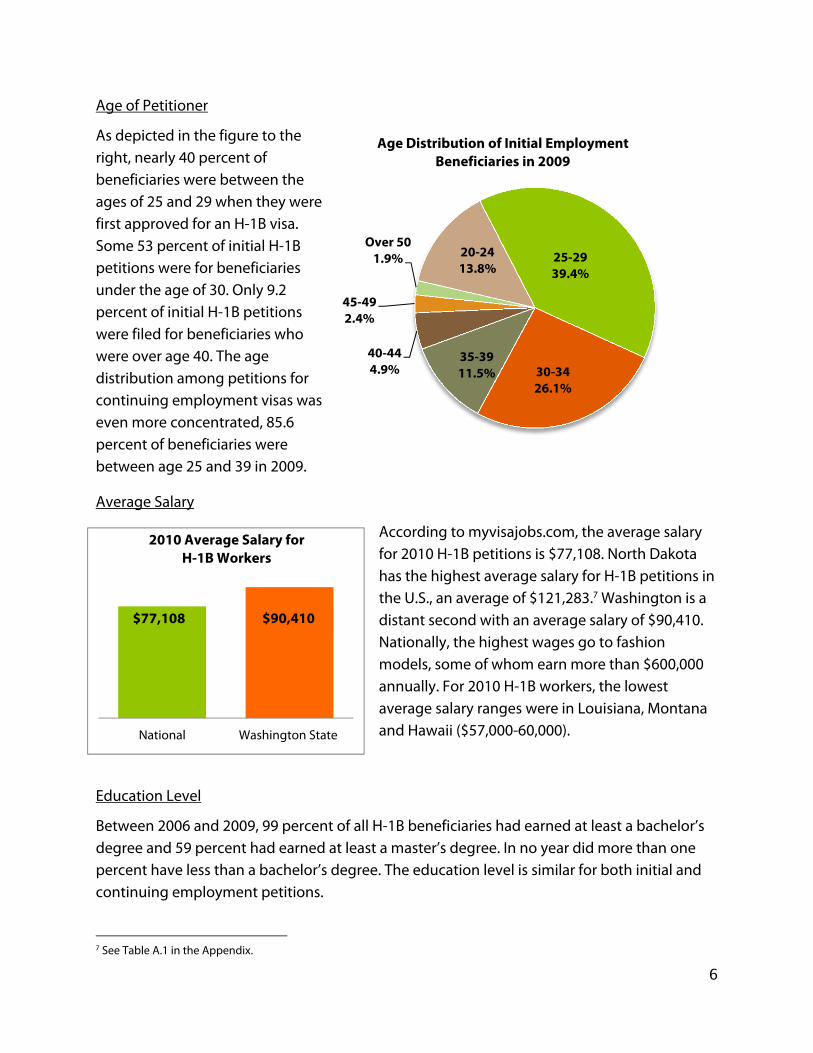
Age of Petitioner
As depicted in the figure to the right, nearly 40 percent of beneficiaries were between the ages of 25 and 29 when they were first approved for an H-1B visa. Some 53 percent of initial H-1B petitions were for beneficiaries under the age of 30. Only 9.2 percent of initial H-1B petitions were filed for beneficiaries who were over age 40. The age distribution among petitions for continuing employment visas was even more concentrated, 85.6 percent of beneficiaries were between age 25 and 39 in 2009.
Average Salary
According to myvisajobs.com, the average salary for 2010 H-1B petitions is $77,108. North Dakota has the highest average salary for H-1B petitions in the U.S., an average of $121,283.7 Washington is a distant second with an average salary of $90,410. Nationally, the highest wages go to fashion models, some of whom earn more than $600,000 annually. For 2010 H-1B workers, the lowest average salary ranges were in Louisiana, Montana and Hawaii ($57,000-60,000).
Education Level
Between 2006 and 2009, 99 percent of all H-1B beneficiaries had earned at least a bachelor’s degree and 59 percent had earned at least a master’s degree. In no year did more than one percent have less than a bachelor’s degree. The education level is similar for both initial and continuing employment petitions.
7 See Table A.1 in the Appendix.
20-2413.8%
25-2939.4%
30-3426.1%
35-3911.5%
40-444.9%
45-492.4%
Over 501.9%
Age Distribution of Initial Employment Beneficiaries in 2009
National Washington State
2010 Average Salary for H-1B Workers
$90,410 $77,108

7
Top H-1B Visa Petitions by State
With over 50,000 H-1B visa petitions, California had the highest number of visa petitions certified in 2010. California is followed by New York with 33,000 H-1B visas certified and Texas with 23,000 certified visas.
New Jersey has the highest density of H-1B workers certified in 2010, with nearly 38 H-1B workers per 10,000 residents. Montana and Wyoming have the lowest per capita H-1B workers certified in 2010, with less than 2 H-1B workers for every 10,000 residents. The U.S. has a per capita concentration of 16 workers certified in 2010 for every 10,000 residents.
Computer and Mathematical Occupations
The largest percentage of H-1B workers are employed in Computer and Mathematical Occupations (CMOs). In 2010, 64.7 percent of all U.S. H-1B visas workers were certified to work
in CMOs, a total of nearly 500,000 workers from 275,000 visa petitions.8 The percentage of H-1B workers certified in CMOs is lower in WICHE states9 (52.7 percent) and higher in Washington (75.3 percent). The most prevalent occupations within this category are: Computer Programmers, Computer Software Engineers (System
8 Employers can request multiple positions on each H-1B petition. Employers may or may not fill every position requested on a petition. 9 WICHE member states are Alaska, Arizona, California, Colorado, Hawaii, Idaho, Montana, Nevada, New Mexico, North Dakota, Oregon, South Dakota, Utah, Washington and Wyoming. Washington State is not included in WICHE calculations in all tables and figures in this report.
Rank WorkStateCertifiedH‐1BVisas
H‐1Bsper10,000Residents
PerCapitaRank
1 California 50,337 22.4 8
2 NewYork 32,914 26.7 53 Texas 22,770 15.5 144 NewJersey 18,320 37.9 15 Illinois 14,334 21.6 96 Florida 11,474 9.5 307 Massachusetts 11,268 27.6 48 Washington 9,791 26.3 69 Pennsylvania 9,699 13.7 1710 Virginia 9,002 18.5 10
Top10StatesforH‐1BVisaPetitions2010
WA75.3%
WICHE 52.7%
US64.7%
As
a %
of a
ll H
-1B
Wor
kers
H-1B Workers Certified in 2010 in Computer and Mathematical Occupations

8
Software & Applications,) Computer Systems Analysts, and All Other Computer Specialists.
In 2010, the USCIS certified 13,392 H-1B CMO workers in Washington, making it the state with the sixth highest number of CMO workers.10 California has the highest number of 2010 CMO H-1B workers with nearly 55,000 workers, followed by New Jersey, Texas, New York, and Illinois all with 20,000-25,000 workers.
Compared to the U.S., Washington has 10 percentage points more certified 2010 H-1B workers in CMOs. In Washington, three out of every four H-1B workers certified in 2010 are in CMOs; furthermore, Washington CMOs workers make up 4.2 percent of all CMO workers certified in the U.S. in 2010.
Washington H-1B Visas
Washington is the state with the 8th highest number of H-1B visa petitions certified in 2010. Many visa petitions were for more than one worker, so there were a total of 17,789 workers certified from the 9,791 visa petitions in 2010. This is the highest number of H-1B visas approved for Washington in the last eight years, and represents a 5 percent increase from 2009. With 26.3 H-1B workers for every 10,000 people, Washington ranked 6th in the nation in having the highest density of workers certified in 2010. That same year, the state had the highest per capita concentration of H-1B workers of any WICHE state.
The 17,789 H1-B workers certified in Washington can be compared to the state’s overall workforce of nearly 3.5 million.11 Altogether, H-1B workers comprise one half of 1 percent of Washington’s workforce. However, not all of Washington’s workforce has the same level of specialized knowledge that is required of H-1B visa holders. There are approximately 931,000 workers in Washington that hold a bachelor’s degree, a professional degree, or a doctorate; therefore, H-1B workers comprise fewer than 2 percent of the workers with this level of education.12 The ratio of H-1B workers to total Washington workers increases when isolating occupational categories that import larger numbers of foreign workers, such as computer and mathematical occupations. For example, in 2010 nearly 14,000 H-1B workers were certified in these occupations compared to an overall CMO workforce of 70,000 in Washington.13 In other words, H-1B workers made up nearly 20 percent of the workers in the computer and mathematical occupations category in 2010.
10 See Figure A.2 in the Appendix. 11 Washington State Employment Security Department, Labor Market and Economic Analysis Branch. “Monthly Employment Report for October 2011.” 12 U.S. Census Bureau’s 2010 American Community Survey, 5-year file, 2006-2010. 13 U.S. Census Bureau’s 2010 American Community Survey, 5-year file, 2006-2010.
9
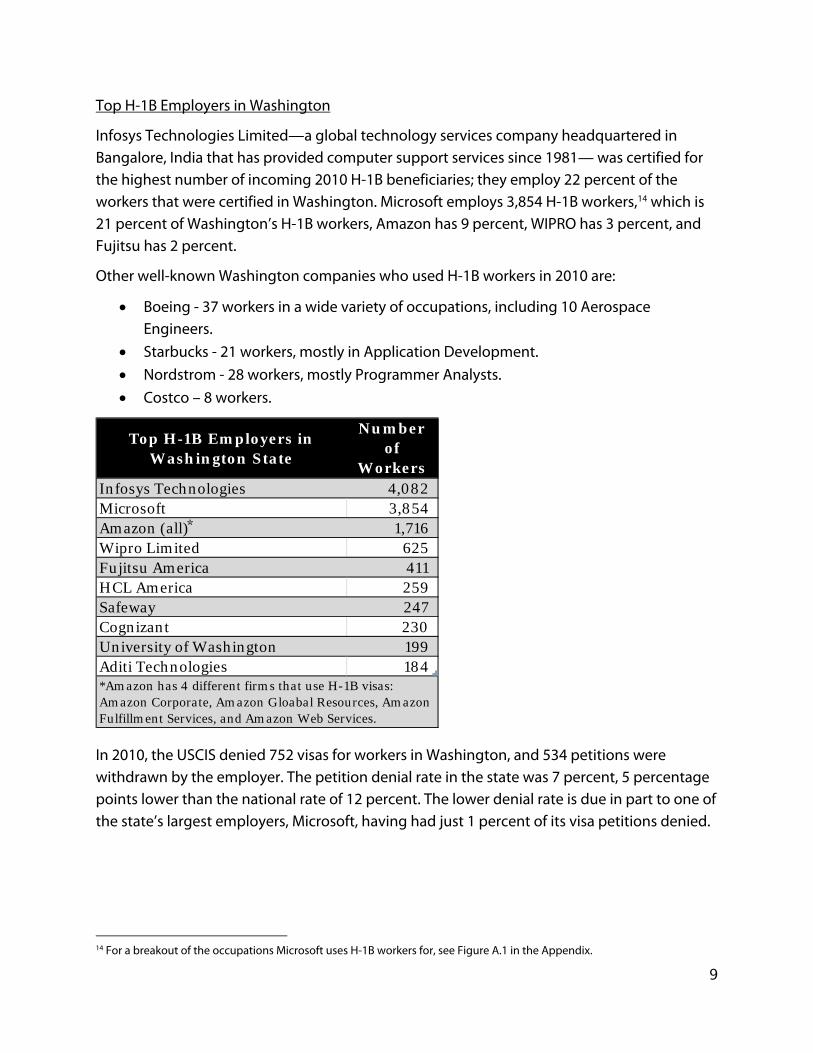
Top H-1B Employers in Washington
Infosys Technologies Limited—a global technology services company headquartered in Bangalore, India that has provided computer support services since 1981— was certified for the highest number of incoming 2010 H-1B beneficiaries; they employ 22 percent of the workers that were certified in Washington. Microsoft employs 3,854 H-1B workers,14 which is 21 percent of Washington’s H-1B workers, Amazon has 9 percent, WIPRO has 3 percent, and Fujitsu has 2 percent.
Other well-known Washington companies who used H-1B workers in 2010 are:
Boeing - 37 workers in a wide variety of occupations, including 10 Aerospace Engineers.
Starbucks - 21 workers, mostly in Application Development. Nordstrom - 28 workers, mostly Programmer Analysts. Costco – 8 workers.
In 2010, the USCIS denied 752 visas for workers in Washington, and 534 petitions were withdrawn by the employer. The petition denial rate in the state was 7 percent, 5 percentage points lower than the national rate of 12 percent. The lower denial rate is due in part to one of the state’s largest employers, Microsoft, having had just 1 percent of its visa petitions denied.
14 For a breakout of the occupations Microsoft uses H-1B workers for, see Figure A.1 in the Appendix.
Top H-1B Employers in Washington State
Number of
WorkersInfosys Technologies 4,082 Microsoft 3,854 Amazon (all) 1,716 Wipro Limited 625 Fujitsu America 411 HCL America 259 Safeway 247 Cognizant 230 University of Washington 199 Aditi Technologies 184 *Amazon has 4 different firms that use H-1B visas: Amazon Corporate, Amazon Gloabal Resources, Amazon Fulfillment Services, and Amazon Web Services.
*

10
Occupational Category Workers in Washington
The majority of the H-1B workers certified to work in Washington in 2010 are in Computer and Mathematical Occupations. The Management Occupations category is the second largest category of incoming 2010 H-1B workers (7 percent), followed by Healthcare Occupations, Business and Financial Operations, and Architecture and Engineering Occupations with 4 percent each. Some commonly used occupations within the Healthcare category are Physicians, Pharmacists, Physical Therapists, and Speech Pathologists. The most frequently used visa job titles in Business and Financial Operations are Fiscal Analyst, Management Analyst, Accountants, Auditors, and Business Analysts.15
15 For a breakdown of the most frequently certified H-1B occupational categories in Washington State, WICHE, and the U.S. over the past 10 years, see the Technical Appendix.
Computer and Mathematical Occupations
75%
Management Occupations
7%Healthcare
4%
Business and Financial
4%
Architecture, Engineering
4%Social Science Occupations
3%Other
3%
2010 Washington H-1B Workers by Major SOC Group

11
Computer and Mathematical Occupation Workers in Washington
Prior to 2010 the USCIS used Dictionary of Occupational Titles (DOT) to identify occupational categories; in 2010 they switched to Standard Occupational Codes (SOC). The occupational category Systems Analysis and Programming was the DOT precursor to the SOC’s Computer and Mathematical Occupations. Between 2001 and 2009 nearly 80,000 workers in Systems Analysis and Programming Occupations were certified to work in Washington, up to 14,000 workers per year. Annually, this occupational category made up between 51 and 62 percent of all Washington H-1B workers.
The figure above contrasts Washington and U.S. data on H-1B workers certified to work in Systems Analysis and Programming Occupations between 2001 and 2008. The highest number of Washington certified H-1B visa workers was in 2001 when 14,273 applications were certified, while the highest percentage was in 2008 with 62 percent of the certified workers were employed in System Analysis and Programming Occupations. The percentage of H-1B visas for H-1B workers in this field has increased over the past decade, from 50 percent in 2001 to 62 percent in 2008.16
16 The DOT’s occupational coding system used to classify H-1B workers from 2001 to 2008. This was changed to SOC codes as of 2009. Accordingly, half of the 2009 and all of the 2010 occupation data was collected in SOC and is not represented in this graph, which only displays DOT occupational data. Additionally, the 2007 data transmitted by fax/e-file is not available and is not represented in this graph.
14,273
7,585 6,087
8,204
9,100 9,798
10,941
40%
50%
60%
70%
2000 2001 2002 2003 2004 2005 2006 2007 2008 2009
Perc
ent o
f Tot
al H
-1B
Wor
kers
H-1B Workers in System Analysis and Programming Occupations Certified Annually 2001-2008
Washington State % of US H-1B Workers

12
Washington employers with large numbers of certified CMO workers include Microsoft with 2,994 H-1B workers in 2010 and Amazon with 1,117 in 2010. However, it’s the Indian firm Infosys Technologies Limited, that had the highest number of CMO H-1B workers certified in 2010, both in Washington (3,937 workers), and nationwide (79,947 workers).17
Other Occupational Categories
The U.S. as a whole has a higher percentage of workers than Washington in many categories, including:
Architecture and Engineering Occupations (U.S. 5.5%, WA 3.9%) Life, Physical, and Social Science Occupations (U.S. 5.4%, WA 2.7%) Business and Financial Operations Occupations (U.S. 6.7%, WA 4.0%)
However, Washington had a higher percentage of 2010 H-1B workers in Management Occupations. The majority of Washington’s H-1B workers employed in Management Occupations, 762 of the 969 H-1B visas certified in 2010, were employed at Microsoft. The large majority (60 percent) of Microsoft’s H-1B workers in Management Occupations are Program Managers, another 11 percent are Product Managers.
17 See Table A.2 in the Appendix.
5.5% 5.4%
6.7%
4.2%
5.7%
3.9%
2.7%
4.0%
6.8%
4.3%
0.0%
2.0%
4.0%
6.0%
8.0%
Architecture andEngineeringOccupations
Life, Physical, andSocial ScienceOccupations
Business andFinancial
OperationsOccupations
ManagementOccupations
HealthcarePractitioners and
TechnicalOccupations
% o
f H-1
B w
orke
rs in
eac
h ca
tego
ry
Major SOC Groups of H-1B Workers Certified in 2010US WA

13
The Impact of the H-1B Visa
The H-1B visa can be a polarizing issue in American politics. Critics say foreign workers are taking jobs away from American workers. Ron Hira of the Economic Policy Institute says, “The goal of the H-1B visa program has been to bring in foreign workers who complement the U.S. workforce. Instead, the loopholes in the program have made it too easy to bring in cheaper foreign workers who directly substitute for, rather than complement, workers already in the country. They are clearly displacing and denying opportunities to U.S. workers.”18
On the other hand, supporters say that the H-1B visa program invigorates the economy and helps businesses succeed. Microsoft founder and chairman Bill Gates, in his testimony to the U.S. Senate in 2007, said that America, “face[s] a critical shortage of scientific talent. And there is only one way to solve that crisis today: Open our doors to highly talented scientists and engineers who want to live, work, and pay taxes here.” 19
A 2011 GAO report states, “If the H-1B program successfully provided needed skills for the U.S. economy, economic theory suggests that the program should contribute to long-run economic growth, which is beneficial for all workers.” However, the GAO does concede that “Certain groups of U.S. workers may experience lower wages and employment as a result of the inflow of H-1B workers.” The GAO also reports that it is difficult to determine the effect of H-1B workers on U.S. workers due to the change in the supply and demand for labor, as well as the changes of wages for both U.S. and foreign workers.
18 The H-1B and L-1 Visa Programs are Out of Control. Ron Hira. Economic Policy Institute. October 14, 2010. 19 Bill Gates Testimony to U.S. Senate, March 7, 2007.

14
Appendix
Table A.1 - Average H-1B Salary by State
Work State H1B Visas
Average Salary
Continued… H1B Visas
Average Salary
North Dakota 137 $121,283.00 New Hampshire 390 $72,511.00
Washington 4,967 $90,410.00 Virginia 4,067 $72,472.00
Maine 199 $87,252.00 North Carolina 2,483 $72,423.00
Wyoming 51 $85,542.00 Tennessee 1,288 $72,331.00
Oregon 978 $83,008.00 Texas 10,144 $71,919.00
New York 15,768 $82,942.00 New Mexico 320 $71,907.00
Connecticut 2,018 $82,303.00 South Carolina 599 $71,627.00
South Dakota 95 $82,031.00 Maryland 3,145 $70,753.00
California 23,548 $81,412.00 Indiana 1,252 $70,473.00
Massachusetts 5,049 $77,763.00 Rhode Island 319 $70,385.00
Minnesota 1,671 $77,328.00 Pennsylvania 4,269 $70,254.00
Arkansas 501 $77,023.00 Nevada 470 $69,451.00
Arizona 1,544 $76,641.00 Nebraska 416 $69,065.00
Kentucky 573 $76,499.00 Ohio 2,730 $68,928.00
Idaho 161 $75,956.00 Alaska 97 $68,379.00
Mississippi 217 $75,148.00 Georgia 3,371 $68,007.00
District of Columbia 1,355 $75,012.00 Kansas 577 $67,973.00
Colorado 1,429 $74,745.00 Utah 515 $67,311.00
Delaware 678 $74,420.00 Alabama 525 $67,301.00
Iowa 676 $74,346.00 Florida 5,744 $67,206.00
Wisconsin 1,192 $74,304.00 Vermont 107 $66,899.00
Missouri 1,471 $73,889.00 Oklahoma 463 $65,240.00
Michigan 2,834 $73,639.00 Hawaii 319 $59,165.00
New Jersey 8,079 $73,517.00 Montana 47 $57,819.00
Illinois 6,560 $73,100.00 Louisiana 800 $57,075.00
West Virginia 164 $72,999.00
Source: myvisajobs.com

15
Table A.2 – Top US Employers of Computer and Mathematical Occupations Top 10 U.S. Employers of H-1B Workers in Computer and Mathematical Occupations in 2010
# of Certified Workers*
Infosys Technologies Limited 79,947 Cognizant Technology Solutions U.S. Corporation 24,526 Wipro Limited 15,897 Oracle America, INC. 13,002 Fujitsu America, INC. 10,153 Itelligence, INC. 7,140 Mphasis Corporation 6,559 Ibm India Private Limited 4,910 Microsoft Corporation 3,327 Accenture Technology Solutions 3,245 Hewlett-Packard Company 3,089 Mastech, INC., A Mastech Holdings, INC. Company 2,760 Deloitte Consulting Llp 2,494 Cisco Systems, INC. 2,216 Syntel Consulting INC 1,730 Csc Covansys Corporation 1,303 Ust Global INC. 1,213 Satyam Computer Services Limited 1,198 Hcl America, INC. 1,179 Amazon Corporate LLC 1,119 Syntel INC 1,101 Tata Consultancy Services Limited 1,097 Pricewaterhousecoopers, LLP 1,082 Mindtree Limited 840 Larsen & Toubro Infotech Limited 759
Source: http://www.flcdatacenter.com/CaseH1B.aspx
* H-1B workers are defined as the number of positions requested on each certified H-1B petition granted to an employer. Employers may or may not fill every position requested on a petition.

16
Figure A.1 – Standard Occupational Code Distribution of Microsoft’s H-1B Workers in 2010
Source: http://www.flcdatacenter.com/CaseH1B.aspx
Computer Software Engineers, Software
72%
Managers, All Other17%
Computer Specialists, All Other
4%
Financial Managers1%
Marketing Managers1%
Computer & Information
Scientists1%
Other4%
2010 Distribution of Microsoft's H-1B Certified Workers, by SOC

17
Figure A.2 – H-1B Computer and Mathematical Occupation Distribution by State
Source: http://www.flcdatacenter.com/CaseH1B.aspx
54,437
26,195
22,702
21,677
19,307
13,392
12,083
11,664
11,360
10,493
9,556
9,553
9,249
9,032
- 10,000 20,000 30,000 40,000 50,000 60,000
CA
NJ
TX
NY
IL
WA
PA
OH
MA
VA
NC
CT
FL
GA
Num
bero
f Com
pute
r & M
athe
mat
ical
Occ
upat
ion
Wor
kers
Number of H-1B Workers in Computer and Mathematical Occupations Located in Each State, 2010

18
i “According to an industry organization representing the IT services industry, outsourcing firms that offshore work, typically call themselves IT solutions firms in order to differentiate themselves from staffing firms. Others view them as a different business model—that is, one that uses onshore staff to provide access to a large, less expensive offshore labor force. An example might be an offshore outsourcing firm that takes over an IT help desk department, and uses its onshore component (staffed by H-1B workers) to establish relationships with and manage projects for the client company in the United States, while using the offshore component to staff the help desk. As such, several of the IT services firms we contacted that conducted offshore outsourcing could be considered a hybrid between an IT staffing and a solutions firm, at times providing IT staff to work at client sites, at times offshoring IT work to their overseas component, and at times providing both onshore and offshore work for a client.” (Government Accountability Office Report 11-26)

Top 5 WA Occupations Compared to WICHE/US*
WA WICHE US
Computer Programmers 23.0% 21.0% 24.0%
Computer Software Engineers, System Software
17.0% 6.0% 4.0%
Computer Systems Analysts 14.0% 18.0% 19.0%
Computer Software Engineers, Applications
13.0% 15.0% 11.0%
Computer Specialists, All Other 5% 2% 2.1%
*2010 Data uses Standard Occupational Codes, 2001‐2009 uses Dictionary of Occupational Titles
2010 Occupations with the Highest Percentage of H‐1B Workers
Technical Appendix ‐ Annual Summary of H‐1B Workers by Occupation
Computer Programmers
24%
Computer Systems Analysts19%
Computer Software Engineers, Applications
11%
Computer Software Engineers, Systems Software
4%
Other42%
2010 US Occupations With the Highest Percentage of Certified H‐1B Workers
Computer Software Engineers, Applications
15%
Computer Systems Analysts18%
Computer Programmers
21%Computer Software Engineers, Systems Software
6%
Electronics Engineers, Except
Computer3%
Other37%
2010 WICHE Occupations With the Highest Percentage of Certified H‐1B Workers
Computer Programmers
23%
Computer Software Engineers, Systems Software17%
Computer Systems Analysts14%
Computer Software Engineers, Applications
13%
Computer Specialists, All
Other5%
Other28%
2010 Washington State Occupations With The Highest Percentage of Certified H‐1B
Workers

Top 5 WA Occupations Compared to WICHE/US
Percent of WA Workers
Percent of WICHE Workers
Percent of US Workers
Systems Analysis And Programming 54.3% 43.0% 42.4%
Electrical/Electronics Engineering 6.7% 6.8% 3.5%
Other Computer‐Related Occupations
4.7% 3.9% 3.3%
College And University Education 2.5% 1.6% 3.1%
Accountant & Auditors 2.2% 5.7% 4.5%
2002 Occupations with the Highest Percentage of H‐1B Workers
Systems Analysis And Programming
54%
Electrical Engineering
7%Other
Computer‐Related
Occupations5%
College And University Education
2%
Accountant & Auditors
2%Aeronautical Engineering
2%
Other28%
2002 Washington State Occupations With The Highest Percentage of Certified H‐1B
Workers
Systems Analysis And Programming
48%
Accountants & Auditors
5%
Electrical Engineering
4%
Other Computer‐Related
Occupations4%
College And University Education
3%
Other36%
2002 US Occupations With the Highest Percentage of Certified H‐1B Workers
Systems Analysis And Programming
43%
Electrical Engineering
7%
Accountants & Auditors
6%
Other Computer‐Related
Occupations4%Other
40%
2002 WICHE Occupations With The Highest Percentage of Certified H‐1B Workers
L:\H1B Project\H‐1B Report\Appendix\H1B_Technical Appendix

Top 5 WA Occupations Compared to WICHE/US WA WICHE US
Systems Analysis And Programming 53.4% 42.2% 40.0%
Architectural Occupations 5.9% 3.8% 3.9%
Miscellaneous Managers And Officials
4.7% 3.2% 3.2%
Other Computer‐Related Occupations
3.7% 3.5% 2.7%
College And University Education 3.2% 2.2% 4.1%
2003 Occupations with the Highest Percentage of H‐1B Workers
Systems Analysis And Programming
42%
Accountants & Auditors
7%
Electrical Electronics Engineering
5%
Architectural Occupations
4%
Other Computer‐Related
Occupations4%
Other38%
2003 WICHE Occupations With the Highest Percentage of Certified H‐1B Workers
Systems Analysis And Programming
53%
Architectural Occupations
6% Miscellaneous Managers And
Officials5%
Other Computer‐Related
Occupations4%
College And University Education
3%Accountants &
Auditors3%
Other26%
2003 Washington State Occupations With The Highest Percentage of Certified H‐1B
Workers
Systems Analysis And Programming
40%
Accountant & Auditors
5%
College And University Education
4%
Architectural Occupations
4%
Miscellaneous Managers And
Officials3%
Other44%
2003 US Occupations With The Highest Percentage of Certified H‐1B Workers
L:\H1B Project\H‐1B Report\Appendix\H1B_Technical Appendix

Top 5 WA Occupations Compared to WICHE/US WA WICHE US
Systems Analysis And Programming 56.5% 43.5% 43.7%
Aeronautical Engineering 6.8% 0.2% 0.3%
Other Computer‐Related Occupations
3.5% 3.4% 3.1%
College And University Education 2.5% 2.1% 3.8%
Accountants & Auditors 2.5% 6.9% 5.1%
2004 Occupations with the Highest Percentage of H‐1B Workers
Systems Analysis And Programming
44%
Accountants & Auditors
7%
Electrical Engineering
6%
Architectural Occupations
4%
Other Computer‐Related
Occupations3%
Other36%
2004 WICHE Occupations With the Highest Percentage of Certified H‐1B Workers
Systems Analysis And Programming
44%
Accountant & Auditors
5%
Architectural Occupations
4%College And University Education
4%
Other Computer‐Related
Occupations3%
Electrical Engineering
3%
Other37%
2004 US Occupations With the Highest Percentage of Certified H‐1B Workers
Systems Analysis And Programming
56%
Aeronautical Engineering
7%
Other Computer‐Related
Occupations3%
College And University Education
3%
Accountants & Auditors
3%
Other28%
2004 Washington State Occupations With The Highest Percentage of Certified H‐1B
Workers
L:\H1B Project\H‐1B Report\Appendix\H1B_Technical Appendix

Top 5 WA Occupations Compared to WICHE/US WA WICHE US
Systems Analysis And Programming 61.4% 51.7% 52.8%
Other Computer‐Related Occupations
9.1% 9.1% 8.9%
College And University Education 2.7% 2.1% 3.3%
Computer System Technical Support
2.1% 0.4% 0.3%
Accountant, Auditors, And Related Occupations
2% 4.4% 4%
2005 Occupations with the Highest Percentage of H‐1B Workers
Occupations In Systems
Analysis And Programming
53%
Other Computer‐Related
Occupations9%
Accountant, Auditors
4%Architectural Occupations
3%
College And University Education
3%Electrical Engineering
2%
Other26%
2005 US Occupations With the Highest Percentage of Certified H‐1B Workers
Systems Analysis And Programming
61%
Other Computer‐Related
Occupations9%
College And University Education
3%
Computer System Technical Support2%
Other25%
2005 Washington State Occupations With The Highest Percentage of
Certified H‐1B Workers
Systems Analysis And Programming
52%
Other Computer‐Related
Occupations9%
Electrical Engineering
5%
Accountants & Auditors
4%
Architectural Occupations
3%
Other27%
2005 WICHE Occupations With the Highest Percentage of Certified H‐1B Workers
L:\H1B Project\H‐1B Report\Appendix\H1B_Technical Appendix

Top 5 WA Occupations Compared to WICHE/US WA WICHE US
Systems Analysis And Programming 59.2% 45.0% 47.9%
Other Computer‐Related Occupations
5.9% 3.6% 3.3%
Miscellaneous Managers And Officials
4.9% 1.5% 1.5%
Architectural Occupations 3.0% 3.6% 4.1%
College And University Education 3.0% 2.6% 3.8%
2006 Occupations with the Highest Percentage of H‐1B Workers
Systems Analysis And Programming
48%
Accountant & Auditors
5%Architectural Occupations
4%
College And University Education
4%
Other Computer‐Related
Occupations3%
Other36%
2006 US Occupations With the Highest Percentage of Certified H‐1B Workers
Systems Analysis And Programming
45%
Electrical Engineering
5%
Accountants & Auditors
5%Data
Communication And Networks
4%
Architectural Occupations
4%
Other Computer‐Related
Occupations4%
Other33%
2006 WICHE Occupations With the Highest Percentage of Certified H‐1B Workers
Systems Analysis And Programming
59%
Other24%
Other Computer‐Related
Occupations6%
Miscellaneous Managers And
Officials5%
Architectural Occupations
3%
College And University Education
3%
2006 Washington State Occupations With The Highest Percentage of Certified H‐1B
Workers
L:\H1B Project\H‐1B Report\Appendix\H1B_Technical Appendix

Top 5 WA Occupations Compared to WICHE/US WA WICHE US
Systems Analysis And Programming 47.5% 40.0% 53.0%
Miscellaneous Managers And Officials
8.3% 2.1% 1.5%
Other Computer‐Related Occupations
6.9% 3.2% 3.2%
College And University Education 4.2% 2.4% 3.2%
Electrical/Electronics Engineering 3.6% 5.8% 2.4%
2007 Occupations with the Highest Percentage of H‐1B Workers
Systems Analysis And Programming
40%
Missing or Invalid10%
Electrical Engineering
6%
Accountants & Auditors
4%
Architectural Occupations
3%
Other Computer‐Related
Occupations3%
Other34%
2007 WICHE Occupations With the Highest Percentage of Certified H‐1B Workers
Systems Analysis And Programming
53%
Accountants & Auditors
4%College And University Education
3%
Other Computer‐Related
Occupations3%
Architectural Occupations
3%
Other34%
2007 US Occupations With the Highest Percentage of Certified H‐1B Workers
Systems Analysis And Programming
48%
Miscellaneous Managers And
Officials8% Other
Computer‐Related
Occupations7% College And
University Education
4%
Electrical Engineering
4%Accountants &
Auditors2%Aeronautical
Engineering Occupations
2%
Other25%
2007 WA Occupations With The Highest Percentage of Certified H‐1B Workers
L:\H1B Project\H‐1B Report\Appendix\H1B_Technical Appendix

Top 5 WA Occupations Compared to WICHE/US WA WICHE US
Systems Analysis And Programming 61.9% 51.0% 53.8%
Other Computer‐Related Occupations
6.0% 3.7% 3.3%
Miscellaneous Managers And Officials
4.4% 1.5% 1.2%
College And University Education 2.5% 2.4% 3.5%
Budget And Management Systems And Analysis Occupations
2% 2.9% 3%
2008 Occupations with the Highest Percentage of H‐1B Workers
Systems Analysis And Programming
62%
Other Computer‐Related
Occupations6%
Miscellaneous Managers And
Officials4%
College And University Education
3%Other25%
2008 Washington State Occupations With The Highest Percentage of Certified H‐1B
Workers
Systems Analysis And Programming
51%
Electrical Electronics Engineering
5%
Accountants & Auditors
4%
Other Computer‐Related
Occupations4%
Architectural Occupations
3%
Other33%
2008 WICHE Occupations With the Highest Percentage of Certified H‐1B Workers
Systems Analysis And Programming
54%
Architectural Occupations
4%College And University Education
4%
Other Computer‐Related
Occupations3%
Accountants & Auditors
3%
Budget And Management Systems And Analysis
3%
Other29%
2008 US Occupations With the Highest Percentage of Certified H‐1B Workers
L:\H1B Project\H‐1B Report\Appendix\H1B_Technical Appendix

Top 5 WA Occupations Compared to WICHE/US WA WICHE US
Systems Analysis And Programming 51.6% 50.5% 49.3%
Other Computer‐Related Occupations
17.6% 4.2% 3.8%
Budget And Management Systems And Analysis
5.9% 6.9% 8.0%
Miscellaneous Managers And Officials
5.0% 1.3% 1.4%
Occupations In College And University Education
1.9% 2.5% 4%
2009 Occupations with the Highest Percentage of H‐1B Workers
Systems Analysis And Programming
52%
Other Computer‐Related
Occupations17%
Budget And Management Systems And Analysis
6%
Miscellaneous Managers And
Officials5%Other
20%
2009 Washington State Occupations With The Highest Percentage of Certified H‐1B
Workers
Systems Analysis And Programming
49%
Budget, Management Systems & Analysis
8%
Other Computer‐Related
Occupations4%
College And University Education
4%Accountant &
Auditors3%
Architectural Occupations
3%
Other29%
2009 US Occupations With the Highest Percentage of Certified H‐1B Workers
Systems Analysis And Programming
51%
Budget And Management Systems And Analysis
Occupations7%
ElectricalEngineering
5%
Other Computer‐Related
Occupations4%
Accountants & Auditors
4%
Other29%
2009 WICHE Occupations With the Highest Percentage of Certified H‐1B Workers
L:\H1B Project\H‐1B Report\Appendix\H1B_Technical Appendix

Top 5 WA Occupations Compared to WICHE/US
WA WICHE US
Computer Programmers 23.0% 21.0% 24.0%
Computer Software Engineers, System Software
17.0% 6.0% 4.0%
Computer Systems Analysts 14.0% 18.0% 19.0%
Computer Software Engineers, Applications
13.0% 15.0% 11.0%
Computer Specialists, All Other 5% 2% 2.1%
2010 Occupations with the Highest Percentage of H‐1B Workers
Computer Programmers
24%
Computer Systems Analysts19%
Computer Software Engineers, Applications
11%
Computer Software Engineers, Systems Software
4%
Other42%
2010 US Occupations With the Highest Percentage of Certified H‐1B Workers
Computer Software Engineers, Applications
15%
Computer Systems Analysts18%
Computer Programmers
21%Computer Software Engineers, Systems Software
6%
Electronics Engineers, Except
Computer3%
Other37%
2010 WICHE Occupations With the Highest Percentage of Certified H‐1B Workers
Computer Programmers
23%
Computer Software Engineers, Systems Software17%
Computer Systems Analysts14% Computer
Software Engineers, Applications
13% Computer Specialists, All
Other5%
Other28%
2010 Washington State Occupations With The Highest Percentage of Certified H‐1B
Workers
L:\H1B Project\H‐1B Report\Appendix\H1B_Technical Appendix