Embed Size (px)
Citation preview

Ecological Complexity 14 (2013) 132–144
Original research article
Gypsy moth invasion in North America: A simulation study of the spatialpattern and the rate of spread
Masha Jankovic *, Sergei Petrovskii
Department of Mathematics, University of Leicester, Leicester LE1 7RH, UK
A R T I C L E I N F O
Article history:
Received 3 July 2012
Received in revised form 23 January 2013
Accepted 23 January 2013
Available online 13 March 2013
Keywords:
Biological invasion
Gypsy moth
Viral infection
Patchy invasion
Pattern formation
A B S T R A C T
Gypsy moth is regarded as one of the top most harmful invasive species. Its invasion in the northeastern
US has led to widespread forest defoliation, wildlife disruption and even a change in biogeochemical
conditions over the area of 106 km2. Spread of gypsy moth has a few distinct features such as a patchy
spatial distribution of the gypsy moth population, which is largely uncorrelated to the environmental
heterogeneity, and a high variability (almost over an order of magnitude) in the spread rates. These
features are usually explained by human-assisted dispersal, e.g. when masses of gypsy moth eggs are
inadvertently transported by cars and vehicles. This theory, however, somewhat disagrees with the
existence of the strong Allee effect that tends to wipe out small new colonies. In this paper, we suggest an
alternative explanation that the patchy structure can result from the interplay between two natural
factors such as wind dispersal and viral infection. In order to check this hypothesis, we describe the gypsy
moth spread with a diffusive SI model and study its properties by means of extensive computer
simulations. Interestingly, in a certain parameter range our model shows formation of spatial patterns
that are qualitatively similar to those observed in the field. To find out the relevant parameter range, we
make a careful review of available literature sources. For biologically meaningful parameter values, we
then show that the rates of gypsy moth spread predicted by our model are in good agreement with the
lower band of the rates observed in nature.
� 2013 Elsevier B.V. All rights reserved.
Contents lists available at SciVerse ScienceDirect
Ecological Complexity
jo ur n al ho mep ag e: www .e lsev ier . c om / lo cate /ec o co m
1. Introduction
Biological invasion occurs when non-native organisms areintroduced to a new area beyond their original (native) range. Thetopic of biological invasions has received much interest due to therapidly increasing number of introduced exotic species (Henge-veld, 1989; Lewis and Kareiva, 1993; Williamson, 1996; Shigesadaand Kawasaki, 1997; Parker et al., 1999; Sakai et al., 2001).Prompted by increasing levels of trade and travel, biologicalinvasions pose a major threat to biodiversity of ecosystems andincur vast economic losses throughout the world (Pimentel, 2002).Due to widespread, vast and profound changes inflicted uponecosystems the topic of biological invasions has been recognized asa significant part of global environmental change (Vitousek et al.,1996).
A rule of thumb known as the tens rule arises in this matter,implying the notion that only about 10% of introduced invasivespecies become established and a mere 10% of these species evolveinto pests, yielding harmful consequences (Williamson, 1996).
* Corresponding author.
E-mail address: [email protected] (M. Jankovic).
1476-945X/$ – see front matter � 2013 Elsevier B.V. All rights reserved.
http://dx.doi.org/10.1016/j.ecocom.2013.01.006
Even though a relatively small amount of invaders succeed toestablish, their cumulative effect has been very large. According toa summary report, the total loss incurred from alien pest specieswas estimated at almost $100 billion by 1991 (US Congress OTA,1993), and is expected to rise even farther in future years.Ecological impacts are diverse and include the effects pest specieshave on other species abundance and extinction, effects on thefood web, changes imposed on ecosystem processes and changes inphysical structure of the environment (e.g. Parker, 2004).
A prime example is the invasion by the gypsy moth, Lymantria
dispar, in the US. Since its introduction in the late 1860s the gypsymoth has spread throughout North America, incurring significantdamage to forests in all or parts of nineteen northeastern states(Maloney et al., 2010). Currently occupying only a third of itspotential habitat, various management strategies are utilized tocontrol gypsy moth spread. To date, the eradication of gypsy mothpopulations in northeastern US has not been successful, as it is stillspreading. The gypsy moth is known to be an invasive pest in itsnative range as well, including countries such as Romania, formerYugoslavia, France and Japan (Gerardi and Grimm, 1979).However, the most devastating consequences are observed inNorth America where since its introduction it has invaded over106 km2 (Liebhold et al., 1992). Apart from the devastating

M. Jankovic, S. Petrovskii / Ecological Complexity 14 (2013) 132–144 133
defoliation, the gypsy moth indirectly affects native populationdynamics (Jones et al., 1998), carbon sequestration and nutrientcycling, alters biogeochemical conditions and changes the acid–base status of affected catchments (Webb et al., 1995) and also hasa negative effect on radial growth of tree hosts (Naidoo andLechowicz, 2001). Rightfully, the gypsy moth has earned the title asone of a hundred world’s worst invasive species by the ISSG(Invasive Species Specialist Group).
The goal of this study is to re-examine the biological factors andthe corresponding mechanisms that can affect the pattern and rateof spread of high density gypsy moth populations in NorthAmerica. For this purpose, we first carefully examine availableevidence and perform an extensive literature review of gypsy mothbiological traits and the possible impact of environmental forcing;see Section 2. From this examination, we infer that the two mainfactors controlling the local gypsy moth abundance are likely to bethe Allee effect and the nuclear polyhedrosis virus (NPV). We thenconsider a spatially explicit SI model (see Section 3) and show thatthe qualitative features of gypsy moth spread can be wellexplained by the interplay between short-distance dispersal, localdisease dynamics and the Allee effect. Based on parameterestimates available from the literature, we show (see Section 5)that the model prediction of the rate of spread is in good agreementwith field data.
2. Gypsy moth: biology, population dynamics, dispersal
Gypsy moth is univoltine, meaning it produces one generationper year. Different stages of metamorphosis include the egg phase,larval (caterpillar), pupal (cocoon) and adult phase. Hatching of eggmasses usually coincides with budbreak (April and May). Bychewing through their egg shells, larvae emerge and maturethrough five to six instars, over a period of about four to six weeks.After locating a preferable place, pupation occurs, mainly on trunksof trees. The pupal stage is brief, lasting around two weeks, inwhich feeding does not occur, and in the majority of this periodpupae are immobile. Mature adults emerge in midsummer (lateJune, early July) and usually live a week or less (Tobin and Liebhold,2011). Males tend to develop slightly before females and this timelag is known as protandry. Females are typically larger than males,usually baring a whitish cream colour with some black markingson their wings, and are flightless (in North America, though someAsian strains are capable of sustained, directed flight). Males areusually brown or dusky coloured with darker markings on theirwings, and capable of flight. Following emergence, mating occurs,and success is hugely dependent on the distance between malesand females.
Due to the females incapability of flight, range distribution andexpansion of the gypsy moth is largely reliant on spreadmechanisms such as larval crawling, windborne dispersal of firstinstars, and increasingly dependent on artificial dispersal originat-ing from inadvertent human transport. This combination ofdifferent dispersal scales induced by long-distance ‘‘jumps’’originating from artificial dispersal and local colony growth dueto short-distance ballooning of early instars is known as stratifieddiffusion (Liebhold and Tobin, 2010). Upon hatching first instargypsy moth larvae crawl to branch twigs and suspend on silkenthreads awaiting passive dispersal in the wind. This ballooning ofearly instars yields short range dispersal. Whilst natural dispersalis limited to early instars, artificial dispersal affects all life stagesbut most frequently involves egg masses. Long distance dispersalleads to the formation of isolated colonies ahead of the initiallyinfested area, which may grow and coalesce thereby increasing therate of spread.
Counts of male moths in pheromone baited traps are a widelyused tool for monitoring low density populations and detecting
new isolated colonies. Other methods of monitoring gypsy mothpopulations are the examination of forest defoliation aerial mapsand counts of overwintering egg masses. Though a tedious process,egg mass counts are frequently utilized for monitoring medium tohigh density populations and are used to make decisions of varioussuppression techniques. However, egg mass sampling programstends to have low spatial resolution and often produce inconclu-sive data, hence male moth counts are the preferred measure ofpopulation abundance.
Compared to other invasive species the rate of spread of gypsymoth is relatively slow largely due to the females’ incapacity offlight. Spread rates have shown considerable variation throughoutthe years of gypsy moth invasion. To date, explanations of thisvariation in spread speed have been numerous, such as, on the onehand, the continuous growing of forests which increase propor-tions of suitable hosts for this pest insect and, on the other hand,the enactment of quarantine measures limiting and suppressingfurther population spread. In particular, it has been proven that thelarge-scale ‘‘Slow the Spread’’ program since its employment in1995 has successfully reduced the spread by at least 50% (Sharov etal., 2002). Analysing available historical county level quarantinedata on gypsy moth invasion Liebhold et al. (1992) concluded thatthe spread rates differed, throughout the past century, from a mere2.82 km/year to a worrying 20.78 km/year. More recently, Tobin etal. (2007a), using various spread rate estimation techniques, cameup with even a broader range of spread rates as 2.6–28.6 km/year.Increased rates of range expansion are usually linked to increasedinadvertent transport of gypsy moth by humans. Also thegeographic variation affects the spread rate as spread to the northwas significantly slower than to the south and west regions,probably due to severe weather conditions (cold temperatures inparticular) which tend to cause heavy mortality in overwinteringegg masses.
Another factor shown to affect the gypsy moth spread is the Alleeeffect (Liebhold and Bascompte, 2003; Tobin et al., 2009; Vercken etal., 2011). In essence, the Allee effect describes a positive relationshipbetween individual fitness and population density (Dennis, 1989;Courchamp et al., 1999); therefore, the lower the density the moreprominent the impact of the Allee effect can be. As a particularconsequence, low density populations can be, and often are, drivento extinction. In the formation of new isolated colonies of gypsymoth, successful establishment and the subsequent growth largelydepend on factors affecting sparse populations. Gypsy moth isolatedcolonies are of low abundance and highly prone to Allee effects andextinction (Liebhold and Bascompte, 2003; Sharov et al., 1995;Whitmire and Tobin, 2006). Mating success is the most importantdensity dependent factor affecting sexually reproducing sparsepopulations. Sharov et al. (1995) found that successful mating ismore likely to occur in high density than in low density populations,highlighting the possibility of extinction through the Allee effect insparse populations.
Allee effects exhibit region specific behaviour, thus indirectlyinfluencing the rate of range expansion (Tobin et al., 2007b).Although mate-finding failure is thought to be a universal cause ofAllee dynamics, reasons underlying spatial and temporal variationof Allee effect strength remain obscure. Numerous studies haveshown an inverse relationship between Allee effect strength andinvasion speed (Lewis and Kareiva, 1993; Tobin et al., 2009, 2007b;Whitmire and Tobin, 2006). However, quantifying Allee effects andestablishing thresholds is by no means a simple task. The estimatesof Allee thresholds obtained in several studies are largely based onmonitoring techniques, such as pheromone baited trap catch data,and expressed in units of male moth counts per trap. These countsprovide only relative information and should not be treated asabsolute population density measures but rather as measures ofrelative gypsy moth abundance (Sharov et al., 1995).

Fig. 1. Gypsy moth defoliation map of US states for 2007. Red colour shows
defoliated areas. (For interpretation of the references to colour in this figure legend,
the reader is referred to the web version of the article.)
From http://www.fs.fed.us/ne/morgantown/4557/gmoth/atlas/#defoliation, by
curtesy of Sandy Liebhold.
M. Jankovic, S. Petrovskii / Ecological Complexity 14 (2013) 132–144134
Dispersal of individual insects results in the gypsy mothpopulation spread over space. In North America, this spatialspread results in the formation of a highly heterogeneous spatialdistribution or ‘pattern’ (see Fig. 1) when areas with high level ofinfestation alternate with areas where gypsy moth is either absentor present at a low density. Having mentioned spatial variabilityof the strength of the Allee effect, an immediate intuitive attemptwould be to relate the observed pattern to environmentalheterogeneity. Gypsy moth is a polyphagous herbivore andcurrently feeds on a total of around 300 tree species, includingboth deciduous and coniferous species; however, some treespecies are more preferable than others. In areas with morepreferred tree species, higher numbers of gypsy moths are morelikely (Liebhold et al., 1994; Witter et al., 1992). Interestingly, theevidence suggests spatial heterogeneity is not as significant afactor in distribution as one might expect. Sharov et al. (1997)looked at pheromone trap data from 1988 to 1994 in northernVirginia and southern West Virginia to find correlations betweenlandscape characteristics (land use, slope, elevation, aspect andtwo forest classifications) and gypsy moth density that could beused to improve understanding of the spread. However, onlyelevation was found to be statistically significant, and onlystrongly significant in the transition zone. Whitmire and Tobin(2006) looked at new outbreaks across the USA and concluded that‘‘the abundance of preferred host tree species and land usecategory did not appear to influence persistence.’’ Overall,environmental forcing through spatial heterogeneity does notappear to be enough to explain the pattern of gypsy mothdistribution.
Having the effect of environmental heterogeneity excluded, onetherefore may hypothesize that the pattern formation in the gypsymoth spatial distribution is an inherent property of biologicalinteractions. Indeed, a well-developed theory predicts self-orga-nized formation of irregular spatial structure in the wake of thepropagating invasion front (Sherratt et al., 1995, 1997) in case thealien species is affected either by predators or pathogens.Interestingly, a closer look at the defoliation maps reveals thatin case of gypsy moth spread there is no any apparent continuousfront separating infested from non-infested regions can beconcluded (Fig. 1). This scenario of alien species spread has been
referred to as the patchy invasion (Petrovskii et al., 2002; Morozovet al., 2006; Mistro et al., 2012). In Section 3, we will explore thishypothesis further and show that the patchy spread of gypsy mothcan appear as a result of the interplay between short-distancedispersal, the Allee effect and a certain viral infection (NPV) whichis common in gypsy moth.
2.1. Nuclear polyhedrosis virus (NPV)
NPV is commonly known as ‘‘wilt disease’’ due to the soft andlimp appearance of infected larvae. This naturally occurring viralinfection induces a bimodal pattern of mortality. Early instarsbecome infected with lethal doses of NPV on the surface of eggmasses and a shiny oily appearance is typical for infected larvae.Mortality occurs usually a week or two after hatch; virus killedlarvae hang in an inverted V position and cadavers are usually abrownish black colour. Cadavers of the killed larvae serve asinoculums of infection to older instars, feeding on contaminatedfoliage, causing a second wave of mortality (Elkinton et al., 1990;Elkinton and Liebhold, 1990; Dwyer and Elkinton, 1993); see Fig. 2.Cadavers rupture and subsequently release large numbers ofpolyhedral occlusion/inclusion bodies (also known as PIBs) thatcan survive outside hosts and remain in the soil and surroundingareas for up to one year (Elkinton and Liebhold, 1990; Reardon etal., 2009), hence the virus is ubiquitous. The corresponding gypsymoth mortality rate is estimated to be about 90% (Reardon et al.,2009).
There are several NPV transmission mechanisms in gypsymoth populations. Horizontal transmission of the virus isthought to be the principal means of transmission betweengenerations, as egg masses contract the disease from contami-nated surfaces. The viral infection can also be passed on fromfemale parent to offspring known as vertical (or maternal)transmission and is thought to occur less often than horizontaltransmission, remaining a debatable issue. Some studies haveshown that the majority of larval mortality occurs by means ofsurface contamination (transovum), rather than within the egg(transovarial) (Elkinton et al., 1990). Other studies have shownthat transmission may originate from male gypsy moths duringmating, and even from egg parasitoids such as Ooencyrtus
kuvanae. Other mechanisms of NPV transmission within gypsymoth populations are vectoring of the disease by variouspredators (Lautenschlager et al., 1980). NPV epizootics areassociated with high density populations; however, the viruscan be found in low density populations as well.
3. Model
Based on the evidence revealed above, there are three specificfeatures in the pattern of gypsy moth spread: (i) at any time, thelarge-scale spatial distribution of the population density isdistinctly heterogeneous, the heterogeneity being self-organizedand not directly related to environmental forcing, (ii) there is nocontinuous front separating infested and non-infested areas, and(iii) the rate of spread may show considerable variation (up to oneorder of magnitude).
The existing literature provides various explanations for each ofthese features. In particular, the patchy structure is usually relatedto the effect of human-assisted dispersal when the egg massesinadvertently transported to a new location ahead of the mainrange eventually develop into a new gypsy moth colony. However,here we argue that the importance of human-assisted dispersalmay be significantly over-estimated. The impact of the strong Alleeeffect, which is typical for the gypsy moth population dynamics,turns the successful establishment of new colonies into a rareevent as theory predicts (e.g. Lewis and Kareiva, 1993) that a new

Fig. 2. A sketch of the infection occurrence between the gypsy moth and nuclear polyhedrosis virus. Arrows indicate the transition between different stages of the infection
occurrence cycle. For more details see Section 2.1. Artwork sources are given in the acknowledgements section.
M. Jankovic, S. Petrovskii / Ecological Complexity 14 (2013) 132–144 135
colony can only survive if its initial population size is sufficientlylarge. Indeed, Liebhold and Bascompte (2003) studied thedevelopment of 194 new isolated colonies and found that noneof them survived. Of these, eradication treatments were applied toonly 32 colonies, whilst the rest died without intervention and 123of which within a year of detection.
We also mention here that the main infested range by itselfrarely shows homogeneous population distribution but, on thecontrary, often consists of separate patches (cf. Fig. 1). The goal ofthis paper is to demonstrate that features (i) and (ii) of the gypsymoth spread can, in fact, be explained by purely natural reasons,namely, by the interplay between (short-distance) wind-assisteddispersal, the Allee effect and the effect of pathogens such as NPV.Moreover, we are going to show that, surprisingly, even the rate ofspread predicted by natural reasons appears to be in goodagreement with observations.
With regard to the effect of pathogens, since recovery from NPVis extremely rare, the SI model seems to be an appropriateframework. Note that the classical SI model assumes that diseasetransmission occurs in direct contact between susceptible andinfected individuals. However, gypsy moths become infected withNPV through contact with occlusion bodies resulting from therupture of cadavers, rather than from direct contact with infectedindividuals. Therefore, for our purposes, the infected individualsare interpreted as infective particles, i.e. NPV occlusion bodies.Since the aim of our work is to improve the understanding ratherthan develop a predictive model, we neglect the second wave ofmortality and focus on larvae infection through consumption ofcontaminated foliage. Correspondingly, the infection cycle beginswith infected individuals and evolves to infection of susceptiblepopulation through consumption of occlusion bodies, henceenabling us to retain the form of the SI model over the wholeinfection cycle (see Fig. 2).
We treat the wind-assisted dispersal as diffusion. The spatiallyexplicit SI model then becomes a diffusion-reaction system. We
therefore hypothesize that the multi-annual spatiotemporaldynamics of gypsy moth can be described by a spatially explicitSI system consisting of two coupled diffusion-reaction PDEs:
@SðR; TÞ@T
¼ D1r2SðR; TÞ þ PðSÞ � EðS; IÞ; (1)
@IðR; TÞ@T
¼ D2r2IðR; TÞ þ EðS; IÞ � MI; (2)
where S(R, T) and I(R, T) are the densities of susceptible andinfected populations, R = (X, Y) is the position in space, T is time,and D1 and D2 are diffusion coefficients of susceptible and infectedpopulations, respectively. We neglect long-distance (human-assisted) dispersal and assume that short-distance (wind-assisted)dispersal can be mathematically regarded as diffusion anddescribed with usual diffusion terms. Since both susceptible andinfected larvae (including viral occlusion bodies) disperse with thewind, we consider D1 = D2 = D. The function E(S, I) describes diseasetransmission and parameter M accounts for the mortality rate ofinfected individuals. P(S) describes the local population growth;note that, since NPV is a terminal disease for gypsy moth, infectedindividuals do not contribute to the growth rate.
As evidence suggests (Liebhold and Bascompte, 2003; Sharovet al., 1995; Whitmire and Tobin, 2006), the gypsy mothpopulations dynamics is affected by a strong Allee effect, henceP(S) is chosen as follows:
PðSÞ ¼ 4h
ðK � S0Þ2
!SðS � S0ÞðK � SÞ; (3)
(cf. Lewis and Kareiva, 1993) where K is the carrying capacity of thesusceptible population, h is the maximum per capita growth rateand S0 is the so-called Allee threshold or threshold density. For0 < S0 < K the Allee effect is strong, for �K < S0 < 0 the Allee effectis weak, and in the case of S0 � � K the Allee effect is absent.
M. Jankovic, S. Petrovskii / Ecological Complexity 14 (2013) 132–144136
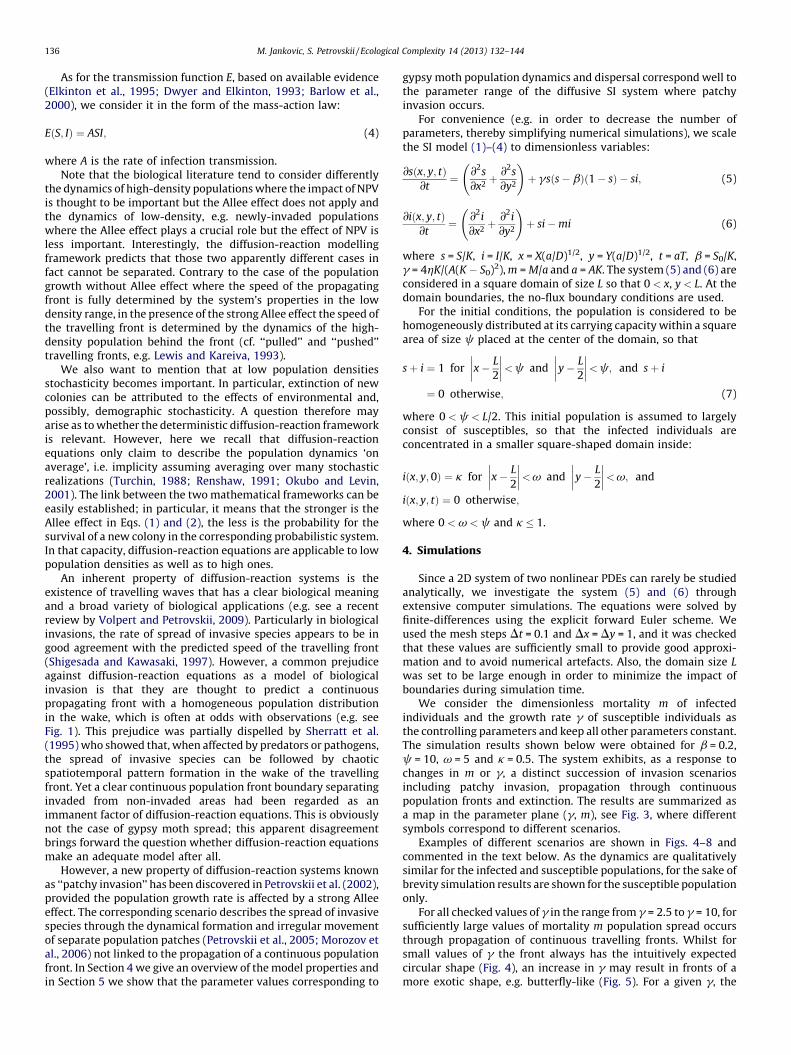
As for the transmission function E, based on available evidence(Elkinton et al., 1995; Dwyer and Elkinton, 1993; Barlow et al.,2000), we consider it in the form of the mass-action law:
EðS; IÞ ¼ ASI; (4)
where A is the rate of infection transmission.Note that the biological literature tend to consider differently
the dynamics of high-density populations where the impact of NPVis thought to be important but the Allee effect does not apply andthe dynamics of low-density, e.g. newly-invaded populationswhere the Allee effect plays a crucial role but the effect of NPV isless important. Interestingly, the diffusion-reaction modellingframework predicts that those two apparently different cases infact cannot be separated. Contrary to the case of the populationgrowth without Allee effect where the speed of the propagatingfront is fully determined by the system’s properties in the lowdensity range, in the presence of the strong Allee effect the speed ofthe travelling front is determined by the dynamics of the high-density population behind the front (cf. ‘‘pulled’’ and ‘‘pushed’’travelling fronts, e.g. Lewis and Kareiva, 1993).
We also want to mention that at low population densitiesstochasticity becomes important. In particular, extinction of newcolonies can be attributed to the effects of environmental and,possibly, demographic stochasticity. A question therefore mayarise as to whether the deterministic diffusion-reaction frameworkis relevant. However, here we recall that diffusion-reactionequations only claim to describe the population dynamics ‘onaverage’, i.e. implicity assuming averaging over many stochasticrealizations (Turchin, 1988; Renshaw, 1991; Okubo and Levin,2001). The link between the two mathematical frameworks can beeasily established; in particular, it means that the stronger is theAllee effect in Eqs. (1) and (2), the less is the probability for thesurvival of a new colony in the corresponding probabilistic system.In that capacity, diffusion-reaction equations are applicable to lowpopulation densities as well as to high ones.
An inherent property of diffusion-reaction systems is theexistence of travelling waves that has a clear biological meaningand a broad variety of biological applications (e.g. see a recentreview by Volpert and Petrovskii, 2009). Particularly in biologicalinvasions, the rate of spread of invasive species appears to be ingood agreement with the predicted speed of the travelling front(Shigesada and Kawasaki, 1997). However, a common prejudiceagainst diffusion-reaction equations as a model of biologicalinvasion is that they are thought to predict a continuouspropagating front with a homogeneous population distributionin the wake, which is often at odds with observations (e.g. seeFig. 1). This prejudice was partially dispelled by Sherratt et al.(1995) who showed that, when affected by predators or pathogens,the spread of invasive species can be followed by chaoticspatiotemporal pattern formation in the wake of the travellingfront. Yet a clear continuous population front boundary separatinginvaded from non-invaded areas had been regarded as animmanent factor of diffusion-reaction equations. This is obviouslynot the case of gypsy moth spread; this apparent disagreementbrings forward the question whether diffusion-reaction equationsmake an adequate model after all.
However, a new property of diffusion-reaction systems knownas ‘‘patchy invasion’’ has been discovered in Petrovskii et al. (2002),provided the population growth rate is affected by a strong Alleeeffect. The corresponding scenario describes the spread of invasivespecies through the dynamical formation and irregular movementof separate population patches (Petrovskii et al., 2005; Morozov etal., 2006) not linked to the propagation of a continuous populationfront. In Section 4 we give an overview of the model properties andin Section 5 we show that the parameter values corresponding to
gypsy moth population dynamics and dispersal correspond well tothe parameter range of the diffusive SI system where patchyinvasion occurs.
For convenience (e.g. in order to decrease the number ofparameters, thereby simplifying numerical simulations), we scalethe SI model (1)–(4) to dimensionless variables:
@sðx; y; tÞ@t
¼ @2s
@x2þ @2
s
@y2
!þ gs s � bð Þ 1 � sð Þ � si; (5)
@iðx; y; tÞ@t
¼ @2i
@x2þ @2
i
@y2
!þ si � mi (6)
where s = S/K, i = I/K, x = X(a/D)1/2, y = Y(a/D)1/2, t = aT, b = S0/K,g = 4hK/(A(K � S0)2), m = M/a and a = AK. The system (5) and (6) areconsidered in a square domain of size L so that 0 < x, y < L. At thedomain boundaries, the no-flux boundary conditions are used.
For the initial conditions, the population is considered to behomogeneously distributed at its carrying capacity within a squarearea of size c placed at the center of the domain, so that
s þ i ¼ 1 for x � L
2
��������< c and y � L
2
��������< c; and s þ i
¼ 0 otherwise; (7)
where 0 < c < L/2. This initial population is assumed to largelyconsist of susceptibles, so that the infected individuals areconcentrated in a smaller square-shaped domain inside:
iðx; y; 0Þ ¼ k for x � L
2
��������< v and y � L
2
��������< v; and
iðx; y; tÞ ¼ 0 otherwise;
where 0 < v < c and k � 1.
4. Simulations
Since a 2D system of two nonlinear PDEs can rarely be studiedanalytically, we investigate the system (5) and (6) throughextensive computer simulations. The equations were solved byfinite-differences using the explicit forward Euler scheme. Weused the mesh steps Dt = 0.1 and Dx = Dy = 1, and it was checkedthat these values are sufficiently small to provide good approxi-mation and to avoid numerical artefacts. Also, the domain size L
was set to be large enough in order to minimize the impact ofboundaries during simulation time.
We consider the dimensionless mortality m of infectedindividuals and the growth rate g of susceptible individuals asthe controlling parameters and keep all other parameters constant.The simulation results shown below were obtained for b = 0.2,c = 10, v = 5 and k = 0.5. The system exhibits, as a response tochanges in m or g, a distinct succession of invasion scenariosincluding patchy invasion, propagation through continuouspopulation fronts and extinction. The results are summarized asa map in the parameter plane (g, m), see Fig. 3, where differentsymbols correspond to different scenarios.
Examples of different scenarios are shown in Figs. 4–8 andcommented in the text below. As the dynamics are qualitativelysimilar for the infected and susceptible populations, for the sake ofbrevity simulation results are shown for the susceptible populationonly.
For all checked values of g in the range from g = 2.5 to g = 10, forsufficiently large values of mortality m population spread occursthrough propagation of continuous travelling fronts. Whilst forsmall values of g the front always has the intuitively expectedcircular shape (Fig. 4), an increase in g may result in fronts of amore exotic shape, e.g. butterfly-like (Fig. 5). For a given g, the

2 3 4 5 6 7 8 9 100.24
0.26
0.28
0.3
0.32
0.34
0.36
0.38
0.4
0.42
Growth rate of susceptible population, γ
Mo
rtal
ity
of
infe
cted
po
pu
lati
on
, m
patchy invasion continuous frontsextinctiontransitional
Extinction
Continuous fronts
Fig. 3. Map of different invasion scenarios as explained by the figure legend.
M. Jankovic, S. Petrovskii / Ecological Complexity 14 (2013) 132–144 137
shape eventually turns back to circular with an increase in m. If, onthe contrary, m decreases, the irregularity of the front shapeincreases sharply, promptly resulting in the front discontinuity andpatchy invasion; see Fig. 6. In this case, a continuous propagatingfront does not exist and invasion takes place through the formationand dynamics of separate patches. We mention here that theapparent symmetry of the spatial pattern shown in Fig. 6 is aconsequence of the symmetric initial conditions (7) and (8). Forasymmetric initial conditions (e.g. for non-concentric initialdomains) the emerging patchy structure would hardly bear anytrace of symmetry (Petrovskii et al., 2002, 2005; Morozov et al.,2006); see also Section 6.
Fig. 4. Snapshots of the susceptible population density taken at times t = 200 (left) and t
g = 3 and m = 0.57.
Fig. 5. Snapshots of susceptible population taken at times t = 200 (left) and t = 350 (righ
fronts of non-circular ‘butterfly-like’ shape.
The change from invasion through propagating continuousfront to patchy invasion does not happen abruptly, though. With adecrease in m, the system dynamics go through a transitionalscenario when the spread is predominantly patchy at an early stageof invasion, say for t � t*, but can turn into the continuous-frontspread at later time (for t > t*); see Fig. 7. The duration t* of thepatchy spread is not known in advance; simulations show that itdepends on parameter values and, for the parameter sets used inthis study, varies between 100 and 300 (in dimensionless units).
With an increase in g, patchy spread becomes even moredistinct as the individual patches tend, on average, to becomesmaller and separated with wider empty areas, cf. Figs. 6 and 8.Also the range of values of m where patchy invasion is observedgrows significantly for large g; see the right-hand side of thediagram in Fig. 3. For small values of g, the parameter range forpatchy invasion shrinks and is difficult to locate. For g = 2.5 wecould not find it at all, although being based on simulation resultsonly it is not possible to tell whether the parameter rangedisappears completely or just becomes very narrow.
Interestingly, for a given value of g patchy invasion canalternate with extinction, e.g. see the diagram of Fig. 3 for g = 3.5and g = 4.5.
By further decreasing mortality and surpassing the patchyregion, extinction occurs inevitably. Note that this succession ofinvasion scenarios following a decrease in mortality m is consistentwith biological arguments. Namely, the dimensionless mortality m
yields the ratio of dimensional mortality of infected individuals M
and the infection transmission rate A. An increase in thedimensionless mortality parameter m may therefore correspondto a disease with a lower transmission rate which puts less
= 400 (right). Propagation occurs through circular expanding fronts. Parameters are
t). Parameters are g = 9.5 and m = 0.31. Invasion occurs through the propagation of

Fig. 6. Patchy invasion: snapshots of susceptible population density taken at times t = 100, t = 400, t = 700, and t = 1000 (left to right, top to bottom). Parameters are g = 4.5 and
m = 0.375.
Fig. 7. Transitional dynamics. Snapshots of susceptible population density at times t = 100, t = 150, t = 400 and t = 600 (left to right, top to bottom). Snapshots reveal the
transitional dynamics when the patchy spread at an early stage of invasion (cf. the top row) turns into the continuous-front spread at later times (the bottom row). Parameters
are g = 5 and m = 0.378.
M. Jankovic, S. Petrovskii / Ecological Complexity 14 (2013) 132–144138
pressure on the species and allows the susceptible population tospread uninterrupted through expansion of population fronts.Lower values of mortality m would then correspond to a moresevere disease with a higher transmission rate, which puts a higherpressure on the species and hence may bring it to the brink ofextinction.
5. Parameter estimation and the rate of spread
In the previous section, we showed that the invasion patternpredicted by the spatial SI model is qualitatively similar to what isseen in field observations (e.g. compare Fig. 1 with Figs. 6 and 8), thatis, exhibiting patchy spread without any continuous population
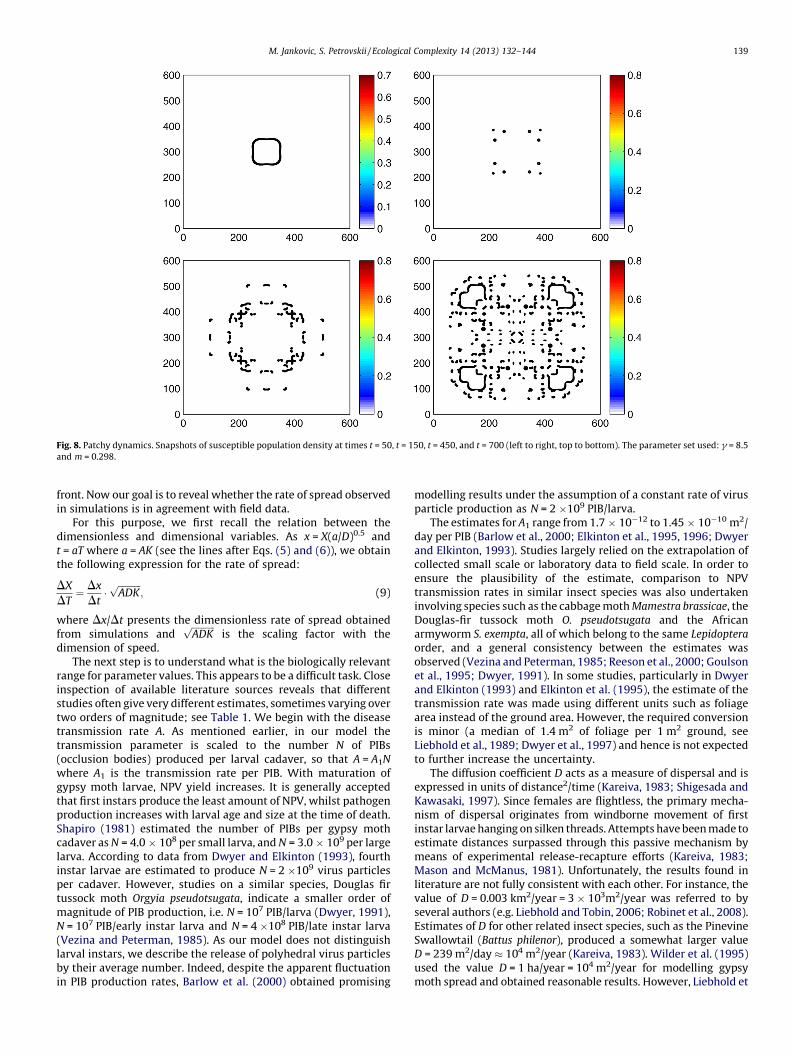
Fig. 8. Patchy dynamics. Snapshots of susceptible population density at times t = 50, t = 150, t = 450, and t = 700 (left to right, top to bottom). The parameter set used: g = 8.5
and m = 0.298.
M. Jankovic, S. Petrovskii / Ecological Complexity 14 (2013) 132–144 139
front. Now our goal is to reveal whether the rate of spread observedin simulations is in agreement with field data.
For this purpose, we first recall the relation between thedimensionless and dimensional variables. As x = X(a/D)0.5 andt = aT where a = AK (see the lines after Eqs. (5) and (6)), we obtainthe following expression for the rate of spread:
DX
DT¼ Dx
Dt�ffiffiffiffiffiffiffiffiffiffiADKp
; (9)
where Dx/Dt presents the dimensionless rate of spread obtainedfrom simulations and
ffiffiffiffiffiffiffiffiffiffiADKp
is the scaling factor with thedimension of speed.
The next step is to understand what is the biologically relevantrange for parameter values. This appears to be a difficult task. Closeinspection of available literature sources reveals that differentstudies often give very different estimates, sometimes varying overtwo orders of magnitude; see Table 1. We begin with the diseasetransmission rate A. As mentioned earlier, in our model thetransmission parameter is scaled to the number N of PIBs(occlusion bodies) produced per larval cadaver, so that A = A1N
where A1 is the transmission rate per PIB. With maturation ofgypsy moth larvae, NPV yield increases. It is generally acceptedthat first instars produce the least amount of NPV, whilst pathogenproduction increases with larval age and size at the time of death.Shapiro (1981) estimated the number of PIBs per gypsy mothcadaver as N = 4.0 � 108 per small larva, and N = 3.0 � 109 per largelarva. According to data from Dwyer and Elkinton (1993), fourthinstar larvae are estimated to produce N = 2 �109 virus particlesper cadaver. However, studies on a similar species, Douglas firtussock moth Orgyia pseudotsugata, indicate a smaller order ofmagnitude of PIB production, i.e. N = 107 PIB/larva (Dwyer, 1991),N = 107 PIB/early instar larva and N = 4 �108 PIB/late instar larva(Vezina and Peterman, 1985). As our model does not distinguishlarval instars, we describe the release of polyhedral virus particlesby their average number. Indeed, despite the apparent fluctuationin PIB production rates, Barlow et al. (2000) obtained promising
modelling results under the assumption of a constant rate of virusparticle production as N = 2 �109 PIB/larva.
The estimates for A1 range from 1.7 � 10�12 to 1.45 � 10�10 m2/day per PIB (Barlow et al., 2000; Elkinton et al., 1995, 1996; Dwyerand Elkinton, 1993). Studies largely relied on the extrapolation ofcollected small scale or laboratory data to field scale. In order toensure the plausibility of the estimate, comparison to NPVtransmission rates in similar insect species was also undertakeninvolving species such as the cabbage moth Mamestra brassicae, theDouglas-fir tussock moth O. pseudotsugata and the Africanarmyworm S. exempta, all of which belong to the same Lepidoptera
order, and a general consistency between the estimates wasobserved (Vezina and Peterman, 1985; Reeson et al., 2000; Goulsonet al., 1995; Dwyer, 1991). In some studies, particularly in Dwyerand Elkinton (1993) and Elkinton et al. (1995), the estimate of thetransmission rate was made using different units such as foliagearea instead of the ground area. However, the required conversionis minor (a median of 1.4 m2 of foliage per 1 m2 ground, seeLiebhold et al., 1989; Dwyer et al., 1997) and hence is not expectedto further increase the uncertainty.
The diffusion coefficient D acts as a measure of dispersal and isexpressed in units of distance2/time (Kareiva, 1983; Shigesada andKawasaki, 1997). Since females are flightless, the primary mecha-nism of dispersal originates from windborne movement of firstinstar larvae hanging on silken threads. Attempts have been made toestimate distances surpassed through this passive mechanism bymeans of experimental release-recapture efforts (Kareiva, 1983;Mason and McManus, 1981). Unfortunately, the results found inliterature are not fully consistent with each other. For instance, thevalue of D = 0.003 km2/year = 3 � 103m2/year was referred to byseveral authors (e.g. Liebhold and Tobin, 2006; Robinet et al., 2008).Estimates of D for other related insect species, such as the PinevineSwallowtail (Battus philenor), produced a somewhat larger valueD = 239 m2/day � 104 m2/year (Kareiva, 1983). Wilder et al. (1995)used the value D = 1 ha/year = 104 m2/year for modelling gypsymoth spread and obtained reasonable results. However, Liebhold et

Table 1Summary of parameter estimates. Estimates for the transmission coefficient are given in m2/PIB day units.
Parameter Species Parameter Estimate Reference
Transmission coefficient, A1 Lymantria dispar 1.7 � 10�12 Barlow et al. (2000)
Orgyia pseudotsugata 0.01–6.82 � 10�9 Dwyer (1991)
Lymantria dispar 2.12–13.1 � 10�12 D’Amico et al. (1996)
Lymantria dispar 1.45 � 10�12 Dwyer and Elkinton (1993)
Lymantria dispar 1.45 � 10�10 Elkinton et al. (1995)
Orgyia pseudotsugata 1 � 10�9 Vezina and Peterman (1985)
Spodoptera exempta 3.38–6.65 � 10�12 Reeson et al. (2000)
Mamestra brassicae 2.16 � 10�12 Goulson et al. (1995)
Diffusion coefficient, D Lymantria dispar 0.003 km2/generation Liebhold and Tobin (2006),
Robinet et al. (2008)
Battus philenor 239 m2/day Kareiva (1983)
Lymantria dispar 0.1 ha/year Wilder et al. (1995)
Orgyia pseudotsugata 0.0274 m2/day Dwyer (1992)
Lymantria dispar 332 m/generation Liebhold et al. (1992)
Disease decay rate, M NPV 0.003 day�1 Barlow et al. (2000) and
Dwyer and Elkinton (1993)
NPV 0.002 day�1 Dwyer (1992)
NPV 4.8 year�1 Vezina and Peterman (1985)
Carrying capacity, K Lymantria dispar 283 moth/trap Tobin et al. (2007a,b)
Lymantria dispar 673 moth/trap Tobin et al. (2007a,b)
Lymantria dispar 687 moth/trap Johnson et al. (2006)
Lymantria dispar 200,000 egg masses/km2 Sharov and Liebhold (1998)
Lymantria dispar 500 larva/m2 Dwyer and Elkinton (1993)
Allee threshold, S0 Lymantria dispar 2.2 moth/trap Tobin et al. (2007b)
Lymantria dispar 20.7 moth/trap Tobin et al. (2007b)
Lymantria dispar 17 moth/trap Johnson et al. (2006)
Lymantria dispar 106.7 male moth/colony Liebhold and Bascompte (2003)
Number of virus particles
produced per cadaver, N
Lymantria dispar 2 � 109 Barlow et al. (2000)
Orgyia pseudotsugata 107 Dwyer (1991)
Lymantria dispar 2 � 109 Dwyer and Elkinton (1993)
Lymantria dispar 4 � 108 Elkinton et al. (1995)
Orgyia pseudotsugata 1 � 107–4 � 108 Vezina and Peterman (1985)
M. Jankovic, S. Petrovskii / Ecological Complexity 14 (2013) 132–144140
al. (1992) estimated the diffusion coefficient of gypsy moth to beD = 332 m/generation, thus sparking an inconsistency in terms ofthe units.
With regard to the carrying capacity K and the Allee thresholdS0, they both have the meaning of density and hence shouldnormally be measured in density units such as number of insectsper unit area. In practice, the most extensive information on gypsymoth abundance is obtained and monitored by using pheromonebaited traps. However, interpretation of trap counts in terms of thepopulation density is a challenging and largely open issue (seePetrovskii et al. (2012) for a discussion of the problem). For thisreason, in the literature estimates of the gypsy moth carryingcapacity and the Allee threshold density are often given in trapcounts, i.e. in moths per trap.
Estimates of K and S0 can be found in Johnson et al. (2006) andTobin et al. (2007b). Data were collected from spatially referencedpheromone trap catches and used to generate a continuousinterpolated surface of gypsy male moth abundance. Grids of5 � 5 km cells encompassed states of Ohio, Illinois, Indiana,Virginia, West Virginia, North Carolina and Wisconsin. Theestimated number of male moth counts per trap was extractedfrom the centre of the grid, for each year during the full period ofthe study (1996–2004).
The Allee threshold was defined as the lowest abundance atwhich a local population is likely to replace itself in the followingyear, below the threshold the population is more likely to decreaseand above the threshold it is more likely to increase (Tobin et al.,2007b; Johnson et al., 2006). To deduce the Allee effect, pairs ofcounts per trap were compared in subsequent years. The carryingcapacity was defined as the highest abundance at which thereplacement probability decreases below 0.5 (Tobin et al., 2007b).
Data for Ohio, Indiana and Illinois were inconclusive, due to lowreplacement rates, ergo no estimates were obtained. Allee thresholdand carrying capacity in Wisconsin were estimated at 2.2 moths/trap and 283 moths/trap, respectively (Tobin et al., 2007b). A muchhigher value of the Allee threshold of 20.7 moths/trap wasestablished in West Virginia, Virginia and North Carolina, with acarrying capacity of 673 moths/trap (Tobin et al., 2007b). Johnson etal. (2006) provided overall estimates as 17 moths/trap for the Alleethreshold and 687 moths/trap for the carrying capacity.
In a similar study, having analyzed pheromone trapping datafrom a large-scale field study in Washington, Liebhold andBascompte (2003) estimated the Allee threshold as 106.7 moths/colony, which is much higher than the estimate by Johnson et al.(2006).
In an earlier study (done on a much smaller spatial scale),Dwyer and Elkinton (1993) estimated the carrying capacity as500 larvae/m2. We mention here that this value is difficult tocompare with the estimates mentioned above as it refers to adifferent life-stage. It seems to indicate a different order ofmagnitude for the carrying capacity. Indeed, the pheromone trapcatchment area for the flying insects is known to be tens of squaremeters (Yamanaka et al., 2003; Hicks and Blackshaw, 2008);therefore, the value of the carrying capacity at 687 moths/trapobtained by Johnson et al. (2006) gives a rough estimate of thepopulation density as, at most, 20–30 moths/m2. However, thelatter is obviously inconsistent with the estimate of the Alleethreshold made by Liebhold and Bascompte (2003) or otherwiseassumes a very low survival rate for larvae before they becomemoths.
Having the information about A, D and K at hands, we can nowcalculate the scaling factor in Eq. (9). Since all three parameters

M. Jankovic, S. Petrovskii / Ecological Complexity 14 (2013) 132–144 141
vary over a wide range, apparently, numerous combinations ofparameter sets may be used. Therefore, here we only endeavour togive an illustrative example of possible range bounds. We chooseD = 3 �103 m2/year according to Liebhold and Tobin (2006). Sincedisease transmission usually occurs during the larval stage, we useK = 500 larvae/m2 according to Dwyer and Elkinton (1993). For theaverage number of PIBs released by a larval cadaver, we accept thevalue N = 2 �109 as in Barlow et al. (2000). Also, in our estimationwe use a maximum length of the larval period as 10 weeks = 70days (Dwyer et al., 2000). Correspondingly, for the lower and upperestimates of the transmission rate A1, we obtain the followingvalues of the scaling factor:
ðffiffiffiffiffiffiffiffiffiffiADKp
Þmin ¼ ½70 � 1:7 � 10�12 m2=ðPIB � yearÞ � 2 � 109 PIB=larva
�500 larva=m2 � 3 � 103 m2=year �1=2 � 600 m=year¼ 0:6 km=year;
(10)
ðffiffiffiffiffiffiffiffiffiffiADKp
Þmax ¼ ½70 � 1:45 � 10�10 m2=ðPIB � yearÞ � 2 � 109 PIB=larva
�500 larva=m2 � 3 � 103 m2=year�1=2 � 5500m=year¼ 5:5 km=year:
(11)
The next step is to estimate the parameters that determine thesimulation results, i.e. b, g and m. Based on the available range ofestimates for the carrying capacity K and Allee threshold S0, weaccept the value b = S0/K = 0.2.
Gypsy moth populations, as many insect species, may undergofluctuations of several orders of magnitude. The estimation of percapita growth rate therefore involves considerable uncertainty. It isalso often based on specific assumptions. Most gypsy moth studiesassume exponential growth, the exponent being found to varybetween 1.65 and 4.6, which results in the range of actualreplacement rates h (see Eq. (3)) as 5–100-fold increase inpopulation density between two subsequent generations (Liebholdand Tobin, 2006; Liebhold et al., 1992; Sharov et al., 1995; SharovandLiebhold,1998).Recallthatg = 4hK[A(K � S0)2]�1 � 6.25h(AK)�1
)�1 where the scaling factor AK varies over two orders of magnitude,i.e. from 120 to 104; see Eqs. (10) and (11). Correspondingly,parameter g can have any value from approximately 5 and down to0.003. We however note that, according to our model, for any givenvalue of mortality a decrease in g almost certainly results inpopulation extinction; see Fig. 3. It may indicate that small values ofg are in fact not feasible.1 We therefore reduce our attention to thevalues of g on the order of one or larger.
Due to our interpretation of the SI model, it appears moreappropriate to interpret the ‘mortality rate’ M as the rate of decayof PIBs (occlusion bodies), i.e. the virus particles. This issue wasaddressed in a few studies and a consistent estimate of 0.003 day�1
was obtained (Dwyer and Elkinton, 1993; Barlow et al., 2000;Elkinton et al., 1995). This value is in agreement with studies on asimilar species, Douglas fir tussock moth (Dwyer, 1992). It isreadily seen that this estimate corresponds to the dimensionlessdecay rate as, at most, m = M(AK)�1 � 0.01. However, here weargue that this estimate should more likely be regarded as a lowerbound of the decay rate rather than its actual value. The matter isthat the above estimate only takes into account the effect on thevirus particles produced by weather conditions (such as high/lowtemperature and sunlight) but not the ‘geometry’ of the diseasetransmission. Whilst the virus particles may still remain activeinoculums for infection, they may be carried away by the wind orwashed-out by the rain to the places where they could not beaccessed by larvae, thus making any contact between occlusionbodies and susceptible larvae impossible. The decay rate of the
1 Or that for small g our model is inappropriate.
virus particles as used in our SI model should take the wash-outrates into account. Unfortunately, we are not aware about anystudy concerned with estimating the wash-out rates. Therefore,here we use it essentially as a tuning parameter which determinesthe type of spread; see Fig. 3. In particular, we choose the value(s)of m that corresponds to patchy spread.
In order to estimate the rate of spread, we now choose twodifferent parameter sets, i.e. (a) g = 4.5 and m = 0.3755 and (b)g = 8.5 and m = 0.98. In case (a), the dimensionless spread rate Dx/Dt � 0.3 and in case (b) Dx/Dt � 0.6. For different values of thescaling factor, see Eqs. (10) and (11)), we therefore obtain:
DX
DT
� �ðaÞmin
¼ 0:18 km=year;DX
DT
� �ðaÞmax
¼ 1:65 km=year; (12)
DX
DT
� �ðbÞmin
¼ 0:36 km=year;DX
DT
� �ðbÞmax
¼ 3:3 km=year: (13)
The range of Gypsy moth spread rates observed in nature isknown to vary from about 2.5 to almost 29 km/year (Liebhold et al.,1992; Tobin et al., 2007a). It is readily seen that our theoreticalestimate has an overlap with this empirical range. The impact ofpathogens and wind dispersal, that are essential components ofour model, are thus capable of explaining the lower values of theobserved rates of gypsy moth spread, which we regard as a successof our approach.
6. Concluding remarks
In this paper, we tried to identify the factors that control thespatial pattern and the rate of spread of the gypsy mothpopulation in North America. By now, a common tendency hasbeen to relate the peculiarities of gypsy moth invasion to human-assisted dispersal (Elkinton and Liebhold, 1990; Tobin andBlackburn, 2008). However, we argue that this point of viewdisagrees to some extent with the proved existence of the strongAllee effect in gypsy moth populations (Vercken et al., 2011),which is known to usually wipe out small new colonies (Liebholdand Bascompte, 2003). Correspondingly, here our goal is to checkwhether natural factors such as wind dispersal and impact ofpathogens might be sufficient to explain, at least partially, thefeatures of the gypsy moth spread.
Our approach is based on mathematical modelling andcomputer simulations. The population dynamics of gypsy mothis known to be strongly affected by nuclear polyhedrosis virus(NPV). Correspondingly, we have used a spatially explicit SI modelof reaction-diffusion type where dispersal is thus described by thestandard diffusion term. We then performed extensive computersimulations and found that, within a certain parameter range, themodel exhibits a pattern of spread surprisingly similar to what isseen in field observations, i.e. a distinct patchy spatial structure.Note that the patchy pattern obtained in simulations is completelyself-organized, it is not related to any pre-defined heterogeneityand it does not require any asymmetry in the initial conditions. Wehave checked it in simulations (see Fig. 9) that use of asymmetricinitial conditions does not affect the patchy spread as such butbreaks the symmetry of the emerging patchy structure, hencemaking it look ‘more realistic.’
In order to choose biologically relevant parameter values, wemade an extensive literature search. The search revealed aconsiderable uncertainty (and sometimes even inconsistency) inparameter estimation made in different studies; see Table 1. Wethen showed that the parameter values that we used in numericalsimulations were generally in agreement with the estimatedparameter range. Based on the parameter values taken from theliterature, we showed that the rates of gypsy moth spread

Fig. 9. Patchy invasion simulated with slightly asymmetric initial conditions. Snapshots of susceptible population density at times t = 100, t = 400, t = 700 and t = 1000 (left to
right, top to bottom). The parameter set used: g = 6 and m = 0.348.
M. Jankovic, S. Petrovskii / Ecological Complexity 14 (2013) 132–144142
predicted by our model are in very good agreement with the lowerrange of the rates of spread observed in field data.
An interesting theoretical question is what is the temporaldynamics of the population density corresponding to differentinvasion scenarios. Note that pattern formation as such is notsufficient to draw any conclusions about this as irregular patternssometimes correspond to periodical temporal dynamics but some
0 500 1000
0.05
0.1
Time
Pop
ulat
ion
dens
ity
2000 2500 3000
0.05
0.1
0.15
Time
Pop
ulat
ion
dens
ity
(a) (
(c) (
Fig. 10. Spatial average of the population density vs time obtained in numerical simulatio
the same as in Fig. 6 and for two different intervals, (a) for 0 < t < 1000, (b) for 2000 < t <
Fig. 8.
simple regular patterns may exhibit multi-periodicity and chaos(cf. Morozov et al., 2004). Fig. 10 shows the population density ofsusceptibles averaged over the spatial domain as obtained in thecourse of the system’s dynamics. Apparently, the populationvariation over time exhibits distinct irregularity. Although adetailed consideration of this issue should include calculation ofthe dominant Lyapunov exponent, which is obviously beyond the
2000 2500 3000
0.05
0.1
Time
Pop
ulat
ion
dens
ity
2000 2500 3000
0.05
0.1
Time
Pop
ulat
ion
dens
ity
b)
d)
ns for different invasion scenarios: (a) and (b) for the patchy spread for parameters
3000; (c) for the transitional regime shown in Fig. 7, (d) for the patchy spread as in

M. Jankovic, S. Petrovskii / Ecological Complexity 14 (2013) 132–144 143
scope of this paper, the apparent irregularity in the timedependence indicates that the corresponding temporal dynamicsis chaotic.
We want to emphasize that, in this study, it was not our goal todevelop a comprehensive model of the gypsy moth invasion.Rather, we aimed to demonstrate that the human-assisteddispersal is not necessarily a primary mechanism of the gypsymoth spread. In particular, there is clearly an alternativeexplanation of the typical patchy structure in the gypsy mothspatial distribution (cf. Fig. 1); indeed, it can appear as a result ofthe interplay between wind dispersal, the Allee effect and theimpact of NPV, see Figs. 6 and 8.
A more general model of gypsy moth spread should includeboth modes of dispersal along with other specifics, such as weatherconditions and the effect of elevation, which would make themodel parameters space-dependent. Interaction between theshort-range (wind-assisted) dispersal and the long-range (hu-man-assisted) dispersal then may be capable of explaining theobserved variability in the rate of spread (Tobin et al., 2007a,b;Tobin and Blackburn, 2008). Parametrization of such a model ishowever going to be a difficult problem as there is currently notenough information available about relevant human movement.Distinguishing between different dispersal modes and/or betweendifferent types of movement is a challenging issue and may havehidden pitfalls, especially if statistical analysis of the movementdata is involved (e.g. see Jansen et al., 2012). Nevertheless,development of a more realistic ‘composite’ model is likely tobecome a direction of future research.
Acknowledgements
Comments of Sandy Liebhold (USDA) on an earlier version of thispaper are appreciated. The authors gratefully acknowledge thesourceoftheartworkused,withpermissions, in Fig.2: (a) fromhttp://www.fs.fed.us/ne/morgantown/4557/gmoth/, (b) from http://www.insectimages.org/, (c) from McManus, M.E., Schneeberger, N.,Reardon, R., Mason, G., 1989. Gypsy moth. USDA Forest Service ForestInsect and Disease Leaflet 162, and (d) from http://www.britannica.com/EBchecked/media/96502/Polyhedral-shaped-inclusion-bodies-formed-in-a-host-cell-by.
References
Barlow, N.D., Caldwell, N.P., Kean, J.M., Barron, M.C., 2000. Modelling the use of NPVfor the biological control of Asian gypsy moth Lymantria dispar invading NewZealand. Agricultural and Forest Entomology 2 (3), 173–184.
Courchamp, F., Clutton-Brock, T., Grenfell, B., 1999. Inverse density dependence andthe Allee effect. TREE 14 (10), 405–410.
D’Amico, V., Elkinton, J.S., Dwyer, G., Burand, J.P., Buonaccorsi, J.P., 1996. Virustransmission in gypsy moths is not a simple action mass process. Ecology 77 (1),201–206.
Dennis, B., 1989. Allee effects: population growth, critical density, and the chance ofextinction. Natural Resourses Modeling 3, 481–538.
Dwyer, G., 1991. The role of density, stage and patchiness in the transmission of aninsect virus. Ecology 72 (2), 559–574.
Dwyer, G., 1992. On the spatial spread of insect pathogens: theory and experiment.Ecology 73 (2), 479–494.
Dwyer, G., Elkinton, J.S., 1993. Using simple models to predict virus epizootics ingypsy moth populations. Journal of Animal Ecology 62 (1), 1–11.
Dwyer, G., Elkinton, J.S., Buonaccorsi, J.P., 1997. Host heterogeneity in susceptibilityand disease dynamics: tests of a mathematical model. The American Naturalist150 (6), 685–707.
Dwyer, G., Dushoff, J., Elkinton, J.S., Levin, S.A., 2000. Pathogen-driven outbreaks inforest defoliators revisited: building models from experimental data. TheAmerican Naturalist 156 (2), 105–120.
Elkinton, J.S., Liebhold, A.M., 1990. Population dynamics of gypsy moth in NorthAmerica. Annual Review of Entomology 35, 571–596.
Elkinton, J.S., Burand, J.P., Murray, K.D., Woods, S.A., 1990. Epizootiology of GypsyMoth Nuclear Polyhedrosis Virus. USDA Gypsy Moth Research Review,Washington, DC.
Elkinton, J.S., Dwyer, G., Sharov, A., 1995. Modelling the epizootiology of gypsy mothnuclear polyhedrosis virus. Computers and Electronics in Agriculture 13, 91–102.
Elkinton, J.S., Healy, W.M., Buonaccorsi, J.P., Boettner, G.H., Hazzard, A.M., Smith,H.R., Liebhold, A.M., 1996. Interactions among gypsy moths, white-footed mice,and acorns. Ecology 77 (8), 2332–2342.
Gerardi, M.H., Grimm, J.K., 1979. The history, biology, damage and control of thegypsy moth Porthetria dispar (L.) Fairleigh Dickinson University Press, Ruther-ford, NJ.
Goulson, D., Hails, R.S., Williams, T., Hirst, M.L., Vasconcelos, D., Green, B.M., Carty,T.M., Cory, J.S., 1995. Transmission dynamics of a virus in a stage-structuredinsect population. Ecology 76 (2), 392–401.
Hengeveld, R., 1989. Dynamics of Biological Invasion. Chapman and Hall, London.Hicks, H., Blackshaw, R.P., 2008. Differential responses of three Agriotes click beetle
species to pheromone traps. Agricultural and Forest Entomology 10, 443–448.Jansen, V.A.A., Mashanova, A., Petrovskii, S.V., 2012. Model selection and animal
movement: comment on ‘‘Levy walks evolve through interaction betweenmovement and environmental complexity’’. Science 335, 918.
Johnson, D.M., Liebhold, A.M., Tobin, P.C., Bjørnstad, O.N., 2006. Allee effects andpulsed invasion by the gypsy moth. Nature 444, 361–363.
Jones, C.G., Ostfeld, R.S., Richard, M.P., Schauber, E.M., Wolff, J.O., 1998. Chainreactions linking acorns to gypsy moth outbreaks and lyme disease risk. Science279, 1023–1026.
Kareiva, P.M., 1983. Local movement in herbivorous insects: applying a passivediffusion model to mark-recapture field experiments. Oecologia 57 (3), 322–327.
Lautenschlager, R.A., Podgwaite, J.D., Watson, D.E., 1980. Natural occurrence of thenucleopolyhedrosis virus of the gypsy moth, Lymantria dispar (Lep: Lymantrii-dae) in wild birds and mammals. Entomophaga 25 (3), 261–267.
Lewis, M.A., Kareiva, P., 1993. Allee dynamics and the spread of invading organisms.Theoretical Population Biology 43, 141–158.
Liebhold, A.M., Bascompte, J., 2003. The Allee effect, stochastic dynamics and theeradication of alien species. Ecology Letters 6, 133–140.
Liebhold, A.M., Tobin, P.C., 2006. Growth of newly established alien populations:comparison of North American gypsy moth colonies with invasion theory.Population Ecology 48, 253–262.
Liebhold, A.M., Tobin, P.C., 2010. Exploiting the Achilles heels of pest invasions:Allee effects, stratified dispersal and management of forest insect establish-ment and spread. New Zealand Journal of Forestry 40, 25–33.
Liebhold, A.M., Halverson, J.A., Elmes, G.A., 1992. Gypsy moth invasion in NorthAmerica: a quantitive analysis. Journal of Biogeography 19 (5), 513–520.
Liebhold, A.M., Elmes, G.A., Hawerson, J.A., Quimby, J., 1994. Landscape characteri-zation of forest susceptibility to gypsy moth defoliation. Forest Science 40, 18–29.
Liebhold, A.M., Elkinton, J.S., Miller, D.R., Wang, Y.S., 1989. Estimating oak leafarea index and gypsy moth Lymantria dispar (L.) (Lepidoptera: Lymantriidae),defoliation using canopy photographs. Environmental Entomology 17, 560–566.
Maloney, K., Baressi, J., Schneeberger, N.F., 2010. Reducing Damage and Slowing theSpread. National Gypsy Moth Management Program. USDA Forest Service SpecialInitiative Brief. Available at http://www.na.fs.fed.us/ra/specialinitiatives/gm/gysp_moth_featured_brief11.pdf.
Mason, C.J., McManus, M.L., 1981. Larval dispersal of the gypsy moth. In: Doane, C.C.,McManus, M.L. (Eds.), The Gypsy Moth: Research Toward Integrated PestManagement. USDA Forest Service Technical Bulletin 1584, pp. 161–202.
Mistro, D.C., Rodrigues, L.A.D., Petrovskii, S.V., 2012. Spatiotemporal complexity ofbiological invasion in a space- and time-discrete predator–prey system with thestrong Allee effect. Ecological Complexity 9, 16–32.
Morozov, A., Petrovskii, S., Li, B.L., 2004. Bifurcations and chaos in a predator–preysystem with the Allee effect. Proceedings of Royal Society of London 271, 1407–1414.
Morozov, A., Petrovskii, S., Li, B.L., 2006. Spatiotemporal complexity of patchyinvasion in a predator–prey system with the Allee effect. Journal of TheoreticalBiology 238, 18–35.
Naidoo, R., Lechowicz, M.J., 2001. Effects of gypsy moth on radial growth ofdeciduous trees. Forest Science 47 (3), 338–348.
Okubo, A., Levin, S., 2001. Diffusion and Ecological Problems: Modern Perspectives.Springer, Berlin.
Parker, I.M., 2004. Mating patterns and rates of biological invasion. Proceedings ofthe National Academy of Sciences of the United States of America 101, 13695–13696.
Parker, I.M., Simberloff, D., Lonsdale, W.M., Goodell, K., Wonham, M., Kareiva, P.M.,Williamson, W.H., Von Holle, B., Moyle, P.B., Byers, J.E., Goldwasser, L., 1999.Impact: toward a framework for understanding the ecological effects of inva-ders. Biological Invasions 1, 3–19.
Petrovskii, S.V., Morozov, A.Y., Venturino, E., 2002. Allee effect makes possiblepatchy invasion in a predator–prey system. Ecology Letters 5, 345–352.
Petrovskii, S.V., Malchow, H., Hilker, F.M., Venturino, E., 2005. Patterns of patchyspread in deterministic and stochastic models of biological invasion andbiological control. Biological Invasions 7, 771–793.
Petrovskii, S.V., Bearup, D., Ahmed, D.A., Blackshaw, R., 2012. Estimating insectpopulation density from trap counts. Ecological Complexity 10, 69–82.
Pimentel, D., 2002. Biological Invasions: Economic and Environmental Costs of AlienPlant, Animal and Microbe Species. CRC Press, New York.
Reardon, R.C., Podgwaite, J.D., Zerillo, R., 2009. Gypchek – Bioinsecticide for theGypsy Moth. The Forest Health Technology Enterprise Team Handbook.
Reeson, A.F., Wilson, K., Cory, J.S., Hankard, P., Weeks, J.M., Goulson, D., Hails, R.S.,2000. Effects of phenotypic plasticity on pathogen transmission in the field in aLepidoptera-NPV system. Oecologia 124, 373–380.

M. Jankovic, S. Petrovskii / Ecological Complexity 14 (2013) 132–144144
Renshaw, E., 1991. Modelling Biological Populations in Space and Time. CambridgeUniversity Press, Cambridge, UK.
Robinet, C., Lance, D.R., Thorpe, K.W., Onufrieva, K.S., Tobin, P.C., Liebhold, A.M.,2008. Dispersion in time and space affect mating success and Allee effects ininvading gypsy moth populations. Journal of Animal Ecology 77, 966–973.
Sakai, A.K., Allendorf, F.W., Holt, J.S., Lodge, D.M., Molofsky, J., With, K.A., Baughman,S., Cabin, R.J., Cohen, J.E., Ellstrand, N.C., McCauley, D.E., O’Neil, P., Parker, I.M.,Thompson, J.N., Weller, S.G., 2001. The population biology of invasive species.Annual Review Of Ecology And Systematics 32, 305–332.
Shapiro, M., 1981. In vivo production at Otis Air base, Massachusetts. In: Doane,C.C., Mc Manus, M.L. (Eds.), The Gypsy Moth: Research Toward IntegratedPest Management. United States Department of Agriculture, Washington, DC,pp. 464–467.
Sharov, A.A., Liebhold, A.M., 1998. Model of slowing the spread of gypsy moth(Lepidoptera: Lymantriidae) with a barrier zone. Ecological Applications 8 (4),1170–1179.
Sharov, A.A., Liebhold, A.M., Ravlin, F.W., 1995. Prediction of gypsy-moth (Lepidop-tera, Lymantriidae) mating success from pheromone trap counts. EnvironmentalEntomology 24 (5), 1239–1244.
Sharov, A.A., Liebhold, A.M., Roberts, E.A., 1997. Correlation of counts of gypsymoths (Lepidoptera: Lymantriidae) in pheromone traps with landscape char-acteristics. Forest Science 43 (3), 483–490.
Sharov, A.A., Leonard, D., Liebhold, A.M., Roberts, E.A., Dickerson, W., 2002. Slow thespread: a national program to contain the gypsy moth. Journal of Forestry 100(5), 30–36 (7).
Sherratt, J.A., Eagan, B.T., Lewis, M.A., 1997. Oscillations and chaos behind predator–prey invasion: mathematical artefact or ecological reality? PhilosophicalTransactions of the Royal Society B 352, 21–38.
Sherratt, J.A., Lewis, M.A., Fowler, A.C., 1995. Ecological chaos in the wake ofinvasion. Proceedings of the National Academy of Science of the United Statesof America 92, 2524–2528.
Shigesada, N., Kawasaki, K., 1997. Biological Invasions: Theory and Practice. OxfordUniversity Press, Oxford.
Tobin, P.C., Blackburn, L.M., 2008. Long-distance dispersal of the gypsy moth(Lepidoptera: Lymantriidae) facilitated its initial invasion of Wisconsin. Envi-ronmental Entomology 37 (1), 87–93.
Tobin, P.C., Liebhold, A.M., 2011. Gypsy moth. In: Simberloff, D., Rejmanek, M.(Eds.), Encyclopedia of Biological Invasions. University of California Press,Berkeley, pp. 298–304.
Tobin, P.C., Liebhold, A.M., Roberts, E.A., 2007a. Comparison of methods for esti-mating the spread of a non-indigenous species. Journal of Biogeography 34,305–312.
Tobin, P.C., Whitmire, S.L., Johnson, D.M., Bjørnstad, O.N., Liebhold, A.M., 2007b.Invasion speed is affected by geographical variation in the strength of Alleeeffects. Ecology Letters 10, 36–43.
Tobin, P.C., Robinet, C., Johnson, D.M., Whitmire, S.L., Bjørnstad, O.N., Liebhold, A.M.,2009. The role of Allee effects in gypsy moth (Lymantria dispar (L.)) invasions.Population Ecology 51, 373–384.
Turchin, P., 1988. Quantitative Analysis of Movement: Measuring and ModelingPopulation Redistribution in Animals and Plants. Sinauer, Sunderland, MA.
U.S. Congress, Office of Technology Assessment, 1993. Harmful Non-IndigenousSpecies in the United States. OTA-F-565. U.S. Government Printing Office,Washington, DC.
Vercken, E., Kramer, A.M., Tobin, P.C., Drake, J.M., 2011. Critical patch sizegenerated by Allee effect in gypsy moth Lymantria dispar (L.). Ecology Letters14, 179–186.
Vezina, A., Peterman, R.M., 1985. Tests of the role of a nuclear polyhedrosis virus inthe population dynamics of its host, douglas-fir tussock moth, Orgyia pseudot-sata (Lepidoptera: Lymantriidae). Oecologia 67, 260–266.
Vitousek, P.M., D’Antonio, C.M., Loope, L.L., Westbrooks, R., 1996. Biological inva-sions as global environmental change. American Scientist 84, 468–478.
Volpert, V., Petrovskii, S.V., 2009. Reaction-diffusion waves in biology. Physics ofLife Reviews 6, 267–310.
Webb, J.R., Cosby, B.J., Deviney, F.A., Eshleman, K.N., Galloway, J.N., 1995. Changein the acid–base status of an Appalachian mountain catchment followingforest defoliation by the gypsy moth. Water, Air, and Soil Pollution 85, 535–540.
Whitmire, S.L., Tobin, P.C., 2006. Persistence of invading gypsy moth populations inthe United States. Oecologia 147, 230–237.
Wilder, J.W., Christie, I., Colbert, J.J., 1995. Modelling of two-dimensional spatialeffects on the spread on forest pests and their management. Ecological Model-ling 82 (3), 287–298.
Williamson, M.H., 1996. Biological Invasions. Chapman & Hall.Witter, J.A., Stoyenoff, J.L., Sapio, F., 1992. Impacts of the gypsy moth in Michigan.
Michigan Academician 25, 67–90.Yamanaka, T., Tatsuki, S., Shimada, M., 2003. An individual-based model for sex-
pheromone-oriented flight patterns of male moths in a local area. EcologicalModelling 161, 35–51.