Embed Size (px)
Citation preview

Gwinnett CountyPublic Schools
Gwinnett County Board of Education Superintendent’s Recommended Budget
Mr. J. Alvin Wilbanks
FY2020 Public Budget DocumentJuly 1, 2019–June 30, 2020

Gwinnett County Public Schools
FY2020 Public Budget Document
Superintendent’s Recommendation
Mr. J. Alvin Wilbanks
CEO/Superintendent
The mission of the Gwinnett County Public Schools is to pursue excellence in academic knowledge, skills, and behavior for each student, resulting in measured improvement against local, national, and world-class standards.

Gwinnett County Public Schools
Fiscal Year 2020 Superintendent’s Recommended Budget Table of Contents
INTRODUCTION
GENERAL FUND
Executive Summary …………………………………… 1 General Fund Revenue Chart ……………………….. 35 Strategic Vision & Direction ………………………..… 5 General Fund Expenditure Chart …………………… 36 FY2020 Budget Development Calendar.……………. 6 Revenue per Student …………………………………. 37 Highlights of Recent Past Budgets ………………….. 7 History of State vs. Local Funding……………………. 38 Organizational Chart ………………………………… 12 Projected Ending Unassigned Fund Balance…..……. 39 Student Enrollment History and Future Estimate ….. 13 Fund Balance as a Percentage of Expenditures……. 40 General Tax Summary ………………………………. 14 Expenditures by Function……………………………… 41 Ad Valorem Taxes Chart ……………………………. 17 Summary of Revenues and Expenditures…………… 43 Historical Digest Growth (Net M&O Digest)………… 18 Positions and Expenditures by Function…………….. 45 Comparison of Millage Levies ………………………. 19 Property Tax Digest ………………………………….. 20 SPECIAL REVENUE FUND ……………………………… 68 Quality Basic Education (Q.B.E.) …………………… 21 CAPITAL PROJECTS FUND ……………………………. 73 School Staff Allocation Formula ……………………. 23 DEBT SERVICE FUND …………………………………… 77 School Staff Point Values …………………………… 28 ENTERPRISE FUND ……………………………………… 80 Budgeted Downloaded Funds to Local Schools …. 29 INTERNAL SERVICE FUND …………………………….. 82 FY2020 Proposed Teacher Salary Schedule ……… 31 GLOSSARY ………………………………………………… 84
TOTAL BUDGET Total Revenue Chart ………………………………… 32 Total Expenditure Chart …………………………….. 33 FY2020 Budget - All Funds ………………………… 34

Gwinnett County Public Schools Budget Introduction
FY2020 Public Budget Document


Executive Summary Page 1 The Gwinnett County Board of Education’s Fiscal Year 2020 (FY2020) budget, as recommended by CEO/Superintendent J. Alvin Wilbanks, is presented within this document. This budget represents an investment plan for Gwinnett County Public Schools (GCPS), its students, employees, and the community as a whole. The budget recommendations are tied directly to the vision and strategic direction of the Board of Education. The proposed Total Budget for FY2020 is approximately $2.319 billion, representing an increase of 2.7% from the current FY2019 Total Budget. The proposed budget for the general operations of the school district is reflected in the General Fund at $1.795 billion, an increase of 3.7% over the current year. The individual funds and the changes from Fiscal Year 2019 are summarized below:
This investment plan for FY2020 accommodates a student population that is projected to grow by 446 students, bringing the district enrollment for the 2019-20 school year to more than 180,200 students. State Revenue The proposed FY2020 budget was developed for Gwinnett County Public Schools prior to the conclusion of the 2019 legislative session and final approval of the state budget. Therefore, the Governor’s most current state budget recommendations at the time of budget development were used as the basis for the proposed local budget. GCPS will receive a net of $52.3 million more in state funding than the district received in FY2019, based on the Quality Basic Education (QBE) funding formula. The additional revenue is due to increases in a number of formula-driven allocations.
QBE Formula Earning Increases for Gwinnett County Public Schools:
$7.7 million in additional formula earnings due to projected student growth
Funds Comprising the Total Budget
FY2020 (In Millions)
FY2019 (In Millions)
Dollar Change (In Millions)
Percentage Change
General Fund 1,794.9$ 1,730.7$ 64.2$ 3.7%Special Revenue Fund 96.3$ 101.1$ (4.8)$ (4.7%)Capital Projects Fund 141.9$ 178.0$ (36.1)$ (20.3%)Debt Service Fund 177.2$ 140.1$ 37.1$ 26.5%Enterprise Fund 96.6$ 97.4$ (0.8)$ (0.8%)Interal Service Fund 12.2$ 11.9$ 0.3$ 2.5%
Total Budget 2,319.1$ 2,259.2$ 59.9$ 2.7%

$41.4 million for salary increases allotted through the State Teacher Salary Schedule
$8.4 million for the state-funded portion of teacher salary step increases (compensation for training and experience) and the additional certificated employees who will be enrolled in state health insurance plans
$1.2 million in additional formula earnings due to an increase in the rate of the employer contribution to the Teachers Retirement System from 20.90% to 21.14%
An increase of $4.4 million in the district’s projected FY2020 Equalization funding, from $82.0 million in FY2019 to $86.4 million. These funds are intended to narrow the gap between public school systems in terms of property “wealth per student.” GCPS will rank 85th among Georgia’s 180 districts in wealth per student next year.
The $63.1 million in additional state revenue above will be offset by an increase of $10.8 million for the system’s “Local Five-Mill Share,” a required cost of participating in the QBE program. The state subtracts from a school district’s total earnings the equivalent of five effective mills of local taxes. For FY2020, GCPS’ five-mill deduction will be $166.8 million compared to $156.0 million in FY2019. The resulting net increase in state revenue, therefore, will be $52.3 million.
Local revenue After five consecutive years (FY2010 – FY2014) of a decline in Gwinnett County’s property tax digest that totaled nearly 25%, the local tax digest is expected to grow for the sixth consecutive year. For FY2020, the increase in property tax revenue is budgeted to be $21.4 million over the amount for the FY2019 budget. In addition, title ad valorem taxes and investment earnings are expected to grow a combined $10.5 million, for a total increase in local revenue of $31.9 million. Expenses For FY2020 the school district once again closely scrutinized all proposed expenditures. However, there are a number of increases in expenses, mostly in the area of salaries and employee benefits, that must be funded:
The addition of 104 instructional and support positions, required to accommodate the projected growth of 446 students and the opening of one new school, will increase the district’s salary and benefits costs by approximately $8.1 million.
The employer share for insurance premiums for over 270 more enrollees in the district’s health benefits plans is budgeted at an annualized cost of $3.1 million.
The employer contribution required for the Gwinnett Retirement System (GRS), the district’s alternative to Social Security, will increase from 5.49% to 5.53%, at a cost of $0.4 million.
Funding the rate increase for the employer-paid portion of the Teachers Retirement System from 20.90% to 21.14% will result in an additional cost of $2.3 million.
Executive Summary Page 2

Executive Summary Page 3
In the area of new funding, the proposed FY2020 budget includes salary improvements for current employees, as well as other expenditures that support the school district’s core business of teaching and learning and increasing student achievement. These new investments include:
A salary step increase for all eligible employees at a projected cost of $13.7 million (Approximately 95% of current teachers will be eligible for a step increase.)
A $3,000 cost-of-living increase for all employees paid on the teacher salary schedule at a cost of $44.6 million A 2.0% cost-of-living increase for all employees not paid on the teacher salary schedule at a cost of $7.0 million Funding for six additional School Resource Officers to enhance school safety and security Increases in per-pupil funding for local schools Additional resources in the areas of special education and psychological services, foreign language, and fine arts Enhanced operational and maintenance support for buildings/grounds, information management, and information security.
To meet the challenges of the mandated increases, fully fund the employee salary and investment plan improvements, and maintain a balanced budget, the following cost-saving measures will remain in place for FY2020:
School staffing allocation formulas will remain unchanged for another year. Schools will continue to receive positions to accommodate student growth.
Division heads were directed to maintain their operating expense budgets at or below the current year spending levels, while maintaining essential levels of service to support teaching and learning.
The practice will continue of leaving vacant, to the extent possible, currently unfilled district-level positions. Only critically needed positions that the budget can continue to fund in future years will be filled as vacancies occur.
Summary of the Six Funds in the Total Budget
The General Fund, as recommended, represents 77.4% of the Total Budget. Primary day-to-day operations of the school district are budgeted through the General Fund. Student achievement and the teaching and learning process are the central focus of this budget, as evidenced by the fact that 71% of the General Fund budget is targeted for instructional services. The FY2020 General Fund budget is increasing by 3.7% over the FY2019 budget. The budgeted expenditure per student is increasing by 3.45% to $9,960.
The General Fund is proposed to be funded with projected state revenue in the amount of just under $1.1 billion, federal revenue of $0.7 million, and local revenue in the amount of $735.2 million. The maintenance and operations millage rate to support this budget will be set in June once more complete data is available on the local property tax digest. As noted earlier, these figures are based on the most current projections and state recommendations at the time of budget development.

The Special Revenue Fund in the FY2020 budget is projected to be $96.3 million, a decrease of $4.8 million over the current year. This fund
accounts for federal categorical grants such as Title I, Title II, Title VI-B, and secondary vocational grants. The Capital Projects Fund in the FY2020 budget totals $141.9 million, a decrease of $36.1 million from the FY2019 level. This fund
includes state capital outlay grants, the tax proceeds and expenses funded by the education special purpose local option sales tax (E-SPLOST) approved by voters in November 2015, and proceeds from the General Obligation bonds approved by voters in November 2018.
The Debt Service Fund for FY2020 will be $177.2 million, an increase of $37.1 million from the FY2019 budget. This fund represents the
budgeted principal and interest payments for outstanding debt associated with 1.) Certificates of Participation (COPS) issued in 2006, 2.) Short-term Series 2016 bonds issued to advance fund the E-SPLOST V program, and 3.) General Obligation bonds approved by voters in February 2008 and November 2018. Principal and interest payments on the COPS and Series 2016 E-SPLOST bonds will be paid with accumulated sales tax proceeds and will not require a debt service property tax levy. The debt service millage rate required to service the General Obligation bonds will be formally adopted in June.
The Enterprise Fund contains the budget for the cafeteria operations for the school district. The total budget for this fund will be $96.6
million for FY2020. As a self-sustaining fund, revenues come primarily from meal purchases and the federal reimbursement program. The Internal Service Fund represents the operations of the school district’s workers’ compensation/risk management fund, employee short-
term disability program, and the in-house print shop. The total budget for this fund will be $12.2 million for FY2020.
Executive Summary Page 4
The Superintendent’s recommended budget document is available for public review online at www.gwinnett.k12.ga.us. The budget is also available in Gwinnett County Public Schools’ Department of Budgets and Financial Reporting, located in the J. Alvin Wilbanks Instructional Support Center at 437 Old Peachtree Road, NW, in Suwanee. Interested citizens may call 678-301-6000 to request an appointment to review the detailed document.
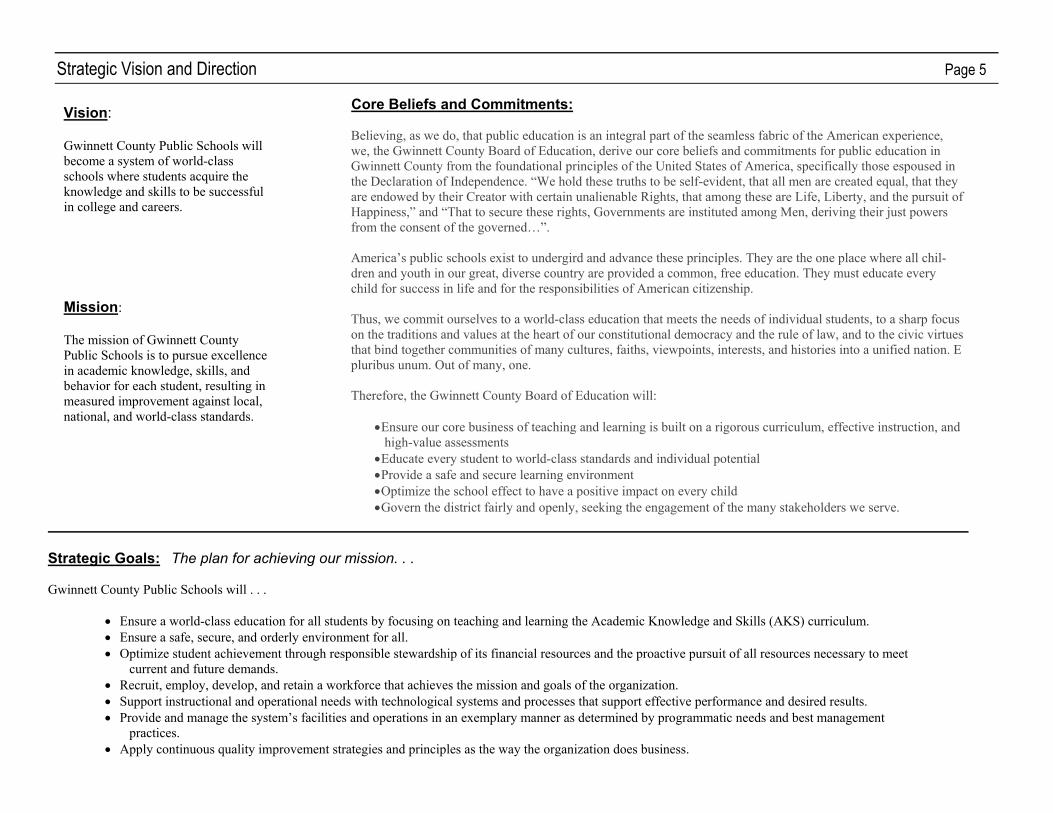
Strategic Goals: The plan for achieving our mission. . . Gwinnett County Public Schools will . . .
Ensure a world-class education for all students by focusing on teaching and learning the Academic Knowledge and Skills (AKS) curriculum. Ensure a safe, secure, and orderly environment for all. Optimize student achievement through responsible stewardship of its financial resources and the proactive pursuit of all resources necessary to meet
current and future demands. Recruit, employ, develop, and retain a workforce that achieves the mission and goals of the organization. Support instructional and operational needs with technological systems and processes that support effective performance and desired results. Provide and manage the system’s facilities and operations in an exemplary manner as determined by programmatic needs and best management
practices. Apply continuous quality improvement strategies and principles as the way the organization does business.
Strategic Vision and Direction Page 5
Vision: Gwinnett County Public Schools will become a system of world-class schools where students acquire the knowledge and skills to be successful in college and careers. Mission: The mission of Gwinnett County Public Schools is to pursue excellence in academic knowledge, skills, and behavior for each student, resulting in measured improvement against local, national, and world-class standards.
Core Beliefs and Commitments: Believing, as we do, that public education is an integral part of the seamless fabric of the American experience, we, the Gwinnett County Board of Education, derive our core beliefs and commitments for public education in Gwinnett County from the foundational principles of the United States of America, specifically those espoused in the Declaration of Independence. “We hold these truths to be self-evident, that all men are created equal, that they are endowed by their Creator with certain unalienable Rights, that among these are Life, Liberty, and the pursuit of Happiness,” and “That to secure these rights, Governments are instituted among Men, deriving their just powers from the consent of the governed…”. America’s public schools exist to undergird and advance these principles. They are the one place where all chil-dren and youth in our great, diverse country are provided a common, free education. They must educate every child for success in life and for the responsibilities of American citizenship. Thus, we commit ourselves to a world-class education that meets the needs of individual students, to a sharp focus on the traditions and values at the heart of our constitutional democracy and the rule of law, and to the civic virtues that bind together communities of many cultures, faiths, viewpoints, interests, and histories into a unified nation. E pluribus unum. Out of many, one. Therefore, the Gwinnett County Board of Education will:
Ensure our core business of teaching and learning is built on a rigorous curriculum, effective instruction, and high-value assessments
Educate every student to world-class standards and individual potential Provide a safe and secure learning environment Optimize the school effect to have a positive impact on every child Govern the district fairly and openly, seeking the engagement of the many stakeholders we serve.

Gwinnett County Public Schools
FY2020 Budget Calendar
FY2020 Budget Development Calendar Page 6
October 2, 2018 – Student count date for FTE funding October 18, 2018 – Adopt budget development calendar for fiscal year 2020 December 3, 2018 - Complete FY 2019 mid-year salary/position budget amendment No later than January 14, 2019 - Distribute FY 2020 budget development packages to program managers January 14, 2019 – February 8, 2019 - Prepare FY2020 program budget requests February 1, 2019 - Central Office budget managers submit completed proposed budget requests to Budget Office February 8, 2019 - Central Office budget managers submit completed budget improvement requests to Budget Office February 11-22, 2019 - Prepare budget request summary February 25-26, 2019 - Superintendent and Cabinet meet to discuss FY2020 budget requests
March 1, 2019 – Superintendent’s Recommendations due to Budget Office March 4-22, 2019 - Preparation and printing of Superintendent's Recommended Budget March 23, 2019 - Board budget work session (Saturday) April 9, 2019 - Board budget work session; adoption of tentative budget; (Area Board Meeting – District I1 – Central Gwinnett HS) May 1 and May 5, 2019 - Publish budget advertisement in newspaper May 9, 2019 - First Public Budget Hearing May 16, 2019 - Second Public Budget Hearing; Final Budget Adoption; and Adoption of Tentative millage rate June TBD, 2019 – Submission of Adopted Budget to Carl Vinson Institute – in compliance with GA Law. July TBD, 2019 – Final Adoption of millage rate September TBD, 2019 – Transmit adopted budget to State Department of Education
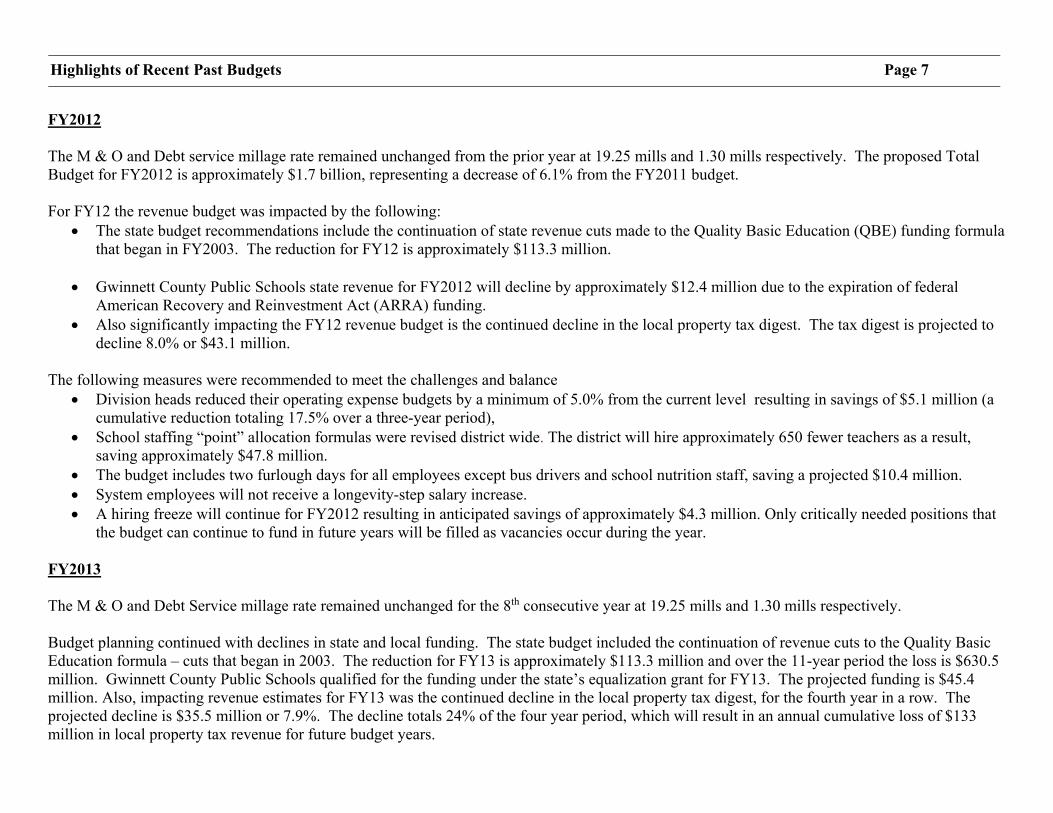
FY2012 The M & O and Debt service millage rate remained unchanged from the prior year at 19.25 mills and 1.30 mills respectively. The proposed Total Budget for FY2012 is approximately $1.7 billion, representing a decrease of 6.1% from the FY2011 budget. For FY12 the revenue budget was impacted by the following:
The state budget recommendations include the continuation of state revenue cuts made to the Quality Basic Education (QBE) funding formula that began in FY2003. The reduction for FY12 is approximately $113.3 million.
Gwinnett County Public Schools state revenue for FY2012 will decline by approximately $12.4 million due to the expiration of federal
American Recovery and Reinvestment Act (ARRA) funding. Also significantly impacting the FY12 revenue budget is the continued decline in the local property tax digest. The tax digest is projected to
decline 8.0% or $43.1 million. The following measures were recommended to meet the challenges and balance
Division heads reduced their operating expense budgets by a minimum of 5.0% from the current level resulting in savings of $5.1 million (a cumulative reduction totaling 17.5% over a three-year period),
School staffing “point” allocation formulas were revised district wide. The district will hire approximately 650 fewer teachers as a result, saving approximately $47.8 million.
The budget includes two furlough days for all employees except bus drivers and school nutrition staff, saving a projected $10.4 million. System employees will not receive a longevity-step salary increase. A hiring freeze will continue for FY2012 resulting in anticipated savings of approximately $4.3 million. Only critically needed positions that
the budget can continue to fund in future years will be filled as vacancies occur during the year. FY2013 The M & O and Debt Service millage rate remained unchanged for the 8th consecutive year at 19.25 mills and 1.30 mills respectively. Budget planning continued with declines in state and local funding. The state budget included the continuation of revenue cuts to the Quality Basic Education formula – cuts that began in 2003. The reduction for FY13 is approximately $113.3 million and over the 11-year period the loss is $630.5 million. Gwinnett County Public Schools qualified for the funding under the state’s equalization grant for FY13. The projected funding is $45.4 million. Also, impacting revenue estimates for FY13 was the continued decline in the local property tax digest, for the fourth year in a row. The projected decline is $35.5 million or 7.9%. The decline totals 24% of the four year period, which will result in an annual cumulative loss of $133 million in local property tax revenue for future budget years.
Highlights of Recent Past Budgets Page 7

With another challenging year ahead, the district closely scrutinized expense budgets and took the following measures to balance the FY13 budget: Central office operating budgets were reduced by 2.5%, the fourth year a reduction (20% over four years , saving $23 million annually) School staffing allocation formulas were revised district wide to add two students to most class sizes. The budget included the elimination of 54 central office positions. The employer contribution rate for the Gwinnett Retirement System (GRS) changed from 5.09% to 2.43%. In addition, changes were made
in vested years of service and spouse survivor benefit options to align GRS with the Teachers Retirement System. The budget included the continuation of two furlough days for all employees except bus drivers and school nutrition staff.
FY2014 While there are still challenges ---local tax digest is projected to decline for the fifth year in a row ; state “austerity reductions” continue; growth in student enrollment; increases in employee health insurance costs; and increased employer retirement benefit expenses ---an increase in state funding means the district will be able to balance the budget by continuing the cost saving measures implemented in previous years. The challenges were met by additional state revenue for enrollment growth and additional earnings from the “Equalization Grant” funding for low-wealth districts. In the area of new discretionary expenses the budget includes funding for the elimination of the two furlough days for all employees and the addition of 18 school resource officer positions. The M & O millage did increase this year from 19.25 mills to 19.80 mills. The Debt Service millage rate increased from 1.30 mills to 2.05 mills to fund the existing general obligation bond debt in FY2014 and beyond. The increase is required after holding the millage rate steady for the past 8 years through the recession. FY2015 A 5% growth in the property tax digest, a smaller state “austerity” cut, and growth in student enrollment, means that GCPS will be able to balance its budget and also provide much needed raises for its employees. While all other cost-saving measures which were put into place over the past five years will remain, teachers, and all other employees will see an increase in pay for the first time since the 2009-10 school year. All full-time employees received a 2% cost-of-living raise and a longevity-step salary increase for all eligible employees, along with bus drivers received an additional $1.25/hour. Additional instructional positions were added to enable each elementary school to implement Reading Recovery. 9 school resource officer (SRO) positions were added which provides an SRO at each high school and middle school. The M & O and Debt Service millage rate remained unchanged at 19.80 mills and 2.05 mills respectively.
Highlights of Recent Past Budgets Page 8

Highlights of Recent Past Budgets Page 9 FY2016 Slight growth of 3% in the property tax digest along with additional revenue from the state, which is based on earnings driven by the Quality Basic Education (QBE) funding formula, a reduction of the state “austerity” cut, and growth in student enrollment means that GCPS will be able to balance its budget and also provide well-deserved raises for its employees. The FY2016 budget accounted for certain state-mandated increases in the areas of employee salary – 175 additional teacher/instructional support positions, and employer benefit cost increases. In addition, the FY2016 budget will include funds to address the operational and start-up costs for the four new schools opening in August of 2015. Salary and other improvements for FY2016:
A longevity-step salary increase for all eligible employees. All full-time employees received a 2.5% cost-of-living increase. Salary adjustment increase to the starting salary for new teachers and those early in their career. Additional salary improvements include adjustments for bus monitors of an increase of .84/hour, increase in the stipend for special
educational paraprofessionals, a 10% increase in coach and sponsor supplements, and an increase in substitute teacher of $5 per day. Additional instructional positions will support Academy Programs, STEP Academies, IB Programs, Mathematics and eCLASS. Fifteen additional bus drivers and five additional bus monitors will be hired to accommodate growth.
The budget-cutting measures from previous years will remain in place. School staffing allocation formulas are unchanged. Central office operating budgets will remain relatively the same. Vacant district positions to remain unfilled to the extent possible. The M & O and Debt Service millage rate remained unchanged at 19.80 mills and 2.05 mills respectively. FY2017 Growth in the property tax digest for the third straight year plus additional revenue from the state means that GCPS will be able to balance its budget. GCPS will “net” additional state revenue. Revenue is increased due to a reduction in the amount of state cuts made to the Quality Basic Education (QBE) formula. This increase in revenue will be offset due to changes in the “equalization grant funding” and a higher “Local Five-Mill Share”. The county’s property tax digest is expected to grow by 5% resulting in an increase in local property tax revenue. Increased costs mandated by the state include funding 159 additional teacher/instructional support positions, operational and start-up costs for two new schools, and increases in employer benefit costs. Salary and other improvements for FY2017:
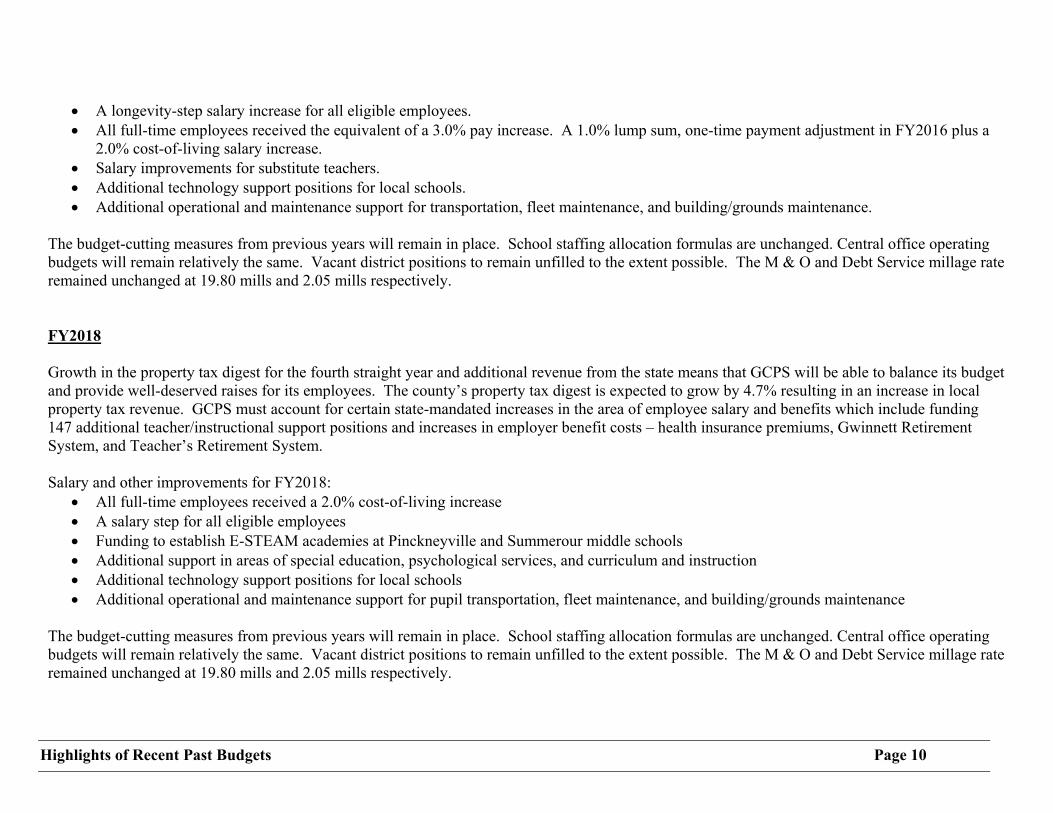
A longevity-step salary increase for all eligible employees. All full-time employees received the equivalent of a 3.0% pay increase. A 1.0% lump sum, one-time payment adjustment in FY2016 plus a
2.0% cost-of-living salary increase. Salary improvements for substitute teachers. Additional technology support positions for local schools. Additional operational and maintenance support for transportation, fleet maintenance, and building/grounds maintenance.
The budget-cutting measures from previous years will remain in place. School staffing allocation formulas are unchanged. Central office operating budgets will remain relatively the same. Vacant district positions to remain unfilled to the extent possible. The M & O and Debt Service millage rate remained unchanged at 19.80 mills and 2.05 mills respectively. FY2018 Growth in the property tax digest for the fourth straight year and additional revenue from the state means that GCPS will be able to balance its budget and provide well-deserved raises for its employees. The county’s property tax digest is expected to grow by 4.7% resulting in an increase in local property tax revenue. GCPS must account for certain state-mandated increases in the area of employee salary and benefits which include funding 147 additional teacher/instructional support positions and increases in employer benefit costs – health insurance premiums, Gwinnett Retirement System, and Teacher’s Retirement System. Salary and other improvements for FY2018:
All full-time employees received a 2.0% cost-of-living increase A salary step for all eligible employees Funding to establish E-STEAM academies at Pinckneyville and Summerour middle schools Additional support in areas of special education, psychological services, and curriculum and instruction Additional technology support positions for local schools Additional operational and maintenance support for pupil transportation, fleet maintenance, and building/grounds maintenance
The budget-cutting measures from previous years will remain in place. School staffing allocation formulas are unchanged. Central office operating budgets will remain relatively the same. Vacant district positions to remain unfilled to the extent possible. The M & O and Debt Service millage rate remained unchanged at 19.80 mills and 2.05 mills respectively.
Highlights of Recent Past Budgets Page 10

Highlights of Recent Past Budgets Page 11 FY2019 Growth in the property tax digest for the fifth straight year and additional revenue from the state, including the elimination of austerity reductions, means that GCPS will be able to balance its budget, provide raises for its employees, and implement some improvement items. The Recommended Budget calls for a total budget of $2.193 billion. The proposed General Fund, which represents 77.8% of the total budget and funds the primary day-to-day operations of the school district, accounts for $1.706 billion of the total. This represents a 5.19% increase in the General Fund that can be attributed to salary improvements, mandated employer benefit increases, and costs associated with an increase in the number of students served. GCPS will receive an additional $54.1 million in state QBE funding due to a number of factors. Additional formula earnings from projected student growth, state funded portion of teacher salary step increases, rate increase to the Teachers Retirement System, and Equalization Funding. The property tax digest is expected to grow by 3.1%, resulting in an increase of $17 million in local property tax revenue. For FY2019, GCPS must account for increases in the area of employee salary and benefits. Additional salary and benefit costs to fund 128 additional teacher/instructional support positions, open one new high school, and increases in employer benefit costs – Gwinnett Retirement System, health insurance premiums, and Teacher’s Retirement System. Salary and other improvements for FY2019:
All full-time employees will receive a 2.25% cost-of-living increase A salary step increase for all eligible employees Funding for 10 additional School Resource Officers Increase in daily rates of pay for substitute paraprofessionals Additional technology support positions for local schools Funding to establish a Junior Achievement Academy at Parkview High School Additional support for special education, psychological services, and curriculum and instruction Expansion of the Student Mentoring Program to serve Hispanic students
The budget-cutting measures from previous years will remain in place. School staffing allocation formulas are unchanged. Central office operating budgets will remain relatively the same. Vacant district positions to remain unfilled to the extent possible. The M & O and Debt Service millage rate for FY2019 are 19.80 mills and 1.95 mills respectively.

Gwinnett County Public Schools Page 12
Gwinnett County Board of Education
Governing Board
CEO/Superintendent
Chief Exec. Officer
Associate Superintendent
Division of School Improvement and
Operations
Associate Superintendent
Division of Human Resources and Talent
Management
Chief Information Officer
Division of Information Management and
Technology
Associate Superintendent
Division of Curriculum and Instructional
Support
Chief Operations Officer
Division of Facilities & Operations
Executive Director of Administration and
Policy____________
Executive Director of Communication and
Media Relations
CEO/Superintendent’s Office
Associate Superintendent
(Part-Time)
Office of District Performance and
Community Engagement
Elementary, Middle, High, Special Entities
Local Schools
Chief of Staff
CEO/Superintendent’s Office
Chief Financial Officer
Division of Business & Finance
Chief Data Officer
Division of Data Governance
Executive Data Governance Steering
Committee
Chief Strategy Officer
Office of Research Evaluation, Strategy,
and Development


FY2020 FY2021 FY2022 FY2023 FY2024Enrollment Projection 180,204 181,004 181,854 182,804 183,804 Change from prior year 446 800 850 950 1,000
FY2015 FY2016 FY2017 FY2018 FY2019Enrollment Actual 173,246 176,052 178,214 179,266 179,758 Change from prior year 4,096 2,806 2,162 1,052 492
Pupil Enrollment: History and Future Year Estimates Page 13
Five Year History of Enrollment
Enrollment Estimate(Estimate for budget purpose only.)
173,24
6
176,05
2
178,21
4
179,26
6
179,75
8
180,20
4
181,00
4
181,85
4
182,80
4
183,80
4
100,000
120,000
140,000
160,000
180,000
200,000
FY2015 Actual
FY2016 Actual
FY2017 Actual
FY2018 Actual
FY2019 Actual
FY2020 Estimate
FY2021 Estimate
FY2022 Estimate
FY2023 Estimate
FY2024 Estimate

The ad valorem tax, more commonly called property tax, is the primary source of revenue for local governments in Georgia. Ad Valorem
means "according to the value," and property is taxed based on its assessed value.
The County Board of Tax assessors, which is appointed by the County Board of Commissioners, evaluates and assesses all property for tax purposes. Assessed value by law is based on 40% of the fair market value as of January 1 each year.
The millage rate is a determining factor in the calculation of taxes (a mill is $1 for each $1,000 of assessed value).
State authorities set the millage rate for State taxes. County Board of Commissioners set the millage rate for County taxes and the County Board of Education sets the millage rate for County school taxes.
The millage rate is established by the various authorities by dividing revenue needed by the 40% net assessment.
The Tax Commissioner’s Office is responsible for billing and collecting taxes based on the set millage rate. The school district pays a 1.5% fee to the Tax Commissioner for collection of the school taxes.
Tax Exempt Property
All public property, all institutions of purely public charity, non-profit hospitals, non-profit homes for the elderly, places of religious worship and burial, all personal property used within the home (if not held for sale or other commercial use) are exempt. All tools and implements of trade of manual laborers, and all domestic animals not exceeding $300 in actual value are exempt from the property tax. Tax exempt status must be applied for before tax liability on the property will be removed.
Property Tax Returns
Individuals are required by law to file a personal property tax return between January 1 and April 1 for all real or personal property owned or purchased in the previous calendar year. Real property consists of real estate and any permanently affixed improvements, such as buildings. Personal property consists of:
a) Furniture, fixtures, machinery, equipment, inventory or any other personal property used in business. b) Aircraft and boats/motors owned by any individual or corporation.
Personal property tax returns shall be filed each year by all persons residing in or doing business in Gwinnett County. Personal property is exempt if the total value of taxable tangible personal property owned by the taxpayer within the county does not exceed $500.
General Tax Summary Page 14

Tax Exemptions
These exemptions apply only to homestead property. Homeowners must meet the regular homestead exemption requirements. This means individuals must own, occupy and claim the legal residence as property on January 1 to be eligible for any of these exemptions. These exemptions are automatically renewed each year unless there is a change in ownership of the property or eligibility. The amount exempted is deducted from the 40% assessed value of the property in the applicable tax categories.
Gwinnett County School Exemptions
Regular Homestead Exemption (S1R) This exemption is for all property owners who occupy the property as of January 1. There is no income or age limit. This exemption includes $4,000 off the assessed value for regular school tax. Regular School Exemption (S3) Homeowners must be 62 years old as of January 1. Has income requirement. This exemption includes $10,000 off the assessed value for school and $10,000 off school bond. Seniors School Exemption (S4) Homeowners must be 65 years old as of January 1. Has income requirement. This exemption includes $10,000 off the assessed value for school and $10,000 off school bond. Disabled Veteran Exemption (S5) This exemption applies to homeowners who are certified by the U. S. Department of Veterans Affairs stating 100% service-connected disabled. This exemption extends to the un-remarried spouse or minor children of the disabled veteran. There is no age or income limit. This exemption includes an annually-adjusted amount set by the U.S. Secretary of Veterans Affairs, off the assessed value for regular school and school bond. Senior Surviving Military Spouse Exemption (SE) Homeowner must be 65 years old as of January 1. No income limit. This exemption extends to the unremarried spouse of a U.S. service member killed in action. Requires a letter from the U. S. Department of Defense stating unremarried surviving spouse receives spousal benefits as a result of the death of spouse who was killed or died as a result of a war or armed conflict while on active duty. This exemption includes an annually-adjusted amount off the assessed value for regular school and school bond. Spouse of Peace Officer or Firefighter killed in the Line of Duty (SG) – No age or income limit. Applies to un-remarried spouse of a peace officer or firefighter killed in the line of duty. A 100% exemption is provided for regular school and school bond taxes. Surviving Spouse Exemption (SS) –No age or income limit. Applies to homeowners who are certified by the U.S. Secretary of Defense stating un-remarried surviving spouse receives spousal benefits as a result of the death of spouse who was killed or died as a result of a war or armed conflict while on active duty. This exemption includes an annually-adjusted amount off the assessed value for regular school and school bond. Disability Exemption (L1) No age or income limit. Requires letter signed by your doctor stating that you are 100% totally and permanently disabled as of January 1. Homeowners are entitled to an exemption of $4,000 off the assessed value on school and $4,000 off school bond. General Tax Summary Page 15

General Tax Summary Page 16 Senior Exemption (L3A) This exemption applies to homeowners who are 65 years old as of January 1. Has income requirements. This exemption includes $20,000 off the assessed value for school. Senior School Exemption (L5A) This exemption applies to homeowners who are 65 years old or 100% disabled as of January 1. Has income requirement. This exemption applies to the house and one acre of property. Claimants are exempt from all school and school bond tax.
Motor Vehicle Title Tax
Effective March 1, 2013, The Georgia General Assembly passed House Bill 386 which changed the way motor vehicles are taxed in Georgia. Under prior law, motor vehicles were generally subject to Sales Tax at the time of purchase and an Annual Ad Valorem Tax every year thereafter. Under House Bill 386, motor vehicles purchased on or after March 1, 2013 are subject to a one-time Title Ad Valorem Tax (TAVT) and are exempt from Sales Tax and Annual Ad Valorem Tax. The TAVT rate and the distribution of proceeds between the state and local counties was defined through the initial legislation and had provisions to evaluate the rate and distribution of proceeds annually. However, in March 2018, the Georgia General Assembly passed House Bill 329, which becomes effective July 1, 2019, to amend the current law by establishing the TAVT rate at 7% and changing the manner of distribution of proceeds. For vehicle that continue to be owned prior to the initial legislative change March 1, 2013, ad valorem taxes (assessed at 40% of the value of the vehicle) will continue to be paid and collected on the birthdate of the vehicle owner. (O.C.G.A. 48-5C-1)
Intangible Recording Tax
The Georgia Intangible Recording Tax is paid to the Tax Commissioner by holders of long-term notes secured by real estate. The rate is $1.50 for each $500 or fractional part of the face amount of the note. The maximum amount of recording tax on any single note is $25,000. (O.C.G.A. 48-6-60 – 48-6-77)
Real Estate Transfer Tax
The Real estate transfer tax is an excise tax on transactions involving the sale of real property where title to the property is transferred from the seller to the buyer. The tax is based upon the property’s sale price at a rate of $1.00 on the first $1,000 or fractional part of $1,000 and at a rate of 10 cents for each additional $100 or fractional part of $100. The seller is liable for the real estate transfer tax, though frequently the parties agree in the sales contract that the buyer will pay the tax. (O.C.G.A. 48-6-1 – 48-6-10)

FY2020 millage rate will be set at a meeting June 2019.
Ad Valorem Taxes Page 17
1.30 1.30 1.30 1.302.05 2.05 2.05 2.05 2.05 1.95
19.25 19.25 19.25 19.25 19.80 19.80 19.80 19.80 19.80 19.80
20.55 20.55 20.55 20.5521.85 21.85 21.85 21.85 21.85 21.75
0.00
5.00
10.00
15.00
20.00
25.00
2010 2011 2012 2013 2014 2015 2016 2017 2018 2019
Mill
age
Rat
e
Fiscal Year
Debt Service
Maintenance & Operations
Total
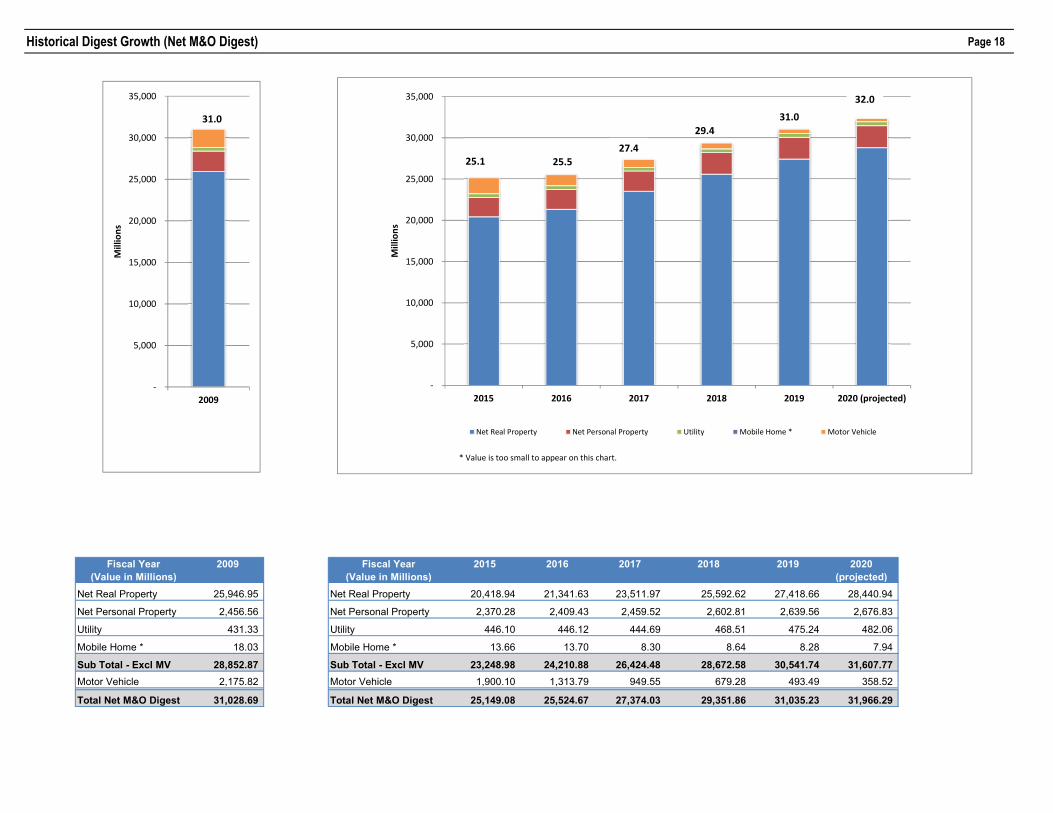
Historical Digest Growth (Net M&O Digest) Page 18
Fiscal Year(Value in Millions)
2009 Fiscal Year(Value in Millions)
2015 2016 2017 2018 2019 2020 (projected)
Net Real Property 25,946.95 Net Real Property 20,418.94 21,341.63 23,511.97 25,592.62 27,418.66 28,440.94
Net Personal Property 2,456.56 Net Personal Property 2,370.28 2,409.43 2,459.52 2,602.81 2,639.56 2,676.83
Utility 431.33 Utility 446.10 446.12 444.69 468.51 475.24 482.06
Mobile Home * 18.03 Mobile Home * 13.66 13.70 8.30 8.64 8.28 7.94
Sub Total - Excl MV 28,852.87 Sub Total - Excl MV 23,248.98 24,210.88 26,424.48 28,672.58 30,541.74 31,607.77 Motor Vehicle 2,175.82 Motor Vehicle 1,900.10 1,313.79 949.55 679.28 493.49 358.52
Total Net M&O Digest 31,028.69 Total Net M&O Digest 25,149.08 25,524.67 27,374.03 29,351.86 31,035.23 31,966.29
‐
5,000
10,000
15,000
20,000
25,000
30,000
35,000
2015 2016 2017 2018 2019 2020 (projected)Millions
Net Real Property Net Personal Property Utility Mobile Home * Motor Vehicle
* Value is too small to appear on this chart.
‐
5,000
10,000
15,000
20,000
25,000
30,000
35,000
2009
Millions
31.0
25.1 25.527.4
29.431.0
32.0

M&O 19.80 M&O 19.80 M&O 19.80 M&O 19.80 M&ODebt 2.05 Debt 2.05 Debt 2.05 Debt 1.95 Debt
$100,000 HomeM&O: $ 712.80 $ 712.80 $ 712.80 $ 712.80Debt Service: 82.00 82.00 82.00 78.00Total: $ 794.80 $ 794.80 $ 794.80 $ 790.80
$150,000 HomeM&O: $ 1,108.80 $ 1,108.80 $ 1,108.80 $ 1,108.80Debt Service: 123.00 123.00 123.00 117.00Total: $ 1,231.80 $ 1,231.80 $ 1,231.80 $ 1,225.80
$200,000 HomeM&O: $ 1,504.80 $ 1,504.80 $ 1,504.80 $ 1,504.80Debt Service: 164.00 164.00 164.00 156.00Total: $ 1,668.80 $ 1,668.80 $ 1,668.80 $ 1,660.80
$250,000 HomeM&O: $ 1,900.80 $ 1,900.80 $ 1,900.80 $ 1,900.80Debt Service: 205.00 205.00 205.00 195.00Total: $ 2,105.80 $ 2,105.80 $ 2,105.80 $ 2,095.80
Comparison of Millage Levies Page 19
FY20 millage rate will be set at a meeting June 2019.
2015 - 2016 2016 - 2017 2017 - 2018 2018 - 2019 2019 - 2020

Property Tax Digest Page 20
Residential63.13%
Other0.47%Utility
1.53%
Motor Vehicle/ Mobile Home
1.62%
Personal Property8.51%
Commercial/Industrial24.74%


Quality Basic Education (Q.B.E.) Page 21
Revenue from the State of Georgia is earned primarily on a per student or full-time equivalency FTE basis. There are 19 direct instructional pro- grams defined by the State of Georgia for which local school districts earn FTE revenue. Each program is assigned a "weight" and the weight is an indication of the relative cost of each program compared to the base student cost assigned a weight of 1.00 in grades 9 - 12.
The 19 programs as defined by the State of Georgia and their estimated weights and values for FY2020 are:
Program FY2020 Weight FY2020 Value
Kindergarten 1.6724 $4,629.47
Kindergarten Early Intervention 2.0678 $5,724.00
Grades 1-3 1.2948 $3,584.21
Grades 1-3 Early Intervention 1.8180 $5,032.51
Grades 4-5 1.0390 $2,876.12
Grades 4-5 Early Intervention 1.8125 $5,017.29
Grades 6-8 1.0314 $2,855.01
Middle School Programs 1.1380 $3,150.17
Grades 9-12 1.0000 $2,768.16
Career, Technical, & Agricultural Educ. Lab (CTAE Lab) 1.1830 $3,274.73
Special Ed. - Category I 2.4118 $6,676.25
Special Ed. - Category II 2.8402 $7,862.13
Special Ed. - Category III 3.6188 $10,017.42
Special Ed. - Category IV 5.8710 $16,251.87
Special Ed. - Category V 2.4737 $6,847.60
Gifted 1.6794 $4,648.85
Remedial Education 1.3576 $3,758.05
Alternative Education 1.4881 $4,119.30
ESOL Program 2.5892 $7,167.32

In addition to QBE formula earnings that are driven by the above FTE amounts, other revenue is earned for categorical grants as follows:
Transportation o Revenue is earned for students who live outside a 1.5 mile radius of their school. Current budget estimates are approximately $5.4
million in FY20.
Five Mill Buy In o Subtracted from a school district's earnings is the requirement of a "Five Mill Buy In" or cost of participating in the QBE program.
Under the “Five Mill Buy In” provision, each school district is required to levy 5 mills of property tax. The value of 5 mills worth of property tax revenue is a direct reduction of total State Earnings. For FY20, the “Five Mill Buy In” for Gwinnett County Public Schools is projected to be $166.8 million.
Educational Equalization Funding Grant
o Equalization grants are additional State funds earned by school districts above the core QBE formula earnings. These funds are in- tended to narrow the gap between systems in terms of property tax “wealth per student” (WPS). The amount of the grant each year is determined by a system’s property tax WPS in relation to the statewide average for school systems. Legislation was introduced and passed during the 2012 session (HB824) to enact changes to the grant program including the method for calculating and distributing funds.
o Gwinnett County Public School District began qualifying for equalization funding in FY08 and has received this funding each year thereafter. The district’s projected funding appropriation for FY20 is $86.4 million.
o Gwinnett County Public School District will rank 85th among Georgia's 180 districts in wealth per student next year.
Quality Basic Education (Q.B.E.) Page 22

School Staff Allocation Formula Page 23
Category Elementary Middle HighKindergarten Teacher Kindergarten FTE divided by 22 n/a n/a
Early Intervention Program (EIP) FTE for EIP students in Grades K-5 divided by 18 n/a n/a
Teacher Specialist FTE in Grades 1-5 divided by 345 FTE in Grades 6-8 divided by 345 n/a(Art, Music, PE)Classroom Teachers Grades 1-3: FTE divided by 25 FTE in grades 6-8 divided by 27 FTE in grades 9-12 divided by 27
Grades 4-5: FTE divided by 27.25 for each school and 1.5 1.5 points per 1,000 students 2.0 points per 1,000 students points per 1,000 students enrolled, or fractions thereof. enrolled, or fractions thereof.enrolled, or fractions thereof. i.e. (.0015 X students enrolled)
i.e.(.0015 X students enrolled) i.e.(.0020 X students enrolled)
Planning Time 1.0 point for teacher planning time. n/a n/a
Refer to Grades 1-5 Planning Chart and subtract Teacher Specialist Points & Planning PointGRADES 1-5 POINTS 1-21 = 3.00 22-24 = 3.25 25-28 = 3.50 29-31 = 4.00 32-33 = 4.25 34-35 = 4.50 36-38 = 4.75 39-42 = 5.00 43-45 = 5.50 46-47 = 5.75 48-49 = 6.00 50-52 = 6.50 53-54 = 6.75 55-56 = 7.00 57-59 = 7.50 60-61 = 7.75 62-63 = 8.00 64-66 = 8.50 67-68 = 8.75 69-70 = 9.00 71-73 = 9.50 74-75 = 9.75 76-77 =10.00
Additional Staff
Grades 1-5 Planning n/a n/a

Category Elementary Middle HighVocational Education Teacher n/a n/a FTE for vocational education classes divided by 27
Local School Technology Coordinator (LSTC)
School enrollment: School enrollment: School enrollment: 1-749 = 1.00 1- 749 = 1.00 1- 680 = 1.00 750-999 = 1.50 750- 999 = 2.00 681- 909 = 1.50 1000-1249 = 2.00 1000-1249 = 2.50 910-1129 = 2.00 1250-1499 = 2.50 1250-1499 = 3.00 1130-1349 = 2.50 1500-1749 = 3.00 1500-1749 = 3.50 1350-1569 = 3.00 1750-1999 = 3.50 1750-1999 = 4.00 1570-1789 = 3.50
2000-2249 = 4.50 1790-2009 = 4.00 2250-2499 = 5.00 2010-2229 = 4.50 2500-2749 = 5.50 2230-2449 = 5.00 2750-2999 = 6.00 2450-2669 = 5.50
2670-2889 = 6.002890-3109 = 6.503110-3329 = 7.003330-3549 = 7.503550-3769 = 8.003770-3989 = 8.50(3990 & over =
(2000 & over = additional 0.5 counselor for each additional 250 students)
(3000 & over = additional 0.5 counselor for each additional 250 students)
additional 0.5 counselor for each 220 additional students)One per school.Schools with an enrollment exceeding 1,000 earn one additional media specialist.
School enrollment: School enrollment: School enrollment: 1 - 949 = 1.0 AP 1 - 499 = 1.0 AP 1- 649 = 0.5 AP 950 -1424 = 2.0 AP’s 500 -1249 = 2.0 AP’s 650- 999 = 1.5 AP’s 1425-1899 = 2.5 AP’s 1250 -1499 = 2.5 AP’s 1000-1249 = 2.0 AP’s 1900-2374 = 3.0 AP’s 1500 -1999 = 3.0 AP’s 1250-1624 = 3.0 AP’s 2375-2849 = 3.5 AP’s 2000 -2499 = 3.5 AP’s 1625-1874 = 3.5 AP’s
2500 -2999 = 4.0 AP’s 1875-2124 = 4.5 AP’s 2125-2374 = 5.5 AP’s 2375-2624 = 6.5 AP’s 2625-2874 = 7.5 AP’s 2875-3124 = 8.5 AP’s 3125-3374 = 9.5 AP’s 3375-3624 =10.5 AP’s
(2850 & over = additional 0.5 AP for each additional 475 students)
(3000 & over = additional 0.5 AP for each additional 500 students)
(3625 & over = additional 1.0 AP for each additional 250 students)
See point value chart See point value chart See point value chart
School Staff Allocation Formula Page 24
One per school.
Counselor
Media Specialist One per school.
Assistant Principal
One for each elementary, middle, and high school. Northbrook Center, The Bridge Program, Maxwell HS of Technology, and Oakland Meadow are allocated differently.

School Staff Allocation Formula Page 25
Category Elementary Middle HighGifted FTE divided by 18 Gifted FTE divided by 18 Gifted FTE divided by 18If the calculation is less than 1.0, the value will be rounded to 1.0.
If the calculation is less than 1.0, the value will be rounded to 1.0.
If the calculation is less than 1.0, the value will be rounded to 1.0.
One Strings teacher for every 138 students
School enrollment < 500 = .50 point for Band.
School enrollment between 500 and 900 = 1.00 point for Band.Above 900 enrollment, schools are expected to use the "extra" points for Band.
In-School Suspension Teacher n/a One In-School Suspension Teacher per middle school.
One In-School Suspension Teacher for each high school except for Maxwell HS of Technology and both GIVE Centers.
Kindergarten FTE divided by 22
See point value chartKindergarten EIP Paraprofessional Kindergarten EIP FTE divided by 18 n/a n/a
See point value chartOne per school.
See point value chartOne per school. One per school. One per school.(220 day employee) (220 day employee) (230 day employee)
See point value chart See point value chart See point value chartOffice Clerk I School enrollment:(190 day employee) for 500-1249 = 0.5counseling office 1250 & over = 1.0
See point value chartOffice Clerk III School enrollment: School enrollment: School enrollment:(210 day employee) 1 -1249 = 1.0 1250 - 2499 = 0.5 900-1449 = 0.5
1250 -2499 = 1.5 2500 - 3749 = 1.0 1450-1849 = 1.02500 -3749 = 2.0 1850-2249 = 2.0
2250-2649 = 3.0 2650-3049 = 4.0 3050-3449 = 5.0 3450-3849 = 6.0
(additional ½ clerk for each additional 1250 students) (additional ½ clerk for each additional 1250 students)
(additional clerk for each additional 400 students)
See point value chart See point value chart See point value chart
Administrative Assistant
n/a n/a
Kindergarten Paraprofessional
Computer Lab Paraprofessional n/a
Connections
n/a
n/a One Strings teacher for every 138 students enrolled.
n/a n/a
Gifted

Category Elementary Middle HighOne half-time per school. One per school. One per school.(210 days) (210 days) (230 days)
See point value chart See point value chart See point value chartMedia Clerk One per school. One per school. One per school.(190 day employee)
See point value chart See point value chart See point value chartInstructional Clerk Projected FTE for Grades Projected enrollment
(190 day employee) 4 and 5 divided by 345 (including Special Ed.) for Grades 6-8 divided by 345
See point value chart See point value chart
Student Data Management Clerk(230 day employee)School Health Worker(190 days)
Type I Intervention Free & Extra (Socio-Economic) Reduced: Points:
30-40% 0.2541-50% 0.5051-60% 0.7561-70% 1.0071-80% 1.2581-90% 1.5091-100% 1.75
Type II Intervention(Student Mobility) Rate: Points:
26-35% 0.5036-45% 1.0046-55% 1.50 56-65% 2.0066-75% 2.5076-85% 3.00 86-95% 3.50 96% + 4.00
School Staff Allocation Formula Page 26
One for each school except Northbrook Center and Oakland Meadow. They are allocated differently.
5- 9 transition students 0.50 point 10-14 transition students 0.75 point 15-18 transition students 1.00 point
(above 23: additional 0.25 point per 5 students)
Transition Intervention
Bookkeeper
1- 4 transition students 0.25 point
See point value chartPoints allotted based on 50% of each elementary and middle school’s previous year Gateway “failure” rate for grade 4 or 7 according to the following schedule:
n/a
n/a
One for each school except Oakland Meadow which is allocated differently.
to Total School Enrollment for thetime period between Labor Day and Spring Break.(Does not include Northbrook Center, both GIVE Centers, Maxwell HS of Technology,
Mobility Extra For all levels calculate mobility as the
Calculate Free & Reduced percentage as the average of all elementary schools in the cluster. Use same allocation table as used for elementary additional points. Base calculation on October data from prior year. (Does not include Northbrook Center, The Bridge Program, both GIVE Centers, Maxwell HS of Technology, Phoenix HS, and Oakland Meadow.)
ratio of Total Entries and Withdrawals
See point value chart
19-23 transition students 1.25 point
Oakland Meadow, and Phoenix HS.)

School Staff Allocation Formula Page 27
Category Elementary Middle HighType IV Intervention(Special EducationSelf Contained Units)
11+ 1.00
K-5 6-8 9-12
FTE divided by 13 FTE divided by 16 FTE divided by 20K-5 6-8 9-12
State Maximum Class Size 7 State Maximum Class Size 7 State Maximum Class Size 7Max No. segments/day with 5 classes 35 Max No. segments/day with 5 classes 35 Max No. segments/day with 5 classes 351:30 Segments 1:35 Segments 1:35 Segments
Gwinnett InterVention Education Centers (GIVE) Regular Education Teachers
Stellar Substitutes
Reading Recovery K-5 6-8 9-12
0.50 points per ES N/A N/A
One stellar substitute position.(Includes Northbrook Center, The Bridge Program, both GIVE Centers, Maxwell, and Oakland Meadow.)
5 - 7 0.25
2. Clerical staff may be employed in combinations of office clerk, counseling clerk, or media clerk to meet SACS standards.
End Notes
(Does not include Northbrook Center, The Bridge Program, both GIVE Centers, Maxwell HS of Technology, and Oakland Meadow.)
Number Sp Ed Extra Self Contained Units: Points:
English to Speakers of Other Languages (ESOL)
Results Based Evaluation System (RBES) Single year benefit of 1.0 teacher point or monetary equivalent or combination of the two. Measured by RBES.
1. With the approval of the appropriate Human Resources Director, principals may make decisions about staffing provided SACS and state standards are met. The total staff employed at a school may not exceed the total point value represented by the school’s allotment.
One additional teacher point allotted when regular education student/teacher ratio exceeds 15/1
Interrelated Resource
Speech and Language Pathologist State Maximum Caseload 551:35 Caseload Pre-K1:45 Caseload K-12
8-10 0.50

Position Point Value
Assistant Principal - Elementary 1.25
Assistant Principal - Middle/High 1.50
Associate Principal - Elementary 1.35
Associate Principal - Middle/High 1.60
School Business Manager - Elementary 1.30
School Business Manager - Middle/High 1.55
Media Specialist 1.00
School Counselor 1.00
Classroom Teacher 1.00
JROTC Instructor 0.75
Local School Technology Coordinator 1.00
Paraprofessional - 190 days 0.50
Administrative Assistant 0.70
Elementary and Middle School - 220 days
Administrative Assistant 0.75
High School - 230 days
Bookkeeper, Elementary - 210 day - half-time 0.30
Bookkeeper, Middle - 210 days 0.60
Bookkeeper, High - 230 days 0.75
Clerk IV - 220 days 0.55
Clerk III - 210 days 0.50
Clerk II - 200 days 0.45
Clerk I - 190 days 0.40
Counseling Clerk
Instructional Clerk
Media Clerk
Student Data Management Clerk - 230 days 0.65
School Health Worker - 190 days 0.40
Position Point Value
Assistant Principal Title I - Elementary Schools Only 1.25
Assistant Principal Title I - Middle/High Schools Only 1.50
Administrative Intern 1.00
Parent Instructional Support Coordinator - Title I Schools Only 1.00
Parent Liaison - Title III Schools Only 0.50
School Staff Point Value Page 28
School Staff Point Values
Non-Allocated Positions

Budgeted Downloaded Funds to Local Schools Page 29
Elementary Schools Middle Schools High Schools
Per Pupil Allotment Per Pupil Allotment Per Pupil Allotment $45.00 per student per school with 0-24% F/RP lunch $46.00 per student per school with 0-24% F/RP lunch $50.00 per student per school with 0-24% F/RP lunch $46.00 per student per school with 25-50% F/RP lunch $47.00 per student per school with 25-50% F/RP lunch $51.00 per student per school with 25-50% F/RP lunch $47.00 per student per school with 51-100% F/RP lunch $48.00 per student per school with 51-100% F/RP lunch $52.00 per student per school with 51-100% F/RP lunch
Principal Discretionary Download Principal Discretionary Download Principal Discretionary Download $10.00 per student @ FY20 projected enrollment. $12.25 per student @ FY20 projected enrollment. $12.25 per student @ FY20 projected enrollment.
ESOL Supplies ESOL Supplies ESOL Supplies $8.50 per ESOL student segment ($400 minimum) $8.50 per ESOL student segment ($400 minimum) $8.50 per ESOL student segment ($400 minimum)
Gifted Supplies Gifted Supplies Gifted Supplies $3.75 per gifted student $3.50 per gifted student $3.00 per gifted student
Summer Staff Resources Summer Staff Resources Summer Staff Resources$3.38 per student per school @ FY21 projected enrollment $5.35 per student per school @ FY21 projected enrollment $8.33 per student per school @ FY21 projected enrollment
Textbooks & Property Inventory Management Textbooks & Property Inventory Management Textbooks & Property Inventory Management Funds allocated by school @ FY20 projected enrollment. Funds allocated by school @ FY20 projected enrollment. Funds allocated by school @ FY20 projected enrollment.
Staff Development Staff Development Staff Development $4.12 per student per school for substitutes for inservice $4.12 per student per school for substitutes for inservice $4.12 per student per school for substitutes for inservice and staff development activities (plus benefits) and staff development activities (plus benefits) and staff development activities (plus benefits)
Telephone Telephone Telephone Funds allocated by school. Amount determined by Funds allocated by school. Amount determined by Funds allocated by school. Amount determined by type of school, square footage, enrollment, and number type of school, square footage, enrollment, and number type of school, square footage, enrollment, and number of trailers. of trailers. of trailers.
Custodial Supplies Custodial Supplies Custodial Supplies $6.78 per student plus $0.015 per square foot @ $6.78 per student plus $0.015 per square foot @ $6.78 per student plus $0.015 per square foot @ FY20 projected enrollment. FY20 projected enrollment. FY20 projected enrollment.
Custodial Point Conversions Custodial Point Conversions Custodial Point Conversions Each school may convert up to 1.5 custodial points Each school may convert up to 1.5 custodial points Each school may convert up to 1.5 custodial points for download for download for download
Trailer Allotment Trailer Allotment Trailer Allotment $30 per month per single trailer $30 per month per single trailer $30 per month per single trailer $50 per month per double trailer $50 per month per double trailer $50 per month per double trailer
Math Supplies Math Supplies Math Supplies $2.44 per student for math consumable supplies $4.00 per student for math consumable supplies $4.00 per student for math consumable supplies
Science Supplies Science Supplies Science Supplies $4.08 per student for science consumable supplies $5.02 per student for science consumable supplies $7.31 per student for science consumable supplies
In-house Printing In-house Printing In-house Printing $0.85 per student per school for printing of progress reports $0.85 per student per school for printing of progress reports $0.85 per student per school for printing of progress reports

Elementary Schools Middle Schools High Schools
International Baccalaureate International Baccalaureate International Baccalaureate Allocated per participating school. Allocated per participating school. Allocated per participating school.
Intrepretation Services Intrepretation Services Intrepretation Services $22.00 per ELL & PHLOTE. $22.00 per ELL & PHLOTE. $22.00 per ELL & PHLOTE.
Special Education Supplies Special Education Supplies Special Education Supplies $300 per Special Ed teacher per school $300 per Special Ed teacher per school $300 per Special Ed teacher per school
Special Entity ES Operating Expenses E-STEAM Academy Special Entity HS Operating Expenses Operating expenses for Oakland $15,000 for Pinckneyville and Summerour MS Operating expenses for Maxwell, Grayson Tech,
GIVE Center East & GIVE Center West, Online Campus, International Transition Center The Bridge Program, Northbrook Center
Early Childhood Program Supplies (Pre-K) Advisement Advisement $500 per facility based teacher $500 per school for materials & supplies $500 per school for materials & supplies $300 per SLP $1,500 per Assessment Team Instrument Repair Instrument Repair
$3,200 per school for repair of GCPS owned $3,200 per school for repair of GCPS owned band & orchestra instrument band & orchestra instrument
Language Arts Supplies Intervention Intervention $500 per school for penmanship program supplies $2600 per school with 0-24% F/RP lunch $2600 per school with 0-24% F/RP lunch
$3000 per school with 25-50% F/RP lunch $3000 per school with 25-50% F/RP lunchKindergarten/Readiness Supplies $3400 per school with 51-100% F/RP lunch $3400 per school with 51-100% F/RP lunch $150 for replacement/consumables per K/R class $100 for consumables per new K/R Class After School Detention Other Supplies
$3,900 per school $8.10 per HS senior per school for diplomas and sealsEIP Supplies $4 per EIP student for reading/math materials Substitutes - GHSA
$1 per HS student per schoolEIP Program Support $500 per school for state mandated support programs Activity Bus Driver
$10,549 per High School - stipends for activity bus drivers to be used for all schools within each cluster
Vertical Teams in Gwinnett $4,500 plus benefits per High School Cluster. Application approval required. Download to Host School.
One-time allocations for new schools:
Supplies per new elementary school: Supplies per new middle school: Supplies per new high school:Counselor/Guidance materials - $1,700 Counselor/Guidance materials - $1,700 Counselor/Guidance materials - $1,700Gifted materials - $1,000 Gifted materials - $1,000 Gifted materials - $1,000Language Arts materials - $15,000 Language Arts materials - $15,000 Language Arts materials - $15,000Math materials - $2,000 Math materials - $2,000 Math materials - $2,000School-wide supplies - $5,000 School-wide supplies - $5,000 School-wide supplies - $5,000Science materials - $3,500 Science materials - $8,000 Science materials - $16,000
Budgeted Downloaded Funds to Local Schools Page 30

FY2020 Proposed Teacher Salary Schedule Page 31
Performance Step
L‐1 L‐2 L‐3 L‐4
0 46,646 51,776 56,282 61,9801 47,504 52,800 57,493 63,3202 48,362 53,824 58,704 64,6603 49,220 54,848 59,915 66,0004 50,078 55,872 61,126 67,3405 50,936 56,896 62,337 68,6806 51,794 57,920 63,548 70,0207 52,652 58,944 64,759 71,3608 53,510 59,968 65,970 72,7009 54,368 60,992 67,181 74,04010 55,226 62,016 68,392 75,38011 56,084 63,040 69,603 76,72012 56,942 64,064 70,814 78,06013 57,800 65,088 72,025 79,40014 58,658 66,112 73,236 80,74015 59,516 67,136 74,447 82,08016 60,374 68,160 75,658 83,42017 61,232 69,184 76,869 84,76018 62,090 70,208 78,080 86,10019 62,948 71,232 79,291 87,44020 63,806 72,256 80,502 88,78021 64,664 73,280 81,713 90,12022 65,522 74,304 82,924 91,46023 66,380 75,328 84,135 92,80024 67,238 76,352 85,346 94,14025 68,096 77,376 86,557 95,48026 68,954 78,400 87,768 96,82027 69,812 79,424 88,979 98,16028 70,670 80,448 90,190 99,500

Gwinnett County Public Schools Total Budget
FY2020 Public Budget Document


Page 32
(all figures in the table below are in millions)
Local: State: Federal $ 1,064.5 School Food Grants $ 66.8
Operations $ 670.6 2.4 PreK - 12 Grants 87.1 Debt Service 62.1 5.6 Post Secondary 1.2
SPLOST 155.6 Total $ 1,072.5 Total $ 155.1 Interest Income 9.2 School Food Sales 26.8 Local School Income 22.5 Other Local Revenue 44.4
Total $ 991.2
FY2020 Budget: Total Revenue
School Food Grants:PreK - 12 Grants
Property Taxes: QBE Revenue:
Total Revenue $2,218.8 Million
Local 44.7%
$991.2 Million
State48.3%
$1,072.5 Million
Federal7.0%
$155.1 Million

Page 33FY2020 Budget: Total Expenditures
Total Expenditures $2,319.1 Million
Other Operating Costs12.1%
$280.5 MillionDebt Service
7.6%$177.2 Million
Capital Outlay6.2%
$144.8 Million
Salaries & Benefits74.1%
$1,716.6 Million

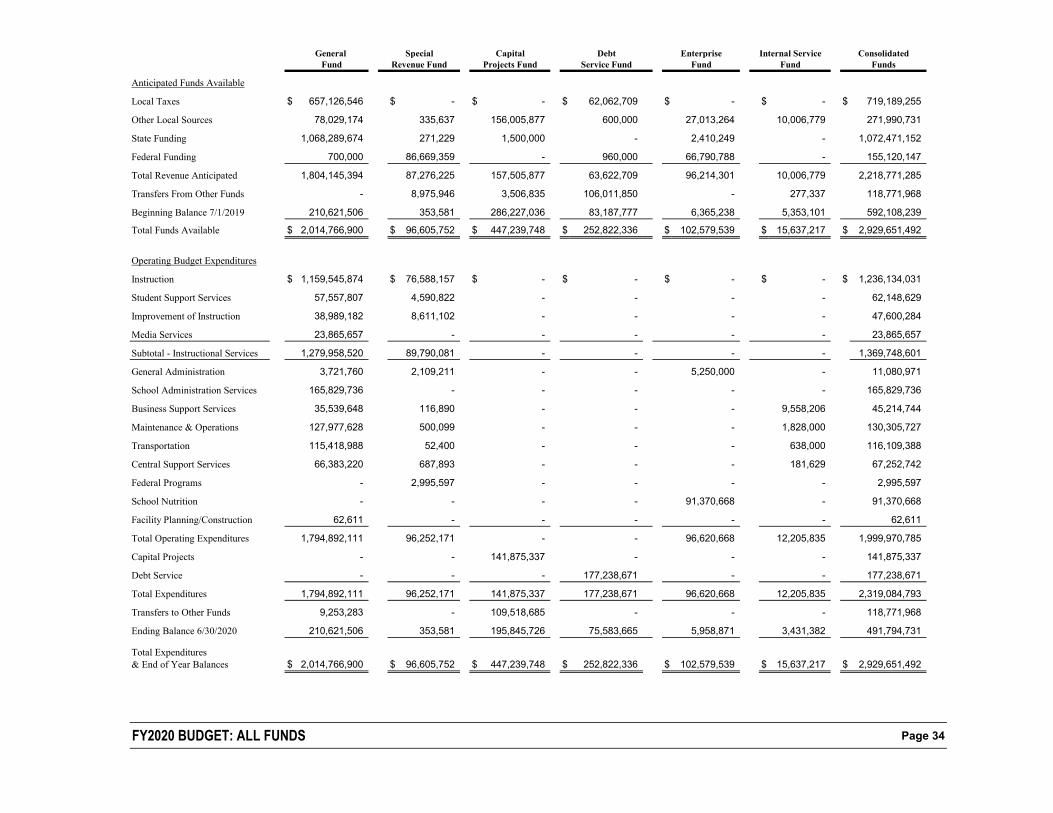
General Special Capital Debt Enterprise Internal Service Consolidated Fund Revenue Fund Projects Fund Service Fund Fund Fund Funds
Anticipated Funds Available
Local Taxes $ 657,126,546 $ - $ - $ 62,062,709 $ - $ - $ 719,189,255
Other Local Sources 78,029,174 335,637 156,005,877 600,000 27,013,264 10,006,779 271,990,731
State Funding 1,068,289,674 271,229 1,500,000 - 2,410,249 - 1,072,471,152
Federal Funding 700,000 86,669,359 - 960,000 66,790,788 - 155,120,147
Total Revenue Anticipated 1,804,145,394 87,276,225 157,505,877 63,622,709 96,214,301 10,006,779 2,218,771,285
Transfers From Other Funds - 8,975,946 3,506,835 106,011,850 - 277,337 118,771,968
Beginning Balance 7/1/2019 210,621,506 353,581 286,227,036 83,187,777 6,365,238 5,353,101 592,108,239
Total Funds Available $ 2,014,766,900 $ 96,605,752 $ 447,239,748 $ 252,822,336 $ 102,579,539 $ 15,637,217 $ 2,929,651,492
Operating Budget Expenditures
Instruction $ 1,159,545,874 $ 76,588,157 $ - $ - $ - $ - $ 1,236,134,031
Student Support Services 57,557,807 4,590,822 - - - - 62,148,629
Improvement of Instruction 38,989,182 8,611,102 - - - - 47,600,284
Media Services 23,865,657 - - - - - 23,865,657
Subtotal - Instructional Services 1,279,958,520 89,790,081 - - - - 1,369,748,601
General Administration 3,721,760 2,109,211 - - 5,250,000 - 11,080,971
School Administration Services 165,829,736 - - - - - 165,829,736
Business Support Services 35,539,648 116,890 - - - 9,558,206 45,214,744
Maintenance & Operations 127,977,628 500,099 - - - 1,828,000 130,305,727
Transportation 115,418,988 52,400 - - - 638,000 116,109,388
Central Support Services 66,383,220 687,893 - - - 181,629 67,252,742
Federal Programs - 2,995,597 - - - - 2,995,597
School Nutrition - - - - 91,370,668 - 91,370,668
Facility Planning/Construction 62,611 - - - - - 62,611
Total Operating Expenditures 1,794,892,111 96,252,171 - - 96,620,668 12,205,835 1,999,970,785
Capital Projects - - 141,875,337 - - - 141,875,337
Debt Service - - - 177,238,671 - - 177,238,671
Total Expenditures 1,794,892,111 96,252,171 141,875,337 177,238,671 96,620,668 12,205,835 2,319,084,793
Transfers to Other Funds 9,253,283 - 109,518,685 - - - 118,771,968
Ending Balance 6/30/2020 210,621,506 353,581 195,845,726 75,583,665 5,958,871 3,431,382 491,794,731
Total Expenditures& End of Year Balances $ 2,014,766,900 $ 96,605,752 $ 447,239,748 $ 252,822,336 $ 102,579,539 $ 15,637,217 $ 2,929,651,492
FY2020 BUDGET: ALL FUNDS Page 34


Gwinnett County Public Schools General Fund
FY2020 Public Budget Document


Page 35General Fund Revenue
Total General Fund Revenue $1,804.1 Million
State Funds$1,068.3 Million
59.2%
Local Taxes$657.1Million36.4%
Other Local Sources$78.0 Million
4.3%
Federal Funds$0.7 Million
0.1%

Page 36General Fund Expenditures
Total General Fund Expenditures $1,794.9 Million
Salaries & Benefits$1,596.9 Million
89.0%
Other Operating Costs$195.1 Million
10.9%
Capital Outlay$2.9 Million
.1%

General Fund: Revenue per Student Page 37
$0
$2,000
$4,000
$6,000
$8,000
$10,000
$12,000
FY2015
$8,019
FY2016
$8,500
FY2017
$8,734
FY2018
$9,340
FY2019
$9,587
FY2020
$10,012
$3,296 $3,384 $3,592 $3,850 $3,912 $4,080
$4,720 $5,113 $5,138 $5,486 $5,672
$5,928
$3 $3 $4
$4 $3 $4
Local State Federal
Total Revenue per Student

General Fund: History of Revenue Funding Page 38
0.00%
10.00%
20.00%
30.00%
40.00%
50.00%
60.00%
70.00%
FY2015 FY2016 FY2017 FY2018 FY2019 FY2020
41.10%
39.81%
41.13%
41.22%
40.81%
40.75%
58.86%
60.15%
58.83%
58.74%
59.16%
59.21%
0.04
%
0.04
%
0.04
%
0.04
%
0.03
%
0.04
%
Fiscal Year
LOCAL STATE FEDERAL

General Fund: FY2020 Projected Ending Unassigned Fund Balance Page 39
$0.0
$100.0
$200.0
$300.0
$400.0
$500.0
$600.0
$152.4 $120.8 $105.8
$549.5 $522.6
$469.5
$422.9
$363.2
$310.3
$255.7 $239.7 $210.6 (M
illions)

( $ in millions)FY2015Actual
FY2016Actual
FY2017Actual
FY2018Actual
FY2019Budget
FY2020Budget
Revenue $1,389.2 $1,496.3 $1,556.5 $1,674.5 $1,723.4 $1,804.1Expenditure & Transfers $1,353.3 $1,452.4 $1,508.6 $1,618.1 $1,742.0 $1,804.1Unassigned Fund Balance $125.9 $147.8 $174.2 $212.6 $210.6 $210.6
Fund Balance as a percentage of Expenditures & Transfers: 9.3% 10.2% 11.6% 13.1% 12.1% 11.7%
General Fund: Fund Balance as a Percentage of Expenditures and Transfers Out Page 40
$0.0
$200.0
$400.0
$600.0
$800.0
$1,000.0
$1,200.0
$1,400.0
$1,600.0
$1,800.0
$2,000.0
FY2015Actual
FY2016Actual
FY2017Actual
FY2018Actual
FY2019Budget
FY2020Budget
Millions
Revenue Expenditure & Transfers Unassigned Fund Balance

Page 41General Fund: Expenditures by Function
Instructional Services
71.3%
School Administration 9.2%
Business Support & General Administration
2.3%
Maintenance & Operations
7.1%Transportation 6.4%Central Support
Services 3.7%

Instruction 64.7% 64.0% 63.4% 63.1% 63.6% 64.6%
Student Support Services 3.2% 3.7% 3.7% 3.2% 3.3% 3.2%
Improvement of Instructional Services 2.1% 2.1% 2.2% 2.2% 2.3% 2.2%
Educational Media Services 1.4% 1.4% 1.4% 1.4% 1.3% 1.3%
Subtotal - Instructional Services 71.4% 71.2% 70.7% 69.9% 70.5% 71.3%
General Administration 0.20% 0.20% 0.20% 0.30% 0.20% 0.20%
School Administration 8.70% 8.70% 8.70% 9.70% 9.50% 9.20%
Business Support Services 2.40% 2.20% 2.20% 2.10% 2.10% 2.10%
Maintenance and Operations 7.40% 7.40% 7.40% 7.20% 7.20% 7.10%
Transportation 6.70% 6.60% 6.80% 6.90% 6.60% 6.40%
Central Support Services 3.20% 3.70% 4.00% 3.90% 3.90% 3.70%
Facility Planning/Construction 0.00% 0.00% 0.00% 0.00% 0.00% 0.00%
Total Operating Expenditures 100.00% 100.00% 100.00% 100.00% 100.00% 100.00%
Page 42General Fund: Expenditures by Function
ActualFY2019Budget
FY2020Budget
FY2015Actual
FY2016Actual
FY2017Actual
FY2018

Page 43
Local Revenue: Ad Valorem Taxes $ 505,200,867 $ 524,094,045 $ 564,010,065 $ 606,846,041 $ 629,431,785 $ 657,126,546 Other Taxes 11,722,609 14,183,721 15,377,606 15,630,107 13,500,000 13,500,000 Interest Income 280,083 560,473 1,465,605 4,360,217 4,000,000 8,000,000 Summer School Tuition / Online Campus 2,949,910 2,278,898 1,945,716 2,504,296 2,150,000 2,150,000 Local School Reimburseables 21,966,222 24,314,694 25,722,542 27,645,827 22,500,000 22,500,000 Other Local Revenue 28,821,580 30,247,228 31,585,408 33,209,005 31,715,388 31,879,174
Subtotal - Local Revenue 570,941,271 595,679,059 640,106,942 690,195,493 703,297,173 735,155,720
State & Federal Revenue:QBE 945,931,735 972,547,270 989,052,234 1,050,038,190 1,076,938,847 1,135,747,418 Five Mill Buy In (134,883,313) (128,902,862) (143,715,830) (147,222,346) (156,020,906) (166,783,490) State Categorical Grants 8,387,414 8,480,463 8,760,169 8,977,429 9,163,890 9,163,890 Equalization Grant 69,078,801 88,818,100 69,393,703 82,790,008 81,976,604 86,376,604 Formula Adjustment (Austerity) (76,823,626) (48,658,493) (17,479,851) (17,522,030) - - Other Dept. of Ed. Grants 6,042,933 6,983,449 9,714,814 6,469,758 7,494,323 3,744,752 Funds from Other State Agencies 1,500 800,736 - 3,193 40,500 40,500 Federal Grants 519,696 554,728 626,696 785,845 500,000 700,000
Subtotal - State & Federal Revenue 818,255,140 900,623,391 916,351,935 984,320,047 1,020,093,258 1,068,989,674
Total Revenue Anticipated 1,389,196,411 1,496,302,450 1,556,458,877 1,674,515,540 1,723,390,431 1,804,145,394
Beginning Unassigned Fund Balance - July 1* 110,529,691 125,100,150 146,130,711 175,731,315 229,277,549 210,621,506
Assigned Fund Balances 27,932,525 49,269,958 72,112,639 90,344,102 - -
Total Funds Available $ 1,527,658,627 $ 1,670,672,558 $ 1,774,702,227 $ 1,940,590,957 $ 1,952,667,980 $ 2,014,766,900
* Beginning balance for FY2020 is projected
Budget BudgetActual Actual Actual ActualFY2018 FY2019 FY2020
General Fund: Summary of Revenues and Expenditures
FY2015 FY2016 FY2017

Operating Budget Expenditures:
Instruction $ 870,084,628 $ 922,160,668 $ 949,213,580 $ 1,009,767,042 $ 1,101,164,838 $ 1,159,545,874 Student Support Services 43,255,984 53,251,328 55,029,574 51,399,313 57,533,786 57,557,807 Improvement of Instructional Services 27,693,016 30,234,417 33,612,834 34,500,128 40,159,313 38,989,182 Educational Media Services 19,292,212 20,100,790 20,588,531 21,607,247 23,204,527 23,865,657 General Administration 2,711,673 3,253,126 2,980,771 4,522,510 3,759,197 3,721,760 School Administration 116,115,904 124,418,443 130,643,154 155,782,065 163,709,347 165,829,736 Business Support Services 32,216,259 32,356,373 32,645,002 33,327,545 35,433,497 35,539,648 Maintenance and Operations 99,827,117 106,034,849 110,292,653 114,758,971 123,036,498 127,977,628 Transportation 90,059,209 95,765,280 103,005,222 111,821,184 115,027,843 115,418,988 Central Support Services 43,573,033 53,012,943 59,201,218 62,631,500 67,587,303 66,383,220 Facility Planning/Construction 39,203 - - 13,318 111,293 62,611 Total Operating Expenditures 1,344,868,238 1,440,588,217 1,497,212,539 1,600,130,823 1,730,727,442 1,794,892,111
Transfers to Other Funds 8,420,281 11,840,991 11,414,270 17,932,020 11,319,032 9,253,283
Ending Unassigned Fund Balance - June 30** 125,881,898 147,838,305 174,234,080 212,599,410 210,621,506 210,621,506
Assigned Fund Balances 48,488,210 70,405,045 91,841,338 109,928,704 - -
Total Expenditures & End of Year Balance $ 1,527,658,627 $ 1,670,672,558 $ 1,774,702,227 $ 1,940,590,957 $ 1,952,667,980 $ 2,014,766,900
** Ending balance for FY2019 is budgeted as of December 2018.
Page 44General Fund: Summary of Revenues and Expenditures
ActualFY2019Budget
FY2015 FY2016 FY2017 FY2018 FY2020BudgetActual Actual Actual

Positions by Function Page 45
Budgeted Positions: FY2015 FY2016 FY2017 FY2018 FY2019 FY2020
Teachers 10,117.46 10,389.17 10,535.34 10,668.20 10,817.83 10,870.91
Certified Substitutes 135.00 133.00 129.00 144.00 144.00 145.00
Parapros 862.41 835.89 852.90 870.98 892.89 906.03
Interpreters 27.00 25.00 24.00 26.00 27.00 27.00
Technology Specialists 241.79 255.43 264.29 271.26 283.76 284.76
Counselors 319.93 331.59 343.19 356.04 360.13 361.80
Total 11,703.59 11,970.08 12,148.72 12,336.48 12,525.61 12,595.50
Instruction
The Instruction function includes activities dealing directly with the interaction between teachers and students. Teaching may be provided for students in a school classroom, in another location such as a home or hospital and in other learning situations. It may also be provided through some other approved medium such as television, radio, telephone and correspondence. Included here are the activities of aides or paraprofessionals, who assist in the instructional process. The Instruction function includes all K - 12 programs, both regular and special education, as well as programs for gifted students. Each student in Gwinnett County Public Schools is offered a curriculum rich in basic academics - language arts, math, science, etc. - which includes physical education, fine arts, foreign language and technical education.
School counselors work to meet the needs of all of Gwinnett's students. Last school year, counselors conducted 38,557 classroom guidance lessons which focused on academics, career exploration and life skills. Counselors also supported students in 5,256 crisis responses system-wide such as physical and sexual abuse, neglect and suicide ideation.
In FY2020, the average GCPS teacher will hold a Masters degree or higher advanced degree, be placed on performance step thirteen, and earn $65,088 a year. With benefits, the total annual teacher compensation package will be $95,292 The change in the average teacher's total salary from FY2019 is an increase of 6.59%.

Teachers $ 553,979,487 $ 590,659,160 $ 603,800,365 $ 634,067,300 $ 662,537,676 $ 703,464,532
Substitutes, Certified & Classified 10,296,074 11,282,687 12,632,466 13,291,517 13,585,541 13,796,618
Parapros 19,944,094 20,570,458 21,145,871 22,351,442 23,631,601 25,141,223
Interpreter 1,019,177 1,034,304 1,013,444 1,092,686 1,232,836 1,399,932
Technology Specialists 14,038,561 15,186,446 15,791,357 16,612,268 17,930,101 19,023,132
Counselors 19,222,508 20,669,489 21,628,746 22,958,055 23,879,561 25,267,158
Other Salaries & Compensation 445,127 407,182 501,528 522,434 1,145,719 1,145,400
Health Insurance 105,342,957 108,817,571 112,095,210 115,728,347 116,217,844 117,020,184
Medicare 8,305,916 8,902,472 9,137,054 9,612,965 9,957,029 11,638,891
Teacher Retirement System 78,996,249 91,634,618 94,985,304 118,055,314 147,275,851 158,534,331
Worker's Compensation 3,678,666 3,296,851 3,379,994 3,552,007 3,676,650 4,013,411
Gwinnett Retirement System 26,058,531 19,530,031 21,259,116 26,496,642 40,385,226 44,324,997
Other Employee Benefits 1,914,757 1,967,094 2,004,434 2,051,045 2,070,812 2,093,277
Subtotal - Salaries & Benefits 843,242,104 893,958,363 919,374,889 986,392,022 1,063,526,447 1,126,863,086
Purchased Services 11,844,307 12,280,718 12,774,255 9,264,338 11,699,000 13,902,181
Travel 15,213 22,946 23,303 23,430 43,020 41,509
Supplies 14,702,260 15,581,632 16,078,127 13,901,701 24,993,745 18,634,906
Textbooks - 2,229 7,557 712 - -
Equipment Replacement 280,744 314,780 955,449 184,840 902,626 104,192
Subtotal - Other Charges 26,842,524 28,202,305 29,838,691 23,375,021 37,638,391 32,682,788
TOTAL $ 870,084,628 $ 922,160,668 $ 949,213,580 $ 1,009,767,043 $ 1,101,164,838 $ 1,159,545,874
Page 46Expenditures by Function Instruction
ActualActualFY2019Budget
FY2020Budget
FY2015 FY2016 FY2017 FY2018Actual Actual

Positions by Function Page 47
Budgeted Positions: FY2015 FY2016 FY2017 FY2018 FY2019 FY2020
Parapros 3.90 4.60 15.97 13.50 14.00 14.00
Secretaries 19.33 18.99 20.49 20.49 22.99 22.99
Clerical 126.64 129.21 137.70 131.41 134.94 135.94
Nurses 34.00 35.00 35.00 35.00 35.00 35.00
Therapists 66.80 70.68 70.88 72.99 73.88 73.88
Teacher Support Specialists 9.00 9.00 9.00 8.00 8.00 8.00
School Psychologist 54.00 55.12 56.12 57.12 58.12 63.12
School Social Worker 29.00 30.00 28.90 28.90 28.70 28.70
Other Management 7.49 6.49 6.98 5.98 5.98 5.98
Other Administrative 20.16 24.35 26.36 28.87 32.31 32.31
Other Salaries 2.00 3.49 3.49 3.49 3.98 3.98
Total 372.32 386.93 410.89 405.75 417.90 423.90
Student Support Services
Student Support Services staff provides health and human services for students to improve their performance in school. They serve as a supplement to the teaching process by helping to identify and remove barriers to students success. Psychologists are assigned to two to three schools which they serve on a regular schedule. Social Workers are assigned on an itinerant basis to schools at-large. In addition, nursing services are also provided on a limited basis for medically fragile students at any school. Preschool programs are designed to meet federal laws and prepare students for school. Student Support Services include both prevention and intervention activities. Also include supplemental payments for additional duties such as coaching or supervising extracurricular activities. Teachers, parents, and students receive assistance from Student Support Services staff.
Special Education teachers and support staff developed and implemented individual education plans for approximately 23,231 eligible disabled students in the 12 areas of disability where services are delivered in a wide range of settings. Related services encompassing occupational therapy, physical therapy, adaptive physical education, audiological interpreting and others were delivered, as well. Last year, school psychologists conducted 5,404 formal assessments, 15,998 informal assessments, held 30,490 conferences with teachers, participated in 6,782 SSTs and conducted 100 in-service sessions for teachers regarding interventions for at-risk students.
School social workers serve as the liaison between the home, school and the community. They provide direct services and resource support to address the academic, attendance, behavioral, and social/emotional concerns that hinder the academic success of students. This school year, school social workers will facilitate over 20,000 consultations with students, parents, district and school personnel to assess, recommend and/or implement interventions to students in need. County school nurses train, supervise and monitor school staff in performing health services required for students to attend school. They provide consultation to local school staff, school nutrition program staff, environmental services and transportation on issues related to student health and safety. County school nurses work closely with health care providers, parents, students and school staff to remove health-related barriers to learning and maximize student success. County School Nurses support 139 school clinic workers and over 41,000 students with medical conditions.

Substitutes, Certified & Classified $ 40,580 $ 83,150 $ 108,636 $ 122,010 $ 257,729 $ 257,729
Parapros 87,837 855,873 483,902 494,593 450,789 478,913
Secretaries 857,829 450,751 933,274 961,571 1,069,299 1,180,443
Clerical 3,300,267 3,455,647 3,721,765 3,663,995 3,812,147 3,982,553
Athletics Personnel 4,363,424 5,325,724 5,449,888 5,670,052 5,760,134 5,781,919
Nurses 1,165,876 1,270,324 1,071,330 1,750,256 1,987,427 2,057,627
Therapists 3,903,810 4,309,726 4,374,348 4,638,419 4,783,177 4,983,614
Teacher Support Specialists 703,932 676,516 659,170 613,420 635,933 661,909
School Psychologists 3,692,126 3,972,045 4,012,948 4,155,309 4,531,910 5,049,561
Social Workers 1,877,361 1,823,142 1,749,577 1,898,301 1,946,887 1,998,995
Other Management Personnel 670,570 756,974 683,280 644,746 684,036 700,365
Other Administrative Personnel 1,906,737 2,325,201 2,599,642 2,665,743 3,229,624 3,382,539
Other Salaries & Compensation 445,996 601,017 686,399 902,618 1,744,568 1,897,465
Health Insurance 2,519,598 2,935,598 3,283,060 3,607,543 3,856,596 4,111,007
Medicare 312,803 356,148 366,456 382,302 393,464 430,231
Teacher Retirement System 2,878,749 3,538,869 3,628,849 4,405,245 5,736,194 6,251,104
Worker's Compensation 111,741 132,688 136,793 142,007 146,093 148,471
Gwinnett Retirement System 982,088 776,049 840,043 1,028,122 1,629,342 1,702,141
Other Employee Benefits 60,980 64,568 65,727 66,323 69,516 74,711
Subtotal - Salaries & Benefits 29,882,304 33,710,010 34,855,087 37,812,575 42,724,865 45,131,297
Purchased Services 9,292,509 14,167,893 15,363,514 11,989,734 11,136,605 9,834,863
Travel 159,489 162,820 199,378 153,945 204,643 204,643
Supplies 3,889,542 5,179,226 4,439,436 1,359,005 3,441,173 2,370,504
Equipment Replacement 32,140 31,379 172,159 84,054 26,500 16,500
Subtotal - Other Charges 13,373,680 19,541,318 20,174,487 13,586,738 14,808,921 12,426,510
TOTAL $ 43,255,984 $ 53,251,328 $ 55,029,574 $ 51,399,313 $ 57,533,786 $ 57,557,807
Page 48
FY2020
Expenditures by Function Student Support Services
ActualFY2019Budget Budget
FY2015Actual
FY2016Actual Actual
FY2017 FY2018

Positions by Function Page 49
Budgeted Positions: FY2015 FY2016 FY2017 FY2018 FY2019 FY2020
Secretary 35.48 33.98 36.46 35.97 36.97 36.97
Clerical 6.00 6.00 8.00 9.00 9.00 9.00
Technology Specialist 1.00 1.00 1.00 1.00 1.00 1.00
Other Management 23.48 24.47 24.48 25.96 26.95 26.95
Other Administrative 96.75 109.77 137.81 138.32 134.12 140.12
Other Salaries 11.81 10.61 12.86 13.86 12.37 12.37
Total 174.52 185.83 220.61 224.11 220.41 226.41
Improvement of Instructional Services
Instructional Services staff provide direct support to each school covering all curriculum areas (math, science, language arts, etc.) Services provided include materials for instruction, staff development for administrators, teachers, and paraprofessionals on both academic content and teaching strategies, and program improvement design. Direct assistance is provided to schools in developing school goals and designing training activities for school staffs. These activities include curriculum development, techniques of instruction, child development and understanding, staff training and professional development. This function includes positions that focus on improvement of instructional services for Special Education handicapped students.
Professional learning activities provide opportunities for all categories of employees throughout the school system. These activities help employees improve technical job competency, instructional skills, expand their leadership skills, and increase their ability to work effectively in problem-solving teams, thus increasing student achievement. Annually, the Professional Learning Department awards PLUs (Professional Learning Units) to over 20,000 participants in system-wide and school-based professional learning activities.

Certified Substitutes $ 1,168,126 $ 1,385,544 $ 1,483,764 $ 1,569,934 $ 1,082,732 $ 583,174
Professional Dev. Stipends 2,052,564 2,018,512 2,335,894 2,238,600 2,902,497 3,007,860
Secretaries 1,512,843 1,609,466 1,669,809 1,606,994 1,767,214 1,870,645
Clerical 265,214 271,300 411,504 469,234 400,654 534,922
Technology Specialists 73,547 76,140 76,894 78,432 216,227 81,801
Other Management Personnel 3,425,412 3,613,754 3,423,567 3,712,406 4,356,659 4,380,099
Other Administrative Personnel 7,223,535 8,554,737 9,636,203 10,020,359 11,426,970 11,731,344
Other Salaries & Compensation 2,158,938 2,334,796 2,444,195 2,485,655 3,222,343 3,006,375
Health Insurance 1,329,805 1,508,811 1,666,673 1,797,224 1,945,452 2,090,714
Medicare 244,975 276,878 302,181 311,225 294,382 300,045
Teacher Retirement System 1,627,928 1,979,103 2,083,233 2,612,058 3,866,303 3,986,224
Worker's Compensation 87,374 101,183 109,659 113,032 106,165 103,564
Gwinnett Retirement System 704,416 536,321 594,801 718,459 1,207,238 1,164,777
Other Employee Benefits 26,572 29,904 32,165 33,558 36,788 39,853
Subtotal - Salaries & Benefits 21,901,249 24,296,449 26,270,542 27,767,170 32,831,624 32,881,397
Purchased Services 3,065,252 3,233,859 3,867,089 3,366,971 3,778,099 3,435,149
Travel 751,646 966,646 1,524,625 1,225,569 909,827 634,217
Supplies 1,945,334 1,693,534 1,859,642 1,979,300 2,576,663 1,975,319
Equipment Replacement 29,535 43,929 90,936 161,118 63,100 63,100
Subtotal - Other Charges 5,791,767 5,937,968 7,342,292 6,732,958 7,327,689 6,107,785
TOTAL $ 27,693,016 $ 30,234,417 $ 33,612,834 $ 34,500,128 $ 40,159,313 $ 38,989,182
Page 50Expenditures by Function Improvement of Instructional Services
ActualFY2019Budget
FY2020Budget
FY2015Actual
FY2016Actual
FY2017Actual
FY2018

Positions by Function Page 51
Budgeted Positions: FY2015 FY2016 FY2017 FY2018 FY2019 FY2020
Secretary 3.40 3.49 3.49 3.49 3.00 3.00
Clerical 104.29 103.38 104.36 101.93 97.79 98.79
Media Specialist 130.49 131.21 135.98 136.42 136.93 137.93
Other Management 2.00 2.00 2.00 2.00 2.00 2.00
Other Administrative 2.00 2.00 2.00 2.00 3.00 3.00
Other Salaries 8.75 9.24 10.49 10.49 11.49 11.49
Total 250.93 251.32 258.32 256.33 254.21 256.21
Educational Media Services
Media Services and Technology Training staff provides leadership and support for school library media programs, allowing students access to print, nonprint and online reference resources which are essential to teaching and learning. A professional library offers access to resources for all GCPS teachers, administrators and staff. Professional learning opportunities are provided for media specialists, media clerks and local school technology coordinators to support the instructional program by collaborating with teachers in the effective use of resources and technology. The staff also coordinates and delivers technology training for systemwide initiatives such as SASI, Peoplesoft, and Microsoft Office. The Broadcast & Distance Learning staff effectively facilitates the rapidly expanding and diverse communication needs of our school system. Our focus is on providing information resources designed to advance teaching and learning. Our capabilities and services include field, studio, and live video production video conferencing, satellite down-links, closed circuit television systems and a 24/7 educational access channel. These vital communication tools enable us to help students acquire knowledge and achieve their academic goals.
The focus of Gwinnett's instructional media and technology program is on student achievement with an emphasis on students becoming life-long learners. Media specialists and local school technology coordinators are professionals who interpret user needs and provide personalized services in appropriate resources to the students, faculty and learning community. Gwinnett County district and school media staff are committed to the continuous improvement of media and instructional technology services. One component of our mission is to educate and inform the community about the goals, programs and services of GCPS. We are positioned to meet these goals through our educational access station, GCPS TV, which reaches Gwinnett County residents and schools through the four local cable providers.

Substitutes, Certified & Classified $ 173,820 $ 193,035 $ 181,894 $ 199,277 $ 219,995 $ 219,995
Secretaries 154,694 151,873 142,728 145,584 148,860 151,837
Clerical 2,687,048 2,792,449 2,822,898 2,797,091 2,845,859 2,973,877
Media Specialists 7,721,755 8,209,929 8,609,841 8,859,300 9,283,482 9,920,399
Other Management Personnel 223,111 232,595 236,546 210,340 248,446 253,415
Other Administrative Personnel 183,610 199,342 200,572 228,714 311,899 327,017
Other Salaries & Compensation 623,814 657,928 748,784 822,701 881,260 917,041
Health Insurance 1,825,965 1,992,463 2,237,292 2,351,472 2,374,025 2,413,115
Medicare 155,685 165,759 173,622 177,437 184,023 210,793
Teacher Retirement System 1,508,465 1,716,612 1,820,513 2,205,949 2,831,749 3,029,138
Worker's Compensation 55,770 62,065 64,695 66,197 68,534 72,686
Gwinnett Retirement System 495,106 366,881 407,796 496,334 755,038 813,570
Other Employee Benefits 37,776 39,009 41,271 41,345 41,385 42,235
Subtotal - Salaries & Benefits 15,846,619 16,779,940 17,688,452 18,601,741 20,194,555 21,345,118
Purchased Services 1,576,652 1,634,986 1,614,137 1,460,473 1,590,276 1,391,704
Travel 13,632 17,775 31,916 28,372 22,575 23,575
Supplies 1,844,530 1,653,609 1,239,625 1,498,465 1,397,121 1,105,260
Equipment Replacement 10,779 14,480 14,401 18,196 - -
Subtotal - Other Charges 3,445,593 3,320,850 2,900,079 3,005,506 3,009,972 2,520,539
TOTAL $ 19,292,212 $ 20,100,790 $ 20,588,531 $ 21,607,247 $ 23,204,527 $ 23,865,657
Page 52
ActualFY2017Actual
FY2018
Expenditures by Function Educational Media Services
ActualFY2019Budget
FY2020Budget
FY2015Actual
FY2016

Positions by Function Page 53
Budgeted Positions: FY2015 FY2016 FY2017 FY2018 FY2019 FY2020
Superintendent 1.00 1.00 1.00 1.00 1.00 1.00
Executive Staff 2.00 2.00 2.00 2.00 2.00 2.00
Secretary 5.00 5.00 5.00 5.00 5.00 5.00
Other Salaries 0.49 0.49 0.98 0.98 1.47 1.47
Total 8.49 8.49 8.98 8.98 9.47 9.47
General Administration
This function includes costs of supporting activities of the Superintendent, Chief of Staff, Executive Director to the Superintendent, legal counsel, and members of the Gwinnett County Board of Education. Some intergovernmental contracts are also accounted for in this function.
All matters relating to education and operation in the Gwinnett County Public Schools are governed and controlled by the Gwinnett County Board of Education, as provided by Georgia Law. The Board has the responsibility to maintain a reasonably uniform system of public schools that provide quality education for all of the young people of Gwinnett County. With the advice of the Superintendent, the Board must determine policies and prescribe the rules and regulations for the management of the school system.

School Board Members $ 82,620 $ 82,620 $ 82,620 $ 84,664 $ 86,708 $ 86,708
Superintendent 410,581 423,808 536,042 549,862 606,000 645,935
Executive Staff 325,066 336,525 339,857 346,654 354,454 361,543
Secretaries 266,480 276,543 277,128 277,115 296,037 301,958
Other Salaries & Compensation 85,864 88,010 158,157 230,213 266,573 271,905
Health Insurance 83,649 88,680 99,478 104,341 104,276 85,892
Medicare 10,399 10,717 11,771 13,064 14,088 22,552
Teacher Retirement System 124,651 139,960 154,437 185,155 300,923 223,506
Worker's Compensation 5,509 5,877 6,759 7,232 7,642 7,778
Gwinnett Retirement System 42,997 30,333 35,464 41,740 79,047 81,215
Other Employee Benefits 2,034 2,110 1,855 1,844 1,987 1,306
Subtotal - Salaries & Benefits 1,439,850 1,485,183 1,703,568 1,841,884 2,117,735 2,090,298
Purchased Services 1,224,031 1,722,307 1,237,101 2,638,569 1,589,000 1,581,412
Travel 36,154 36,400 27,518 27,076 33,212 31,250
Supplies 11,638 9,236 12,584 14,981 19,250 18,800
Subtotal - Other Charges 1,271,823 1,767,943 1,277,203 2,680,626 1,641,462 1,631,462
TOTAL $ 2,711,673 $ 3,253,126 $ 2,980,771 $ 4,522,510 $ 3,759,197 $ 3,721,760
Page 54Expenditures by Function General Administration
ActualFY2019Budget
FY2020Budget
FY2015Actual
FY2016Actual
FY2017Actual
FY2018

Positions by Function Page 55
Budgeted Positions: FY2015 FY2016 FY2017 FY2018 FY2019 FY2020
Principal 129.00 132.00 135.00 135.00 138.00 139.00
Assistant Principal 495.71 513.24 523.47 536.97 549.03 550.37
Secretary 126.80 131.80 137.91 138.00 139.98 140.98
Clerical 651.07 676.82 688.64 742.24 762.49 764.49
Other Administrative 10.00 10.00 10.00 10.00 - -
Total 1,412.58 1,463.86 1,495.02 1,562.21 1,589.50 1,594.84
School Administration
Activities budgeted here are concerned with overall administrative responsibility for school operations. Included are activities of principals, assistant principals, department chairpersons and clerical staff.
Local school principals, along with their administrative staff, are responsible for the planning and successful implementation of local school budgets, staff development, and curriculum. In addition, they serve the community by working with local advisory and support groups such as the PTA, LSAC (Local School Advisory Committee), CSI (Committee for School Improvement), and the various booster clubs. Along with leading the instructional process, their responsibilities include discipline, building maintenance, property inventory, school buses and cafeteria operations.

Classified Substitutes $ 191,220 $ 169,230 $ 169,530 $ 191,379 $ 195,300 $ 195,300
Principals 14,767,187 15,663,992 16,103,976 16,566,345 17,305,355 17,974,881
Assistant Principals 38,583,764 41,917,315 43,493,638 45,771,157 47,769,219 49,146,116
Secretaries 4,922,214 5,242,899 5,565,721 5,706,585 5,931,038 6,129,832
Clerical 22,258,418 23,743,797 24,504,114 25,253,514 26,757,409 26,987,617
Other Administrative Personnel 913,772 991,180 1,002,545 1,070,975 34,517 34,517
Other Salaries & Compensation 1,375,086 1,347,232 1,373,266 1,335,018 4,809,803 5,141,107
Health Insurance 10,927,384 12,025,675 13,395,327 14,459,565 14,952,049 14,974,285
Medicare 1,097,461 1,188,317 1,233,333 1,284,501 1,315,106 1,457,198
Teacher Retirement System 10,520,178 12,163,190 12,796,968 15,676,813 20,231,161 20,765,271
Worker's Compensation 394,288 445,283 460,964 479,403 500,614 502,481
Gwinnett Retirement System 3,500,997 2,622,765 2,894,838 3,537,958 5,396,374 5,655,441
Other Employee Benefits 241,799 248,537 260,798 267,089 271,790 274,111
Subtotal - Salaries & Benefits 109,693,768 117,769,412 123,255,018 131,600,302 145,469,735 149,238,157
Purchased Services 3,511,074 3,732,778 4,274,371 13,877,897 9,512,116 9,029,604
Travel 136,390 128,023 162,959 203,502 125,875 124,875
Supplies 2,723,722 2,714,722 2,888,601 9,770,841 8,288,411 7,147,100
Equipment Replacement 50,950 73,508 62,205 329,523 313,210 290,000
Subtotal - Other Charges 6,422,136 6,649,031 7,388,136 24,181,763 18,239,612 16,591,579
TOTAL $ 116,115,904 $ 124,418,443 $ 130,643,154 $ 155,782,065 $ 163,709,347 $ 165,829,736
Page 56Expenditures by Function School Administration
ActualFY2019Budget
FY2020Budget
FY2015Actual
FY2016Actual
FY2017Actual
FY2018

Positions by Function Page 57
.
Budgeted Positions: FY2015 FY2016 FY2017 FY2018 FY2019 FY2020
Secretary 3.00 4.00 3.00 4.00 4.00 4.00
Clerical 38.00 38.00 38.00 38.00 37.00 37.00
Accountants 12.00 12.00 12.00 12.00 13.00 13.00
Warehouse/Distribution 34.47 34.47 34.47 40.47 40.47 40.47
Other Management 7.00 7.00 7.49 7.49 8.49 8.49
Other Administrative 14.00 14.00 14.00 15.49 15.49 15.49
Total 108.47 109.47 108.96 117.45 118.45 118.45
Business Support Services
The Business and Finance Division supports educational services to children through the procurement, payment, storage, and delivery of goods and services to the local schools. Business support involves all activities associated with the fiscal operation of the school district, including budgetary operations, financial reporting, accounting services, payroll/benefit administration, risk management, inventory control, property management, procurement, warehousing, internal auditing and cash management.
The business function provides direct support to local schools in a variety of ways. Delivery of mail, supplies, equipment and food are provided daily to local schools. Payroll checks are processed and delivered in a timely manner for approximately 21,000 employees. Accounting, budgeting, auditing, and investment services are available to help each individual school site realize the greatest return on investment of available resources.

Secretaries $ 125,190 $ 147,945 $ 149,410 $ 176,826 $ 184,680 $ 192,532
Clerical 1,768,488 1,827,355 1,834,214 1,834,710 1,903,789 1,969,169
Accountants 919,048 941,673 971,403 981,999 1,017,333 1,070,191
Maint/Transp/Whse/Security 1,481,453 1,453,924 1,530,639 1,814,437 1,973,578 2,027,685
Other Management Personnel 853,632 893,224 979,866 1,002,243 1,132,719 1,184,274
Other Administrative Personnel 875,828 983,871 1,014,115 1,154,804 1,139,512 1,206,228
Other Salaries & Compensation 327,303 364,924 405,026 441,775 450,700 450,700
Health Insurance 648,469 718,321 852,284 996,339 1,027,227 1,138,939
Medicare 80,897 85,799 91,272 98,685 102,543 115,982
Teacher Retirement System 773,418 864,091 896,534 1,126,785 1,508,872 1,556,746
Worker's Compensation 28,634 31,333 32,441 34,881 36,220 39,992
Gwinnett Retirement System 261,251 182,948 200,786 247,545 396,346 417,398
Other Employee Benefits 17,562 17,003 17,271 18,336 17,773 20,263
Subtotal - Salaries & Benefits 8,161,173 8,512,411 8,975,261 9,929,365 10,891,292 11,390,099
Purchased Services 23,767,037 23,647,390 23,392,692 23,024,794 23,748,777 23,781,777
Travel 13,040 14,131 20,828 16,029 30,510 27,210
Supplies 257,697 178,696 256,221 340,281 762,918 340,562
Equipment Replacement 17,312 3,745 - 17,076 - -
Subtotal - Other Charges 24,055,086 23,843,962 23,669,741 23,398,180 24,542,205 24,149,549
TOTAL $ 32,216,259 $ 32,356,373 $ 32,645,002 $ 33,327,545 $ 35,433,497 $ 35,539,648
Page 58Expenditures by Function Business Support Services
ActualFY2019Budget
FY2020Budget
FY2015Actual
FY2016Actual
FY2017Actual
FY2018

Positions by Function Page 59
.
Budgeted Positions: FY2015 FY2016 FY2017 FY2018 FY2019 FY2020
Secretary 6.00 6.00 6.00 6.00 6.00 6.00
Clerical 14.00 14.00 19.00 19.00 19.00 19.00
Maintenance/Security 188.49 209.49 212.49 216.49 231.49 242.49
Custodial * 1,068.50 1,115.75 1,139.75 1,139.75 1,155.25 1,181.50
Other Management 7.00 7.00 7.00 7.00 8.00 8.00
Other Administrative 2.99 2.99 3.00 3.00 3.00 3.00
Other Salaries 8.00 8.00 8.00 8.00 10.00 10.00
Total 1,294.98 1,363.23 1,395.24 1,399.24 1,432.74 1,469.99
Maintenance and Operations
The learning environment is greatly enhanced by providing students well-maintained school buildings and equipment. Students and teachers have a safe comfortable place to learn, teach, and play. They also have access to instructional equipment and computers that are maintained by professional craftsmen or technicians.
The maintenance and operations staff is responsible for the upkeep of 141 schools and an additional 55 other locations with 28,365,596 square feet of building space, 4,495 acres of land, and 1,092 pieces of playground equipment. In addition to normal maintenance and operations, the staff supports the expanding building program and performs essential tasks in opening new classrooms and facilities. The facilities maintenance function is performed both by in-house employees and private contractors. Approximately 34% of maintenance work is contracted to private vendors, while 66% is performed by in-house staff.
* Custodial positions reflect total positions earned by the schools. Each school has the option of transferring some of its funds to pay part-time staff.

Classified Substitutes $ 503,560 $ 495,287 $ 439,479 $ 487,123 $ 518,000 $ 518,000
Secretaries 261,433 284,197 288,564 298,313 304,623 311,781
Clerical 653,615 667,837 810,086 865,221 916,487 940,278
Maint/Transp/Whse/Security 11,881,248 13,454,523 14,267,160 14,779,313 15,962,912 17,502,597
Custodial Personnel 30,841,141 32,864,236 34,210,986 35,176,718 36,831,110 38,925,218
Other Management Personnel 826,162 870,265 865,346 907,078 1,049,781 1,089,330
Other Administrative Personnel 190,219 257,576 255,548 267,865 274,381 281,310
Other Salaries & Compensation 519,070 576,409 609,129 634,980 840,317 809,930
Health Insurance 7,697,209 8,937,206 10,867,364 12,231,385 12,870,646 14,290,466
Medicare 601,385 653,159 685,399 709,160 711,061 848,493
Teacher Retirement System 2,373,651 2,860,422 3,032,486 3,644,225 4,509,564 5,391,654
Worker's Compensation 216,340 248,958 260,680 268,608 269,351 293,041
Gwinnett Retirement System 1,918,302 1,417,669 1,574,199 1,880,477 2,862,157 3,213,993
Other Employee Benefits 174,297 184,230 191,859 197,103 200,798 232,033
Subtotal - Salaries & Benefits 58,657,632 63,771,974 68,358,285 72,347,569 78,121,188 84,648,124
Purchased Services 14,372,028 15,546,616 16,024,030 15,021,475 16,946,694 16,388,633
Travel 11,192 12,220 23,721 24,631 9,919 9,919
Supplies 26,121,166 25,713,878 25,370,332 26,523,137 26,523,411 26,036,120
Equipment Replacement 665,099 990,161 516,285 842,159 1,435,286 894,832
Subtotal - Other Charges 41,169,485 42,262,875 41,934,368 42,411,402 44,915,310 43,329,504
TOTAL $ 99,827,117 $ 106,034,849 $ 110,292,653 $ 114,758,971 $ 123,036,498 $ 127,977,628
Page 60
ActualFY2017Actual
FY2018
Expenditures by Function Maintenance and Operations
ActualFY2019Budget
FY2020Budget
FY2015Actual
FY2016

Positions by Function Page 61
.
Budgeted Positions: FY2015 FY2016 FY2017 FY2018 FY2019 FY2020
Clerical 57.00 57.00 77.00 77.98 77.98 77.98
Bus Driver 1,649.00 1,664.00 1,637.00 1,647.00 1,647.00 1,647.00
Other Transportation 207.00 213.00 230.00 235.00 244.00 244.00
Other Management 1.00 1.00 1.00 1.00 2.00 2.00
Other Salaries 56.00 56.49 56.49 56.49 56.49 56.49
Total 1,970.00 1,991.49 2,001.49 2,017.47 2,027.47 2,027.47
Transportation
Along with transporting students to and from school and trips to school activities, the transportation staff also is responsible for driver training, federal legal requirements, student management on the operations side, and bus maintenance, inspection and state regulatory compliance on the fleet management side. Transportation insurance expenditures also are charged to this function.
FY2019 Transportation facts: GCPS has 1,980 buses in its fleet, making it the largest school-district owned fleet in the nation. We transport more than 133,000 students twice daily over 8,000 routes traveling almost 23,800,000 miles annually. Our fleet mainenance organization also maintains over 500 non-school bus vehicles used by GCPS in support of teaching and learning. As info, a new bus costs $86,000 on average.

Clerical $ 2,433,117 $ 2,528,292 $ 3,556,423 $ 3,840,865 $ 3,537,520 $ 3,622,503
Bus Drivers 42,707,916 46,642,564 45,837,819 47,372,347 51,190,988 51,364,591
Maint/Transp/Whse/Security 4,656,872 5,413,269 6,079,995 6,636,607 7,658,406 7,882,738
Other Management Personnel 119,914 124,800 125,370 127,877 229,824 254,893
Other Salaries & Compensation 3,232,629 3,500,272 3,447,246 3,515,673 3,583,646 3,690,638
Health Insurance 10,334,320 11,909,517 13,891,428 15,381,166 15,577,866 16,887,148
Medicare 687,353 758,848 771,782 807,193 769,994 997,313
Teacher Retirement System 1,021,088 1,166,490 1,387,803 1,708,057 2,339,086 2,444,295
Worker's Compensation 253,527 294,202 298,611 310,554 239,514 336,854
Gwinnett Retirement System 2,332,558 1,769,368 1,907,393 2,332,807 3,145,425 3,717,425
Other Employee Benefits 287,300 292,668 292,329 291,069 286,643 316,349
Subtotal - Salaries & Benefits 68,066,594 74,400,290 77,596,199 82,324,215 88,558,912 91,514,747
Purchased Services 4,981,207 7,383,351 7,256,457 7,060,459 7,237,252 6,975,115
Travel 28,363 65,686 46,147 40,770 56,041 61,041
Supplies 15,653,307 12,409,213 13,135,811 14,544,636 15,532,322 15,485,183
Equipment Replacement 1,329,738 1,506,740 4,970,608 7,851,104 3,643,316 1,382,902
Subtotal - Other Charges 21,992,615 21,364,990 25,409,023 29,496,969 26,468,931 23,904,241
TOTAL $ 90,059,209 $ 95,765,280 $ 103,005,222 $ 111,821,184 $ 115,027,843 $ 115,418,988
Page 62Expenditures by Function Transportation
ActualFY2019Budget
FY2020Budget
FY2015Actual
FY2016Actual
FY2017Actual
FY2018

Positions by Function Page 63
.
Budgeted Positions: FY2015 FY2016 FY2017 FY2018 FY2019 FY2020
Secretary 16.49 16.49 15.00 17.00 18.00 18.00
Clerical 44.00 44.49 44.49 48.98 50.98 50.98
Family Services - Parent Coordinator 3.50 6.35 8.11 13.32 13.46 13.46
Research Personnel 6.00 6.75 7.00 8.00 8.00 8.00
Planning Staff 4.00 5.00 4.50 4.50 4.50 4.50
Other Management 47.00 49.00 51.00 54.49 55.49 55.49
Other Administrative 8.00 8.00 14.47 36.92 35.96 35.96
Other Salaries 77.82 81.49 85.96 68.49 75.49 75.49
Total 206.81 217.57 230.53 251.70 261.88 261.88
Central Support Services
Central Support Services refers to administrative activities that do not fall under the categories of "general administration" or "business services". Central Support Services include: employee recruiting and hiring (personnel services), student enrollment forecasting (planning, and managing communication with employees, parents, citizens, and the news media (community relations).
Computer information systems is one facet of the central support function. The Information Management Division manages a complex computer network which spans the school system. A major function of the department is to make it possible to use computer technology for records keeping and organization in areas such as: personnel, payroll financial accounting, attendance reporting, student records, high school scheduling and grade reporting.

Certified Substitutes $ 5,650 $ 27,475 $ 23,834 $ 92,429 $ 42,400 $ 42,400
Secretaries 750,964 684,049 694,179 764,373 975,209 977,606
Clerical 2,019,165 2,089,662 2,118,739 2,261,187 2,570,080 2,598,371
Research Personnel 593,915 698,899 635,121 762,348 853,700 883,497
Planning Staff 370,258 441,957 464,181 475,303 487,300 498,388
Family Services - Parent Coord 121,127 424,309 566,446 890,179 937,897 1,006,200
Other Management Personnel 4,767,913 5,108,120 5,608,253 5,877,129 7,016,109 7,115,456
Other Administrative Personnel 510,982 591,970 1,129,790 2,450,386 3,040,970 3,078,603
Other Salaries & Compensation 6,872,143 7,298,129 7,695,417 7,092,816 6,703,890 6,744,674
Health Insurance 1,154,712 1,388,482 1,723,636 2,122,975 # 2,374,826 2,602,644
Medicare 210,151 229,833 253,001 278,096 303,079 328,773
Teacher Retirement System 1,805,560 2,137,248 2,321,254 3,028,390 4,689,024 4,528,543
Worker's Compensation 77,004 86,801 94,684 103,343 111,106 113,369
Gwinnett Retirement System 657,247 485,566 553,542 706,919 1,224,190 1,253,871
Other Employee Benefits 33,029 34,963 35,887 39,182 41,313 46,588
Subtotal - Salaries & Benefits 19,949,820 21,727,463 23,917,964 26,945,055 31,371,093 31,818,983
Purchased Services 14,240,300 19,671,435 22,614,607 21,129,825 23,254,737 20,957,949
Travel 126,492 112,499 159,460 135,732 204,939 216,825
Supplies 6,776,705 10,485,243 11,710,020 13,926,953 12,430,747 13,226,676
Equipment Replacement 2,479,716 1,016,303 799,167 493,935 325,787 162,787
Subtotal - Other Charges 23,623,213 31,285,480 35,283,254 35,686,445 36,216,210 34,564,237
TOTAL $ 43,573,033 $ 53,012,943 $ 59,201,218 $ 62,631,500 $ 67,587,303 $ 66,383,220
Page 64
ActualFY2017Actual
FY2018
Expenditures by Function Central Support Services
ActualFY2019Budget
FY2020Budget
FY2015Actual
FY2016

Positions by Function Page 65
.
No full-time positions are budgeted for this function.
Facility Planning/Construction
The Facility Planning and Construction departments are responsible for the planning, design and construction of school facilities needed to meet the rapid growth in our student population in Gwinnett County

Purchased Services $ 39,203 $ - $ - $ 13,318 $ 111,293 $ 62,611
Travel - - - - - -
Supplies - - - - - -
Equipment Replacement - - - - - -
TOTAL $ 39,203 $ - $ - $ 13,318 $ 111,293 $ 62,611
Page 66Expenditures by Function Facility Planning/Construction
ActualFY2019Budget
FY2020Budget
FY2015Actual
FY2016Actual
FY2017Actual
FY2018

Page 67
Transfers to Other Funds 8,420,281 11,840,991 11,414,269 17,932,020 11,319,032 9,253,283
Total Expenditures - General Fund $ 1,353,288,519 $ 1,452,429,208 $ 1,508,626,808 $ 1,618,062,844 $ 1,742,046,474 $ 1,804,145,394
Enrollment 173,246 176,052 178,214 179,266 179,758 180,204
Per Pupil Expenditures (excluding transfers) 7,763$ 8,183$ 8,401$ 8,926$ 9,628$ 9,960$
ActualFY2017Actual
FY2018
Expenditures by Function
ActualFY2019Budget
FY2020Budget
FY2015Actual
FY2016
Gwinnett County Public Schools Special Revenue Fund
FY2020 Public Budget Document


Special Revenue Funds Page 68
Revenue by YearFY2015 FY2016 FY2017 FY2018 FY2019 FY2020Actuals Actuals Actuals Actuals Budget Budget
Federal $ 75,480,990 $ 76,124,606 $ 77,890,736 $ 75,424,843 $ 88,789,924 $ 86,669,359 State 377,071 1,009,752 896,466 378,339 328,455 271,229
Local 3,432,752 1,984,284 776,670 493,960 329,330 335,637
Totals 79,290,813 79,118,642 79,563,872 76,297,142 89,447,709 87,276,225
General Fund 3,306,205 3,899,293 4,672,093 7,455,074 11,319,032 8,975,946
Totals $ 82,597,018 $ 83,017,935 $ 84,235,965 $ 83,752,216 $ 100,766,741 $ 96,252,171
Special Revenue funds account for grants awarded to Gwinnett County Public Schools. These individual funds enable the program managers/coordinators to easily track the expenditures to ensure that the grant dollars are being spent in accordance with the terms of the grant agreement and approved budget. The Special Revenue funds also account for receipts and expenditures of resources transferred from the General Fund when the grant receipts are inadequate to finance the specified activities.

Current Projected2019 Budget 2020 Budget
Beginning Balance: $ 688,113 $ 353,581
Revenue:Local 329,330 335,637 State 328,455 271,229 Federal 88,789,924 86,669,359 Total Revenue 89,447,709 87,276,225 Transfers In 11,319,032 8,975,946 Total Sources Available $ 101,454,854 $ 96,605,752
Expenditures:Instruction $ 77,948,490 $ 76,588,157 Student Support Services 5,426,069 4,590,822 Improvement of Instruction 3,486,633 1,379,503 Instructional Staff Development 7,553,101 7,231,599 Media Services 13,322 - General Administration 2,096,917 2,109,211 School Administration Services - - Business Support Services 116,890 116,890 Maintenance & Operations 577,065 500,099 Transportation 163,066 52,400 Central Support Services 588,643 674,593 Other Support Services 15,562 13,300 Federal Grant Administration 3,010,540 2,995,597 School Nutrition Program 104,975 - Total Expenditures 101,101,273 96,252,171
Ending Fund Balance 353,581 353,581
Total Expenditures & Fund Balance $ 101,454,854 $ 96,605,752
Special Revenue Funds Page 69

Special Revenue Funds Page 70
Funding Current ProjectedSource 2019 Budget 2020 Budget
Bright from the Start
This grant represents funds for the purpose of operating a Pre-kindergarten program for 4 year old children. Beginning Bal. - -
State 263,512 271,229
Other Federal Grants - -
Total 263,512 271,229
Department of Administrative Services (DOAS)This grant provides business and finance support to local schools and central office staff. Beginning Bal. 353,581 353,581
Local 116,890 116,890
Total 470,471 470,471
FreshFruitandVegatableProgramThisgrantisestablishedtoprovideaccountingoffederalfundsforthepurposeofincreasingaccesstofreshfruit&vegatablesinelementaryschoolchildrentoimproveoveralldietandcreatehealthiereatinghabits. Federal 104,975 -
GoSTEM Initiative Beginning Bal. 104,021 - This grant is established to provide accounting of local funds committed for the purpose of providing evaluation services for the purpose of enhancing the educational experience of Latino students in Georgia and strnegthen the pipeline of these students into post-secondary STEM (Science, Technology, Engineering and Mathematics) education.
Local - 104,021
Homeless Children and YouthThis grant provides federal funding for the purpose of supporting the educational successes of homeless children by providing school supplies, tutoring and other services. Federal 107,214 107,114
IDEA Flow Through Transfer In 11,014,984 8,620,476
This grant provides additional instructional support for students with disabilities. Federal 28,912,860 28,918,327
Total 39,927,844 37,538,803

Funding Current ProjectedSource 2019 Budget 2020 Budget
IDEA Preschool Special Education Program Transfer In 304,048 355,470This grant provides funding for the educational needs of pre-kindergarten children with disabilities. Federal 664,696 649,930
Total 968,744 1,005,400
Innovation Grants - Governors' Office of Student Acheivement
This grant provides funding for the purpose of increasing student achievement and providing reform opportunities through unique and challenging educational programs. State 64,943 -
New Schools GrantThis grant provides funding from the NewSchools Venture Fund for the purpose of supporting the Meadowcreek Cluster of Schools. Local 212,440 114,726
Perkins Grant Programs
This grant provides secondary vocational education programs throughout the school district. Federal 1,244,508 1,244,508
Students Against Destructive Decisions (SADD) - GOHSThis grant provides federal funding for the purpose of providing students with peer to peer support in making positive decisions. Federal 2,262 -
The Wallace FoundationBeginning Bal. 230,511 -
This grant provides local funding for leadership development and training for school and district level leaders.
Local - -
The M.A.P.L.E Grant
This grant provides local funding from the John & Laura Arnold Foundadation thru Georgia State University to support research on the effective use of data in decision making to improve instruction.
Local - -
Special Revenue Funds Page 71

Special Revenue Funds Page 72
Funding Current Projected
Source 2019 Budget 2020 Budget
Title I
This grant provides federal funding for the purpose of helping disadvantaged children meet challenging State academic content and student academic achievement standards. Federal 44,353,591 43,550,481
Title I Part C Migrant
This grant provides funding for the support of high quality education programs (including supportive services) for migratory children.
Federal 57,222 54,878
Title II, Part A Improving Teacher QualityThis grant provides funding to increase academic achievement by improving teacher and principal quality through recruitment, retention, and staff development.
Federal 6,358,086 5,432,755
Title II, Part B Math & Science Partnerships
This grant provides funding to support partnerships between the school district and institutions of higher education departments of science and math in order to advance the instructional skills of teachers in these core subject areas.
Federal 90,136 -
Title III This grant provides funding to help ensure that English learners including immigrant children and youth attain English proficiency and develop high levels of academic achievement in English.
Federal 3,764,021 3,682,642
Title IVThis grant provides funding to support student achievement through improving access to a well rounded education, improved learning conditions and enhanced access to technology.
Federal 3,130,353 3,028,724

Gwinnett County Public Schools Capital Projects Fund
FY2020 Public Budget Document


Capital Projects Fund Page 73
SPECIAL LOCAL OPTION SALES TAX (SPLOST) - GENERAL INFORMATION
In FY1998, the Georgia Legislature passed a law allowing school districts to establish a one-cent sales tax that could be used for capital projects or debt retirement. The passage of this sales tax assists the school district in building new schools for a student enrollment that continues to grow each year; to renovate and add classrooms to existing schools, and to provide system-wide technology improvements for teaching and learning.
SPLOST V (July 1, 2017 - June 30, 2022)To meet the demands of the school District's continued enrollment growth voters in the county approved the extension of the Special Local Option Sales Tax. The referendum approved a maximum collection of $950 million over the five year period. Revenue will be used for 13 building projects, technology enhancements, and system-wide facility modifications (including new/refurbished buses, fine arts equipment, roofs, floor coverings, painting, etc). In addition to approving the sales tax extension, the voters also authorized the Board to sell short-term bonds to be repaid with sales tax revenue. This will provide the necessary cash flow to allow the classroom needs to be met earlier.
In a county-wide referendum in November 2018, 78% of the voters approved the issuance of up to $350 million general obligation bonds. Proceeds from the bonds will be used to supplement revenue from the SPLOST to expand to a second phase of capital projects. As with the SPLOST, proceeds from the bonds will be used to build new schools for a student enrollment that grows each year; to renovate and add classrooms to existing schools, and to provide system-wide technology improvements for teaching and learning.
GENERAL OBLIGATION BONDS

Beginning Balance $ 204,161,945 $ 286,227,036 -
RevenueSales Tax Receipts 150,082,829 155,605,877 Investment Income 250,000 400,000 Issuance of Bonds 199,129,500 - State Capital Outlay 1,259,411 1,500,000 Transfer In 3,419,643 3,506,835
Total Revenue 354,141,383 161,012,712
Total Sources Available 558,303,328 447,239,748
Expenditures:
Expenses 202,977,698 141,875,337 Transfers 69,098,594 109,518,685 Total Expenditures 272,076,292 251,394,022
Ending Fund Balance 286,227,036 195,845,726
Total Expenditures & Fund Balance 558,303,328 447,239,748
Capital Projects Fund Page 74
FY2019 BudgetProjected
FY2020 BudgetCurrent

Capital Projects Fund Page 75
SPLOST V GO BondsFund 227 Fund 245 TOTAL
Beginning Balance 111,997,536$ 174,229,500$ 286,227,036$
RevenueSales Tax Receipts 155,605,877 ‐ 155,605,877$ Investment Income 100,000 300,000 400,000$ State Capital Outlay 1,500,000 1,500,000$ Transfer In (Project Mngt) 3,506,835 ‐ 3,506,835$ Total Revenue 160,712,712 300,000 161,012,712
Total Sources Available 272,710,248$ 174,529,500$ 447,239,748$
ExpendituresConstruction 48,750,000 38,000,000 86,750,000 Technology 21,750,000 15,000,000 36,750,000 Furniture & Equipment ‐ Schools 4,740,000 1,000,000 5,740,000 Financial Services 128,502 ‐ 128,502 Data Governance 3,000,000 ‐ 3,000,000 Network Security 2,000,000 2,000,000 Bus Purchases 4,000,000 ‐ 4,000,000 Project Management 3,506,835 ‐ 3,506,835 Transfer to Other Funds 109,518,685 ‐ 109,518,685 Total Expenditures 197,394,022 54,000,000 251,394,022
Ending Fund Balance 75,316,226 120,529,500 195,845,726
Total Expenditures & Fund Balance 272,710,248$ 174,529,500$ 447,239,748$
Projected FY20 Budget by Funding Source

FY20 Projected Budget SPLOST V G. O. Bonds TOTALConstruction
Benefield ES Addition/Renovation 2,500,000 ‐ 2,500,000 Berkmar HS Addition 5,000,000 ‐ 5,000,000 Chesney ES addition 2,000,000 ‐ 2,000,000 Grayson HS Addition/Renovation 8,000,000 ‐ 8,000,000 Ferguson ES Addition 2,500,000 ‐ 2,500,000 Meadowcreek Cluster ES 7,500,000 ‐ 7,500,000 Parkview HS Addition/Renovation 5,000,000 ‐ 5,000,000 Painting 500,000 ‐ 500,000 Roof Replacement 5,750,000 ‐ 5,750,000 Gym/Kitchen HVAC Project 5,000,000 ‐ 5,000,000 Systemwide Improvement 5,000,000 4,000,000 9,000,000 Seckinger HS ‐ 30,000,000 30,000,000 Discovery HS 1,000,000 1,000,000 Central Gwinnett HS Fine Arts 3,000,000 3,000,000
TechnologyBerkmar HS Addition 250,000 250,000 Grayson HS Addition/Renovation 500,000 500,000 Ferguson ES Addition 250,000 250,000 Meadowcreek Cluster ES 750,000 750,000 Parkview HS Addition/Renovation 500,000 500,000 IMT System Development 5,000,000 5,000,000 Remote Access 2,500,000 2,500,000 E‐Class System Development 5,000,000 5,000,000 Growth Computers 1,000,000 1,000,000 HS Technology Refresh 5,000,000 5,000,000 Central Office Refresh 1,000,000 1,000,000 Seckinger HS ‐ 2,000,000 2,000,000 Collaborative System 3,000,000 3,000,000 MS Technology Refresh 6,000,000 6,000,000 Intercom Replacement 4,000,000 4,000,000
Furniture & Equipment SchoolsBenefield ES Addition/Renovation 115,000 115,000 Berkmar HS Addition 125,000 125,000 Grayson HS Addition/Renovation 200,000 200,000 Ferguson ES Addition 200,000 200,000 Parkview HS Addition/Renovation 100,000 100,000 Seckinger HS ‐ 1,000,000 1,000,000 Fine arts 1,000,000 1,000,000 Growth & Replacement 3,000,000 3,000,000
Capital Projects Fund Page 76
Breakdown of selected expense categories by project

Gwinnett County Public Schools Debt Service Fund
FY2020 Public Budget Document


Debt Service Fund Page 77
Long-Term Debt Obligations approved by county-wide voter referundum
Series 2009 Series 2010 Series 2010 Series 2013 Series 2015 Series 2017 Series 2019 Total
Original Par Amount of Principal Issued 18,980$ 19,640$ 255,080$ 211,380$ 252,440$ 97,335$ 173,355$ 1,028,210$
Principal Outstanding @ 6/30/19 18,980$ 19,640$ 208,750$ 107,645$ 250,105$ 93,980$ 173,355$ 872,455$
Principal Retired in FY20 -$ -$ 17,085$ 8,495$ 810$ 1,465$ 5,000$ 32,855$
Principal Outstanding @ 6/30/20 18,980$ 19,640$ 191,665$ 99,150$ 249,295$ 92,515$ 168,355$ 839,600$
FY2019 FY2020 Millage rate required to fund Long-term debt 1.95 *
* Millage rate will be set at a meeting June 2019.
Short-term Debt Obligations from SPLOST Programs
(000's omitted)
SPLOST VOriginal Par Amount of Principal Issued 305,000$
Principal Outstanding @ 6/30/19 260,000$
Principal Retired in FY20 70,000$
Principal Outstanding @ 6/30/20 190,000$
(000's omitted)
Debt Service Funds are established to account for the payment of general long-term debt principal and interest. The funds are used to account for the semi-annual payment of bond principal and interest on general obligation serial bond issues which were issued for capital improvements as approved by the voting public or to reduce the district's interest expense by refunding prior outstanding issues at lower interest rates.
Revenue to service the long-term debt consists primarily of local property taxes. The Gwinnett County Board of Education annually levies a property tax millage rate as required to service the principal and interest payments for the year.
In addition to approving the SPLOST V sales tax extension, the voters also authorized the Board to issue short-term general obligation debt to be repaid with the sales tax revenue. This provides the necessary cash flow to allow the classroom needs to be met earlier.

$ 97,238,455 $ 83,187,777
59,291,690 62,062,709 Interest Income 100,000 600,000 Other Federal Revenue 960,000 960,000
60,351,690 63,622,709
65,678,951 106,011,850
$ 223,269,096 $ 252,822,336
$ 88,100,000 $ 121,145,000 51,971,319 56,083,671
10,000 10,000 140,081,319 177,238,671
83,187,777 75,583,665
$ 223,269,096 $ 252,822,336
Debt Service Fund Page 78
Dues & Fees
Total Expenses & Fund Balance
Total Expenditures
Ending Fund Balance
Payment of Interest
Total Sources Available
Expenditures:Payment of Principal
FY2019 Budget FY2020 BudgetCurrent
Transfers In
Total Revenue
Projected
Beginning Balance
Revenue:Ad Valorem Taxes

Debt Service Fund Page 79
General Certificates Obligation of SPLOST V
Debt Participation Debt TOTALBeginning Balance $ 38,580,620 $ 3,746,806 $ 40,860,351 $ 83,187,777
RevenueAd Valorem Taxes 62,062,709 ‐ ‐ 62,062,709 Investment Income 550,000 ‐ 50,000 600,000 Other Federal Revenue 960,000 ‐ ‐ 960,000 Total Revenue 63,572,709 ‐ 50,000 63,622,709
Transfer from Other Funds ‐ 24,866,150 81,145,700 106,011,850
Total Sources Available $ 102,153,329 $ 28,612,956 $ 122,056,051 $ 252,822,336
ExpendituresPayment of principal 32,855,000 18,290,000 70,000,000 121,145,000 Payment of interest 38,311,821 6,576,150 11,195,700 56,083,671 Dues & Fees 10,000 ‐ ‐ 10,000 Total Expenditures 71,176,821 24,866,150 81,195,700 177,238,671
Ending Fund Balance 30,976,508 3,746,806 40,860,351 75,583,665
Total Expenditures & Fund Balance $ 102,153,329 $ 28,612,956 $ 122,056,051 $ 252,822,336
Projected FY2020 Budget by Fund

Gwinnett County Public Schools Enterprise Fund
FY2020 Public Budget Document


Enterprise (School Nutrition) Fund Page 80
The School Nutrition Program provides students with a well-balanced breakfast and lunch while continually educating them on healthy eating. Menus are planned according to nutrition standards set by Food and Nutrition Services (FNS) within the US Department of Agriculture (USDA) and provide students with nutrient dense foods and avoids products that are high in fat and added sugars. The planned menus are analyzed for compliance with the nutrition standards by age groups also set by FNS, USDA.
All lunches are planned using a Food-Based Menu Planning Approach and contain 5 food components- Fruits, Vegetables, Grains, Meat/Meat Alternate and Milk. A reimbursable meal must contain 3 of the 5 components at a minimum and 5 of the 5 components at a maximum. A reimbursable meal must also contain at least one serving of the fruit or vegetable component. At the Elementary and Middle Schools, student may take up to 1 serving from the fruit component and up to 2 servings from the vegetable component. At High Schools, students may up to 2 servings from the fruit and vegetable component.
All breakfasts are planned using a Food-Based Menu Planning Approach and contain 3 food components- Grains, Fruit and Milk. Within the 3 food components, 4 food items will be offered. A reimbursable meal at breakfast must include 3 of the 4 food items at a minimum and all 4 food items at a maximum. A reimbursable breakfast must also include at least one serving of fruit.
Federal law requires the School Nutrition Program to operate on a non-profit basis. All costs of the program, including food, labor, and supplies, are funded by cafeteria revenues and federal/state reimbursements. Adults must pay the full cost of the meal because there are no offsetting federal/state reimbursements.
The projected numbers of meals to be served in FY2020 are 20,648,000 student lunches and 10,600,000 student breakfasts. There will be 135 serving locations with a staff of over 1,500 employees. Approximately 53.5% of all students are eligible to receive meals that are either free or reduced price. System-wide year-to-date participation in the school nutrition program as of December 2018 was 34.1% for breakfast and 69.3% for lunch.
All meal prices will remain the same in FY2020. Lunch prices will be $2.25 at the Elementary level and $2.50 at the Middle/High levels. Breakfast will be $1.50 at all levels. Reduced meal prices will remain $.30 for Breakfast and $.40 for Lunch. Adult meal prices will be $1.75 for Breakfast and $3.00 for Lunch at all levels. Milk prices will remain $.40 cents.

$ 7,569,153 $ 6,365,238
26,407,021 27,013,264 2,393,798 2,410,249
67,382,850 66,790,788 96,183,669 96,214,301
$ 103,752,822 $ 102,579,539
$ 22,711,727 $ 22,629,419 12,847,543 12,669,822 35,559,270 35,299,241
Food (Including USDA Commodities) 40,760,000 41,080,000 Purchased Services 13,384,814 12,116,314 Travel 36,500 34,500 Supplies / Uniforms 5,626,000 6,095,613 Equipment 2,021,000 1,995,000
61,828,314 61,321,427
97,387,584 96,620,668
6,365,238 5,958,871
$ 103,752,822 $ 102,579,539
Enterprise (School Nutrition) Fund Page 81
Revenue:Local
Projected
Beginning Balance
CurrentFY2019 Budget FY2020 Budget
Total Sources Available
Expenditures:SalariesFringe Benefits
StateFederalTotal Revenue
Subtotal
Total Expenses & Fund Balance
Total Expenditures
Ending Fund Balance
Subtotal


Gwinnett County Public Schools Internal Service Fund
FY2020 Public Budget Document


Internal Service Fund Page 82
Internal Service Funds are used to account for the operation of departments which provide goods or services to other departments of the school system or other governmental units. Included are the Worker's Compensation, the Disability Insurance Fund, and the Print Shop Fund. Each of these are funded through their charges to other budget units or outside agencies.
The workers' compensation program, which pays medical and wage benefits to injured employees, is self-insured to a $750,000 per claim retention. Aggressive claims management and other cost-containment measures help control costs while providing a vital service to employees who are injured while performing their duties. The average cost per claim has been less than $4000 in each of the last five years. The structure of the workers' compensation program is reviewed periodically to ensure that it remains the most cost-effective way to meet the requirements of the statute.
This is a program for paying approved claims incurred for short-term disability. It is financed through payroll deductions for participating employees. The employer pays the full cost of the basic plan for those hired before 7/1/95 who elect not to have health insurance coverage. Employees hired after 7/1/95 pay the full cost.
The Print Shop provides high volume copy and color offset printing services to Gwinnett County Public Schools. The Print Shop's prices average 25% less than retail cost. The Print Shop provides a variety of printing and finishing services including booklet-making, coil binding, poster printing, and variable data printing.
Worker's Compensation / Risk Management
Disability Insurance Fund
Print Shop Fund

Beginning Balance $ 7,239,695 $ 5,353,101
Revenue - Charges for Services:Worker's Compensation: Payroll Assessment 5,683,071 5,677,337 Disability Insurance: Payroll Deductions and Employer Contributions 2,288,287 2,288,287 Print Shop: Printing Requisitions 2,029,861 2,041,155 Transfers from Other Funds - 277,337 Total Revenue $ 17,240,914 $ 15,637,217
Expenditures:
Risk Management / Worker's Compensation $ 7,547,621 $ 7,858,812 Disability Insurance Fund 2,302,948 2,305,868 Print Shop Fund 2,037,244 2,041,155 Total Expenditures $ 11,887,813 $ 12,205,835
Ending Fund Balance 5,353,101 3,431,382
Total Expenditures & Fund Balance $ 17,240,914 $ 15,637,217
Internal Service Fund Page 83
FY2019 BudgetProjected
FY2020 BudgetCurrent


Gwinnett County Public Schools Glossary of Terms
FY2020 Public Budget Document
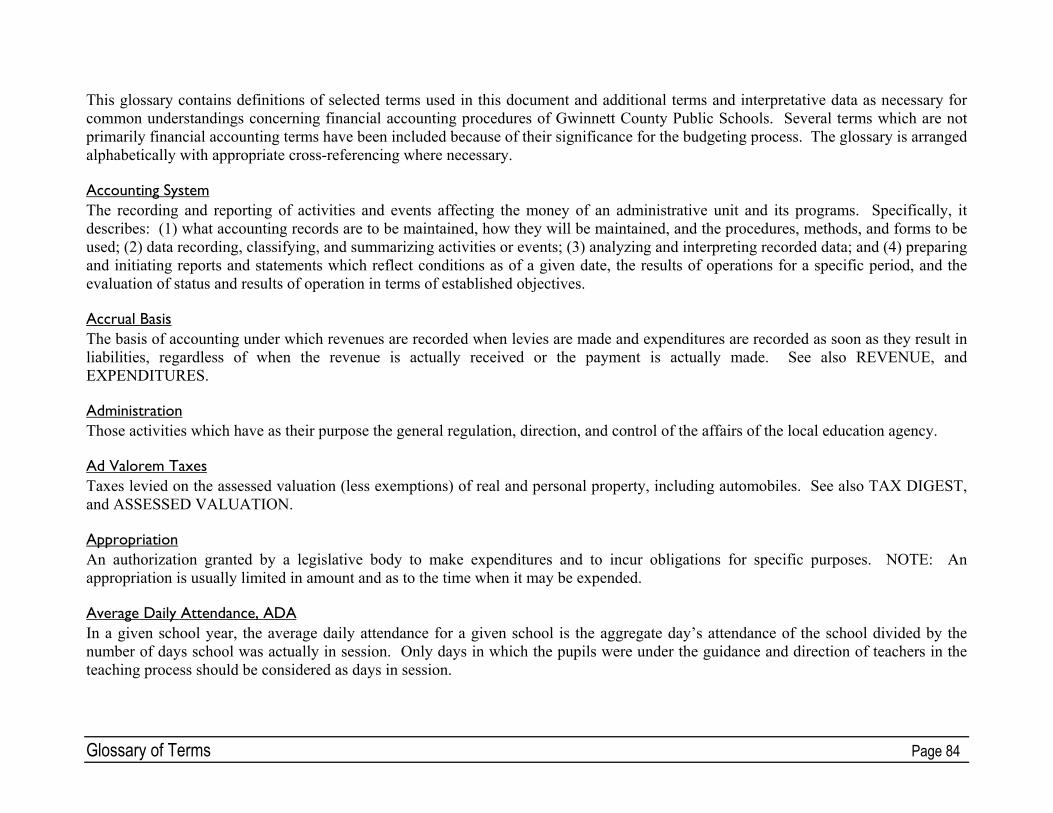
This glossary contains definitions of selected terms used in this document and additional terms and interpretative data as necessary for common understandings concerning financial accounting procedures of Gwinnett County Public Schools. Several terms which are not primarily financial accounting terms have been included because of their significance for the budgeting process. The glossary is arranged alphabetically with appropriate cross-referencing where necessary. Accounting System The recording and reporting of activities and events affecting the money of an administrative unit and its programs. Specifically, it describes: (1) what accounting records are to be maintained, how they will be maintained, and the procedures, methods, and forms to be used; (2) data recording, classifying, and summarizing activities or events; (3) analyzing and interpreting recorded data; and (4) preparing and initiating reports and statements which reflect conditions as of a given date, the results of operations for a specific period, and the evaluation of status and results of operation in terms of established objectives. Accrual Basis The basis of accounting under which revenues are recorded when levies are made and expenditures are recorded as soon as they result in liabilities, regardless of when the revenue is actually received or the payment is actually made. See also REVENUE, and EXPENDITURES. Administration Those activities which have as their purpose the general regulation, direction, and control of the affairs of the local education agency. Ad Valorem Taxes Taxes levied on the assessed valuation (less exemptions) of real and personal property, including automobiles. See also TAX DIGEST, and ASSESSED VALUATION. Appropriation An authorization granted by a legislative body to make expenditures and to incur obligations for specific purposes. NOTE: An appropriation is usually limited in amount and as to the time when it may be expended. Average Daily Attendance, ADA In a given school year, the average daily attendance for a given school is the aggregate day’s attendance of the school divided by the number of days school was actually in session. Only days in which the pupils were under the guidance and direction of teachers in the teaching process should be considered as days in session. Glossary of Terms Page 84
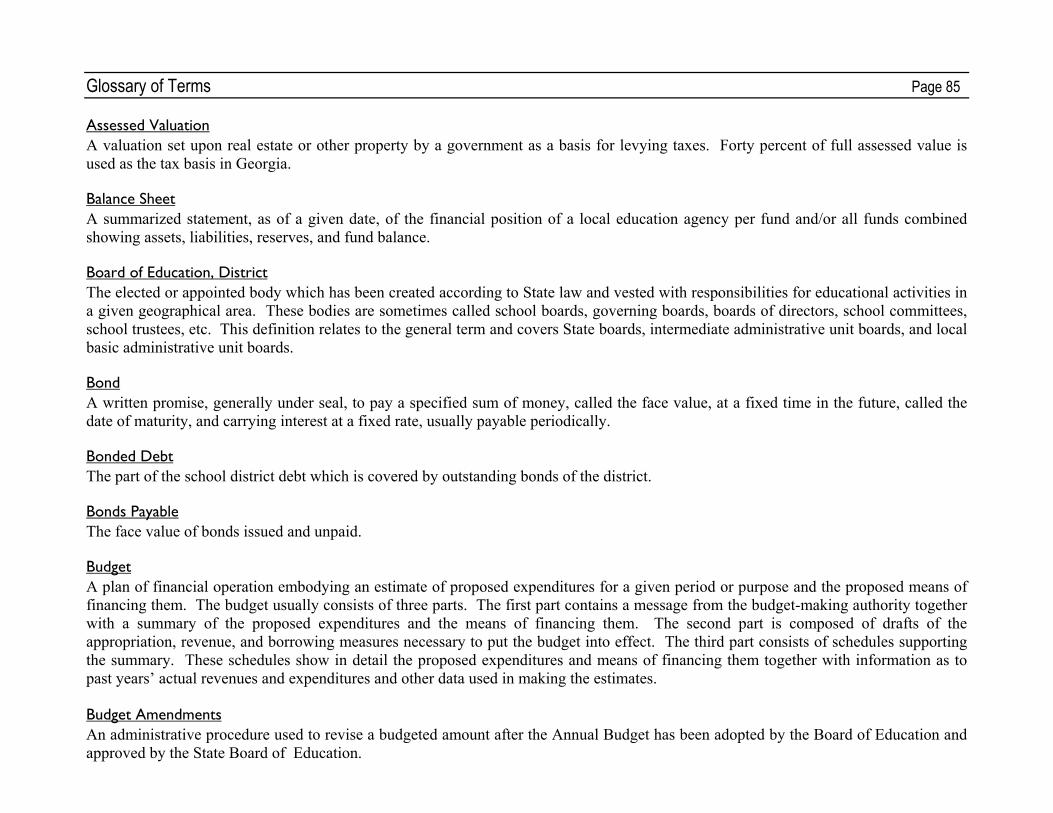
Glossary of Terms Page 85 Assessed Valuation A valuation set upon real estate or other property by a government as a basis for levying taxes. Forty percent of full assessed value is used as the tax basis in Georgia. Balance Sheet A summarized statement, as of a given date, of the financial position of a local education agency per fund and/or all funds combined showing assets, liabilities, reserves, and fund balance. Board of Education, District The elected or appointed body which has been created according to State law and vested with responsibilities for educational activities in a given geographical area. These bodies are sometimes called school boards, governing boards, boards of directors, school committees, school trustees, etc. This definition relates to the general term and covers State boards, intermediate administrative unit boards, and local basic administrative unit boards. Bond A written promise, generally under seal, to pay a specified sum of money, called the face value, at a fixed time in the future, called the date of maturity, and carrying interest at a fixed rate, usually payable periodically. Bonded Debt The part of the school district debt which is covered by outstanding bonds of the district. Bonds Payable The face value of bonds issued and unpaid. Budget A plan of financial operation embodying an estimate of proposed expenditures for a given period or purpose and the proposed means of financing them. The budget usually consists of three parts. The first part contains a message from the budget-making authority together with a summary of the proposed expenditures and the means of financing them. The second part is composed of drafts of the appropriation, revenue, and borrowing measures necessary to put the budget into effect. The third part consists of schedules supporting the summary. These schedules show in detail the proposed expenditures and means of financing them together with information as to past years’ actual revenues and expenditures and other data used in making the estimates. Budget Amendments An administrative procedure used to revise a budgeted amount after the Annual Budget has been adopted by the Board of Education and approved by the State Board of Education.

Budget Calendar The schedule of key dates used in the preparation and adoption of the Annual Budget. Budgetary Control The control or management of the business affairs of the school district in accordance with an approved budget with a responsibility to keep expenditures within the authorized amounts. Budget Document The instrument used as a comprehensive financial plan of operations of the Board of Education. Budget Message The opening section of the budget which provides the Board and the public with a general summary of the most important aspects of the proposed budget and recommendations of the Superintendent. Capital Budget A plan of proposed capital outlays and the means of financing them for the current fiscal period. It is usually a part of the current budget. If a Capital Program is in operation, it will be the first year thereof. A Capital Program is sometimes referred to as a Capital Budget. See also CAPITAL PROGRAM. Capital Outlays Expenditures which result in the acquisition of or addition to fixed assets. Capital Program A plan for capital expenditures to be incurred each year over a fixed period of years to meet capital needs arising from the long term work program or otherwise. It sets forth each project or other contemplated expenditure in which the local education agency is to have a part and specifies the full resources estimated to be available to finance the projected expenditures. Cash Accounting A basis of accounting in which transactions are recorded when cash is either received or expended. Certified Tax Digest That annual property tax digest certified by the tax receiver or tax commissioner of a county to the Department of Revenue and approved by the State Revenue Commissioner.
Glossary of Terms Page 86

Glossary of Terms Page 87 Cost Per Pupil Financial data (either budget or expenditures) for a given period of time divided by a pupil unit of measure (enrollment, FTE (full-time equivalency)). Debt An obligation resulting from the borrowing of money or from the purchase of goods and services. Debt of local education agencies includes bonds, warrants and notes, etc. Debt Limit The maximum amount of gross or net debt which is legally permitted. Debt Service Fund A fund established to account for the accumulation of resources for, and the payment of, long-term debt principal and interest. Encumbrance Accounting A system or procedure which involves giving recognition in the accounting budgetary expenditures control records for the issuance of purchase orders, statements, or other commitments chargeable to an appropriation in advance of any liability or payment. Encumbrances Purchase orders, contracts, and/or other commitments which are chargeable to an appropriation and for which a part of the appropriation is reserved. They cease to be encumbrances when paid, as in accounts payable, or when actual liability is established or when canceled. Fiscal Period Any period at the end of which a local education agency determines its financial position and the results of its operations. The period may be a month, a quarter, or a year, depending upon the scope of operations and requirements for managerial control and reporting. Five Mill Buy In Each local board of education is required to provide and use local funds in support of the QBE Act. A minimum of the equivalent of 5 mills must be provided. The Five Mill Buy In is computed by the Georgia Department of Education and identified on the allotment sheet provided to each school system following actions of the Georgia General Assembly. The Five Mill Buy In equates to five effective mills on the equalized, adjusted tax digest as certified by the Departments of Audits and adjusted for exemptions. Five Mill Buy In is subtracted from the total QBE revenue entitlements.

Fixed Assets Land, buildings, machinery, furniture, and other equipment which the school district intends to hold or continue in use over a long period of time. “Fixed” denotes probability or intent to continue use or possession and does not indicate immobility of an asset. Fringe Benefits Total employer’s share of F.I.C.A. Taxes, hospitalization, dental, disability, worker’s compensation, unemployment, and retirement contributions made on behalf of employees. F.T.E. (Full-time Equivalence - Employee) The amount of employed time required in a part-time position expressed in proportion to that required in a full-time position, with 1.000 representing one full-time position. It is derived by dividing the amount of employed time in the part-time position by the amount of employed time required in a corresponding full-time position. F.T.E. (Full-Time Equivalency - State Funding) Local school systems in Georgia must report enrollment three times during the school year for funding purposes. This reporting reflects the school day being divided into six parts (periods). The student is counted six times, according to which programs he or she participates in during the day. Students may not be counted for the portion of the day that they are in the following programs or under the following conditions:
1. Study Hall 2. Non-credit courses 3. Enrichment courses as defined by QBE or the State Board (generally one which does not devote a major portion of time to
the competencies adopted by the State Board) 4. Courses which require competitive participation in an extracurricular activity 5. Serving as a student assistant, unless this activity is an approved career or vocational education work program 6. Individual study courses which have no outline of course objectives available 7. Other courses designated by the State Board 8. The student is not enrolled in a program or not attending regularly 9. A resident student paying tuition or fees in excess of the local cost per student 10. A non-resident student paying tuition or fees in excess of the local cost per student 11. A student who has not attended within 10 days of the count
Each student is counted for each one-sixth of the school day for the eligible program in which he or she is enrolled. The resulting total, when divided by six, is known as the full-time equivalent (FTE) program count. An average of the counts reported at three different times during the year are used in the funding formula. (See QBE definitions.) Glossary of Terms Page 88

Glossary of Terms Page 89 Function An accounting term relating to both the budget and the financial report. A “function” is a grouping of activities being performed for which salaries and other types of direct costs are expended and accounted. Functions and subfunctions consist of activities which have somewhat the same general operational objectives. Furthermore, categories of activities should be combinable, comparable, relatable, and mutually exclusive. Both the budget and the financial reports group activities within “functions”. Fund A fiscal and accounting entity which is comprised of a self-balancing set of accounts which reflect all assets, liabilities, equity, revenue, and expenditures (or expenses) necessary to disclose financial position and the results of operations. Funds are established as individual entities in order to segregate financial records for purposes of legal compliance, different natures of the activities performed, measurement of different objectives, and to facilitate management control. Fund Balance The excess of assets of a fund over its liabilities and reserves. During the fiscal year prior to closing, it represents the excess of the fund’s assets and estimated revenues for the period over its liabilities, reserves, and appropriations for the period. Fund, Capital Projects Used to account for all resources used for acquiring capital sites, buildings, and equipment as specified by the related bond issue. Capital project funds are designated to account for acquisition or construction of capital outlay assets which are not acquired directly by the general fund, special revenue funds, or enterprise funds. Capital project funds have been developed to account for the proceeds of a specific bond issue and revenue from other possible sources which is designated for capital outlay, i.e., for land, buildings, and equipment. Fund, Debt Service Used to finance and account for payment of principal and interest on all long-term general obligation debts. Debt service funds are used to accumulate resources over the outstanding life of the bond issue in an amount equal to the maturity value. Cash of the debt service may be invested in income-producing securities which are converted back into cash at the maturity date for use in retiring bonds. Fund, Enterprise Used to finance and account for the acquisition, operations, and maintenance of school district facilities and services which are entirely or predominantly self-supportive by user charges. Budgetary accounts and formal budgetary accounting are recommended for Enterprise Funds. The accounting consists primarily of proper recording of receipts and disbursements.

Fund, General The fund used to finance the ordinary operations of the local education agency. It is available for a legally authorized purpose and consists of money not specifically designated for some other particular purpose. Fund, Internal Service A fund established to finance and account for services and commodities furnished by a designated department or agency to other departments and agencies within a single governmental unit. Amounts expended by the fund are restored thereto either from operating earnings or by transfer from other funds so that the original fund capital is kept intact. Fund, Special Revenue A fund used to account for the proceeds of specific revenue sources (other than special assessments, expendable trusts, or for major capital projects) that are legally restricted to expenditures for specific purposes. Fund, Trust and Agency - Fiduciary Used to account for money and property held in trust by a school system for individuals, government entities, or non-public organizations. A Trust Fund is usually in existence over a longer period of time than an Agency Fund. Primarily, Agency Funds function as a clearing mechanism for cash resources collected by the district held for a short period, and then disbursed to authorized recipients. Grant Contributions of either money or material goods given by a contributing unit (public or private) to another receiving unit and for which the contributing unit expects no repayment. Grants may be for a specific or general purpose. Inter-Fund Transfers Amounts transferred from one fund to another fund. Lapse The difference between budgeted revenue and expenses and actual revenue and expenses. Levy (Verb) To impose taxes or special assessments. (Noun) The total of taxes or special assessments imposed by a governmental unit.
Glossary of Terms Page 90

Glossary of Terms Page 91 Local Fair Share See Five Mill Buy In Long-Term Debt Debt with a maturity of more than one year after the date of issuance. Mill The rate of taxation based on dollars per thousand of taxable assessed value. A mill is one-tenth of a cent ($.001). Millage Rate The ad valorem tax rate expressed in terms of the levy per thousand dollars of taxable assessed value established by the governing authority each fiscal year. Per Pupil (Allotment) An allotment to each school for supplies and equipment initially based on the first school month pupil enrollment. Per Pupil (Expenditure) An accepted and commonly used norm to compare expenditures between school districts, state spending, and national spending. Program The definition of an effort to accomplish a specific objective or objectives consistent with funds or resources available. Budgets and actual revenue and expenditure records may be maintained per program. Program Budget A budget wherein expenditures are based primarily on programs of work and secondarily on character and object. A program budget is a transitional type of budget between the traditional character and object budget on the one hand, and the performance budget, on the other. Program Weights Since different programs vary in their cost to operate, each of the nineteen (19) QBE programs is assigned a different weight program. The weights reflect the cost of teachers and other instructional personnel; instructional materials; facility maintenance and operation (M & O) costs; media center personnel and materials costs; school and central office administration costs and staff development. See also: QBE.

Q.B.E. (Quality Basic Education) - Allotments Funds are allotted by the state on the basis of “Weighted F.T.E.” (F.T.E.: Full Time Equivalent students) to the local school system. The following are 19 programs of allotment under Q.B.E.:
1. Kindergarten 2. Kindergarten Early Intervention 3. Primary Grades (1-3) 4. Primary Grades (1-3) Early
Intervention 5. Elementary Grades (4-5) 6. Elementary Grades (4-5) Early
Intervention 7. Middle Grades (6-8) 8. Middle School Programs 9. High School General Education
(9-12) 10. Vocational Labs (9-12)
11. Special Education Category I 12. Special Education Category II 13. Special Education Category III 14. Special Education Category IV 15. Special Education Category V 16. Gifted 17. Remedial Education 18. Alternative Education 19. ESOL Programs
Q.B.E. - Mid Year Adjustment Because the QBE formula is based on FTE counts which are taken primarily in the previous school year, there will be a need to adjust the total allotment as more recent counts become available. If the more recent counts result in an increase in funds needed, the State Board will request the additional funds from the General Assembly. Reserve An account used to indicate that a portion of fund balance is restricted for a specific purpose. Revised Budget An increase or decrease to the initial budget (original amount as adopted by the governing body) amount. Source of Funds This dimension identifies the expenditure with the source of revenue, i.e., local, state, federal, and others.
Glossary of Terms Page 92
Glossary of Terms Page 93 Taxes Compulsory charges levied by a governmental unit for the purpose of financing services performed for the common benefit. Tax Digest The established formula for the county to determine the net Maintenance and Operations (M & O) property digest for the school district on a calendar year basis which includes total real, personal, motor vehicles, mobile homes, and public utility property, less homestead, various personal, freeport and agricultural exemptions. The Tax Digest is certified in July of each year and the local board of education sets the official millage rate. Teacher Allotment The teachers are allotted to the schools on the basis of active enrollment. The formula used for allocations meets the provisions of the State Board of Education and accrediting standards, with additional personnel allotted above State requirements and funded with local tax dollars.