Embed Size (px)
Citation preview

GWBrown, IT Strategy & Technology, 4/12/00RR®® 1
SCOR Experience at IntelSCOR Experience at IntelPresentation for
Supply Chain CouncilApril 12, 2000
George W. BrownIntel Worldwide IT, Strategy & Technology

GWBrown, IT Strategy & Technology, 4/12/00RR®® 2
AgendaAgenda
Objectives for Presentation Context for Supply Network Improvement at
Intel SCOR Pilot Project
Supply Network Task Force Supply Network Tools Task Force Pilot Scope and Deliverables
Lessons Learned and Observations SCOR/Tool Update Summary of Potential Wins

GWBrown, IT Strategy & Technology, 4/12/00RR®® 3
Objectives for PresentationObjectives for Presentation
Highlight Intel’s Emphasis on Supply Network Management
Summarize Our SCOR Pilot Experience
Share Our Learning's and Observations
Recommend Improvements in SCOR/Tools

GWBrown, IT Strategy & Technology, 4/12/00RR®® 4
SupplierSupplier ManufacturerManufacturer CustomerCustomer
Multiple Views on Supply Chain Multiple Views on Supply Chain Definition ...Definition ...
Supply chain = Supply chain = Activities within and between Activities within and between each circleeach circle
DISCOVERDISCOVER DEVELOPDEVELOP DEPLOYDEPLOY
Supply chain = Supply chain = Entire context of the product life Entire context of the product life cyclecycle
Multiple SuppliersMultiple SuppliersMultiple ProductionMultiple ProductionOperations withinOperations within
a Businessa BusinessMultiple CustomersMultiple Customers
Most Supply Chains consist of many Most Supply Chains consist of many “threads”“threads”

GWBrown, IT Strategy & Technology, 4/12/00RR®® 5
Lead to Supply Network Thinking Lead to Supply Network Thinking and ...and ...
FUTURE...FUTURE... Integrated Supply Network Performance is a Driver of Competitiveness.
Competition is no longer just between individual firms, but is between the supply networks that design, develop, produce and deliver products to the end customer.
NEW COMPUTER INDUSTRY PARADIGMS SPEED ..... Internet Time
FLEXIBILITY ..... Quick TPT
COST ..... Highly Competitive Consumer Market

GWBrown, IT Strategy & Technology, 4/12/00RR®® 6
… … a Common Visiona Common Vision
Be the Leader in Supply Network Management
Operate the right multiple supply networks driven by business needs
Execute each network as a single, virtual enterprise enabled by the Internet

GWBrown, IT Strategy & Technology, 4/12/00RR®® 7
… … and Supply Network Goalsand Supply Network Goals
Drive Cycle Time Reduction in all our
businesses across the Supply Networks
Design & Implement Agile/Flexible
Supply Networks

GWBrown, IT Strategy & Technology, 4/12/00RR®® 8
Supply Chain Task Force Supply Chain Task Force FormedFormed
To establish a methodology for how we analyze different business Supply Networks
To better identify which cycle time CSIs we should target
To assess the relative impact (and cost) of improving cycle time through variation of different portions of our overall supply chain
To improve efficiency and effectiveness of targeted supply chain

GWBrown, IT Strategy & Technology, 4/12/00RR®® 9
… … and a Supportingand a Supporting Supply Chain Tools Task Force Supply Chain Tools Task Force
To evaluate tools and methodologies to support supply chain improvements
To support the SCOR Model/Methodology Provides structure and common language including definition of
process steps and metrics to model supply chain Reference Model provides an archetype to configure supply chain
Consistency of definition allows for effective evaluation With appropriate Tool, Time invested can yield value added
results
To explore integration with other planning and business process modeling activities

GWBrown, IT Strategy & Technology, 4/12/00RR®® 10
The SCOR Tool Assessment ProcessThe SCOR Tool Assessment Process
StakeholderBriefing
SCOR Pilot
PreliminaryAssessment
Formalizethe Process
CompleteSelection
• Factor in new SCOR requirements
• Identify Stakeholders
• Assimilate all requirements
• Make recommendation decision
• Prepare propagation plan
• SCOR and Tool Training
• Apply SCOR methodology
• Plan tool/methodology improvements
• Analysis of SCOR• Identify options• Make tool
selection for pilot

GWBrown, IT Strategy & Technology, 4/12/00RR®® 11
D1.6 D1.5 D1.3 D1.2 D1.1
D1.8 D1.9 D1.10 D1.11 D1.12 D1.13
D1.4D1.7
ARIS EasySCOR utilized for ARIS EasySCOR utilized for SCOR ModelingSCOR Modeling
Level One in EasySCOR Modeler
Plan
Source
Make Deliver
Deliver
D0 Deliver Infrastructure
D1 Deliver Stocked Products
D2 Deliver Make-to-Order Products
D3 Deliver Engineer-to-Order Products
Level Two in EasySCOR
Modeler
Level Three in EasySCOR Modeler
GWBrown, IT Strategy & Technology, 4/12/00RR®® 12
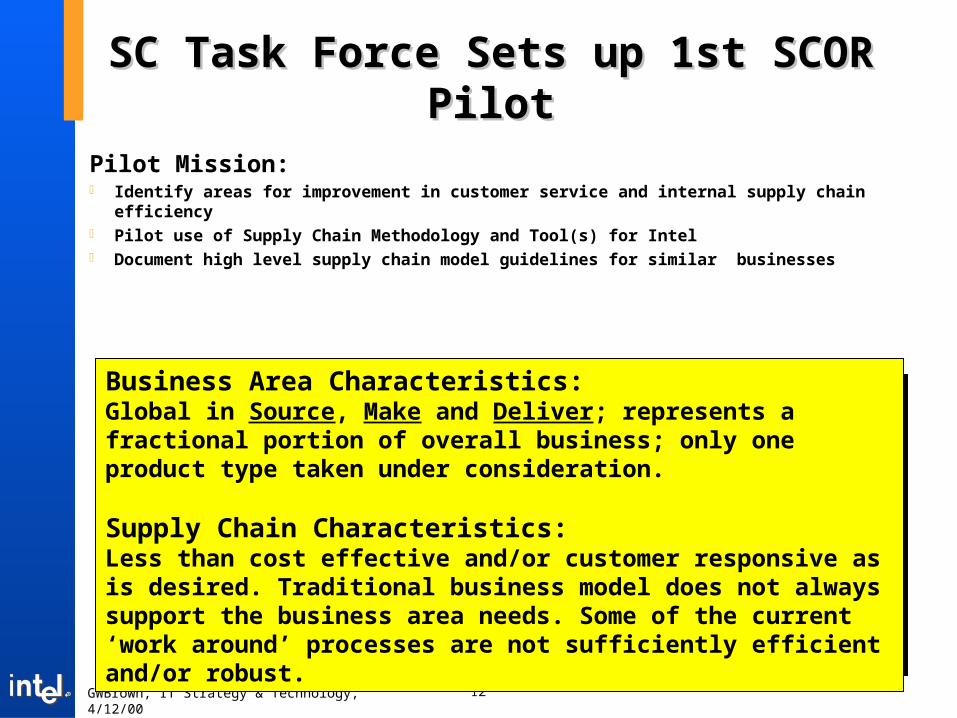
Business Area Characteristics: Global in Source, Make and Deliver; represents a fractional portion of overall business; only one product type taken under consideration.
Supply Chain Characteristics:Less than cost effective and/or customer responsive as is desired. Traditional business model does not always support the business area needs. Some of the current ‘work around’ processes are not sufficiently efficient and/or robust.
SC Task Force Sets up 1st SCOR SC Task Force Sets up 1st SCOR PilotPilot
Pilot Mission: Identify areas for improvement in customer service and internal supply
chain efficiency Pilot use of Supply Chain Methodology and Tool(s) for Intel Document high level supply chain model guidelines for similar businesses

GWBrown, IT Strategy & Technology, 4/12/00RR®® 13
SCOR Pilot ProcessSCOR Pilot Process
Identify team , charter,
mission and scope
SCOR and Tool Training
Develop AS IS model
Identify metrics and
gaps
Refine AS ISModel
Gather Data for AS IS /TO BE
Review modelsfor supply
chain optimization
Develop TO BE models and identify
gaps
Plansupply chain optimization strategies
Develop EnterpriseSupply Chain
Scorecard
Identify BusinessImprovement
Targets
BaselineExisting Baseline
Processes
DefineScorecard
IdentifyPerformance
ImprovementsCross-
Functional Team:Core Team: Transportation,
Finance, Assembly and Test
Manufacturing, Warehouses,
Materials, Strategic Logistics, Biz
Operations
Tool/Methodology Support Team:
IT Strategy &Technology (ARIS
EasySCOR), ATM Business
Process, Corp Logistics
(Manugistics Navigator)
Extended Team/Consultants:
Geography, Sys. Mfg., IDS Scheer

GWBrown, IT Strategy & Technology, 4/12/00RR®® 14
SC Task Force DeliverablesSC Task Force Deliverables
Document Pilot Supply Chain Document current Supply Chain process
improvement efforts in Pilot business area Identify & “Go Do” short-term improvements Identify, get support & identify owners for
long-term improvements Summarize findings and learnings for using
Supply Chain Methodology and Tools Document guiding Supply Chain principles for
“Pilot-Like” businesses Document learnings and BKMs on managing a
Supply Chain taskforce
GWBrown, IT Strategy & Technology, 4/12/00RR®® 15
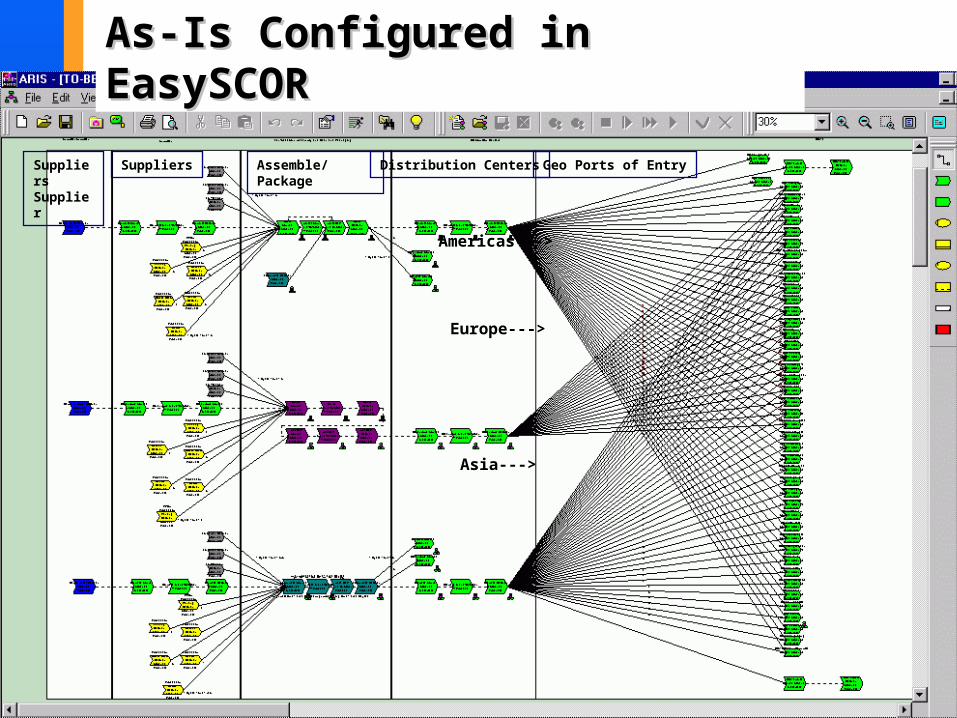
As-Is Configured in As-Is Configured in EasySCOREasySCOR
Suppliers Supplier
Suppliers Assemble/ Package Distribution Centers Geo Ports of Entry
Americas--->
Europe--->
Asia--->

GWBrown, IT Strategy & Technology, 4/12/00RR®® 16
SCOR Metrics Assessed at Level I & SCOR Metrics Assessed at Level I & IIII
PerformanceAttributes
L ITie
Metric for P1, Plan SupplyChain
Metric for P2, Plan Source Metricfor P3 Plan Make Metric for P4, Plan Deliver
Cycle Time PF,TLC,CCT,DP,AT
Cumulative Source/Make CycleTime
Replan Cycle Time
Cash-to-cash Cycle Time
Cumulative Source Cycle Time
Source Flexibility
Supplier Cycle Time
Cumulative Make Cycle Time
Make flexibility
Number of End Products/SKU’s
Order Management Cycle Time
Cost PF,TLC,CCT,DP,AT
Total Order Management Costs
D/S Planning Costs
Inventory Carrying Costs
Value-Added Productivity
Obsolete Inventory
Raw Material Inventory CarryingCosts
Number of Supply Sources
Raw Material Shrinkage
Commodity Management Profile
Work-In-Process InventoryCarrying Costs
WIP Shrinkage
Material Overhead Cost PerDollar of Material Expenditure
Finished Goods InventoryCarrying Costs
Finished Goods Shrinkage
Order management costs
Total Logistics Costs
Service/Quality PF,TLC,CCT,DP,AT
Forecast Accuracy
Delivery to Customer RequestDate
Fill Rate
Product & Process DataAccuracy (Bills of Material,Routings, Planning Factors, etc.)
Supplier Delivery Performanceto Customer Request Date
Supplier Fill Rate
Production plan adherence
Actual to Theoretical CycleTime
Fill rate
Forecast Accuracy
Delivery to Customer RequestDate
Assets PF,TLC,CCT,DP,AT
Return on Assets
Capacity Utilization
Total Inventory DOS
Total Raw Material InventoryDOS
Total WIP Inventory DOS
Inventory Obsolescence
Total Finished Goods InventoryDOS
PF = Production Flexibility, TLC = Total Logistics Cost, CCT = Cash-to-Cash Cycle Time, DP = Delivery Performance; AT = Asset Turns; xx = no tie; xx = tie

GWBrown, IT Strategy & Technology, 4/12/00RR®® 17
SCOR Elements Considered for FitSCOR Elements Considered for Fit
Level III

GWBrown, IT Strategy & Technology, 4/12/00RR®® 18
Alternatives/Opportunities Alternatives/Opportunities EvaluatedEvaluated
We developed our own process for first-pass evaluation of business improvement opportunities
Evaluation helped prioritize opportunities for more rigorous analysis through simulation and optimization studies
GWBrown, IT Strategy & Technology, 4/12/00RR®® 19
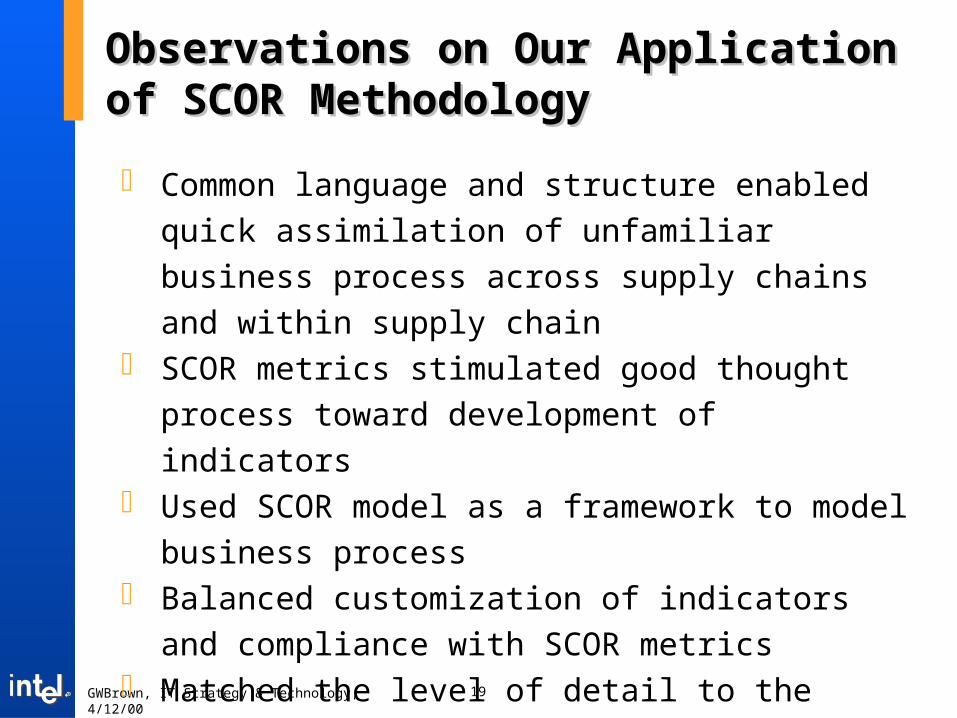
Observations on Our Application Observations on Our Application of SCOR Methodologyof SCOR Methodology
Common language and structure enabled quick assimilation of unfamiliar business process across supply chains and within supply chain
SCOR metrics stimulated good thought process toward development of indicators
Used SCOR model as a framework to model business process
Balanced customization of indicators and compliance with SCOR metrics
Matched the level of detail to the project objective(s)

GWBrown, IT Strategy & Technology, 4/12/00RR®® 20
Observations on Data GatheringObservations on Data Gathering
Spend time identifying ‘right’ metrics to measure the business-- very time consuming, don’t underestimate!
Recognize that the level of detail of information and analysis should match the objective of the taskforce
Would have been nice to do benchmarking but limited time and ability to make direct comparisons made it difficult
Need to include inventory/capital costs in model to be comprehensive
Validating labor and handling costs has value beyond Pilot
Modeling for a complex network requires significant effort to baseline & up-date-- but there is benefit in optimizing several factors simultaneously

GWBrown, IT Strategy & Technology, 4/12/00RR®® 21
Learnings from SC Task ForceLearnings from SC Task Force
Introduce SCOR Methodology and/or Tools early in team process
Begin data population of As-Is early & allow a minimum of 1 month for data population and 1 month for validation
Mapping of Level II metrics to Level I indicators is highly subjective and potentially time consuming
Positioning of Plan elements is difficult to align with operational experience and is non-intuitive
Methodology provides the structure to define the current and optimized business process but not the “how” for successful implementation-- need more support in this area.
Need to have capability to customize metrics and not force fit SCOR metrics

GWBrown, IT Strategy & Technology, 4/12/00RR®® 22
Intangible Benefits from PilotIntangible Benefits from Pilot
Big benefit has been raising the knowledge level of the entire team about the business, supply chain processes and solidifying relationships… intangible but real and powerful!
Provides structure and common language including definition of process steps and metrics to model supply chain
SCOR proliferation is gaining support Larger SCOR projects under way

GWBrown, IT Strategy & Technology, 4/12/00RR®® 23
R/3 & APO Ref. Models
Biz
Drivers
Function
Process
Procedure
Task
Biz + Tech-nology Infra-
structure
Biz Function Scope
Template
Biz Process Levels
SCOR plus Enterprise SCOR plus Enterprise Information Architecture = Biz Information Architecture = Biz Process RepositoryProcess Repository
•Process improvement methodology•Generic, uses archetypes•Best practices and metrics
Supply Chain
SCOR
Information Architecture•Provides details about Intel business process relationships

GWBrown, IT Strategy & Technology, 4/12/00RR®® 24
SCOR applied to B2B e-SCOR applied to B2B e-CommerceCommerce
Support the Sub-contractor Direct Ship project Supply chain improvement project from SCOR Pilot B2B scenario linked to EAI
Leverage SCOR to develop a BKM around e-business scenario modeling Start with supply chain models Refine the model representation of B2B scenarios Drill down to the interchange process specification level Perform SCOR-based simulation
Explore mapping of SCOR to the Rosettanet Work with both the Supply Chain Council and RosettaNet Siemens is committed in a joint effort
Currently developing a Value Proposition statement and pilot plan Internal review process will precede SCC/Rosettanet proposal
GWBrown, IT Strategy & Technology, 4/12/00RR®® 25
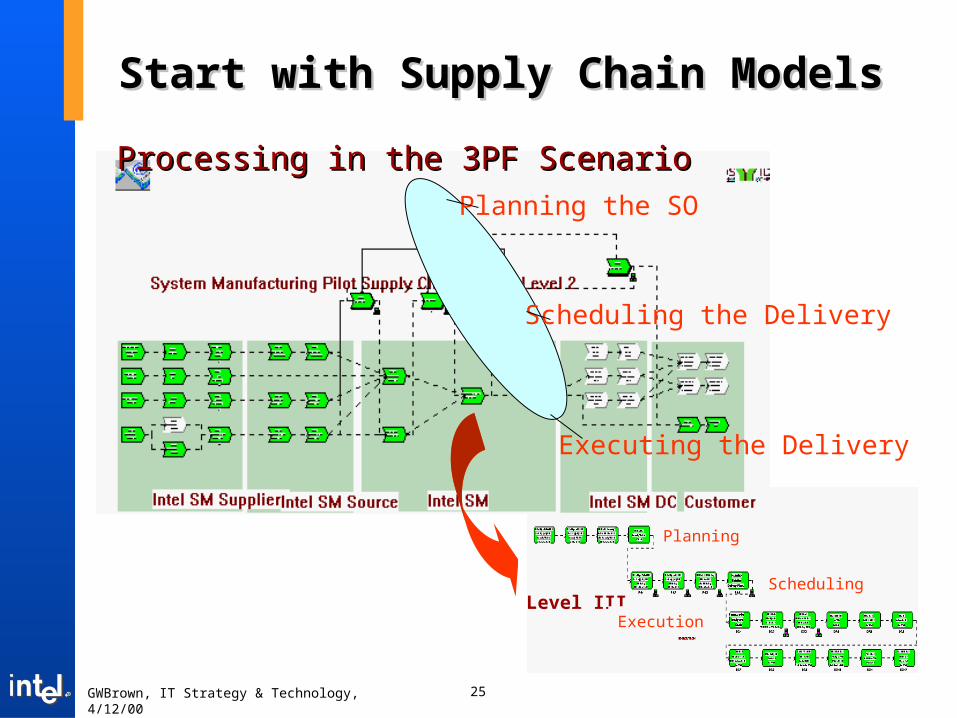
Start with Supply Chain ModelsStart with Supply Chain Models
Planning the SO
Scheduling the Delivery
Executing the Delivery
Processing in the 3PF ScenarioProcessing in the 3PF Scenario
Level III
Planning
Scheduling
Execution
GWBrown, IT Strategy & Technology, 4/12/00RR®® 26
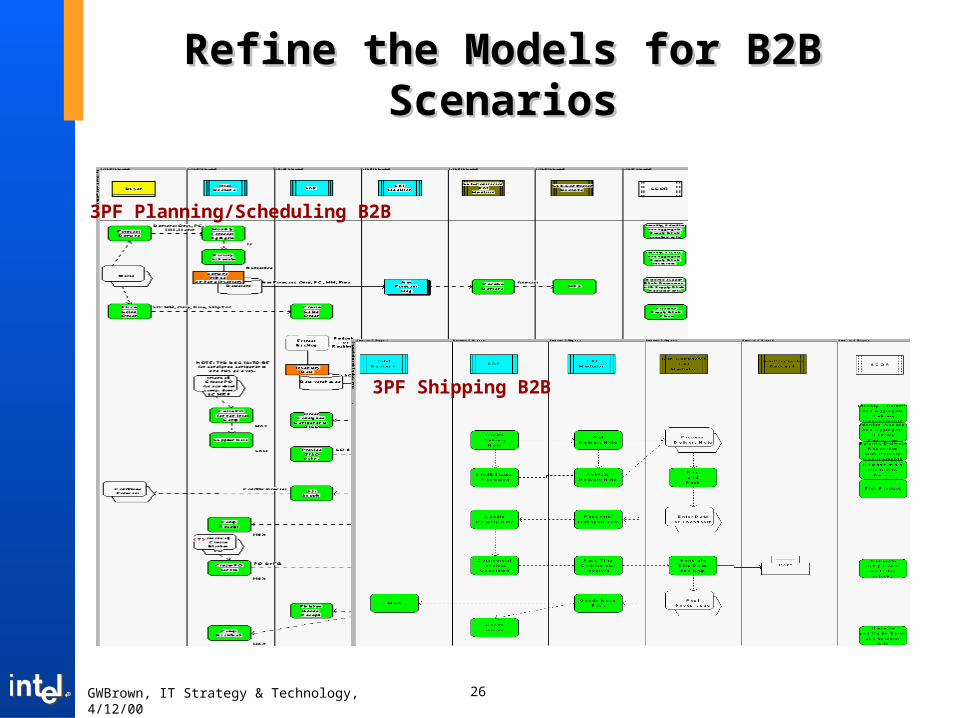
Refine the Models for B2B Refine the Models for B2B ScenariosScenarios
3PF Planning/Scheduling B2B
3PF Shipping B2B

GWBrown, IT Strategy & Technology, 4/12/00RR®® 27
Drill into Interchange Drill into Interchange SpecificationSpecification
Export/Transport
Export/Transport
SubcontractorSubcontractorSellerSeller
OrderManagerment
OrderManagerment
ShippingShipping
SalesOrder
ProductionProduction
ReservationPlanning
Goods ReceiptProcessing
Vehicle Specification/Search Request
via Internet
ShipmentTracking
Transport Control
Vehicle Locating and Allocation
Order Processing
Order TrackingOrder Tracking
OEM DealerImporter
IDS ScheerE-Business Scenarios will be used to visualize the flow of communication between business participants

GWBrown, IT Strategy & Technology, 4/12/00RR®® 28
Perform SCOR-based SimulationPerform SCOR-based Simulation
Use eSCOR for tpt/cost analysis
Transfer ARIS Model into GensymeSCOR
Define products
Define resources
Run simulation
GWBrown, IT Strategy & Technology, 4/12/00RR®® 29
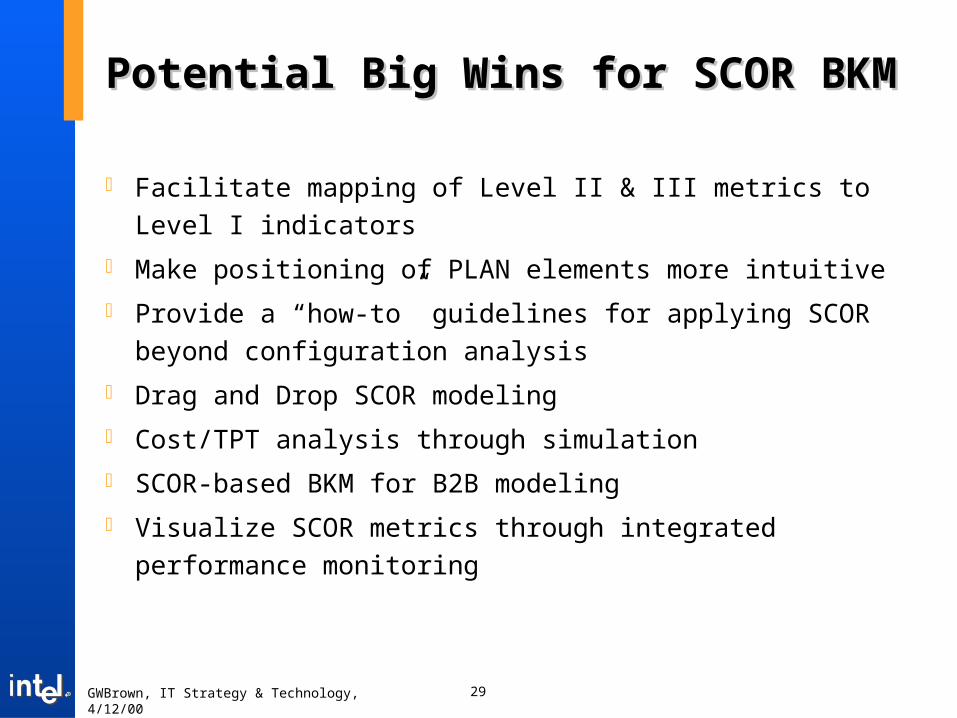
Potential Big Wins for SCOR Potential Big Wins for SCOR BKMBKM
Facilitate mapping of Level II & III metrics to Level I indicators
Make positioning of PLAN elements more intuitive
Provide a “how-to” guidelines for applying SCOR beyond configuration analysis
Drag and Drop SCOR modeling
Cost/TPT analysis through simulation
SCOR-based BKM for B2B modeling
Visualize SCOR metrics through integrated performance monitoring

GWBrown, IT Strategy & Technology, 4/12/00RR®® 30
Questions?