Embed Size (px)
Citation preview

Guyana Economic Performance Assessment
November 2007
This publication was produced by Nathan Associates Inc. for review by the United States Agency for International Development.

Guyana Economic Performance Assessment
DISCLAIMER
The authors’ views expressed in this publication do not necessarily reflect the views of the United States Agency for International Development or the United States Government.

Sponsored by the Economic Growth office of USAID’s Bureau of Economic Growth, Agriculture and Trade (EGAT), under Contract No. PCE-I-00-00-00013-00, Task Order 004, the Country Analytical Support (CAS) Project, 2004–2006, Nathan Associates Inc. developed a standard methodology for producing analytical reports to provide a clear and concise evaluation of economic growth performance in designated countries receiving USAID assistance. The reports are tailored to meet the needs of USAID missions and regional bureaus for country-specific analysis. Each report contains:
⎯ A synthesis of key data indicators drawn from numerous sources, including the World Bank, the International Monetary Fund, the Millennium Challenge Corporation, the United Nations, other international data sets, and host-country documents and data sources;
⎯ International benchmarking to assess country performance in comparison to similar countries, groups of countries, and predicted values based on international data;
⎯ An easy-to-read analytic narrative that highlights areas in which a country’s performance is particularly strong or weak, to assist in the identification of future programming priorities;
⎯ A convenient summary of the main findings, in the form of a Highlights Table and a Performance Scorecard (in lieu of an Executive Summary).
Under Contract No. GEG-I-00-04-00002-00, Task Order 004, 2006-2008, Nathan Associates continues to provide support to the EGAT Bureau by producing analytical reports evaluating economic growth performance in designated host countries. Through the same task order, Nathan is also developing a template for countries emerging from crisis, assessing data issues in countries with large gaps in their data; conducting sector reviews based on the diagnostic analysis in the country reports, and providing other analytical support to the EGAT Bureau.
The authors of the present report are Roger Manring, Ramya Sundaram, Alexander Greenbaum, and Thibaut Muzart. Peter Miller of Nathan Associates assisted with data management.
The CTO for this project at USAID/EGAT/EG is Rave Aulakh. USAID missions and bureaus may seek assistance and funding for country analytical studies or in-depth follow-on studies by contacting Ms. Aggarwal at [email protected].
Subject to EGAT consent, electronic copies of reports and materials relating to the CAS project are available at www.nathaninc.com. For further information or hard copies of CAS publications, please contact:
Rose Mary Garcia Chief of Party, CAS Project Nathan Associates Inc. [email protected]

Contents Highlights of Guyana’s Performance iii
Guyana: Notable Strengths and Weaknesses—Selected Indicators v
1. Introduction 1
Methodology 1
Data Quality and Format 3
2. Overview of the Economy 5
Growth Performance 5
Poverty and Inequality 8
Economic Structure 9
Demography and Environment 11
Gender 13
3. Private Sector Enabling Environment 15
Fiscal and Monetary Policy 15
Business Environment 18
Financial Sector 21
External Sector 23
Economic Infrastructure 29
Science and Technology 30
4. Pro-Poor Growth Environment 33
Health 33
Education 35
Employment and Workforce 36
Agriculture 38
Appendix. CAS Methodology

I I C O N T E N T S
Illustrations
Figures Figure 2-1. Real Annual GDP Growth 6 Figure 2-2. Investment Productivity, Incremental Capital-Output Ratio 7 Figure 2-3. Human Poverty Index (0 for excellent to 100 for poor) 8 Figure 2-4. Output Structure and Labor Force Structure 10 Figure 2-5. Population Growth Rate 12 Figure 2-6. Urbanization Rate 12 Figure 2-7. Labor Force Participation Rate, Male and Female 14 Figure 3-1. Overall Budget Balance, including Grants, % of GDP 16 Figure 3-2. Cost of Starting a Business, % of GNI per capita 19 Figure 3-3. Control of Corruption Index 20 Figure 3-4. Money Supply, M2, % GDP 21 Figure 3-5. Domestic Credit to Private Sector, % GDP 22 Figure 3-6. Current Account Balance, % of GDP 25 Figure 3-7. Remittances Receipts, % of Exports 26 Figure 3-8. Foreign Direct Investment, % of GDP 27 Figure 3-9. Overall Infrastructure Quality Index 29 Figure 4-1. Life Expectancy at Birth, Years 34 Figure 4-2. Educational Expenditure per Student 36 Figure 4-3. Economically Active Children, Percentage of All Children, 7-14 Years 37 Figure 4-4. Agricultural Productivity, Value Added per Worker 39
Tables Table 1-1. Topic Coverage 2

HIGHLIGHTS OF GUYANA’S PERFORMANCE Economic Growth Guyana, a lower-middle-income (LMI) country, is one of the poorest in the Latin
America/Caribbean region. After an extended period of no or slow growth dating from the late 1990s, real GDP began to expand in 2006 (increase of 4.7%) and appears to be on the same growth track in 2007. To raise standards of living and reduce poverty, this new growth momentum must be sustained and even accelerated.
Poverty Evidence suggests that Guyana has made progress in reducing poverty, though deterioration in its Human Poverty Index standing is worrying. Data development in this area could help in planning and targeting poverty reduction.
Economic Structure
Agriculture accounts for fairly high shares of output and labor (nearly 30 percent) for an LMI economy, with industry and services holding relatively lower shares. Deep transformation of economic structure, central to development, is not yet fully under way.
Demography and Environment
Due to heavy emigration, Guyana’s population is barely growing (increases less than 1 percent per annum), and the youth dependency ratio is surprisingly low.
Gender Guyana performs well in nearly every measure of gender equity—except the female labor force participation rate, an extremely low 48 percent. Workforce training aimed at women is in order.
Fiscal and Monetary Policy
Government’s fiscal deficit is high (11.2 percent of GDP) as a result of heavy public sector capital expenditure (Skeldon sugar factory and infrastructure). This imbalance should improve with completion of major capital projects. Inflation has been controlled in recent years, but increased in 2006 with expansion of private sector credit, the return to economic growth, and VAT-induced price rises. Management of public finances and tax reform are key ongoing issues.
Business Environment
Doing business in Guyana is hampered by heavy corruption, high taxation, and excessive regulation. Reform is critical to improve business efficiency and raise investor confidence. The new National Competitiveness Strategy will provide a reform framework.
Financial Sector Wide interest rate spreads and sharp complaints from business regarding access to and cost of finance reveal serious financial sector inefficiencies. Still, credit to the private sector grew rapidly in 2006. Regulatory reform and effective bank supervision are priorities for financial sector development.
External Sector Guyana is an open and vulnerable economy. Exports are overly concentrated in sugar, gold, bauxite, and other primary products. Present current account deficits are large (28 percent of GDP) as a result of massive imports. But deficits are narrowed by sizable remittance receipts and are ultimately covered by capital inflows from debt relief and FDI. Foreign reserves are adequate, and Guyana’s dollar is broadly stable against the US dollar. With the end of several capital projects (e.g., Skeldon sugar plant), current external imbalances will ease.
Economic Infrastructure
Save for telecommunications and the Internet—in which Guyana has made relatively good strides—power, transport, and other economic infrastructure are constraints on growth.
Science and Technology
With heavy emigration of Guyanese tertiary graduates (89 percent of whom work in OEDC countries, not the home economy) technology development is lagging. But rising FDI inflows may increase technology transfer through spillovers to the private sector.
Health Despite relatively high public health spending and widespread access to improved water and sanitation, performance is poor in key public health areas—especially life expectancy, maternal mortality, HIV/AIDS, and child malnutrition.

I V
Education Primary and secondary enrollment levels are reasonable, and overall expenditure for education is comparatively high. Issues with quality and effectiveness remain, but key data to evaluate impact (e.g., youth literacy rates) are out-dated or missing.
Employment and Workforce
Guyana’s workforce has grown slowly due to emigration but unemployment is still relatively high. Female labor force participation is surprisingly low (48 percent) and the proportion of children 7-14 years who are economically active is surprisingly high (30 percent). Regulatory reform in hiring/firing should make labor markets more flexible and stimulate job creation.
Agriculture Sugar and rice dominate agricultural activity. Sugar is grown largely on plantations, but rice often involves smallholders. Although overall value-added per worker seems to be rising, much more needs to be done to accelerate growth of output and efficiency throughout the sector—especially in view of the coming end of the European Union’s Sugar Protocol—and to diversify production generally.
Note: The methodology used for diagnostic benchmarking is explained in the Appendix.

GUYANA: NOTABLE STRENGTHS AND WEAKNESSES—SELECTED INDICATORS
Selected Indicators, by Topic Strengths Weaknesses
Growth Performance
Real GDP growth X
Growth of labor productivity X
Investment productivity—incremental capital-output ratio (ICOR) X
Poverty and Inequality
Income share of the bottom 20% of households X
Demography and Environment
Adult literacy rate X
Population growth rate X
Youth dependency rate X
Urbanization Rate X
Gender
Girls’ primary completion rate X
Labor force participation rates, female X
Fiscal and Monetary Policy
Government budget balance X
Government expenditures X
Business Environment
Rule of law index X
Government effectiveness index X
Financial Sector
Domestic credit to the private sector X
Money supply (M2), % GDP X
Credit information index X
External Sector
Trade in goods and services, percentage of GDP X
Debt service ratio, % exports X
Current account balance X
Foreign direct investment, % GDP X
Trade in services, % GDP X
Remittance receipts, % GDP X
Economic Infrastructure
Overall infrastructure quality X
Quality of infrastructure—ports X
Quality of infrastructure—air transport X

V I G U Y A N A E C O N O M I C P E R F O R M A N C E A S S E S S M E N T
Selected Indicators, by Topic Strengths Weaknesses
Quality of infrastructure—rail X
Quality of infrastructure—electricity supply X
Internet users per 1,000 people X
Science and Technology
FDI technology transfer index X
Availability of scientists and engineers X
Health
HIV prevalence X
Life expectancy at birth X
Access to improved sanitation X
Access to improved water source X
Education
Persistence to grade 5 X
Net secondary school enrollment rate X
Gross tertiary enrollment rate X
Employment and Workforce
Labor force participation rate X
Growth of labor force X
Rigidity of employment index X
Agriculture
Agriculture value added per worker X
Cereal yield X
Note: The chart identifies selective indicators for which Guyana’s performance is particularly strong or weak relative to benchmark standards, as explained in the Appendix. Details are discussed in the text. The data supplement presents a full tabulation of the data and international benchmarks examined for this report, along with technical notes on the data sources and definitions..

1. Introduction This report is one of a series of economic performance assessments prepared for the EGAT Bureau to provide USAID missions and regional bureaus with a concise evaluation of key indicators covering a broad range of issues relating to economic growth performance in designated host countries. The report draws on a variety of international data sources1 and uses international benchmarking against reference group averages, comparator countries, and statistical norms to identify major constraints, trends, and opportunities for strengthening growth and reducing poverty. This study uses two other countries in the same Latin America-Caribbean region, Belize and Suriname, as comparators. Suriname, a lower-middle-income economy, provides a good baseline for direct comparison, whereas Belize, an upper-middle-income economy, represents an aspiration. In addition, Guyana’s performance is also compared to median values of various indicators for lower-middle-income (LMI) countries as a group and for lower-middle-income Latin America and Caribbean (LMI-LAC) countries as a group.
METHODOLOGY The methodology used here is analogous to examining an automobile dashboard to see which gauges are signaling problems. Sometimes a blinking light has obvious implications—such as the need to fill the fuel tank. In other cases, it may be necessary to have a mechanic probe more deeply to assess the source of the trouble and determine the best course of action.2 Similarly, the economic performance assessment is based on an examination of key economic and social indicators, to see which ones are signaling problems. Some “blinking” indicators have clear implications, while others may require further study to investigate the problems more fully and identify appropriate courses for programmatic action.
The analysis is organized around two mutually supportive goals: transformational growth and poverty reduction.3 Broad-based growth is the most powerful instrument for poverty reduction.
1 Sources include the World Bank, the International Monetary Fund, the Millennium Challenge Corporation, the United Nations (including the Millennium Development Goals database), the World Economic Forum, and host-country documents and data sources. This report reflects data available as of September-October 2007.
2 Sometimes, too, the problem is faulty wiring to the indicator—analogous here to faulty data. 3 In USAID’s white paper U.S. Foreign Aid: Meeting the Challenges of the Twenty-first Century (January
2004), transformational growth is a central strategic objective, both for its innate importance as a development goal and because growth is the most powerful engine for poverty reduction.

2 G U Y A N A E C O N O M I C P E R F O R M A N C E A S S E S S M E N T
At the same time, programs to reduce poverty and lessen inequality can help to underpin rapid and sustainable growth. These interactions can create a virtuous cycle of economic transformation and human development.
Transformational growth requires a high level of investment and rising productivity. This is achieved by establishing a strong enabling environment for private sector development, involving multiple elements: macroeconomic stability; a sound legal and regulatory system, including secure contract and property rights; effective control of corruption; a sound and efficient financial system; openness to trade and investment; sustainable debt management; investment in education, health, and workforce skills; infrastructure development; and sustainable use of natural resources.
In turn, the impact of growth on poverty depends on policies and programs that create opportunities and build capabilities for the poor. We call this the pro-poor growth environment. Here, too, many elements are involved, including effective education and health systems, policies facilitating job creation, agricultural development (in countries where the poor depend predominantly on farming), dismantling barriers to micro and small enterprise development, and progress toward gender equity.
The present evaluation must be interpreted with care. A concise analysis of selected indicators cannot provide a definitive diagnosis of economic performance problems, nor simple answers to questions about programmatic priorities. Instead, the aim of the analysis is to spot signs of serious problems affecting economic growth, subject to limits of data availability and quality. The results should provide insight about potential paths for USAID intervention, to complement on-the-ground knowledge and further in-depth studies.
The remainder of the report presents the most important results of the diagnostic analysis, in four sections: Overview of the Economy; Private Sector Enabling Environment; and Pro-Poor Growth Environment. Table 1-1 summarizes the topical coverage. The appendix provides a brief explanation of the criteria used for selecting indicators, the benchmarking methodology, and a table showing the full set of indicators examined for this report.
Table 1-1 Topic Coverage
Overview of the Economy
Private Sector Enabling Environment
Pro-Poor Growth Environment
• Growth performance
• Poverty and inequality
• Economic structure
• Demographic and environmental conditions
• Gender
• Fiscal and monetary policy
• Business environment
• Financial sector
• External sector
• Economic infrastructure
• Science and technology
• Health
• Education
• Employment and workforce
• Agriculture

I N T R O D U C T I O N 3
DATA QUALITY AND FORMAT The breadth and quality of economic data available for Guyana are relatively poor and appear to be steadily worsening. For example, the World Bank gave Guyana an overall score of 50 percent in its 2006 Statistical Capacity Indicator Index, down from 58 percent in 2005. This is well shy of the present median scores for LMI countries generally (66.5), and for Latin America-Caribbean LMI countries (73) specifically. Of particular concern are the lack of recent poverty and agricultural survey data and uneven statistical practices used in the collection of national account, price, and government finance accounting data. Some statistics on education and health are also lacking or inconsistent. Such data problems complicate our analysis in several sections of the report: Poverty and Inequality, Economic Structure, Fiscal and Monetary Policy, Health, Education and Agriculture. Nevertheless, we believe that our data set has been adequate to evaluate and highlight a broad range of key trends and issues in Guyana’s economy.4
4 Note also that we are somewhat constrained by the fact that the IMF Staff Report and related documents for IMF Article IV Consultations with the Government of Guyana in 2006 and in previous years are not publicly available, except for summary Public Information Notes. Normally these detailed Article IV materials are a major source of data for our Country Analytical Support (CAS) Project assessments.


2. Overview of the Economy This section reviews basic information on Guyana’s macroeconomic performance, poverty and inequality, economic structure, demographic and environmental conditions, and indicators of gender equity. Some of the indicators cited here are descriptive rather than analytical and are included to provide context for the performance analysis.
GROWTH PERFORMANCE With an estimated real per capita GDP of $1,147 (current U.S. dollars) in 2006 (or $4,851 in terms of purchasing power parity, PPP), Guyana remains one of the poorer countries in the Western Hemisphere. Thus, the need for rapid and sustained economic growth is acute. Yet, after a period of vigorous expansion in the early to mid-1990s, Guyana’s level of real GDP virtually stagnated from 1998 until 2006. For example, over the five-year period 2002-2006, Guyana’s growth in real GDP averaged just one percent per annum—and even this low average figure has been boosted by a more acceptable 4.7 percent rate of real GDP growth for 2006 (Figure 2-1).5 Such performance is below the expected value of 6.1 percent average annual GDP growth for a country with Guyana’s characteristics,6 as well as the current actual growth rates for Belize (5.0 percent) and Suriname (5.8 percent). If Guyana wishes to increase its standard of living and income opportunities for its people, it will need to break its low growth–no growth path of the late 1990s and first half of the present decade, and sustain or even raise its performance above the levels of economic growth achieved in 2006 and projected for 2007 (5 percent).7
Some of Guyana’s poor growth performance in this decade derives from natural disaster (e.g., severe flooding which caused a contraction in GDP in 2005), but in overall economic terms the persistent cause of low growth is no mystery: low productivity. In the last two years, gross fixed investment has increased sharply, and now stands at a striking 35.5 percent of GDP,8 almost double the LMI-LAC median of 19.6 percent and Belize’s value of 18.8 percent. Guyana’s gross fixed investment/GDP ratio even exceeds the elevated Suriname figure of 33.2 percent.
5 Bureau of Statistics, Guyana. 6 The expected values in this report are based on our regression benchmarking methodology. Please see
the appendix for a detailed explanation. 7 IMF Public Information Notice 07/53. 8 Ibid.

6 G U Y A N A E C O N O M I C P E R F O R M A N C E A S S E S S M E N T
Figure 2-1. Real Annual GDP Growth
Real economic growth has been stagnant and only picked up in 2006.
Time Series Comparisons to other countries, most recent year Global Standing
-3.0-2.0-1.00.01.02.03.04.05.06.0
2002 2003 2004 2005 2006
Year Value 2002 1.1 2003 -0.7 2004 1.6 2005 -1.9 2006 4.7
Summary for 2002- 2006 Five year average 0.1 Trend growth rate .
4.7 4.1 4.9 5.0 5.8
6.1
0
1
2
3
4
5
6
7
8
9
Guyana LMI-LAC LMI Belize S uriname
Per
cent
Cha
nge
E xpected va lue and marg in of error
Highest-five average
-5.4
GUY
15.9
Lowest-five average
Source: IMF, World Economic Outlook April 2007 and Guyana Bureau of Statistics CAS Code: 11P3
However, as measured by the Incremental Capital-Output Ratio (ICOR) Guyana’s investment productivity is very low (Figure 2-2). In 2006 Guyana’s ICOR stood at 27.2, implying that approximately $27.20 of gross investment is needed per $1 of extra output. This is far higher than comparator ICORs: the LMI-LAC median of 5.6, Belize’s 3.8, and Suriname’s 5.6. In fact, countries using capital productively generally have an ICOR of 4 or below.
The likely cause of this low productivity is the high ratio of government to private sector investment within Guyana’s overall capital formation. In this decade, public sector investment appears to have risen to more than three-quarters of total investment.9 Much of recent public sector capital formation has been for infrastructure rehabilitation, social sector facilities (schools and hospitals), and modernization of the Skeldon sugar plant. All such investments produce positive returns only with a lag, as opposed to private investment in the productive sectors that tends to yield higher and more immediate returns. On the private sector side, since the late 1990s, private capital formation generally declined, reaching a low of 5.8 percent of GDP in 2004. Since that point, however, private investment has again begun to rise, and in 2006 reached a level equivalent to more than 10 percent of GDP. While the recent trend is encouraging, private capital formation still accounts for less than one-third of Guyana’s total gross fixed investment. Additional, sustained increases in private sector investment are critical to raising Guyana’s investment productivity and level of economic growth.10
9 See Cornelia Startz, Ruben Atoyan and Judith Gold, “Why has Growth Stopped? An Empirical Study on the Stagnation of Economic Growth,” IMF Working Paper WP/07/86, April 2007.
10 Ibid.

O V E R V I E W O F T H E E C O N O M Y 7
Figure 2-2. Investment Productivity, Incremental Capital-Output Ratio
Investment appears to be extremely inefficient at present—approximately $27 of capital is needed per $1 of extra output.
Comparisons to other countries, most recent year
5.827.2 5.6 3.8 5.60
5
10
15
20
25
30
Guyana LMI-LAC LMI Belize S uriname
Per
cent
Source: World Bank, World Development Indicators and computation using IMF Public Notice no. 07/53 CAS Code: 11S2
Labor productivity has been stagnant in Guyana. Between 2001 and 2005, Guyana’s level of labor productivity barely budged, with an average annual increase of a mere 0.1 percent, well below the LMI-LAC median for labor productivity growth of 1.2 percent. To some extent, such poor performance may be attributed to lack of investment and to the high emigration rate among trained Guyanese. It is notable, for example, that 89 percent of Guyanese tertiary graduates currently live in the OECD countries (see Demography and Environment discussion below).
Improving both labor and capital productivity in order to boost economic growth is a priority for Guyana and for donor assistance. Reducing political and social tensions, which are stoked by deep distrust between the major ethnic groups in Guyana,11 is one key to achieving this objective. An improved security and political climate could arrest emigration, and encourage long-term investment in human capital among those individuals who remain in Guyana. Equally important, continued improvement in Guyana’s investment climate will boost investor confidence, and attract needed private capital to sugar, energy, and other strategic sectors of the economy. Expanded private capital formation in productive activities would mean significantly higher rates of return, thus elevating investment efficiency and growth throughout the economy.
11 The Economist Intelligence Unit, Guyana Country Report, July 2007.

8 G U Y A N A E C O N O M I C P E R F O R M A N C E A S S E S S M E N T
POVERTY AND INEQUALITY The UNDP’s Human Poverty Index (HPI) provides a broad gauge of poverty that takes into account deprivation in health and education as well as income poverty (where 1 demonstrates excellent performance and 100 poor performance). In 2004, the most recent year for which data are available, Guyana received an HPI score of 14.8 (Figure 2-3). This is somewhat better than Belize’s score of 16.7, but worse than Suriname’s 10.3, and certainly lower than 11.6, the expected HPI value for a country with Guyana’s characteristics. Moreover, Guyana’s present score is a 3.4 point decrease from its HPI standing in 2000. This trend is perhaps even more worrying than the current rating itself, but is consistent given the general stagnation in economic growth that Guyana experienced after 1998.
Figure 2-3. Human Poverty Index (0 for excellent to 100 for poor)
Human deprivation score is low but Guyana is not the best performer.
Comparisons to other countries, most recent year Global Standing
14.8
11.8
10.3
16.7
17.1
11.1
0 2 4 6 8 10 12 14 16 18
Guyana
LMI-LAC
LMI
Belize
S uriname
0 (E xcellent) - 100 (P oor)
E xpected va lue a nd marg in of error
Highest-five average
4.0
57.6
GUY
Lowest-five average
Source: UNDP Human Development Report 2006 CAS Code: 12P1
These HPI data are relatively in line with earlier estimates of other poverty indicators. For example, in 1998, the most recent data point available, the estimated population living on less than $1 (PPP) per day was 3 percent.12 This is even less than the expected value plus broad standard error band (12 percent plus/minus 7.1 percent) associated with this indicator for a country like Guyana, and well below the LMI-LAC median of 16.5 percent. Such low levels of extreme poverty also seem consistent with the relatively positive story conveyed by Guyana’s scores in health and education attainment (see Education and Health below).
The basic indicator we apply to measure inequality is the income share accruing to the poorest 20 percent of the population. According to the latest data available for Guyana—again, figures from
12 World Bank Guyana Country at a Glance.

O V E R V I E W O F T H E E C O N O M Y 9
1998—the poorest 20 percent of the population earned 4.5 percent of the country’s income.13 This is generally in line with the expected value of a country like Guyana (4.4 percent including the margin of standard error) and the LMI-LAC benchmark (3 percent). It is also a finding that fits with the above data on population living on less than $ 1 per day.
Although these indicators suggest that Guyana has made tangible progress in reducing poverty, the fact is that specific recent impacts are often difficult to document. The country’s Poverty Reduction Strategy was ratified in 2001, but since then poverty and inequality data have been generally sparse and/or publicly unavailable.14 Hence, the international donor community might usefully provide assistance to strengthen poverty data collection, monitoring, and analysis in a timely fashion. This would reinforce Guyana’s capacity to plan, strategize, and manage its poverty reduction programs.
ECONOMIC STRUCTURE Looking at the broad structure of national output, the share of Guyana’s GDP originating in agriculture remains remarkably large for an LMI country (Figure 2-4). Over the past five years, agriculture’s share of output hovered around 31 percent,15 approximately double the expected value of 16.6 percent for a country with Guyana’s characteristics, and more than double Belize’s share (14.1 percent) and almost triple Suriname’s share (10.8 percent). By contrast, in Guyana’s economy, the contribution of services to GDP is low, though growing modestly. In 2006, services accounted for just 45.7 percent of GDP, up from 40.6 percent in 2002, but still 9 percentage points lower than the expected value for Guyana, and well below the 68.2 percent and 64.8 percent shares that services represent in the economies of Belize and Suriname, respectively. But of particular concern is the declining percentage of GDP originating from industry. In 2006, industry accounted for just 23.8 percent of GDP compared to 28.6 percent in 2002.16 This present figure is below the expected value of 27.7 percent for a country with Guyana’s characteristics and below Suriname’s 24.4 percent as well, yet still above Belize’s modest 17.7 percent share of industry in GDP.
Labor force structure data for Guyana are ten years old; nonetheless, they provide an interesting comparison to the output structure of GDP. In 1997, 27.8 percent of Guyanese were employed in agriculture, 47.9 percent in services, and 22.6 percent in industry, all roughly in line with the profile of current output (Figure 2-4). Guyana’s labor structure is more or less consistent with that of the LMI countries as a group. But it differs markedly in two respects from that of LMI-LAC
13 Ibid. 14 For example, a household income and expenditure survey (HIES) was conducted in late 2005, and
resultant data are being analyzed. The analysis will provide an updated and comprehensive poverty profile for Guyana, suitable for cross-country comparisons. In the meantime, using the population and housing census of 2002, the Bureau of Statistics has created a “poverty map” for Guyana. This map is based on a “marginality index” computed from eight socioeconomic variables and is designed to show the relative poverty status of each of Guyana’s ten regions.
15 Guyana Bureau of Statistics. 16 Over the same period, the absolute value of output from industry also declined.

10 G U Y A N A E C O N O M I C P E R F O R M A N C E A S S E S S M E N T
countries and from the expected value for an economy with Guyana’s characteristics: relative to these comparators, Guyana has a considerably lower share of its workers in services, but also a somewhat higher share of its workers in agriculture.
Figure 2-4. Output Structure and Labor Force Structure
The structure of Guyana’s economy by output and labor force are roughly equivalent and show agriculture’s prominent role.
Output Structure Comparisons to other countries, most recent year
30.5
16.611.3 15.1
23.8
27.729.7
31.4
54.756.6
52.945.7
0
10
20
30
40
50
60
70
80
90
100
Guyana E xpected Va lue LMI-LAC LMI
Per
cent
of G
DP
Ag riculture, Va lue Added Industry, Va lue Added S ervices , etc., Va lue Added
Labor Force Structure
27.821.6 21.0
30.3
22.6
17.5 20.0
20.2
60.4 58.149.047.9
0
10
20
30
40
50
60
70
80
90
100
Guyana E xpected Va lue LMI-LAC LMI
Per
cent
of G
DP
Ag riculture Industry S ervices
Source: Guyana Bureau of Statistics and World Development Indicators 2007 CAS Codes: 13P2 a-c, 13P1 a-c

O V E R V I E W O F T H E E C O N O M Y 11
Bearing in mind that nearly ten years has passed since GDP and labor force data were collected, and assuming that the structure of Guyana’s labor force has not significantly evolved, the similarity of output and employment structures suggests that levels of labor productivity could be more or less equivalent across agriculture, services, and industry. This is unusual. As data for LMI-LAC and LMI countries convey, labor productivity is often likely to be relatively low in agriculture, but higher in industry and services.17
In conclusion, productivity and output data indicate that the structural transformation of the economy that is central to the development process is advancing only very slowly in Guyana. Normally, economic development entails a shift from an economy based on agricultural and other primary production to one in which industry and especially services play a dominant role. A review of Guyana’s policy framework is therefore in order to confirm that economic objectives and incentives fully support and reinforce the desired transformation of the economy.
DEMOGRAPHY AND ENVIRONMENT Guyana’s population of 760,000 has been growing at a mere 0.5 percent average annual rate in the past five years (Figure 2-5). While this growth rate is about at Suriname’s level (0.6 percent per annum), it is extremely low in absolute terms and well below the LMI-LAC and LMI medians of 1.4 percent or 1.5 percent. Unfortunately, such low population growth may in large part be attributed to emigration—the flight of human capital from an economically stagnant Guyana. Recent analysis has pointed out than an astonishing estimated 89 percent of highly educated Guyanese are now living in OECD countries (see Education below).18
Guyana also has a relatively low youth dependency rate, which favors economic and human development by reducing the household consumption burden for income earners and by easing the growth of demand for public services. In 2004, the youth dependency rate was 45, meaning that there were approximately 45 youths for every 100 working-age adults. This was well below the expected value of 54 for a country with Guyana’s characteristics, as well as Belize’s ratio of 64. It is also somewhat lower than Suriname’s youth dependency ratio of 48. On the other hand, the elderly dependency ratio for Guyana (7.9) is very much in line with similar statistics for all the comparators.
Also of note is the nation’s low urbanization rate of just 28.2 percent (2005). This is very significantly below all benchmarks, and has shown very little change over time. Such low urbanization reflects the continuing importance of the rural sector in Guyana’s economy, and the lack of any sustained structural transformation (Figure 2-6).
17 Note, however, that Guyana’s Bureau of Statistics (BOS) is updating procedures associated with national income accounting. Such revisions are likely to lead to modifications in the weights BOS applies in estimating shares of agriculture, industry, and services in GDP—the current weights have not changed since 1988. Preliminary reports suggest that with such changes, the sectoral shares of services and industry in GDP may well increase, while that of agriculture may decrease. If so, this would mean that Guyana’s economy had experienced a greater degree of transformation than present statistics and the commentary above seem to indicate.
18 The Economist, “Fruit that Falls far from the Tree,” November 3, 2005.

12 G U Y A N A E C O N O M I C P E R F O R M A N C E A S S E S S M E N T
Figure 2-5. Population Growth Rate
Guyana’s population size is barely increasing.
Comparisons to other countries, most recent year
0.3 1.4 1.5 3.2 0.60.0
0.5
1.0
1.5
2.0
2.5
3.0
3.5
Guyana LMI-LAC LMI Belize S uriname
Per
cent
cha
nge
Source: World Bank, World Development Indicators and Guyana Bureau of Statistics Code: 14P4b
Figure 2-6. Urbanization Rate
Guyana’s low urbanization rate is unusual for a country at its stage of development.
Comparisons to other countries, most recent year Global Standing
28.2 62.8 54.6 48.3 73.9
65.9
0
10
20
30
40
50
60
70
80
Guyana LMI-LAC LMI Belize S uriname
Per
cent
E xpected va lue and marg in of error
Highest-five average
100.0
10.4
GUY
Lowest-five average
Source: World Development Indicators 2007 and Guyana Demographic and Health Survey 2005/06 CAS Code: 14P5

O V E R V I E W O F T H E E C O N O M Y 13
Despite an unusually high rural population, Guyana’s latest statistics (1990) revealed an impressive 98 percent rate of adult literacy. Assuming this level has been maintained, it is well above the expected value (86.8 percent), and available comparator statistics (i.e., the LMI-LAC median of 87.3 percent and Suriname’s 89.6 percent).
GENDER Gender equity enables faster economic growth by ensuring that the productive capacities of all citizens can be developed and used to the fullest extent. Guyana performs well on every basic indicator of gender equity with the notable exception of female labor force participation.
Life expectancy at birth is a fundamental indicator of health conditions. Women in Guyana can anticipate outliving their male counterparts by about six years, which is on par with the expected value for the gender differential between female and male life expectancy for a country with characteristics similar to Guyana’s. Belize, for example, has a gender differential of five years, while Suriname’s differential is also six years. Of greater surprise is the low life expectancy of both males and females in Guyana—the average life expectancy (2004) was 66.7 years for women and 60.6 years for men. These are considerably lower than female and male life expectancy rates in LMI-LAC countries (72.7 and 67.6 years, respectively) or in LMI countries (72.7 and 67.4 years, respectively). Life expectancy in Guyana was low in 1950-1955, at 52.3 years, and improved steadily until the beginning of the 1980s. The spread of HIV/AIDS halted improvements in life expectancy, although this indicator is predicted to reach 71.7 years in 2045-2050.19 This issue is discussed further in the Health section below.
The gross enrollment rate at all levels of schooling for males and females in Guyana is 78 percent (2004). This is slightly lower than Belize’s 81 percent enrollment rate for both sexes, but compares favorably with Suriname, where girls have a gross enrollment rate of 77 percent, but the rate for boys is a much lower 68 percent.
Unfortunately, the favorable indicators of gender equity in education are not matched by equity in labor force participation (Figure 2-7). On the contrary, the labor force participation rate is 87.2 percent for males and just 47.9 percent for females. This high degree of gender inequality in the labor market seriously undermines the country’s productive potential. The extremely high emigration rates among educated Guyanese makes it even more imperative that policymakers focus commensurate attention on creating equitable opportunities for women in the workplace, including programs to train female workers and entrepreneurs, so that all Guyanese can fulfill their productive potential and contribute to national development.
19 United Nations, Department of Economic and Social Affairs, Population Division (2007). World Population Prospects: The 2000 Revision, Volume III.

14 G U Y A N A E C O N O M I C P E R F O R M A N C E A S S E S S M E N T
Figure 2-7. Labor Force Participation Rate, Male and Female
Guyana has a high degree of gender inequality in the labor market.
Comparisons to other countries, most recent year
87.2 87.1 84.7 87.7 69.553.847.9 58.1 46.6 37.30.0
10.0
20.0
30.0
40.0
50.0
60.0
70.0
80.0
90.0
100.0
Guyana LMI-LAC LMI Belize S uriname
%
Labor Force P a rticipa tion Ra te, F ema le Labor F orce P a rticipa tion Ra te, Ma le
Source: World Development Indicators 2007 CAS Code: 15P4a,b

3. Private Sector Enabling Environment This section reviews key indicators of the enabling environment for encouraging rapid and efficient growth of the private sector. Sound fiscal and monetary policies are essential for macroeconomic stability, which is a necessary (though not sufficient) condition for sustained growth. A dynamic market economy also depends on basic institutional foundations, including secure property rights, an effective system for enforcing contracts, and an efficient regulatory environment that does not impose undue barriers on business activities. Financial institutions play a major role in mobilizing and allocating savings, facilitating transactions, and creating instruments for risk management. Access to the global economy is another pillar of a good enabling environment because the external sector is a central source of potential markets, modern inputs, technology and finance, as well as competitive pressure for improving efficiency and productivity. Equally important is development of the physical infrastructure to support production and trade. Finally, developing countries need to adapt and apply science and technology to attract efficient investment, improve competitiveness, and stimulate productivity.
FISCAL AND MONETARY POLICY Fiscal and monetary performance in Guyana has been relatively stable in recent years, thanks to sound policies and prudent management. However, Guyana still confronts serious internal and external imbalances, and, as a small open economy, is vulnerable to external shocks. (See External Sector for discussion of external imbalances and threats.) Hence, its macroeconomic framework needs to be further strengthened, and policy implementation needs to be monitored carefully to ensure support for increased levels of economic growth.
IMF Program Status for Guyana
In 2002, the IMF approved a three-year
Poverty Reduction and Growth Facility
(PRGF) for Guyana. In 2006, Guyana
completed its sixth PRGF on a lapse of time
basis. More recently, Fund authorities
commended the government for
implementing sound macroeconomic
policies but warned of the dangers of large
imbalances, both domestic and external.
Inflation, the main indicator of macroeconomic stability, has been relatively low for Guyana in the present decade, and has averaged about 5.9 percent over the most recent five-year period. In 2006, inflation may have increased slightly to a level of 7.3 percent (yearly average).20 This is somewhat higher than for such comparators as the LMI–LAC and countries (6.3 and 5.2 percent, respectively) and Belize (4.3 percent), but is still within the standard error band for the expected
20 Guyana Bureau of Statistics.

16 G U Y A N A E C O N O M I C P E R F O R M A N C E A S S E S S M E N T
value for a county with Guyana’s characteristics (9 percent), and is well below Suriname’s current inflation of 11.3 percent (2006).
Effective monetary policy to manage money supply growth is important in controlling inflation. In 2006, Guyana’s broad money (M2) increased by 17 percent, a significant acceleration from an annual average growth of 8.3 percent for the previous four years, and no doubt a contributor to the recent up-tick in inflation.21 Much of this expansion in money supply can be attributed to the return to economic growth in 2006, and to significantly increased volumes of credit extended to the private sector during the year, including lending to support preparations for the Cricket World Cup. Containing inflationary pressures associated with such credit expansion and increased spending in a more buoyant economy will continue to be a critical ongoing task for Guyana’s monetary policy managers.
Figure 3-1. Overall Budget Balance, including Grants, % of GDP
High budget deficits have been worsening and are at worrying levels.
Time Series Comparisons to other countries, most recent year Global Standing
-16.0-14.0-12.0-10.0-8.0-6.0-4.0-2.00.0
2003 2004 2005 2006
Year Value
2003 -8.7 2004 -4.5 2005 -13.6 2006 -11.2
Summary for 2003- 2006
Four year average -9.5 Trend growth rate -18.6
-11.2
-1.0-1.5
-5.5
0.1
-2.3
-12
-10
-8
-6
-4
-2
0
2
Guyana LMI-LAC LMI Belize S uriname
Per
cent
E xpected va lue and marg in of error
Highest-five average
6.8
-11.4GUY
Lowest-five average
Source: IMF Article IV Public Notice CAS Code: 21P5
According to the latest IMF figures, Guyana’s budget deficit (including grants) in 2006 was equivalent to an expansionary 11.2 percent of GDP.22 While this level of public sector deficit is a significant improvement over 2005 (deficit of 13.6 percent of GDP), it remains extremely high relative to all comparators: Suriname’s surplus (0.1 percent of GDP); close to five times the expected value for countries with Guyana’s characteristics (deficit of 2.3 percent); and more than double that of Belize (deficit of 5.5 percent). Deficits this large are associated with an overly dominant public sector and signal a domestic economic imbalance for Guyana. Avoiding increased inflation and macroeconomic instability will require reducing the public sector deficit through improved fiscal policy.
21 IMF International Financial Statistics, September 2007. 22 Note: This figure includes government expenditures on the large Skeldon sugar factory.

P R I V A T E S E C T O R E N A B L I N G E N V I R O N M E N T 17
Skillful public sector fiscal management, on both the revenue and expenditure accounts, is imperative to lower the fiscal deficit. On the revenue side, Guyana’s government revenue yield is already relatively high. In 2006, excluding grants and state owned enterprises (SOEs), government revenue yield amounted to some 34.6 percent of GDP. (Including SOEs, this revenue yield rises to 38.7 percent of GDP.) Such figures are substantially above the median for LMI-LAC countries (21.2 percent) as well as those for Belize (23.5 percent) and Suriname (28.7 percent). Also, Guyana’s revenue yield is close to double the expected value of 19.6 percent of GDP that is associated with countries of similar characteristics.
Within government’s revenue base, taxes on income, profits, and capital gains yield 45 percent of total, with taxes on goods and services and international trade generating about 38 percent and 8 percent, respectively. Other taxes account for about 10 percent of revenues. The share of tax revenues arising from income, profits, and capital gains is considerably higher than the equivalent median share for LMI-LAC countries (18.5 percent). Given Guyana’s need to stimulate entrepreneurship and business formation and growth, the prominent role of taxes on income, profits, and capital gains in public revenues may well constitute an excessive burden on the private sector. Fortunately, a comprehensive tax reform program to address this issue is being prepared, and was initiated with the introduction of a value-added tax (VAT) on January 1, 2007.23
On the expenditure side, Guyana’s public sector spending levels are very high. In 2006, the IMF estimated that government expenditures, excluding expenditures on the Skeldon sugar factory program, amounted to 49.6 percent of GDP. When Skeldon is included this swells to 56.2 percent24—approximately double the expected value of 28.4 percent of GDP for a country with Guyana’s characteristics, or Belize’s 29 percent or Suriname’s 28.6 percent. In the last two years, owing in large part to the large-scale, long-term Skeldon project, plus other public spending on infrastructure rehabilitation, government capital expenditures alone have skyrocketed to account for 25.4 percent of GDP (2006). The investment costs of Skeldon represent nearly one-quarter of that amount. By the end of 2008 Skeldon development should be completed, and with strict control of the public sector current and other capital expenditures, Guyana’s government budget deficit should come down to more sustainable levels.
Donors might consider providing assistance to help the Government of Guyana in public expenditure management, as well as in planning and implementing tax reforms. Furthermore, Guyana could also profit from expert support to improve the collection and dissemination of timely, standardized public finance and other economic data.
23 The initial stages of VAT implementation were not entirely smooth. The price rises that accompanied it were higher than anticipated and so led to public pressure to expand the list of zero-rated items. Still, the program is becoming fully operational, and is laying a foundation for further tax reform.
24 Guyana Bureau of Statistics.

18 G U Y A N A E C O N O M I C P E R F O R M A N C E A S S E S S M E N T
BUSINESS ENVIRONMENT Institutional barriers to doing business, including perceived corruption in government, are critical determinants of private sector development and prospects for sustainable growth. A business friendly environment that stimulates the development of the private sector, thereby enabling robust growth, is of particular relevance to Guyana given the present size and dominance of the public sector in the economy and the importance of boosting private sector investment.
The World Bank’s composite Doing Business index for 2007 places Guyana at an unsatisfactory rank of 104 out of 178 countries. Guyana has slipped by six places since 2006, when it was ranked 98th. Whether this decline was due to Guyana’s business environment worsening or due to other economies improving the ease of doing business is unclear. Whatever the cause, maintaining a competitive ranking is important to attract private sector investment in an increasingly global capital market. At 104, Guyana’s ranking is in line with the medians for LMI-LAC countries (104.5) and LMI countries generally (102.5). Suriname’s performance is worse: it is ranked 142 out of 178 countries. Belize has a more favorable 59.
For many of the specific Doing Business indicators, in 2007 Guyana compares favorably to or is on par with the regional medians. These include time to enforce a contract (36 days versus a median of 36.7 days for LMI-LAC); procedures to register property (6 versus 6.7); procedures to start a business (8 versus 12.5); time to register property (34 days versus 45.8 days); and time to start a business (44 days versus 47.7 days).
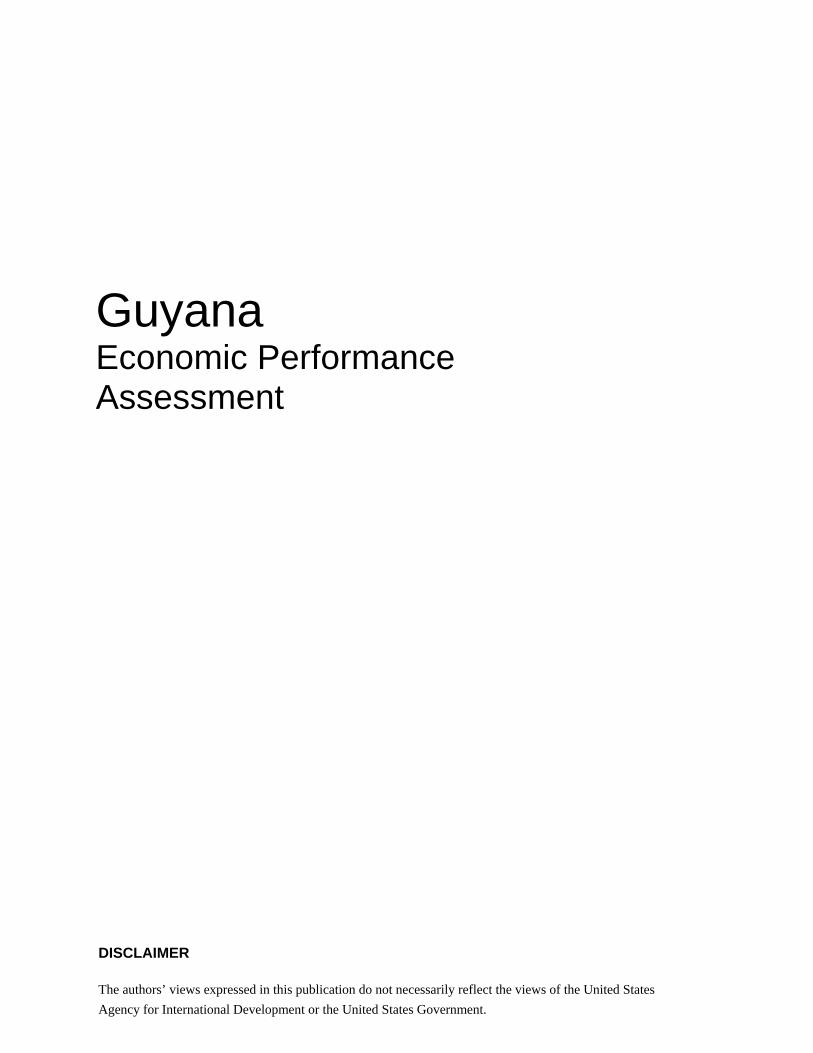
But there are weaknesses. For example, the cost of starting a business in Guyana in 2007 was 87.2 percent of GNI per capita. Though this is much lower than Suriname’s prohibitively high cost of 141.8 percent of GNI, it is much higher than the 57.3 percent for LMI-LAC countries, 33 percent for LMI countries, and 53.1 percent for Belize (Figure 3-2). And this cost disadvantage exists despite the fact that starting a business takes fewer procedures in Guyana (8) than in Belize (9), Suriname (13), or the regional median for LMI-LAC countries (12.5) and LMI countries (10.7). Thus, the main problem appears to be the process itself. Fortunately, the costs have come down significantly from 101.4 and 100.2 percent of GNI in 2005 and 2006, respectively. Although this trend is positive, this process would still seem to remain a severe constraint on the growth of the private sector in Guyana.
Businesses in Guyana face a higher tax burden than some comparators. (See Fiscal and Monetary Policy.) Doing Business for 2007 estimates that the total taxes payable by a standardized business amounts to 39 percent of operating profit in Guyana, as opposed to 30.8 percent in Belize and 27.9 percent in Suriname. This tax burden, however, is about the same as that faced by businesses in LMI-LAC and LMI countries generally (42 percent of operating profit).
Enforcement of contracts is time-consuming in Guyana; the 2007 estimate for the minimum time it takes to enforce a contract through the court system was 581 days. At almost a year and a half, contract enforceability would seem to be a priority area for reform, even though Guyana is on par with the regional median (586 days) and compares favorably with Belize (892 days) and Suriname (1,715 days).
P R I V A T E S E C T O R E N A B L I N G E N V I R O N M E N T 19
Figure 3-2. Cost of Starting a Business, % of GNI per capita
The costs of starting a business are relatively high.
Comparisons to other countries, most recent year
33.087.2 57.3 53.1 141.80
20
40
60
80
100
120
140
160
Guyana LMI-LAC LMI Belize S uriname
Per
cent
Source: World Bank Doing Business Indicators 2007 CAS Code: 22S1
In addition to formal regulations and procedures, poor quality of governance can also be a significant obstacle to doing business. Guyana has a mixed performance on the four World Bank Institute (WBI) indices that summarize the quality of governance: control of corruption, government effectiveness, rule of law, and regulatory quality. Each of these indices is expressed on a scale of -2.5 to +2.5, with a global mean of 0.0.25
In 2006, the government effectiveness index for Guyana was -0.15, versus the expected value of -0.5 for a country with similar characteristics, and scores of -0.2 and 0.0 for Belize and Suriname, respectively. The present rating represents a marked improvement, after a significant deterioration to -0.54 in 2005. This result may be due to the decisive August 2006 election of the current PPP-Civic government, which received an increased Parliamentary majority and a clear mandate for its five-year term.
Under the Rule of Law index, which measures the extent to which agents have confidence in and abide by the rules of society, Guyana was rated a -0.71 in 2006, worse than the expected value of -0.6 for this index for a country with similar characteristics and worse than scores for both Belize (-0.1), and Suriname (-0.2). Guyana’s score was generally deteriorating up to 2005, but the 2006
25 The WBI indices should be used with caution both for comparisons between countries in a single year, due to large standard errors, as well as in tracking a country’s progress over time, since the index does not compensate for changes in the world average.

20 G U Y A N A E C O N O M I C P E R F O R M A N C E A S S E S S M E N T
rating shows a very small improvement. In general, however, concerns over lawlessness in Guyana, including drug crime, police corruption, and increases in armed robberies and kidnappings, are persistent.26 Such concerns undermine the climate for investment and business.
Guyana’s scores under the regulatory quality index, which measures the incidence of market-unfriendly policies as well as perceptions of the burdens imposed by excessive regulation, have deteriorated steadily, reaching -0.48 in 2006. This is worse than the expected value of -0.4 for a country with similar characteristics, worse than Suriname’s -0.4 and for LMI-LAC countries overall, and significantly below Belize’s score of -0.2. In 2006, Guyana’s score on the control of corruption index also deteriorated to -0.61 (Figure 3-3). This is lower than the expected value of -0.5 for a country with similar characteristics, and Belize’s -0.3 and Suriname’s -0.21, but is on par with the median value in LMI-LAC countries (-0.6). Corruption, because it inflates and obscures the actual cost of business and increases risk, tends to be a major deterrent to foreign as well as local investment.
Figure 3-3. Control of Corruption Index
Perceived corruption has increased in the past five years.
Time Series Comparisons to other countries, most recent year
-0.7-0.6-0.5-0.4-0.3-0.2-0.10.0
2002 2003 2004 2005 2006
Year Value 2002 -0.4 2003 -0.4 2004 -0.5 2005 -0.6 2006 -0.6
Summary for 2002-2006 Five year average -0.5 Trend growth rate -9.8
-0.5
-0.30
-0.21
-0.6
-0.61
-0.5
-0.8 -0.7 -0.6 -0.5 -0.4 -0.3 -0.2 -0.1 0.0
Guyana
LMI-LAC
LMI
Belize
S uriname
E xpected va lue and marg in of error
1 (Very Corrupt) - 10 (Lea s t P erceived Corruption)
Source: World Bank, Governance Matters 2007 CAS Code: 22P1
All of these business environment indicators suggest that there is still considerable work to be done to create an environment more conducive to business and investment, one that will build competitiveness and stimulate private entrepreneurship. A National Competitiveness Strategy for Guyana has been formulated, and implementation of the regulatory reforms and enterprise development initiatives it calls for will no doubt require substantial and sustained donor support.
26 The Economist Intelligent Unit, Guyana Country Report, July 2007.

P R I V A T E S E C T O R E N A B L I N G E N V I R O N M E N T 21
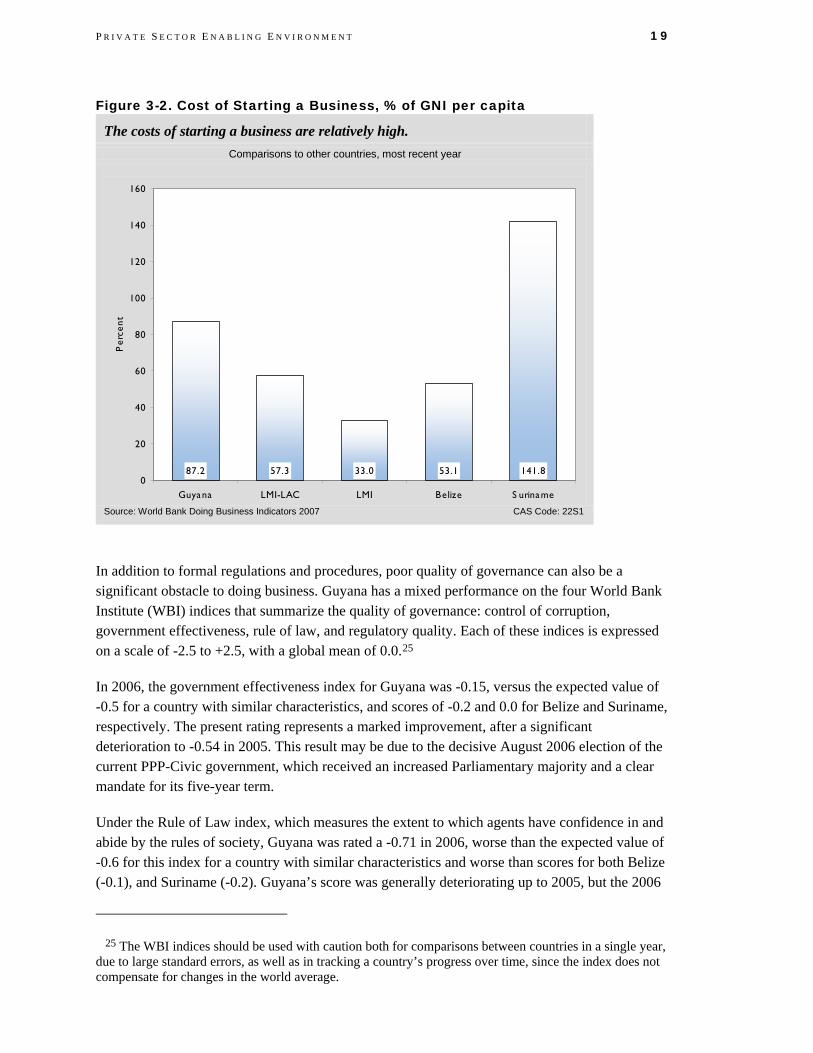
FINANCIAL SECTOR A sound and efficient financial sector is a key to mobilizing savings, fostering productive investment, and improving risk management. Indicators for Guyana’s financial sector present a mixed picture. On some dimensions, Guyana resembles a relatively advanced emerging market economy. For example, its ratio of broad money supply to GDP, a basic gauge of monetization of the economy and development of the banking system, is favorable. The broad money supply in 2006 equaled 104.2 percent of GDP, more than double the expected value (41.4 percent) of this ratio for a country with similar characteristics (Figure 3-4). For this indicator, Guyana is more on a par with Thailand (105 percent) than its neighbors (e.g., Belize at 56.7 percent or Suriname at 55.5 percent) or the median for LMI-LAC countries (38 percent). At the same time, however, caution is warranted . Guyana’s broad money as a percentage of GDP was 77 percent of GDP in 2000, and the ratio has risen steadily since then. With little growth in its denominator (GDP), increase in this ratio appears to be due in large part to money supply growth. Our Fiscal and Monetary Policy discussion above underscores the potential inflationary risks associated with such rapid expansion in the money supply.
Figure 3-4. Money Supply, M2, % GDP
Guyana resembles an emerging market in its degree of monetization.
Time Series Comparisons to other countries, most recent year
80.085.090.095.0
100.0105.0110.0
2002 2003 2004 2005 2006
Year Value 2002 91.2 2003 95.9 2004 96.9 2005 97.3 2006 104.2
Summary for 2002- 2006 Five year average 97.1 Trend growth rate 2.8
104.2 38.0 38.4 56.7 55.5
41.4
0
20
40
60
80
100
120
Guyana LMI-LAC LMI Belize S uriname
Per
cent
E xpected va lue a nd marg in of error
Source: World Development Indicators 2007 and IMF International Financial Statistics CAS Code: 23P3
Credit to the private sector is another relatively positive and improving financial sector indicator for Guyana. Measured as a percent of GDP, credit to the private sector has expanded in recent years, recovering from a low of 53 percent of GDP in 2004 to reach about 60 percent of GDP in 2006 (Figure 3-5). While still below Belize’s 64 percent, Guyana outperforms the expected value (34 percent) of this ratio for a benchmark country with similar characteristics, as well as the medians for LMI-LAC (26.8 percent) and LMI countries (24.5). The recent expansion in private sector credit is reported to be driven in part by preparations for the Cricket World Cup in early 2007, which included the building of hotels and bed-and-breakfast rooms in private homes, and

22 G U Y A N A E C O N O M I C P E R F O R M A N C E A S S E S S M E N T
led to increased mortgage lending. Unfortunately, the tournament turned out to be disappointing, with only about a third of the expected tourists turning up.27 This raises the possibility of a rise in non-performing loans. If so, credit conditions for the private sector could tighten once again, and this ratio could deteriorate.
Figure 3-5. Domestic Credit to Private Sector, % GDP
Domestic credit to the private sector is recovering.
Time Series Comparisons to other countries, most recent year Global Standing
48.050.052.054.056.058.060.062.064.0
2002 2003 2004 2005 2006
Year Value 2002 62.1 2003 57.5 2004 53.2 2005 57.1 2006 59.9
Summary for 2002- 2006 Five year average 58.0 Trend growth rate -0.8 59.9 26.8 24.5 64.0 25.8
34.0
0
10
20
30
40
50
60
70
Guyana LMI-LAC LMI Belize S uriname
Per
cent
E xpected va lue and marg in of error
Highest-five average
175.6
2.3
GUY
Lowest-five average
Source: IMF International Finance Statistics CAS Code: 23P1
Guyana shows a disturbingly large spread between the lending and deposit rates, signaling inefficiency in financial intermediation. In 2006, this spread was 12.0, and had persisted at about this level for the past five years. While this figure is in the range of the expected value plus standard error band for a country with similar characteristics, it exceeds the interest rate spread for various comparators. Suriname’s interest rate spread is 10.1, which is also the median for LMI-LAC countries. Belize has a significantly more efficient interest rate spread of 6.5, as do the LMI countries (median spread of 7.1).
Consistent with the financial sector inefficiency suggested above, a survey of enterprises in Guyana in 2004 revealed that more than 60 percent of the firms cite access to/cost of financing to be a ”major” or ”very severe” obstacle to firm-level investment.28 The same survey also found that 100 percent of loans in Guyana require collateral, and the value of the collateral is on average a whopping 223 percent of the loan amount. Although credit conditions have eased considerably since 2004, credit is still likely to be a major constraint on a vibrant private sector in Guyana.
27 The Economist, “Stumped,” May 3 2007. 28 Summary of the enterprise survey available by selecting Guyana at the World Bank web site:
http://www.enterprisesurveys.org/ExploreEconomies/

P R I V A T E S E C T O R E N A B L I N G E N V I R O N M E N T 23
Turning to the institutional foundations for financial sector development, Guyana received a score of 3 on the World Bank’s index of Legal Rights of Borrowers and Lenders for 2006, on a scale of 0 (poor) to 10 (excellent). This relatively weak score is in line with the median performance of LMI-LAC countries (also 3) and Suriname and LMI countries (both 4), but is markedly below the score of 7 for Belize This indicator shows the need for further legal and regulatory reform to facilitate the expansion of bank credit to the private sector.
Guyana’s financial sector development issues may offer several opportunities for useful donor assistance. The Bank of Guyana has begun implementing many of the recommendations made by an IMF Financial Sector Assessment Program conducted in 2005.29 Technical assistance could broadly support this program. For example, such assistance could focus on strengthening bank supervision, since expanding private sector credit and the risk of rising numbers of non-performing loans puts new pressure on the banking system and its regulators. Donors might also support establishment of a credit bureau, an institution Guyana lacks. By documenting responsible business and borrowing behavior, a credit bureau helps reduce information costs and asymmetries between lenders and borrowers, thereby leading to increased and more efficient loan activities, possibly including reduced collateral requirements.
EXTERNAL SECTOR Fundamental changes in international commerce and finance, including reduced transport costs, advances in telecommunications technology, and lower policy barriers, have fueled a rapid increase in global integration in the past 25 years. The international flow of goods and services, capital, technology, ideas, and people offers great opportunities for Guyana to boost growth and reduce poverty by stimulating productivity and efficiency, providing access to new markets and ideas, and expanding the range of consumer choice. At the same time, globalization creates new challenges, including the need for reforms to take full advantage of international markets, and cost-effective approaches to cope with the resulting adjustment costs.
Guyana is a small and very open economy that relies very heavily on foreign trade. In this respect, it resembles the small island economies of the Caribbean more than it resembles its neighbors in Latin America. It is therefore highly vulnerable to external shocks (e.g., movements in the world price of petroleum) and to fluctuations in production and price of the few primary commodities that constitute the bulk of its exports. All of this introduces volatility into Guyana’s real GDP growth path, and can create large and disruptive external imbalances for the economy to overcome.
International Trade and Current Account Balance Guyana’s total trade—exports plus imports of goods and services—amounts to 210 percent of GDP (2006 data). This figure underscores the economy’s openness, and is vastly higher than the total trade/GDP ratio of LMI countries (83.3 percent) or LMI-LAC countries (63.9 percent). By
29 IMF Public Information Notice 07/53.

24 G U Y A N A E C O N O M I C P E R F O R M A N C E A S S E S S M E N T
comparison, in 2005, the total trade ratio for Suriname was 101 percent of GDP, and for Belize 118.2 percent of GDP.
In 2005, the latest year for which data are available, Guyana’s concentration of exports (percentage of total exports represented by the top three export product groups) measured 53 percent, which compares favorably with Belize’s 64.2 percent, and Suriname’s extremely high 92.5 percent (2001 data). Nevertheless, this figure shows that the economy remains highly dependent on exports of a few primary commodities. In value terms, Guyana’s main exports are sugar, gold, timber, bauxite, rice and shrimp. These six items—particularly sugar and gold—dominate Guyana’s overall exports, constituting about 85 percent of total export value in 2006,30 a proportion that has remained fairly stable since 2002. Export diversification is clearly a priority for Guyana.
Since 2002, exports have grown in value by about 20 percent, despite the global boom in commodity prices generally.31 Most recently, measured in current U.S. dollars, export shipments grew by 7.5 percent in 2006, after falling by 6.5 percent in 2005.32 To understand these recent movements, and to separate out terms of trade shifts from those in export quantity, we compute the changes in volumes exported for the primary commodities.33 In 2005, record floods affected the production of both rice and sugar, resulting in sharply decreasing export volumes for rice (down 25.1 percent) and for sugar (down 20.5 percent). Although world gold prices skyrocketed, the volume of Guyana’s gold exports still dropped by 26 percent because the important Omai gold mine closed in 2005. And though export volumes of bauxite grew by 10.8 percent and timber by 12.2 percent, these increases were insufficient to offset poor performance by other commodities, and the overall value of Guyana’s exports fell for the year.34
Some recovery occurred in 2006, with the volume of rice exports growing by 12.3 percent, and the volume of sugar exports increasing by a more modest 3.6 percent. Gold exports continued to contract, with export volumes decreasing by another 25 percent in 2006, again despite a huge and prolonged run-up in world gold prices. Bauxite volumes also decreased by 6 percent. By contrast, timber posted an explosive 43.7 percent growth in volume. Thus, Guyana’s 7.5 percent increase
30 The concentration of exports indicator is obtained from ITC COMTRADE data, while the share of the six main export commodities in total exports is computed from statistics provided in the Bank of Guyana Half Year Report 2007. There may be small discrepancies between exports figures obtained from the national authorities, and those reported by ITC COMTRADE and WDI.
31 IMF Public Information Notice 07/53. 32 The standard indicator included in the database measures the annual growth rate of exports of goods
and services based on constant local currency units. These data are not available for Guyana beyond 2002. Given the importance of the performance of exports in explaining the recent performance of Guyana’s economy, we use the more up-to-date data on exports growth in current U.S. dollars obtained from the IMF Public Information Notice No. 07/53.
33 Bank of Guyana Half Year Report 2007. 34 The exports of shrimp are not broken down into volume and unit price, and so the same analysis cannot
be carried out for them.

P R I V A T E S E C T O R E N A B L I N G E N V I R O N M E N T 25
in exports in 2006 appears to be in part due to the inflated price of gold—even with smaller export volumes—along with increases in the volume of rice, sugar, and timber exports.
Figure 3-6. Current Account Balance, % of GDP
The current account deficit is extremely large and still expanding.
Time Series Comparisons to other countries, most recent year Global Standing
-30.0
-25.0
-20.0
-15.0
-10.0
-5.0
0.02002 2003 2004 2005 2006
Year Value 2002 -8.6 2003 -11.9 2004 -8.9 2005 -19.1 2006 -28.0
Summary for 2002- 2006 Five year average -15.3 Trend growth rate -28.3
-28.0
-10.7
-14.4
-3.4-1.6
-3.2
-30
-25
-20
-15
-10
-5
0
5
Guyana LMI-LAC LMI Belize S uriname
Per
cent
E xpected va lue and marg in of error
Highest-five average
21.0
-20.5
GUY
Lowest-five average
Source: World Development Indicators 2007 and computation using IMF Public Notice no. 07/53 CAS Code: 24P2
On the goods import side, the value of Guyana’s imports has risen by almost two-thirds since 2002, including jumps of 22 percent (2005) and 19 percent (2006).35 One of Guyana’s main imports is petroleum, and rapid rises in the world price of petroleum in the last two years have contributed significantly to this pattern. Large-scale imports of capital equipment for modernization of the Skeldon sugar factory and a pronounced recovery in foreign direct investment (FDI) have generated much of the increase in import value. Capital and consumer goods imports in preparation for the 2007 Cricket World Cup were also important factors.
With imports greatly outstripping exports, Guyana’s current account has worsened significantly in recent years. At the end of 2006, the current account deficit stood at -28 percent of GDP (Figure 3-6). This is a sharp deterioration from the deficit recorded in 2004 (-9 percent of GDP). This number is orders of magnitude below the range (expected value plus standard error) predicted for a country with similar characteristics (8 percent), as well as the current account positions of Belize (-14.4 percent), Suriname (-10.7 percent), LMI-LAC countries (-1.6 percent), and LMI countries (-3.4 percent). Such a large external imbalance is clearly unsustainable. Fortunately, prospects for improvement are good. Imports should slow with completion of the Skeldon sugar factory program and as various other FDI-supported projects come on line. And with improved plant and equipment, export growth should pick up, assuming that the sugar sector modernization program achieves planned increases in output, and gold and other sectors benefit from investment in new facilities to expand production.
35 IMF Public Information Notice 07/53.

26 G U Y A N A E C O N O M I C P E R F O R M A N C E A S S E S S M E N T
Figure 3-7. Remittance Receipts, % of Exports
Guyana benefits from very large remittances from Guyanese working abroad.
Time Series Comparisons to other countries, most recent year Global Standing
0.05.0
10.015.020.025.030.035.0
2001 2002 2003 2004 2005
Year Value 2001 3.4 2002 7.7 2003 14.9 2004 20.5 2005 29.0
Summary for 2001- 2005 Five year average 15.1 Trend growth rate 52.7 29.0 21.0 7.9 6.7 0.1
11.6
0
5
10
15
20
25
30
35
Guyana LMI-LAC LMI Belize S uriname
Per
cent
Highest-five average
83.1
0.0
GUY
Lowest-five average
Source: World Development Indicators 2007 CAS Code: 24P9
But for net private transfers—remittance receipts—Guyana’s current account deficit would be even deeper. The one silver lining to massive emigration of the educated elite and other workers (see Demography and Environment) has been remittances. Measured as a percentage of exports, Guyana’s remittances have grown massively in this decade, and now stand at 29 percent of exports (2005 data), up from only 3.4 percent five years earlier. This figure for remittance receipts is almost three times the expected value of 11.6 percent for a country with similar characteristics and greatly exceeds the ratios for all comparators: Belize (6.7) Suriname (0.1), and the medians for LMI-LAC countries (21 percent) and LMI countries (7.9 percent). Such remittances are generally an important factor in poverty reduction, and have generally led to higher savings, investment, and growth in recipient economies.
FDI, External Debt and Exchange Rate Inflows of FDI to Guyana exploded to almost 10 percent of GDP in 2005, up from 3.8 percent in 2004, and played an important role in financing the current account deficit (Figure 3-8). Telecommunications and mining may be major destination sectors for FDI. Although detailed figures are not yet in the public domain, the Bank of Guyana reports that net private capital flows (the sum of net FDI and net portfolio investment) expanded both in 2006 and 2007.36 Over the long term, Guyana is unlikely to sustain FDI inflows at present high levels—inflows for 2005 dwarfed the expected FDI value of 4.2 percent of GDP for a country with similar characteristics, and the 3.5 percent and 2.7 percent median FDI/GDP ratios for LMI-LAC and LMI countries respectively. Only Belize, with an FDI inflow equivalent to 11.4 percent of GDP exceeds Guyana among comparators. Strategic opportunities to attract additional FDI to Guyana appear to exist,
36 Bank of Guyana Annual Statistics, December 2006, and Bank of Guyana Half Year Report 2007. Net portfolio investment likely represents only a modest share of this flow of net private capital.

P R I V A T E S E C T O R E N A B L I N G E N V I R O N M E N T 27
notably in the sugar sector and in private infrastructure development (e.g., electric power). FDI can catalyze productivity gains and growth by transferring technology, developing human capital, and enhancing competition. Donor assistance to improve business environment—the most fundamental incentive in attracting FDI—could generate high returns in this respect.
Figure 3-8. Foreign Direct Investment, % of GDP
Guyana’s FDI Inflows have surged.
Comparisons to other countries, most recent year
9.8 3.5 2.7 11.4
4.2
0
1
2
3
4
5
6
7
8
9
10
11
12
Guyana LMI-LAC LMI Belize
Per
cent
E xpected va lue and marg in of error
Source: World Bank Doing Business Indicators 2007 CAS Code: 22S1
Foreign aid flows to Guyana have been relatively high and even increasing over the past 5 years. Aid as a share of Guyana’s GNI stood at 18.5 percent in 2005, much above the 5.1 percent expected value of this ratio for a country with similar characteristics. Such aid flows also much exceed the aid/GNI ratios for comparators: 0.7 percent median in LMI-LAC countries, 3.1 percent median in LMI countries, 1.3 percent in Belize, and 3.8 percent in Suriname. Much of this aid is in the form of debt relief and grants in connection with the Heavily Indebted Poor Country (HIPC) Initiative, and the Multilateral Debt Relief Initiative (MRDI). In 2006, for example, the IMF provided 100 percent debt relief under the MDRI on all Guyana’s debt incurred to the IMF before January 1, 2005.37 Other international public creditors may also act likewise in the MDRI framework. Other official transfers not related to debt relief are also likely to be
37 IMF press release no 05/294, December 23, 2005.

28 G U Y A N A E C O N O M I C P E R F O R M A N C E A S S E S S M E N T
forthcoming (e.g., grants or loans during 2007 from the Millennium Challenge Corporation in public finance and the Inter-America Bank in power sector restructuring).38
As a result of debt relief and concessional borrowings, Guyana’s total external debt outstanding and debt service levels have decreased significantly. But even so, the present value of Guyana’s debt obligations is still high: equivalent to 84 percent of gross national income (GNI) at the end of 2005, the most recent data available. This is within the expected value and standard error band for the ratio of present value of external debt/GNI for a country with Guyana’s characteristics, but is well above LMI-LAC and LMI medians of 46.2 and 39 percent, respectively. It is well below Belize, however, with present value of external debt of 116 percent of GNI. On the other hand, Guyana’s ratio of debt service to export earnings in 2006 was a low 5.6 percent. This debt service burden is much lighter than the expected value of 21 percent for a country with similar characteristics, as well as the LMI-LAC median of 8.8 percent, the LMI median of 10.1 percent, and Belize’s 36.9 percent.
Substantial levels of debt relief, FDI inflows and remittance receipts have made it possible for gross official reserves to actually increase over the last two years. Gross reserves at end 2006 reached about US$278 million, up from US$225 million at end 2004. The figure for 2006 is equivalent to slightly less than 3 months’ goods and services imports. This is an acceptable threshold level, but is still below the expected value of 4.6 months of imports for a country with Guyana’s characteristics, and slightly below the LMI-LAC median of 3.6 months and the LMI median of 3.3 months. However, Guyana’s reserves are significantly above Belize’s 1 month of imports and Suriname’s 1.1 months. Given the openness of Guyana’s economy, maintaining an adequate level of international reserves is an important tool for cushioning external shocks.
Over the past few years, and even with Guyana’s large and growing current account deficits, the nominal exchange rate has been relatively stable, in the range of G$200 to US$1. This stability is due to significant capital inflows from debt relief and FDI easily covering the deteriorating current account. Such exchange rate stability is important because it builds confidence in the business climate among private sector firms and investors. Moreover, Guyana’s real effective exchange rate (REER, a trade-weighted average of major currencies adjusted for inflation differentials and a key measure of competitiveness) has also been fairly stable over time, apparently with some measure of depreciation in 2006 to offset REER appreciation in the previous year.
In sum, despite the imbalances arising from surging imports and evident in substantial current account deficits, Guyana has been able to manage its external sector challenges. Continuing debt relief, high levels of FDI, and reliable remittance receipts are essential to finance massive deficits on merchandise trade, at least until import levels begin to decline and exports rise. However, in the foreseeable future, Guyana will still be highly vulnerable to economic shocks ranging from natural disasters (e.g., floods) that disrupt export production, to adverse global price movements (e.g., rising oil prices or declining prices for its export commodities) that undermine efficiency
38 The Economist Intelligence Unit, Guyana Country Report, July 2007.

P R I V A T E S E C T O R E N A B L I N G E N V I R O N M E N T 29
and earnings. Perhaps the most immediate likely shock will be impacts from the European Union’s plan to reduce the price it pays for sugar over a four-year period beginning in 2006. Rapid completion of sugar sector modernization to raise productivity and output must be part of Guyana’s response. But in the long term an equally important response must be diversification and value addition in exports, including expansion of manufactured exports, now only about 20 percent of Guyana’s export shipments. Achieving such goals requires accelerating the structural transformations of Guyana’s economy that are central to development, as emphasized earlier (see Economic Structure).
ECONOMIC INFRASTRUCTURE A country needs good physical infrastructure—for transportation, communications, power, and information technology—to strengthen competitiveness and expand productive capacity. Guyana’s infrastructure systems are relatively weak. The World Economic Forum (WEF) compiles an annual index of infrastructure quality based on a survey of executive opinion in each country. In 2006, on a scale from 1 (poor) to 7 (excellent), Guyana’s score on the Overall Infrastructure Quality Index was 2.2 (Figure 3-9). This is lower than the expected value of 2.5 of a country with Guyana’s characteristics and lower than the medians for LMI-LAC countries (2.9), LMI countries (2.9), and Suriname’s score of 2.5.
Figure 3-9. Overall Infrastructure Quality Index
Poor infrastructure quality threatens growth performance.
Comparisons to other countries, most recent year Global Standing
2.9
2.5
2.9
2.2
2.5
0.0 0.5 1.0 1.5 2.0 2.5 3.0 3.5
Guyana
LMI-LAC
LMI
S uriname
E xpected va lue and marg in of error
1 (Very P oor) - 7 (E xcellent) Highest-five average
6.6
1.7
GUY
Lowest-five average
Source: Global Competitiveness Report 2007-2008 CAS Code: 25P2
Within infrastructure, power and transport systems appear to be particularly serious constraints. On a quality of electric supply index, Guyana receives a score of 2.1, while LMI-LAC and LMI countries both hold median ratings of 3.9 and Suriname scores 2.7. A combination of very high power costs per KWh, power outages, and delays in obtaining connections are all factors limiting

30 G U Y A N A E C O N O M I C P E R F O R M A N C E A S S E S S M E N T
productivity in industry and services.39 For transport, Guyana scores 3.3 in air transport infrastructure and 2.3 in port infrastructure, both relatively poor and substantially below the median ratings for LMI-LAC countries for these systems.
On the other hand, Guyana appears to be advancing fairly well in ICT development. Telephone density, the number of telephone lines and mobile phones per 1,000 people, is 521.2 for Guyana (2005 data). This is a marked improvement over 2001 and represents consistent year-to-year growth, no doubt due to an explosion in cell phone use. This telephone density is much higher than the expected value of 408 lines per 1,000 people associated with a country with Guyana’s characteristics. Guyana’s scores are higher than in LMI-LAC countries (443), LMI countries (260), and Belize (433). Only Suriname’s rating is better, at 699 lines per 1,000 people.
Similarly, the number of internet users per 1,000 people is higher in Guyana, at 213 users (2005 data), than in LMI-LAC countries (70.6 users) and LMI countries (53.6 users). It is also much higher than Guyana’s expected value of 59.5 users, and exceeds the actual number of users for Belize (130.2) and Suriname (71.2).40
In summary, with the exception of the ICT sector, where Guyana is doing relatively well, overall economic infrastructure remains problematic and risks further impeding an already poor growth performance. Donor assistance may be useful in these areas—perhaps in helping to develop public-private partnerships and private sector participation (PSP) approaches to upgrade physical infrastructure systems, especially in the electricity and transport sectors.
SCIENCE AND TECHNOLOGY Because technical knowledge is a driving force for rising productivity and competitiveness, science and technology are central elements of a dynamic growth process. Transformational development increasingly depends on acquiring and adapting technology from the global economy to apply it in ways that are appropriate to a country’s level of development. The inability to access and use technology prevents an economy from benefiting from globalization.
Unfortunately, few international indicators of science and technology are available for judging performance in Guyana. The country’s score on the FDI Technology Transfer Index—where a value of 1 means FDI brings little new technology and a value of 7 means FDI is an important source of new technology—is 3.9, below the expected value of 4.6 for a country with Guyana’s
39 According to the World Bank’s Enterprise Survey database, Guyanese businesses need 93.35 days to obtain an electrical connection vs. 32.88 days for firms in the region; and face on average 41.18 days of electrical outages vs. 17.78 days in the region. For Guyana’s scores on the World Bank Enterprise Survey, see www.enterprisesurveys.org/ExploreEconomies/Default.aspx?economyid=84.
40 The picture becomes a bit more mixed when business use of the internet is considered. World Bank analysis suggests that while individual internet use is fairly high, only 17 percent of Guyana’s companies use websites and only 31 percent use email regularly. This relatively low use may be due to the elevated cost of high-speed internet access in Guyana: businesses generally are only interested in high-speed DSL service, and Guyana’s DSL rates run about US$175 for business users versus US$50 in other Latin American countries. See World Bank, Guyana Investment Climate Assessment, Volume II Detailed Findings and Recommendations, Report no. 35951-GY, June 21, 2007, page 92.

P R I V A T E S E C T O R E N A B L I N G E N V I R O N M E N T 31
characteristics. It is also below the median for LMI-LAC and LMI countries (4.9) and below Suriname’s score of 4.5. Technology is an important element of modern economic growth, and Guyana should intensify efforts to encourage technology transfer in the FDI projects it attracts.
Another indicator of performance in science is an index of the availability of scientists and engineers, with 1 denoting low and 7 high availability. Guyana performs poorly at 2.9, well below its expected value of 3.8, the median scores for LMI-LAC and LMI countries (3.6 and 4.2, respectively), and Suriname at 3.5. Emigration is clearly a major factor in Guyana’s poor showing on this indicator. According to a recent IMF study, 89 percent of Guyanese workers with tertiary education and 43 percent with secondary education migrated to OECD member countries between 1965 and 2000.41 This is a serious loss to the Guyanese economy.
41 See “Emigration and Brain Drain: Evidence From the Caribbean,” IMF Working Paper 06/05, 2006.


4. Pro-Poor Growth Environment Rapid growth is the most powerful and dependable instrument for poverty reduction, yet the link from growth to poverty reduction is not mechanical. In some cases, income growth for poor households exceeds the overall rise in per capita income, while in other instances growth benefits the non-poor far more than the poor. A pro-poor growth environment stems from policies and institutions that improve opportunities and capabilities for the poor while reducing their vulnerabilities. Pro-poor growth is associated with improvements in primary health and education, the creation of jobs and income opportunities, the development of skills, microfinance, agricultural development, and gender equality. This section focuses on four of these issues: health, education, employment and workforce, and agricultural development.
HEALTH Basic health services provision is crucial to the creation of human capital and thus a significant determinant of growth and poverty reduction. Although health programs do not fall under the EGAT bureau, an understanding of health conditions can influence the design of economic growth interventions.
On certain health sector indicators, Guyana scores fairly well. For example, in 2006, government expenditure on health was equivalent to 5.6 percent of GDP, well above the 3.6 percent LMI-LAC average and rates for comparator countries (Belize, 2.7 percent; Suriname, 3.6 percent). Similarly, according to the Guyana HIV/AIDS Indicator Survey 2005, access to improved sanitation was 90.4 percent, and access to improved water sources was 95.1 percent. 42 Both numbers are above the relevant LMI-LAC averages of 90 percent (water) and 78 percent (sanitation), and above rates for Belize and Suriname (save in sanitation for the latter, whose access rate is 94 percent). Moreover, Guyana’s child immunization rates are also relatively high—93 percent of Guyanese children are immunized—surpassing the LMI-LAC (88 percent) and LMI (91 percent) country averages and Suriname’s rate (87 percent), but still trailing Belize (96 percent).
42 Ministry of Health (Guyana), Guyana Responsible Parenthood Association, and ORC Macro. 2006. Guyana HIV/AIDS Indicator Survey 2005. Calverton, Maryland, USA: Ministry of Health, Guyana Responsible Parenthood Association, and ORC Macro.

34 G U Y A N A E C O N O M I C P E R F O R M A N C E A S S E S S M E N T
But certain other health sector indicators are less favorable. On life expectancy, a commonly applied core indicator of country health conditions, Guyana fares badly. In 2005 life expectancy at birth in Guyana stood at just 64 years, significantly lower than its benchmark expected value (71 years), and life expectancy figures for both comparators: Belize, 72 years, and Suriname, 70 years. One possible explanation for this differential is the major impact of HIV/AIDS on Guyana. In 2005, UNAIDS estimated that 2.4 percent of the population had HIV/AIDS, above the expected value (0 percent) for a country with Guyana’s characteristics and above Suriname (1.9 percent), though marginally below Belize (2.5 percent).
Figure 4-1. Life Expectancy at Birth, Years By this core indicator, Guyana’s performance in the health sector is poor.
Comparisons to other countries, most recent year Global Standing
64.370.7 69.4 71.8 69.7
71.1
0
10
20
30
40
50
60
70
80
Guyana LMI-LAC LMI Belize S uriname
Yea
rs
E xpected va lue and marg in of error
Highest-five average
80.9
37.2
GUY
Lowest-five average
Source: UNDP and Guyana Demographic and Health Survey 2005/06 CAS Code: 31P2
Maternal mortality is also high in Guyana. In 2000, it was estimated that 170 Guyanese mothers died per 100,000 live births. Although this is lower than the expected rate of 198 deaths, it is much higher than rates for all comparator countries, which range from 110 maternal deaths for Suriname to the average of 150 maternal deaths for LMI-LAC countries. This gap cannot be explained by differences in the number of births attended by skilled personnel, since for Guyana this figure is 85.6, roughly on par with the averages for LMI-LAC and LMI countries (85.1 and 89.8 respectively).
Child malnutrition is another problem. In 2000, it was estimated that 13.6 percent of children were underweight for their age. Although essentially at Suriname’s level (13.2 percent), this rate is much worse than the average for LMI-LAC countries (7.6 percent). This basic health deficiency for Guyana raises serious concerns about long-term growth prospects, because the health and productivity of tomorrow’s workers depends on the nourishment of today’s children.
Given this uneven profile of health sector performance, it is apparent that while Guyana’s health spending may be relatively generous and has certainly achieved some good results, significant

P R O - P O O R G R O W T H E N V I R O N M E N T 35
opportunities exist for donors to help raise the effectiveness of this expenditure. For example, donors might consider funding programs to stop the spread of HIV/AIDS, improve child nutrition, or reduce maternal mortality, among other strategic initiatives.
EDUCATION Investment in human capital is a cornerstone for economic growth and development. For Guyana, much of the evidence at hand demonstrates mixed performance in the education sector, though data that would permit inter-country comparisons for important indicators are often lacking.43
For a key measure, primary enrollment, the Guyana HIV/AIDS Indicator Survey 2005 reveals that total net primary enrollment is 90.6 percent and varies little between males and females.44 This is on par with the expected value for Guyana of 92.5 percent, albeit somewhat lower than the rates in Belize (95.9) and Suriname (94.2).
Worryingly, between 1999 and 2001 (the latest year for which data are available) there was a large decrease in the persistence of primary school children to grade five. In 2001, the rate plunged to 64.3 percent from 97.4 percent just two years before. This precipitous decline seems rather unrealistic, perhaps all the more so because this most recent figure is much lower than the expected value of 77.5 percent for a country with Guyana’s characteristics. Data problems may make the indicator unreliable.
In any event, on the brighter side, again according to the Guyana HIV/AIDS Indicator Survey 2005, the net secondary school enrollment rate is 70.4 percent, higher than the average number for LMI-LAC countries (61.8 percent), though a bit below rates for Belize (72.6 percent) and Suriname (74.7 percent). On tertiary enrollment, however, Guyana falls short. In 2005, gross tertiary enrollment was just 9.9 percent. This is much lower than the expected value of 30.9 percent for a country with Guyana’s characteristics, a bit lower than Suriname (12.4 percent), but much above Belize (2.6 percent).
Education quality is difficult to measure. At the primary level, a crude but common proxy is the pupil/teacher ratio. In Guyana, this ratio has been modestly increasing since 2002 to reach 28 pupils per teacher in 2004. Guyana’s standard is at the average of LMI-LAC countries (27.4), but higher than that in LMI countries (24.2) and Belize (22.5). Only Suriname fared better, with 18.6 pupils per teacher. However, the 2007 MDG Report specifies that the Guyana pupil-to-qualified-teacher ratio is 50, revealing a much grimmer picture of education quality.45
43 For example, a basic and widely applied indicator for measuring educational outcomes is the youth literacy rate. Unfortunately, Guyana does not collect these data. Hence, specialist donor assistance might be enlisted to design and deliver programs to help Guyana develop comprehensive education sector statistics.
44 Ministry of Health (Guyana), Guyana Responsible Parenthood Association, and ORC Macro. 2006. Guyana HIV/AIDS Indicator Survey 2005. Calverton, Maryland, USA: Ministry of Health, Guyana Responsible Parenthood Association, and ORC Macro
45 Guyana Millennium Development Goals Report, 2007

36 G U Y A N A E C O N O M I C P E R F O R M A N C E A S S E S S M E N T
Figure 4-2. Educational Expenditure per Student
Guyana commits significant resources to education.
Comparisons to other countries, most recent year
16.2 12.037.2 37.111.617.10
5
10
15
20
25
30
35
40
Guyana LMI-LAC
Per
cent
E duca tiona l E xpenditure per S tudent, % GDP per capita , P rimaryE duca tiona l E xpenditure per S tudent, % GDP per capita , S econdaryE duca tiona l E xpenditure per S tudent, % GDP per capita , Tertia ry
Source: World Development Indicators 2007. CAS Code: 32S2a,b
Overall commitment of resources is another gauge of quality. By this standard, Guyana scores reasonably well. For example, as a share of GDP per capita, Guyana’s expenditure for primary school education was 17.1 percent in 2005, higher than all benchmarks. Expenditure for secondary school education was 16.2 percent of GDP per capita, higher than in LMI-LAC countries (12 percent) but lower than in LMI countries and Belize (17.1 percent and 18.4 percent). Tertiary education expenditure rates for Guyana were slightly higher (37.2 percent of GDP per capita) than in LMI-LAC and LMI countries (each 37.1 percent). Whatever other issues such expenditures might raise, this relatively heavy investment in education makes Guyana’s high rate of emigration all the more striking—and stresses the losses that human capital flight imposes on the home economy.
EMPLOYMENT AND WORKFORCE Guyana has a labor force of about 330,000 workers (2005 data). The average growth rate of the workforce in the last five years has been about 1.1 percent per year. Normally the economy should readily absorb this increment of slightly more than 3,600 new workers each year. However, Guyana’s recorded unemployment was about 9.1 percent of its total work force in 2001, the most recent year for which data are available. This rate is more or less in line with the expected value (11.3 percent) plus standard error band (+/- 2.5 percent) for unemployment in a country with Guyana’s characteristics, and for the comparators: LMI country average, 10.2 percent; Belize, 10 percent; and LMI-LAC country average, 9.1 percent.

P R O - P O O R G R O W T H E N V I R O N M E N T 37
With Guyana’s growth stagnant for most of this decade, it is unlikely that the unemployment rate declined significantly. Indeed the 2004 survey of enterprises revealed that employment growth from 2001 to 2004 was only 7.6 percent in Guyana, much lower than in the LAC region (29.1 percent).46
Figure 4-3. Economically Active Children, Percentage of All Children, 7-14 Years
A surprisingly large percentage of 7-14 year olds are economically active.
Comparisons to other countries, most recent year Global Standing
29.6 12.5 7.4
17.3
0
5
10
15
20
25
30
35
Guyana LMI-LAC Belize
Per
cent
E xpected va lue and marg in of error
Highest-five average
70.2
4.6
GUY
Lowest-five average
Source: World Development Indicators 2007. CAS Code: 33P5
At 67 percent, Guyana’s labor force participation rate is slightly lower than the expected value (74 percent) for a country with similar characteristics. However, as noted (see Gender), the gap between male and female labor force participation is large. Guyana also seems to have a surprisingly high ratio of economically active children as a percent of all children aged 7-14 (Figure 4-3). This ratio of 29.6 percent exceeds the expected value, even with its broad standard error band (i.e., 7 percent plus/minus 10.7 percent) for a country similar to Guyana. It is also about four times as high as Belize’s rate of 7.4 percent. The ratio may be consistent with Guyana’s low recorded rate for persistence of children to grade 5 (see Education), suggesting that many children do indeed leave school to seek employment.
Despite some labor market rigidities, Guyana compares favorably to LMI and LMI-LAC countries on the World Bank’s Rigidity of Employment index. Using a scale of 0 (best) to 100 (worst), this index measures the regulatory difficulty that firms face in hiring and firing workers (i.e., if government policies and rules increase the cost of firing, it is riskier for employers to hire
46 See a summary of the enterprise survey by selecting Guyana at the World Bank web site: http://www.enterprisesurveys.org/ExploreEconomies/

38 G U Y A N A E C O N O M I C P E R F O R M A N C E A S S E S S M E N T
workers in the first place). For 2006, Guyana received a score of 21 on employment rigidity. This is relatively favorable: much lower than the expected value (45.5) for a country with Guyana’s characteristics, and below the LMI-LAC and LMI averages of 35. It is on par with Suriname’s rigidity of employment index of 23. However, Belize’s labor market—rigidity of employment index of 10—is apparently significantly more flexible in hiring and firing rules.
When one considers the cost of firing a worker measured in weeks of wages, however, a slightly different picture emerges. In a standardized situation, the World Bank estimates that it takes more than one year (56 weeks) of wages to fire a worker in Guyana, compared to 24 weeks in Belize and 26 weeks in Suriname. The average in LMI countries is also lower at 44 weeks. Guyana is on a level with LMI-LAC countries, where the cost of firing a worker is almost 60 weeks.
The implementation of the National Competitiveness Strategy (see Business Environment), which will apply regulatory reform to stimulate growth of the private sector and create both high- and low-skill jobs, is a top priority for policymakers. Donors could reinforce the competitiveness program by promoting labor market reforms and supporting workforce development initiatives, plus incentive schemes to encourage children to stay in school and build skills.
AGRICULTURE As noted earlier (see Economic Structure), agriculture comprises an important part of Guyana’s economy: it generates approximately 30 percent of output and employment and accounts for the overwhelming bulk of merchandise exports. Sugar is the anchor of Guyana’s agriculture, with this subsector alone making up 14 percent of GDP in 2006.47 Rice is another important crop. Both sugar and rice engage significant numbers of rural workers, and in the case of rice, smallholder producers as well. Boosting output and productivity throughout agriculture, and in sugar and rice in particular, is thus essential for ensuring sustained pro-poor growth in Guyana’s economy.
Guyana’s value-added per worker in agriculture seems to be growing. Between 2000 and 2004, estimates of this indicator rose from about US$3,300 to US$3,700 (constant terms), an average of 3 percent per annum. Such improvements are a precondition to raising incomes of poor and rural families. Relative to comparators, the 2004 figure of US$3,700 value-added per agricultural worker is roughly within the expected value and standard error band for a country with Guyana’s characteristics (US$2,621 plus/minus US$1,052) and within range of Suriname’s standard (US$3,701) as well. Guyana’s performance exceeds the LMI-LAC and LMI country averages (US$2,054 and US$1,415, respectively), but is significantly below Belize’s (US$6,632).
With respect to cereal yields (i.e., rice, at 3,795 kg per ha) Guyana’s present productivity is superior to averages for LMI-LAC countries (2,624 kg per ha) and LMI countries (2,485 kg per ha), and equal to Suriname (3,799 kg per ha). More worrisome is the fact that yields have stagnated in recent years, and even declined by about 5 percent since peaks in 1998 (3,084 kg per ha).
47 Guyana Bureau of Statistics.

P R O - P O O R G R O W T H E N V I R O N M E N T 39
Figure 4-4. Agricultural Productivity, Value Added per Worker
Overall labor productivity in agriculture seems to be increasing.
Time Series Comparisons to other countries, most recent year
3,0003,1003,2003,3003,4003,5003,6003,7003,800
2000 2001 2002 2003 2004
Year Value 2000 3288 2001 3400 2002 3583 2003 3538 2004 3707
Summary for 2000- 2004 Five year average 3503 Trend growth rate 2.8
3707 2054 1415 6632 3701
2621
0
1,000
2,000
3,000
4,000
5,000
6,000
7,000
Guyana LMI-LAC LMI Belize S uriname
U.S
. Dol
lars
E xpected va lue and ma rg in of error
Source: World Development Indicators 2007. CAS Code: 34P1
Equally important, Guyana’s overall index of crop production suggests that the aggregate value of agricultural production was stalled between 1995 and 2004, the most recent year for which there are data. Assuming a sharp contraction in crop production in 2005 as a result of that year’s flooding, and some rebound in more favorable 2006 conditions, the situation at present is unlikely to have much improved. (By contrast, the index of Guyana’s livestock production increased by more than 40 percent in the five years to 2004, although livestock enterprise is a much smaller part of the agricultural economy than crop production.)
With the central role of agriculture in Guyana’s economy, poverty reduction demands a dynamic and energized agricultural sector. While the signs of steadily rising labor productivity in agriculture are encouraging, much more needs to be done to stimulate output and accelerate productivity growth. An essential first step is implementation of Guyana’s National Sugar Action Plan to reform the subsector and build competitiveness, particularly in light of adjustments necessitated by imminent termination of the European Union’s Sugar Protocol.48 But additional initiatives are also needed, notably to revitalize the rice subsector and to diversify production into promising new high-value outputs, such as fruits, vegetables, and aquaculture. Donor participation could be highly strategic in helping to make this happen.
48 See http://www.moftic.gov.gy/Publications/digest0106.pdf, accessed October 5, 1007.


Appendix. CAS Methodology CRITERIA FOR SELECTING INDICATORS The economic performance evaluation in this report is designed to balance the need for broad coverage and diagnostic value, on the one hand, and the requirement of brevity and clarity, on the other. The analysis covers 15 economic growth–related topics, and just over 100 variables. For the sake of brevity, the write-up in the text highlights issues for which the “dashboard lights” appear to be signaling problems, which suggest possible priorities for USAID intervention. The accompanying table provides a full list of indicators examined for this report. The data supplement contains the complete data set for Guyana, including data for the benchmark comparisons, and technical notes for every indicator.
For each topic, the analysis begins with a screening of primary performance indicators. These Level I indicators are selected to answer the question: Is the country performing well or not in this area? The set of primary indicators also includes descriptive variables such as per capita income, the poverty head count, and the age dependency rate.
When Level I indicators suggest weak performance, we review a limited set of diagnostic supporting indicators. These Level II indicators provide additional details, or shed light on why the primary indicators may be weak. For example, if economic growth is poor, one can examine data on investment and productivity as diagnostic indicators. If a country performs poorly on educational achievement, as measured by the youth literacy rate, one can examine determinants such as expenditure on primary education, and the pupil–teacher ratio.1
The indicators have been selected on the basis of the following criteria. Each must be accessible through USAID’s Economic and Social Database or convenient public sources, particularly on the Internet. They should be available for a large number of countries, including most USAID client states, to support the benchmarking analysis. The data should be sufficiently timely to support an assessment of country performance that is suitable for strategic planning purposes. Data quality is another consideration. For example, subjective survey responses are used only when actual measurements are not available. Aside from a few descriptive variables, the indicators must also be useful for diagnostic purposes. Preference is given to measures that are widely used, such as Millennium Development Goal indicators, or evaluation data used by the Millennium Challenge Corporation. Finally, an effort has been made to minimize redundancy. If two indicators provide similar information, preference is given to one that is simplest to
1 Deeper analysis of the topic using more detailed data (Level III) is beyond the scope of this series.

A - 2 A P P E N D I X
understand, or most widely used. For example, both the Gini coefficient and the share of income accruing to the poorest 20 percent of households can be used to gauge income inequality. We use the income share because it is simpler and more sensitive to changes.
BENCHMARKING METHODOLOGY Comparative benchmarking is the main tool used to evaluate each indicator. The analysis draws on several criteria, rather than a single mechanical rule. The starting point is a comparison of performance in Guyana relative to the average for countries in the same income group and region —in this case, lower-middle-income countries in Latin America and the Caribbean.2 For added perspective, three other comparisons are examined: (1) the global average for this income group; (2) respective values for two comparator countries approved by the Guyana mission (in this case Suriname and Belize); and (3) the average for the five best- and five worst-performing countries globally. Most comparisons are framed in terms of values for the latest year of data from available sources. Five-year trends are also taken into account when this information sheds light on the performance assessment.3
For selected variables, a second source of benchmark values uses statistical regression analysis to establish an expected value for the indicator, controlling for income and regional effects.4 This approach has three advantages. First, the benchmark is customized to Guyana’s specific level of income. Second, the comparison does not depend on the exact choice of reference group. Third, the methodology allows the quantification of the margin of error and establishment of a “normal band” for a country with Guyana’s characteristics. An observed value falling outside this band on the side of poor performance signals a serious problem.5
Finally, where relevant, Guyana’s performance is weighed against absolute standards. For example, a corruption perception index below 3.0 is a sign of serious economic governance problems, regardless of the regional comparisons or regression result.
2 Income groups as defined by the World Bank for 2004. For this study, the average is defined in terms of the mean; future studies will use the median instead, because the values are not distorted by outliers.
3 The five-year trends are computed by fitting a log-linear regression line through the data points. The alternative of computing average growth from the end points produces aberrant results when one or both of those points diverges from the underlying trend.
4 This is a cross-sectional OLS regression using data for all developing countries. For any indicator, Y, the regression equation takes the form: Y (or ln Y, as relevant) = a + b * ln PCI + c * Region + error – where PCI is per capita income in PPP$, and Region is a set of 0-1 dummy variables indicating the region in which each country is located. When estimates are obtained for the parameters a, b, and c, the predicted value for the Philippines is computed by plugging in Philippines-specific values for PCI and Region. Where applicable, the regression also controls for population size and petroleum exports (as a percentage of GDP).
5 This report uses a margin of error of 0.66 times the standard error of estimate (adjusted for heteroskedasticity, where appropriate). With this value, 25 percent of the observations should fall outside the normal range on the side of poor performance (and 25 percent on the side of good performance). Some regressions produce a very large standard error, giving a “normal band” that is too wide to provide a discerning test of good or bad performance.

C A S M E T H O D O L O G Y A - 3
STANDARD CAS INDICATORS Indicator Level MDG, MCA, or EcGova
Growth Performance
Per capita GDP, in purchasing power parity dollars I
Per capita GDP, in current US dollars I
Real GDP growth I
Growth of labor productivity II
Investment Productivity, incremental capital-output ratio (ICOR) II
Gross fixed investment, % GDP II
Gross fixed private investment, % GDP II
Poverty and Inequality
Human poverty index (0 for excellent to 100 for poor) I
Income-share, poorest 20% I
Population living on less than $1 PPP per day (LI countries)/ $2 PPP per day (LMI countries) I MDG
Poverty headcount, by national poverty line I MDG
PRSP status I EcGov
Population below minimum dietary energy consumption II MDG
Economic Structure
Employment or labor force structure I
Output structure I
Demography and Environment
Adult literacy rate I
Youth dependency rate/ elderly dependency rate (for Eastern Europe and Former Soviet Union countries) I
Environmental performance index (0 for poor to 100 for excellent) I
Population size and growth I
Urbanization rate I
Gender
Girls primary completion rate I MCA
Gross enrollment rate, all levels, male, female I MDG
Life expectancy at birth, male, female I
Labor force participation rate, male, female I
Fiscal and Monetary Policy
Government expenditure, % GDP I EcGov
Government revenue, excluding grants, % GDP I EcGov
Growth in the broad money supply I EcGov
Inflation rate I MCA
Overall government budget balance, including grants, % GDP I MCA, EcGov
Composition of govt. expenditure II

A - 4 A P P E N D I X
MDG, MCA, or EcGova Indicator Level
Composition of govt. revenue II
Composition of money supply growth II
Business Environment
Corruption perception index (1 for poor to 10 for excellent) I EcGov
Ease of doing business ranking I EcGov
Rule of law index (-2.5 for poor to 2.5 for excellent) I MCA, EcGov
Regulatory quality index (-2.5 for poor to 2.5 for excellent) I MCA, EcGov
Government effectiveness index (-2.5 for poor to 2.5 for excellent) I MCA, EcGov
Cost of starting a business II MCA, EcGov
Procedures to enforce a contract II EcGov
Procedures to register property II EcGov
Procedures to start a business II EcGov
Time to enforce a contract II EcGov
Time to register property II EcGov
Time to start a business II MCA, EcGov
Total tax payable by business II EcGov
Business costs of crime, violence, terrorism index (1 for poor to 7 for excellent) II
Senior manager time spent dealing with government regulations II EcGov
Financial Sector
Domestic credit to private sector, % GDP I
Interest rate spread I
Money supply, % GDP I
Stock market capitalization rate, % of GDP I
Credit information index (0 for poor to 6 for excellent) I
Legal rights of borrowers and lenders index (0 for poor to 10 for excellent) II
Real Interest rate II
External Sector
Aid , % GNI I
Current account balance, % GDP I
Debt service ratio, % exports I MDG
Export growth of goods and services I
Foreign direct investment, % GDP I
Gross international reserves, months of imports I EcGov
Gross Private capital inflows, % GDP I
Present value of debt, % GNI I
Remittance receipts, % exports I
Trade, % GDP I

C A S M E T H O D O L O G Y A - 5
MDG, MCA, or EcGova Indicator Level
Trade in services, % GDP I
Concentration of exports II
Inward FDI potential index II
Net barter terms of trade II
Real effective exchange rate (REER) II EcGov
Structure of merchandise exports II
Trade policy index II MCA, EcGov
Ease of trading across boarders ranking II EcGov
Economic Infrastructure
Internet users per 1,000 people I MDG
Overall infrastructure quality index (1 for poor to 7 for excellent) I EcGov
Telephone density, fixed line and mobile I MDG
Quality of infrastructure—railroads, ports, air transport, and electricity II
Roads paved, % total roads II
Science and Technology
Expenditure for R&D, % GDP I
FDI and technology transfer index (1 for poor to 7 for excellent) I
Availability of scientists and engineers index (1 for poor to 7 for excellent) I
Science & technology journal articles per million people I
IPR protection index (1 for poor to 7 for excellent) I
Health
HIV prevalence I
Life expectancy at birth I
Maternal mortality rate I MDG
Access to improved sanitation II MDG
Access to improved water source II MDG
Births attended by skilled health personnel II MDG
Child immunization rate II MCA
Prevalence of child malnutrition (weight for age) II
Public health expenditure, % GDP II MCA, EcGov
Education
Net primary enrollment rate – female, male, total I MDG
Persistence in school to grade 5 I MDG
Youth literacy rate, all, male, female I
Net secondary enrollment rate I
Gross tertiary enrollment rate I

A - 6 A P P E N D I X
MDG, MCA, or EcGova Indicator Level
Education expenditure, primary, % GDP II MCA, EcGov
Expenditure per student, % GDP per capita—primary, secondary, and tertiary II EcGov
Pupil-teacher ratio, primary school II
Employment and Workforce
Labor force participation rate, total I
Rigidity of employment index (0 for minimum rigidity to 100 for maximum) I EcGov
Size and growth of the labor force I
Unemployment rate I
Economically active children, % children ages 7-14 I
Firing costs, weeks of wages II EcGov
Agriculture
Agriculture value added per worker I
Cereal yield I
Growth in agricultural value-added I
Agricultural policy costs index (1 for poor to 7 for excellent) II EcGov
Crop production index II
Livestock production index II
Agricultural export growth II
a Level I = primary performance indicators, Level II = supporting diagnostic indicators
b MDG—Millennium Development Goal indicator MCA—Millennium Challenge Account indicator EcGov—Major indicators of economic governance, which is defined in USAID’s Strategic Management Interim Guidance to include “microeconomic and macroeconomic policy and institutional frameworks and operations for economic stability, efficiency, and growth.” The term therefore encompasses indicators of fiscal and monetary management, trade and exchange rate policy, legal and regulatory systems affecting the business environment, infrastructure quality, and budget allocations.

Data Supplement
Dataset 1
Technical Notes 20


1
Growth Performance
Statistical Capacity Indicator
Per capita GDP, in
Purchasing Power Parity
Dollars
Per capita GDP, in
current U.S. Dollars
Real GDP Growth
Growth of Labor
Productivity
Investment Productivity, Incremental
Capital-Output Ratio
(ICOR)
Gross Fixed Investment, % of GDP
Gross Fixed Private
Investment, % of GDP
Indicator Number 11P0 11P1 11P2 11P3 11S1 11S2 11S3 11S4 Guyana Data
Latest Year (T) 2006 2006 2006 2006 2005 2006 2006 2006
Value Year T 50 4,851 1,147 4.7 -2.7 27.2 35.5 10.1
Value Year T-1 58 4,568 1,081 -1.9 2.8 48.8 31.1 7.7
Value Year T-2 . 4,586 1,043 1.6 -1.5 36.6 22.1 5.8
Value Year T-3 . 4,404 991 -0.7 0.4 25.6 21.0 6.6
Value Year T-4 . 4,355 965 1.1 1.4 35.5 21.0 .
Average Value, 5 year . 4,553 1,045 1.0 0.1 34.8 26.1 7.6
Growth Trend . 2.5 4.3 . . 1.1 14.4 .
Benchmark Data Regression Benchmark . . . 6.1 . . . .
Lower Bound . . . 3.7 . . . .
Upper Bound . . . 8.4 . . . .
Latest Year Belize 2006 2006 2006 2006 2005 2005 2005 .
Belize Value Latest Year 43 7,760 4,028 5.0 -1.1 3.8 18.8 .
Latest Year Suriname 2006 2006 2006 2006 2005 2005 2005 .
Suriname Value Latest Year 55 6,276 4,081 5.8 4.0 5.6 33.2 .
LMI-LAC Median 73 4,937 2,662 4.1 1.2 5.6 19.6 19.0
Lower Middle Income Median 67 5,376 2,192 4.9 0.9 5.8 20.2 17.5
High Five Avg. 23 709 153 -5.4 -8.7 . 8.2 4.5
Low Five Avg. 91 43,504 53,335 15.9 11.5 . 44.7 30.5

2
Poverty and Inequality
Human Poverty
Index (0 for excellent to
100 for poor)
Income Share,
Poorest 20%
Percentage of
Population Living on Less Than $1 PPP per
Day
Percentage of
Population Living on Less Than $2 PPP per
Day
Poverty Headcount,
National Poverty Line
PRSP Status
Population % Below
Minimum Dietary Energy
Consumption Indicator Number 12P1 12P2 12P3a 12P3b 12P4 12P5 12S1
Guyana Data Latest Year (T) 2004 1998 1998 . 1998 . 2002
Value Year T 14.8 4.5 3.0 . 35.0 Yes 9.0
Value Year T-1 12.9 . . . . . .
Value Year T-2 12.7 . . . . . .
Value Year T-3 . . . . . . .
Value Year T-4 11.4 . . . . . .
Average Value, 5 year . . . . . . .
Growth Trend . . . . . . .
Benchmark Data Regression Benchmark 11.6 3.3 12.0 30.7 51.1 . .
Lower Bound 6.0 2.4 4.9 22.4 42.9 . .
Upper Bound 17.1 4.2 19.1 39.1 59.3 . .
Latest Year Belize 2004 . . . . . 2002
Belize Value Latest Year 16.7 . . . . No 5.0
Latest Year Suriname 2004 . . . . . 2002
Suriname Value Latest Year 10.3 . . . . No 10.0
LMI-LAC Median 11.8 3.0 16.5 34.8 47.0 . 12.0
Lower Middle Income Median 17.1 . . . . . 11.0
High Five Avg. 4.0 3.1 2.0 4.7 22.3 - 2.5
Low Five Avg. 57.6 8.7 33.7 69.8 51.2 - 67.0

3
Economic Structure
Labor Force Structure
(Employment in agriculture, %
total)
Labor Force Structure
(Employment in industry,
% total)
Labor Force Structure
(Employment in services,
% total)
Output structure
(Agriculture, value added,
% GDP)
Output structure (Industry,
value added, % GDP)
Output structure (Services, etc., value added, %
GDP) Indicator Number 13P1a 13P1b 13P1c 13P2a 13P2b 13P2c
Guyana Data Latest Year (T) 1997 1997 1997 2006 2006 2006
Value Year T 27.8 22.6 47.9 30.5 23.8 45.7
Value Year T-1 . . . 30.3 24.7 45.0
Value Year T-2 . . . 31.3 26.9 41.7
Value Year T-3 . . . 31.4 27.1 41.4
Value Year T-4 . . . 30.8 28.6 40.6
Average Value, 5 year . . . 30.9 26.2 42.9
Growth Trend . . . -0.6 -4.6 3.2
Benchmark Data Regression Benchmark 21.6 17.5 60.4 16.6 27.7 54.7
Lower Bound 15.0 14.2 55.3 10.7 22.2 48.6
Upper Bound 28.2 20.7 65.5 22.6 33.2 60.9
Latest Year Belize . . . 2005 2005 2005
Belize Value Latest Year . . . 14.1 17.7 68.2
Latest Year Suriname . . . 2005 2005 2005
Suriname Value Latest Year . . . 10.8 24.4 64.8
LMI-LAC Median 21.0 20.0 58.1 11.3 29.7 56.6
Lower Middle Income Median 30.3 20.2 49.0 15.1 31.4 52.9
High Five Avg. 0.4 11.1 30.5 2.2 11.6 19.7
Low Five Avg. 54.7 38.6 79.7 63.6 67.6 80.6

4
Demography and Environment
Adult Literacy
Rate
Youth Dependency
Rate
Elderly Dependency
Rate
Environmental Performance Index (1 to
100)
Population Size
(Millions)
Population Growth,
Annual % Urbanization
Rate Indicator Number 14P1 14P2a 14P2b 14P3 14P4a 14P4b 14P5
Guyana Data Latest Year (T) . 2004 2005 . 2006 2006 2005
Value Year T . 45.34 7.9 . 0.8 0.3 28.2
Value Year T-1 . 45.81 7.8 . 0.8 0.3 28.3
Value Year T-2 . 46.29 7.8 . 0.8 0.3 28.4
Value Year T-3 . 46.90 7.8 . 0.8 0.3 28.4
Value Year T-4 . 47.69 7.8 . 0.8 0.9 28.5
Average Value, 5 year . 46.41 7.8 . 0.7 0.5 28.4
Growth Trend . -1.25 0.2 . 0.3 -20.3 -0.3
Benchmark Data Regression Benchmark 86.8 54.0 10.0 70.2 . . 65.9
Lower Bound 77.7 47.4 8.0 65.0 . . 56.0
Upper Bound 95.8 60.6 12.0 75.4 . . 75.9
Latest Year Belize . 2004 2005 . 2005 2005 2005
Belize Value Latest Year . 63.87 7.2 . 0.3 3.2 48.3
Latest Year Suriname 2006 2004 2005 2006 2005 2005 2005
Suriname Value Latest Year 89.6 48.11 10.0 0.0 0.4 0.6 73.9
LMI-LAC Median 87.3 52.76 8.2 0.0 8.9 1.4 62.8
Lower Middle Income Median 89.7 56.98 7.8 0.0 6.3 1.5 54.6
High Five Avg. 24.7 16.56 1.8 0.0 0.0 -0.7 10.4
Low Five Avg. 99.7 99.39 27.5 0.0 611.1 5.5 100.0

5
Gender
Girls' Primary
Completion Rate
Gross Enrollment
Rate, All Levels of
Education, Male
Gross Enrollment
Rate, All Levels of
Education, Female
Life Expectancy,
Male
Life Expectancy,
Female
Labor Force Participation
Rate, Male
Labor Force Participation Rate, Female
Indicator Number 15P1 15P2a 15P2b 15P3a 15P3b 15P4a 15P4b Guyana Data
Latest Year (T) 2003 2004 2004 2004 2004 2005 2005
Value Year T 91.8 78.0 78.0 60.6 66.7 87.2 47.9
Value Year T-1 96.2 . . . . 87.0 47.5
Value Year T-2 94.9 . . . . 86.9 46.9
Value Year T-3 114.2 . . . . 86.4 46.7
Value Year T-4 103.5 . . . . 85.9 46.6
Average Value, 5 year 100.1 . . . . 86.7 47.1
Growth Trend -4.1 . . . . 0.4 0.7
Benchmark Data Regression Benchmark 91.5 74.3 75.0 68.4 74.0 87.2 60.3
Lower Bound 82.3 68.1 68.0 64.7 69.9 83.6 52.0
Upper Bound 100.8 80.6 82.0 72.0 78.1 90.8 68.6
Latest Year Belize 2005 2004 2004 2004 2004 2005 2005
Belize Value Latest Year 103.6 81.00 81.0 69.5 74.4 87.7 46.6
Latest Year Suriname 2005 2004 2004 2004 2004 2005 2005
Suriname Value Latest Year 97.1 68.0 77.0 66.1 72.7 69.5 37.3
LMI-LAC Median 92.6 70.5 77.5 67.6 72.7 87.1 58.1
Lower Middle Income Median 92.7 70.0 73.0 67.4 72.7 84.7 53.8
High Five Avg. 22.2 28.2 21.8 35.1 35.1 67.6 19.2
Low Five Avg. 117.0 101.2 106.8 78.5 84.1 98.6 92.2

6
Fiscal and Monetary Policy Composition of Government Expenditure
Govt. Expenditure,
% of GDP
Govt. Revenue, % of GDP
Growth in Money Supply
Inflation Rate
Overall Budget
Balance, Incl. Grants,
% of GDP
Wages and
salaries
Goods and
services Interest
payments
Subsidies/ other
current transfers Capital
Indicator Number 21P1 21P2 21P3 21P4 21P5 21S1a 21S1b 21S1c 21S1d 21S1e Guyana Data
Latest Year (T) 2006 2006 2006 2006 2006 . . . . 2006
Value Year T 56.2 34.6 17.0 7.3 -11.2 . . . . 41.2
Value Year T-1 53.9 34.0 6.0 6.3 -13.6 . . . . 39.5
Value Year T-2 44.4 33.1 9.7 4.6 -4.5 . . . . 32.3
Value Year T-3 44.4 31.5 9.5 6.0 -8.7 . . . . 27.0
Value Year T-4 43.6 32.2 8.1 5.4 . . . . . 26.1
Average Value, 5 year 48.5 33.1 10.1 5.9 -9.5 . . . . 33.2
Growth Trend 7.0 2.2 10.2 6.7 -2.4 . . . . 13.0
Benchmark Data Regression Benchmark 28.4 19.6 16.3 6.3 -2.3 . . . . .
Lower Bound 21.1 14.6 9.8 3.5 -4.6 . . . . .
Upper Bound 35.7 24.7 22.7 9.0 0.1 . . . . .
Latest Year Belize 2006 2006 2005 2006 2006 . . . . .
Belize Value Latest Year 29.0 23.5 6.6 4.3 -5.5 . . . . .
Latest Year Suriname . . 2005 2006 . . . . . .
Suriname Value Latest Year 28.6 28.7 10.7 11.3 0.1 . . . . .
LMI-LAC Median 17.4 21.2 14.2 6.3 -1.0 . . . . .
Lower Middle Income Median 24.1 26.6 12.5 5.2 -1.5 . . . . .
High Five Avg. 10.6 8.9 5.2 -1.2 -11.4 . . . . .
Low Five Avg. 48.8 50.6 107.2 89.7 6.8 . . . . .

7
Fiscal and Monetary Policy (cont'd) Composition of Government Revenue Composition of Money Supply Growth
Comp. of Govt.
Expenditure
(Other)
Taxes of income,
profits and capital gains
Taxes on
goods and
services
Taxes on intl. trade
Social contr.
Other taxes
Grants and
other revenue
Domestic credit to public sector
Domestic credit to private sector
Domestic credit to non-
financial public
enterprises
Net foreign assets,
reserves
Other items
net Indicator Number 21S1f 21S2a 21S2b 21S2c 21S2d 21S2e 21S2f 21S3a 21S3b 21S3c 21S3d 21S3e
Guyana Data Latest Year (T) . 2006 2006 2006 . 2006 2006 2006 2006 2006 2006 2006
Value Year T . 44.5 37.7 8.3 . 9.5 18.2 -36.6 47.4 6.45 66.91 16
Value Year T-1 . 43.9 38.8 8.6 . 8.8 14.1 -23.2 42.5 7 87 -13
Value Year T-2 . 42.8 37.7 9.4 . 10.1 8.1 163.4 -2.5 -12.45 -49.52 1.1
Value Year T-3 . 44.5 33.8 9.8 . 11.9 5.8 94.1 -124.2 -18.5 72.4 76.2
Value Year T-4 . 44.7 33.1 10.4 . 11.7 6.0 42.8 16.7 0.92 40.43 -0.9
Average Value, 5 year . 44.1 36.2 9.3 . 10.4 10.4 48.1 -4.0 -3.4 43.4 16.0
Growth Trend . -0.3 3.9 -5.8 . -7.2 30.9 . . . . .
Benchmark Data Regression Benchmark . . . . . . . . . . . .
Lower Bound . . . . . . . . . . . .
Upper Bound . . . . . . . . . . . .
Latest Year Belize . . . . . . . . . . . .
Belize Value Latest Year . . . . . . . . . . . .
Latest Year Suriname . . . . . . . . . . . .
Suriname Value Latest Year . . . . . . . . . . . .
LMI-LAC Median . 18.5 40.7 6.8 8.7 1.8 15.6 . . . . .
Lower Middle Income Median . 19.7 35.5 8.3 . 1.4 15.6 . . . . .
High Five Avg. . 1.7 3.1 -1.7 0.4 - 3.0 - - - - .
Low Five Avg. . 53.8 64.6 44.9 45.3 19.8 78.7 - - - - .

8
Business Environment
Control of Corruption Index (-2.5 for poor to
2.5 for excellent)
Ease of Doing
Business Ranking (1
to 155)
Rule of Law Index (-2.5 for poor to
2.5 for excellent)
Regulatory Quality
Index (-2.5 for poor to
2.5 for excellent)
Government Effectiveness Index (0 for poor to 1 for
excellent)
Cost of Starting a
Business % GNI per Capita
Procedures to Enforce a
Contract Indicator Number 22P1 22P2 22P3 22P4 22P5 22S1 22S2
Guyana Data Latest Year (T) 2006 2007 2006 2006 2006 2007 2007
Value Year T -0.6 104.0 -0.7 0 0 87.2 36.0
Value Year T-1 -0.6 98.0 -0.7 0 -1 100.2 36.0
Value Year T-2 -0.5 . -0.6 0 0 101.4 37.0
Value Year T-3 -0.4 . -0.5 0 0 . .
Value Year T-4 -0.4 . -0.5 0 0 . .
Average Value, 5 year -0.5 . -0.6 0 0 . .
Growth Trend -9.8 . -11.9 -7.2 5.8 . .
Benchmark Data Regression Benchmark -0.5 119.0 -0.6 -0.4 -0.5 . .
Lower Bound -0.7 97.7 -0.9 -0.7 -0.7 . .
Upper Bound -0.2 140.3 -0.4 -0.1 -0.2 . .
Latest Year Belize 2006 2007 2006 2006 2006 2007 2007
Belize Value Latest Year -0.3 59.0 -0.1 0 0 53.1 51.0
Latest Year Suriname 2006 2007 2006 2006 2006 2007 2007
Suriname Value Latest Year -0.2 142.0 -0.2 0 0 141.8 44.0
LMI-LAC Median -0.6 104.5 -0.7 0 -1 57.3 36.7
Lower Middle Income Median -0.5 102.5 -0.6 0 0 33.0 39.0
High Five Avg. -1.6 - -1.8 -2 -2 0.5 23.1
Low Five Avg. 2.4 - 2.0 2 2 574.0 53.7

9
Business Environment (cont'd)
Procedures to Register
Property
Procedures to Start a Business
Time to Enforce a Contract
Time to Register Property
Time to Start a
Business
Total Tax Payable by
Business, % operating
profit
Business Costs of Crime,
Violence and
Terrorism (1 for poor to 7
for excellent)
Senior Manager
Time Spent Dealing with Government Regulations
(%) Indicator Number 22S3 22S4 22S5 22S6 22S7 22S8 22S9 22S10
Guyana Data Latest Year (T) 2007 2007 2007 2007 2007 2007 . 2004
Value Year T 6.0 8.0 581.0 34.0 44.0 39.0 . 2.3
Value Year T-1 6.0 8.0 581.0 34.0 46.0 39.0 . .
Value Year T-2 6.0 8.0 581.0 34.0 46.0 39.0 . .
Value Year T-3 . . . . . . . .
Value Year T-4 . . . . . . . .
Average Value, 5 year . . . . . . . .
Growth Trend . . . . . . . .
Benchmark Data Regression Benchmark . . . . . . . .
Lower Bound . . . . . . . .
Upper Bound . . . . . . . .
Latest Year Belize 2007 2007 2007 2007 2007 2007 . .
Belize Value Latest Year 8.0 9.0 892.0 60.0 44.0 30.8 . .
Latest Year Suriname 2007 2007 2007 2007 2007 2007 2006 .
Suriname Value Latest Year 4.0 13.0 1,715.0 193.0 694.0 27.9 3.2 .
LMI-LAC Median 6.7 12.5 586.0 45.8 47.7 41.5 2.7 8.7
Lower Middle Income Median 6.3 10.7 565.0 48.0 41.7 41.7 3.8 .
High Five Avg. 1.6 2.4 182.6 2.1 4.3 12.2 1.9 1.5
Low Five Avg. 13.9 18.5 1,611.6 485.8 287.7 251.2 6.6 17.4
10
Financial Sector
Domestic Credit to Private
Sector, % GDP
Interest Rate
Spread
Money Supply (M2), %
GDP
Stock Market Capitalization Rate, % GDP
Credit Information Index (0 for poor to 6 for
excellent)
Legal Rights of Borrowers and Lenders (0 for poor to
10 for excellent)
Real Interest
Rate Indicator Number 23P1 23P2 23P3 23P4 23P5 23S1 23S2
Guyana Data Latest Year (T) 2006 2006 2006 2005 2007 2007 2005
Value Year T 59.9 12.0 104.2 23.8 0.0 3.0 10.0
Value Year T-1 57.1 12.0 97.3 16.2 0.0 3.0 9.2
Value Year T-2 53.2 11.9 96.9 12.7 0.0 3.0 9.0
Value Year T-3 57.5 11.8 95.9 . . . 11.3
Value Year T-4 62.1 11.8 91.2 . . . 19.3
Average Value, 5 year 58.0 11.9 97.1 . . . 11.8
Growth Trend -0.8 0.5 2.8 . . . -15.1
Benchmark Data Regression Benchmark 34.0 10.7 41.4 17.5 3.8 . .
Lower Bound 19.8 7.7 26.1 -10.9 2.4 . .
Upper Bound 48.2 13.7 56.6 46.0 5.1 . .
Latest Year Belize 2005 2005 2005 . 2007 2007 2005
Belize Value Latest Year 64.0 6.5 56.7 . 0.0 7.0 12.5
Latest Year Suriname 2005 2005 2005 . 2007 2007 2005
Suriname Value Latest Year 25.8 10.1 55.5 . 0.0 4.0 5.6
LMI-LAC Median 26.8 10.1 38.0 11.9 5.0 3.0 12.4
Lower Middle Income Median 24.5 7.1 38.4 15.4 3.0 4.0 6.7
High Five Avg. 2.3 1.5 8.7 1.1 0.0 0.6 -11.9
Low Five Avg. 175.6 56.8 185.7 246.3 6.0 9.4 29.4

11
External Sector
Aid, % of
GNI
Current Account Balance, % GDP
Debt Service ratio, % Exports
Exports Growth, Goods
and Services
Foreign Direct
Investment, % GDP
Gross International
Reserves, Months of
Imports
Gross Private Capital
Inflows, % GDP
Present Value of Debt, %
GNI
Remittance Receipts, % Exports
Trade, % GDP
Trade in Services, % GDP
Indicator Number 24P1 24P2 24P3 24P4 24P5 24P6 24P7 24P8 24P9 24P10 24P11 Guyana Data
Latest Year (T) 2005 2006 2006 2002 2005 2006 2005 2005 2005 2006 2005
Value Year T 18.5 -28.0 5.60 -1.2 9.8 3.0 11.5 84.3 29.0 210.2 42
Value Year T-1 19.8 -19.1 4.30 0.3 3.8 3.1 5.2 72.2 20.5 205.8 47
Value Year T-2 12.5 -8.9 6.00 -1.9 3.5 3.2 3.5 . 14.9 204.1 44
Value Year T-3 9.7 -11.9 7.40 3.5 6.0 4.4 7.1 . 7.7 189.7 51
Value Year T-4 15.3 -8.6 8.90 -4.5 8.0 4.4 7.6 . 3.4 197.2 52
Average Value, 5 year 15.2 -15.3 6.44 -0.7 6.2 3.6 7.0 . 15.1 201.4 47.3
Growth Trend 11.0 -28.3 -14.7 . -0.7 -11.2 5.0 . 52.7 2.1 -5.2
Benchmark Data Regression Benchmark 5.1 -3.2 21.0 11.2 4.2 4.6 . 74.7 11.6 71.2 16.0
Lower Bound 0.3 -8.2 16.1 4.9 1.8 3.2 . 53.4 2.9 48.6 5.3
Upper Bound 9.9 1.7 26.0 17.5 6.5 6.1 . 96.1 20.3 93.8 26.7
Latest Year Belize 2005 2005 2005 2005 2005 2005 2004 2005 2005 2005 2005
Belize Value Latest Year 1.3 -14.4 36.92 12.6 11.4 1.0 16.7 116.1 6.7 118.2 41
Latest Year Suriname 2005 2005 . . . 2005 2004 . 2005 2005 2005
Suriname Value Latest Year 3.8 -10.7 . . . 1.1 -3.4 . 0.1 101.0 41
LMI-LAC Median 0.7 -1.6 8.75 6.9 3.5 3.6 4.1 46.2 21.0 63.9 14
Lower Middle Income Median 3.1 -3.4 10.11 5.5 2.7 3.3 3.7 39.0 7.9 83.3 17
High Five Avg. -0.2 -20.5 0.57 -15.5 -0.7 0.4 -2.1 10.9 0.0 26.3 5.0
Low Five Avg. 51.9 21.0 56.83 49.0 90.7 16.4 178.6 352.4 83.1 242.3 92.1

12
External Sector (Cont'd)
Concentration
of Exports
Inward FDI
Potential Index (0 for poor to 1 for
excellent)
Net Barter
Terms of Trade
(2000 = 100)
Real Effective
Exchange Rate
(REER) (2000 =
100)
Structure of Merchandise
Exports (Agricultural
raw materials exports)
Structure of Merchandise
Exports (Fuel
exports)
Structure of Merchandise
Exports (Manufactures
exports)
Structure of Merchandise
Exports (Ores and
metals exports)
Structure of Merchandise
Exports (Food
exports)
Trade Policy Index
(100 for excellent to 0 for poor)
Ease of Trading Across Borders Ranking
Indicator Number 24S1 24S2 24S3 24S4 24S5a 24S5b 24S5c 24S5d 24S5e 24S6 24S7 Guyana Data
Latest Year (T) 2005 2004 . 2007 2005 2005 2005 2005 2005 2007 2007
Value Year T 53 0.1 . 101.2 7.5 0.0 19.98 8.09 62.5 57.0 101.0
Value Year T-1 56 . . 97.4 6.65 0.0 29.62 6.40 56.8 58.8 93.0
Value Year T-2 55 . . 95.1 4.04 0.0 26.36 6.53 62.4 58.8 .
Value Year T-3 54 . . 93.5 5.68 0.0 22.57 9.12 62.1 60.2 .
Value Year T-4 56 . . 97.7 4.72 0.0 17.76 21.66 55.3 61.8 .
Average Value, 5 year 55 . . 97.0 5.72 0.0 23.26 10.36 59.8 59.3 .
Growth Trend -0.9 . . 1.1 10.88 9.3 5.1 -23.2 1.5 -1.9 .
Benchmark Data Regression Benchmark . . . . . . . . . . .
Lower Bound . . . . . . . . . . .
Upper Bound . . . . . . . . . . .
Latest Year Belize 2005 . . . 2003 2003 2003 2003 2003 2007 2007
Belize Value Latest Year 64 . . . 1.1 0.3 13.42 0.01 84.7 57.2 116.0
Latest Year Suriname 2001 2004 . . 2001 2000 2001 2001 2001 2007 2007
Suriname Value Latest Year 93 0.2 . . 1.5 7.5 80.22 0.25 17.3 55.0 86.0
LMI-LAC Median . 0.1 97 . 2.9 5.7 26.09 2.90 40.8 62.0 92.0
Lower Middle Income Median . 0.2 97 . 2.6 5.2 42.46 1.71 21.1 60.4 97.0
High Five Avg. - 0.1 66 - 0.0 0.0 3.02 0.01 0.2 40.0 -
Low Five Avg. - 0.5 131 - 34.5 92.2 95.16 51.99 87.6 52.0 -

13
Economic Infrastructure
Internet Users per
1,000 people
Overall Infrastructure Quality (1 for poor to 7 for
excellent)
Telephone Density,
Fixed Line and
Mobile per 1,000
people
Quality of Infrastructure - Air Transport Infrastructure
Index (1 for poor to 7 for
excellent)
Quality of Infrastructure -
Port Infrastructure Quality Index
(1 for poor to 7 for excellent)
Quality of Infrastructure -
Rail Development Index (1 for poor to 7 for
excellent)
Quality of Infrastructure -
Quality of Electricity
Supply Index (1 for poor to 7 for excellent)
Roads, Paved (%
total) Indicator Number 25P1 25P2 25P3 25S1a 25S1b 25S1c 25S1d 25S2
Guyana Data Latest Year (T) 2005 2006 2005 2006 2006 2006 2006 .
Value Year T 213.0 2.2 521.2 3.3 2.3 1.2 2.1 .
Value Year T-1 193.3 . 365.7 . . . . .
Value Year T-2 186.9 . 307.5 . . . . .
Value Year T-3 167.2 . 213.8 . . . . .
Value Year T-4 134.1 . 208.2 . . . . .
Average Value, 5 year 178.9 . 323.3 . . . . .
Growth Trend 10.7 . 23.7 . . . . .
Benchmark Data Regression Benchmark 59.5 2.5 407.9 . . . . .
Lower Bound 22.5 2.1 230.2 . . . . .
Upper Bound 96.4 3.0 585.5 . . . . .
Latest Year Belize 2005 . 2005 . . . . .
Belize Value Latest Year 130.2 na 433.1 . . . . na
Latest Year Suriname 2005 2006 2005 2006 2006 2006 2006 2003
Suriname Value Latest Year 71.2 2.5 698.6 2.5 2.5 1.5 2.7 26.3
LMI-LAC Median 70.6 2.9 443.4 4.2 2.8 1.3 3.9 19.0
Lower Middle Income Median 53.6 2.9 259.7 4.0 3.0 1.7 3.9 49.0
High Five Avg. 1.0 1.7 9.4 2.2 1.3 1.1 1.5 6.0
Low Five Avg. 667.5 6.6 1,729.7 6.7 6.6 6.5 6.9 100.0

14
Science and Technology
Expenditure in Research and
Development, % GDP
FDI Technology
Transfer Index
Availability of Scientists and
Engineers (1 for poor to 7 for excellent)
Scientific and Technology
Journal Articles, per Million People
IPR Protection (1 for poor to 7 for
excellent) Indicator Number 26P1 26P2 26P3 26P4 26P5
Guyana Data Latest Year (T) . 2005 2006 . .
Value Year T . 3.9 2.9 . .
Value Year T-1 . . . . .
Value Year T-2 . . . . .
Value Year T-3 . . . . .
Value Year T-4 . . . . .
Average Value, 5 year . . . . .
Growth Trend . . . . .
Benchmark Data Regression Benchmark 0.2 4.6 3.8 374.0 2.7
Lower Bound 0.0 4.3 3.4 334.4 2.4
Upper Bound 0.4 5.0 4.1 413.6 3.0
Latest Year Belize . . . . .
Belize Value Latest Year na . . . .
Latest Year Suriname . 2006 2006 . 2006
Suriname Value Latest Year na 4.5 3.5 . 1.9
LMI-LAC Median 0.1 4.9 3.6 14.0 2.8
Lower Middle Income Median . 4.9 4.2 27.0 2.9
High Five Avg. 0.1 3.7 2.6 6.0 1.9
Low Five Avg. 3.7 6.1 6.2 17,149.0 6.4

15
Health
Life Expectancy
at Birth
Maternal Mortality Rate, per
100,000 Live Births
Access to Improved Sanitation
Access to Improved
Water Source
Births Attended by
Skilled Health
Personnel
Child Immunization
Rate
Prevalence of Child
Malnutrition, Weight for
Age
Public Health
Expenditure, % GDP
Indicator Number 31P2 31P3 31S1 31S2 31S3 31S4 31S5 31S6 Guyana Data
Latest Year (T) 2005 2000 2005 2005 2000 2005 2000 2006
Value Year T 64.26 170.00 90.40 95.1 85.6 92.5 13.6 5.6
Value Year T-1 . . . . 96.0 89.5 . 4.3
Value Year T-2 . . . . . 89.5 . 4.6
Value Year T-3 62.76 . . . 95.0 92.0 11.8 4.3
Value Year T-4 . . . . . 88.5 . 4.7
Average Value, 5 year . . . . . 90.4 . .
Growth Trend . . . . . 0.6 . 3.9
Benchmark Data Regression Benchmark 71.1 198.0 . . . . . .
Lower Bound 67.3 31.0 . . . . . .
Upper Bound 75.0 365.0 . . . . . .
Latest Year Belize 2005 2000 2004 2004 . 2005 . 2004
Belize Value Latest Year 71.81 140.00 47.00 91.0 . 95.5 . 2.7
Latest Year Suriname 2005 2000 2004 2004 2000 2005 2000 2004
Suriname Value Latest Year 69.71 110.00 94.00 92.0 85 87.0 13.2 3.6
LMI-LAC Median 70.66 150.00 78.00 90.0 85 88.0 7.6 3.6
Lower Middle Income Median 69.39 115.00 75.00 86.5 90 91.0 9.9 3.2
High Five Avg. 37.23 2.60 8.00 26.4 15 37.6 5.6 0.7
Low Five Avg. 80.89 1,800.00 100.00 100.0 100 99.0 44.0 10.2

16
Education
Net Primary Enrollment Rate, Total
Net Primary Enrollment
Rate, Female
Net Primary Enrollment Rate, Male
Persistence to Grade 5,
Total
Persistence to Grade 5,
Female
Persistence to Grade 5,
Male
Youth Literacy
Rate, Total
Youth Literacy
Rate, Male
Youth Literacy
Rate, Female
Indicator Number 32P1a 32P1b 32P1c 32P2a 32P2b 32P2c 32P3a 32P3b 32P3c Guyana Data
Latest Year (T) 2005 2005 2005 2001 2001 2001 . . .
Value Year T 90.6 91.2 90 64 65.0 64 . . .
Value Year T-1 . . . 77 84.0 71 . . .
Value Year T-2 . 93.0 95 97 . . . . .
Value Year T-3 . . . . . . . . .
Value Year T-4 . . . . . . . . .
Average Value, 5 year . . . . . . . . .
Growth Trend . . . . . . . . .
Benchmark Data Regression Benchmark 92.5 . . 77.5 . . 92.6 . .
Lower Bound 84.8 . . 70.0 . . 84.3 . .
Upper Bound 100.2 . . 85.1 . . 100.9 . .
Latest Year Belize 2005 2005 2005 2000 1999 1999 . . .
Belize Value Latest Year 95.9 96.5 95 91 79.5 76 . . .
Latest Year Suriname 2005 2005 2005 . . . 2006 2006 2006
Suriname Value Latest Year 94.2 95.9 93 . . . 95 96 94.1
LMI-LAC Median 92.0 92.1 92 74 77.6 72 96 96 95.7
Lower Middle Income Median 92.6 90.7 91 82 83.1 82 97 98 97.8
High Five Avg. 40.0 35.3 45 48 48.9 46 33 46 21.3
Low Five Avg. 100.0 100.0 100 100 100.0 99 100 100 99.9

17
Education (Cont'd)
Net Secondary
School Enrollment Rate, Total
Gross Tertiary
Enrollment Rate, Total
Expenditure on Primary Education,
% GDP
Educational Expenditure per Student, % GDP per
capita, Primary
Educational Expenditure per Student, % GDP per
capita, Secondary
Educational Expenditure per Student, % GDP per
capita, Tertiary
Pupil-teacher Ratio,
Primary School
Indicator Number 32P4 32P5 32S1 32S2a 32S2b 32S2c 32S3 Guyana Data
Latest Year (T) 2005 2005 . 2005 2005 2005 2004
Value Year T 70.4 9.9 . 17.1 16.2 37.2 28.0
Value Year T-1 . 9.1 . 11.4 15.2 37.1 26.6
Value Year T-2 . 6.1 . 18.2 . . 25.9
Value Year T-3 . . . 24.8 21.3 . 26.0
Value Year T-4 . . . . . . 26.2
Average Value, 5 year . . . . . . 26.6
Growth Trend . . . -15.9 . . 1.5
Benchmark Data Regression Benchmark 58.0 30.9 . . . . .
Lower Bound 50.0 23.6 . . . . .
Upper Bound 66.1 38.2 . . . . .
Latest Year Belize 2005 2004 . 2004 2004 2004 2005
Belize Value Latest Year 72.6 2.6 . 12.7 18.4 218.4 22.5
Latest Year Suriname 2005 2002 . . . . 2005
Suriname Value Latest Year 74.7 12.4 . . . . 18.6
LMI-LAC Median 61.8 20.1 . 11.6 12.0 37.1 27.4
Lower Middle Income Median 67.4 16.9 . 13.4 17.1 37.1 24.2
High Five Avg. 7.8 0.7 0.0 5.9 6.1 11.2 10.0
Low Five Avg. 97.8 83.9 6.2 24.3 47.8 470.0 68.3

18
Employment and Workforce
Labor Force Participation Rate, Total
Rigidity of Employment Index
(0 for minimum rigidity to 100 for maximum rigidity)
Size of Labor Force
Growth of the Labor Force, Labor Force,
Annual % Change
Unemployment Rate
Economically Active
Children, % Children
Ages 7-14
Firing Costs,
Weeks of Wages
Indicator Number 33P1 33P2 33P3a 33P3b 33P4 33P5 33S1 Guyana Data
Latest Year (T) 2005 2006 2005 2005 2001 2000 2006
Value Year T 67.0 21.0 329,611 1.0 9.1 29.6 56.3
Value Year T-1 66.6 21.0 326,423 1.0 . . 56.3
Value Year T-2 66.3 . 323,287 1.0 . . .
Value Year T-3 66.0 . 320,042 1.1 . . .
Value Year T-4 65.7 . 316,479 1.5 . . .
Average Value, 5 year 66.3 . 323,168 1.1 . . .
Growth Trend 0.5 . 1.0 . . . .
Benchmark Data Regression Benchmark 74.0 45.5 . 3.1 11.3 17.3 .
Lower Bound 69.4 34.3 . 1.6 8.8 6.6 .
Upper Bound 78.6 56.7 . 4.6 13.7 27.9 .
Latest Year Belize 2005 2006 2005 2005 2002 2001 2006
Belize Value Latest Year 67.5 10.0 116,083 4.9 10.0 7.4 24.0
Latest Year Suriname 2005 2006 2005 2005 . . 2006
Suriname Value Latest Year 53.4 23.0 152,371 1.4 . . 26.0
LMI-LAC Median 71.8 35.0 3,847,696 2.6 9.1 12.5 59.6
Lower Middle Income Median 68.3 35.0 2,503,191 2.5 10.2 . 44.3
High Five Avg. 49.7 0.0 51,616 -1.8 2.5 4.6 0.0
Low Five Avg. 92.3 76.2 306,821,409 8.1 28.7 70.2 229.0

19
Agriculture
Agriculture Value Added per Worker
Cereal Yield
Growth in Agricultural Value-Added
Agricultural Policy Costs Index (1 for poor to 7 for
excellent)
Crop Production Index (1999-2001 = 100)
Livestock Production Index (1999-2001 = 100)
Agricultural Export Growth
Indicator Number 34P1 34P2 34P3 34S1 34S2 34S3 34S4 Guyana Data
Latest Year (T) 2004 2005 2006 . 2004 2004 2005
Value Year T 3,707.1 3,795.0 5.5 . 100.1 141.1 5.0
Value Year T-1 3,537.7 3,795.0 -13.7 . 100.1 140.9 86.8
Value Year T-2 3,583.5 3,795.0 3.2 . 93.9 113.1 -23.7
Value Year T-3 3,400.4 3,790.0 . . 98.8 101.5 22.5
Value Year T-4 3,287.9 3,947.9 . . 103.1 98.7 16.0
Average Value, 5 year 3,503.3 3,824.6 -1.7 . 99.2 119.1 21.3
Growth Trend 2.8 -0.8 . . -0.5 10.4 .
Benchmark Data Regression Benchmark 2,621.2 2,870.5 2.3 . . . .
Lower Bound 1,569.5 2,234.2 -1.9 . . . .
Upper Bound 3,672.8 3,506.9 6.6 . . . .
Latest Year Belize 2004 2005 2005 . 2004 2004 2003
Belize Value Latest Year 6,632.1 2,523.9 2.0 . 110.5 148.7 50.2
Latest Year Suriname 2004 2005 2005 2006 2004 2004 2001
Suriname Value Latest Year 3,701.1 3,798.8 1.4 2.8 106.6 105.4 103.4
LMI-LAC Median 2,053.6 2,624.0 2.3 3.6 107.6 108.6 8.1
Lower Middle Income Median 1,415.2 2,484.7 3.0 3.6 110.9 108.4 10.2
High Five Avg. 109.7 368.6 -17.1 2.5 68.1 86.5 -0.6
Low Five Avg. 39,551.3 7,896.1 17.9 5.2 135.9 148.4 8.1

Technical Notes The following technical notes identify the source for each indicator, provide a concise definition, indicate the coverage of USAID countries, and comment on data quality where pertinent. For reference purposes, a CAS code is also given for each indicator. In many cases, the descriptive information is taken directly from the original sources, as cited.
STATISTICAL CAPACITY
Statistical Capacity Indicator
Source: World Bank, updated annually, at http://web.worldbank.org/WBSITE/EXTERNAL/DATASTATISTICS/0,,contentMDK:20541648~pagePK:64133150~piPK:64133175~theSitePK:239419,00.html Definition: Provides and evaluation of a country’s' statistical practice, data collection activities and key indicator availability against a set of criteria consistent with international recommendations. The score ranges from 0 to 100 with a score of 100 indicating that the country meets all the criteria. Coverage: Data are available for the vast majority of USAID countries. CAS Code # 01P1
GROWTH PERFORMANCE
Per capita GDP, in Purchasing Power Parity Dollars
Source: IMF World Economic Outlook database, updated every six months, at http://www.imf.org/external/ns/cs.aspx?id=28 Definition: This indicator adjusts per capita GDP measured in current U.S. dollars for differences in purchasing power, using an estimated exchange rate reflecting the purchasing power of the various local currencies. Coverage: Data are available for about 85 USAID countries. CAS Code #11P1
Per capita GDP, in current US Dollars
Source: IMF World Economic Outlook database, updated every 6 months, at: http://www.imf.org/external/ns/cs.aspx?id=28 Definition: GDP per capita is gross domestic product divided by midyear population. GDP is the sum of gross value added by all resident producers plus any product taxes, less any subsidies not included in the value of the products. It is calculated without making deductions for depreciation of fabricated assets or for depletion and degradation of natural resources. Coverage: Data are available for about 85 USAID countries. CAS Code #11P2
Real GDP Growth
Source: IMF World Economic Outlook database, updated every six months; latest country data from IMF Article IV consultation reports:
www.imf.org/external/np/sec/aiv/index.htm Definition: Annual percentage growth rate of GDP at constant local currency prices Coverage: Data are available for about 85 USAID countries. CAS Code #11P3
Growth of Labor Productivity
Source: Best labor market data available for target country, or World Development Indicators. If using WDI, estimated by calculating the annual percentage change of the ratio of GDP (constant 1995 US$) (NY.GDP.MKTP.KD) to the population age 15–64, which in turn is the product of the total population (SP.POP.TOTL) times the percentage of total population in this age group (SP.POP.1564.IN.ZS). Definition: Labor productivity is defined here as the ratio of GDP (in constant prices) to the size of the working age population (age 15–64). The more familiar calculation, based on employment, labor force, or work hours, is used where available. Coverage: Data are available for about 85 USAID countries. CAS Code # 11S1
Investment Productivity, Incremental Capital-Output Ratio (ICOR)
Source: International benchmark data computed from World Development Indicators most recent publication year, based on the five-year average of the share of fixed investment (NE.GDI.FTOT.ZS) and the five-year average GDP growth (NY.GDP.MKTP.KD.ZG). Updated figures for the target country are computed from IMF Article IV consultation reports. Definition: The ICOR shows the amount of capital investment incurred per extra unit of output. A high value represents low investment productivity. The ICOR is calculated here as the ratio of the investment share of GDP to the growth rate of GDP, using five-year averages for both the numerator and denominator. Coverage: Data are available for about 81 USAID countries. CAS Code #11S2
Gross Fixed Investment, Percentage of GDP
Source: IMF Article IV consultation report for latest country data; international benchmark from the World Development Indicators, most recent publication series NE.GDI.FTOT.ZS. Definition: Gross fixed investment is spending on replacing or adding to fixed assets (buildings, machinery, equipment and similar goods). Coverage: Data are available for about 84 USAID countries. CAS Code # 11S3

T E C H N I C A L N O T E S 21
Gross Fixed Private Investment, Percentage of GDP
Source: IMF Article IV consultation report, for latest country data; World Development Indicators 2004, for international comparison data (explanation below). The estimation of this indicator involves taking the difference between gross fixed capital formation (percent of GDP) (NE.GDI.FTOT.ZS) and government capital expenditure (percent of GDP). The latter term is the product of government capital expenditure (percent of total expenditure) (GB.XPK.TOTL.ZS) and total government expenditure (percent of GDP) (GB.XPD.TOTL.GD.ZS). Definition: This indicator measures gross fixed capital formation by nongovernment investors, including spending for replacement or net addition to fixed assets (buildings, machinery, equipment, and similar goods). Coverage: Available from World Development Indicators 2004 for about 38 USAID countries. Starting in 2005, WDI no longer reports government capital expenditure, which is needed to compute this variable. The reason is that the World Bank has adopted a new system for government finance statistics, which switches from reporting budget performance based on cash outlays and receipts, to a modified accrual accounting system in which government capital formation is a balance sheet entry, and only the consumption of fixed capital (that is, a depreciation allowance) is treated as an expense. The template will include this variable when the required data can be obtained from IMF Article IV consultation report or national data sources. Group and regression benchmarks will be computed from WDI 2004 (since group averages tend to be relatively stable). Data Quality: National statistics offices may have different methodologies for breaking down total government expenditure into current and capital components. In particular, the data on “development expenditure” in many countries include elements of current expenditure. CAS Code #11S4
POVERTY AND INEQUALITY
Human Poverty Index
Source: UNDP, Human Development Report. http://hdr.undp.org/statistics/data/indicators.cfm?x=18&y=1&z=1 for most recent edition; updates may be found at http://hdr.undp.org/reports/view_reports.cfm?type=1 Definition: The index measures deprivation in terms of not meeting target levels for specified economic and quality-of-life indicators. Values are based on (1) percentage of people not expected to survive to age 40, (2) percentage of adults who are illiterate, and (3) percentage of people who fail to attain a “decent living standard,” which is subdivided into three (equally weighted) separate items: (a) percentage of people without access to safe water, (b) percentage of people without access to health services, and (c) percentage of underweight children. The HPI ranges in value from 0 (zero deprivation incidence) to 100 (high deprivation incidence). Coverage: Data are available for about 60 USAID countries. CAS Code #12P1
Income Share, Poorest 20%
Source: World Development Indicators, most recent publication series SI.DST.FRST.20. These are World Bank staff estimates based on primary household survey data obtained from government statistical agencies and World Bank country departments. Alternative source for target countries: the country’s Poverty Reduction Strategy Paper: http://www.imf.org/external/np/prsp/prsp.asp
Definition: Share of total income or consumption accruing to the poorest quintile of the population. Coverage: Data are available for about 59 USAID countries, if one goes back to 1997; for the period since 2000, data are available for about 35 USAID countries. CAS Code # 12P2
Percentage of Population Living on Less than $1 PPP per Day
Source: World Development Indicators, most recent publication series SI.POV.DDAY, original data from national surveys. Alternative source for target countries: the country’s Poverty Reduction Strategy Paper: http://www.imf.org/external/np/prsp/prsp.asp Definition: The indicator captures the percentage of the population living on less than $1.08 a day at 1993 international prices. Coverage: Data are available for about 59 USAID countries going back to 1997; data for 2000 or later are available for about 35 USAID countries. Data Quality: Poverty data originate from household survey questionnaires that can differ widely; even similar surveys may not be strictly comparable because of difference in quality. CAS Code #12P3a
Percentage of Population Living on Less than $2 PPP per Day
Source: World Development Indicators, most recent publication series SI.POV.2DAY, original data from national surveys. Alternative source for target countries: the country’s Poverty Reduction Strategy Paper: http://www.imf.org/external/np/prsp/prsp.asp Definition: The indicator captures the percentage of the population living on less than $2.15 a day at 1993 international prices. Coverage: Data are available for about 59 USAID countries going back to 1997; data for 2000 or later are available for about 35 USAID countries. Data Quality: Poverty data originate from household survey questionnaires that can differ widely; even similar surveys may not be strictly comparable because of difference in quality. CAS Code #12P3b
Poverty Headcount, National Poverty Line
Source: World Development Indicators, most recent publication series SI.POV.NAHC. Alternative source: the country’s Poverty Reduction Strategy Paper: http://www.imf.org/external/np/prsp/prsp.asp Definition: The percentage of the population living below the national poverty line. National estimates are based on population-weighted estimates from household surveys Coverage: Data available for only 19 countries for 2000 or later; data are available for about 49 countries going back to 1997. For most target countries, data can be obtained from the PRSP. Data Quality: Measuring the percentage of people below the “national poverty line” has the disadvantage of limiting international comparisons because of differences in the definition of the poverty line. Most lower-income countries, however, determine the national poverty line by the level of consumption required to have a minimally sufficient food intake plus other basic necessities. CAS Code #12P4

22 T E C H N I C A L N O T E S
PRSP Status
Source: World Bank/IMF. A list of countries with a Poverty Reduction Strategy Paper can be found at http://www.imf.org/external/np/prsp/prsp.asp Definition: Yes or no variable showing whether a country has (or not) completed a PRSP (introduced by the World Bank and IMF to ensure host-country ownership of poverty reduction programs). Coverage: All countries having PRSPs are so indicated. CAS Code #12P5
Population below Minimum Dietary Energy Consumption
Source: UN Millennium Indicators Database at http://millenniumindicators.un.org/unsd/mdg/Data.aspx, based on FAO estimates. Definition: Proportion of the population in a condition of undernourishment. The FAO defines undernourishment as the condition of people whose dietary energy consumption is continuously below a minimum dietary energy requirement for maintaining a healthy life and carrying out light physical activity. Coverage: Data are available for about 82 USAID countries. CAS Code # 12S1
ECONOMIC STRUCTURE
Employment or Labor Force Structure
Source: World Development Indicators, most recent publication series SL.AGR.EMPL.ZS for agriculture, series SL.IND.EMPL.ZS for industry, and series SL.SRV.EMPL.ZS for services. Alternative source: CIA World Fact Book: https://www.cia.gov/library/publications/the-world-factbook/index.html Definition: Employment in each sector is the proportion of total employment recorded as working in that sector. Employees are people who work for a public or private employer and receive remuneration in wages, salary, commission, tips, piece rates, or pay in kind. Agriculture includes hunting, forestry, and fishing. Industry includes mining and quarrying (including oil production), manufacturing, electricity, gas and water, and construction. Services include wholesale and retail trade and restaurants and hotels; transport, storage, and communications; financing, insurance, real estate, and business services; and community, social, and personal services. Coverage: Data are available for about 37 USAID countries. For most target countries, data can be obtained from PRSP. Data Quality: Employment figures originate with International Labor Organization. Some countries report labor force structure instead of employment, thus the data must be checked carefully before comparisons are made. CAS Code #13P1
Output Structure
Source: World Development Indicators, most recent publication series NV.AGR.TOTL.ZS for value added in agriculture as a percentage of GDP; series NV.IND.TOTL.ZS for the share of industry; and NV.SRV.TETC.ZS for the share of services. Definition: The output structure is composed of value added by major sector of the economy (agriculture, industry, and services) as percentages of GDP, where value added is the net output of a sector after all outputs are added up and
intermediate inputs are subtracted. Value added is calculated without deductions for depreciation of fabricated assets or depletion and degradation of natural resources. Agriculture includes forestry, hunting, and fishing, as well as cultivation of crops and livestock production. Industry includes manufacturing, mining, construction, electricity, water, and gas. Services include wholesale and retail trade (including hotels and restaurants), transport, and government, financial, professional, and personal services such as education, health care, and real estate services. Coverage: Data are available for about 86 USAID countries. Data Quality: A major difficulty in compiling national accounts is the extent of unreported activity in the informal economy. In developing countries a large share of agricultural output is either not exchanged (because it is consumed within the household) or not exchanged for money. This production is estimated indirectly using estimates of inputs, yields, and area under cultivation. This approach can differ from the true values over time and across crops. Ideally, informal activity in industry and services is measured through regular enterprise censuses and surveys. In most developing countries such surveys are infrequent, so prior survey results are extrapolated. CAS Code #13P2
DEMOGRAPHY AND ENVIRONMENT
Adult Literacy Rate
Source: World Development Indicators, most recent publication series SE.ADT.LITR.ZS, based on UNESCO calculations. Definition: Percentage of people ages 15 and older who can read and write a short, simple statement about their daily life. Coverage: Data are available for about 66 USAID countries. Data Quality: In practice, literacy is difficult to measure. A proper estimate requires census or survey measurements under controlled conditions. Many countries estimate the number of illiterate people from self-reported data, or by taking people with no schooling as illiterate. CAS Code # 14P1
Youth Dependency Rate
Source: World Development Indicators, most recent publication series. Definition: Youth dependency rate is calculated as the percentage of the population below age 15 (WDI SP.POP.0014.TO.ZS) divided by the working-age population (those ages 15–64) (WDI SP.POP.1564.TO.ZS) Coverage: Data are available for about 89 USAID countries. CAS Code #14P2a
Elderly Dependency Rate
Source: World Development Indicators, most recent publication series. Definition: This is calculated as percentage of the population over age 65 (WDI SP.POP.65UP.TO.ZS) divided by working-age population (those ages 15–64) (WDI SP.POP.1564.TO.ZS) Coverage: Data are available for about 89 USAID countries. CAS Code #14P2b
Environmental Performance Index
Source: Center for International Earth Science Information Network (CIESIN) at Columbia University, and the Center

T E C H N I C A L N O T E S 23
for Environmental Law and Policy at Yale University. http://www.yale.edu/epi/ . Definition: The Environmental Performance Index (EPI) is a composite index of national environmental protection, which tracks (1) environmental health, (2) air quality, (3) water resources, (4) biodiversity and habitat, (5) productive natural resources, and (6) sustainable energy. The index is a weighted average of these six policy categories, with more weight given environmental health, (i.e., EPI = 0.5 × environmental health + 0.1 × (air quality + water resources + productive natural resources + biodiversity and habitat + sustainable energy)). The index values range from 0 (very poor performance) to 100 (very good performance). The 2006 edition is considered a work in progress. Coverage: Data are available for about 80 USAID countries. CAS Code #14P3
Population Size and Growth
Source: World Development Indicators, most recent publication series SP.POP.TOTL for total population, and series SP.POP.GROW for the population growth rate. Definition: Total population counts all residents regardless of legal status or citizenship—except refugees not permanently settled in the country of asylum. Annual population growth rate is based on the de facto definition of population. Coverage: Data are available for about 88 USAID countries. CAS Code # 14P4
Urbanization Rate
Source: World Development Indicators, most recent publication series SP.URB.TOTL.IN.ZS. Definition: Urban population is the share of the total population living in areas defined as urban in each country. The calculation considers all residents regardless of legal status or citizenship, except refugees. Coverage: Data are available for about 86 USAID countries. Data Quality: The estimates are based on national definitions of what constitutes an urban area; since these definitions vary greatly, cross-country comparisons should be made with caution. CAS Code #14P5
GENDER
Girls’ Primary Completion Rate
Source: World Development Indicators, most recent publication series: SE.PRM.CMPT.FE.ZS Definition: Primary completion rate is the percentage of students completing the last year of primary school. It is calculated by taking the total number of students in the last grade of primary school, minus the number of repeaters in that grade, divided by the total number of children of official graduation age. Coverage: Data are available for about 80 USAID countries. Data Quality: Completion rates are based on data collected during annual school surveys, typically conducted at the beginning of the school year. The indicator does not measure the quality of the education. CAS Code #15P1
Gross Enrollment Rate, All Levels of Education, Male and Female
Source: UNDP Human Development Report http://hdr.undp.org/hdr2006/statistics/indicators/225.html and http://hdr.undp.org/hdr2006/statistics/indicators/224.html Definition: The number of students enrolled in primary, secondary, and tertiary levels of education by sex, regardless of age, as a percentage of the population of official school age for the three levels by sex. Coverage: Data are available for about 80 USAID countries. Data Quality: Enrollment rates are based on data collected during annual school surveys, typically conducted at the beginning of the school year. CAS Code #15P2
Life Expectancy, Male and Female
Source: Estimated from UNDP Human Development Indicators: http://hdr.undp.org/hdr2006/statistics/indicators/221.html. Definition: The number of years a newborn male or female infant would live if prevailing patterns of age and sex-specific mortality rates at the time of birth were to stay the same throughout the child’s life. Coverage: Data are available for about 85 USAID countries. CAS Code #15P3
Labor Force Participation Rate, Male and Female
Source: Derived from World Development Indicators, but the precise computation differs depending on the edition of WDI used for the data. To calculate the female labor force participation rate using WDI 2007: the numerator is the labor force, female (% of total labor force) (SL.TLF.TOTL.FE.ZS) times labor force, total (SL.TLF.TOTL.IN); the denominator is simply population ages 15–64, female (SP.POP.1564.FE.IN). Using WDI 2006, the denominator (female population, ages 15–64), can only be estimated by multiplying the total population (SP.POP.TOTL) times the percentage of the population ages 15–64 (SP.POP.1564.IN.ZS) times the percentage of females in the total population (SP.POP.TOTL.FE.ZS). To calculate the male labor force participation rate using WDI 2004: the numerator is calculated by subtracting the female labor force, derived above, from the total labor force (SL.TLF.TOTL.IN). The denominator is population ages 15–64, male (SP.POP.1564.MA.IN). Using WDI 2006 and subsequent years, the denominator is an estimate of the male population, ages 15–64, calculated as the total population (SP.POP.TOTL) times the percentage ages 15–64 (SP.POP.1564.IN.ZS) times the percentage of males in the total population, where the final factor is computed as 100 minus the percentage of females in the total population (SP.POP.TOTL.FE.ZS). Definition: The percentage of the working-age population that is in the labor force. The labor force is made up of people who meet the International Labour Organization definition of the economically active population: all people who supply labor for the production of goods and services during a specified period. It includes both the employed and the unemployed. Coverage: Data are available for about 88 USAID countries. CAS Code #15P4

24 T E C H N I C A L N O T E S
FISCAL AND MONETARY POLICY In the World Development Indicators for 2005, the World Bank has adopted a new system for government budget statistics, switching from data based on cash outlays and receipts to a system with revenues booked on receipt and expenses booked on accrual, in accordance with the IMF’s Government Financial Statistics Manual, 2001. On the revenue side, the changes are minor, and comparisons to the old system may still be valid. There is a major change, however, in the reporting of capital outlays, which are now treated as balance sheet entries; only the annual capital consumption allowance (depreciation) is reported as an expense. Hence, the data on total expense is not comparable to the former data on total expenditure. In addition, WDI 2005 now provides data on the government’s cash surplus/deficit; this differs from the previous concept of the overall budget balance by excluding net lending minus repayments (which are now a financing item under net acquisition of financial assets). Many countries do not use the new GFS system, so country coverage of fiscal data in WDI 2005 is limited. For these reasons, the template will continue to use some data from WDI 2004, along with new data from WDI 2005 and subsequent WDI series, as appropriate.
Government Expenditure, Percentage of GDP Source: IMF Article IV consultation report for latest country data www.imf.org/external/np/sec/aiv/index.htm; International Financial Statistics database for benchmarking (line item 82 divided by GDP). Definition: Total expenditure of the central government as a percent of GDP. Gaps: Data available for about 70% of USAID countries. CAS Code # 21P1
Government Revenue, excluding grants, Percentage of GDP Source: IMF Article IV consultation report for latest country data www.imf.org/external/np/sec/aiv/index.htm; World Development Indicators for benchmarking data (GB.RVC.TOTL.GD.ZS). Original data from the IMF, Government Finance Statistics Yearbook and data file, and World Bank estimates. Definition: Government revenue includes all revenue to the central government from taxes and non-repayable receipts (other than grants), measured as a share of GDP. Grants represent monetary aid going to the central government that has no repayment requirement. Gaps: Data missing for about 24 USAID countries. CAS Code # 21P2
Growth in Broad Money Supply Source: Latest country data are from national data sources or from IMF Article IV consultation report: www.imf.org/external/np/sec/ aiv/index.htm. Benchmarking data are from World Development Indicators, most recent publication, series FM.LBL.MQMY.ZG. Original source of WDI data is IMF, International Financial Statistics, and World Bank estimates. Definition: Average annual growth rate in the broad money supply, M2 (money plus quasi-money) measured as the change in end-of-year totals relative to the preceding year. M2 comprises the sum of currency outside banks, checking account deposits other than those of the central government, and the time, savings, and foreign currency deposits of resident sectors other than the central government. M2 corresponds to the sum of lines 34 and 35 in the IMF’s International Financial Statistics.
Coverage: Data are available for about 81 USAID countries. CAS Code #21P3
Inflation Rate Source: IMF World Economic Outlook database, updated every six months, at http://www.imf.org/external/ns/ cs.aspx?id=28 Definition: Inflation as measured by the consumer price index reflects the annual percentage change in the cost to the average consumer of acquiring a basket of goods and services that may be fixed or changed at specific intervals. Coverage: Data are available for about 85 USAID countries. Data Quality: For many developing countries, figures for recent years are IMF staff estimates. Additionally, data for some countries are for fiscal years. CAS Code # 21P4
Overall Budget Balance, Including Grants, Percentage of GDP Source: For countries using the new GFS system (see explanation at the beginning of this section), benchmarking data on the government’s cash surplus/deficit are obtained from World Development Indicators, most recent publication series GC.BAL.CASH.GD.ZS. For countries that are not yet using the new system, benchmarking data on the overall budget balance are obtained from WDI 2004, series GB.BAL.OVRL.GD.ZS. Latest country data are obtained from national data sources or from IMF Article IV consultation reports: www.imf.org/external/np/sec/aiv/index.htm. Definition: The cash surplus/deficit is revenue (including grants) minus expenses, minus net acquisition of nonfinancial assets. This is close to the previous concept of overall budget balance, differing only in that it excludes net lending (which is now treated as a financing item, under net acquisition of financial assets). For countries that are not using the new GFS system, the template will continue to focus on the overall budget balance, using data from the alternative sources indicated above. The overall budget deficit is defined as the difference between total revenue (including grants) and total expenditure. Both concepts measure the central government’s financing requirement, which must be met by domestic or foreign borrowing. As noted above, they differ in that the new cash surplus/deficit variable excludes net lending (which is usually a minor item). Coverage: Data are available in WDI 2006 for less than half USAID countries. CAS Code # 21P5
Composition of Government Expenditure
Source: The latest country and benchmark data are taken from national data sources or from IMF Article IV consultation reports: www.imf.org/external/np/sec/aiv/index.htm. Definition: Central government expenditure, broken down into the following five categories:. (1) wages and salaries; (2) goods and services; (3) interest payments; (3) subsidies and other current transfers; (4) capital expenditures; (5) other expenditure. Coverage: Data are available for the majority of USAID countries. As explained at the beginning of this section, WDI stopped reporting government expenditures in 2005. The template will include this variable when the required data can be obtained from IMF Article IV consultation report or national data sources for the target country and the

T E C H N I C A L N O T E S 25
comparison countries. Data Quality: Many countries report their revenue in noncomparable categories. Budget data are compiled by fiscal year. If the fiscal year differs from the calendar year, ratios to GDP may be calculated by interpolating budget data from two adjacent fiscal years. CAS Code # 21S1
Composition of Government Revenue
Source: The latest country and comparison country data are taken from national data sources or from IMF Article IV consultation reports: www.imf.org/external/np/sec/aiv/index.htm. Benchmarking data are taken directly from WDI 2005 database: (1) taxes on goods and services (% of revenue), series GC.TAX.GSRV.RV.ZS; (2) taxes on income, profits and capital gains (% of revenue), series GC.TAX.YPKG.RV.ZS; (3) taxes on international trade (% of revenue), series GC.TAX.INTT.RV.ZS; (4) other taxes (% of revenue), series GC.TAX.OTHR.RV.ZS; (5) social security contributions (% of revenue), series GC.REV.SOCL.ZS; and (6) grants and other revenue (% of revenue), series GC.REV.GOTR.ZS. Definition: Breakdown of central government revenue sources by categories outlined above. Each source of revenue is expressed as a percentage of total revenue. Coverage: Data are available from WDI 2005 for about 46 USAID countries. Data Quality: Many countries report their revenue in noncomparable categories. If the fiscal year differs from the calendar year, then the ratios to GDP may be calculated by interpolating budget data from two adjacent fiscal years. CAS Code # 21S2
Composition of Money Supply Growth
Source: Constructed using national data sources or IMF Article IV consultation reports: www.imf.org/external/np/sec/ aiv/index.htm. Definition: Identifies the sources of the year-to-year change in the broad money supply (M2), disaggregated into five categories: (1) net domestic credit to the public sector, (2) net domestic credit to the private sector, and (3) net foreign assets (reserves), (4) net credit to non-financial public enterprises, and (5) other items, net. Each component is expressed as a percentage of the annual change (December to December) in M2. Coverage: Data are available for about 86 USAID countries. CAS Code # 21S3
BUSINESS ENVIRONMENT
Control of Corruption Index
Source: World Bank Institute
http://www.govindicators.org
Definition: The Control of Corruption index is an aggregation of various indicators that measure the extent to which public power is exercised for private gain, including both petty and grand forms of corruption, as well as "capture" of the state by elites and private interests. Index ranges from -2.5 (for very poor performance) to +2.5 (for excellent performance).
This is also an MCC indicator, under the criterion of ruling justly. The MCC rescales the values as percentile rankings relative to the set of MCA eligible countries, ranging from a value from 0 (for very poor performance) to 100 (for
excellent performance). Some country reports use the MCC scaling. Coverage: Data are available for nearly all USAID countries. Data Quality: This indicator uses perception and opinions gathered from local businessmen as well as third-party experts; thus, the indicator is largely subjective. Also standard errors are large. For both reasons, international comparisons are problematic, though widely used. CAS Code # 22P1
Ease of Doing Business Index
Source: World Bank, Doing Business Indictors http://rru.worldbank.org/DoingBusiness/ Definition: The Ease of Doing Business index ranks economies from 1 to 175. The index is calculated as the ranking on the simple average of country percentile rankings on each of the 10 topics covered in Doing Business in 2007: starting a business, dealing with licenses, hiring and firing, registering property, getting credit, protecting investors, paying taxes, trading across borders, enforcing contracts, and closing a business. Coverage: Data are available for nearly all USAID countries. CAS Code # 22P2
Rule of Law Index
Source: World Bank Institute, http://www.govindicators.org
This indicator is based on the perceptions of the legal system, drawn from 12 data sources. Definition: The Rule of Law index is an aggregation of various indicators that measure the extent to which agents have confidence in and abide by the rules of society. Index ranges from -2.5 (for very poor performance) to +2.5 (for excellent performance). Coverage: Data are available for nearly all USAID countries. Data Quality: This index is best used with caution for relative comparisons between countries in a single year, because the standard errors are large. Using the index to track a country’s progress over time is also difficult because the index does not compensate for changes in the world average. For instance, if the world average decreases in a given year, a country whose score appears to increase may not actually have tangible improvements in its legal environment. CAS Code #22P3
Regulatory Quality Index
Source: World Bank Institute; http://www.govindicators.org
Definition: The regulatory quality index measures the ability of the government to formulate and implement sound policies and regulations that permit and promote private sector development. It is computed from survey data from multiple sources. The index values range from -2.5 (very poor performance) to +2.5 (excellent performance).
This is also an MCC indicator, under the criterion of encouraging economic freedom. The MCC rescales the values as percentile rankings relative to the set of MCA eligible countries, ranging from a value from 0 (for very poor performance) to 100 (for excellent performance). Some country reports use the MCC scaling. Gaps: Data are available for nearly all USAID countries. Data Quality: This index is best used with caution for relative comparisons between countries in a single year, because the standard errors are large. It is also difficult to use

26 T E C H N I C A L N O T E S
the index to track a country’s progress over time because the index does not compensate for changes in the world average. For instance, if the world average decreases in a given year, a country whose score appears to increase may not actually have tangible improvements in their legal environment. CAS Code #22P4
Government Effectiveness Index
Source: World Bank Institute, http://www.govindicators.org Definition: This index, based on 17 component sources, measures “the quality of public services, the quality of the civil service and the degree of its independence from political pressures, the quality of policy formulation and implementation, and the credibility of the government’s commitment to such policies.” The index values range from -2.5 (very poor performance) to +2.5 (excellent performance). Coverage: Data are available for nearly all USAID countries. CAS Code #22P5
Cost of Starting a Business
Source: World Bank, Doing Business; Starting a Business category:http://rru.worldbank.org/DoingBusiness/ ExploreTopics/StartingBusiness/CompareAll.aspx Definition: Legally required cost to starting a simple limited liability company, expressed as percentage of GNI per capita. Coverage: Data are available for nearly all USAID countries. CAS Code #22S1
Procedures to Enforce a Contract
Source: World Bank, Doing Business; Enforcing Contracts category: http://rru.worldbank.org/DoingBusiness/ ExploreTopics/EnforcingContracts/CompareAll.aspx Definition: The number of procedures required to enforce a valid contract through the court system, with procedure defined as any interactive step the company must take with government agencies, lawyers, notaries, etc. to proceed with enforcement action. Coverage: Data are available for nearly all USAID countries. CAS Code # 22S2
Procedures to Register Property
Source: World Bank, Doing Business; Registering Property category: http://rru.worldbank.org/DoingBusiness/ ExploreTopics/RegisteringProperty/CompareAll.aspx Definition: Number of procedures required to register the transfer of title for business property. A procedure is defined as any step involving interaction between a company or individual and a third party that is necessary to complete the property registration process. Coverage: Data are available for nearly all USAID countries. CAS Code #22S3
Procedures to Start a Business
Source: World Bank, Doing Business; Starting a Business category: http://rru.worldbank.org/DoingBusiness/ ExploreTopics/StartingBusiness/CompareAll.aspx Definition: The number of procedural steps required to legalize a simple limited liability company. A procedure is an interaction of a company with government agencies, lawyers, auditors, notaries, and the like, including interactions required to obtain necessary permits and licenses and
complete all inscriptions, verifications, and notifications to start operations. Coverage: Data are available for nearly all USAID countries. CAS Code # 22S4
Time to Enforce a Contract
Source: World Bank, Doing Business; Enforcing Contracts category: http://rru.worldbank.org/DoingBusiness/ ExploreTopics/EnforcingContracts/CompareAll.aspx Definition: Minimum number of days required to enforce a contract through the court system. Coverage: Data are available for nearly all USAID countries. CAS Code # 22S5
Time to Register Property
Source: World Bank, Doing Business; Registering Property category: http://rru.worldbank.org/DoingBusiness/ ExploreTopics/RegisteringProperty/CompareAll.aspx Definition: The time required to accomplish the full sequence of procedures to transfer a property title from the seller to the buyer when a business purchases land and a building in a peri-urban area of the country’s most populous city. Every required procedure is included whether it is the responsibility of the seller, the buyer, or where it is required to be completed by a third party on their behalf.
Coverage: Data are available for nearly all USAID countries. CAS Code #22S6
Time to Start a Business
Source: World Bank, Doing Business; Starting a Business category: http://rru.worldbank.org/DoingBusiness/ ExploreTopics/StartingBusiness/CompareAll.aspx Definition: The number of calendar days needed to complete the required procedures for legally operating a business. If a procedure can be speeded up at additional cost, the fastest procedure, independent of cost, is chosen. Coverage: Data are available for nearly all USAID countries. CAS Code #22S7
Total Tax Payable by Business
Source: World Bank, Doing Business, Paying Taxes Category: http://www.doingbusiness.org/ExploreTopics/ PayingTaxes/ Definition: The amount of taxes payable by a medium-sized business in the second year of operation, expressed as share of commercial profits. The total amount of taxes is the sum of all the different taxes payable after accounting for deductions and exemptions. The taxes withheld but not paid by the company are excluded. The taxes included can be divided into five categories: profit or corporate income tax, social security contributions and other labor taxes paid by the employer, property taxes, turnover taxes and other small taxes (such as municipal fees and vehicle and fuel taxes). Commercial profits are defined as sales minus cost of goods sold, minus gross salaries, minus administrative expenses, minus other deductible expenses, minus deductible provisions, plus capital gains (from the property sale) minus interest expense, plus interest income and minus commercial depreciation. Coverage: Data are available for nearly all USAID countries CAS Code #22S8

T E C H N I C A L N O T E S 27
Business Costs of Crime, Violence and Terrorism Index
Source: Global Competitiveness Report 2006-2007, World Economic Forum. The indicators can be found in the Data Tables, Section VI. Definitions: The index measures executives’ perceptions of the business costs of terrorism in their respective country. Executives grade, on a scale from 1 to 7, whether crime, violence and terrorism impose (1) significant costs on business, or (7) do not impose significant costs on business. Coverage: Data are available for about 52 USAID countries. Data Quality: Comparisons between countries are difficult, because the data are based on executive perceptions. CAS Code #22S9
Senior Manager Time Spent Dealing with Government Regulations
Source: World Bank Enterprise Surveys, Bureaucracy section, www.enterprisesurveys.org. Definitions: Average percentage of senior managers’ time that is spent in a typical week dealing with requirements imposed by government regulations such as taxes, customs, labor regulations, licensing and registration, and dealings with officials, and completing forms. Coverage: Data available for about 80 USAID countries. Data Quality: Same-timeframe comparisons between countries may be difficult; 15-20 enterprise surveys are conducted per year, with country updates expected approximately every three to five years. Surveys are taken of hundreds of entrepreneurs per country who describe the impact of their country’s investment climate on their firm. CAS Code #22S10
FINANCIAL SECTOR
Domestic Credit to Private Sector, Percentage of GDP
Source: IMF Article IV consultation reports or national data sources for latest country data; World Development Indicators, most recent publication series FS.AST.PRVT.GD.ZS for benchmarking data. The WDI data originate with the IMF, International Financial Statistics and data files, and World Bank estimates. Definition: Domestic credit to private sector refers to financial resources provided to the private sector, such as through loans, purchases of non-equity securities, and trade credits and other accounts receivable, that establish a claim for repayment. For some countries, these claims include credit to public enterprises. Coverage: Data are available for about 82 USAID countries. CAS Code # 23P1
Interest Rate Spread
Source: World Development Indicators, most recent publication series FR.INR.LNDP. Original data from IMF, International Financial Statistics and data files. Definition: The difference between the average lending and borrowing interest rates charged by commercial or similar banks on domestic currency deposits. Coverage: Data are available for about 66 USAID countries. CAS Code # 23P2
Money Supply, Percentage of GDP
Source: Latest country data obtained from national data sources or IMF Article IV consultation reports: www.imf.org/external/np/sec/aiv/index.htm. Benchmarking data from World Development Indicators, most recent publication series FM.LBL.MQMY.GD.ZS. WDI data originate from IMF, International Financial Statistics and data files, and World Bank and OECD GDP estimates. Definition: Money supply (M2), also called broad money, is defined as nonbank private sector’s holdings of notes, coins, and demand deposits, plus savings deposits and foreign currency deposits. Ratio of M2 to GDP is calculated to assess the degree of monetization of an economy. Coverage: Data are available for about 81 USAID countries. Data Quality: In some countries M2 includes certificates of deposits, money market instruments, and treasury bills. CAS Code # 23P3
Stock Market Capitalization Rate, Percentage of GDP
Source: World Development Indicators, most recent publication, series CM.MKT.LCAP.GD.ZS. Definition: This variable is defined as the market capitalization, also known as market value (the share price times the number of shares outstanding), of all the domestic shares listed on the country’s stock exchange as a percentage of GDP. Coverage: Data are available for about 54 USAID countries. CAS Code # 23P4
Credit Information Index
Source: World Bank, Doing Business; Getting Credit Category: http://www.doingbusiness.org/ExploreTopics/ GettingCredit/Default.aspx?direction=asc&sort=2 Definition: The credit information index measures rules affecting the scope, accessibility and quality of credit information available through either public or private credit registries. The index ranges from 0 to 6, with higher values indicating the availability of more credit information, from either a public registry or a private bureau, to facilitate lending decisions. Coverage: Data are available for nearly all USAID countries. Data Quality: The indicator is subjective, as it is based on an opinion poll. CAS Code # 23P5
Legal Rights of Borrowers and Lenders Index
Source: World Bank Doing Business; Getting Credit category: http://rru.worldbank.org/DoingBusiness/ ExploreTopics/GettingCredit/CompareAll.aspx. The index is based on data collected through research of collateral and insolvency laws supported by survey data on secured transactions laws. Definition: The index measures the degree to which collateral and bankruptcy laws facilitate lending. It ranges in value from 0 (very poor performance) to 10 (excellent performance). It includes three aspects related to legal rights in bankruptcy, and seven aspects found in collateral law. Coverage: Data are available for nearly all USAID countries. CAS Code # 23S1
Real Interest Rate
Source: World Development Indicators, most recent publication series FR.INR.RINR.

28 T E C H N I C A L N O T E S
Definition: Real interest rate is the lending interest rate adjusted for inflation, as measured by the GDP deflator. Coverage: Data are available for about 68 USAID countries. CAS Code # 23S2
Number of Active Microfinance Borrowers
Source: The Mix Market. http://www.mixmarket.org/en/demand/demand.quick.search.asp. Definition: An aggregate of the number of current borrowers from microfinance institutions as reported by microfinance institutions to The Mix Market. Coverage: Data are available for about 68 USAID countries. Data Quality: Data are only available for those microfinance institutions that report to the Mix Market and data are not always updated in a timely fashion. CAS Code # 23S3
EXTERNAL SECTOR
Aid, Percentage of GNI
Source: Latest country data obtained from national data sources or IMF Article IV consultation reports: www.imf.org/ external/np/sec/aiv/index.htm. Benchmarking data from World Development Indicators, most recent publication series DT.ODA.ALLD.GN.ZS. Definition: The indicator measures official development assistance from OECD countries and official aid from non-OECD countries, as a percentage of the recipient’s gross national income. Coverage: Data are available for about 84 USAID countries. Data Quality: Data do not include aid given by recipient countries to other recipient countries, and may not be consistent with the country’s balance sheets, because data are collected from donors. CAS Code #24P1
Current Account Balance, Percentage of GDP
Source: Latest country data from national data sources or IMF Article IV consultation reports: www.imf.org/external/ np/sec/aiv/index.htm. Benchmarking data from World Development Indicators, most recent publication series BN.CAB.XOKA.GD.ZS, based on IMF, Balance of Payments Statistics Yearbook and data files, World Bank staff estimates, and World Bank and OECD GDP estimates. Definition: Current account balance is the sum of net exports of goods, services, net income, and net current transfers. It is presented here as a percentage of a country’s gross domestic product. Coverage: Data are available for about 79 USAID countries. CAS Code # 24P2
Debt Service ratio
Source: Latest country data obtained from national data sources or IMF Article IV consultation reports: www.imf.org/external/np/sec/aiv/index.htm. Benchmarking data from World Development Indicators, most recent publication, series DT.TDS.DECT.EX.ZS, based on World Bank, Global Development Finance data. Definition: Total debt service is the sum of principal repayments and interest actually paid in foreign currency, goods, or services on long-term debt, interest paid on short-term debt and repayments (repurchases and charges) to the
IMF. Debt is considered as a percent of exports of goods and services, which includes income and workers' remittances. Coverage: Data are available for about 77 USAID countries. Data Quality: See data quality comments to the Present value of debt, percent of GNI regarding quality of debt data reported. CAS Code # 24P3
Exports Growth, Goods and Services
Source: Latest country data obtained from national data sources or IMF Article IV consultation reports: www.imf.org/external/np/sec/aiv/index.htm. Benchmarking data from World Development Indicators, most recent publication, series NE.EXP.GNFS.KD.ZG, based on World Bank national accounts data, and OECD National Accounts data files. Definitions: Annual growth rate of exports of goods and services based on constant local currency units. Exports include the value of merchandise, freight, insurance, transport, travel, royalties, license fees, and other services, such as communication, construction, financial, information, business, personal, and government services. They exclude labor and property income (formerly called factor services), as well as transfer payments. Coverage: Data are available for about 81 USAID countries. CAS Code # 24P4
Foreign Direct Investment, Percentage of GDP
Source: Latest country data obtained from national data sources or IMF Article IV consultation reports: www.imf.org/external/ np/sec/aiv/index.htm. Benchmarking data from World Development Indicators, most recent publication, series BX.KLT.DINV.DT.GD.ZS, based on IMF, International Financial Statistics and Balance of Payments databases, World Bank, Global Development Finance, and World Bank and OECD GDP estimates. Definition: Foreign direct investment is the net inflow of investment to acquire a lasting management interest (10 percent or more of voting stock) in an enterprise operating in an economy other than that of the investor. It is the sum of equity capital, reinvestment of earnings, other long-term capital, and short-term capital as shown in the balance of payments. This series shows net inflows in the reporting economy. Coverage: Data are available for about 82 USAID countries. CAS Code #24P5
Gross International Reserves, Months of Imports
Source: Latest country data obtained from national data sources or IMF Article IV consultation reports: www.imf.org/external/np/sec/aiv/index.htm. Benchmarking data from World Development Indicators, most recent publication, series FI.RES.TOTL.MO. Definition: Gross international reserves comprise holdings of monetary gold, special drawing rights (SDRs), the reserve position of members in the IMF, and holdings of foreign exchange under the control of monetary authorities expressed in terms of the number of months of imports of goods and services. Coverage: Data are available for about 77 USAID countries. CAS Code # 24P6

T E C H N I C A L N O T E S 29
Gross Private Capital Inflows, Percentage of GDP
Source: Latest country data obtained from national data sources or IMF Article IV consultation reports: www.imf.org/external/ np/sec/aiv/index.htm Benchmarking data derived from the International Financial Statistics (sum of lines 78BED and 78BGD, divided by GDP). Definition: Net private capital inflows are the sum of the direct and portfolio investment inflows recorded in the balance-of-payments financial account. The indicator is calculated as a ratio to GDP in U.S. dollars. Coverage: Information on coverage is not easily accessible. Data Quality: Capital flows are converted to U.S. dollars at the IMF’s average official exchange rate for the year shown. CAS Code #24P7
Present Value of Debt, Percentage of GNI
Source: World Development Indicators, most recent publication series DT.DOD.PVLX.GN.ZS, based on Global Development Finance data. Definition: Present value of debt is the sum of short-term external debt plus the discounted sum of total debt service payments due on public, publicly guaranteed, and private non-guaranteed long-term external debt over the life of existing loans. The indicator measures the value of debt relative to the GNI. Coverage: Data are available for about 80 USAID countries. Data Quality: The coverage and quality of debt data vary widely across countries because of the wide spectrum of debt instruments, the unwillingness of governments to provide information, and a lack of capacity in reporting. Discrepancies are significant when exchange rate fluctuations, debt cancellations, and rescheduling occur. CAS Code # 24P8
Remittances Receipts, Percentage of Exports
Source: Latest country data obtained from national data sources or IMF Article IV consultation reports: www.imf.org/external/ np/sec/aiv/index.htm. Benchmarking data are obtained from World Development Indicators, most recent publication. The figure is constructed by dividing workers’ remittances (receipts), series BX.TRF.PWKR.CD, by exports of goods and services, series BX.GSR.GNFS.CD. Definition: Workers’ remittances are current transfers by migrants who are employed or intend to remain employed for more than a year in another economy in which they are considered residents. The indicator is the ratio of remittances to exports. Coverage: Data are available for about 74 USAID countries. CAS Code # 24P9
Trade, Percentage of GDP
Source: Latest country data obtained from national data sources or IMF Article IV consultation reports: www.imf.org/external/ np/sec/aiv/index.htm. Benchmarking data from World Development Indicators, most recent publication, series NE.TRD.GNFS.ZS. Definition: The sum of exports and imports of goods and services divided by the value of GDP, all expressed in current U.S. dollars. Coverage: Data available for about 84 USAID countries. CAS Code # 24P10
Trade in Services, Percentage of GDP
Source: Latest country data obtained from national data sources or IMF Article IV consultation reports: www.imf.org/external/ np/sec/aiv/index.htm. Benchmarking data from the World Development Indicators, most recent publication, series BG.GSR.NFSV.GD.ZS. Definition: Trade in services is the sum of service exports and imports divided by the value of GDP, all in current U.S. dollars. Coverage: Data available for about 80 USAID countries. CAS Code # 24P11
Concentration of Exports
Source: Constructed with ITC COMTRADE data by aggregating the value for the top three export product groups (SITC Rev.3) and dividing by total exports. Raw data: http://www.intracen.org/tradstat/sitc3-3d/indexre.htm Definition: The percentage of a country’s total merchandise exports consisting of the top three products, disaggregated at the SITC (Rev. 3) 3-digit level. Coverage: Available for about 74 USAID countries. Data Quality: Smuggling is a serious problem in some countries. For countries that do not report trade data to the United Nations, ITC uses partner country data. There are a number of shortcomings with this approach: ITC does not cover trade with other nonreporting countries; transshipments may hide the actual source of supply; and reporting standards include transport cost and insurance in measuring exports but exclude these items when measuring imports. CAS Code # 24S1
Inward FDI Potential Index
Source: UNCTAD. Indicator is available at http://www.unctad.org/Templates/WebFlyer.asp?intItemID=2472&lang=1. Definition: Inward FDI Potential Index measures an economy’s attractiveness to foreign investors, capturing factors (apart from market size) that are expected to have an impact. The index ranges in value from 0 (for very poor performance) to 1 (for excellent performance). It is an unweighted average of the scores of 12 normalized economic and social variables. Coverage: Data are available for about 77 USAID countries. CAS Code # 24S2
Net Barter Terms of Trade
Source: World Development Indicators, most recent publication, series TT.PRI.MRCH.XD.WD Definition: Net barter terms of trade are calculated as the ratio of the export price index to the corresponding import price index measured relative to the base year 2000. Coverage: Data are available for about 51 USAID countries. CAS Code # 24S3
Real Effective Exchange Rate (REER)
Source: IMF Article IV consultation reports: www.imf.org/external/ np/sec/aiv/index.htm; Definition: The REER is an index number with base 1995=100, which measures the value of a currency against a weighted average of foreign currencies. It is calculated as the nominal effective exchange rate divided by a price deflator or index of costs. The IMF defines the REER so that an increase in the value represents a real appreciation of the home currency, and a decrease represents a real depreciation.

30 T E C H N I C A L N O T E S
Coverage: Information on coverage is not easily accessible. Data Quality: Changes in real effective exchange rates should be interpreted with caution. For many countries the weights from 1990 onward take into account trade in 1988-90, and an index of relative changes in consumer prices is used as the deflator. CAS Code # 24S4
Structure of Merchandise Exports
Source: World Development Indicators, most recent publication. Exports from five categories are used: Food exports series TX.VAL.FOOD.ZS.UN; Agricultural raw materials exports series TX.VAL.AGRI.ZS.UN; Manufactures exports series TX.VAL.MANF.ZS.UN; Ores and metals exports series TX.VAL.MMTL.ZS.UN; and Fuel exports series TX.VAL.FUEL.ZS.UN. Definition: This indicator reflects the composition of merchandise exports by major commodity groups—food, agricultural raw materials, fuels, ores and metals, and manufactures. Coverage: Data are available for about 78 USAID countries. Data Quality: The classification of commodity groups follows the Standard International Trade Classification (SITC) revision 1, but most countries report using later revisions of the SITC. Tables are used to convert data reported in one system to another and this may introduce errors of classification. Shares may not sum to 100 percent because of unclassified trade. CAS Code # 24S5
Trade Policy Index
Source: Index of Economic Freedom, Heritage Foundation: http://www.heritage.org/research/features/index/downloads.cfm. The Trade Policy Score (index) is one component of the Index of Economic Freedom. Definition: The index measures the degree to which government hinders the free flow of foreign commerce, based on a country’s weighted average tariff rate (weighted by imports from the country’s trading partners), with adjustments for non-tariff barriers and corruption in the customs service. The countries are ranked on a 0-to-100 scale, with a higher score representing greater freedom (low barriers to trade)—a switch from the 5-1 ranking of previous Indexes (in which lower numbers denoted greater freedom). Coverage: Data are available for about 83 USAID countries. Data Quality: The index is subjective and at times inconsistent in its treatment of tariffs. CAS Code # 24S6
Ease of Trading Across Borders Ranking
Source: World Bank, Doing Business, Trading Across Borders category: http://www.doingbusiness.org/ ExploreTopics/TradingAcrossBorders/ Definitions: The 175 economies covered by the Doing Business report are ranked on the ease with which one may import into and export out of the economy. The ranking is based on a simple average of the economy’s ranking on each of the composite indicators for Trading Across Borders: number of documents to import and export, cost to import and export, and time to import and export. Coverage: Data are available for nearly all USAID countries. CAS Code # 24S7
ECONOMIC INFRASTRUCTURE
Internet Users per 1,000 people
Source: World Development Indicators, most recent publication series IT.NET.USER.P3, derived from the International Telecommunication Union database. Definition: Indicator quantifies the number of Internet users, defined as those with access to the worldwide network, per 1,000 people. Coverage: Data are available for about 88 USAID countries. CAS Code # 25P1
Overall Infrastructure Quality Index
Source: Global Competitiveness Report 2006–2007, World Economic Forum. The indicator can be found in the Data Tables, Section V. General Infrastructure; 5.01. Definition: The index measures executives’ perceptions of general infrastructure in their respective country. Executives grade, on a scale from 1 to 7, whether general infrastructure in their country is poorly developed (1) or among the best in the world (7). Coverage: Data are available for about 52 USAID countries. Data Quality: Comparisons between countries are difficult because the data are based on executives’ perceptions. CAS Code # 25P2
Telephone Density, Fixed Line and Mobile
Source: World Development Indicators, most recent publication series IT.TEL.TOTL.P3, derived from the International Telecommunication Union database.. Definition: The indicator is the sum of subscribers to telephone mainlines and mobile phones per 1,000 people. Fixed lines represent telephone mainlines connected to the public switched telephone network. Mobile phone subscribers refer to users of cellular-based technology with access to the public switched telephone network. Coverage: Data are available for about 88 USAID countries. CAS Code #25P3
Quality of infrastructure—Railroads, Ports, Air Transport and Electricity
Source: Global Competitiveness Report 2006-2007, World Economic Forum. The indicators can be found in the Data Tables, Section V. General Infrastructure; 5.02, 5.03, 5.04, and 5.05 for Railroad, Port; Air Transport, and Electricity, respectively. Definitions: The index measures executives’ perceptions of general infrastructure in their respective country. Executives grade, on a scale from 1 to 7, whether railroads, ports, air transport, and electricity are poorly developed (1) or among the best in the world (7). Coverage: Data are available for about 52 USAID countries. Data Quality: Comparisons between countries are difficult because the data are based on executive perceptions. CAS Code #25S1
Roads, paved (% total)
Source: World Development Indicators, most recent publication series IS.ROD.PAVE.ZS Definitions: Paved roads are roads surfaced with crushed stone (macadam) and hydrocarbon binder or bituminized agents, with concrete, or with cobblestones. Coverage: Data are available for nearly all USAID countries.

T E C H N I C A L N O T E S 31
CAS Code #25S2
SCIENCE AND TECHNOLOGY
Expenditure in Research and Development, Percentage of GDP
Source: World Development Indicators, most recent publication, series GB.XPD.RSDV.GD.ZS, based on data from the UNESCO Institute of Statistics. Definition: Expenditures for research and development are current and capital expenditures (both public and private) on creative, systematic activity that increases the stock of knowledge. Included are fundamental and applied research and experimental development work leading to new devices, products, or processes. Coverage: Data are available for about 26 USAID countries. CAS Code #26P1
FDI Technology Transfer Index
Source: Global Competitiveness Report 2006-2007, World Economic Forum. The indicator can be found in the Data Tables, Section III. Technology: Innovation and Diffusion; 3.04. Definition: The index measures executives’ perceptions of FDI as a source of new technology for the country. Executives grade, on a scale from 1 to 7, whether foreign direct investment in their country brings little new technology (1), or is an important source of new technology (7). Coverage: Data are available for about 52 USAID countries. Data Quality: Comparisons between countries are difficult because the data are based on executive perceptions. CAS Code # 26P2
Availability of Scientists and Engineers Index
Source: Global Competitiveness Report 2006-2007, World Economic Forum. The indicators can be found in the Data Tables, Section IX. Innovation; 9.05. Definitions: The index measures executives’ perceptions of the availability of scientists and engineers in their respective country. Executives grade, on a scale from 1 to 7, whether scientists and engineers in their country are nonexistent (1) or rare, or widely available (7). Coverage: Data are available for about 52 USAID countries. Data Quality: Comparisons between countries are difficult because the data are based on executive perceptions. CAS Code #26P3
Science and Technology Journal Articles, per Million People
Source: World Development Indicators, most recent publication, series IP.JRN.ARTC.SC Definitions: The indicator refers to published scientific and engineering articles in physics, biology, chemistry, mathematics, clinical medicine, biomedical research, engineering and technology, and earth and space sciences per one million population. Coverage: Data are available for about 82 USAID countries. CAS Code #26P4
IPR Protection Index
Source: Global Competitiveness Report 2006-2007, World Economic Forum. The indicators can be found in the Data Tables, Section IV. Innovation; 9.07. Definitions: The index measures executives’ perceptions of the availability of the quality of intellectual property rights protection in their respective country. The scale ranges from 1(for poorly enforced) to 7 (among the best in the world). Coverage: Data are available for about 52 USAID countries. Data Quality: Comparisons between countries are difficult because the data are based on executive perceptions. CAS Code #26P5
HEALTH
HIV Prevalence
Source: UNAIDS for most recent country data: http://data.unaids.org/pub/GlobalReport/2006/2006_GR_ANN2_en.pdf. World Development Indicators, most recent publication for benchmark data, series SH.DYN.AIDS.ZS. Definition: Percentage of people ages 15–49 who are infected with HIV. Coverage: Data are available for about 79 USAID countries. Data Quality: UNAIDS/WHO estimates are based on all available data, including surveys of pregnant women, population-based surveys, household surveys conducted by Kenya, Mali, Zambia, and Zimbabwe, and other surveillance information. CAS Code # 31P1
Life Expectancy at Birth
Source: World Development Indicators, most recent publication, (SP.DYN.LE00.IN) Definition: Life expectancy at birth indicates the number of years a newborn infant would live on average if prevailing patterns of mortality at the time of his or her birth were to stay the same throughout his or her life. Coverage: Data are available for about 88 USAID countries. Data Quality: Life expectancy at birth is estimated on the basis of vital registration or the most recent census/survey. Extrapolations may not be reliable for monitoring changes in health status or for comparative analytical work. CAS Code # 31P2
Maternal Mortality Rate
Source: UN Millennium Indicators Database, http://millenniumindicators.un.org/unsd/mdg/Data.aspx based on WHO, UNICEF and UNFPA data. Definition: The indicator is the number of women who die during pregnancy and childbirth, per 100,000 live births. Coverage: Data are available for about 87 USAID countries. Data Quality: Household surveys attempt to measure maternal mortality by asking respondents about survival of sisters. The estimates pertain to 12 years or so before the survey, making them unsuitable for monitoring recent changes. CAS Code # 31P3
Access to Improved Sanitation
Source: World Development Indicators, most recent publication, series SH.STA.ACSN.

32 T E C H N I C A L N O T E S
Definition: The indicator is the percentage of population with at least adequate excreta disposal facilities (private or shared, but not public) that can effectively prevent human, animal, and insect contact with excreta. Coverage: Data are available for about 82 USAID countries. CAS Code #31S1
Access to Improved Water Source
Source: World Development Indicators, most recent publication series SH.H2O.SAFE.ZS Definition: The indicator is the percentage of the population with reasonable access to an adequate amount of water from an improved source, such as a household connection, public standpipe, borehole, protected well or spring, or rain water collection. Coverage: Data are available for about 83 USAID countries. Data Quality: Access to drinking water from an improved source does not ensure that the water is adequate or safe. CAS Code # 31S2
Births Attended by Skilled Health Personnel
Source: World Development Indicators, most recent publication, series SH.STA.BRTC.ZS. Definition: The indicator is the percentage of deliveries attended by personnel trained to give the necessary supervision, care, and advice to women during pregnancy, labor, and the postpartum period, to conduct interviews on their own, and to care for newborns. Coverage: Data are available for about 62 USAID countries. Data Quality: Data may not reflect improvements in maternal health; maternal deaths are underreported; and rates of maternal mortality are difficult to measure. CAS Code # 31S3
Child Immunization Rate
Source: World Development Indicators, most recent publication, estimated by averaging two series: Immunization, DPT (% of children ages 12–23 months) (SH.IMM.IDPT) and Immunization, measles (% of children ages 12–23 months) (SH.IMM.MEAS). Definition: Percentage of children under one year of age receiving vaccination coverage for four diseases: measles and diphtheria, pertussis (whopping cough), and tetanus (DDPT). Coverage: Data are available for about 88 USAID countries. CAS Code #31S4
Prevalence of Child Malnutrition—Weight for Age
Source: World Development Indicators, most recent publication, series SH.STA.MALN.ZS. Definition: The indicator is based on the percentage of children under age five whose weight for age is more than minus two standard deviations below the median for the international reference population ages 0–59 months. Coverage: Data are available for about 55 USAID countries. CAS Code # 31S5
Public Health Expenditure, Percentage of GDP
Source: Latest data for host country is obtained from the MCC: http://www.mcc.gov/selection/scorecards/2007/ index.php. International benchmarking data from World Development Indicators, most recent publication (SH.XPD.PUBL.ZS),
based on World Health Organization, World Health Report, and updates and from the OECD, supplemented by World Bank poverty assessments and country and sector studies. Definition: Public health expenditure consists of recurrent and capital spending from government (central and local) budgets, external borrowings and grants (including donations from international agencies and nongovernmental organizations), and social (or compulsory) health insurance funds. Coverage: Data are available for about 88 USAID countries. CAS Code #31S6
EDUCATION
Net Primary Enrollment Rate—Female, Male and Total
Source: UNESCO Institute for Statistics, http://stats.uis.unesco.org/ReportFolders/reportfolders.aspx Definition: The indicator measures the proportion of the population of the official age for primary, secondary, or tertiary education according to national regulations who are enrolled in primary schools. Primary education provides children with basic reading, writing, and mathematics skills along with an elementary understanding of such subjects as history, geography, natural science, social science, art, and music. Coverage: Data are available for about 80 USAID countries. Data Quality: Enrollment rates are based on data collected during annual school surveys, which are typically conducted at the beginning of the school year, and do not reflect actual rates of attendance during the school year. In addition, school administrators may report exaggerated enrollments because teachers often are paid proportionally to the number of pupils enrolled. The indicator does not measure the quality of the education provided. CAS Code # 32P1
Persistence to Grade 5—Female, Male, and Total
Source: World Development Indicators, most recent publication series SE.PRM.PRS5.FE.ZS (female); SE.PRM.PRS5.MA.ZS (male); and SE.PRM.PRS5.ZS (total). Definition: The indicator is an estimate of the proportion of the population entering primary school who reach grade 5, for female, male, and total students. Coverage: Data are available for about 48 USAID countries. CAS Code # 32P2
Youth Literacy Rate—Female, Male, and Total
Source: World Development Indicators, most recent publication, series SE.ADT.1524.LT.ZS. Definition: The indicator is an estimate of the percent of people ages 15–24 who can, with understanding, read and write a short, simple statement on their everyday life. Coverage: Data are available for about 67 USAID countries. Data Quality: Statistics are out of date by two to three years. CAS Code #32P3
Net Secondary Enrollment Rate, Total
Source: World Development Indicators, most recent publication, series SE.SEC.NENR. Based on data from the United Nations Educational, Scientific, and Cultural Organization (UNESCO) Institute for Statistics.

T E C H N I C A L N O T E S 33
Definitions: Net enrollment ratio is the ratio of children of official school age based on the International Standard Classification of Education 1997 who are enrolled in school to the population of the corresponding official school age. Secondary education completes the provision of basic education that began at the primary level and aims at laying the foundations for lifelong learning and human development by offering more subject- or skill-oriented instruction using more specialized teachers. Coverage: Not available for draft. Data Quality: Break in series between 1997 and 1998 due to change from International Standard Classification of Education (ISCED) 76 to ISCED97. Recent data are provisional. CAS Code #32P4
Gross Tertiary Enrollment Rate, Total
Source: World Development Indicators, most recent publication, series SE.TER.ENRR. Based on data from the UNESCO Institute for Statistics. Definitions: Gross enrollment ratio is the ratio of total enrollment, regardless of age, to the population of the age group that officially corresponds to the level of education shown. Tertiary education, whether or not to an advanced research qualification, normally requires, as a minimum condition of admission, the successful completion of education at the secondary level. Coverage: Not available for draft. Data Quality: Break in series between 1997 and 1998 due to change from International Standard Classification of Education (ISCED) 76 to ISCED97. Recent data are provisional. CAS Code #32P5
Expenditure on Primary Education, Percentage of GDP
Source: Millennium Challenge Corporation: http://www.mcc.gov/ selection/scorecards/2007/index.php. Definition: The indicator is the total expenditures on education by all levels of government, as a percent of GDP. Coverage: Data are available for about 58 USAID countries. Data Quality: The MCC obtains the data from national sources through U.S. embassies. CAS Code #32S1
Educational Expenditure per Student, Percentage of GDP per capita—Primary, Secondary and Tertiary
Source: World Development Indicators, most recent publication series SE.XPD.PRIM.PC.ZS (primary); SE.XPD.SECO.PC.ZS (secondary); and SE.XPD.TERT.PC.ZS (tertiary). Definition: Public expenditure per student (primary, secondary or tertiary) is defined as the public current expenditure on education divided by the total number of students, by level, as a percentage of GDP per capita. Coverage: Data are available for about 50, 47, and 45 USAID countries (for primary, secondary, and tertiary expenditure, respectively). Data Quality: Education statistics should be interpreted with caution because the data are out of date by 2 or 3 years; also, the statistics reflects solely public spending, generally excluding spending by religious schools, which play a significant role in many developing countries. Data for some countries and for some years refer to spending by the ministry of education only. CAS Code # 32S2
Pupil-teacher Ratio, Primary School
Source: World Development Indicators, most recent publication series SE.PRM.ENRL.TC.ZS. Definition: Primary school pupil-teacher ratio is the number of pupils enrolled in primary school divided by the number of primary school teachers (regardless of their teaching assignment). Coverage: Data are available for about 76 USAID countries. Data Quality: The indicator does not take into account differences in teachers’ academic qualifications, pedagogical training, professional experience and status, teaching methods, teaching materials and variations in classroom conditions – all factors that could also affect the quality of teaching/learning and pupil performance. CAS Code # 32S3
EMPLOYMENT AND WORKFORCE
Labor Force Participation Rate
Source: Derived from World Development Indicators, but the precise computation differs depending on whether a particular country study uses the 2004 or 2005 and years subsequent WDI. To calculate the total labor force participation rate using WDI 2004: the numerator is Labor force, total (SL.TLF.TOTL.IN), and the denominator is Population ages 15-64, total (SP.POP.1564.TO). Using WDI 2005 and subsequent years, the denominator is calculated as the total population (SP.POP.TOTL) times the percentage of the population in the age group 15-64 (SP.POP.1564.IN.ZS). Definition: The percentage of the working age population that is in the labor force. The labor force comprises people who meet the International Labor Organization definition of the economically active population: all people who supply labor for the production of goods and services during a specified period. It includes both the employed and the unemployed. Coverage: Data are available for about 88 USAID countries. CAS Code #33P1
Rigidity of Employment Index
Source: World Bank, Doing Business in 2007, Employing workers category: http://www.doingbusiness.org/ExploreTopics/EmployingWorkers/ Definition: Rigidity of employment index is a measure of labor market rigidity constructed as the average of the Difficulty of Hiring index, Rigidity of Hours index and Difficulty of Firing index. Index ranges in value from 0 (minimum rigidity) to 100 (maximum rigidity). Coverage: Data are available for nearly all USAID countries. Data Quality: Subindices are compiled by the World Bank from survey responses to in-country specialists. CAS Code # 33P2
Size and Growth of the Labor Force
Source: Size of labor force from World Development Indicators (SL.TLF.TOTL.IN); annual percentage change calculated from size data. Definition: The indicator measures the size of the labor supply, and its annual percent change. Labor force is made up of people who meet the International Labor Organization definition of the economically active population: all people who are able to supply labor for the production of goods and

34 T E C H N I C A L N O T E S
services during a specified period, including both the employed and the unemployed. Although national practices vary in the treatment of groups such as the armed forces and seasonal or part-time workers, in general, the labor force includes the armed forces, the unemployed, and first-time job-seekers, but excludes homemakers and other unpaid caregivers and workers in the informal sector. Coverage: Data are available for about 88 USAID countries. CAS Code #33P3
Unemployment Rate
Source: World Development Indicators, most recent publication series SL.UEM.TOTL.ZS. Definition: The unemployment rate refers to the share of the labor force that is without work but available for and seeking employment. For this purpose, informal sector workers and own-account workers (including subsistence farmers) are counted as employed. Coverage: Data are available for about 50 USAID countries. Data Quality: Definitions of labor force and unemployment differ by country, making international comparisons inaccurate. CAS Code # 33P4
Economically Active Children, Percentage Children Ages 7-14
Source: World Development Indicators, most recent publication series SL.TLF.0714.ZS. Derived from the Understanding Children's Work project based on data from ILO, UNICEF, and the World Bank. Definitions: Economically active children refer to children involved in economic activity for at least one hour in the reference week of the survey. CAS Code # 33P5
Firing Costs, Weeks of Wages
Source: World Bank, Doing Business, Employing Workers Category: http://www.doingbusiness.org/ MethodologySurveys/EmployingWorkers.aspx. Definitions: The firing cost indicator measures the cost of advance notice requirements, severance payments, and penalties due when terminating a redundant worker, expressed in weekly wages. One month is recorded as 4 and 1/3 weeks. Coverage: Data available for nearly all USAID countries. CAS Code # 33S1
AGRICULTURE
Agriculture Value Added per Worker
Source: World Development Indicators, most recent publication series EA.PRD.AGRI.KD, derived from World Bank national accounts files and Food and Agriculture Organization, Production Yearbook and data files. Definition: Agriculture value added per worker is a basic measure of labor productivity in agriculture. Value added in agriculture measures the output of the agricultural sector (ISIC divisions 1–5)—forestry, hunting, fishing, cultivation of crops, and livestock production—less the value of intermediate inputs. Data are in constant 1995 U.S. dollars. Coverage: Data are available for about 80 USAID countries. CAS Code # 34P1
Cereal Yield
Source: World Development Indicators, most recent publication series AG.YLD.CREL.KG based on Food and Agriculture Organization Production Yearbook and data files. Definition: Cereal yield, measured as kilograms per hectare of harvested land, includes wheat, rice, maize, barley, oats, rye, millet, sorghum, buckwheat, and mixed grains. Production data on cereals relate to crops harvested for dry grain only. Coverage: Data are available for about 84 USAID countries. Data Quality: Data on cereal yield may be affected by a variety of reporting and timing differences. The FAO allocates production data to the calendar year in which the bulk of the harvest took place. But most of a crop harvested near the end of a year will be used in the following year. Cereal crops harvested for hay or harvested green for food, feed, or silage, and those used for grazing, are generally excluded. But millet and sorghum, which are grown as feed for livestock and poultry in Europe and North America, are used as food in Africa, Asia, and countries of the former Soviet Union. So some cereal crops are excluded from the data for some countries and included elsewhere, depending on their use. CAS Code # 34P2
Growth in Agricultural Value-Added
Source: The latest country data are taken from national data sources or from IMF Article IV consultation reports: www.imf.org/ external/np/sec/aiv/index.htm. The benchmarking data are from World Development Indicators, most recent publication series NV.AGR.TOTL.KD.ZG Definition: The indicator measures the annual growth rate for agricultural value added, in constant local currency. Regional group aggregates are based on constant 2000 U.S. dollars. Agriculture corresponds to ISIC divisions 1–5 and includes forestry, hunting, and fishing, as well as cultivation of crops and livestock production. Value added is the net output of a sector after all outputs are added up and intermediate inputs are subtracted. It is calculated without deductions for depreciation of fabricated assets or depletion and degradation of natural resources. Coverage: Data are available for about 84 USAID countries. CAS Code # 34P3
Agricultural Policy Costs Index
Source: Global Competitiveness Report 2006-2007, World Economic Forum. The indicator can be found in the Data Tables, Section II. Macroeconomic Environment; 2.20. Definition: The index measures executives’ perceptions of agricultural policy costs in their respective country. Executives grade, on a scale from 1 to 7, whether the cost of agricultural policy in a given country is excessively burdensome (1), or balances all economic agents’ interests (7). Coverage: Data are available for about 52 USAID countries. Data Quality: Comparisons between countries are difficult because the data are based on executives’ perceptions. CAS Code # 34S1
Crop Production Index
Source: World Development Indicators, most recent publication series AG.PRD.CROP.XD, based on FAO statistics. Definition: Crop production index shows agricultural production for each year relative to the period 1999–2001 =

T E C H N I C A L N O T E S 35
100. The index includes production of all crops except fodder crops. Regional and income group aggregates for the FAO’s production indices are calculated from the underlying values in international dollars, normalized to the base period. Coverage: Data are available for about 85 USAID countries. Data Quality: Regional and income group aggregates for the FAO’s production indices are calculated from the underlying values in international dollars, normalized to the base period 1999–2001. The FAO obtains data from official and semiofficial reports of crop yields, area under production, and livestock numbers. If data are not available, the FAO makes estimates. To ease cross-country comparisons, the FAO uses international commodity prices to value production expressed in international dollars (equivalent in purchasing power to the U.S. dollar). This method assigns a single price to each commodity so that, for example, one metric ton of wheat has the same price regardless of where it was produced. The use of international prices eliminates fluctuations in the value of output due to transitory movements of nominal exchange rates unrelated to the purchasing power of the domestic currency. Coverage: Data are available for about 85 USAID countries. CAS Code # 34S2
Livestock Production Index
Source: World Development Indicators, most recent publication series AG.PRD.LVSK.XD, based on FAO. Definition: Livestock production index shows livestock production for each year relative to the base period 1999–2001=100. The index includes meat and milk from all sources, dairy products such as cheese, and eggs, honey, raw silk, wool, and hides and skins. Coverage: Data are available for about 85 USAID countries. Data Quality: See comments on the Crop Production Index. CAS Code # 34S3
Agriculture Export Growth
Source: World Development Indicators, most recent publication series TX.VAL.AGRI.ZS.UNs, Agricultural raw materials exports (% of merchandise exports), based on World Bank staff estimates from the COMTRADE database maintained by the United Nations Statistics Division; and series TX.VAL.MRCH.CD.WT, Merchandise exports (current US$), based on data from the World Trade Organization. Definitions: Agricultural raw materials comprise SITC section 2 (crude materials except fuels), excluding divisions 22, 27 (crude fertilizers and minerals excluding coal, petroleum, and precious stones), and 28 (metalliferous ores and scrap). Merchandise exports show the f.o.b. value of goods provided to the rest of the world valued in U.S. dollars. Data are in current U.S. dollars. The indicator is calculated by multiplying agricultural raw materials by merchandise exports. The annual growth rate is then calculated from the resulting series. Coverage: Not available for draft. CAS Code # 34S4