Embed Size (px)
Citation preview

9/21/19
1
Monday 23rd September 2019
Supported by the Australian Breakfast Cereal Manufacturers Forum (ABCMF)
Gut Health and GrainsDr Joanna McMillan
Body Weight and BreakfastDr Flavia Fayet-Moore
Dr Joanna McMillanAPD & Nutrition Scientist

9/21/19
2
INTRODUCTION
• The gut microbiome is hot topic & emerging evidence links to a human physical & mental health• Whole grains and cereal fibre associated with ↓risk chronic diseases
including some cancers, type 2 diabetes, obesity & CVD – why?• This report uncovers the evidence and explores the involvement of
the microbiome• Explores the role of breakfast cereals, being a major source of
wholegrains and cereal fibre for Australians• What advice should we be giving to boost microbiome health?
ANATOMY OF A GRAIN

9/21/19
3
DEFINITIONS• Whole grain: The intact grain or the dehulled, ground,
milled, cracked or flaked grain where the constituents –endosperm, germ and bran – are present in such proportions that represent the typical ratio of those fractions occurring in the whole cereal and includes wholemeal.
• Cereal fibre: These are specific fibres found in whole grains/cereals. They are almost all located in the outer layers of the grain that are collectively called the bran. The bran can be removed from the grain and added to food products, as part of the manufacturing process, to increase the fibre of foods such as breakfast cereals and breads. E.g. Wheat bran and oat bran
HEALTH EFFECTS OF DIETARY RISKS IN 195 COUNTRIES
Lancet 2019;393:1958-72

9/21/19
4
HEALTH EFFECTS OF DIETARY RISKS IN 195 COUNTRIES
Lancet 2019;393:1958-72
DALY = disability-adjusted life year
HOW MUCH ARE AUSTRALIANS EATING?
• Not enough!• 70% fail to meet the recommended whole grain intake of 48g/d –
median intake 21g/d• Children recommended 32-40g/d – median intake 16g/d• For cereal fibre median intake for adults 6.4g and
children/adolescents 6.2g

9/21/19
5
FIBRES PRESENT IN WHOLE GRAINS
• Non-starch polysaccharides (NSP) – arabinoxylan, β-glucan, cellulose• Resistant starch (RS)• Oligosaccharides – fructans, fructo-oligosaccharides (FOS), galacto-
oligosaccharides (GOS)• Lignin & lignans

9/21/19
6
PHYTOCHEMICALS IN WHOLE GRAINS
• Polyphenols – benzoic & cinnamic acids, esp. ferulic acid• Plant sterols• Tocols (vit E – major fat soluble antioxidants)• Betaine (osmolyte to protect cells under stress & methyl donor,
participates in the methionine cycle)

9/21/19
7
THE MICROBIOME
UNIQUE TO THE INDIVIDUAL –ESTABLISHED IN EARLY LIFE AND
SHAPED BY GENETICS, ENVIRONMENT, DIET & LIFESTYLE
DIET IS RESPONSIBLE FOR AROUND 57% OF VARIATION – HUGE
POTENTIAL THEREFORE FOR USING DIET TO INSTIGATE BENEFICIAL
CHANGES
FUNCTIONAL AND COMPOSITIONAL CHANGES IN MICROBIOME ASSOCIATED WITH TYPE 2
DIABETES, OVERWEIGHT & OBESITY, CVD, INFLAMMATORY BOWEL
DISEASE, AUTOIMMUNE DISEASES AND INFLAMMATORY SKIN
DISEASES SUCH AS PSORIASIS
INCREASING INTEREST ON THE GUT-BRAIN LINKS INFLUENCING
DEPRESSION, ANXIETY & LONG TERM BRAIN HEALTH
WHAT DOES THE
MICROBIOME DO?
• Helps to digest food components our own enzymes can’t break down• Produces some micronutrients • Keeps colonic cells healthy & maintains an
intact, healthy mucosal layer• Produces metabolites that travel throughout
the body influencing physical & mental health • Intimately involved with immune system –
‘trains’ it in early life

9/21/19
8
ROLE OF DIFFERENT FIBRES
• MACs = microbiota-accessible carbohydrates –fermentable fibres• RS and most soluble fibres are fermentable• Some insoluble fibres are fermentable • Insoluble fibres importantly carry MACs through
length of colon ensuring fermentation takes place right to the distal sections where most cancers occur• Insoluble fibres have the highest phenolic content
and the greatest antioxidant capacity
} Some prebiotic activity
GRAIN PHYTOCHEMICALS & THE MICROBIOME
90% of the phenolics in grains are bound to fibres in the bran layer
Released by the microbiota
Modulate microbiota composition, boosting the growth of beneficial species
Some directly absorbed into bloodstream
Others metabolised into more biologically active and better absorbed metabolites

9/21/19
9
MAJOR PHYTOCHEMICALS
• Ferulic acid – wheat, wheat bran, rye & corn• Released along the length of colon = elevated in the blood for up to 24 hrs giving long
lasting antioxidation protection • Cf ferulic acid from fruits & coffee increase blood levels for only ½-3 hrs
• Avenanthramides – unique to oats • Topically these have anti-itch & anti-inflammatory effects (hence oatmeal bathing
products)• Orally these are released on fermentation & have effects locally within the colon &
systemically once absorbed – reduce inflammation & oxidative stress
THE GUT – GRAIN CONNECTION

9/21/19
10
ROLE OF BREAKFAST CEREALS
• Of the 88% of Australian adults who eat breakfast, almost half have breakfast cereal
• Those who do have healthier diets overall
• 40% of whole grains in Aus diets come from breakfast cereals
• Breakfast cereals & porridge provide 28.8% cereal fibre adults, 21.7% for children
• 70% of breakfast cereals available in Aus are whole grain
BREAKFAST CEREAL & THE MICROBIOME
• 39/42 studies in systematic review found increased microbial diversity and/or abundance with regular cereal fibre consumption • A daily bowl of a high fibre breakfast cereal had positive effect on
microbiome within 3 weeks & benefits observed for at least a year• Whole grain corn, wheat & oat breakfast cereals/granola have been
shown to ↑ Bifidobacterium and/or lactobacilli • Whole grain breakfast cereals shown to increase blood ferulic acid &
reduce inflammatory markers • Variety in whole grains may be key

9/21/19
11
DIETARY RECOMMENDATIONS FOR A HEALTHY GUT
MICROBIOME
• Emphasise plant-rich diet – this can also include animal foods• Diversity of plant foods = diversity of fibres &
phytonutrients = diversity of microbiota• Choose whole grains and foods high in cereal
fibre daily – breakfast cereal, muesli, granola or porridge are convenient, easy & budget friendly breakfast options• Include legumes 2-3 times a week• Daily handful of nuts• Variety of vegies & fruit
drjoanna.com.au
drjoannamcmillan
drjoannamcmillan

9/21/19
1
Why do adults who eat breakfast
cereal have healthier diets &
more favourable weight status ?
A secondary analysis of the 2011-12 National Nutrition and Physical Activity Survey
Flavia Fayet-MoorePhD, MNutrDiet, APD, RNutr, FASLM
23 September 2019
Insert new background image

9/21/19
2
Insert new background image
USING AUSTRALIAN ADULT DATA
Fayet-Moore F et al. Breakfast choice is associated with nutrient, food group and discretionary
intakes in Australian adults at both breakfast and the rest of the day. Nutrients 2019; 11(1).
Not just breakfast
• Rest of the day
Not just nutrients
• Five Food groups & discretionary foods & beverages
Insert new background image
2011-12 NNPAS (n = 9341 adults 19+ years)
METHODS
3 BREAKFAST GROUPS
SKIPPERS NON CEREAL BREAKFAST CEREAL

9/21/19
3
Insert new background image
ANALYSIS
ü Consumer characteristics
ü Weight statusü Types of foods consumed
ü Five Food groups
ü Discretionary intakes
ü Nutrient intakes
Insert new background image
CONSUMER
CHARACTERISTICS

9/21/19
4
Insert new background image
SKIPPERS NON CEREAL BREAKFAST CEREAL
BREAKFAST CEREAL EATERS HAD A DISTINCT SOCIO-DEMOGRAPHIC
PROFILE
12% 47% 41%
More males More females More males
Youngest Oldest
Lowest SES Highest SES
More inactive Less inactive
Insert new background image
DID TYPE OF BREAKFAST INFLUENCE WEIGHT STATUS?
Different superscript (a,b) denotes significant difference (p < 0.001)
BREAKFAST CEREAL CONSUMERS HAD THE LOWEST BMI
& WAIST CIRCUMFERENCE
SKIPPERS
NON-CEREAL
BREAKFAST CEREAL
9/21/19
5
Insert new background image
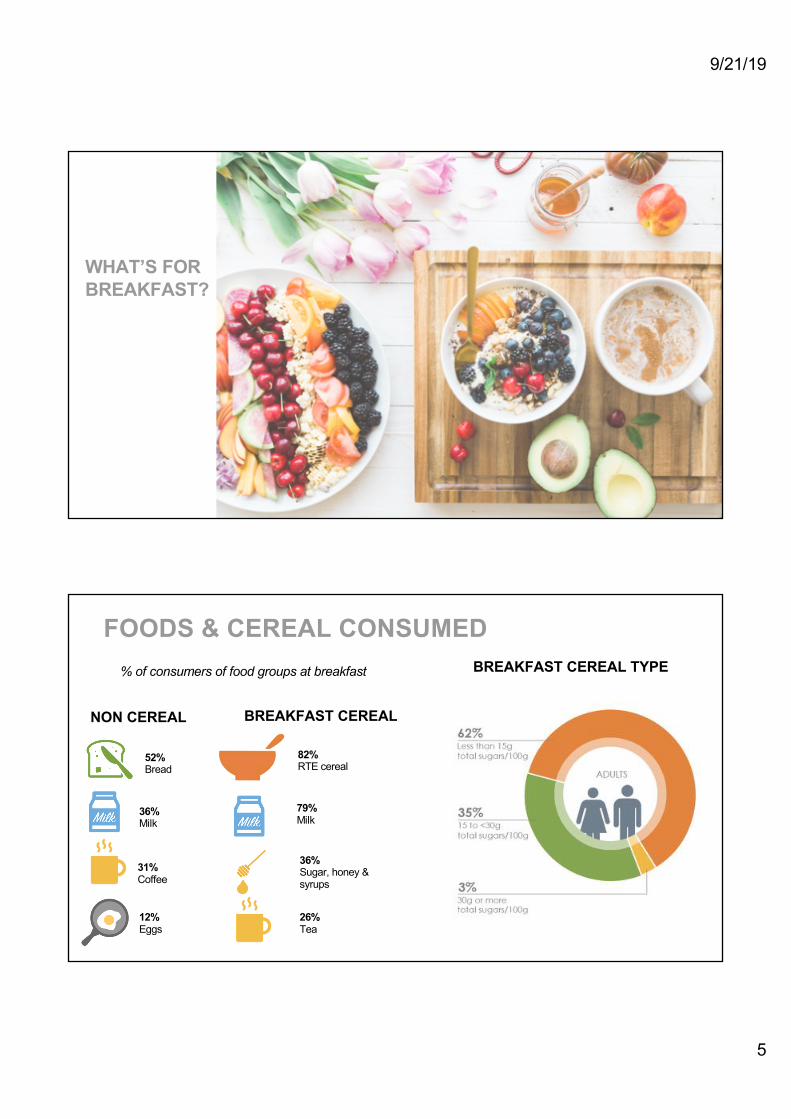
WHAT’S FOR
BREAKFAST?
Insert new background image
FOODS & CEREAL CONSUMED
NON CEREAL
BREAKFAST CEREAL TYPE
52%
Bread
36%
Milk
31%
Coffee
12%
Eggs
% of consumers of food groups at breakfast
BREAKFAST CEREAL
26%
Tea
79%
Milk
82%
RTE cereal
36%
Sugar, honey & syrups

9/21/19
6
Insert new background image
FIVE
FOOD
GROUPS
Insert new background image
BC CONSUMERS ATE MORE DAILY GRAIN, FRUIT, DAIRY,
AND LESS MEAT
Food group
DAILY SERVES
SKIPPERS NON CEREAL BREAKFAST CEREAL
Grain (cereal) 3.8 a 4.4 b 5.2 c
Fruit 1.1 a 1.4 b 1.8 c
Vegetables and
legumes/beans2.7 a 3.1 b 3.2 b
Lean meats and
alternatives2.3 a,b 2.2 a 2.0 b
Dairy and
alternatives1.1 a 1.2 a 1.8 b
Means, Adjusted for age, sex, their interaction, energy intake and BMI group.Different superscript denotes significant difference between groups (p < 0.001)

9/21/19
7
Insert new background image
BC CONSUMERS ATE MORE FRUIT & DAIRY AT BREAKFAST AND
REST OF DAY
REST OF DAY
NON CEREALBREAKFAST
CEREAL
3.1 b 3.1 b
1.1 a 1.3 b
2.8 a 3.2 b
2.0 b 2.0 b
0.9 b 1.0 a
Means, Adjusted for age, sex, their interaction, energy intake and BMI group.
Different superscript a,b denotes significant difference between groups (p < 0.001)
Food Food
group
BREAKFAST
NON CEREALBREAKFAST
CEREAL
Grain (cereal) 1.4 a 2.1 b
Fruit 0.3 a 0.6 b
Vegetables and
legumes/beans0.2 a 0.0 b
Lean meats and
alternatives0.2 a 0.1 b
Dairy and
alternatives0.3 a 0.8 b
Insert new background image
BC CONSUMERS WERE MORE LIKELY TO MEET DAILY TARGETS
OF ALL FOOD GROUPS EXCEPT LEAN MEATS
P<0.001 for all food groups except lean meats (P=0.366)
41%
36%
18%
35%
20%
27%27%
16%
36%
11%
18% 18%
9%
34%
12%
0%
10%
20%
30%
40%
50%
Grain (cereal) Fruit Vegetables andlegumes/beans
Lean meats andalternatives
Dairy andalternatives
break fast cerealconsumers
non-cerea l breakfastconsumers
break fast skippers
SKIPPERS
NON-CEREAL
BREAKFAST CEREAL

9/21/19
8
Insert new background image
DISCRETIONARY
FOODS &
BEVERAGES
Insert new background image
BC CONSUMERS HAD THE LOWEST DISCRETIONARY SERVES
4.5
5.5
6.3
break fast cereal consumers
non-cerea l breakfast consumers
break fast skippers
Discretionary serves
b
c
Different superscript (a,b,c) denotes significant difference (p < 0.001)
a
Means, adjusted for age, sex, their interaction, energy intake and BMI group
SKIPPERS
NON-CEREAL
BREAKFAST CEREAL

9/21/19
9
Insert new background image
BREAKFAST CEREAL CONSUMERS HAD 4 TIMES LESS
DISCRETIONARY ENERGY AT BREAKFAST
Discretionary Foods &
Beverages NON CEREAL BREAKFAST CEREAL P value
Breakfast DF (serves) 0.7 0.2 <0.001
Rest of day DF (serves) 5 4.6 <0.001
Proportion of breakfast energy
that was DF (%)23% 8% <0.001
Adjusted for age, sex, their interaction, BMI group, and energy/energy at breakfast/energy at all other REO
Insert new background image
NUTRIENT
INTAKES
9/21/19
10
Insert new background image
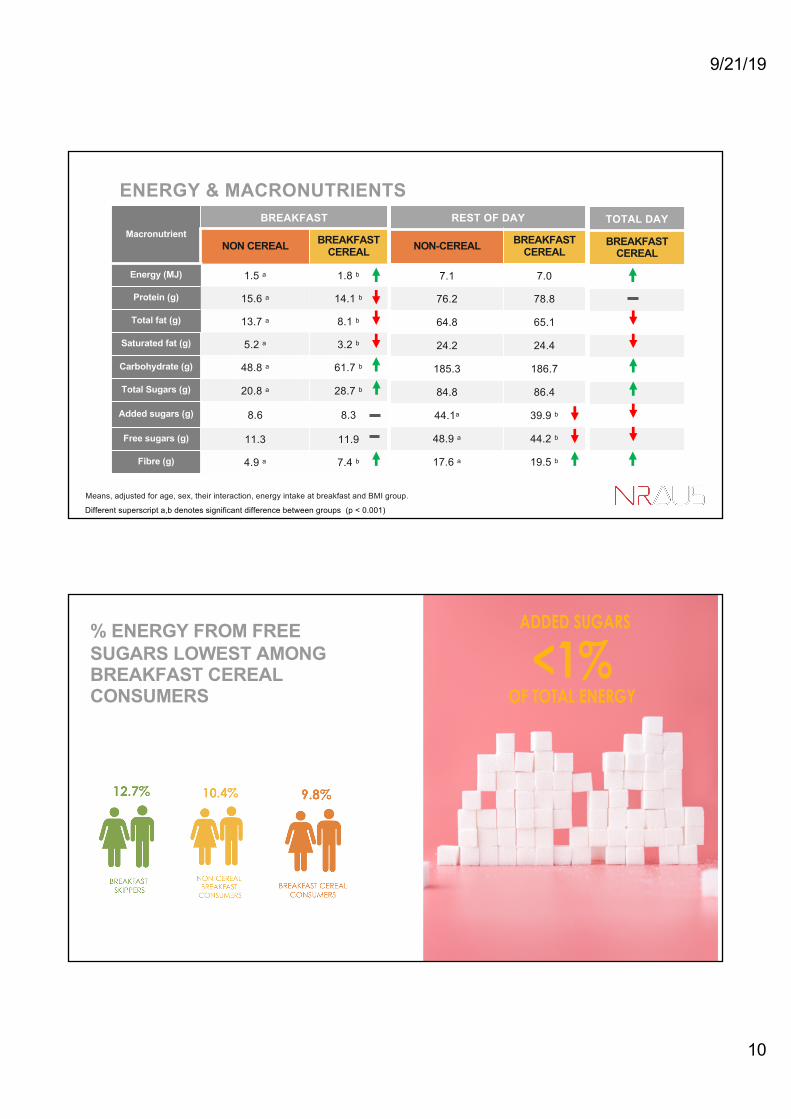
ENERGY & MACRONUTRIENTS
Macronutrient
BREAKFAST
NON CEREALBREAKFAST
CEREAL
Energy (MJ) 1.5 a 1.8 b
Protein (g) 15.6 a 14.1 b
Total fat (g) 13.7 a 8.1 b
Saturated fat (g) 5.2 a 3.2 b
Carbohydrate (g) 48.8 a 61.7 b
Total Sugars (g) 20.8 a 28.7 b
Added sugars (g) 8.6 8.3
Free sugars (g) 11.3 11.9
Fibre (g) 4.9 a 7.4 b
Means, adjusted for age, sex, their interaction, energy intake at breakfast and BMI group.
REST OF DAY
NON-CEREALBREAKFAST
CEREAL
7.1 7.0
76.2 78.8
64.8 65.1
24.2 24.4
185.3 186.7
84.8 86.4
44.1a 39.9 b
48.9 a 44.2 b
17.6 a 19.5 b
TOTAL DAY
BREAKFAST
CEREAL
Different superscript a,b denotes significant difference between groups (p < 0.001)
Insert new background image
% ENERGY FROM FREE
SUGARS LOWEST AMONG
BREAKFAST CEREAL
CONSUMERS
<1%OF TOTAL ENERGY
ADDED SUGARS

9/21/19
11
Insert new background image
MICRONUTRIENTS
Micronutrient
BREAKFAST
NON CEREALBREAKFAST
CEREAL
Niacin (eqv) (mg) 8.4 a 9.1 b
Iron (mg) 2.3 a 5.0 b
Thiamin (mg) 0.5 a 0.8 b
Riboflavin (eqv) (mg) 0.5 a 1.0 b
Folate (µg) 208 a 253 b
Calcium (mg) 177 a 291 b
Sodium (mg) 570 a 244 b
Magnesium (mg) 69 a 98 b
Potassium (mg) 520 a 646 b
Adjusted for age, sex, their interaction, energy intake at breakfast and BMI group.
REST OF DAY
NON-CEREALBREAKFAST
CEREAL
32.8 33.8
8.2 a 8.7 b
1.0 1.1
1.2 a 1.4 b
396 a 449 b
580 a 644 b
2069 2075
264 a 276 b
2405 a 2539 b
TOTAL DAY
BREAKFAST
CEREAL
Means, adjusted for age, sex, their interaction, energy intake at breakfast and BMI group.
Different superscript a,b denotes significant difference between groups (p < 0.001)
Insert new background image
*Unadjusted

9/21/19
12
Insert new background image
BC CONTRIBUTED 33% Fe, 36% B1
% ENERGY
CONTRIBUTION
Unadjusted
Insert new background image
LIMITATIONS
1 day’s intake
Under-reporting
Cross-sectional
9/21/19
13
Insert new background image
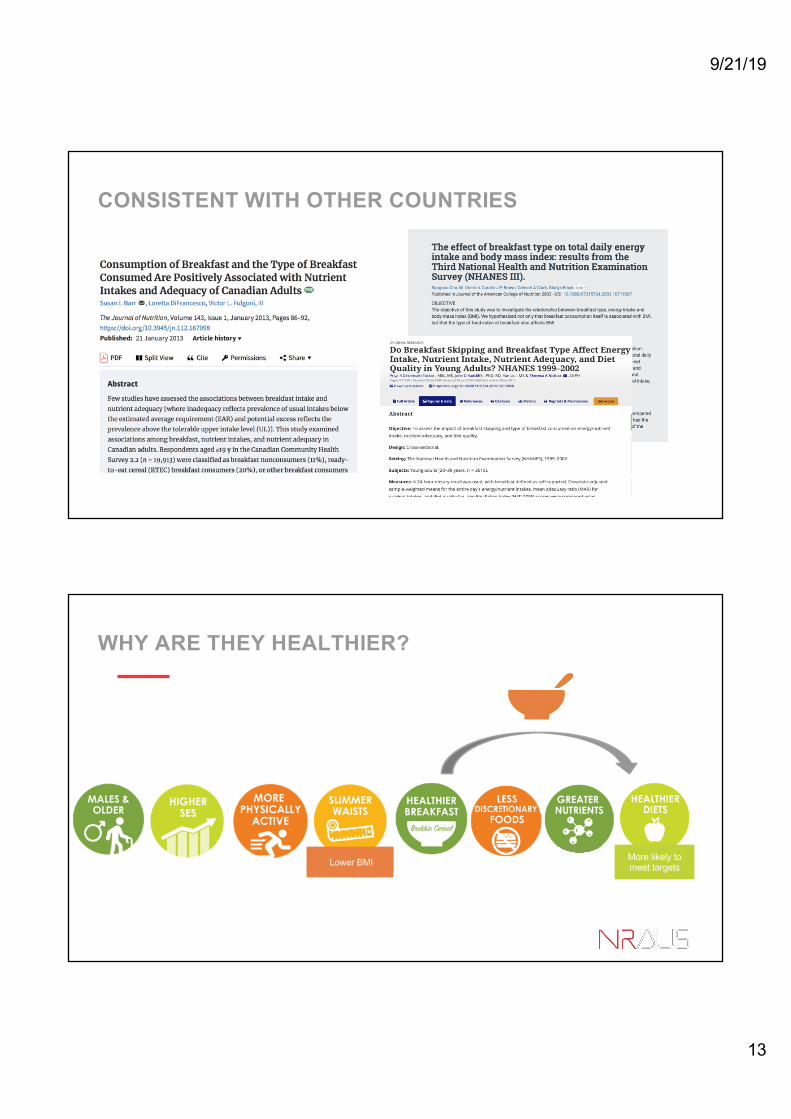
CONSISTENT WITH OTHER COUNTRIES
Insert new background image
WHY ARE THEY HEALTHIER?
Lower BMI More likely to meet targets

9/21/19
14
THANK YOUCO-AUTHORS
Andrew McConnellTim CassettariProf Peter Petocz
RESEARCH GRANT
WWW.NRAUS.COM