Embed Size (px)
Citation preview

Scientific Society of Advanced Research and Social Change SSARSC International Journal of Library, Information Networks and Knowledge
Volume 1 Issue 2, July- December 2016, ISSN 2455-5207
www.ssarsc.org Page 1
Guru Gobind Singh University, Delhi : A Scientometric Study of its Publications Output
during 2006-15
Satyendra Sharma* and Ritu Gupta**
*Delhi Technical Campus, 28/1 Knowledge Park III, Greater Noida 201 306, Uttar Pradesh
**Sri Venkateshwara University, Tirupati 517 502
Abstract
The paper examines 668 publications of Guru Gobind Singh University, as covered in Scopus database
during 2006-15, using various quantitative and qualitative parameters with a focus on its growth, citation
quality, share of national international collaborative papers, subject-wise distribution, contribution and
impact of its leading scholars, contribution to most productive journals, etc. Guru Gobind Singh
Indraprastha University, Delhi output witnesses an annual average growth rate of 37.53% and citation per
paper of 4.92 during 2006-15, which decreased from 9.41 during 2006-10 to 3.15 during 2011-15. Its
share of national and international collaborative publications in the total output was 52.69% and 8.53%
during 2006-15. Only 61.08% share of the university publications registered 1 or more citations during
2006-15. Computer science contributed the largest share of publications (22.60%), followed by
engineering (19.61%), materials science (15.27%), biochemistry, genetics & molecular biology (14.52%),
physics & astronomy (13.17%), chemistry (12.11%), medicine (11.38%), agricultural & biological
sciences (9.58%), mathematics (7.78%), environment science (6.59%), chemical engineering (5.69%),
etc. during 2006-15. The university top authors contributed 375 publications, which constituted 56.14%
and 72.67% share to its total publication and citation output during 2006-15. The university contribution
in 20 most productive journals together account for 16.17% share of its total output during 2006-15,
which decreased from 21.69% to 13.99% from 2006-10 to 2011-15. Suggest the need for university to
enlarge its research output and also raise its quality and impact of its research publications in order to
compete with other universities in Delhi.
0 Introduction
The Govt. of NCT of Delhi established its first University with the name Guru Gobind Singh
Indraprastha University in 1998. It is a teaching and affiliating University with the explicit
objective of facilitating and promoting “studies, research and extension work in emerging areas
of higher education with focus on professional education, for example engineering, technology,
management studies, medicine, pharmacy, nursing, education, law, etc. and also to achieve
excellence in these and connected fields and other matters connected therewith or incidental

Scientific Society of Advanced Research and Social Change SSARSC International Journal of Library, Information Networks and Knowledge
Volume 1 Issue 2, July- December 2016, ISSN 2455-5207
www.ssarsc.org Page 2
thereto. In a short span of 17 years, the University has not only been able to earn the best of
national accreditations, educational awards and acquire stringent certifications – UGC's
recognition under Section 2 (f) and 12 (b); Graded as „A' by the National Assessment and
Accreditation Council, Bangalore; ISO 9001 : 2000 first in 2008 and upgraded later to ISO 9001
: 2008 in 2009; and Recertified again in February, 2011 up to February, 2014. The University is
recognized by University Grants Commission (UGC), India. Guru Gobind Singh Indraprastha
University awards various degrees such as: B.Tech, B.Arch., M.Tech, MCA, M.Sc., BCA, BBA,
MBA, BMC, B.Pharma, BPT, MPT, BHMCT, B.Ed., LLB, LLM, BHMS, MBBS and Ph.D. The
admission to these programmes is done yearly through a Common Entrance Test. Within a short
span, Guru Gobind Singh Indraprastha Universityhas been able to make its presence felt the
world over. It is running more than 60 programmes in 11 University Schools of Studies and 80
Institutes, imparting professional education to more than 38,000 students with an annual intake
of about 12,000. Believing in the philosophy of continuing education, the University has started
a number of Post Graduate level Weekend Programmes in Management, Technology and Mass
Communication for working professionals, which have become very popular. The University's
state-of-the-art Main Campus, spread over on an area of more than 60 acres, is located at Sector
16-C, Dwarka, New Delhi and 11 University Schools of Studies, namely, (i) University School
of Basic and Applied Sciences; (ii) University School of Biotechnology; (iii) University School
of Chemical Technology; (iv) University School of Education; v) University School of
Environment Management; (vi) University School of Humanities and Social Sciences; (vii)
University School of Information Technology; (viii)University School of Law & Legal Studies;
and, (ix) University School of Management Studies ; (x)School of Architecture & Planning; and
(xii) School of Mass Communication. The university's state of the art campus with ultra-modern
facilities in an area measuring 60 acres is being build at West Delhi (Dwarka). With an aim to
provide Research and Development facilities of international standards, Guru Gobind Singh
Indraprastha University has decided to set up an Institute of Information Technology in East
Delhi (Surajmal Vihar) [1].
1 Literature Review

Scientific Society of Advanced Research and Social Change SSARSC International Journal of Library, Information Networks and Knowledge
Volume 1 Issue 2, July- December 2016, ISSN 2455-5207
www.ssarsc.org Page 3
A number of studies [2-11] have been published in India focusing on the performance of
individual Indian universities using publications, citations and collaborative publications data
and using quantitative and qualitative indices. There are also studies [12-19] which deal with
performance of individual university in broad and narrow subject area. On a similar line, the
present study makes an evaluation of research output of Guru Gobind Singh Indraprastha
University, Delhi during 2005-14
2 Objectives
The main objectives of this study are to study the performance of Guru Gobind Singh University,
based on publications output, as indexed in Scopus database during 2006-15. In particular, the
study focuses on the following objectives: (i) To study the growth of its research output and its
distribution by type of publication and citation impact per paper (ii) To study the distribution of
citations received by university publications (iii) To study the share of its national and
international collaboration publications and share of leading collaborative countries (iv) To study
the distribution of Indian research output by broad and narrow subject areas; (v) To study the
publication productivity and citation impact of its leading Indian authors(vi) To study the
leading media of communication
3 Methodology
For downloading publication data, we have used “Guru Gobind Singh Indraprastha University”
and “Delhi” as the keywords used in affiliation tag and “2006” to “2016” selected as the time
span of the study, which resulted in 668 records of the university. The search strategy used is
shown below. These records were further analyzed using different tags in the Scopus database
such as “author names”, “subject area”, “document type”, “source Title”, ”Affiliation” and
“Country/Territory” to get information on different aspects of research output as specified in the
objectives of the study.
(AFFILORG(Guru Gobind Singh Indraprastha University) AND AFFILCITY(Delhi)) AND
PUBYEAR > 2005 AND PUBYEAR < 2016
4 Analysis

Scientific Society of Advanced Research and Social Change SSARSC International Journal of Library, Information Networks and Knowledge
Volume 1 Issue 2, July- December 2016, ISSN 2455-5207
www.ssarsc.org Page 4
The total publication output of Guru Gobind Singh Indraprastha University, Delhi consisted of
668 publications during 2006-15, which increased from 13 to 121 publications from year 2006 to
2015, registering an annual average growth rate of 37.53%. The cumulative growth of Guru
Gobind Singh Indraprastha University publications increased from 189 to 479 from 2006-10 to
2011-15, registering growth of 153.44%. The average citation per paper registered by all
publications of Guru Gobind Singh Indraprastha University was 4.92 during 2006-15, which
decreased from 9.41 during 2006-10 to 3.15 during 2011-15 (Table 1). Of the total publications
of Guru Gobind Singh Indraprastha University, 72.01% (481) appeared as articles, 17.96% (120)
as conference papers, 4.94% (33) as reviews, 2.10% (14) as book chapters, 1.20%(8) as articles
in press, and others less than 1%: letters (0.90%), books and erratum (0.30%), editorial and short
survey (0.15% each) during 2006-15.
Table 1. Growth of Publications, Citations and Collaborative papers of
Guru Gobind Singh Indraprastha University during 2006-15
Publication
Year
TP TC ACPP NCP %NCP ICP %ICP
2006 13 135 10.38 8 61.54 1 7.69
2007 37 579 15.65 15 40.54 3 8.11
2008 32 300 9.38 16 50.00 2 6.25
2009 45 329 7.31 24 53.33 2 4.44
2010 62 435 7.02 38 61.29 5 8.06
2011 63 402 6.38 36 57.14 6 9.52
2012 93 485 5.22 57 61.29 10 10.75
2013 79 297 3.76 38 48.10 10 12.66
2014 123 266 2.16 67 54.47 12 9.76
2015 121 58 0.48 53 43.80 6 4.96
2006-10 189 1778 9.41 101 53.44 13 6.88
2011-15 479 1508 3.15 251 52.40 44 9.19
2006-15 668 3286 4.92 352 52.69 57 8.53
TP=Total Papers; TC=Total Citations; ACPP=Average Citation Per
Paper; NCP=National Collaborative Publications; ICP=International
Collaborative Publications
4.1 Comparison of Guru Gobind Singh Indraprastha University with other Delhi
Universities

Scientific Society of Advanced Research and Social Change SSARSC International Journal of Library, Information Networks and Knowledge
Volume 1 Issue 2, July- December 2016, ISSN 2455-5207
www.ssarsc.org Page 5
In comparison with other Delhi universities, Guru Gobind Singh Indraprastha University is
ranked at 6th
place in publication output, 7th
rank in average citation per paper, 6th
rank in terms
of h-index and 7th
rank in terms of share of high cited papers during 2005-14 (Table 2).
Table 2. Scientometric Profile of Indian Universities in terms of Overall Output during
2006-15
S.No Name of the University TP TC ACPP HI HCP %HCP
1 University of Delhi 11885 101523 8.54 79 93 0.78
2 Jawaharlal Nehru
University , New Delhi
5424 27583 5.09 65 18 0.33
3 Jamia Hamdard University,
Delhi
3301 32092 9.72 68 21 0.64
4 Delhi Technological
University
2350 13479 5.74 46 8 0.34
5 Jamia Millia Islamia, Delhi 1147 7452 6.50 33 11 0.96
6 G G S Indraprastha
University, Delhi
668 3286 4.92 24 2 0.30
7 Indira Gandhi National
Open University, Delhi
535 1832 3.42 20 1 0.19
8 South Asia University,
Delhi
298 6823 22.90 18 7 2.35
TP=Total Papers; TC=Total Citations; ACPP=Average Citation Per Paper;HI-h-index;
HCP=High Cited Papers
4.2 National Collaboration
The share of national collaborative publications in the total output of Guru Gobind Singh
Indraprastha University was 52.69% during 2006-15, which decreased from 53.44% during
2006-10 to 52.40% during 2011-15 (Table 1). The 352 national collaborative publications of
Guru Gobind Singh Indraprastha University received 1894 citations, leading to average citations
per paper of 5.38. The largest share of national collaborative papers (157 publications with 20
universities) was with universities: University of Delhi (45 publications), followed by Inter-
University Accelrator Centre, Delhi (23), Delhi Technological University (18), Aligarh Muslim
University (15), Amity University, Noida (13), Jamia Millia Islamia, Delhi (7),
G.N.D.University, Amritsar, University of Calcutta and Jaypee Institute of Information
Technology (5 each). The second largest collaborating group was research institutes (115
publications with 17 research institutes): National Physical Laboratory, New Delhi (26

Scientific Society of Advanced Research and Social Change SSARSC International Journal of Library, Information Networks and Knowledge
Volume 1 Issue 2, July- December 2016, ISSN 2455-5207
www.ssarsc.org Page 6
publications), Defence Research & Development Organization (14), Institute of Genomics &
Integrated Biology, Delhi (13), Indian Agricultural Research Institute, New Delhi (11),
Meterological Department, New Delhi (9), Saha Institute of Nuclear Physics, Kolkata (8),
Defence Institute of Bio-Energy Research (7), Indian Association for Cultivation of Science,
Kolkata (6)m Indira Gandhi Centre of Atomic Research, Kalpakkam (5), etc. The third largest
group of collaborative organizations was institute of national importance (58 papers from 3 INI):
iit-Delhi (37 papers), AIIMS-Delhi (21), etc. The largest number of collaborative papers among
engineering colleges was with Netaji Subhash Institute of Technology and Orissa College of
Engineering (12 each), etc.
4.3 International Collaboration
The share of international collaborative papers (57) of Guru Gobind Singh Indraprastha
University was 8.53% during 2006-15, which increased from 6.88% to 9.19% from 2006-10 to
2011-15 (Table 1). The 57 international collaborative papers of the university together got 427
citations, leading to average citation per paper of 7.49. Among 23 collaborative countries in
research output of Guru Gobind Singh Indraprastha University, the largest share (29.82%, 17
publications) was contributed by United States, followed by Japan (14.04%, 8 publications),
Canada and Germany (10.53%, 6 publications each), Australia and Taiwan (7.02%, 4
publications each), U.K. (5.26%, 3 publications), Iraq and Mauritius (3.51%, 3 publications
each), etc during 2006-15.
4.4 Distribution of Citations in Publications
Only 61.08% of total publications registered 1 or more citations during 2006-15. Of the cited
publications, 0.30% share (2 publications) (received 100 or more citations) registered 8.58% of
university‟s citation share (282 citations), 0.60% share (4 publications) of university‟s
publications (received 51 to 100 citations) registered 9.10% citation share (299 citations), 2.10%
share (14 publications) of university‟s publications (received 31 to 50 citations) registered
15.55% citation share (511 citations), 10.18% share (68 publications) of university (received 11
to 30 citations) registered 10.18% citation share (1076 citations), and 47.90% share (320
publications) of university (received 1-10 citations) registered 34.02% India‟s citations share
(1118 citations) during 2005-14 (Table 3)

Scientific Society of Advanced Research and Social Change SSARSC International Journal of Library, Information Networks and Knowledge
Volume 1 Issue 2, July- December 2016, ISSN 2455-5207
www.ssarsc.org Page 7
Table 3. Distribution of Citations in Publications of
Guru Gobind Singh Indraprastha University during 2006-15
Citation
Range
Number of
publications
Number
of
Citations
Share of
publications
Share of
citations
0 260 0 38.92 0
1-10 320 1118 47.90 34.02
11-20 59 856 8.83 26.05
21-30 9 220 1.35 6.70
31-40 10 334 1.50 10.16
41-50 4 177 0.60 5.39
51-100 4 299 0.60 9.10
>100 2 282 0.30 8.58
Total 668 3286
4.5 Subject-Wise Distribution of Publications
4.5.1 Broad Subject-Wise Distribution
Engineering sciences contributed the largest share of publications (48.35%) to the output of Guru
Gobind Singh Indraprastha University, followed by physical sciences (38.47%), life sciences
(24.25%), medical sciences (11.53%) and social sciences (8.53%) during 2006-15. Life sciences
registered the highest citation impact per paper (8.73), followed by medical sciences (5.17),
physical sciences (4.54), engineering sciences (3.47) and social sciences (2.47) (Table 4).
Table 4. Broad Subject-Wise Distribution of Publications of
Guru Gobind Singh Indraprastha University during 2006-15
S.No Broad Subject TP TC ACPP HI %TP
1 Engineering sciences 323 1121 3.47 15 48.35
2 Physical sciences 257 1167 4.54 16 38.47
3 Life sciences 162 1414 8.73 18 24.25
4 Medical sciences 77 398 5.17 10 11.53
5 Social sciences 57 141 2.47 7 8.53
Total of the university 668
TP=Total Papers; TC=Total Citations; ACPP=Average Citation Per
Paper; HI-h-index
4.5.2 Narrow Subject-Wise Distribution of Publications

Scientific Society of Advanced Research and Social Change SSARSC International Journal of Library, Information Networks and Knowledge
Volume 1 Issue 2, July- December 2016, ISSN 2455-5207
www.ssarsc.org Page 8
The publications output of Guru Gobind Singh Indraprastha University was classified according
to Scopus bibliographical database classification. The largest share of publications (22.60%) was
classified under computer science, followed by engineering (19.61%), materials science
(15.27%), biochemistry, genetics & molecular biology (14.52%), physics & astronomy
(13.17%), chemistry (12.11%), medicine (11.38%), agricultural & biological sciences (9.58%),
mathematics (7.78%), environment science (6.59%), chemical engineering (5.69%), etc. during
2006-15. The publication share has increased in computer science, engineering, physics &
astronomy, medicine, environment science, chemical engineering, earth & planetary science and
pharmacology, toxicology and pharmaceutics, as against decrease in materials science,
biochemistry, genetics & molecular biology, chemistry, agricultural & biological sciences,
mathematics, environment science, business, management & accounting and social sciences-
general from 2006-10 to 2011-15. Biochemistry, genetics & molecular biology registered the
highest citation impact per paper (12.03), followed by environment science (6.07), chemistry
(5.89), pharmacology, toxicology and pharmaceutics (5.80), chemical engineering (5.79),
agricultural & biological science (5.55%), medicine (5.20), materials science (4.74), physics &
astronomy (4.14), earth & planetary science (3.48), engineering (3.24), business, management &
accounting (2.71), social sciences-general (1.88), computer science (1.84) and mathematics
(1.81) during 2006-15 (Table 5).
Table 5. Subject-Wise Distribution of Publications on of Guru Gobind Singh
Indraprastha University during 2006-15
S.No Narrow
Subject
TP %TP TC ACP
P
HI IC
P
%I
CP
2006
-10
2011
-15
200
6-
15
2006-
10
2011
-15
2006-
15
1 Computer
science
39 112 151 20.63 23.3
8
22.60 278 1.84 10 7 4.64
2 Engineering 33 98 131 17.46 20.4
6
19.61 424 3.24 12 11 8.40
3 Materials
science
31 71 102 16.40 14.8
2
15.27 483 4.74 12 11 10.7
8
4 Biochemistr
y, genetics
& molecular
biology
34 63 97 17.99 13.1
5
14.52 116
7
12.0
3
18 14 14.4
3

Scientific Society of Advanced Research and Social Change SSARSC International Journal of Library, Information Networks and Knowledge
Volume 1 Issue 2, July- December 2016, ISSN 2455-5207
www.ssarsc.org Page 9
5 Physics &
astronomy
21 67 88 11.11 13.9
9
13.17 364 4.14 11 10 11.3
6
6 Chemistry 23 58 81 12.17 12.1
1
12.13 477 5.89 11 7 8.64
7 Medicine 15 61 76 7.94 12.7
3
11.38 395 5.20 10 11 14.4
7
8 Agricultural
& biological
sciences
21 43 64 11.11 8.98 9.58 355 5.55 11 8 12.5
0
9 Mathematic
s
15 37 52 7.94 7.72 7.78 94 1.81 6 1 1.92
10 Environmen
t science
7 37 44 3.70 7.72 6.59 267 6.07 9 2 4.55
11 Chemical
engineering
10 28 38 5.29 5.85 5.69 220 5.79 6 2 5.26
12 Business,
managemen
t &
accounting
9 22 31 4.76 4.59 4.64 84 2.71 5 1 3.23
13 Earth &
planetary
science
4 21 25 2.12 4.38 3.74 87 3.48 6 3 12.0
0
14 Social
sciences-
general
10 15 25 5.29 3.13 3.74 47 1.88 3 2 8.00
15 Pharmacolo
gy,
toxicology
&
pharmaceuti
cs
5 15 20 2.65 3.13 2.99 116 5.80 5 3 15.0
0
Total of the
university
189 479 668
TP=Total Papers; TC=Total Citations; ACPP=Average Citation Per Paper; HI=h-index;
ICP=International Collaborative Publications
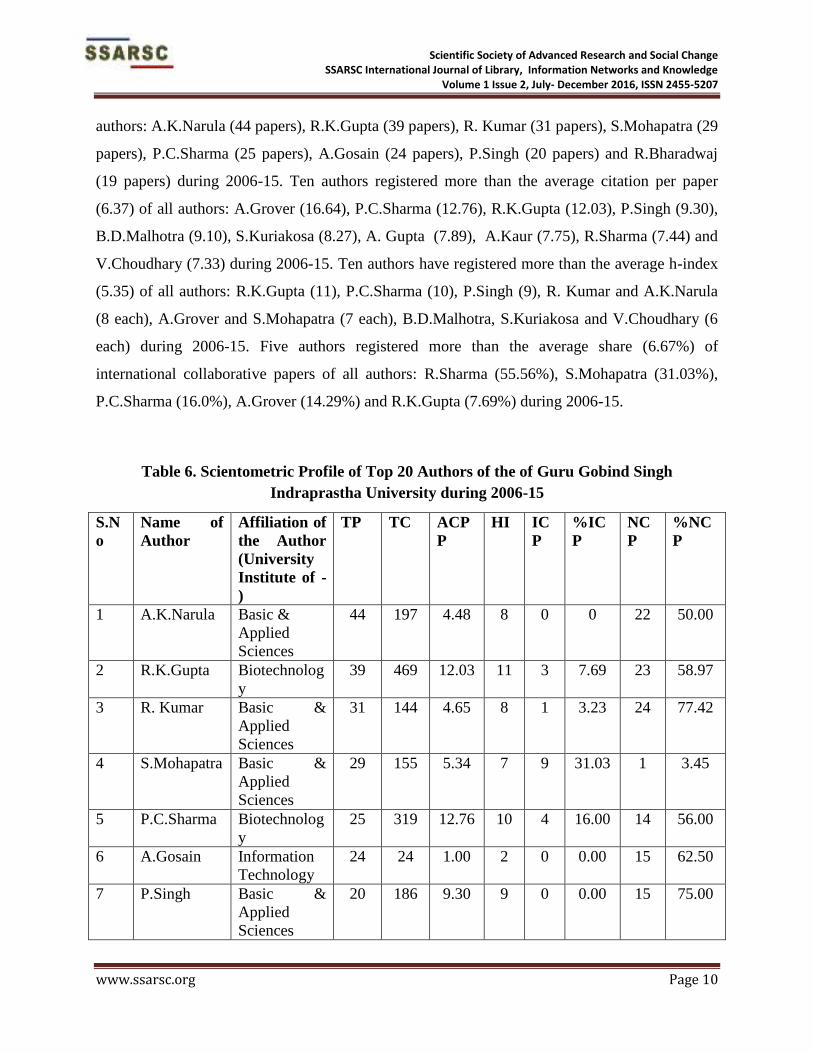
4.6 Contribution and Citation Impact of Top 20 Authors
The contribution of 20 top authors varied from 9 to 44 publications and together they contributed
375 publications (56.14% publication share) and accounted for 2388 citations (72.67% citation
share) during 2006-15. A scientometric profile of top 20 most productive authors is shown in
Table 6. Eight authors published more than the average productivity per paper (18.75) of all
Scientific Society of Advanced Research and Social Change SSARSC International Journal of Library, Information Networks and Knowledge
Volume 1 Issue 2, July- December 2016, ISSN 2455-5207
www.ssarsc.org Page 10
authors: A.K.Narula (44 papers), R.K.Gupta (39 papers), R. Kumar (31 papers), S.Mohapatra (29
papers), P.C.Sharma (25 papers), A.Gosain (24 papers), P.Singh (20 papers) and R.Bharadwaj
(19 papers) during 2006-15. Ten authors registered more than the average citation per paper
(6.37) of all authors: A.Grover (16.64), P.C.Sharma (12.76), R.K.Gupta (12.03), P.Singh (9.30),
B.D.Malhotra (9.10), S.Kuriakosa (8.27), A. Gupta (7.89), A.Kaur (7.75), R.Sharma (7.44) and
V.Choudhary (7.33) during 2006-15. Ten authors have registered more than the average h-index
(5.35) of all authors: R.K.Gupta (11), P.C.Sharma (10), P.Singh (9), R. Kumar and A.K.Narula
(8 each), A.Grover and S.Mohapatra (7 each), B.D.Malhotra, S.Kuriakosa and V.Choudhary (6
each) during 2006-15. Five authors registered more than the average share (6.67%) of
international collaborative papers of all authors: R.Sharma (55.56%), S.Mohapatra (31.03%),
P.C.Sharma (16.0%), A.Grover (14.29%) and R.K.Gupta (7.69%) during 2006-15.
Table 6. Scientometric Profile of Top 20 Authors of the of Guru Gobind Singh
Indraprastha University during 2006-15
S.N
o
Name of
Author
Affiliation of
the Author
(University
Institute of -
)
TP TC ACP
P
HI IC
P
%IC
P
NC
P
%NC
P
1 A.K.Narula Basic &
Applied
Sciences
44 197 4.48 8 0 0 22 50.00
2 R.K.Gupta Biotechnolog
y
39 469 12.03 11 3 7.69 23 58.97
3 R. Kumar Basic &
Applied
Sciences
31 144 4.65 8 1 3.23 24 77.42
4 S.Mohapatra Basic &
Applied
Sciences
29 155 5.34 7 9 31.03 1 3.45
5 P.C.Sharma Biotechnolog
y
25 319 12.76 10 4 16.00 14 56.00
6 A.Gosain Information
Technology
24 24 1.00 2 0 0.00 15 62.50
7 P.Singh Basic &
Applied
Sciences
20 186 9.30 9 0 0.00 15 75.00

Scientific Society of Advanced Research and Social Change SSARSC International Journal of Library, Information Networks and Knowledge
Volume 1 Issue 2, July- December 2016, ISSN 2455-5207
www.ssarsc.org Page 11
8 R.Bharadwa
j
Basic &
Applied
Sciences
19 39 2.05 4 1 5.26 12 63.16
9 Y.Singh Information
Technology
17 99 5.82 4 0 0.00 7 41.18
10 P.Chandra Information
Technology
15 7 0.47 2 0 0.00 6 40.00
11 A.Grover Biotechnolog
y
14 233 16.64 7 2 14.29 9 64.29
12 N.Rajpal Information
Technology
13 5 0.38 1 0 0.00 1 7.69
13 R.S.Gupta Basic &
Applied
Sciences
13 4 0.31 1 0 0.00 5 38.46
14 V.Choudhar
y
Basic &
Applied
Sciences
12 88 7.33 6 0 0.00 12 100.00
15 A.Kaur Information
Technology
12 93 7.75 4 0 0.00 1 8.33
16 B.D.Malhotr
a
Basic &
Applied
Sciences
10 91 9.10 6 0 0.00 8 80.00
17 S.Kuriakosa Basic &
Applied
Sciences
11 91 8.27 6 0 0.00 8 72.73
18 A. Gupta Environment
management
9 71 7.89 4 0 0.00 4 44.44
19 C.S.Rai Information
Technology
9 6 0.67 2 0 0.00 4 44.44
20 R.Sharma Biotechnolog
y
9 67 7.44 5 5 55.56 9 100.00
Total of 20
authors
375 2388 6.37 5.3
5
25 6.67 200 53.33
Total of the
university
668 3286
Share of 20
authors in
university
output
56.1
4
72.6
7
TP=Total Papers; TC=Total Citations; ACPP=Average Citation Per Paper; NCP=National
Collaborative Publications; ICP=International Collaborative Publications; HI=h-index
4.7 Medium of Communication

Scientific Society of Advanced Research and Social Change SSARSC International Journal of Library, Information Networks and Knowledge
Volume 1 Issue 2, July- December 2016, ISSN 2455-5207
www.ssarsc.org Page 12
Of the 668 publications of Guru Gobind Singh Indraprastha University, 535 appeared in journals,
91 in conference proceedings, 25 in book series and 17 as books during 2006-15. The top 20
journals together accounted for 108 publications (16.17% share of the university output) during
2006-15, which decreased from 21.69% to 13.99% from 2006-10 to 2011-15. The largest
number of publications (13) had appeared in Journal of Applied Polymer Science, followed by
Nuclear Instrutmens & Methods in Physics Research. Section B (9 papers), Asian Journal of
Chemistry (8 papers), Indian Journal of Pure & Applied Physics (7 papers), etc during 2006-15
(Table 7).
Table 7. List of Most Productive Journals Publishing Guru Gobind Singh
Indraprastha University Output during 2006-15
S.No Name of the Journal Number of Papers
2006-
09
2010-15 2006-15
1 Journal of Applied Polymer
Science
11 2 13
2 Nuclear Instrutmens & Methods
in Physics Research.Section B
1 8 9
3 Asian Journal of Chemistry 3 5 8
4 Indian Journal of Pure &
Applied Physics
5 2 7
5 Journal of Alloys & Compounds 0 6 6
6 Current Science 3 3 6
7 Advanced Materials Letters 0 5 5
8 Physiology & Molecular
Biology of Plants
3 2 5
9 Journal of Thermal Analysis &
Calorimetry
3 2 5
10 Vaccum 0 4 4
11 Wireless Personal
Communication
0 4 4
12 Applied Surface Science 0 4 4
13 Environmental Science &
Pollution Research
0 4 4
14 Critical Reviews in
Biotechnology
2 2 4
15 International Journal of
Business Information System
3 1 4
16 Library Philosophy & Practice 4 0 4
17 Journal of Basic Microbiology 0 4 4

Scientific Society of Advanced Research and Social Change SSARSC International Journal of Library, Information Networks and Knowledge
Volume 1 Issue 2, July- December 2016, ISSN 2455-5207
www.ssarsc.org Page 13
18 Beilstein Journal of
Nanotechnology
0 4 4
19 Molecular Genetics &
Genomics
3 1 4
20 Natural Hazards 0 4 4
Total of 20 journals 41 67 108
Total of the university 189 479 668
Share of 20 journals in
university output
21.69 13.99 16.17
5. Summary & Conclusion
The Guru Gobind Singh Indraprastha University, Delhi published 668 publications during 2006-
15. Its annual publications increased from 13 to 121 publications from year 2006 to 2015,
registering an annual average growth rate of 37.53%. The average citation per paper registered
by all publications of Guru Gobind Singh Indraprastha University was 4.92 during 2006-15,
which decreased from 9.41 during 2006-10 to 3.15 during 2011-15. Guru Gobind Singh
Indraprastha University is ranked at 6th
place in publication output, 7th
rank in average citation
per paper, 6th
rank in terms of h-index and 7th
rank in terms of share of high cited papers in
comparison with other Delhi universities during 2005-14. The Guru Gobind Singh Indraprastha
University share of national and international collaborative publications in its total output was
52.69% and 8.53% during 2006-15. The national collaborative publications of the university
decreased from 53.44% during 2006-10 to 52.40% during 2011-15, in comparison to
international collaborative publications which increased from 6.88% to 9.19% from 2006-10 to
2011-15. Of the total publications of the university, only 61.08% registered 1 or more citations
during 2006-15. Among the cited publications, 0.30% share of publications (received 100 or
more citations) registered 8.58% of university‟s citation share in comparison to 47.90% share of
publications of the university (received 1-10 citations) registered 34.02% India‟s citations share
during 2005-14. Among the broad subjects, engineering sciences contributed the largest share of
publications (48.35%) to the output of Guru Gobind Singh Indraprastha University, followed by
physical sciences (38.47%), life sciences (24.25%), medical sciences (11.53%) and social
sciences (8.53%) during 2006-15. Life sciences registered the highest citation impact per paper
(8.73), followed by medical sciences (5.17), physical sciences (4.54), engineering sciences (3.47)
and social sciences (2.47). Among narrow subjects, computer science contributed the largest

Scientific Society of Advanced Research and Social Change SSARSC International Journal of Library, Information Networks and Knowledge
Volume 1 Issue 2, July- December 2016, ISSN 2455-5207
www.ssarsc.org Page 14
publication share of 22.60%, followed by engineering (19.61%), materials science (15.27%),
biochemistry, genetics & molecular biology (14.52%), physics & astronomy (13.17%),
chemistry (12.11%), medicine (11.38%), agricultural & biological sciences (9.58%),
mathematics (7.78%), environment science (6.59%), chemical engineering (5.69%), etc. during
2006-15. Biochemistry, genetics & molecular biology registered the highest citation impact per
paper (12.03), followed by environment science (6.07), chemistry (5.89), pharmacology,
toxicology and pharmaceutics (5.80), chemical engineering (5.79), agricultural & biological
science (5.55%), medicine (5.20), etc during 2006-15. The contribution of 20 top authors of the
university accounted for 56.14% and 72.67% share of publication and citation output of the
university during 2006-15. The top 20 most productive journals together accounted 16.17% share
of the university output during 2006-15, which decreased from 21.69% to 13.99% from 2006-10
to 2011-15.
Concludes from above analysis that the performance of Guru Gobind Singh Indraprastha
University lag far behind with other leading Delhi universities, in terms of both publications
output and citation impact. As a result, the university must plan in terms of enlarging its research
output and also in raising the quality and impact of its research output, by enlarging the size of
qualified faculty and intake of intelligent Ph.D students and also improve its citation impact
through enlarged participation of its faculty in national and international collaborative projects
and increasing participation of its Ph.D students in international conferences and workshops. In
addition, more efforts should be made to attract extra-mural grants for getting research projects
from different major Indian funding agencies/departments, which may also lead to greater
research output and qualitative research.
References
1. Guru Ggobind Singh Indraprastha University. University profile.
http://ipu.ac.in/home/ipuaboutusmain.htm.
2. Kumbhar, M., Gupta, B.M. and Dhawan, S.M. Growth and impact of research output of
University of Mysore, 1996-2006: a case study. Annals of Library and Information Studies 2008,
55 (3), 185- 195.

Scientific Society of Advanced Research and Social Change SSARSC International Journal of Library, Information Networks and Knowledge
Volume 1 Issue 2, July- December 2016, ISSN 2455-5207
www.ssarsc.org Page 15
3. Malhan, I.V., & Gupta, B.M. (2011). A scientometric assessment of growth and impact of
research output of the University of Jammu. SALIS Journal of Library & Information Science
2011, 3(1-4), 30-45. .
4. Sevukan, R and Arivoli, J. Research trends among academics in Pondicherry University: A
bibliometric analysis. International Journal of Library and Information Science April 2012, 1(1),
98-111
5. Maharana, Rabindra K. and Das, Prangya. Research publication trend of Utkal University‟s
researchers indexed in Scopus during 2008 to 2012: A bibliometric analysis. Library Philosophy
and Practice (e-journal). 2013, Paper 999. http://digitalcommons.unl.edu/libphilprac/999
6. Maharana, R. K. and Sethi, B. B. A bibliometric analysis of the research output of Sambalpur
University‟s publication in ISI Web of Science during 2007-11. Library Philosophy and Practice
(e-journal). 2013, Paper 926, accessed June 15, 2013 available
from http://digitalcommons.unl.edu/libphilprac/926
7. Gopikttan, A and Aswathy, S. Publication Productivity of University of Kerala: A Scientometric
View. DESIDOC Journal of Library & Information Technology, 2014, 34(2), pp. 131-139.
8. Kumbar, B.D. and Gupta, B.M. Contribution of Karnataka University in science &
technology: Research output and citation impact during 2001-10.DESIDOC Journal of Library &
Information Technology March 2013, 33(2), 114-124
9. Siwach, Anil Kumar and Kumar, Satish. L. Bibliometric Analysis of Research Publications of
Maharshi Dayanand University (Rohtak) During 2000-2013. DESIDOC Journal of Library &
Information Technology, January 2015, 35(1), 17-24 Received 24 September 2014, revised 19 January 2015, online published 20 March 2015
10. Gautam, Vinod Kumar and Mishra, Rajani. Scholarly Research Trend of Banaras Hindu
University during 2004-2013: A Scientometric Study Based on Indian Citation Index. DESIDOC
Journal of Library & Information Technology 2015, 35(2), 75-81 © 2015, DESIDOC
11. Anil Kumar, H, Dora, Mallikarjun Dora and Desai, Asha. A bibliometrics profile of Gujarat
University, Ahmedabad during 2004-2013 DESIDOC Journal of Library & Information
Technology January 2015, 35(1), 9-16
12. Maharana, B. Research productivity of physical science disciplines in Sambalpur University
(Orissa): A scientometric study. Researchers World, 2012, 4(1), 1-8.
13. Nagarkar, S., Veer, C. and Kumbar, R. Bibliometric analysis of papers published by Faculty of
Life Science Departments of Savitribai Phule Pune University during 1999-2013. DESIDOC
Journal of Library & Information Technology, 2015, 35(5), 368-75.
14. Kaur, A. and Aggarwal, S. Bibliometric analysis of research publications of Department of
Chemistry, Guru Nanak Dev University, Amritsar. IASLIC Bulletin, 2010, 55(1), 20-28. 12.
15. Nagarkar, S. A bibliometric analysis of publications of Chemistry Department, University of
Pune, India, 1999-2012. Annals of Library & Information Studies, 2014, 61, 85-92.

Scientific Society of Advanced Research and Social Change SSARSC International Journal of Library, Information Networks and Knowledge
Volume 1 Issue 2, July- December 2016, ISSN 2455-5207
www.ssarsc.org Page 16
16. Khaparde, V. Bibliometric Analysis of Research Publication of Department of Chemistry, Dr.
Babasaheb Ambedkar Marathwada University, Aurangabad. Journal of Computer Science and
Information Technology, 2013, 1(1), 65-73.
17. Nandi, A., & Bandyopadhyay, A.K. Zoological research contribution of the University of
Burdwan in West Bengal: An analytical study. SRELS Journal of Information Management,
2010, 47(2), 229-144. 15.
18. Choudhari, V.M., & Borse, T.R. Research productivity of faculty members in School of
Mathematical Sciences, NMU, Jalgaon. E-Library Science Research Journal 2015, 3(10), 1-11.
19. Bansal, Madhu; Bansal, Jivesh; Saini, Harinder Singh; and Gupta, B M. Contribution and
Citation Impact of Panjab University in Mathematics Research during 2005-14. Library
Philosophy and Practice (e-journal), 2015, Paper 1325.