Embed Size (px)
Citation preview

Gulf Water Study Roper River Region

Front cover: Painting of the Rainbow Serpent by Rex Wilfred.
(see Appendix A for the story of the painting)
Satellite image of the Roper River.
Yawurrwarda Lagoon.

ii
GULF WATER STUDY
Early morning at Roper Bar, Roper River
WATER RESOURCES OF THE ROPER RIVER REGION
REPORT 16/2009D U. ZAAR DARWIN NT
© Northern Territory of Australia, 2009
ISBN 978-1-921519-64-2

1
ACKNOWLEDGEMENTS
This project was co -funded through the Australian Government Water Smart Australia Program and
the Northern Territory Government Department of Natural Resources, Environment the Arts and Sport.
I would like to thank my colleagues who provided help on this project: Peter Jolly (now retired) who
instigated this project; Des Yin Foo for his generous support as our team manager; Anthony Knapton,
my co-worker on this project who provided technical and field assistance; Steve Tickell, Danuta Karp
and Jon Sumner for their technical advice; Lynton Fritz for his outstanding cartographic skills in
drawing up the maps; Renee Ramsay for the production of the GIS and collation of the DVD and our
experienced technical team – Rodney Metcalfe, Steve Hester, Roger Farrow and Rob Chaffer for all
their efficient fieldwork. A special thanks also to Phil O’Brien who not only provided enthusiastic field
assistance but wise advice.
I take pleasure in also thanking members of our technical working group; Max Gorringe - the manager
of Elsey Station, Frank Shadforth – the manager of Seven Emu Station and Glenn Wightman –
ethnobiologist who all kindly took the time to provide advice at our meetings. All were always ready to
help.
I am very much indebted to the local people in the region. I thank the traditional owners for sharing
their knowledge of water resources and providing excellent guidance in the field; in particular Stephen
Roberts, Robert Roberts and Walter Rogers. I thank the station owners and managers who were
generous with their time in providing key information on the region and were very hospitable.
I would like to thank the Northern Land Council who provided liaison assistance particularly Bobby
Nununmadjbarr, the Roper Gulf Shire (Ngukurr and Minyerri) and the Yugul Mangi Rangers for their
assistance.
Lynton Fritz Technical working group Yugul Mangi Rangers
SUMMARY
This report provides details of the groundwater and Dry season surface water resources of the Roper
River region of the Gulf as depicted on the accompanying water resource map. It is one of five regions
which make up the mapping area of the Gulf Water Study (Figure 1.1). The study was co-funded by the
Australian Government Water Smart Australia Program and the Northern Territory Department of Natural
Resources, Environment, the Arts and Sport.
The purpose of this work is to provide readily accessible and easily understandable information on water
resources in the region. The project was undertaken with the dual perspective of western science and
indigenous knowledge and both are represented in the products of this study. It is hoped that common
understandings will develop between indigenous people and land managers about water in the region.
The key aim is to provide a fundamental data set to guide sustainable development of water resources,
maintaining social values, healthy groundwater systems and rivers as well as the ecosystems which
depend upon them.
The groundwater resource has been classified into five aquifer types:
• Fractured and Karstic Rocks (yields up to 10 L/s)
• Fractured and Weathered Rocks – carbonate rocks (yields 0.5 – 10 L/s)
• Fractured and Weathered Rocks – carbonate rocks (yields 0.5 – 5 L/s)
• Fractured and Weathered Rocks (yields 0.5 – 5 L/s)
• Fractured and Weathered Rocks with minor groundwater resources (yields 0 - 1 L/s)
The area is generally poor in groundwater. Of the better yielding aquifers, the fractured and karstic rock
aquifers are minor in extent and have not been drilled, and the fractured and weathered carbonate rock
aquifers are local in scale but are an important resource as they supply the largest settlement in the area,
Ngukurr. Across the area small groundwater discharges host water dependent ecosystems often marked
by lush vegetation pockets.
Given the generally poor and limited groundwater prospects, water supplies are often sought from surface
water sources; from rivers, waterholes, springs and dams. The Roper River and its tributaries dominate
the map sheet. A number of cattle stations as well as Ngukurr draw supplies from the Roper River. River
flow has been classified according to the minimum recorded flow at the end of the Dry season during a
dry period. There are four categories that describe river flow;
• River with a minimum flow greater than 100L/s at the end of the Dry season
• River with a minimum flow of between 10 and 100L/s at the end of the Dry season
• River with permanent waterholes and minimum flows up to 10 L/s at the end of the Dry season
• River which is dry at the end of the Dry season
Only the upper reaches of the Roper River fits into the highest flow category. Most of the rivers in the
area fit into the latter two categories reflecting the lack of groundwater discharge (baseflow) provided by
‘fractured and weathered rock’ aquifers which cover almost the entire map area.

3
Dry season discharges (baseflow) of the Roper River and its tributary the Wilton River, are sourced from
springs (groundwater discharges) which lie in their headwaters outside the map sheet. These rivers and
ecosystems that depend on their baseflow are therefore groundwater dependent. Dry season flow in
these rivers decreases with downstream distance due to evapotranspiration losses. In drier periods such
as in the 1960’s these rivers can cease to flow for kilometres upstream from the Roper estuary. The
amount of freshwater input into the estuary influences the location of the freshwater/saltwater interface in
the estuary. In drier times the interface can move more than 70 kilometres upstream causing the usually
fresh reaches of the estuary to turn salty, thus effecting Ngukurr’s water supply. This outlines the crucial
role of groundwater discharge in maintaining the dynamic natural environment as well as community
water supplies. To sustainably manage the Roper River requires consideration of the whole groundwater
catchment supplying water to the river as well as the surface water catchment of the Roper River.
Recorded rainfall, groundwater level and river baseflow were correlated on a yearly basis and strong
trends emerged. From the long term rainfall and river flow record it was observed that there were dry
periods and wet periods. 1952 to 1967 was a dry period in which every year the Roper River ceased to
flow at Roper Bar by the end of the Dry. The last decade however has been a wet period with
exceptionally high rainfall resulting in high groundwater levels and river baseflows. In fact, the flow at
Roper Bar, which is situated at the head of the Roper river estuary, has hardly dropped below 1 m3/s
since 1998. Such high variability needs to be taken into account in water allocation planning so the
health of the river system is maintained.
As part of the Gulf Water Study, an integrated surface water / groundwater computer model has been
developed which analyses the surface water and groundwater elements, and their interplay, in the entire
Roper River catchment. This work has been undertaken by A. Knapton and will provide vital information
to water allocation planning in the region currently underway as there is high demand for water in the
Mataranaka region. His reports provide a greater level of detail on the Roper River catchment and the
modelling of water resources within it. (See Knapton, 2009)
Indigenous knowledge on specific sites has been provided by traditional owners and is documented in
this report. Many of the sites are shown on the map. To provide a background to this knowledge an
overview on how indigenous people in the region view land and water is discussed. Indigenous people
believe that the Spirit Ancestors created their environment as well as a charter that is the Law for
existence. Through this law all land, water, plants, animals, natural phenomena, people and the Spirit
Ancestors (Dreamings) are inextricably connected. It is through these intricate connections that
indigenous people relate to water and everything else. Water sites not only have a physical entity and a
purpose in the connected environment but also social, emotional, cultural and spiritual significance.
Effective management of land and water therefore involves consideration of all these realms. Much can
be learnt from their holistic view as it engenders responsible land and water management.

4
Aside from the maps and reports other products from the Gulf Water Study include a geographic
information system (GIS), posters and spatial photographic and video collection which are all available on
DVD data disc.

TABLE OF CONTENTS
ACKNOWLEDGEMENTS ....................................................................................................................... 2
SUMMARY .............................................................................................................................................. 2
Table of Contents .................................................................................................................................... 5
List of Figures...................................................................................................................................... 7
List of Tables....................................................................................................................................... 8
List of Plates........................................................................................................................................ 9
1. INTRODUCTION .......................................................................................................................... 12
2. LOCATION ................................................................................................................................... 13
3. CLIMATE ...................................................................................................................................... 14
4. CURRENT WATER USAGE......................................................................................................... 17
5. INDIGENOUS KNOWLEDGE ...................................................................................................... 19
6. GROUNDWATER......................................................................................................................... 30
6.1 The Water Cycle .................................................................................................................. 30
6.2 Geology................................................................................................................................ 30
6.2.1 Rock Formations ......................................................................................................... 31
6.2.2 Geologic Structure and depositional history................................................................ 32
6.3 Aquifer Type......................................................................................................................... 33
6.3.1 Flow system description of aquifers ............................................................................ 34
6.3.2 Mapped aquifers.......................................................................................................... 35
6.3.3 Other groundwater supplies ........................................................................................ 40
6.4 Groundwater Quality ............................................................................................................ 41
6.4.1 Water quality measurements ...................................................................................... 42
6.4.2 Water Quality and Aquifer Type .................................................................................. 43
6.5 Recharge.............................................................................................................................. 45
6.6 Groundwater discharge and dependent ecosystems .......................................................... 47
6.6.5 Occurrence of springs ................................................................................................. 50
7. SURFACE WATER....................................................................................................................... 53
7.1 How surface water sites are recorded ................................................................................. 54
7.2 River Catchments................................................................................................................. 55
7.3 Availability of river water ...................................................................................................... 56
7.3.1 Mapping minimum baseflows...................................................................................... 56
7.3.2 Baseflow Water Quality ............................................................................................... 58
7.3.3 The Roper River .......................................................................................................... 58
7.4 Wet Season Flows ............................................................................................................... 67
8. WATER RESOURCE DATA AND AVAILABILITY ....................................................................... 69
9. GLOSSARY .................................................................................................................................. 70
10. REFERENCES......................................................................................................................... 74
APPENDIX A: INDIGENOUS KNOWLEDGE ............................................................................ 77

6
APPENDIX B: RECHARGE AND TRANSMISSIVITY.............................................................. 111
APPENDIX C: RECESSION FLOW MEASUREMENTS ......................................................... 113
APPENDIX D: FLOW LOSS ANALYSIS in the roper river....................................................... 115
APPENDIX E: MATARANKA RAINFALL RECORD ................................................................ 128
APPENDIX F: GROUNDWATER MONITORING DATA ......................................................... 129
APPENDIX G: WHEN THE ROPER RIVER STOPPED FLOWING ........................................ 130
APPENDIX H: DEPARTMENTAL WATER RESOURCES REPORTS.................................... 132
APPENDIX I: SUMMARY OF BORE INFORMATION ............................................................ 133
APPENDIX J: BORE WATER CHEMISTRY............................................................................ 150
APPENDIX K: SURFACE WATER SITES ............................................................................... 167
APPENDIX L: CHEMISTRY OF SURFACE WATER SITES................................................... 178
APPENDIX M: RAINFALL RECORDER SITES ....................................................................... 214
Key messages are highlighted in gold throughout the report.

7
List of Figures
Figure 1.1 Study Regions ................................................................................................................. 12 Figure 2.1 Land use in the Roper River Region ............................................................................... 13 Figure 3.1 Average monthly rainfall for Ngukurr (Station Number DR014609) ................................ 14 Figure 3.2 Average annual rainfall for the Northern Territory ........................................................... 15 Figure 3.3 Ngukurr annual rainfall. ................................................................................................... 15 Figure 3.4 Ngukurr mean maximum and minimum temperature. ..................................................... 16 Figure 3.6 Tropical cyclones between 1996 – 2006 in the map region ............................................ 16 Figure 5.1 Spirit Ancestors and their tracks in the Foelsche and Wearyan Rivers area .................. 21 Figure 5.2 Place names associated with the Spirit Ancestors and their tracks in the Foelsche and
Wearyan Rivers area............................................................................................................................. 22 Figure 5.3 Dreaming story. ............................................................................................................... 23 Figure 5.4 The beginning versus of the Mambaliya-Wawukarriya Kujika......................................... 25 Figure 5.5 Clan areas in the Borroloola area. (Baker, 1999)........................................................... 26 Figure 5.6 Some of the land units associated with the mainland as identified by Yanyuwa. ........... 28 Figure 6.1 The Water Cycle .............................................................................................................. 30 Figure 6.2 Example of grouping of Rock Formations into aquifer type. ........................................... 32 Figure 6.3 Flow path of water in a fractured rock aquifer. This is a local system............................ 35 Figure 6.4 Karstic aquifer development in the Nathan Group. ......................................................... 36 Figure 6.5 Aquifers situated in the Yalwarra Volcanics and along its contact with the Knuckey
Formation. ......................................................................................................................................... 38 Figure 6.6 Aquifers at the contact zone between the Bessie Creek Sandstone and the Velkerri and
Corcoran Formations............................................................................................................................. 39 Figure 6.7 Interception of water table by dam .................................................................................. 41 Figure 6.8 Recorded water levels (from local ground level) in RN027906 at Minyerri and for
comparison RN029429 at Tindall RAAF base over the years 1995 to 2002. ....................................... 46 Figure 6.9 Recharge to a confined and unconfined aquifer.............................................................. 47 Figure 6.10 Springs resulting from a more permeable rock overlying a less permeable rock. ...... 48 Figure 6.11 Spring emerging from a low point in the landscape. ................................................... 49 Figure 6.12 Spring discharge from a karstic aquifer....................................................................... 49 Figure 6.13 Spring discharge from a fault. ..................................................................................... 50 Figure 7.1 Runoff and Baseflow Components of Surface Water...................................................... 53 Figure 7.2 Discharge hydrograph in the Roper River at Red Rock G9030250 in 1995. .................. 54 Figure 7.3 Effect of Water Table Level on River Flow (Adapted from Fetter, 1994) ........................ 54 Figure 7.4 Roper River and tributary location map. Gaining, losing and tidal sections of the Roper
river. ......................................................................................................................................... 55 Figure 7.5 Measured discharge in m3/s (cumecs) in the Roper River catchment in 1963 (October),
1986 (May-June) and 2007 (November). .............................................................................................. 60
8
Figure 7.6 Average measured loss and estimated evaporation loss between gauging sites on the
Roper River. (Assuming one river channel) ........................................................................................ 62 Figure 7.7 Flow in the Roper River at Red Rock GS9030250 since 1967. ...................................... 63 Figure 7.8 Comparison of Mataranka annual and 5 year moving average rainfall to actual and
modelled groundwater level and minimum flow in the Roper River at G9030250. ............................... 64 Figure 7.9 The salt water/freshwater interface (wedge) moves upstream when inflow is sufficiently
reduced or ceases for a period.............................................................................................................. 66 Figure 7.10 Flow increases in the Roper River in response to rainfall........................................... 68 Figure D1 Correlation between gauged flow at Elsey and Moroak, grouped by rainfall period. .... 115 Figure D2 Correlation between gauged flow at Elsey and Moroak, grouped by month of gauging......
....................................................................................................................................... 116 Figure D3 Excerpt from geology map showing extent of Tindall Limestone. ................................. 119 Figure D4 Correlation between gauged flow at Moroak and Judy Crossing.................................. 120 Figure D5 Correlation between gauged flow at Judy Crossing and Flying Fox Junction............... 122 Figure D6 Correlation between gauged flow at Flying Fox Junction and Red Rock...................... 124 Figure D7 Correlation between gauged flow at Red Rock and Roper Bar. ................................... 126 Figure E1 Actual Wet Season rainfall at Mataranka DR14610 compared with Data Drill interpolated
data for the same location. .................................................................................................................. 128 Figure F1 Groundwater levels as measured by bores in the Tindall aquifer. ................................ 129
List of Tables
Table 4.1 Current water use in the Roper River Region. ................................................................ 18 Table 5.1 Examples of Yanyuwa clan classification (Bradley et al., 2006, p12) ........................... 26 Table 6.1 Rock groups, Formations and their ages. ....................................................................... 31 Table 6.2 Aquifer types and their characteristics............................................................................. 33 Table 6.3 Aquifer flow systems (Coram et al, 2000)........................................................................ 34 Table 6.4 Aquifer categories in the Roper River Region represented on the water resource map. 35 Table 6.5 Bores drilled into the Bessie Creek contact zone aquifers. ............................................. 39 Table 6.6 pH and water quality observed in the study area ............................................................ 43 Table 6.7 Water quality in aquifers around the Ngukurr area.......................................................... 44 Table 7.1 Recorded flows (m3/s) at sites along the Roper River in the driest periods. ................... 59 Table 7.2 Losses between gauging sites on the Roper River (m3/s). Statistics calculated on
gaugings undertaken between 1963 to 1991. ....................................................................................... 61 Table A1 Indigenous place names and details supplied by Sandy August .................................... 78 Table A2 Indigenous place names and details supplied by Donald Blitner .................................... 80 Table A3 Indigenous place names and details supplied by Arnold Duncan................................... 82 Table A4 Indigenous place names and details supplied by Roy Hammer ..................................... 85 Table A5 Indigenous place names and details supplied by Stephen Roberts................................ 90

9
Table A6 Indigenous place names and details supplied by Roger Rogers .................................... 96 Table A7 Indigenous place names and details supplied by Walter Rogers.................................. 103 Table A8 Indigenous place names and details supplied by Benny Tyson.................................... 106 Table A9 Indigenous place names and details supplied by Rex Wilfred ...................................... 109 Table A10 Indigenous place names and details supplied by other Traditional Owners. ................ 110 Table B1 Transmissivity and recharge characteristics for aquifers at Ngukurr. (Adapted from
Sumner, 2008)..................................................................................................................................... 111 Table B2 Transmissivity and recharge characteristics for aquifers at Minyerri. (Adapted from
Matthews, 2008 and Jamieson, 1992) ................................................................................................ 112 Table C1 Recession flow gaugings in cumecs.............................................................................. 113 Table D1 Rainfall periods and averages. For rainfall at Mataranka (See Appendix E). .............. 116 Table D2 Evaporation rates........................................................................................................... 117 Table D3 Data analysis for flow gaugings grouped in years noted............................................... 117 Table D4 Estimated evaporation losses along the Roper River between Elsey and Moroak....... 118 Table D5 Data analysis for gaugings grouped in years noted. ..................................................... 121 Table D6 Estimated evaporation losses along the Roper River between Moroak and Judy Crossing
for one channel.................................................................................................................................... 121 Table D7 Data analysis for gaugings grouped in years noted. ..................................................... 123 Table D8 Estimated evaporation losses along the Roper River between Judy Crossing and Flying
Fox Junction for one channel. ............................................................................................................. 123 Table D9 Data analysis for gaugings grouped in years noted. (Raw data from Appendix C) ..... 125 Table D10 Estimated evaporation losses along the Roper River between Flying Fox Junction and
Red Rock for one channel................................................................................................................... 125 Table D11 Data analysis for gaugings. .......................................................................................... 126 Table D12 Estimated evaporation losses along the Roper River between Red Rock and Roper Bar ..
....................................................................................................................................... 127 Table G1 Rainfall at Mataranka and minimum flow at Roper Bar, when available, for era where
flow ceased. ....................................................................................................................................... 130
List of Plates Plate 4.1 Pumping water from the Roper River at Ngukurr to supply the community. ................... 17 Plate 6.1 Weathered sandstone from 15-18 m interval from RN 35728. Note the pore spaces. .. 37 Plate 6.2 A drop of acid dissolving limestone as shown by the fizz. This is a common field test for
carbonate rocks. .................................................................................................................................... 42 Plate 6.3 U.Zaar measuring the EC with an EC meter. .................................................................. 42 Plate 6.4 Example of spring type 1: Seep discharging from the Hodgson Sandstone which overlies
the impervious dolerite. The spring is marked by the lusher vegetation.............................................. 48 Plate 6.5 Vegetation flanking Bukalorkmi sandstone escarpment.................................................. 49
10
Plate 6.6 Spring fed waterhole which supplies Roper Valley ......................................................... 50 Plate 6.7 Clara Hall, standing by a spring fed creek at Jawa. ........................................................ 51 Plate 6.8 Satellite image showing the lush vegetation lining the spring discharges at Jawa. ........ 51 Plate 6.9 Spring fed waterhole on Bella Glen Creek ...................................................................... 51 Plate 6.10 Manbilila Spring. .............................................................................................................. 52 Plate 7.1 Roper River adjacent to Moroak Station.......................................................................... 56 Plate 7.2 Tollgate Creek ................................................................................................................. 57 Plate 7.3 Bella Glen Creek.............................................................................................................. 57 Plate 7.4 Turkey Lagoon Creek ...................................................................................................... 57 Plate 7.5 Ursula Zaar interviewing Walter Rogers.......................................................................... 65 Plate 7.6 Roper Bar in times of high baseflow................................................................................ 67 Plate 8.1 Chantelle Tapp enjoying the Roper River. ...................................................................... 69 Plate A1 Donald Blitner at Ngukurr ................................................................................................ 79 Plate A2 Jill, Grace and Cherry Daniels at Nyawurlbarr ................................................................ 81 Plate A3 Arnold Duncan at Gangngurngur seep............................................................................ 82 Plate A4 Roy Hammer.................................................................................................................... 83 Plate A5 Satellite image of Wabarra Lake ..................................................................................... 84 Plate A6 & A7 Wurrumala............................................................................................................... 84 Plate A8 Stephen Roberts.............................................................................................................. 86 Plate A9 Wadangarda Lagoon ....................................................................................................... 87 Plate A10 Wurdawawa..................................................................................................................... 88 Plate A11 & 12 Namarlil and Wanmari Waterholes ........................................................................ 89 Plate AI3 & 14 Manbilila spring and discharge channel.................................................................. 89 Plate A15 Alirranya Spring ............................................................................................................... 96 Plate A16 Walter Rogers.................................................................................................................. 97 Plate A17 & A18 Walter standing by a mature Kapok tree and holding a bark water carrier ........ 97 Plate A19 Barnanda ......................................................................................................................... 98 Plate A20 Burrunju Creek................................................................................................................. 98 Plate A21 Burrunju – The Ruined City ............................................................................................. 98 Plate A22 Durrungutjbanganya ........................................................................................................ 99 Plate A23 Ganiyarrang Waterhole ................................................................................................... 99 Plate A24 Gurrurrukal Outstation ..................................................................................................... 99 Plate A25 & A26 Jilliwirri Waterhole and Costello........................................................................ 100 Plate A27 Malambuybuy Lagoon ................................................................................................... 100 Plate A28 & A29 Mitjingili ............................................................................................................. 101 Plate A30 Namiliwiri Waterhole...................................................................................................... 101 Plate A31 Nyawurlbarr ................................................................................................................... 102 Plate A32 Warawu.......................................................................................................................... 102 Plate A33 Rex Wilfred .................................................................................................................... 107 Plate A34 Rex Wilfred with his painting ......................................................................................... 107
11
Plate A35 Wreck of the Young Australian steamer at Yatalriya on the Roper River. .................... 109 Plate A36 Yawurrwarda, billabong of the Roper River................................................................... 110 Plate D1 Satellite image of the river between Elsey and Moroak. ............................................... 115 Plate D2 Rodney Metcalfe measuring the flow in one of the channels of the Roper River at Moroak
Station ....................................................................................................................................... 119 Plate D3 Satellite image of the river between Moroak and Judy’s Crossing................................ 120 Plate D4 Satellite image of the river between Judy’s Crossing and Flying Fox Junction............. 122 Plate D5 Satellite image of the river between Flying Fox Junction and Red Rock and Roper Bar....
....................................................................................................................................... 124
ABBREVIATIONS
Cumecs Cubic metres per second
NRETAS Northern Territory Department of Natural Resources, Environment, The Arts and
Sport
Est Estimated

12
1. INTRODUCTION
This report provides details of the groundwater and Dry season surface water resources of the Roper
River region of the Gulf of Carpentaria as depicted on the accompanying water resource map. It is
one of five regions which make up the mapping area of the Gulf Water Study (Figure 1.1). The study
was co-funded by the Australian Government Water Smart Australia Program and the Department of
Natural Resources, Environment, the Arts and Sport of the Northern Territory Government.
Figure 1.1 Study Regions
Ancillary to this report and map are posters, geographic information system (GIS) and a spatial
photographic and video collection. All products from the study are available on DVD data disc.
The purpose of this work is to provide readily accessible, easily understandable and user friendly
information products on water resources in the region. The project was undertaken with the dual
perspective of western science and indigenous knowledge and both are represented in the products of
this study. It has been targeted to inform all stakeholders from station managers, traditional owners
and land developers through to water planners and government bureaucrats. It is hoped that common
understandings will develop between indigenous people and land managers about water in the region.
The key aim is to provide a fundamental data set to guide sustainable development of water
resources, maintaining social values, healthy groundwater systems and rivers as well as the
ecosystems which depend upon them.
The water resources map is an interpretation of the regions geology, topography, bore data, stream
flows and vegetation patterns. Where data was lacking investigations were carried out including water
quality sampling, stream gauging, drilling, site visits, and aerial photo interpretation . The contribution
from local people, in particular their knowledge of the waterways has been vital to this mapping
exercise, especially in areas where access was difficult and scientific information scant.

13
2. LOCATION
In the Roper River Region there are two main communities. These are Ngukurr with a population of
1589 and Minyerri with a population of 340 people (Bushtel, 2007). Ngukurr is situated within Arnhem
Land and services numerous outstations within the district and the small community of Rittarangu with
a population of 100 (Bushtel, 2007). Rittarangu or Urapunga is located on the Urapunga Aboriginal
Land Trust. Minyerri is located on the Alawa 1 Aboriginal Land Trust which was previously known as
Hodgson Downs Station. The north west of the map sheet is dominated by cattle stations on pastoral
land. Of interest is Wongalara Station which was purchased in 2007 by the Australian Wildlife
Conservancy (AWC). Although it is continued to be run as a cattle station the AWC will be addressing
conservation of wildlife on the station. In the south east is the Limmen National Park.
Access to the region is by the Roper Highway from Mataranka which is partly bituminised. The
highway ends near Roper Bar, 180 km east of Mataranka. From there, an unsealed road leads
through Arnhem Land to Ngukurr and on to Numbulwar, and another unsealed road, namely the
Nathan River Road, leads south through the Limmen National Park to Cape Crawford and Borroloola.
Services are available at Minyerri, Ngukurr and the Roper Bar Store.
The Roper River runs from west to east through the centre of the map sheet and is the largest river in
the Gulf of Carpentaria within the Northern Territory. (Figure 2.1). The Limmen Bight (Port Roper)
Tidal Wetlands System situated around the mouth of the Roper River covering an area of 185,000 ha
is the only wetland in the region listed in the Directory of Important Wetlands in Australia (Environment
Australia, 2001).
Figure 2.1 Land use in the Roper River Region

14
3. CLIMATE
The Roper River region lies in the Wet/Dry tropics. With 6 months of negligible rain in the Dry season
most streams cease to flow unless they are groundwater fed. Annual evaporation exceeds rainfall.
The last decade has been the wettest for the last 118 years, since records have been kept.
The Roper River region has a tropical savanna climate with a marked Wet season from November to
April and Dry season from May to October (Figure 3.1). The southern part of the region has an
average annual rainfall of between 600 - 800 mm whereas the northern part receives between 800 –
1000 mm rainfall per annum on average (Figure 3.2). Annual rainfall has varied widely over the period
of record (Figure 3.3).
For example at Ngukurr the average annual rainfall from 1968 – 2008 was 840 mm but the long term
average from 1890 to 2008 was 761 mm (based on Bureau of Meteorology (BOM) Silo Data Drill data
for Ngukurr site; www.longpaddock.qld.gov.au/silo). The higher average for the last 40 years, and in
particular the last decade with 1039 mm average, has resulted in unusually high Dry season river
flows in the region (See Section 7.3).
Ngukurr
020406080
100120140160180200
Sep Oct Nov Dec Jan Feb Mar Apr May Jun Jul Aug
Month
Rai
nfal
l (m
m)
Figure 3.1 Average monthly rainfall for Ngukurr (Station Number DR014609) (From Bureau of Meteorology web site: www.bom.gov.au/climate/averages)

15
Figure 3.2 Average annual rainfall for the Northern Territory (From BOM website: www.bom.gov.au/jsp/ncc/climate_averages/rainfall)
Ngukurr Annual Rainfall
0
200
400
600800
1000
1200
1400
1600
1889
/0
1894
/5
1899
/0
1904
/5
1909
/10
1914
/15
1919
/20
1924
/25
1929
/30
1934
/35
1939
/40
1944
/45
1949
/50
1954
/55
1959
/60
1964
/65
1969
/70
1974
/75
1979
/80
1984
/85
1989
/90
1994
/95
1999
/00
2004
/5
Water Year
Rain
fall
(mm
)
Annual 1890-2008 Average 1968-2008 Average 1998-2008 Average
Figure 3.3 Ngukurr annual rainfall. Calculated over the Water year, September to August of
the following year. (Bureau of Meteorology Data Drill data for Ngukurr site;
www.longpaddock.qld.gov.au/silo).

16
Mean monthly minimum temperature varies from 15 - 26°C and maximum from 30 – 39°C (Figure 3.4).
Average annual evaporation is about 2400 mm for the region which exceeds the annual rainfall in
even the wettest of years. Mean monthly 3 pm humidity varies from 24 – 56 percent (Figure 3.5).
The Wet/Dry season contrast has significant implications for water resources. The monsoon brings
wet season rainfall but cyclones, and the lows before and after cyclones, bring large rainfall events
(Figure 3.6). These events cause major flooding and can provide good recharge to aquifers.
Although the Wet season brings significant rainfall over a short period, the ensuing Dry, with months of
negligible rain, results in most rivers in the region ceasing to flow unless they are groundwater fed,
such as the Roper, Wilton and Phelp rivers.
Figure 3.4 Ngukurr mean maximum and minimum temperature. (From BOM website:
www.bom.gov.au/jsp/ncc/cdio/cvg)
Figure 3.5 Ngukurr mean 9am and 3pm humidity. (From BOM website:
www.bom.gov.au/jsp/ncc/cdio/cvg)
Figure 3.6 Tropical cyclones between 1996 – 2006 in the map region
(From BOM website: www.bom.gov.au/cgi-bin/silo/cyclones)

17
4. CURRENT WATER USAGE
The level of water usage in the region is low, with bores, rainwater (tanks and dams), natural
waterholes and rivers providing water for domestic usage and cattle grazing. The Roper River
provides an essential water resource to the area.
Groundwater is used for domestic supplies wherever possible. The major population centres of
Minyerri, Urapunga and Ngukurr all use groundwater. However, Ngukurr, the largest community in the
region, supplements its supply with Roper River water (Plate 4.1). Outstations use bores, springs,
river water or lagoons for their domestic water supply (Table 4.1). The cattle stations use bores,
rainwater tanks or river water for their domestic supply (Table 4.1). Cattle are watered through bores,
dams, river water and natural water holes. Cattle stations have reported dams drying up late in the
Dry season due to months of no rain and high evaporation rates. The main industry in the area is
cattle grazing. Tourism is developing in the region at the Limmen National Park. Even with this low
level development, securing water supplies can be problematic due to the lack of permanent surface
water and lack of knowledge about groundwater in a very difficult hydrogeological environment. The
Roper River undoubtedly is a key water resource in the region.
Plate 4.1 Pumping water from the Roper River at Ngukurr to supply the community.

18
Table 4.1 Current water use in the Roper River Region.
Location Water Supply Water supply to cattle
Awunbunji outstation Waterhole/soak
Badawarrka outstation Roper River
Big River cattle station Rain water tank, Roper River Roper River, natural waterholes, dams
Boomerang Lagoon outstation Bore
Bringung (Abandoned) Roper River
Costello outstation Billabong of Turkey Lagoon Creek
Flying Fox cattle station Rain water tank, Roper River Roper River, creeks, natural waterholes
Ganiyarrang outstation Bore
Gondooloo cattle station Roper River, natural waterholes, dams
Jawa/Jowar Bore
Lake Katherine outstation Lagoon of the Phelp River
Larrpayanji outstation Creek fed by permanent spring
Lonesome Dove cattle station Roper River. Roper River, creek, natural waterholes, dams.
Maria Lagoon outstation Lagoon of the Limmen Bight River
Minyerri community Bores
Moroak cattle station Bore Roper River, creeks, natural waterholes, dams, bore
Mt Mc Minn cattle station Rainwater tank, Roper River Roper River, creeks, natural waterholes, dams, bore
Namul Namul cattle station Bore Dams, bores, natural waterholes.
Ngukurr community Bores, Roper River
Nulawan outstation Roper River
Nummerloori outstation Lagoon
Roper Valley Waterhole supplied by a permanent spring
Turkey Lagoon outstation Billabong
Urapunga community Bores
Wanmari outstation Lagoon of the Pelp River
Wongalara cattle station Roper River Roper River, creeks, natural waterholes

19
5. INDIGENOUS KNOWLEDGE
To indigenous people water sites not only have a physical entity and a purpose in the connected
environment, but also social, emotional, cultural and spiritual significance. Effective management of
land and water therefore involves consideration of all these realms.
‘… nothing is without meaning, because to have no meaning would be to have no Law, if something
has no Law it has no place and this cannot be for Indigenous plants and animals, (and land and water)
all have ngalki, they have essence or substance that relates them to all other living things including
humans.’ (Bradley et al. 2006)
Western science provides a view of water resources in terms of its physical characteristics. On the
water resource map, rivers are classified according to their minimum flow, groundwater classified
according to aquifer type and waterholes depicted as to whether they are permanent or intermittent.
Aboriginal people however view and classify the natural environment differently and kinship plays a
major role. Just as any scientific based management of water requires an understanding of scientific
principles and classification, so too indigenous environmental management requires an understanding
of indigenous views and classification of the environment.
To begin to comprehend the indigenous perspective is no easy task when coming from a Western
European perspective. ‘Many cross-cultural differences exist in relation to environmental perceptions,
knowledge of scientific practices, spirituality and language. Bradley notes that it was only after he had
become quite fluent in Yanyuwa that he began to really understand how the Yanyuwa view their
environment.’ (Bradley et al. 2006) Bradley is an anthropologist who has worked with the Yanyuwa
people since 1980. The work of Bradley and others is presented following as it gives a clear overview
of how one language group, the Yanyuwa view the environment, thus providing an example of
indigenous perspectives in the Gulf region. The Yanyuwa people are one of several language groups
situated in the Gulf Region. Other groups include Alawa, Marra, Warndarrang, Mangarrayi,
Ngalakgan, Garawa, and Gudanji as well as others. Cultural differences exist between the language
groups but the underlying world view often has similarities. Yanyuwa traditional country is situated
north-east of Borroloola and encompasses the Sir Edward Pellew Group of islands.
The following overview has been heavily resourced and quoted from Bradley et al. 2003 and Bradley
et al. 2006 and is denoted by the grey font. The information presented is the result of years of
research by Bradley.
For Yanyuwa people the environment is both a physical, spiritual and cultural landscape. To begin to
understand their interconnected view of the environment it is necessary to explain their view on how
life and land came into being.

20
The Yanyuwa believe all was created by the Spirit Ancestors, commonly called Dreamings or in
Yanyuwa Yijan ‘who rose up from the earth or travelled from distant places, and created and /or
changed geographical features and placed different plants and animals on the earth’.
‘The Spirit Ancestors also created a charter that is the Law for existence. … The Law is the reason
why things are as they are, or are done in a particular fashion’. As ‘the Spirit Ancestors set out the
forms of Law, and established the natural order and shape of the landscape they also left their
creative potency. At some point in time, most of the Spirit Ancestors changed into a number of forms.
Some became life forms or phenomena, as we know them today, such as certain species of plant and
animal, celestial bodies, winds and tides. Others transformed themselves into rocks, trees and
watercourses, and their power became localized at certain sites’.
‘The Yanyuwa believe that these Spirit Ancestors and their power still exist in the land. They also
believe that their power is still active and that through ceremony, song and certain forms of ritual
action, they can be contacted. It is because of this that the country is said to be able to ‘hear’, that a
rock for example, can make certain things happen, and that places when visited can be describes as
being happy, sad, generous or ungiving’.
The land and water is ‘criss-crossed with the tracks or paths of these Spirit Ancestors, and these
tracks are marked with places where the Spirit Ancestors danced, ate, fought, slept, urinated and so
on. All of these places are seen to be repositories of power and the consciousness of the Spirit
Ancestors. Thus the whole landscape is seen as a vast network of interconnected meaning’. An
example is provided in Figure 5.1 which provides a listing of the Spirit Ancestors and shows their
tracks in the Foelsche and Wearyan Rivers area (south-eastern Gulf). Figure 5.2 shows the place
names associated with these Spirit Ancestors for the same area. Figure 5.3 provides part of one of the
dreaming stories for this area, namely that of Walalu, the Stranger Rainbow Serpent. This area forms
part of the Law that comes from the Mainland.
The tracks that the Spirit Ancestors took ‘are also the song cycles, kujika, which are sung during
ceremonial performances. The song cycles for the travelling Spirit Ancestors follow a particular track
and have offshoots that diverge from the main track to bring into the song all the stationary Spirit
Ancestors that may be associated with a particular tract of land. Both the songs and the creatures can
be called kujika, as they play a creative role.’ It is believed that ‘the songs are still moving through
country even if no one is singing them, it is like they have a life of their own. People who know the
Kujika can join in and sing, and once they start singing it is like the country is singing through that
person.’ The Spirit Ancestors and their songs are inseparable from each other and from the sites that
they created through the action of singing. Thus, the Spirit Ancestors are the creators, the singers of
songs, which sang the Yanyuwa environment into being. Everything they did is recorded in these
songs: the names of country, fauna, flora, events and names of people and places are all recorded’.

21
Figure 5.1 Spirit Ancestors and their tracks in the Foelsche and Wearyan Rivers area. (From Bradley et al, 2003)

22
Figure 5.2 Place names associated with the Spirit Ancestors and their tracks in the Foelsche and Wearyan Rivers area. (From Bradley et al, 2003)

Figure 5.3 Dreaming story. (From Bradley et al, 2003). Right: one of the dreaming stories relating to the Foelsche and Wearyan Rivers area. Left: other stories associated with that Dreaming, Walalu. This story in particular has been presented here because, as detailed under ‘Other Stories 1’ the story of Walalu travels right across the Gulf region and ends at Bitter Springs at Mataranka, thereby traversing several language groups and providing an example of how the stories link people from different language groups.

24
‘The Kujika is said to preserve the way the country was in the Dreaming and how it still is, and how the
old people would like it to stay.’ The songs are also about power and the sound of the song creates
power that can make things happen. For example, Stephen Roberts, a senior elder living at Minyeri,
in talking to Zaar about the rain dreaming at Mambilila spring, located south of Ngukurr, explained:
“If the heavy storm come, you can stop that rain (by) singing, … (sings song). That’s how you stop
that rain, he wont come rough. You sing … backwards. (sings song) You sing like that. You stop that
rain, never come. That cloud will go right back Minimeer, that’s all. (Stephen Roberts, pers. comm.)
An example of part of a Kujika is provided in Figure 5.4. These are the final verses from a kujika
which has in it Walalu, the Stranger Whirlwind Rainbow Serpent Dreaming amongst others. The
kujika starts at Marrinybul rockhole.
Bradley explains that ‘every kujika has its own Ngalki’. ‘Ngalki is a very complex word that identifies
and gives distinction to its owner or owners. It is often translated as ‘essence’, ‘skin’ or ‘sweat’. For
example the ngalki of a flower is its smell; of food, its taste and a songs’ ngalki is its tune. The
Yanyuwa believe that the Spirit Ancestors were imbued with ngalki, which was also a classifying agent
that divided all things into one of four clans1’. As the Spirit Ancestors called and named places,
animals, plants and other environmental features they also classified them, with a ngalki, which places
them within the Yanyuwa clan system. The names of these four clans are:
• Wurdaliya,
• Wuyaliya,
• Rrumburriya and
• Mambaliya-Wawukarriya.
The interrelationship between Kujika, Ngalki, Dreaming and clans is portrayed in the following
example: ‘the kujika starting at Manankurra belongs to the Tiger Shark Dreaming and the Tiger Shark
Dreaming is Rrumburriya. Rrumburriya is the name of the ngalki, it is also the name of the clan that
owns the Manankurra Kujika.’
The map in Figure 5.5 shows Yanyuwa clan areas and Table 5.1 provides a listing of plants and
animals according to the clan classification. This clan classification is not restricted to the Yanyuwa,
and other language groups in the Gulf identify with it. An example is provided by the Aboriginal land
trust named ‘Mambaliya Rrumburriya Wuyaliya Aboriginal Land Trust’ which is situated on the
McArthur River and is connected with a number of language groups. The trust has used clan names
rather than language group names for identification. The four clans can be called different names in
different languages. When Zaar undertook field work with indigenous people from differing language
groups, they often referred to land and water areas in terms of the four clan names. 1 Baker (1999) describes the social groups of the Yanyuwa as consisting of two moieties which each have two semi-moieties. The semi moiety groups are equivalent to the clan groups noted by Bradley et al. (2006)

Figure 5.4 The beginning versus of the Mambaliya-Wawukarriya Kujika. It travels from Marrinybul rockhole to Jarrka.

Figure 5.5 Clan areas in the Borroloola area. (Baker, 1999)
Table 5.1 Examples of Yanyuwa clan classification (Bradley et al., 2006, p12)
People also carry ngalki. A person follows the ngalki of their father and father’s father. There are four
terminological lines of descent, which are distinguished at a grandparental level and which can be matched
to a clan. These are:
• Father’s father
• Mother’s father
• Father’s mother’s (brother)
• Mother’s mother’s (brother)
This is the basis of Yanyuwa kinship. ‘The clans are categories that codify relationships of importance in
ritual activity and in daily life.’ For example ‘the Yanyuwa are ngimarringki for their father’s country and
jungkayi for their mother’s country. The former is usually translated into English as ‘owner’ and the latter
term is translated by the Yanyuwa into English as ‘manager’. (Baker, 1999) People relate to country after
Rrumburriya
Mambaliya-Wawukarriya
Wuyaliya
Wurdaliya

27
the relatives that come from it; if, for example they were Rrumburriya, and they were referring to land that
was Rrumburriya, they would call it ‘country of my father’s father’.
As mentioned earlier, the Spirit Ancestors set out the Law and the Law that belongs to country provides the
rules for how people should interact with their environment and with others. It also determines how
ceremonies are to be performed and what each person’s role is in a ceremony. This again is interrelated to
a person’s clan. For example ‘the secret and sacred a-Kunabibi ceremony is for the Mambaliy-Wawukarriya
and Rrumburriya clans and they are ngimarringki while the Wuyaliya and Wurdaliya clans are jungkayi’.
Each has particular responsibilities in the ceremony. Hence ‘everyone is dependent on others to carry out
the life-sustaining ceremonies associated with the land’ (Baker, 1999). This was noted by Zaar when in
conversation with Donald Blitner, a Marra man from Ngukurr who said:
“I am the last child from my uncle and father who taught me the Willy Wagtail ceremony and song. If it’s a
dry time, my old people used to sing the rain song and my uncle and brother in law would sing at the cold
weather time for rain. The Jungayi, that is, the Joshua family for the area have passed away so no
ceremony is done anymore. That’s the way it goes. My eldest brother knew more than me but he has
passed away”. (Donald Blitner, pers. com.)
Because people, land, animals, plants and other natural phenomena all belong to a clan, a person belonging
to one clan will know how to relate to everything else in their natural environment. Hence the existence of an
intricate web of spiritual, cultural and social relationships between people and their environment. For
example: ‘The Brolga is Mambaliya-Wawukarriya so people from this clan are ngimarringki for the brolga and
call it father’s father, while people from the Wuyaliya and Wurdaliya clans will be jungkayi for it because it is
either their mother or father’s mother. Rrumburriya people call the brolga, mother’s mother’.
Aside from the spiritual and social way in which Yanyuwa view their environment they also view it in terms of
the ‘physical landscape and the habitat an organism occupies’. They have developed habitat classifications;
birds for example are classified into many habitats including mangroves, freshwater and lagoons amongst
others. They have divided the ‘physical landscape into distinctive ‘land units’ reflecting topography, soil and
vegetation.’ One of these units is presented in Figure 5.6. In it freshwater is associated with riparian
vegetation such as river pandanus and paperbark trees which is a familiar association also in Western
science. The Yanyuwa are aware of how their seasons and animal and food resources all interact with the
land units and habitats. They are acutely aware of environmental changes and the causes.
Land and water management for the Yanyuwa incorporates the intricate web of physical, spiritual and
cultural connections. Examples of how indigenous people manage the environment sustainably include:

28
Figure 5.6 Some of the land units associated with the mainland as identified by Yanyuwa. (Bradley et al., 2006) The land unit is listed at the bottom of the diagram ie Yiwirr, environmental detail is listed above this, and other environmental detail is provided at the top.
• There is total prohibition on some species and, typically, these are attributed with the power to
preserve particular resources. For example, the survival of the ‘quiet’ water snake is thought to
maintain waterholes. (Baker, 1993)
• Permission from the ngimarringki is required to hunt in areas. These rights are jealously guarded in
areas of plentiful resources, such as small islands rich with bird or turtle eggs. (Baker, 1999)
• Undertaking log coffin funeral practices to return spirits to the land and revitalize the country. This
practice has ceased amongst the Yanyuwa and hence people say the ‘land’s getting weak,
(because) no people, no spirit come back now’. (Baker, 1999)
Now let’s look specifically at water in relation to the above dissertation on the indigenous perspective of the
environment. Let’s take the example of a waterhole, any waterhole. Each waterhole has been named and
created by a Spirit Ancestor as it travelled on its path. The waterhole would be named in one or more songs
which would have a particular tune. The songs would explain what events occurred at the waterhole. The
waterhole would have its unique Ngalki or essence. The waterhole would be part of land belonging to a clan.
There would be owners and managers for the waterhole. Each of these people would carry responsibilities
in relation to caring for the waterhole. Ceremonies may take place at the waterhole. There may be a
particular way in which people must interact with the waterhole as determined by the law. The waterhole
forms part of a land unit, a habitat that is used by flora, fauna and people. The waterhole has a purpose.
The waterhole would be managed in a sustainable way because it has a role to play in the interconnected
spiritual, social and physical realm of the indigenous people. In fact management of the waterhole includes
all these aspects.

29
Les Hogan Warramurru a Garawa elder from Borroloola had similar words to say when interviewed by Zaar:
“Every waterhole has a story of how it was created. It got story that one. Every lagoon, every waterhole, all
the way down (the river) all that story, that one. We know (the story). We show our children when we go
there. We tell them. This is the country that dreaming been say, he’s here somewhere, something like that.
We show them the right waterhole, the dreaming there. Some places all right (to visit), when that dreaming
been talk, he’s all right, they still can fish or catch turtle. (When going to a waterhole we talk to the dreaming)
I’m here, I’m the boss for this country, you got to talk yourself. You tell the old people (the ancestors), they
belong to there, they are there somewhere but you can’t see them.” (Les Hogan, pers. com.)
Plate 5.1 Les Hogan Warramurru
The West has in recent decades become more aware of interconnections of water and the environment
through such fields as hydroecology; it recognises the beneficial uses of water which include cultural and
environmental uses and it realises people have to be responsible in managing the environment. This has
been the awareness of the indigenous people for thousands of years only their world view takes one step
further – that of the spiritual. Their holistic view engenders responsible land and water management.
As a means of presenting indigenous knowledge on water, indigenous waterhole names collected as part of
this study are marked on the water resource maps and information pertaining to the waterholes and who
provided that information is given in Appendix A. This information, which has often been provided by elders,
provides a little insight into the significance of water to indigenous people in this map area. It presents a
fragment of the indigenous knowledge of the vast Gulf region that has been passed on through generations
by word of mouth, song, dance, painting and ceremonies. It is hoped that this introduction which has very
much simplified what is really an interconnected complex system, has provided enough background so that
the information in Appendix A can be put into perspective.
Ancillary to this report, indigenous knowledge has also been documented through photographs and video
and is available on The Gulf Water Study DVD.

30
6. GROUNDWATER
6.1 The Water Cycle To understand the groundwater system, it helps to have an understanding of the water cycle (Figure
6.1). When rainfall hits the ground, some of it runs off into streams and creeks (surface runoff), some
of it evaporates and some of it seeps into the ground (infiltration). The amount of water that infiltrates
depends on many factors, including the soil and rock type, the slope of the land and the intensity and
duration of rainfall. As the water infiltrates it wets up the soil and moves down. Some of this water will
be evaporated or used by plants, and the rest will move downwards until it reaches the watertable to
become groundwater. The process of adding water to the groundwater system is called recharge.
Porous rocks and soil allow the groundwater to slowly move from high areas to low areas, usually
discharging to the surface at some point. If a useful amount of water can be extracted from a rock
unit, then it is referred to as an aquifer.
Figure 6.1 The Water Cycle
6.2 Geology Geology is the science of rocks and its characteristics. Rock type and geological structure are some
of the main factors influencing groundwater occurrence and the location of springs.

31
6.2.1 Rock Formations Rock Formations are made up of one or several rock types. These are shown on geology maps. The
groundwater potential of each Formation is assessed and those with similar aquifer characteristics are
grouped together and mapped under one of the aquifer types shown on the water resources map.
Rocks are classified into rock formations as characterised by their physical and chemical features.
Rock Formations can consist of one or several rock types i.e. sandstone, dolomite. When a number of
rock Formations have common characteristics, they are grouped together to form a rock group. The
age of the rock is categorized by a geologic time frame. Table 6.1 provides a broad outline of the rock
groups and Formations of the region and their ages.
Table 6.1 Rock groups, Formations and their ages.
GROUP ROCK FORMATION AGE: IN MILLIONS OF YEARS
GEOLOGIC TIME FRAME
Undifferentiated alluvium and colluvium 0 - 65
(Youngest) Cenozoic
Undifferentiated Cretaceous 65 - 145 Cretaceous
Antrim Plateau Volcanics 488 - 542 Cambrian
Derim Derim Dolerite 542 - 2500 Proterozoic
Roper Includes:
Chambers River Formation
Bukalorkmi Sandstone
Kyalla Formation
Velkerri Formation
Bessie Creek Sandstone
Corcoran Formation
Munyi Member
Hodgson Sandstone
Jalboi Formation
Arnold Sandstone
Phelp Sandstone
Nathan Walmudga Formation
Yalwarra Volcanics
Knuckey Formation
Mount Birch Sandstone
Vizard and McArthur
Urapunga Granite and Mt Reid Rhyolite (Oldest)
32
The extent of each Rock Formation is depicted on geology maps. The Roper River Region is covered
by the following 1:250000 scale geology maps:
• URAPUNGA-ROPER RIVER SPECIAL
• HODGSON DOWNS
• MOUNT YOUNG
A number of the Rock Formations noted in Table 6.1 will be referred to in this report. The groundwater
potential of each Formation has been assessed and Formations with similar aquifer characteristics are
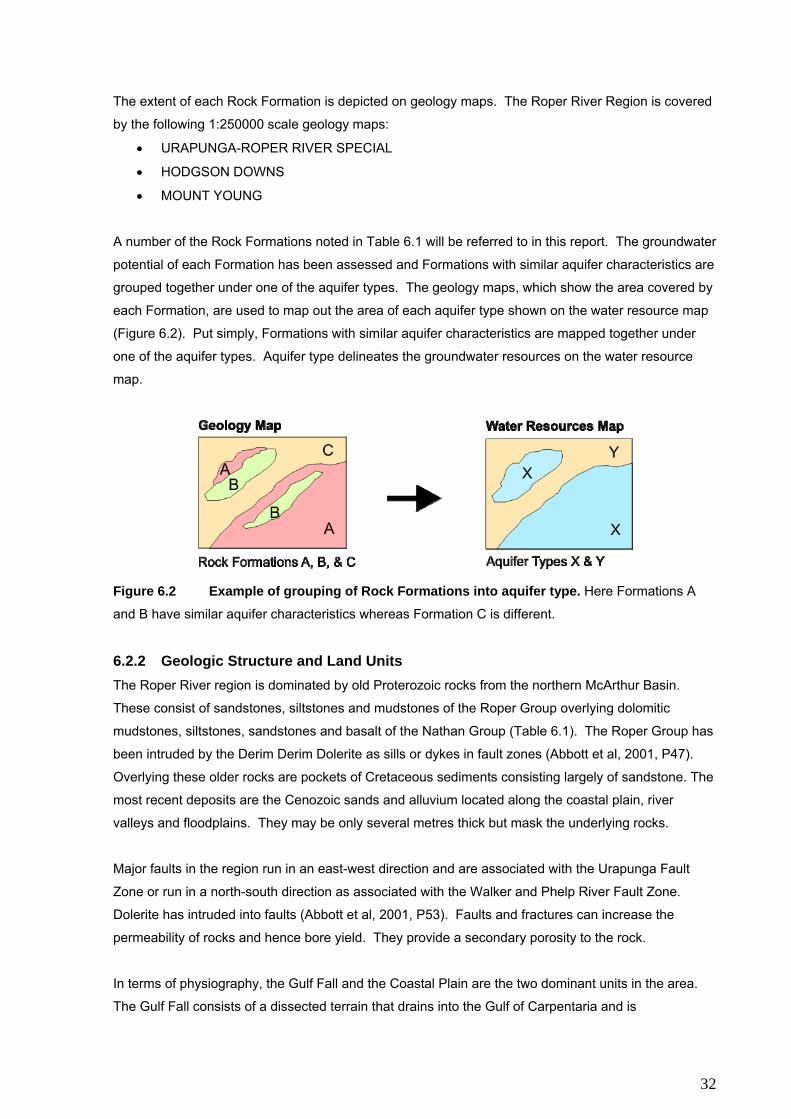
grouped together under one of the aquifer types. The geology maps, which show the area covered by
each Formation, are used to map out the area of each aquifer type shown on the water resource map
(Figure 6.2). Put simply, Formations with similar aquifer characteristics are mapped together under
one of the aquifer types. Aquifer type delineates the groundwater resources on the water resource
map.
Figure 6.2 Example of grouping of Rock Formations into aquifer type. Here Formations A
and B have similar aquifer characteristics whereas Formation C is different.
6.2.2 Geologic Structure and Land Units The Roper River region is dominated by old Proterozoic rocks from the northern McArthur Basin.
These consist of sandstones, siltstones and mudstones of the Roper Group overlying dolomitic
mudstones, siltstones, sandstones and basalt of the Nathan Group (Table 6.1). The Roper Group has
been intruded by the Derim Derim Dolerite as sills or dykes in fault zones (Abbott et al, 2001, P47).
Overlying these older rocks are pockets of Cretaceous sediments consisting largely of sandstone. The
most recent deposits are the Cenozoic sands and alluvium located along the coastal plain, river
valleys and floodplains. They may be only several metres thick but mask the underlying rocks.
Major faults in the region run in an east-west direction and are associated with the Urapunga Fault
Zone or run in a north-south direction as associated with the Walker and Phelp River Fault Zone.
Dolerite has intruded into faults (Abbott et al, 2001, P53). Faults and fractures can increase the
permeability of rocks and hence bore yield. They provide a secondary porosity to the rock.
In terms of physiography, the Gulf Fall and the Coastal Plain are the two dominant units in the area.
The Gulf Fall consists of a dissected terrain that drains into the Gulf of Carpentaria and is

33
characterised by low rubbly hills of Proterozoic rocks and broad alluvial plains of the Roper River and
its tributaries. (Abbot, 2001 pp1). The highest elevation, around 250m, lies in the northern part of the
map sheet on the Wilton River Plateau, which is an extensive upland area belonging to the Gulf Fall.
The Coastal Plain is characterised by extensive coastal flats of low elevation. The Roper River lies in
the centre of the map area and runs from west to east with tributaries joining from the north and south.
6.3 Aquifer Type An Aquifer is a body of rock that contains water and releases it in useable quantities. The rock
contains water-filled spaces that are sufficiently connected to allow the water to flow through the rock.
The spaces can develop from fractures, rock dissolution or occur naturally due to voids between the
grains in the case of sandstone. Aquifers are classified according to the type of spaces within the
rock.
When assessing the groundwater resource potential of a Rock Formation, bore yields, springs, water
quality, sinkholes and importantly rock type and the nature of the spaces in the rock is taken into
account. The latter delineates aquifer type. The properties of the spaces determine how extensive an
aquifer is, how easily water moves through it, and how much water can be stored in it. Aquifer type is
related to rock type. There are three main aquifer types (Table 6.2).
Table 6.2 Aquifer types and their characteristics. (Adapted from Tickell, 2008)
Aquifer type Description Rock type that contains this aquifer type
Fractured
Networks of fractures in the rock provide space for water to collect and move through. The degree of fracturing can vary greatly. Fractures are normally very small, less than a millimetre, but if there are enough of them an aquifer can exist. Where fracturing is extensive and interconnected throughout a formation a widespread aquifer results. Localised fracturing results in a localised aquifer which is usually not very productive.
All rock types. It is the main aquifer type for hard, impermeable rocks such as granite, schist, dolerite and silicified sandstone.
Fractured and Karstic
This aquifer is created by the dissolution of the rock by water passing through it. It forms in carbonate rocks – limestone or dolomite. Over geological time frames these rocks are slightly soluble in water. As water moves through fractures, it gradually enlarges them as the rock is slowly dissolved. The process can form caverns but more commonly openings of millimetre to centimetre in scale.
Carbonate rocks – Limestone and dolomite
Sedimentary Porous rock
This aquifer occurs in sands and sandstone. Pore spaces between the grains provide storage and a flow path for water. Not all sandstones have suffic-ient intergranular porosity to form an aquifer. Also over time, minerals may fill or partially fill the pore spaces hence the younger the sandstone the more likely it is to have its intergranular porosity intact.
Sands and sandstones

34
The effects of weathering can increase aquifer development and therefore has been included in the
description of aquifer type. Weathering is the physical disintergration and chemical decomposition of
rock. Physical weathering occurs from the alternate expansion and contraction due to temperature
changes, and chemical weathering produces new minerals. Weathering can cause the development
of new fractures or enhance existing fractures, resulting in better aquifers. Weathering can also cause
the narrowing of fractures reducing aquifer development. The most productive aquifers commonly
occur near the base of the weathered rock.
Weathering can be accelerated or enhanced by fracturing. When rock is fractured, open spaces
develop in the rock mass, and water collects in the spaces. Aquifers can exist in rocks due to
fracturing alone. Fracturing can occur in all rock types but the degree of fracturing can vary greatly.
Faults are marked on geology maps but the degree of fracturing is not indicated. Fractures can be
targeted for potential water supplies but specialist scientific advice should be sought.
Aquifers can consist of combinations of the main aquifer types.
6.3.1 Flow system description of aquifers Aquifers can be described according to the distance groundwater moves through the aquifer, from
where it enters the ground (recharge areas) to where it discharges back to the surface (discharge
areas) (Figure 6.3). The distance it flows depends on the extent of the aquifer. It can vary from
hundreds of kilometres to less than a kilometre. The scale of groundwater flow has been categorized
by Coram and others (2000). These are termed groundwater flow systems (Table 6.3) and are used
to describe the aquifers on the water resource map.
Table 6.3 Aquifer flow systems (Coram et al, 2000)
Groundwater flow system
Flow path distance of groundwater
Example
Local < 5 km Fractured rock aquifers in granite often have a short flow path because the aquifer is only as extensive as the group of fractures.
Intermediate 5 to 50 km Carbonate rocks that extend for tens of kilometres can have longer flow paths as provided by the interconnected caverns.
Regional > 50 km In large sedimentary basins, like the Great Artesian Basin, the flow path is long because the sediments have been deposited over a very large area and remain connected. These aquifers may have high permeability.

35
Figure 6.3 Flow path of water in a fractured rock aquifer. This is a local system.
The rate at which groundwater flows is usually very slow compared to river flows. It can vary from a
few millimetres to several metres per year. Karstic aquifers are an exception where water can flow
almost like a river through caverns when they exist. Depending on the size and type of an aquifer, it
can take days to thousands of years for rainwater to complete its journey through an aquifer from
when it infiltrates into the ground to when it discharges. The water we drink from some springs could
be very old indeed.
6.3.2 Mapped aquifers / Groundwater Resources In the Roper River region five aquifer categories have been identified and drawn on the water
resource map (Table 6.4). Each category has been determined by its aquifer type, flow system,
typical bore yield and whether or not it consists of carbonate rock. Carbonate rocks impart a particular
water quality to groundwater (See section 6.4).
Table 6.4 Aquifer categories in the Roper River Region represented on the water resource map.
Representative colour on the map
Diagram of aquifer type
Aquifer Type Flow system Typical bore yield
Fractured and karstic rocks – carbonate rocks
Local to intermediate scale
Up to 10 L/s may be encountered
Fractured and weathered rocks – Carbonate rocks
Local scale
0.5 – 10 L/s (2 categories)
0.5 – 5 L/s
Fractured and weathered rocks Local scale 0.5 – 5 L/s
Fractured and weathered rocks with minor groundwater resources
Local scale 0 – 1 L/s
36
The occurrence and characteristics of each of these aquifers is detailed below. The extent of each of
the aquifers has been determined by use of the geological maps and grouping together rock
formations that contain the same aquifer type. Drilling information is used to confirm the interpretation
of aquifer type and its extent. All water bores drilled in the Northern Territory are identified by a
Registration Number (RN) and these are plotted on the water resource map. Details of each bore are
provided in Appendices I and J.
Fractured and Karstic Rocks
This aquifer type is located south of Ngukurr and in the north-east of the map and is situated in the
Nathan Rock Group. In these areas the Phelp Sandstone, with thickness between 40 - 80 m, overlies
the Nathan Group which contains carbonate rocks ie dolostone (Figure 6.4). To access the aquifer
one needs to drill through the Phelp Sandstone and into the Nathan Group.
Figure 6.4 Karstic aquifer development in the Nathan Group.
The Nathan Group in the north east is potentially saturated since the sinkholes in the overlying
sandstone are known to permanently hold water. Satellite imagery indicates there is a spring
discharging from the southern end of the aquifer running into a creek connecting with the Phelp River.
The aquifer south of Ngukurr also exhibits sinkholes and the largest spring in the region, Manbilila
spring with a carbonate water quality, emerges from the aquifer. These factors provide evidence for
the existence of karstic aquifers but further investigations, such as drilling, would provide confirmation.
No bores have been drilled at the locations, however, it is anticipated that yields up to 10 L/s or more
are possible.
Fractured and weathered rocks – carbonate rocks
Carbonate rocks under the fractured and weathered rocks aquifer type have been identified separately
because they impart a very distinct water quality to the rocks. Carbonate rocks have the potential to

37
be karstic but karstic development has not been identified in the formations listed under this aquifer
category. Carbonate is present in the form of dolomite in the formations. Through detailed drilling
investigations around Ngukurr and Urapunga, aquifer characteristics of the carbonate formations in the
area were determined. (Sumner, 2008). It was found that a number of the carbonate formations
supplied higher yields compared with other carbonate formations. Hence fractured and weathered
carbonate rock aquifers are separated into two categories, distinguished by their difference in yield.
Fractured and weathered rocks – carbonate rocks (Yields 0.5-10L/s)
The Mount Birch Sandstone Sumner (2008) reports that an aquifer was intersected in the Mt Birch Sandstone on the northern side
of the Roper River in a weathered, coarse grained, feldspathic band amongst quartz sandstones. The
upper part of the sandstone exhibited poorer porosity due to silicification. The high pump test
yields, greater than 10 L/s, were considered sustainable as water level logging demonstrated a direct
connection between the bore in the feldspathic sandstone and the river (Sumner, 2008). On the
southern side of the river RN35728 was also drilled into the Mt Birch Sandstone and airlifted 10 L/s in
a similarly weathered sandstone (Plate 6.1).
Plate 6.1 Weathered sandstone from 15-18 m interval from RN 35728. Note the pore spaces.
Bores drilled into the Mt Birch Sandstone are located
either on or in close proximity to faults so fracturing
would be a major factor in these high yields. It was
notable that water quality tests showed high barium
levels in two bores drilled either side of the river:
RN35721 and RN35728. This is attributed to
mineralisation along fractures associated with the Mt
Birch Fault which cuts across the river and through the
Mt Birch Sandstone. It is possible that the high yields
are a localised phenomena associated with the river
and fault.
The contact zone between the Yalwarra Volcanics and the Knuckey Formation The Ngukurr region has been extensively investigated for groundwater in order to provide potable
water to Ngukurr. The most recent investigations were undertaken in 2007 in response to the
borefield supplying increasingly poorer quality water. The investigation concluded that the borefield,
located northwest of Ngukurr, was drawing in river water through saline paleochannels (Sumner,
2008). The aquifer that hosts the borefield is situated at the contact zone between the weathered
basal sandstones of the Yalwarra Volcanics and the weathered dolomite in the upper Knuckey
Formation (Figure 6.5). The investigations found that this was a major aquifer in the region. Yields
between 5-10 L/s were generally attained from this contact zone. Although the Knuckey Formation
contains dolomitic rocks, no evidence of karst development within the formation was found (Sumner,
2008).
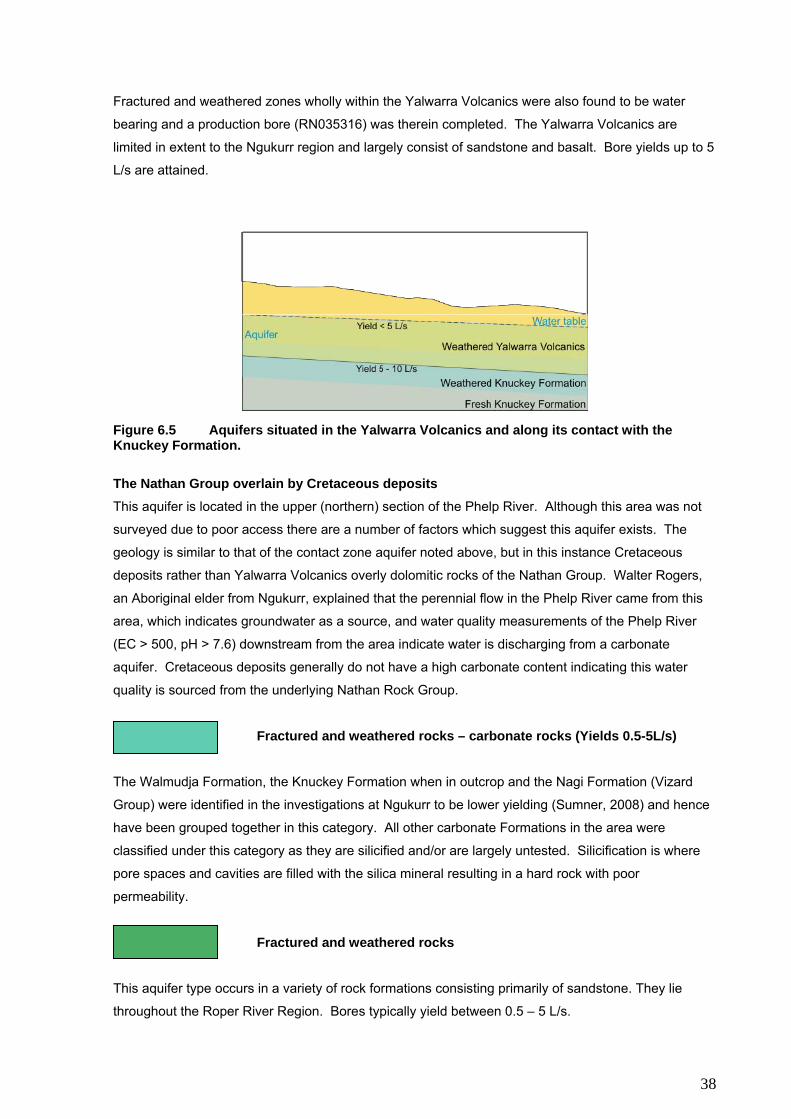
38
Fractured and weathered zones wholly within the Yalwarra Volcanics were also found to be water
bearing and a production bore (RN035316) was therein completed. The Yalwarra Volcanics are
limited in extent to the Ngukurr region and largely consist of sandstone and basalt. Bore yields up to 5
L/s are attained.
Figure 6.5 Aquifers situated in the Yalwarra Volcanics and along its contact with the Knuckey Formation.
The Nathan Group overlain by Cretaceous deposits This aquifer is located in the upper (northern) section of the Phelp River. Although this area was not
surveyed due to poor access there are a number of factors which suggest this aquifer exists. The
geology is similar to that of the contact zone aquifer noted above, but in this instance Cretaceous
deposits rather than Yalwarra Volcanics overly dolomitic rocks of the Nathan Group. Walter Rogers,
an Aboriginal elder from Ngukurr, explained that the perennial flow in the Phelp River came from this
area, which indicates groundwater as a source, and water quality measurements of the Phelp River
(EC > 500, pH > 7.6) downstream from the area indicate water is discharging from a carbonate
aquifer. Cretaceous deposits generally do not have a high carbonate content indicating this water
quality is sourced from the underlying Nathan Rock Group.
Fractured and weathered rocks – carbonate rocks (Yields 0.5-5L/s)
The Walmudja Formation, the Knuckey Formation when in outcrop and the Nagi Formation (Vizard
Group) were identified in the investigations at Ngukurr to be lower yielding (Sumner, 2008) and hence
have been grouped together in this category. All other carbonate Formations in the area were
classified under this category as they are silicified and/or are largely untested. Silicification is where
pore spaces and cavities are filled with the silica mineral resulting in a hard rock with poor
permeability.
Fractured and weathered rocks
This aquifer type occurs in a variety of rock formations consisting primarily of sandstone. They lie
throughout the Roper River Region. Bores typically yield between 0.5 – 5 L/s.

39
Five formations are mapped under this category. These are the Bessie Creek Sandstone, the
Bukalorkmi Sandstone, the Arnold Sandstone, the Hodgson Sandstone and the Bukalara Sandstone.
All these formations are old Proterozoic or Cambrian rocks which have become indurated (cemented)
so little primary porosity remains. The effects of weathering however, has developed secondary
permeability features in the rocks allowing aquifer development. Each aquifer is detailed following.
The Bessie Creek Sandstone From drilling investigations undertaken at Minyerri (Table 6.5) it was established that ‘aquifers exist at
the contact zone of the Bessie Creek Sandstone with the overlying Velkerri Formation and underlying
Corcoran Formation’ (Jamieson, 1992)(Figure 6.6). The latter was found to be the more productive of
the two aquifers. Most of the production bores were drilled through both aquifers so as to gain a
supply from each aquifer. Pump tests undertaken have recommended pump rates in these aquifers of
below 1 L/s. The Bessie Creek Sandstone was mapped under this aquifer category as an indication to
the location of the two contact zones. The Bessie Creek Sandstone can vary in thickness but is
generally less than 60 m in the map area. When drilling into the Bessie Creek Sandstone and only a
minimal supply is attained from the top contact zone it is worthwhile drilling through the Sandstone
(pending on the angle of dip/thickness) to target the lower contact zone aquifer.
Figure 6.6 Aquifers at the contact zone between the Bessie Creek Sandstone and the Velkerri and Corcoran Formations.
Table 6.5 Bores drilled into the Bessie Creek contact zone aquifers. (Jamieson, 1992) See
Appendix I for further bore details.
RN007322 RN008503 RN008504 RN022806 RN022807 RN022808 RN022809
RN023161 RN023162 RN023163 RN025383 RN026145 RN027901 RN027902
RN027905 RN027906 RN027907 RN027908 RN027909 RN027960 RN027961
The Bukalorkmi Sandstone The Bukalorkmi Sandstone was most likely encountered in RN35878, RN35879 and RN036300 under
about 100 m cover of shales and fine sandstone belonging to the Chambers River Formation. The
bores airlifted 5 L/s however pump tests undertaken on RN35879 and RN36300 recommended rates
at 0.7 and 0.5 L/s respectively. One bore likely to have been drilled into outcropping sandstone is
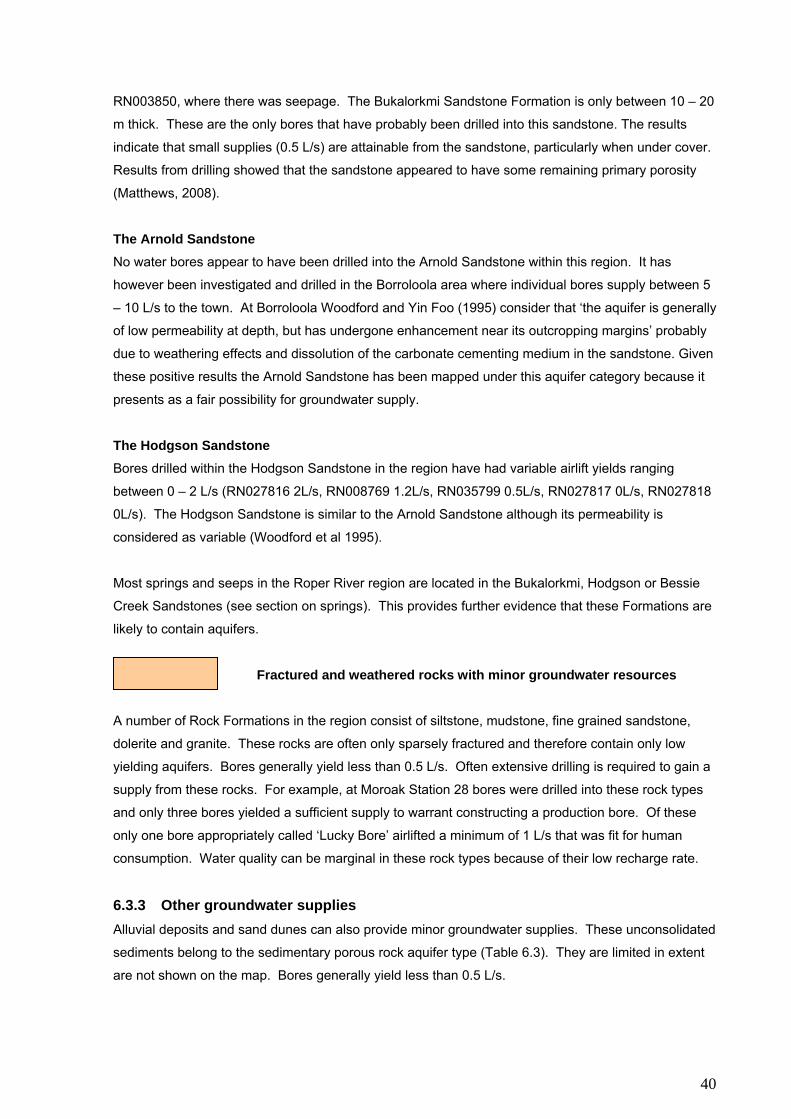
40
RN003850, where there was seepage. The Bukalorkmi Sandstone Formation is only between 10 – 20
m thick. These are the only bores that have probably been drilled into this sandstone. The results
indicate that small supplies (0.5 L/s) are attainable from the sandstone, particularly when under cover.
Results from drilling showed that the sandstone appeared to have some remaining primary porosity
(Matthews, 2008).
The Arnold Sandstone No water bores appear to have been drilled into the Arnold Sandstone within this region. It has
however been investigated and drilled in the Borroloola area where individual bores supply between 5
– 10 L/s to the town. At Borroloola Woodford and Yin Foo (1995) consider that ‘the aquifer is generally
of low permeability at depth, but has undergone enhancement near its outcropping margins’ probably
due to weathering effects and dissolution of the carbonate cementing medium in the sandstone. Given
these positive results the Arnold Sandstone has been mapped under this aquifer category because it
presents as a fair possibility for groundwater supply.
The Hodgson Sandstone Bores drilled within the Hodgson Sandstone in the region have had variable airlift yields ranging
between 0 – 2 L/s (RN027816 2L/s, RN008769 1.2L/s, RN035799 0.5L/s, RN027817 0L/s, RN027818
0L/s). The Hodgson Sandstone is similar to the Arnold Sandstone although its permeability is
considered as variable (Woodford et al 1995).
Most springs and seeps in the Roper River region are located in the Bukalorkmi, Hodgson or Bessie
Creek Sandstones (see section on springs). This provides further evidence that these Formations are
likely to contain aquifers.
Fractured and weathered rocks with minor groundwater resources
A number of Rock Formations in the region consist of siltstone, mudstone, fine grained sandstone,
dolerite and granite. These rocks are often only sparsely fractured and therefore contain only low
yielding aquifers. Bores generally yield less than 0.5 L/s. Often extensive drilling is required to gain a
supply from these rocks. For example, at Moroak Station 28 bores were drilled into these rock types
and only three bores yielded a sufficient supply to warrant constructing a production bore. Of these
only one bore appropriately called ‘Lucky Bore’ airlifted a minimum of 1 L/s that was fit for human
consumption. Water quality can be marginal in these rock types because of their low recharge rate.
6.3.3 Other groundwater supplies Alluvial deposits and sand dunes can also provide minor groundwater supplies. These unconsolidated
sediments belong to the sedimentary porous rock aquifer type (Table 6.3). They are limited in extent
are not shown on the map. Bores generally yield less than 0.5 L/s.

41
Aquifers can be found in alluvial deposits built up along rivers or on floodplains, particularly where
sediments consist of well rounded gravels and are well sorted (of similar size). RN028623, located
along the Roper River on Moroak Station, exploits an alluvial aquifer. The airlift yield from this bore
was 2 L/s with the river providing continuous recharge to the sediments. Bores drilled in alluvial
deposits have a low success rate because of their limited extent, variability in thickness, and gravel,
silt and sand content, making construction difficult.
Small supplies can be attained from aquifers in sand dunes. Although sand dunes or cheniers exist
within the map sheet they have not been drilled for water supply. Infiltration galleries rather than bores
are recommended for extracting water from sand dunes to ensure water quality is maintained. These
have been installed at Wuyagiba which is located along the coast just north of the map region.
As reported by station owners and managers of Elsey, Moroak, Flying Fox and Lonesome Dove
Stations, whilst digging dams at some locations the groundwater table was intercepted and the dam
filled with water without rain (Figure 6.7). A high water table at some locations has also been recorded
on some bore reports. Appendix I provides standing water levels of all
bores in the area. This is fortuitous, but it must be remembered that
water table level changes over time and we are currently experiencing
high groundwater levels due to a wet period.
Figure 6.7 Interception of water table by dam 6.4 Groundwater Quality Groundwater quality is effected by evapotranspiration of rainfall and rock type.
Rainwater contains salts. As rainwater moves down through the soil to the water table
evapotranspiration concentrates the salts. Salts are made up of ions. For example table salt (Sodium
Chloride) is made up of the ions Sodium and Chloride. Common ions used to describe water quality
are listed in Appendix J. If recharge is low then the salts can become so concentrated that the water
becomes unsuitable for human consumption. Low recharge can be due to low rainfall but it is also
related to rock type. Mudstones for example would have low recharge because the small particle size
of the rock allows little water through.
Rock type affects water quality because, as water moves through them, it picks up (dissolves) salts
from the surrounding rock. This process is particularly evident in limestone and dolomite because they
contain high amounts of calcium or magnesium carbonate which dissolve in acidic conditions (Plate
6.2) and our rainfall is naturally acidic. When these rocks dissolve, calcium, magnesium and
bicarbonate ions are released into the water. Hence groundwater rich in these ions has most likely
come from a limestone or dolomite formation.

42
Plate 6.2 A drop of acid dissolving limestone as shown by the fizz. This is a common field test for carbonate rocks.
6.4.1 Water quality measurements In order to describe the quality of water and its suitability for drinking or other use, a number of
parameters can be measured in the field and in the laboratory. One of these parameters is Total
Dissolved Solids (TDS) which is a measure of the saltiness of the water. It is usually described in
terms of the number of milligrams of salt in a litre of water (mg/L).
The Australian Drinking Water Guidelines (ADWG, 2004) define good quality drinking water for human
consumption from the perspective of health and aesthetics. The guidelines state that good drinking
water has a TDS of less than 500 mg/L, and that a TDS of 500 – 800 mg/L is fair. A TDS of greater
than 1000 mg/L is considered unacceptable. High TDS may be associated with excessive scaling,
and unsatisfactory taste. A simple way of estimating
TDS in the field is by measuring the water’s electrical
conductivity (EC). Salt present in the water will make it
more conductive for an electrical current, which can be
easily measured with a small field probe (Plate 6.3).
EC is measured in microSeimens per centimetre,
μS/cm. TDS is approximately equal to 0.6 x EC.
Plate 6.3 U.Zaar measuring the EC with a meter.
Water can also be described as being ‘hard’ or ‘soft’. ‘Hard’ water requires more soap to produce
suds than ‘soft’ water, and is generally associated with groundwater occurring in limestone and
dolomite aquifers. These aquifers contain calcium or magnesium rich waters. Water having more
than 150 mg/L calcium carbonate can deposit scale in pipes and water heaters under favourable
conditions.
Another parameter which can be easily measured in the field, and give an immediate indication of
water quality and suitability is pH. pH is a measure of the hydrogen ion concentration. Water is said
to be either acidic or alkaline, depending on the relative concentration of hydrogen ions. A pH of 7
indicates neutrality, a pH of less than 7 indicates an acidic water, and a pH of greater than 7 indicates
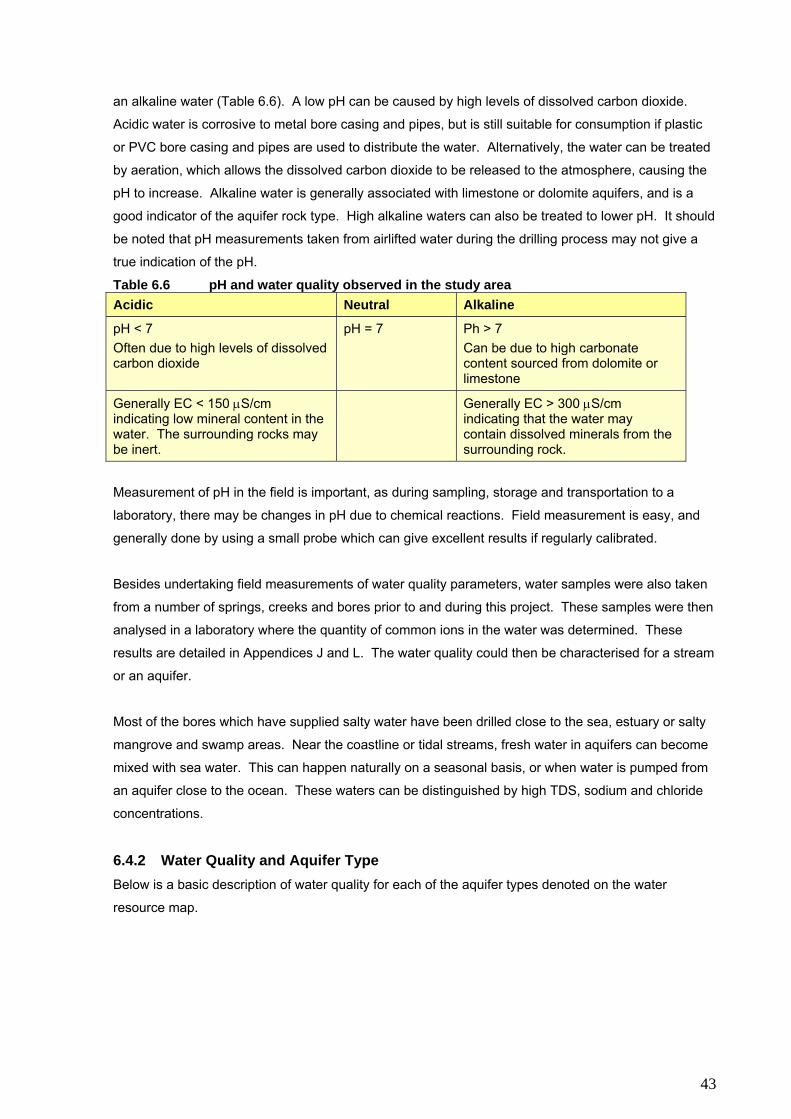
43
an alkaline water (Table 6.6). A low pH can be caused by high levels of dissolved carbon dioxide.
Acidic water is corrosive to metal bore casing and pipes, but is still suitable for consumption if plastic
or PVC bore casing and pipes are used to distribute the water. Alternatively, the water can be treated
by aeration, which allows the dissolved carbon dioxide to be released to the atmosphere, causing the
pH to increase. Alkaline water is generally associated with limestone or dolomite aquifers, and is a
good indicator of the aquifer rock type. High alkaline waters can also be treated to lower pH. It should
be noted that pH measurements taken from airlifted water during the drilling process may not give a
true indication of the pH.
Table 6.6 pH and water quality observed in the study area Acidic Neutral Alkaline
pH < 7 Often due to high levels of dissolved carbon dioxide
pH = 7 Ph > 7 Can be due to high carbonate content sourced from dolomite or limestone
Generally EC < 150 μS/cm indicating low mineral content in the water. The surrounding rocks may be inert.
Generally EC > 300 μS/cm indicating that the water may contain dissolved minerals from the surrounding rock.
Measurement of pH in the field is important, as during sampling, storage and transportation to a
laboratory, there may be changes in pH due to chemical reactions. Field measurement is easy, and
generally done by using a small probe which can give excellent results if regularly calibrated.
Besides undertaking field measurements of water quality parameters, water samples were also taken
from a number of springs, creeks and bores prior to and during this project. These samples were then
analysed in a laboratory where the quantity of common ions in the water was determined. These
results are detailed in Appendices J and L. The water quality could then be characterised for a stream
or an aquifer.
Most of the bores which have supplied salty water have been drilled close to the sea, estuary or salty
mangrove and swamp areas. Near the coastline or tidal streams, fresh water in aquifers can become
mixed with sea water. This can happen naturally on a seasonal basis, or when water is pumped from
an aquifer close to the ocean. These waters can be distinguished by high TDS, sodium and chloride
concentrations.
6.4.2 Water Quality and Aquifer Type Below is a basic description of water quality for each of the aquifer types denoted on the water
resource map.
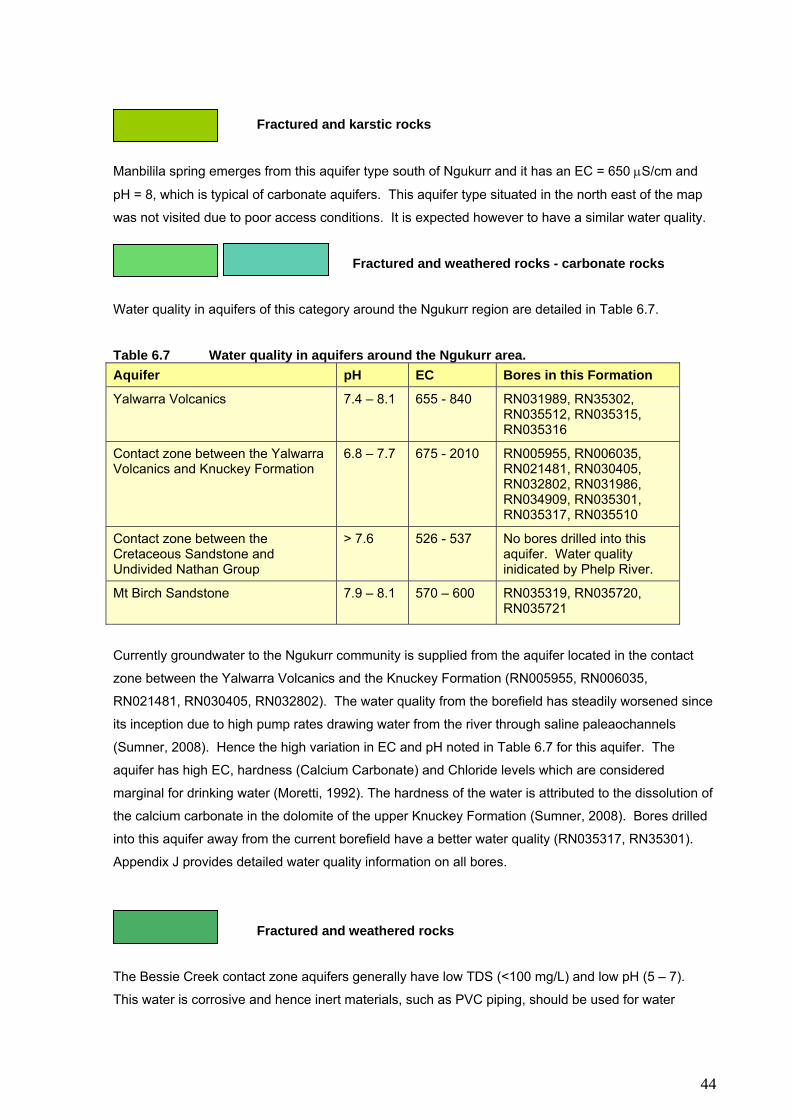
44
Fractured and karstic rocks
Manbilila spring emerges from this aquifer type south of Ngukurr and it has an EC = 650 μS/cm and
pH = 8, which is typical of carbonate aquifers. This aquifer type situated in the north east of the map
was not visited due to poor access conditions. It is expected however to have a similar water quality.
Fractured and weathered rocks - carbonate rocks
Water quality in aquifers of this category around the Ngukurr region are detailed in Table 6.7.
Table 6.7 Water quality in aquifers around the Ngukurr area. Aquifer pH EC Bores in this Formation
Yalwarra Volcanics 7.4 – 8.1 655 - 840 RN031989, RN35302, RN035512, RN035315, RN035316
Contact zone between the Yalwarra Volcanics and Knuckey Formation
6.8 – 7.7 675 - 2010 RN005955, RN006035, RN021481, RN030405, RN032802, RN031986, RN034909, RN035301, RN035317, RN035510
Contact zone between the Cretaceous Sandstone and Undivided Nathan Group
> 7.6 526 - 537 No bores drilled into this aquifer. Water quality inidicated by Phelp River.
Mt Birch Sandstone 7.9 – 8.1 570 – 600
RN035319, RN035720, RN035721
Currently groundwater to the Ngukurr community is supplied from the aquifer located in the contact
zone between the Yalwarra Volcanics and the Knuckey Formation (RN005955, RN006035,
RN021481, RN030405, RN032802). The water quality from the borefield has steadily worsened since
its inception due to high pump rates drawing water from the river through saline paleaochannels
(Sumner, 2008). Hence the high variation in EC and pH noted in Table 6.7 for this aquifer. The
aquifer has high EC, hardness (Calcium Carbonate) and Chloride levels which are considered
marginal for drinking water (Moretti, 1992). The hardness of the water is attributed to the dissolution of
the calcium carbonate in the dolomite of the upper Knuckey Formation (Sumner, 2008). Bores drilled
into this aquifer away from the current borefield have a better water quality (RN035317, RN35301).
Appendix J provides detailed water quality information on all bores.
Fractured and weathered rocks
The Bessie Creek contact zone aquifers generally have low TDS (<100 mg/L) and low pH (5 – 7).
This water is corrosive and hence inert materials, such as PVC piping, should be used for water

45
reticulation. With depths over 100 m the water quality is less corrosive as pH was above seven (7.3 –
8.2) but TDS also increased (up to 400 mg/L) (Jamieson et al., 1992). The water has a high iron and
moderate manganese content (Appendix J). This affects taste and causes staining of washing and
cookware.
The water from the Bukalorkmi Sandstone aquifer had a pH between 6.3 – 7.2 and EC between 264
and 399 μS/cm (Matthews, 2008). The Hodgson Sandstone has not been extensively drilled; water
quality analysis is provided for one bore, RN027816 which had a pH = 7.8 and EC = 820 μS/cm
showing suitability for drinking. The Arnold Sandstone has not been investigated in this map region. It
is however, considered similar to the Hodgson Sandstone. These two sandstones have been
extensively drilled at Borroloola (McArthur River map region) where the characteristic water quality
was pH 5.3 – 8.2 and EC 45 – 240 μS/cm. In general the main concern regarding water quality of
these sandstone aquifers is the corrosive nature of the water to metal reticulation.
Fractured and weathered rocks with minor groundwater resources
The water quality in these aquifers has a very wide variation and it is not unusual for the TDS to
exceed the guideline value, with rock type and poor recharge being the likely causes. For example, on
Moroak Station four of the 10 bores where water quality analysis was undertaken had unacceptably
high TDS (Appendix J). The high chloride content in the four bores indicated evapotranspiration (poor
recharge) as the mechanism for salt concentration.
Reviewing the water quality data available for the region (Appendix J), in general these aquifers have
a pH > 7 and EC > 500.
6.5 Recharge Recharge is where water is added to an aquifer. It is important to carefully manage areas where
recharge occurs to ensure groundwater quality is maintained. Recharge can be observed by
monitoring water levels in bores.
Recharge is where water is added to an aquifer (Figure 6.1). It occurs during the wet season.
Recharge amounts vary with rainfall, soil and geology. It occurs through three main mechanisms;
diffuse, point source and stream bed. Diffuse recharge is the widespread downward seepage of
rainwater, point source recharge occurs through an opening in the ground such as a sinkhole allowing
direct drainage to the aquifer, and stream bed recharge is where water drains from a stream to an
aquifer (the water level of the aquifer must be lower than river level for this to occur).
High rainfall usually results in better recharge. Recharge is indicated by the rise of groundwater levels
and can be observed in bores which are monitored. Currently there are no bores being monitored in
the Roper River map region but there is a little historic data available for Minyerri. In RN027906

46
(Figure 6.8) the groundwater level fell over the years 1995 to 1997 due to low rainfall, but with better
rainfall in 1998 and 1999 the groundwater level significantly increased. To better show how
groundwater level fluctuates with rainfall, continuous height data from RN029429 is shown in Figure
6.8. When rainfall is sufficient note how quickly recharge occurs in RN029429 and how the water level
slowly recedes over the dry season. Poor annual rainfall can result in no recharge and a continued
decline in water level from the previous year. Long term trends in rainfall can provide an indication of
variations in groundwater level (Figure 7.8).
Figure 6.8 Recorded water levels (from local ground level) in RN027906 at Minyerri and for comparison RN029429 at Tindall RAAF base over the years 1995 to 2002. Annual rainfall (mm) at Mataranka is shown as an indication of rainfall at Minyerri as no rainfall data is available for Minyerri for these years.
Recharge is affected by geology or rock type and soil type. The amount of water that reaches an
aquifer is dependent on the rock types or soils that overly the aquifer as well as the rocks that make up
the aquifer. Water moves through some rocks and soils better than others, that is, they have a better
permeability. Permeability is affected by the size and shape of the voids in the rock and how well the
voids are interconnected. A coarse sand, for instance, has a high permeability whereas a mudstone
or a poorly fractured granite has a low permeability. If a sand is overlain by a mudstone or clay, then it
will be poorly recharged, but if it is unconfined it will be better recharged (Figure 6.9). When an aquifer
is confined the recharge area can be restricted to the area where the rock is in outcrop (Figure 6.9).
Recharge areas should be managed to ensure water quality is maintained. For example, sewage
works should not be located over recharge areas. Recharge is often described as the amount of

47
rainfall entering an aquifer in mm/year or by the rise in water level in an aquifer in metres. Up to 20%
of annual rainfall results in groundwater recharge.
Figure 6.9 Recharge to a confined and unconfined aquifer.
The sustainable yield of an aquifer can be considered as that amount that can be extracted from an
aquifer without adversely affecting the environment and reducing the average groundwater level in
that aquifer. In other words the extraction rate should be less than the average recharge rate. Hence
the importance of determining recharge rates.
When detailed water resource investigations are carried out recharge and permeability values are
determined. Appendix B provides a summary of the results of such investigations for Minyerri and
Ngukurr.
6.6 Groundwater discharge and dependent ecosystems All isolated springs in the map area maintain lush vegetation pockets which are refuges for wildlife.
These are groundwater dependent ecosystems.
One way groundwater discharges is through springs. Springs and seeps are marked on the water
resource map. Manbilila spring located south-west of Ngukurr is a localised spring as it discharges
from one point but groundwater can also discharge as diffuse flow along a river bed. Diffuse or
streambed seepage is where a stream cuts through an aquifer allowing water to drain into the stream.
The area of drainage forms the discharge zone, which is marked by a gradual downstream increase in
river flow. Another less obvious way in which groundwater discharges is through evapotranspiration.
Plants can tap into groundwater when it is shallow enough and similarly groundwater can be directly
evaporated through the soil when it is within metres of the surface.
Springs occur where the water table is at or above the ground surface. They can be permanent
(perennial) or periodic (ephemeral) due to fluctuations in the local water table. Invariably denser
vegetation communities (ie rainforests) occur at these springs. Such communities are dependent on

48
groundwater. Riparian (riverbank) vegetation can also be reliant on groundwater although it may not
be situated in a spring area. O’Grady et al. (2002) in their study along the Daly River found Silver-
leaved Tea Tree (Melaleuca argentea) and Freshwater Mangrove (Barringtonia acutangula) were
associated with river banks with shallow water tables and were shown to be reliant on groundwater.
O’Grady et al. (2002) state that ‘further work is required to fully assess the level of groundwater
dependency and the environmental flow requirements of riparian vegetation’.
Localised springs and streambed seepages located outside of the map area provide perennial flow to
the upper Roper and Wilton Rivers. Water loving ecosystems have flourished along these rivers and
can be considered dependent on the groundwater. Rainforest vegetation communities associated
with riparian zones and springs have been mapped throughout the Top End (Russell-Smith, 1991) and
are shown on the Water Resource maps. These are likely groundwater dependent ecosystems.
The lack of spring discharges in the map region reflect the generally low recharge rates in aquifers
with low permeability and storage capacity. Most springs in the region discharge less than 10 L/s by
the end of the Dry. Four types of springs have been recognised in the mapped region and an
overview is provided below.
Contact Spring
Figure 6.10 Springs resulting from a more permeable rock overlying a less permeable rock.
Plate 6.4 Example of a contact spring: Seep discharging from the Hodgson Sandstone which overlies the impervious dolerite. The spring is marked by the lusher vegetation. (Google Earth)
This type of spring arises where a more permeable rock such as sandstone, lies above a less
permeable rock such as siltstone or dolerite (Figure 6.10). Water stored in the upper layer seeps out
at the contact between the two rock types because it is unable to penetrate into the lower layer. This
is generally in the form of a seepage zone or swampy area at the contact. Seepage over an area will
eventually coalesce to form a creek. Occasionally there will be a discrete spring or permanent
waterhole. These springs are often seen at the base of escarpments and provide water to rainforest
pockets (Plate 6.4).

Plate 6.5 Vegetation flanking Bukalorkmi sandstone escarpment. (Google Earth)
Depression Spring
Figure 6.11 Spring emerging from a low point in the landscape.
Karst Spring
Figure 6.12 Spring discharge from a karstic aquifer
At times the groundwater in sandstone
escarpments does not break out in the form of a
spring but comes close to the surface. These
areas are often marked with lusher vegetation as
tree roots find their way to the watertable (Plate
6.5). Such vegetation can effectively be
considered a groundwater dependent ecosystem.
This type of spring results when the water table is
intersected by a low point in the landscape such
as a valley or creek bed allowing drainage to
occur from the surrounding rock, such as
fractured and weathered sandstone (Figure 6.11).
Sometimes the low point in the landscape is
resultant of a fracture or fault and the aquifer can
be very localised to that feature. Locating faults
and fractures often requires specialist advice. Not
all bores drilled in fractures will yield a water
supply. The springs can be a temporary feature
after periods of good rainfall.
In this spring type the aquifer that feeds the spring
is developed in the more permeable underlying
rock, and in this particular case that rock is
dolomitic. Acidic recharge waters dissolve the
dolomite resulting in karstic development such as
caverns and sinkholes allowing an aquifer to
develop. The spring emerges where the dolomite
outcrops.

50
Fault Spring This type of spring occurs when a geological
fracture or fault provides a pathway to allow
groundwater to rise to the surface, in areas
where it is normally confined beneath a low
permeability rock. Sometimes hot water
emerges from these springs because they are
sourced from some depth below the surface.
Figure 6.13 Spring discharge from a fault. 6.6.5 Occurrence of springs Contact and depression springs occur in the Bukalorkmi, Hodgson, Bessie Creek and Bukalara
Sandstones. There is some void space in these sandstones, due to fractures and weathering, but
since the voids are only small, only a small amount of water is able to be stored and can only move
through slowly. In other words it has a low permeability. This means that the springs that emerge
from these sandstones have small discharges. Examples follow.
The Bukalorkmi Sandstone
Plate 6.6 Spring fed waterhole which supplies Roper Valley
At Roper Valley Station springs emerge from the
Bukalorkmi Sandstone which lies above the Kyalla
Formation (siltstone and mudstone). The springs
maintain a waterhole which supplies Roper Valley
Station (Plate 6.6). In September 2007, discharge
was less than 1 L/s with an EC = 50µS/cm. The
Bukalorkmi Sandstone is also present on Flying Fox
Station where seeps emerge from the escarpment
and maintain small rainforest pockets. In fact it is
the lusher vegetation around a seep that provides an
indication of its existence.
The Hodgson Sandstone The Hodgson Sandstone overlays the Jalboi Formation which consists of fine grained sandstone and
siltstone. Angus Spring and the springs at Jawa discharge from the Hodgson Sandstone (Plate 6.8).
At Jawa discharge in one channel was estimated at 1 L/s in September, 2007 with an EC = 34µS/cm
(Plate 6.7). There are many seeps associated with this sandstone in the Roper River region.
$
$
$
¥ Spring
FAULTAQUIFER(eg dolomite)
NON-AQUIFER(egshale)
watertable
water moves up fault-line
$
$
$
¥ Spring
FAULTAQUIFER(eg dolomite)
NON-AQUIFER(egshale)
watertable
water moves up fault-line
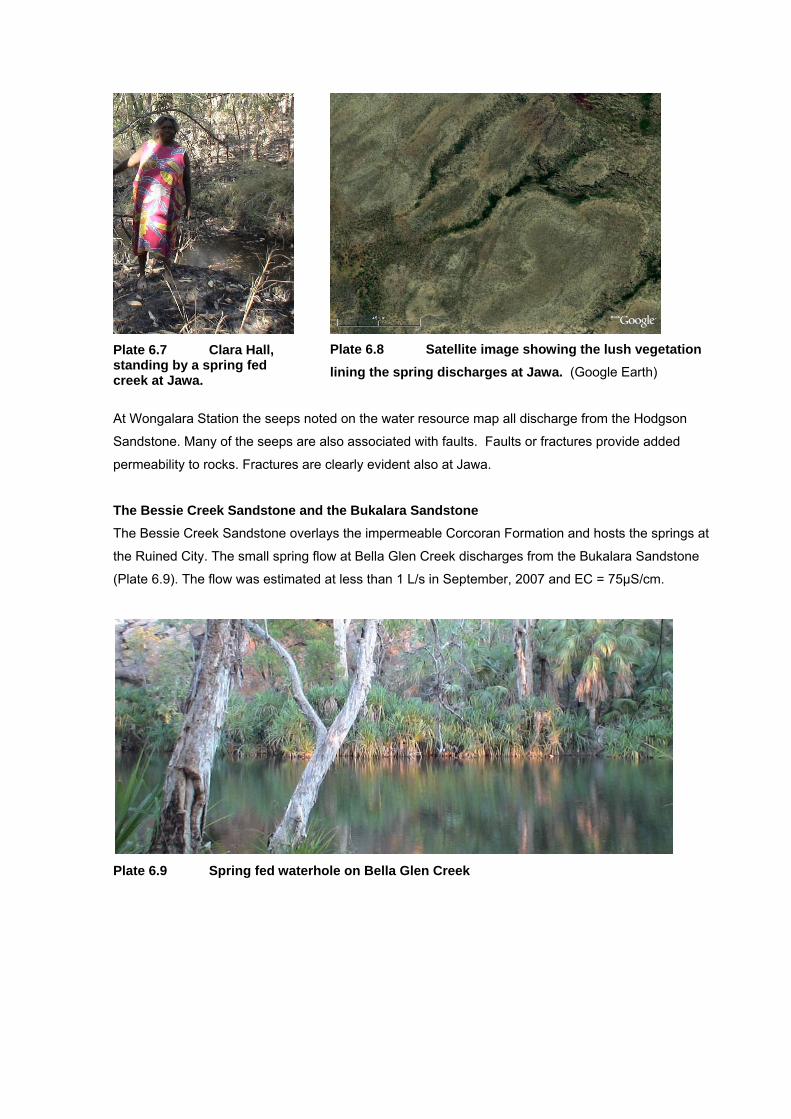
Plate 6.7 Clara Hall, standing by a spring fed creek at Jawa.
Plate 6.8 Satellite image showing the lush vegetation lining the spring discharges at Jawa. (Google Earth)
At Wongalara Station the seeps noted on the water resource map all discharge from the Hodgson
Sandstone. Many of the seeps are also associated with faults. Faults or fractures provide added
permeability to rocks. Fractures are clearly evident also at Jawa.
The Bessie Creek Sandstone and the Bukalara Sandstone The Bessie Creek Sandstone overlays the impermeable Corcoran Formation and hosts the springs at
the Ruined City. The small spring flow at Bella Glen Creek discharges from the Bukalara Sandstone
(Plate 6.9). The flow was estimated at less than 1 L/s in September, 2007 and EC = 75µS/cm.
Plate 6.9 Spring fed waterhole on Bella Glen Creek

52
Karst springs are likely to occur in the areas marked with aquifer type ‘Fractured and Karstic Rocks’.
In these areas the aquifer has developed in the connected cavities of the dolomitic Nathan Rock group
which lies beneath the Phelp Sandstone. Manbilila spring is the largest spring in the Roper River
Region. The spring may be an example of a karst spring however because it is located at the
intersection of several faults it could be a combination
of a karst spring and fault spring. It is possible that in
this region the faults have not only enhanced the
permeability of the aquifer but also provided a conduit
for groundwater to flow from this aquifer and converge
at Manbilila spring. The spring supplies water to
Larrpanyanji outstation and discharges to Tollgate
Creek. In September 2007 it was discharging 118 L/s
with a typical dolomitic water quality (EC=649μS/cm).
Plate 6.10 Manbilila Spring.
Although not visited by the survey team, the spring called Wamarlirr that Stephen Roberts describes
as being so hot that you can make tea from it is likely to be an example of a fault spring. Stephen
explained it was located near Peter Yard and indeed a number of faults are located in this area.
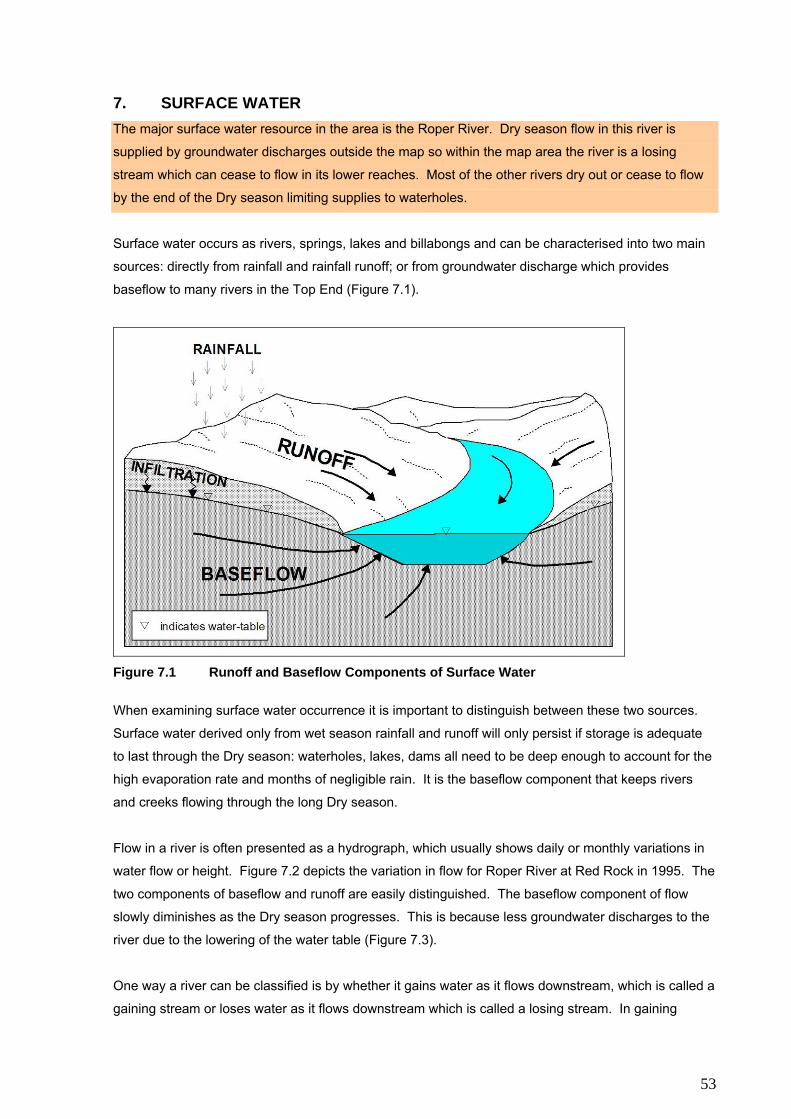
53
7. SURFACE WATER The major surface water resource in the area is the Roper River. Dry season flow in this river is
supplied by groundwater discharges outside the map so within the map area the river is a losing
stream which can cease to flow in its lower reaches. Most of the other rivers dry out or cease to flow
by the end of the Dry season limiting supplies to waterholes.
Surface water occurs as rivers, springs, lakes and billabongs and can be characterised into two main
sources: directly from rainfall and rainfall runoff; or from groundwater discharge which provides
baseflow to many rivers in the Top End (Figure 7.1).
Figure 7.1 Runoff and Baseflow Components of Surface Water
When examining surface water occurrence it is important to distinguish between these two sources.
Surface water derived only from wet season rainfall and runoff will only persist if storage is adequate
to last through the Dry season: waterholes, lakes, dams all need to be deep enough to account for the
high evaporation rate and months of negligible rain. It is the baseflow component that keeps rivers
and creeks flowing through the long Dry season.
Flow in a river is often presented as a hydrograph, which usually shows daily or monthly variations in
water flow or height. Figure 7.2 depicts the variation in flow for Roper River at Red Rock in 1995. The
two components of baseflow and runoff are easily distinguished. The baseflow component of flow
slowly diminishes as the Dry season progresses. This is because less groundwater discharges to the
river due to the lowering of the water table (Figure 7.3).
One way a river can be classified is by whether it gains water as it flows downstream, which is called a
gaining stream or loses water as it flows downstream which is called a losing stream. In gaining

54
streams water is often sourced from groundwater discharging as springs or as diffuse flow (see
section 6.6). In losing streams water is often lost through evaporation and transpiration. The Roper
River, Wilton River and Flying Fox Creek are losing streams in the mapped area.
Figure 7.2 Discharge hydrograph in the Roper River at Red Rock G9030250 in 1995.
High water table = large flow in river Low water table = low flow in river Figure 7.3 Effect of Water Table Level on River Flow (Adapted from Fetter, 1994)
7.1 How surface water sites are recorded All NRETAS surface water sites have a unique ‘gauge station’, ‘G’ number and name eg. G9030250
Roper River at Red Rock. A listing of all the NRETAS surface water sites within the mapped area is
provided in Appendix K. The amount of data collected at each site can vary greatly: from one water
quality record to detailed water level and quality records over several decades.
Dept Nat Resources, The Arts & Sport HYPLOT V132 Output 23/01/2009
Period 1 Year Plot Start 00:00_01/01/1995 1995Interval 12 Hour Plot End 00:00_01/01/1996
G9030250 Roper Ri @ Red Rock140.00 Max & Min Discharge (Cumecs)
0.1
1
10
100
1000
Jan Feb Mar Apr May Jun Jul Aug Sep Oct Nov Dec
Runoff component
from rainfall
Baseflow component from groundwater

55
The surface water sites marked with a ‘G’ number on the map include:
• Gauging stations where river height has been continuously recorded and flow measurements
made. (See Glossary)
• Gauge sites where a number of flow measurements have been made
• Springs where water quality and flow measurements have been made
• Permanent waterholes where water quality measurements have been made.
The continuous height record generally spans from 1963 to 1986 (See Appendix K for details).
G9030250 Roper River at Red Rock is the only site in the map area where river level is still
continuously recorded. The tidal limit of the river is approximately 8 km downstream from G9030250 at
Roper Bar. Here the river is subject to water level changes due to tidal influences but is normally not
salt water. Usually the water begins to become brackish another 70 km further downstream from
Roper Bar. G9030250 is therefore a key site on the river as it provides height and flow data at the
lowest reach of the river above the influence of the tide. Similarly G9030012 Roper River Police
Station2 is a key site as it was located just upstream from Roper Bar.
7.2 River Catchments …I observed a green belt of trees … and on riding towards it, I found myself on the banks of a large
fresh water river from 500 to 800 yards broad, with not very high banks…The water was slightly
muddy, as if a fresh had come down the river; and the tide rose full three feet. It was the river Mr.
Roper had seen two days before, and I named it after him… Ludwig Leichhardt (1847)
The Roper River catchment dominates this map. The map covers approximately one third of the
entire surface water catchment of the Roper River centred on the lower reaches of the river including
Figure 7.4 Roper River and tributary location map. Gaining, losing and tidal sections of the Roper river. 2 In the early years flow and level measurements were made at G9030012, but this site was abandoned and replaced by G9030250 for this lower stretch of the river from 1966.

56
its estuary and mouth. Areas of other smaller catchments are represented in the south-east of the
map; the Towns River and the Limmen Bight River. Little surface water information is available on
these smaller catchments, which by the end of the dry season contain little if any flowing water.
Within the map area, only the upper reaches of the Roper River are perennial whilst most of the
adjoining tributaries cease to flow in most years. These tributaries include Maiwok Creek, Hodgson
River, Flying Fox Creek, Jalboi River and Wilton River (Figure 7.4). Of these, the Flying Fox Creek
and the Wilton River can continue to flow throughout the year in wet eras. Flow data for the site on the
Wilton River G9030146 and Hodgson River G9030102 is presented in Appendix K. Perennial
tributaries in the region, Tollgate Creek and Phelps River have limited flow measurements (Appendix
K). These two rivers are perennial in their upper reaches buttheir flow does not always reach the
Roper River.
7.3 Availability of river water 7.3.1 Mapping minimum baseflows To gain a perspective on water availability from a river, it is necessary to examine the variability in
annual minimum flow at sites along a river over the years. This work has only been undertaken for the
Roper River, in section 7.3.3, because of its perennial reaches and good data availability. Most of the
adjoining tributaries within the mapped region cease to flow in most years. To provide an overview of
water availability all rivers on the Water Resources map have been plotted according to their minimum
flow, thereby reflecting the environment at its driest. It is intended to raise awareness of how supplies
from these rivers can be limited. In cases where there was little recorded data, site visits, flow
gaugings and local knowledge were used to determine minimum flows. Local knowledge proved vital
to this task as this project was conducted during a period of above average rainfall and higher than
minimum flows were observed in most rivers. The minimum flow categories of some rivers have been
estimated from anecdotal evidence or scientific interpretation, as not all sites could be visited during
the project duration. There are four categories of minimum flow shown on the water resource map:
River with a minimum flow of 100 L/s at the end of the Dry season
Only the upper Roper River is listed under this
category. The river section shown on the Water
Resource map is dominated by braiding.
Plate 7.1 Roper River adjacent to Moroak Station. Rodney Metcalfe measuring the flow at site G9030123.

57
River with a minimum flow between 10 and 100 L/s at the end of the Dry season
Tollgate Creek, the upper Phelp River, the upper
Wilton River and a section of the Roper River are
marked under this category.
Plate 7.2 Tollgate Creek
River with permanent waterholes or flows up to 10 L/s at the end of the Dry season
Rivers in this category have potential to provide small
supplies. It includes rivers which cease to flow, but
maintain permanent waterholes which can provide a
supply throughout the year. The lower reaches of the
Wilton and Roper Rivers have been included in this
category because in drier periods they cease to flow.
Plate 7.3 Wilton River
River which is dry at the end of the Dry season
These rivers are not suited to supply water reliably
throughout the year. Although most of the rivers in
this category are dry by the end of the Dry season
some of them may continue to flow throughout the
year after periods of average and above average
rainfall, but will dry out in drier times. Rivers which
can have long stretches of dry riverbed with only the
occasional waterhole are also marked under this
category. Where possible these isolated permanent
waterholes are marked on the map.
Plate 7.4 Turkey Lagoon Creek

The water resource map is dominated by rivers which are dry or have permanent waterholes or flows
up to 10 L/s by the end of the Dry season. This reflects the major aquifer type in the region, that being
‘Fractured and Weathered Rocks’. These aquifers have low yields and hence supply minimal
groundwater discharges to rivers which drain from them.
7.3.2 Baseflow Water Quality Baseflows of major rivers within the map sheet are sourced from carbonate aquifers which lie outside
of the map sheet. The baseflow in the Roper River is sourced from the Tindall Limestone aquifer, and
the Wilton River and Flying Fox Creek (when flowing) source their baseflow from the Dook Creek
Formation which is a dolomitic Formation. The baseflows of the Phelp River and Tollgate Creek are
also sourced from carbonate aquifers. The baseflow water quality for these rivers reflect their
carbonate content with pH > 7and EC >300µS/cm. Water quality details of sites along each river are
provided in Appendix L. Baseflow water quality readings are those undertaken in the Dry season.
7.3.3 The Roper River There is a foreseeable high demand for groundwater in the Mataranka region by horticulturists for
irrigation. It is this groundwater, that discharges from the Tindall Limestone aquifer, that provides
baseflow to the Roper River. It follows that if you extract the groundwater then there is less supply to
the river. In order to establish how much water can be made available for extraction, first the
dynamics of the river and the ecosystems that depend on it must be understood. We need to ask:
how much water is required to maintain this healthy river system? To make a start to answering this
question we need to know:
• How much water is used by the natural environment along the river and
• What happens if there is less flow in the river?
The answers to these questions is discussed following.
Environmental flow losses along the Roper River (Baseflow variation along the Roper River) Around Mataranka the Roper River is a gaining stream however once the river no longer crosses the
Tindall aquifer (on Elsey station) there are no further groundwater discharges to the river and the river
becomes a losing stream (Figure 7.4). In wetter years some tributaries do add flow to the river
downstream from Elsey station, but overall the river continues to loose flow. The amount of flow loss
to the environment in sections of the river can be calculated because flow has been measured at sites
along the river between Mataranka and Red Rock in a number of years. Table 7.1 provides the data
for the driest periods when flow gaugings have been undertaken. Note the increase in flow between
Mataranka G9030176 and Elsey Station G9030013, and then how flow decreases. The data shows
that when flow is about 1 m3/s at Mataranka G9030176 or 2.5 m3/s at Elsey G9030013, there is no
flow at Red Rock G9030250 or Police Station G9030012, and when flow falls below 2.5 m3/s at Elsey
then no flow occurs further upstream of Red Rock. One report from 1970 (Water Resources file;
G9030123, F213) states:
3 F21 denotes the Folio or page number in the file. Files are kept by NRETAS.
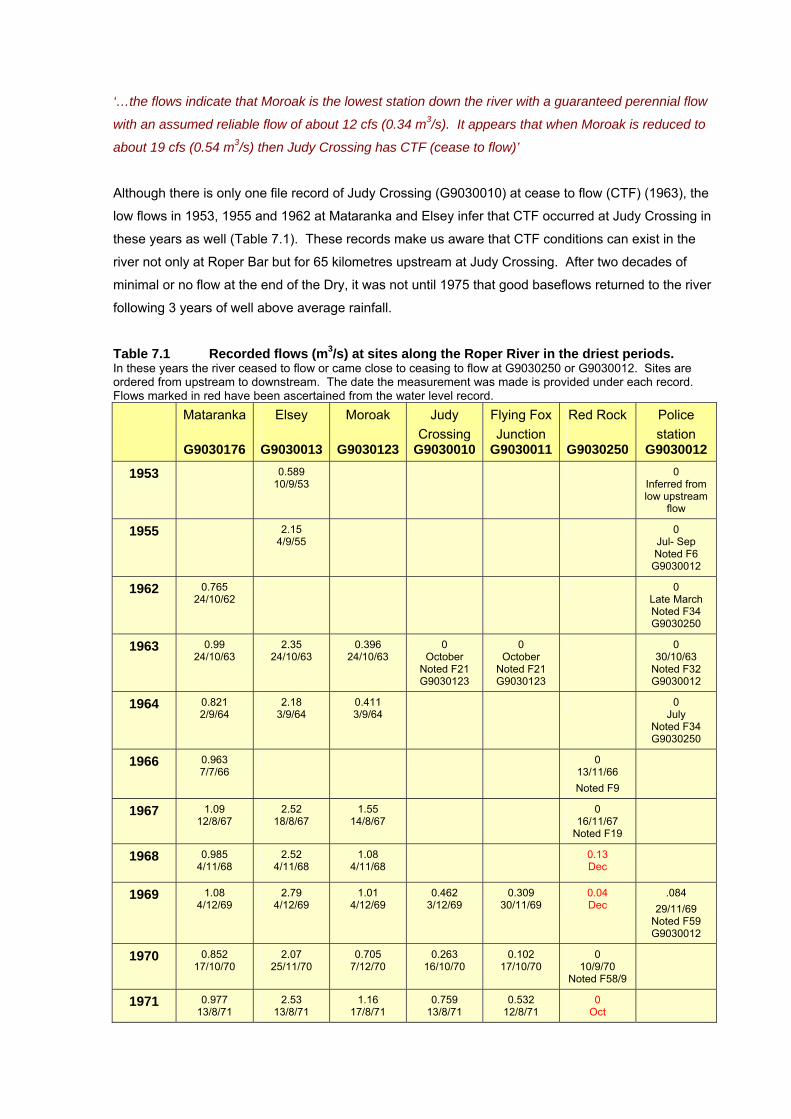
‘…the flows indicate that Moroak is the lowest station down the river with a guaranteed perennial flow
with an assumed reliable flow of about 12 cfs (0.34 m3/s). It appears that when Moroak is reduced to
about 19 cfs (0.54 m3/s) then Judy Crossing has CTF (cease to flow)’
Although there is only one file record of Judy Crossing (G9030010) at cease to flow (CTF) (1963), the
low flows in 1953, 1955 and 1962 at Mataranka and Elsey infer that CTF occurred at Judy Crossing in
these years as well (Table 7.1). These records make us aware that CTF conditions can exist in the
river not only at Roper Bar but for 65 kilometres upstream at Judy Crossing. After two decades of
minimal or no flow at the end of the Dry, it was not until 1975 that good baseflows returned to the river
following 3 years of well above average rainfall.
Table 7.1 Recorded flows (m3/s) at sites along the Roper River in the driest periods. In these years the river ceased to flow or came close to ceasing to flow at G9030250 or G9030012. Sites are ordered from upstream to downstream. The date the measurement was made is provided under each record. Flows marked in red have been ascertained from the water level record.
Mataranka
G9030176
Elsey
G9030013
Moroak
G9030123
Judy Crossing
G9030010
Flying Fox Junction
G9030011
Red Rock
G9030250
Police station
G9030012
1953 0.589 10/9/53
0 Inferred from low upstream
flow
1955 2.15 4/9/55
0 Jul- Sep Noted F6
G9030012
1962 0.765 24/10/62
0 Late March Noted F34 G9030250
1963 0.99 24/10/63
2.35 24/10/63
0.396 24/10/63
0 October
Noted F21 G9030123
0 October
Noted F21 G9030123
0 30/10/63
Noted F32 G9030012
1964 0.821 2/9/64
2.18 3/9/64
0.411 3/9/64
0 July
Noted F34 G9030250
1966 0.963 7/7/66
0 13/11/66 Noted F9
1967 1.09 12/8/67
2.52 18/8/67
1.55 14/8/67
0 16/11/67
Noted F19
1968 0.985 4/11/68
2.52 4/11/68
1.08 4/11/68
0.13 Dec
1969 1.08 4/12/69
2.79 4/12/69
1.01 4/12/69
0.462 3/12/69
0.309 30/11/69
0.04 Dec
.084 29/11/69
Noted F59 G9030012
1970 0.852 17/10/70
2.07 25/11/70
0.705 7/12/70
0.263 16/10/70
0.102 17/10/70
0 10/9/70
Noted F58/9
1971 0.977 13/8/71
2.53 13/8/71
1.16 17/8/71
0.759 13/8/71
0.532 12/8/71
0 Oct

All recession (low flow) gaugings undertaken at successive sites along the Roper River are provided in
Table C1 (Appendix C). An overview of baseflow variation over the years is shown in Figure 7.5: note
the large differences in flow between 1963 and 2007. In 2007 and 2008 the flow at Roper Bar did not
drop below 2 m3/s. These are the largest annual minimum flows recorded at Red Rock and Roper Bar
(Appendix C).
Figure 7.5 Measured discharge in m3/s (cumecs) in the Roper River catchment in 1963 (October), 1986 (May-June) and 2007 (November).
Analysis of flow losses and environmental water use in sections of the Roper River To improve our understanding of flow losses and environmental water use along the Roper River each
section of the river between gauge sites was analysed separately. Regression analysis of flow
between two gauge sites (x was the upstream site and Y the downstream site) was undertaken. The
y-intercept from the regression analysis can provide an estimate of the loss between each section.
The average difference in flow was also calculated (Appendix D). In analysing all the available low
flow data as listed in Table C1 (Appendix C), two distinct groups emerge (Figure D1); 1963 – 1991
data in which the average rainfall is equivalent to the long term average rainfall, and 2007 – 2008 data
which was part of an extremely wet period which ran from 1997-2008 (Table D1, Appendix D). Data
analysis was undertaken for each period separately. Table 7.2 provides a summary of the results for
the 1963-1991 period only, as it better reflects the characteristics of the environment under average
conditions. A detailed discussion of results for each river section for each period is provided in
Appendix D.
As water flows along the river it is evaporated from the surface and used by riparian vegetation
through transpiration. As riparian vegetation typically occurs as a relatively thin strip close to the river,

61
the water lost to evaporation can provide an estimate of the environmental losses (Table 7.2). This can
then be compared to the actual flow losses. Losses due to stock and domestic use were not
considered here as it would have minimal impact on the flow.
Table 7.2 Losses between gauging sites on the Roper River (m3/s). Statistics calculated on gaugings undertaken between 1963 to 1991. Details provided in Appendix D. River Section: A
Elsey - Moroak
B Moroak - Judy Crossing
C Judy Crossing - Upstream Flying Fox junction
D Downstream Flying Fox junction - Red Rock
Total Elsey- Moroak
Regression Analysis:
Y-intercept (m3/s) -1.51 -0.34 -0.12 -0.31 -2.28
Gradient 1.03 0.93 0.83 1.26
R squared 0.72 0.94 0.91 0.97
Average difference in measured flow (m3/s) -1.42 -0.47 -0.25 -0.16 -2.3
Evaporation calculation
Approximate distance between sites(km) 55 40 41 35
Estimated river width (m) 60 60 60 60
Evaporation loss at 7mm/day over section (m3/s) -0.3 -0.2 -0.2 -0.2
Evaporation loss due to Wetland (m3/s) -0.9
Total Evaporation loss (m3/s) -1.2 -0.2 -0.2 -0.2 -1.8
Comment Large wetland followed by braids for 2/3 of the section
Well braided in about 1/3 of this section
Well braided in about 1/3 of this section
Two main channels in upstream part of section
Between the Elsey and Moroak sites there is a large wetland situated north and south of Red Lily
Lagoon. Evaporation losses from this wetland are significant and have been estimated at 0.9 m3/s
(Appendix D). The results in Table 7.2 show that evaporation can account for most of the loss in flow
between each river section. The evaporation estimate is particularly similar to the average decrease
in measured flow for sections A, C and D. Section B shows greater disparity however this could be
due to the effects of braiding (See Appendix D). An areal overview of measured loss and estimated
evaporation loss between sites is provided in Figure 7.6. The total evaporation loss (-1.8 m3/s) is
close to the total average difference in measured flow (-2.3 m3/s) and the total loss based on the
regression analysis intercepts (-2.28 m3/s). Considering measurement errors, extra losses to

62
transpiration and estimates in the evaporation calculations (evaporation rate, estimated river length
and width, braiding), the calculations do provide evidence that evaporation is the primary cause for the
decreasing flow along the river. In summary, the natural environment through evaporation and
transpiration can account for the 2.3 m3/s decrease in flow in the Roper River between Elsey Station
and Red Rock.
Figure 7.6 Average measured loss and estimated evaporation loss between gauging sites on the Roper River. (Assuming one river channel)
In each section between Moroak and Red Rock the flow losses are higher in the wet period compared
to the average rainfall period (Appendix D). Put simply, the higher the flow the higher the loss. This
may be due to the river spilling over into more channels in the braided sections of the river when flow
is greater resulting in a greater water surface area and higher evaporation losses.
Baseflow variation in the Roper River at Red Rock The previous section detailed how flow varied along the Roper River between Elsey and Red Rock.
This section examines how low flow has varied at one site, that being Red Rock, over the years. This
site is well placed in providing annual minimum flow information for the river as it is located
approximately 10 kilometres upstream of the tidal section of the Roper River. The variability in
minimum flow is important when determining how much water is available to be extracted from the
river. The gauging station at Red Rock has a long height and flow record dating back to 1967. The
continuous record of flow4 for this site is provided in Figure 7.7 which shows that in the late 60’s and
early 70’s the Roper River at the site either ceased to flow or had a low minimum flow, whereas in the
late 90’s and early 2000’s it had a high annual minimum flow, mostly over 1 m3/s. This variation is due
to variations in rainfall.
4 Continuous flow record isobtained from translation of continuous height record at G9030250 by use of a (rating) table which relates height to flow. The table is produced from actual flow measurements and height records.

63
Dept Nat Resources, The Arts & Sport HYPLOT V132 Output 27/04/2009
Period 44 Year Plot Start 00:00_01/01/1966 1966-10Interval 1 Month Plot End 00:00_01/01/2010
G9030250 Roper Ri @ Red Rock140.00 Max & Min Discharge (Cumecs)
0
1
2
3
4
5
1966-75 1976-85 1986-95 1996-05
Figure 7.7 Flow in the Roper River at Red Rock GS9030250 since 1967.
In years of high rainfall, such as the late 90’s, there was better recharge to the Tindall aquifer resulting
in higher groundwater levels, thereby providing higher baseflows and minimum annual flows to the
Roper River. This rainfall5 – groundwater level – minimum annual river flow relationship is depicted in
Figure 7.8. The 5 year moving average6 of rainfall is provided in the figure to smooth out the year by
year fluctuations and show the trend clearly. Because no long term groundwater level data is
available for the Tindall aquifer at Mataranka, levels from RN022006 which is situated in the aquifer,
although in the Venn district, are shown in the figure (See also Appendix F). Note how the trend in
rainfall parallels the variation in recorded groundwater level in RN022006 and the recorded minimum
river flow at Red Rock. The cumulative effect of high rainfall and recharge since the 90’s has resulted
in exceptionally high groundwater levels and minimum flows in the 21st century.
As part of the Gulf Water Study a computer based water resource (integrated surface water –
groundwater) model was developed which models the surface water and groundwater resources, and
their interplay, in the entire Roper River catchment. This work is described in Knapton (2009). The
model can predict groundwater level and river flow based on rainfall. Predictions from the model are
provided in Figure 7.8 for the available rainfall record thereby providing a historical perspective. Note
how well predicted and observed values coincide.
5 Mataranka rainfall obtained from Bureau of Meteorology Data Drill rainfall data for Mataranka location. Details are provided in Appendix 3. 6 The 5 year moving average rainfall for year X = sum of the rainfall for year X and the previous 4 years divided by 5.
Low annual minimum flow
High annual minimum flow

64
Figure 7.8 Comparison of Mataranka annual and 5 year moving average rainfall to actual and modelled groundwater level and minimum flow in the Roper River at G9030250. Predictions were provided by the water resource computer model and supplied by Knapton (2009)

65
The results show that for the last decade we have been living in times of unusually high rainfall
whereas a drier environment with accompanying lower groundwater levels and river flows is more the
norm for the Roper catchment. In fact, results from the model have shown that cease to flow
conditions at Red Rock are relatively common; occurring in 48 of 107 years since 1900. The model
also showed that no flow occurred for approximately 5% of the time over the 107 years; this equates to
18 days of no flow in an average year (Knapton, 2009). The long term record generated by the model
has implications for water use planning and any water allocations must consider the drier times and
the water requirements of the environment.
What happens when the Roper River ceases to flow In the 1950’s the water at Ngukurr became too salty to
drink. The river at Roper Bar had stopped flowing and
the salt water came upstream. Because of this, people
in the community had to move to where fresh water
was available. Women and children from Ngukurr
Mission went to Nyawurlbarr (Mission Gorge) where
there is a permanent spring.
(Transcription from interview with Walter Rogers)
Plate 7.5 Ursula Zaar interviewing Walter Rogers.
No flow at Roper Bar can have dramatic consequences to the river as explained by Walter Rogers.
Walter’s story is substantiated by mission records:
‘..at the Roper River drought conditions in 1952 led to the transfer of such Aborigines … to Mission
Gorge … In 1954 the Mission experienced further famine as a result of continued drought. Because
the river had gone salt the gardens could not be watered’ Cole (1968)
As Walter explained, the water quality in the tidal section of the Roper River, which begins at Roper
Bar, is dependent on the freshwater input from the river. The amount of freshwater that enters the
estuary during both the dry and wet seasons determines the location of the freshwater/saltwater
interface in the river. When the interface is stable at a location then there is a balance between
freshwater outflow and salt water inflow. From a study undertaken by Knapton and others (2005) it
was determined that in 2002 the interface was located approximately 9 km upstream of Kangaroo
Island in the Dry season. At this time the minimum flow was 1 m3/s which was equivalent to the
evaporation rate of the upstream freshwater pool (situated between Roper Bar and the interface)
hence stabilising the location of the interface. When there is no or little freshwater inflow, the balance
is disturbed and the interface migrates up the estuary (Figure 7.9). In years where there was no flow
for several months such as those in the 1950’s and 1960’s (Appendix G), the interface migrated so far
up the estuary that Ngukurr community’s river water supply was affected. In the 1960’s the mission
resorted to carrying water from the Wilton River for its supply (Kneebone 1960).

66
Figure 7.9 The salt water/freshwater interface (wedge) moves upstream when inflow is sufficiently reduced or ceases for a period. Because saltwater has a greater density than freshwater, it moves upstream in the form of a wedge with the leading edge on the river base.
This migration of the salt water/freshwater interface is also well known by indigenous people. The
term wurrunkurrun is used by the Yanyuwa to describe the brackish water where the salt and fresh
water merge. (Baker, 1993) Indigenous people recognise that the location of the interface varies with
the seasons and can move upstream as the Dry season progresses. This dynamic is not only
recognised in the Roper but also at the McArthur River.
Roper River baseflow water availability Jolly (2004) undertook a study examining the amount of baseflow available from the Roper River for
beneficial uses other than environment. He considered not only the Roper River but also the Tindall
aquifer which supplies baseflow to the Roper River.
In his study he undertook a direct analysis of gauging data from Elsey (G9030013) and Red Rock
(G9030250) and arrived at a loss of 2.47 m3/s between the sites, which is similar to the results in
Section 7.3.3. Jolly used this relationship to determine the availability of groundwater (equivalent to
the baseflow in the Roper River) for extraction based on 80% of flow being maintained at Red Rock.
This is one of four approaches that he considers in determining the water available for extraction. All
his approaches are based on the then NRETAS water allocation policy in the absence of a water
allocation plan. His analysis showed that ‘the amount of water available … depends on what location
in the river the principles (policy) are applied to’. When he considered the maintenance of Ngukurr’s
water supply (as Ngukurr pumps from the Roper River) then in 30% of years no groundwater (river
baseflow) should be extracted. This shows the critical nature of groundwater extraction and the
necessity for effective water allocation planning at Mataranka.
The integrated water resource modelling, undertaken as part of this Gulf Water Study, provides further
analysis on this subject. The model shows quantitatively the effects of varying rainfall, as well as the
effects of groundwater and surface water extraction, has on groundwater levels and river flow. The
model will prove essential to water allocation planning at Mataranka to ensure healthy rivers.
To sum up, significant groundwater extraction in the Mataranka area during a drier period can:

67
• result in less discharge to the river (less spring flow to the river)
• which results in less flow downstream in the losing section of the river
• which can cause the river to cease to flow at Roper Bar and further upstream (because of
environmental water losses)
• which reduces water availability to users (stations) upstream of Roper Bar
• and which can cause the salt water interface to migrate upstream in the estuary affecting
Ngukurr’s water supply and potentially the ecology of the Roper River of which we know little
about.
In context of modelling results showing cease to flow occurring 48 of 107 years, this would be an
expected occurrence.
Water allocation planning for the Roper River must ensure maintenance of the ecological communities
that depend on it.
In contrast to limited water availability during
drier periods, the wetter periods can present a
very different scenario (Plate 7.6). In the last
decade there has been exceptional rainfall and
correspondingly high baseflows in the Roper
River. In fact the flow at Red Rock has hardly
dropped below 1 m3/s. This emphasises the
large variation of baseflow in the river.
Plate 7.6 Roper Bar in times of high baseflow. Photo taken 21.7.07.
7.4 Wet Season Flows In the Wet season, river flows increase due to rainfall runoff. Figure 7.10 provides an example
showing how flow in the Roper River at G9030250 Red Rock increases with rainfall events at
Mataranka. The increase in flow at a point along the river is dependent upon the rain that has fallen in
the catchment upstream from that point. For the same amount of rainfall, larger catchments have
larger flows. Major catchment boundaries are shown on the Water Resource Map. Appendix K
provides plots of the flow record for the gauging stations with a continuous record. Note the large
variations in maximum flow over the years. Very large quantities of rainfall runoff discharge along the
Roper and its major tributaries most years. This presents a substantial resource.
For further information on rainfall runoff The CSIRO North Australia Sustainable Yields (NASY) project
is best referenced. (www.environment.gov.au/water/policy-programs/sustainable-yields) It assesses
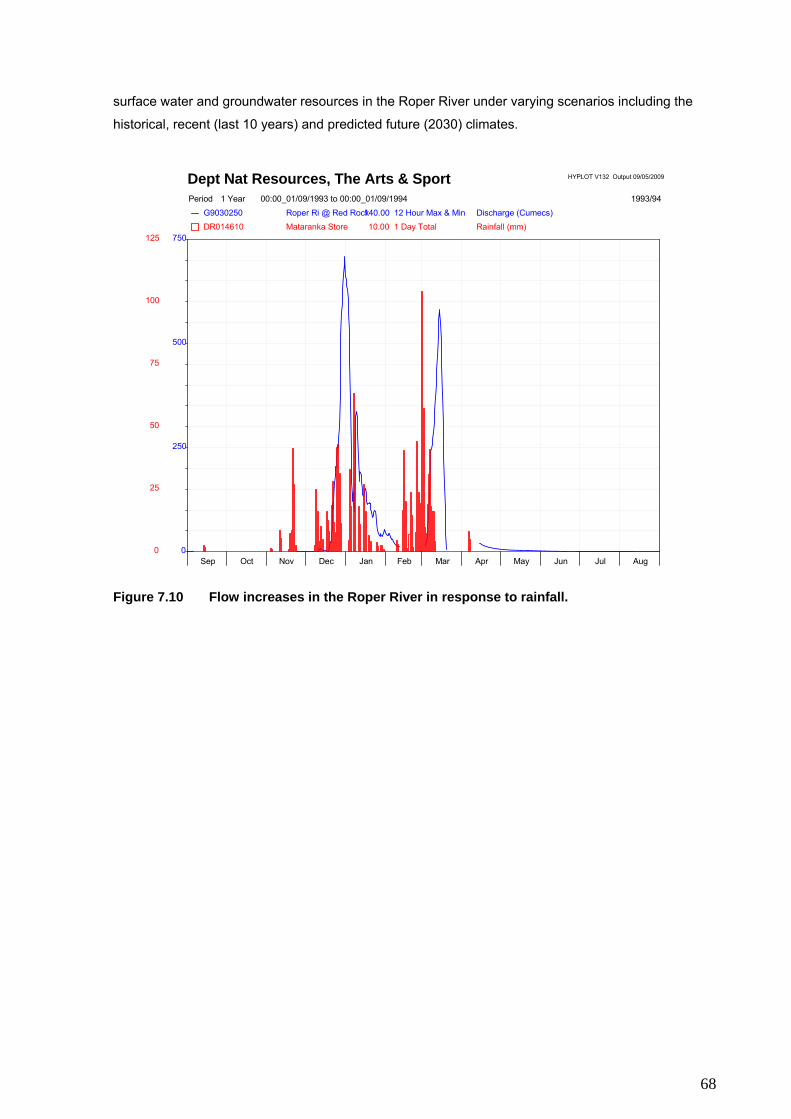
68
surface water and groundwater resources in the Roper River under varying scenarios including the
historical, recent (last 10 years) and predicted future (2030) climates.
Dept Nat Resources, The Arts & Sport HYPLOT V132 Output 09/05/2009
Period 1 Year 00:00_01/09/1993 to 00:00_01/09/1994 1993/94G9030250 Roper Ri @ Red Rock140.00 12 Hour Max & Min Discharge (Cumecs)DR014610 Mataranka Store 10.00 1 Day Total Rainfall (mm)
0
250
500
750
0
25
50
75
100
125
Sep Oct Nov Dec Jan Feb Mar Apr May Jun Jul Aug
Figure 7.10 Flow increases in the Roper River in response to rainfall.

69
8. WATER RESOURCE DATA AND AVAILABILITY
NRETAS reports pertaining to this map area are listed in Appendix H and many are available in digital
format.
The Water Resource Map that accompanies this report was produced by NRETAS. It can be reprinted
at any time and made available to interested parties.
All products of the Gulf Water Study are available in digital format on DVD. The DVD titled ‘The Gulf
Water Study’ contains the following products:
• This report and the reports for the other regions of the study
• Posters pertaining to the study area
• A GIS which uses the program Arc Explorer
• A photographic and video database which is geo referenced
The DVD is available through the Natural Resources Division of NRETAS.
All detailed information on surface water sites is kept on the NRETAS ‘Hydstra’ database. Requests
for such data can be made to: Spatial Data and Mapping Branch, NRETAS Phone (08) 8999446,
Email: [email protected]
All bore reports are available through the internet site www.nt.gov.au/nretamaps. These are regularly
updated.
Plate 8.1 Shantelle Tapp enjoying the Roper River.

70
9. GLOSSARY
Airlift Yield: The rate at which water is extracted from a bore using compressed air down hole.
Aquifer: A body of rock which is sufficiently permeable to conduct groundwater and to yield useable
quantities of groundwater to bores and springs
Baseflow: The groundwater contribution to a stream. Baseflow often maintains the flow in a stream
over the Dry season.
Catchment: Area in which rainfall collects to form the flow in a river.
Confined aquifer: A confined aquifer occurs where an aquifer is overlain by a confining bed. The
confining bed prevents upward movement of the groundwater. Such aquifers are usually completely
saturated with water which is commonly under pressure. Therefore when a bore intersects the
aquifer, water rises up the bore. If the pressure is sufficient to drive the groundwater above the ground
level, the bore is called artesian.
Carbonate rock: A rock such as limestone or dolomite, consisting largely of the carbonate minerals;
calcium carbonate or calcium magnesium carbonate.
Consolidate: Any process whereby soft or loose earth materials become firm, for example the
cementation of sand or the compaction of mud.
Dhuwa and Yirritja: These are the two moiety names often used in Arnhem Land. Everyone and
everything is either Dhuwa or Yirritja. This is one of the fundamentals of Aboriginal culture.
Dolomite: A sedimentary rock composed mainly of the mineral dolomite (calcium magnesium
carbonate)
Electrical conductivity, EC: The measure of the ability of water to conduct electrical current. The
magnitude is directly related to the dissolved mineral content of the water. EC is measured in
microseimens per centimetre, μS/cm.
Ephemeral: A creek or river that dries up in the dry season.
Evaporation: The process whereby liquid water turns to vapour. It accounts for the movement of
water to the air from sources such as the soil, canopy interception, and waterbodies.

71
Evapotranspiration: The sum of evaporation and plant transpiration from the Earth’s surface to the
atmosphere. Transpiration accounts for the loss of water from plants as vapour through its leaves.
Fractured: A fractured rock is one that is broken by joints, cracks or faults.
Gauging station: Site on a stream where direct observation of water
velocities, heights or quality are made and recorded. Pictured – gauging
station with well, recording river height.
Geology: Science of earth’s composition, crust, rocks, origin,
structures, historical changes and processes.
Geographic Information System (GIS): A computer system that captures,
stores, analyses, manages and presents data that is linked to location. Data can be viewed and
accessed using a computerised map.
Geophysics: The use of specialised surveys to give an indication of underlying rock type. Techniques
such as magnetics, gravity, electro-magnetics, and seismics can be used on the earth’s surface in
order to indicate geology.
Groundwater: Water beneath the surface of the earth that is in the saturated zone.
Groundwater dependent ecosystems: A community of plants and animals that rely partially or
completely on groundwater for its existence.
Groundwater Discharge: The release of groundwater to the surface by seepage, evaporation or
transpiration (from plants).
Hardness: A measurement of the level of calcium carbonate in water.
Hydrograph: A graph that shows water levels or flow in a stream, or the watertable level in a bore.
Impermeable: An impermeable soil, rock or sediment is that in which fluid (water) is unable to pass
through.
Jungkayi: People who have responsibilities to their mother’s clan, ritual managers of one’s mother’s
country. The term can be translated in English as ‘manager’, ‘caretaker’ or ‘policeman’.
Karst: A term describing typical geologic/topographic attributes of limestone or dolomite resulting from
mineral solution such as caves and sinkholes.
72
Monitoring/Observation bore: A bore used for measuring groundwater levels.
Ngimarringki: Yanyuwa term for traditional land owners.
Perennial: A stream, lake or waterhole which retains water throughout the year.
Perennial flow: Flow that is retained throughout the year.
Permeability/Permeable: The capability of sediments and rocks to allow water to move through
them.
pH: A measure of acidity (low pH) or alkalinity (high pH). A pH of 7 indicates neutrality whereas lower
pH levels indicate acidity.
Porosity: The total amount of pore space in a soil or rock.
Primary porosity: Voids in a rock formed when the rock was deposited. The spaces between sand
grains are an example of primary porosity.
Recession: The part of the hydrograph where the water level or flow diminishes.
Recharge: Addition of water to an aquifer to become groundwater.
Runoff: Rainwater that leaves an area as surface flow.
Sandstone: A sedimentary rock composed of sand grains cemented together.
Spring: Outflow points for groundwater where the watertable is near or above the ground surface.
Secondary porosity: Voids in a rock formed after the rock has been deposited; not formed when the
rock was formed, but later due to other processes.
Siltstone: A sedimentary rock composed of silt sized particles.
Standing Water Level: The level below ground surface, to which groundwater rises in a bore.
Surface Water: Water that is on the earth’s surface, such as a stream, river, lake or reservoir.
Sustainable: maintain (without adverse effect)

73
Topography: The shape and height of the land surface.
Total Dissolved Solids (TDS): The amount of dissolved material in water, usually expressed as
milligrams per litre (mg/L).
Unconsolidated: A sedimentary deposit in which the particles are not cemented together.
Water table: Level of the surface of the groundwater. It is often measured in observation bores.
Water quality: Physical, chemical, biological characteristics of water and how they relate to it for a
particular use.
Water Year: The water year splits the year from September of one year to August of the next year.
Hence the total Wet season rainfall is accounted for.
Wetland: Land which remains wet for a large part of the year.
Yield: Amount of water which can be supplied by an aquifer or pumped from a bore over a certain
time period.

74
10. REFERENCES
Australian Drinking Water Guidelines, 2004
www.nhmrc.gov.au/publications/synopses/_files/adwg_11_06.pdf
Baker B, 2002. ‘I’m going to Where-her-brisket-is’: place names in the Roper. (Draft version published
in ‘The Land is a Map’ edited by Luise Hercus, Flavia Hodges, and Jane Simpson. Pacific
Linguistics:Canberra) www-personal.une.edu.au/ bbaker2
Baker R, 1993. Traditional Aboriginal Land Use in the Borroloola Region. In ‘Traditional Ecological
Knowledge’ by Williams et al.
Baker R, 1999. Land is Life. From Bush to Town. The story of the Yanyuwa people. Allen & Unwin
Bradley J et al, 2003. “Forget about Flinders” A Yanyuwa Atlas of the South West Gulf of
Carpentaria.
Bradley J et al., 2006. Yumbulyumbulmantha Ki-Awarawu. All Kinds of Things from Country: Yanyuwa
Ethnobiological Classification. University of Queensland.
Bushtel, 2007
www.bushtel.nt.gov.au
Coram JE, Dyson PR, Houlder PA and EvansWR, 2000. Australian groundwater flow systems
contributing to dryland salinity. A Bureau of Rural Science project for the National Land and Water
Resources Audit. P24.
Cole EK, 1968. A short history of the C.M.S. Roper River Mission, 1908-1968. The Church Missionary
Historical Publications Trust.
Cook PG, 2003. Inferring Groundwater inflow to the Roper River (N.T.) from environmental tracers.
CSIRO Land and Water. Water Resources technical Report No 37/2003D.
Environment Australia (2001). A directory of important wetlands in Australia. Environment Australia,
Canberra. Third Edition.
Fetter CW, 1994. Applied Hydrogeology. 3rd Edition. Macmillan Publishing Company. New York,
p691.
Jamieson M, Pidsley D, 1992. Miniyeri Groundwater Resources Investigation 1991/92.

75
Power and Water Authority, Water Resources Division, Technical Report No 46/1992.
Jolly P, Knapton A and Tickell S, 2004. Water Availability form the Aquifer in the Tindall Limestone
South of the Roper River. Northern Territory Department of Infrastructure, Planning and Environment,
Technical Report No 34/2004.
Knapton A, Jolly PK, Yin Foo D, Raju B, 2005. Bathymetric Survey of the Roper River Estuary 2002.
Northern Territory Government Department of Natural Resources, Enironment and the Arts, Technical
Report No 18/2005D.
Knapton A, 2009. Integrated Surface-Groundwater Model of the Roper River Catchment. Northern
Territory Government Department of Natural Resources, Environment, the Arts and Sport. Technical
Report No 15/2009D.
Leichhardt L, 1847. Journal of an overland expedition in Australia, from Moreton Bay to Port
Essington. London T& W. Boone, 1847.
Matthews I, 2008. Minyeri – Regional groundwater investigation and expansion of exisiting borefield.
Territory Groundwater Services, Darwin NT.
Merlan F, 1996. Big River Country, Stories from Elsey Station. IAD Press.
Moretti A, Jolly P, Tyson P, Baker A, 1992. Ngukurr Water Supply Evaluation. Power and Water
Authority, Water Resources Division, Technical Report No 41/1992.
O’Grady A et al. 2002. Tree Water Use and Sources of Transpired Water in Riparian Vegetation alon
the Daly River, Northern Territory.
Russell Smith J, 1991. Classification, Species Richness and Environmental Relations of Monsoon
Rain Rorest Vegetation in Northern Australia. J. Veg Science v. 2/2 1991
SILO 1998. Data Drill rainfall data.
www.longpaddock.qld.gov.au/silo
Sumner J, 2008. Ngukurr Groundwater Investigation 2006 – 07. Water Resources Branch, Northern
Territory Government Department of Natural Resources, Environment, the Arts and Sport, Technical
Report No 16/2008D.

76
Tickell S, 2008. Groundwater, Explanatory notes to the Groundwater Map of the Northern Territory.
Northern Territory Government Department of Natural Resources, Environment, the Arts and Sport,
Technical Report No 12/2008D.
Thonemann H, 1949. Tell the White Man. The Life Story of an Aboriginal Lubra. Collins.
Woodford JC, Yin Foo D, 1995. Borroloola Groundwater Investigations 1995. Power and Water
Authority, Water Resources Division, Technical Report No 59/1995D.
Zaar U, Farrow R, 2005. Catalogue of Groundwater monitoring Bores in the Top End to 2005.
Northern Territory Government Department of Natural Resources, Environment and the Arts,
Technical Report No 24/2005D.
GEOLOGY MAPS (Geology maps and explanatory notes are attainable from the Northern Territory
Geological Survey (NTGS) details at www.minerals.nt.gov.au/ntgs T:89996443)
Urapunga – Roper River Special
Abbott ST, Sweet IP, Pumb KA, Young DN, Cutovinos A, Ferenczi PA, Brakel A, and Pietsch BA,
2001. Roper Region – Urapunga and Roper river Special, Northern Territory (second Edition). 1:250
000 Geological Map Series and Explanatory Notes, SD 53-10, 11 Northern Territory Geological
Survey and Geoscience Australia (National Geoscience Mapping Accord.)
Mount Young
Haines PW, Pietsch BA, Rawlings DJ and Madiban TL, 1993. Mount Young. 1: 250000 Geological
Map Series and Explanatory notes, SD53-15, Northern Territory Geological Survey.
Hodgson Downs
Dunn PR, 1963. Hodgson Downs, Northern Territory. 1:250 000 Geological Map Series and
Explanatory Notes, SD 53 – 14 Bureau of Mineral Resources, Geology and Geophysics.

77
APPENDIX A: INDIGENOUS KNOWLEDGE
‘In the Roper, places which are named constitute the manifest embodiment of the Ancestral Creator
Beings. What non-Indigenous people to the area call the ‘Hodgson River’, the locals think of
simultaneously as the track of the Mermaids gilyirringgilyirring.’ (Baker, 2002)
All cultural perspectives need to be recognised when undertaking land and water management and
development. In an effort to present the indigenous cultural perspective pertaining to water, care has
been taken to present indigenous place names on the maps and detail cultural information relevant to
the places in this report. All indigenous place names relate to the people, their ancestors and the
country. It is hoped that aside from producing a cross-cultural user friendly map, non-indigenous
readers can gain some insight into the rich heritage of the indigenous people of this region.
The following information was collected during field trips when Traditional Owners were interviewed or
accompanied field workers and guided them to water sites. At all times when collecting indigenous
knowledge, it was made clear that the information would be public, so culturally sensitive information
was not recorded. Where possible, the language of the place name was recorded. Efforts were made
to transcribe the names correctly and the Ngukurr Language Centre was very generous in this respect.
Where substantial information was offered by the Traditional Owner, the information is presented
individually in alphabetical name order. Some personal details and a photo of the Traditional Owner is
shown and this is followed by detailed information and photos of some sites. A table is then provided
with location and transcription details of all sites the Traditional Owner discussed. Information from
other individuals is presented in tabular form at the end of the Appendix. In the tables it is noted if the
site was visited with the Traditional Owner or the location only estimated by use of maps and through
discussion. Where there is too much uncertainty on location, no co-ordinates were supplied.
Indigenous and non-indigenous people provided information on water resources and their dynamics
that has helped with mapping and scientific understandings. This information such as spring locations
and whether or not waterholes are permanent or intermittent is knowledge gained through experience
and observation. Such information has been invaluable, particularly as such a vast area was covered
and access difficult.
Ancillary to this report, indigenous knowledge has also been documented through photographs and
video and is available on the Gulf Water Study DVD.

78
Sandy August (deceased)
In September 2007 Zaar met with Sandy August and Stephen Roberts at Minyerri to discuss water
resources in the region. As the two men related dreamtime creation stories, differences in the stories
emerged. Sandy’s knowledge is presented here. Stephen Roberts agreed with part of the story
sequences.
The journey of the goanna The goanna travelled along waterholes on Mountain Creek and then further afield. It went from
*Mangurwala lagoon to Nyalajirr, Wunduluerr, *Yumanji and then Yilbiya.
*These are the sites Stephen Roberts agreed with.
The journey of a mermaid The mermaid travelled from *Nyadagarinna to *Jawalada to *Wadamada to Larrdan, Six Mile
Waterhole, *Alinginji and then on to Inbarrwa and continued on.
*This part of the journey was related initially by Stephen Roberts but Sandy agreed with it and added
the latter part of the journey.
Table A1 Indigenous place names and details supplied by Sandy August Indigenous name
Site Comment Easting Northing Transcribed
Alinginji Naomi Wilfred Inbarrwa Naomi Wilfred Larrdan Naomi Wilfred Manguwala Lagoon/
Waterhole On Mountain ck Naomi Wilfred
Nyalajirr Waterhole Naomi Wilfred Wunduluerr Waterhole Naomi Wilfred Yilbiya Waterhole Naomi Wilfred
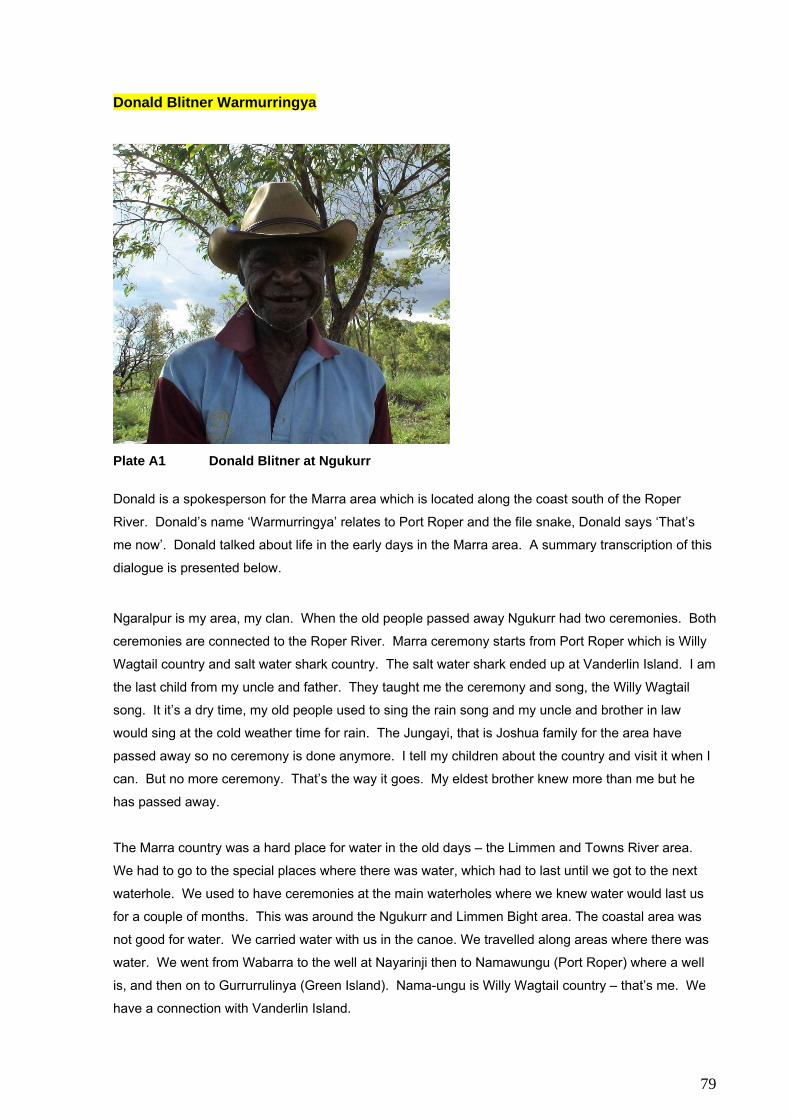
79
Donald Blitner Warmurringya
Plate A1 Donald Blitner at Ngukurr
Donald is a spokesperson for the Marra area which is located along the coast south of the Roper
River. Donald’s name ‘Warmurringya’ relates to Port Roper and the file snake, Donald says ‘That’s
me now’. Donald talked about life in the early days in the Marra area. A summary transcription of this
dialogue is presented below.
Ngaralpur is my area, my clan. When the old people passed away Ngukurr had two ceremonies. Both
ceremonies are connected to the Roper River. Marra ceremony starts from Port Roper which is Willy
Wagtail country and salt water shark country. The salt water shark ended up at Vanderlin Island. I am
the last child from my uncle and father. They taught me the ceremony and song, the Willy Wagtail
song. It it’s a dry time, my old people used to sing the rain song and my uncle and brother in law
would sing at the cold weather time for rain. The Jungayi, that is Joshua family for the area have
passed away so no ceremony is done anymore. I tell my children about the country and visit it when I
can. But no more ceremony. That’s the way it goes. My eldest brother knew more than me but he
has passed away.
The Marra country was a hard place for water in the old days – the Limmen and Towns River area.
We had to go to the special places where there was water, which had to last until we got to the next
waterhole. We used to have ceremonies at the main waterholes where we knew water would last us
for a couple of months. This was around the Ngukurr and Limmen Bight area. The coastal area was
not good for water. We carried water with us in the canoe. We travelled along areas where there was
water. We went from Wabarra to the well at Nayarinji then to Namawungu (Port Roper) where a well
is, and then on to Gurrurrulinya (Green Island). Nama-ungu is Willy Wagtail country – that’s me. We
have a connection with Vanderlin Island.

80
When travelling up the Limmen Bight River we would get water from Wamungu and then travel to
Namanuwal for water.
In the 50’s when I grew up I chose to be a ringer. It was in the 40’s 50’s, 1947 that the river (Roper
River) became salty. The jellyfish went right up to Roper Bar. We were not allowed to go to Mission
Gorge. All the single boys had to stay here at Yawurrwarda. We used to sterilise the water, get rid of
the dust. We would boil it and then put flour or something into the water and that would make all the
dust fall down and we would have clean water.
Table A2 Indigenous place names and details supplied by Donald Blitner Indigenous name
Site Comment Easting Northing Transcribed
Gurrurrulinya Green Island Water supply here was a swamp. It was the only water supply till Port Roper where there was a well. Wandarang area
512400 As located
on Topo map.
8366500 Ursula Zaar
Magarinji Creek /spring There are permanent waterholes along this creek.
521100
8332000 Ursula Zaar Spelt Magaranyi on topo map.
Najamarra Mouth of the Roper River. Marra country.
541000 Location
estimated
8373000 Ursula Zaar Marra language
Namawungu Port Roper Willy Wagtail country. Marra country.
541000 Location
estimated
8373000 Ursula Zaar Marra
Nawarlbur Waterhole G9045001
Permanent waterhole. This is where my ceremony finishes, it went from the coast to here.
530300 8324000 Existent on Topographic map
Nayarinji Towns river Marra country. It is a big area. From the coast to the highway. At the coast there is a well.
540100 Location
estimated
8348000 Ursula Zaar
Wabarra Lake This is permanent water. 541500 8331000 Existent on Topographic map
Walanbarrungnu Creek Site where the highway crosses the Towns river. There are permanent waterholes along the creek.
522800 Location
estimated
8337000 Ursula Zaar
Warlngudu (Site was also noted by S. Roberts)
Old St Vidgeon Station
This is my fathers mother country. My grandmother, she is from here. My father was born there.
467700 Location
estimated
8337700 Naomi Wilfred
Wamungu Area Limmen River at the mouth. We got water from here.
574000 Location
estimated
8330000 Ursula Zaar
Wurrumala Permanent waterhole. Ceremonies took place here. Marra ceremonies.
536900
8309000 Existent on Topographic map
Yumanji CountryLittle Towns River
There are permanent waterholes along this creek.
519000 8337700 Existent on Topographic map

81
Cherry Daniels
Plate A2 Jill, Grace and Cherry Daniels at Nyawurlbarr
Cherry Daniels is the senior ranger at Ngukurr. She remembers when the Roper River went salty and
they had to live at Nyawurlbarr. She had the following to say about water issues in the area.
The main issues are destruction by pigs, buffalo and pollution by visitors. The rangers have been
cleaning these places and fenced three billabongs. These are at Costello, Namiliwirri and Nulawan.
Weeds are being controlled such as Mimosa, Parkinsonia, Bellyache Bush and Rubber Bush. The
program started in 2005. To kill the weeds we have to camp out in the bush and walk and spray
poison.

82
Arnold Duncan
Arnold Duncan lives at Urapunga. He is a
key elder for the Wilton River area. He is a
fit man who has worked with cattle most of
his life and continues to do so. He guided
the field survey team to a seep at
Ganggnurngur and discussed water in the
area.
Plate A3 Arnold Duncan at Gangngurngur seep Gangngurngur This place is called Gangngurngur. Sometimes there is no water here. This was the place where
people stopped to get water when they walked form Ngukurr to Urapunga. When the tide is up the
spring runs. When it is low tide there is no water seeping.
Table A3 Indigenous place names and details supplied by Arnold Duncan Indigenous name
Site Comment Easting Northing Transcribed
Dalkanda Spring Permanent running small spring on the eastern side of the Wilton River. Near Ah Cup waterhole.
Ursula Zaar
Damererri spring Located further up from Ah Cup waterhole on the western side.
Ursula Zaar
Gangngurngur Seep This is where people stopped for water when they walked between Urapunga and Ngukurr.
458941 Visited
8375079 Ursula Zaar
Ginburronni Waterhole This is a big waterhole on the Roper River
Ursula Zaar
Laddiladdi spring Permanent flowing small spring on western side of Wilton River. Near Ah cup waterhole up the gorge.
Ursula Zaar
Wallanji Billabong This is a sacred area that you cannot visit. It never dries, even in the 1950’s it didn’t dry.
Ursula Zaar
Youlo / Youleu Lake Allen? Big permanent waterhole Ursula Zaar Spring at
Sandy creek Permanent spring on Sandy creek. Close to Urapunga station.
Ursula Zaar
Spring next to pumpkin yard
Ursula Zaar

83
Roy Hammer (deceased)
Plate A4 Roy Hammer (Photo supplied by and with the permission of his wife Violet Hammer)
It was late in November 2007 that Zaar finally met with Roy Hammer. He was an elder of the Marra
clan and had worked as a stockman for most of his life. He spent a lot of his time as a stockman on
Bauhinia, Billengarah, Nathan River, Hodgson, Nutwood, Tanumbirini, Bing Bong stations and
numerous other stations. He was the head stockman at Bauhinia for many years and actually took on
the name Hammer after Ken Hammer who was then the owner of Bauhinia. Roy’s proper surname is
Riley. Roy was a great jockey and was the first man to win the Borroloola cup races twice. He was a
very well respected man by all people. He was the Borroloola council President for 6 years. He was
well known for his beliefs in, and faultless knowledge of, aboriginal law. He travelled to Japan to show
the world his Traditional Dancing. (Information provided by Frank Shadforth, pers. Comm. and
memorial service notes) When Zaar interviewed Roy she was impressed by his excellent memory and
how he was able to read maps and locate water sites very quickly, naming and describing them. Some
of his knowledge of water sites is recorded below.

84
Wabarra This is a permanent freshwater lake located
between the Towns and Limmen Bight Rivers.
Roy explained that according to traditional
indigenous culture the lake was made by a
python. The black nosed python (Bubunahdda)
came from the Bye Hills and travelled to Wabarra
Lake, then to Ngaldja swamp, past Nahwugunnya
where the wells are, and on to the reef. Stephen
Roberts also agreed that this is the only
permanent water for miles.
Plate A5 Satellite image of Wabarra Lake (Google Earth) Wurrumala
Plate A6 & A7 Wurrumala Satellite image (Google Earth) and at site This is a fresh permanent lake. It is known also as Lake Mary. It is Black nose python dreaming.
Wurrumala is a Marra and Yanyuwa word.

85
Table A4 Indigenous place names and details supplied by Roy Hammer Indigenous name
Site Comment Easting Northing Transcribed
Lamahda Spring This spring has bubbling fresh water. Roy used to travel by canoe from Namanuwal waterhole which was their camp, to Lamahda spring to get water and then return.
554600 Location estimated.
8316600 Ursula Zaar
Leguldu Waterholes These waterholes are permanent
526100 As per 50K topo map
8306000 Already noted on 50K topo map.
Magaranyi River This river is related to the Barramundi in the dreamtime
503300 As per 50K topo map
8300000 Already noted on 50K topo map.
Nahwugunnya well The wells are in the sand along the coast. You have to dig for the water. The wells are located near the pandanus.
557500 Location estimated
8340000 Ursula Zaar
Ngaldja Swamp Ursula Zaar Wabarra Lake Lake was made by the Black
Nosed Python. Name confirmed by Roy.
541500 From topo map
8331000
Already noted on 50K topo map.
Wamungku
waterhole
This waterhole is permanent and provides water to Maria Lagoon.
547700 8308500 Already noted on 50k topo map
Wunuwanji Spring This is a permanent bubbling spring located north east of Maria Lagoon community. It is the plain kangaroo dreaming.
545800 Location estimated.
8310100 Ursula Zaar
Wurrumala Lake Mary This is the Black Nose Python dreaming. Name confirmed by Roy.
536900 From topo map
8309000
Already noted on 50K topo map. Marra and Yanywa word.

86
Stephen Roberts
Plate A8 Stephen Roberts
Stephen Roberts is a well respected elder of the Budal clan. He lives in Minyerri. Having being born
in 1925, he experienced a traditional upbringing learning about, and living his culture as it was for
thousands of years. He also saw the changes that came with the Europeans. In talking with Stephen
one quickly recognises that he has an extensive knowledge of the waterholes over a vast tract of
country as he related the names and dreamtime stories of waterholes and their interconnections. The
knowledge of the region he provided is documented below. I lived at the old Mission before it got washed away by the big flood. Then I lived at Old St Vidgeon,
Warlngudu. That’s where I learnt to be a stockman. Those were the hard times. We did do
ceremony. We used to cart salt from Port Roper in the wagon to Warlngudu. We got the salt from a
little creek, Naryulgai. Narmawungu is on the Towns River. My old father made a well there for
freshwater. Then I went to Nutwood Downs to work. Old Jimmy Gibbs went to Urapunga. That was
the time of no money, Johnny cake and corned beef. Hard work but good times. Most of my life I
worked on cattle stations. I also worked for the army. I did all sorts of jobs when I was young.
Most places are good for visiting by all people. There are only some important places that people
cannot go to. My three grandsons know this – I taught them. The O’Keefe’s. I have taught them
ceremony and all. They know how to muster cattle. They know the places and the rain song. The
Red legged Jabiru, Garrinji, rain, kangaroo, sandridge goanna. The three boys are jungkayi for this,
the master of ceremony. If I tell them to start ceremony then they start. This ceremony no women and
kids can see.
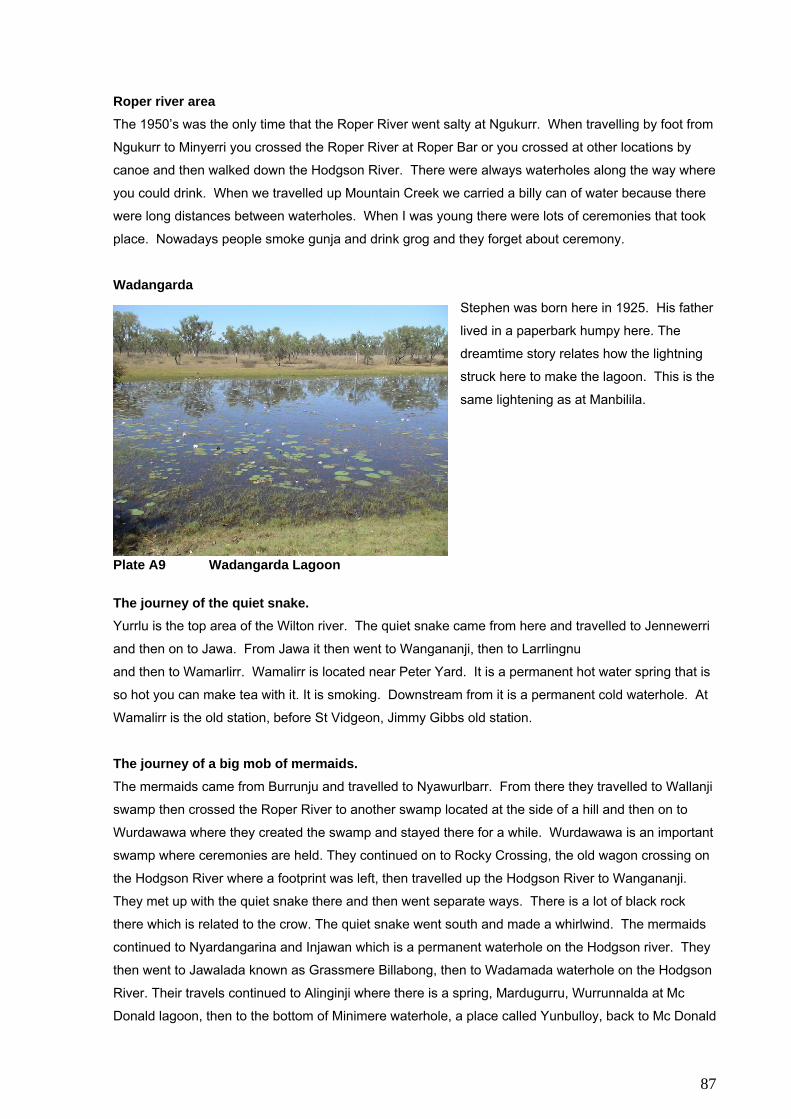
87
Roper river area The 1950’s was the only time that the Roper River went salty at Ngukurr. When travelling by foot from
Ngukurr to Minyerri you crossed the Roper River at Roper Bar or you crossed at other locations by
canoe and then walked down the Hodgson River. There were always waterholes along the way where
you could drink. When we travelled up Mountain Creek we carried a billy can of water because there
were long distances between waterholes. When I was young there were lots of ceremonies that took
place. Nowadays people smoke gunja and drink grog and they forget about ceremony.
Wadangarda Stephen was born here in 1925. His father
lived in a paperbark humpy here. The
dreamtime story relates how the lightning
struck here to make the lagoon. This is the
same lightening as at Manbilila.
Plate A9 Wadangarda Lagoon The journey of the quiet snake. Yurrlu is the top area of the Wilton river. The quiet snake came from here and travelled to Jennewerri
and then on to Jawa. From Jawa it then went to Wangananji, then to Larrlingnu
and then to Wamarlirr. Wamalirr is located near Peter Yard. It is a permanent hot water spring that is
so hot you can make tea with it. It is smoking. Downstream from it is a permanent cold waterhole. At
Wamalirr is the old station, before St Vidgeon, Jimmy Gibbs old station.
The journey of a big mob of mermaids. The mermaids came from Burrunju and travelled to Nyawurlbarr. From there they travelled to Wallanji
swamp then crossed the Roper River to another swamp located at the side of a hill and then on to
Wurdawawa where they created the swamp and stayed there for a while. Wurdawawa is an important
swamp where ceremonies are held. They continued on to Rocky Crossing, the old wagon crossing on
the Hodgson River where a footprint was left, then travelled up the Hodgson River to Wangananji.
They met up with the quiet snake there and then went separate ways. There is a lot of black rock
there which is related to the crow. The quiet snake went south and made a whirlwind. The mermaids
continued to Nyardangarina and Injawan which is a permanent waterhole on the Hodgson river. They
then went to Jawalada known as Grassmere Billabong, then to Wadamada waterhole on the Hodgson
River. Their travels continued to Alinginji where there is a spring, Mardugurru, Wurrunnalda at Mc
Donald lagoon, then to the bottom of Minimere waterhole, a place called Yunbulloy, back to Mc Donald
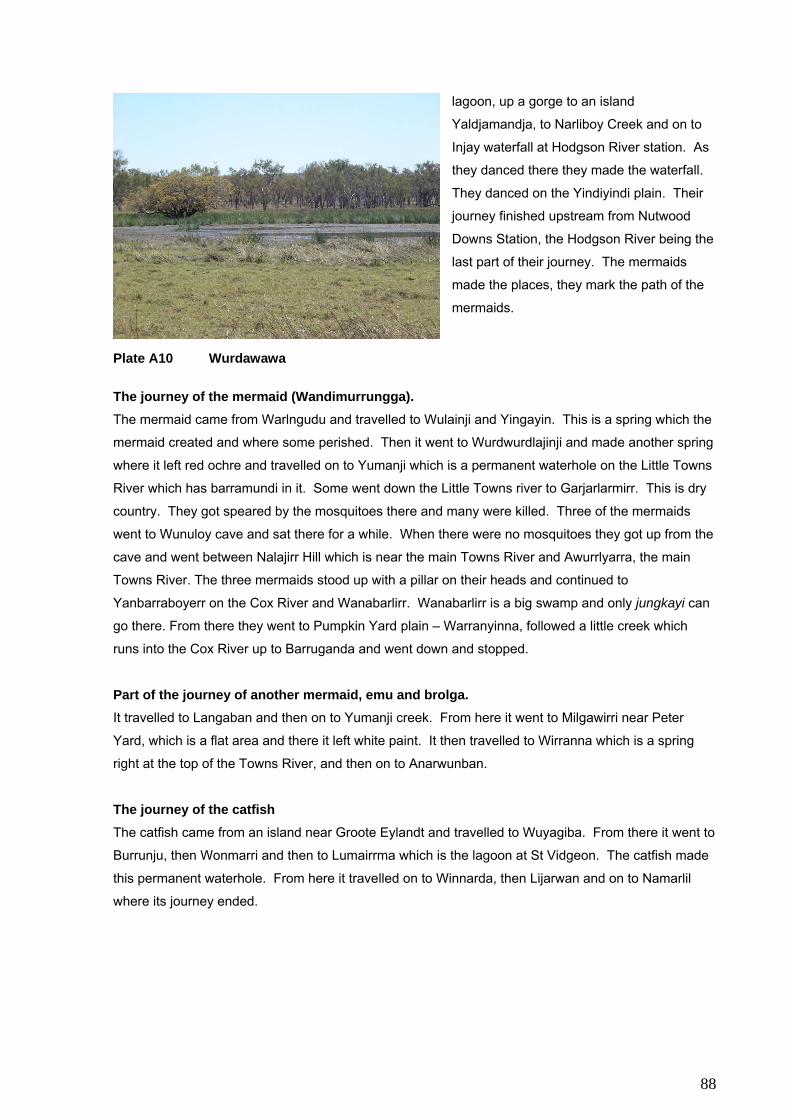
88
lagoon, up a gorge to an island
Yaldjamandja, to Narliboy Creek and on to
Injay waterfall at Hodgson River station. As
they danced there they made the waterfall.
They danced on the Yindiyindi plain. Their
journey finished upstream from Nutwood
Downs Station, the Hodgson River being the
last part of their journey. The mermaids
made the places, they mark the path of the
mermaids.
Plate A10 Wurdawawa The journey of the mermaid (Wandimurrungga). The mermaid came from Warlngudu and travelled to Wulainji and Yingayin. This is a spring which the
mermaid created and where some perished. Then it went to Wurdwurdlajinji and made another spring
where it left red ochre and travelled on to Yumanji which is a permanent waterhole on the Little Towns
River which has barramundi in it. Some went down the Little Towns river to Garjarlarmirr. This is dry
country. They got speared by the mosquitoes there and many were killed. Three of the mermaids
went to Wunuloy cave and sat there for a while. When there were no mosquitoes they got up from the
cave and went between Nalajirr Hill which is near the main Towns River and Awurrlyarra, the main
Towns River. The three mermaids stood up with a pillar on their heads and continued to
Yanbarraboyerr on the Cox River and Wanabarlirr. Wanabarlirr is a big swamp and only jungkayi can
go there. From there they went to Pumpkin Yard plain – Warranyinna, followed a little creek which
runs into the Cox River up to Barruganda and went down and stopped.
Part of the journey of another mermaid, emu and brolga. It travelled to Langaban and then on to Yumanji creek. From here it went to Milgawirri near Peter
Yard, which is a flat area and there it left white paint. It then travelled to Wirranna which is a spring
right at the top of the Towns River, and then on to Anarwunban.
The journey of the catfish The catfish came from an island near Groote Eylandt and travelled to Wuyagiba. From there it went to
Burrunju, then Wonmarri and then to Lumairrma which is the lagoon at St Vidgeon. The catfish made
this permanent waterhole. From here it travelled on to Winnarda, then Lijarwan and on to Namarlil
where its journey ended.

89
Plate A11 & 12 Namarlil and Wanmari Waterholes
Manbilila
Plate AI3 & 14 Manbilila spring and discharge channel I am the Ngimarringki for rain at Mambilila. Manbilila spring was created at the time of the big rain and
the lightning struck and created the spring. That’s the dreamtime story from my two fathers. The rain
dreaming, the spring down here. I have the rain song on my tongue. If I sing I can stop the lightning.
If that heavy storm comes we can stop that rain with singing. (Stephen started singing). That’s only a
short rain, he won’t come (in) rough. The spring is located at the Larrpayanji outstation and supplies
water to Tollgate creek.
The Red legged Jabiru The Red legged Jabiru came from Minimere and its journey ended at Spring Creek Station. It started
from Marlringa, a swamp near Old Newcastle Waters near Elliot and then went to Minimere. If you
bring that helicopter I can take you to these places.
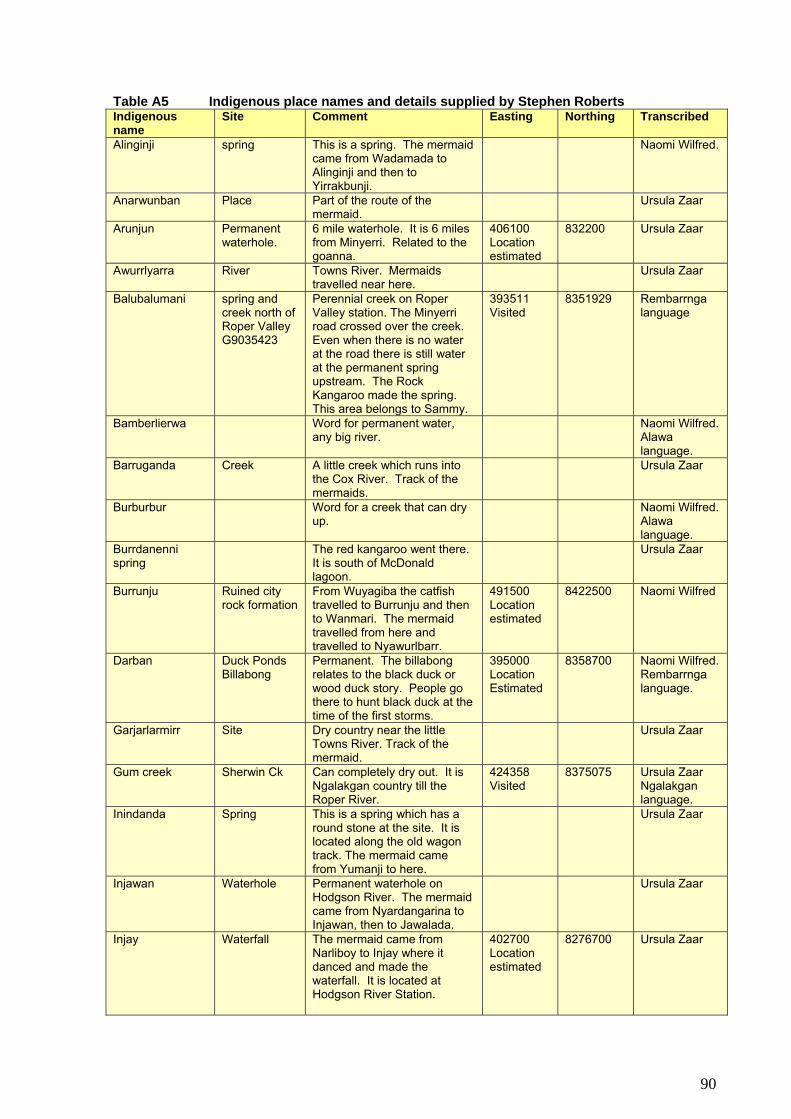
90
Table A5 Indigenous place names and details supplied by Stephen Roberts Indigenous name
Site Comment Easting Northing Transcribed
Alinginji spring This is a spring. The mermaid came from Wadamada to Alinginji and then to Yirrakbunji.
Naomi Wilfred.
Anarwunban Place Part of the route of the mermaid.
Ursula Zaar
Arunjun Permanent waterhole.
6 mile waterhole. It is 6 miles from Minyerri. Related to the goanna.
406100 Location estimated
832200 Ursula Zaar
Awurrlyarra River Towns River. Mermaids travelled near here.
Ursula Zaar
Balubalumani spring and creek north of Roper Valley G9035423
Perennial creek on Roper Valley station. The Minyerri road crossed over the creek. Even when there is no water at the road there is still water at the permanent spring upstream. The Rock Kangaroo made the spring. This area belongs to Sammy.
393511 Visited
8351929 Rembarrnga language
Bamberlierwa Word for permanent water, any big river.
Naomi Wilfred. Alawa language.
Barruganda Creek A little creek which runs into the Cox River. Track of the mermaids.
Ursula Zaar
Burburbur Word for a creek that can dry up.
Naomi Wilfred. Alawa language.
Burrdanenni spring
The red kangaroo went there. It is south of McDonald lagoon.
Ursula Zaar
Burrunju Ruined city rock formation
From Wuyagiba the catfish travelled to Burrunju and then to Wanmari. The mermaid travelled from here and travelled to Nyawurlbarr.
491500 Location estimated
8422500 Naomi Wilfred
Darban Duck Ponds Billabong
Permanent. The billabong relates to the black duck or wood duck story. People go there to hunt black duck at the time of the first storms.
395000 Location Estimated
8358700 Naomi Wilfred. Rembarrnga language.
Garjarlarmirr Site Dry country near the little Towns River. Track of the mermaid.
Ursula Zaar
Gum creek Sherwin Ck Can completely dry out. It is Ngalakgan country till the Roper River.
424358 Visited
8375075 Ursula Zaar Ngalakgan language.
Inindanda Spring This is a spring which has a round stone at the site. It is located along the old wagon track. The mermaid came from Yumanji to here.
Ursula Zaar
Injawan Waterhole Permanent waterhole on Hodgson River. The mermaid came from Nyardangarina to Injawan, then to Jawalada.
Ursula Zaar
Injay Waterfall The mermaid came from Narliboy to Injay where it danced and made the waterfall. It is located at Hodgson River Station.
402700 Location estimated
8276700 Ursula Zaar

91
Indigenous name
Site Comment Easting Northing Transcribed
Jawa Spring near Jowar / Jawa community G9035424
Perennial spring. The dreamtime story states that five snakes come through here. The snake made the spring. On another meeting, Stephen said that only one snake came through here. It was the quiet snake and it came from Yurrlu to Jennewirri waterhole to Jawa. From Jawa it went to Wangaranidji - which is associated with the black crow.
438719 Site of creek near spring
8371197 Naomi Wilfred. Ngalakgan language.
Jawalarra Jawalada
Grassmere Billabong
The mermaid travelled from Injawan to here and on to Wadamarda. Stephen added later that this is a permanent and important lagoon but no-one will drink the water.
420700 Location estimated
8345000 Naomi Wilfred
Jennewerri The quiet snake came from Yurrlu to here and then on to Jawa. It is located upstream from Badawarrka Outstation.
Ursula Zaar
Langaban The mermaid went from Langaban to Yumanji Creek.
Ursula Zaar
Larrlingnu The quiet snake came from Wangananji to here and then on to Wamarlirr.
Ursula Zaar
Lijarwan After Winnarda the catfish came here and then travelled to Namarlil.
Naomi Wilfred
Linlinji Permanent waterhole.
Permanent waterhole on a tributary to the Hodgson River.
455800 Location estimated
8353600 Naomi Wilfred. Alawa language.
Lumairrma lagoon, at st Vidgeon
From Wanmari the catfish came here and made this permanent waterhole. From here the catfish went to Winnarda
Naomi Wilfred
Manbilila Spring G9035417
Spring at Larrpayanji Outstation.
465549 Visited
8365709 Naomi Wilfred. Alawa.
Mardugurru The mermaid came to this site from Yirrakbunji and travelled on to Wurrunnalda.
Ursula Zaar
Milgawirri Flat area The mermaid travelled from Yumanji creek to here and then to Wirranna. Milgawirri is a flat area near Peter Yard, where it left white paint.
Ursula Zaar
Minyerri Waterhole at Community
Permanent waterhole, related to the goanna and dingo. Guyal tribe.
401700 From map
8317100
Mirrinjinenni Permanent waterhole just across the hill from Minyerri.
Ursula Zaar
Mungamunga word for mermaid Naomi Wilfred. Marra language.
Nabururluyu Mountain ck at hwy. Also known as St Vidgeon crossing.
The river can dry right up from here to Nyawuddi
477800 Location Estimated
8366700 Naomi Wilfred. Marra language.

92
Indigenous name
Site Comment Easting Northing Transcribed
Namarlil Permanent waterhole G9035420
Stephens mothers country. After Lijarwan the catfish arrived here and made the waterhole. This is where its journey stopped.
469610 Visited
8370780 Naomi Wilfred. Marra language.
Nalajirr Hill Near the Towns River. Mermaids travelled past here.
Ursula Zaar
Narliboy Creek The mermaid came from Yaldjamandja to Narliboy creek which is near Hodgson River airstrip, and then to Injay.
Ursula Zaar
Narlumbulumbu Country name Related to swordfish / combfish. Near the wreck of the Young Australian. The Blue tongue sucked them under drowning the boat.
465692 Visited
8368880 Naomi Wilfred. Alawa language.
Nawarlburr Waterhole Stephen said the waterhole can dry out but Sandy said it is permanent.
530300 8324000
Ngaragarlil Waterfall Upstream of Ngardjirri? Mountain Creek area?
? Naomi Wilfred. Alawa language.
Ngarchall Word for spring Alawa language.
Ngardjirri Permanent waterhole.
Permanent waterhole on a tributary to the Hodgson River.
458300 Location estimated
8350100 Naomi Wilfred. Alawa language.
Nyardangarina Waterhole on the Hodgson R
Permanent long waterhole. The name means big flat rock. There are lots of barra there. Felix lived there, but now he's at Hodgson downs. From Wangananji the mermaid journeyed here then travelled to Injawan.
444000 Location estimated
8355800 Naomi Wilfred. Alawa language.
Nyawuddi Permanent waterhole located at the side of Mountain Ck.
A permanent spring but not running. It belongs to a group of mermaids. The area was used by the Murrunggun tribe - part of Alawa clan.
466600 Location estimated
8343700 Naomi Wilfred. Alawa language.
Raerweng Site at Wire Yard, Hodgson R.
Site name. 439200 Location estimated
8353800 Naomi Wilfred
Rocky Crossing Crossing on the Hodgson river.
This is south of the highway crossing on the Hodgson river. The mermaid came from Wurdawawa to here where she left her footprint and travelled to Wangananji
451600 Location estimated
8353400
Uradbungu Tributary to Hodgson River
The creek marks the path of the quiet snake - python. It is the name of the python. All waterholes in this creek dry out.
442800 Location estimated
8354800 Naomi Wilfred
Urralda Area name Area from here to hodgson River. There is an old story related to swordfish which made a swamp.
458160 Visited
8359276 Naomi Wilfred. Alawa language.
Urrlirlinji Caves in Sandstone
East of Warlngudu waterhole. The Devil Devil and kingfisher made the cave. It has 3 doors and is a big cave with bones in it.
467700 Location estimated
8337700 Naomi Wilfred. Alawa language.

93
Indigenous name
Site Comment Easting Northing Transcribed
Wadamarda Permanent waterhole?
Waterhole on the Hodgson river between Jawalarra and Minyerri. There is a spring on top. King Browns are in that country. On one occasion Stephen said Wadamarda is the same as Jawalarra and another time it was Hamilton Lagoon
413700 Location estimated at Hamilton Lagoon
8330000 Naomi Wilfred. Alawa language
Wadangarda Permanent lagoon G9035421
Stephen was born here in 1925.
467826 Visited
8370399 Naomi Wilfred
Wallanji The swamp near Wallinji hill or Alligator Bluff.
The mermaid came from Nyawurlbarr to here.
457700 Location estimated
8366800 Naomi Wilfred. Marra and Wandarrang language.
Wallinji Alligator Bluff - hill
Hill. The site is related to the mermaid.
459400 Location estimated
8367300 Naomi Wilfred. Marra and Wandarrang language.
Wamarlirr Permanent hot water spring.
The quiet snake came from Larrlingnu to here. This is where the journey ended. Wamarlirr is a permanent hot water spring near Peter Yard. It is so hot you can make tea with it. It is smoking. Downstream from it is a permanent cold waterhole. Location estimated.
449300 Location estimated
8301700 Ursula Zaar.
Wanabarlirr Swamp A big swamp that only jungkayi can go to. Track of the mermaids.
Ursula Zaar
Wangananji / Wangaraninji
Waterhole on Hodgson River
Permanent waterhole. The name means crow and the crow created the waterhole. There is black round stone there that marks the place where the crow stopped. On another meeting Stephen explained that the quiet snake came from Jawa to here and then went to Larrlingnu. And that a mermaid came from Rocky Bar Crossing on the Hodgson River to here and travelled on to Nyardangarina.
446100 Location estimated
8355300 Naomi Wilfred. Alawa and Ngalakgan language.
Warlba Word for creek Naomi Wilfred. Alawa language.
Warlngudu Waterhole on Mountain creek.
At the old St Vidgeon station. The mermaid came through here, but didn’t stay travelling on to Yingaiyin. The devil devil came through.
467700 Location estimated
8337700 Naomi Wilfred
Warranyinna Plain Pumpkin Yard plain. Track of the mermaid.
Ursula Zaar
Winnarda From Lumairrma the catfish came here and then travelled to Lijarwan.
Naomi Wilfred
Wirranna Spring The mermaid travelled from Milgawirri to Wirranna spring which is on the Towns river. It is right on top.
Ursula Zaar

94
Indigenous name
Site Comment Easting Northing Transcribed
Wanmari Wonmarri
Waterhole at community Wanmari
From Burrunju the catfish came to Wanmari and then to Lumairrma.
Wulainji Waterhole on Mountain ck
Part of the track of the mermaid.
Naomi Wilfred
Wunuloy Cave Three mermaids stayed here for a while.
Ursula Zaar
Wurdawawa Swamp G9035419
Important permanent swamp where ceremony takes place.
453116 Visited
8356977 Naomi Wilfred. Alawa and Ngalakgan.
Wurdwurdlajinji Spring Spring was made by the mermaid. There is red ochre there.
Ursula Zaar
Wurlinawu Permanent waterhole.
Big permanent waterhole at the top of the Ngaragarlil waterfall. The kingfisher and wild devil devil made the waterhole. Two big hils mark the track from these two. The country belonged to Joshua (deceased). Mountain Creek area?
Naomi Wilfred. Alawa language.
Wurrunnalda Mc Donald Lagoon.
Permanent waterhole. The mermaid came from Mardugurru to here then travelled to the bottom of Minimere waterhole and then turned back to Mc Donald lagoon.
414500 Location estimated.
8298500 Ursula Zaar
Wuyagiba The catfish came from an island near Groote Island, then to Wuyagiba and on to Burrunju.
Yaldjamandja Island in a gorge in general area of Hodgson River
The mermaid came up a gorge to Yaldjamandja then to Narliboy creek.
Ursula Zaar
Yanbarraboyerr River Cox River. Track of the mermaids.
Ursula Zaar
Yandajanda Waterhole on Hodgson River
Waterhole on upstream side Hodgson River at Hwy crossing.
453200 Location estimated
8355200 Naomi Wilfred. Alawa and Marra Language.
Yindiyindi plain Plain This is where the mermaids danced.
Ursula Zaar
Yinggaiyin Spring. Five Mile Spring
The mermaid (Wandimurrungga) came from Warlngudu to Wulainji & travelled to Yingayin. This is a permanent spring which the mermaid created by hitting the rock with a yam stick after which she perished. It is located along the old wagon track. On another occasion Stephen said that a mermaid then went to Umanji from Yinggaiyin.
469200 Location estimated
8334800 Naomi Wilfred.
Yirrakbunji Spring This is a spring in the area of McDonald Yard. The mermaid came from Alinginji to here.
Ursula Zaar

95
Indigenous name
Site Comment Easting Northing Transcribed
Yulmunoorga Hill along Mountain creek. 470000 Location estimated.
8344000
Yumanji / Umanjji Permanent waterhole
Yumanji is a permanent waterhole with barramundi in it. It is on the little Towns River along the old wagon track. The mermaid travelled from Yingayin to here and on to Inindanda. A goanna came from Wunduluerr to here and then on to Yilbiya.
464500 Location estimated
8316700 Naomi Wilfred.
Yumanji creek. creek A mermaid travelled from Langaban to here and then to Milgawirri.
Naomi Wilfred.
Yunbulloy Waterhole Minimere Waterhole 415000 Location estimated
8295000 Ursula Zaar
Yurdbunji Hill at Roper Bar store
The hill marks the Red Kangaroo tracks. From here it is Ngalakgan country till Hodgson River. After Hodgson River is Alawa country. Alawa and Marra country east of Hodgson River.
449800 Location estimated
8370200 Naomi Wilfred. Ngalakgan.
Yurrlu / Yurrlurr This is the beginning of the journey of the quiet snake. Yurrlu is the top area of the Wilton river. The quiet snake came from here and travelled to Jennewerri.
Ursula Zaar
Yurrmurrnugga Permanent waterhole near Mt Young
Ursula Zaar.
Cheon Creek Dry. Soak only. Dries out when the hot weather comes.
Ngalakgan Country
423142 8372999
No name given Deadman spring
A small permanent spring upstream of where Deadmans creek crosses the Minyerri road.
391400 Location estimated
8343200
No name given. Creek and spring
Known as Bullock Yard Creek. Dry creek. Rembarrnga country. There is a perennial spring up top, on the pack horse road. The spring flows into Bullock yard ck.
412000 Location estimated
8368000

96
Roger Rogers On 28.10.1998 Roger Rogers and Henry Rogers accompanied Water Resources officers (Roger
Farrow) to water sites north of the mouth of the Roper River. The information is presented here. The
sites and names coincide with those of Walter Rogers.
Table A6 Indigenous place names and details supplied by Roger Rogers Indigenous name
Site Comment Easting Northing Transcribed
Alirranya Spring G9035151
Flow was 0.3 L/s on 28.10.98 538585 Visited
8391512 Roger Farrow
Arraruru
Waterhole G9035150
Permanent waterhole with no discharge. Many feral animals especially buffalo visit this waterhole which looked degraded. The waterhole has the same name as another about 1 km away. Roger said that the level for this time of year is lower compared to 5 years ago. At that time the water was clear with water lilies. There are old stock yards here.
547450 Visited
8383893 Roger Farrow
Allunbunji Permanent soak G9035152
538591 Visited
8397499 Roger Farrow
Plate A15 Alirranya Spring Alirranya spring provides the first permanent waterhole in a creek. Seepage was from the base of a
rocky hill. Roger explained that the place was in the ‘Bushtime’ a main waterhole. They used to camp
here often.

97
Walter Rogers For Ngukurr and the region north of
Ngukurr Walter is a key elder people refer
to. He travelled with the study team
guiding them to waterholes and springs,
naming the places and explaining cultural
aspects. He spoke of the European and
indigenous history of the sites.
Plate A16 Walter Rogers
Survival water supplies
Plate A17 & A18 Walter standing by a mature Kapok tree and holding a bark water carrier
As a young boy he lead a very traditional life. He relates how he travelled from Ngukurr to Borroloola
when he was only 6 or 7 years old. The party travelled through the Limmen Bight River by canoe in
the Dry season. As there were long distances between waterholes during their long walk they used to
eat the sapling root of the Kapok tree (Cochlospermum gregorii) as a source of water. The Kapok tree
is called Jiwurru in the Marra language. During the walk the guide was the man with the message
stick. There was information on the stick to show the way. For short distances we used a bark water
carrier to hold water.

98
Barnanda Barnanda is goanna dreaming. The goanna
came from Barryamirri. The goanna created
the waterhole. This is a deep waterhole.
The Turkey Lagoon community situated by
the waterhole here doesn’t get flooded. In
the old days people used to stay here and
fish and hunt. The water level will drop more
as it gets drier. Back in the 1950's musterers
trapped horses here. The posts in the water
mark the trap-yard. They recently did a
trapping as there are still many horses here. Plate A19 Barnanda Burrunju Burrunju means catfish in the Wandarrang language. The Burrunju creek is part of the catfish
dreaming. This creek can dry out. The
catfish came all the way from the coast.
Two hills near the creek mark the daughters
of the catfish. The hills are called
Manggurraja and Dulban. The ruined city is
also called Burrunju as it is related to the
catfish. At the ruined city some catfish
stayed and some jumped to Katherine
(Lake?). At the ruined city there are springs
on top which seep all year round. There are
no pools just seepage. The Wandarrang
language runs from Wanmari to Burrunju. Plate A20 Burrunju Creek
Plate A21 Burrunju – The Ruined City

99
Durrungutjbanganya Durrungutjbanganya has permanent water. The
quiet snake and flood water went through here,
all the way to the coast to Port Roper. There is
a song that is sung at circumcision which
relates the journey of the quiet snake which
came down from the Wilton River. This is sung
with women but there is another song
underneath this that is sacred and not sung by
women. Connected to this site is a story of 5
young boys who travelled along the lagoon and
were circumcised. They left their mark along
the lagoon.
Plate A22 Durrungutjbanganya Ganiyarrang
Ganiyarrang is the Ngandi name for the
waterhole and outstation. The outstation uses
a bore near the road. The name means
freshwater crocodile which inhabit the
waterhole. The waterhole can dry up. There is
no-one at the outstation.
Plate A23 Ganiyarrang Waterhole Gurrurrukal - Lake Katherine Community
The community is now deserted. Tourists used
to camp here. The actual Lake Katherine is
permanent but is located south of the
community and is called Warawu. People
used to stay at Gurrurrukul which is a
waterhole to the north but it got flooded so they
moved here. Now they call the waterhole at the
Lake Katherine community Gurrurrukul. The
Phelp river supplied the community.
Plate A24 Gurrurrukal Outstation

100
Jilliwirri waterhole and Costello Outstation. Jilliwirri is the water supply to Costello. Costello is named after the stockman who lived here. He had
his homestead here and stone footings of the homestead can still be seen in the ground. Costello
bread horses for the army during WW1. There is a saying that Costello buried his money here
somewhere as he didn’t want to share it. The site relates to the quiet snake. There is a sacred site
closeby.
Plate A25 & A26 Jilliwirri Waterhole and Costello Malambuybuy Malambuybuy is a permanent deep lagoon which always looks murky. Malambuybuy is a Ngandi
word which means boomerang which the lagoon is named after as it is shaped like a boomerang. The
English name is Boomerang
Lagoon. The dreaming threw a
boomerang which landed here at the
site of the lake. There is no-one at
Boomerang lagoon outstation but for
buffalo shooters. People didn’t stay
here because there is a sacred site
here, the hill, and they didn’t want to
build near it. Also this area gets
flooded so they moved south of
here. The water level drops over
the dry season. There are fresh and
saltwater crocs in the lagoon.
Plate A27 Malambuybuy Lagoon

101
Mitjingili
Plate A28 & A29 Mitjingili
This place is called Mitjingili and belongs to the Manbali clan. It is a permanent waterhole. It was an
important camping area for hunting and fishing. There is a lot of fish and wallaby here. People used to
come and have a big camp here. Over the other side are rock paintings. We like the rangers to go
there because it is fading away. I used to come here a lot with my children when I had my vehicle.
Further upstream from here there is not much in the way of springs. There are soaks. Water comes
from underneath the bed of the creek. All along the creek you see some waterholes but not as big as
this one. This is the main pool here. Some years ago the rangers walked from the Ruined City to
here. Namiliwirri
This permanent waterhole can get
flooded and has saltwater crocodiles
in it. It is related to the goanna
dreaming. It came from Turkey
Lagoon and went underground to
come up at Namiliwirri. A fuel pump
is used to pump water from the
lagoon. There is no-one living here
now. People used to live here a long
time ago, they used to camp here, the
Ngandi people.
Plate A30 Namiliwiri Waterhole

102
Nyawurlbarr (Mission Gorge)
Plate A31 Nyawurlbarr
The water level here will not drop any lower than this. This waterhole is reserved for drinking. There
is a waterhole further upstream which is used for swimming and there is another waterhole further
downstream which was used by the stockmen in the 1950’s. Nyawurlbarr was an important source of water
for Ngukurr community because back in the1950’s the Roper River at Ngukurr became too salty to drink. As the
river was the main water supply people had to look elsewhere for their drinking water. Women and
children and teachers were taken here to live because this is permanent freshwater. No-one was
allowed to swim here, it was used for drinking only. Water was carried away from the waterhole in
drums for washing. Stockmen used the waterhole further downstream. Most of the missionaries and
workers stayed at Ngukurr and obtained their water from Yalwarra lagoon. They drank the water after
boiling it.
Warawu – Lake Katherine This is sugarbag and wild bee
dreaming. The sugarbag flew from
here to nutwood (downs) and created
the spring there at the homestead.
That spring relates to the sugarbag.
Warawu area floods in a big flood. The
water level drops over the dry but it is
permanent. Fresh and saltwater crocs
live in the lagoon.
Plate A32 Warawu

103
Table A7 Indigenous place names and details supplied by Walter Rogers Indigenous name
Site Comment Easting Northing Transcribed
Alirranya Spring G9035151
538400 Location estimated
8391400 Ursula Zaar
Arrarurru
Soak G9035150
You may need to dig for water here.
548300 Location estimated
8383600 Ursula Zaar
Awunbunji Soak G9035152
Permanent soak with clear water. When the Roper river became salty in the ‘50’s stockmen came here and camped with their stock.
539300 Location estimated
8397000 Language Centre.
Balamu Spring or soak
538400 Location estimated
8387750 Ursula Zaar
Banipani Waterhole Large waterhole on the Phelp River.
508200 8427000 Ngandi Language.
Barnanda Turkey Lagoon G9035023
Permanent waterhole by the community
473100 Visited
8393700 Language Centre. Ngandi Language.
Barrabuga
Waterhole on Turkey Lagoon Creek
Permanent waterhole in gorge.
468700 Location estimated
8399000 Ursula Zaar
Barryamirri Site Relates to the dreaming story of the goanna. The goanna came from Barryamirri to Barnanda.
Burrunju Burunju creek. G9035430
Creek near the ruined city. It can dry out.
498118 Visited
8425867 Language Centre. Wandarrang language.
Burrunju Ruined city Rock formation 491500 Location estimated
8422500 Language Centre. Wandarrang language.
Durrungutjbanganya
Waterhole G9035428
Permanent. 492105 Visited
8388115 Language Centre. Ngandi language.
Gamanminymul Towards Washaway creek.
This was a big camp in the old days. There are spear heads there. The name means King Brown snake. (Located just north of study area)
506200 Location estimated
8462800 Language Centre. Ngandi Language.
Ganiyarrang Waterhole G9035429
Waterhole which can dry up and outstation.
502236 Visited
8399741 Language Centre. Ngandi Language.
Gularra Small permanent spring or soak.
This is a permanent spring or soak but sometimes it needs to be dug to gain water, ie hand dug well.
479300 Location estimated
8378600 Language Centre.
Gurrurrukul Billabong of the Phelp River.
This is the indigenous name for the (L. Katherine) community but the actual waterhole is located north of the community. The rainbow serpent came through here.
507200 Location estimated
8425000 Language Centre.
Jilliwirri (Mitjingili) this was corrected to Jilliwirri by Walter later.
Lagoon at Costello G9035022
Water level drops a lot more but it is a deep pool. A solar pump was running when we visited as this is the water supply to Costello.
487167 Visited
8390538 Ursula Zaar. Ngandi Language.

104
Indigenous name
Site Comment Easting Northing Transcribed
Malambuybuy Boomerang lagoon G9035015
Permanent waterhole 509139 Visited
8407969 Language Centre. Ngandi Language.
Mambumambu Waterhole and outstation.
The waterhole gets salty when the water level drops. Water is pumped from the waterhole. There are crocodiles in the waterhole.
535288 Visited
8409938 Language Centre.
Mangajarra
waterhole Big permanent waterhole. This could be the same as Mungajirri waterhole as noted on 50K topographic map.
527200 Location estimated
8393000 Ursula Zaar
Manggurraja and Dulban
2 hills The two hills are relate to the catfish which came from the sea. They mark the daughters from the catfish. Located near the ruined city.
491600 492300 Location estimated
8424300 8424500
Language Centre. Wandarrang language.
Marna
spring Spring and sandy creek. Water runs about 100 m from the spring. There are big trees there in the valley.
478300 Location estimated
8420050 Ursula Zaar
Mayalurra Waterhole Permanent waterhole 522700 Location estimated
8404600 Language Centre. Wandarrang language.
Mirripi Big waterhole Located downstream of Burrunju crossing along Burrunju creek.
Language Centre.
Mitjingili Waterhole on tributary to Turkey Lagoon creek.
Permanent waterhole in the gorge.
482550 Visited
8395501 Language Centre. Ngandi Language.
Nahwugunnya well The wells are in the sand along the coast. You have to dig for the water. The wells are located near the pandanus.
557500 Location estimated
8340000 Ursula Zaar
Najarrwayung Waterhole G9035427
Permanent waterhole. Relates to the Goanna dreaming. Same goanna from Turkey Lagoon.
495729 Visited
8386675 Language Centre.
Namaja Waterhole that dries
Waterhole that dries 501700 Location estimated
8369300 Language Centre. Wandarrang language.
Namiliwiri Waterhole at community G9035033
Permanent waterhole. It gets flooded.
497515 Visited
8386848 Language Centre. Ngandi language.
Nanggabarra Waterhole. This is the only permanent water as the upstream waterholes dry. The water level will drop more as the Dry season progresses. This is where the quiet snake or silver snake was.
487995 8391646 Language Centre. Ngandi Language.
Napurr Gorge The kangaroo went through this gorge.
502300 8368500 Language Centre. Wandarrang language.
Ngunanyin Waterhole This waterhole will dry in a bad year
536400 8400000 Language Centre.

105
Indigenous name
Site Comment Easting Northing Transcribed
Wandarrang language.
Nyajillajilla Waterhole? On the Wilton.
This is at the top of the Wilton near Ferris crossing. The snake and floodwater are there. A song sung before initiation relates to this.
Ursula Zaar. Ngandi Language.
Nyawurlbarr Permanent waterhole and spring G9035425
Mission gorge. 473223 Visited
8380296 Language Centre.
Nyanyalindi
Waterhole. Waterholes at Lake Katherine community. Crocodiles lay their eggs here and women wash here.
507000 Location estimated
8422000
Nyayawuldu
Waterhole Permanent. 513300 Location estimated
8388300 Ursula Zaar
Walmaja Waterhole This waterhole can dry out. 480100 8370700 Language Centre.
Wanmari
Large waterhole on the Phelp River and outstation. G9035000
The catfish came from the sea to here and then went through to Burunju, the ruined city. The catfish created the waterhole here. The waterhole is permanent but in dry years the water level drops more and it gets brackish.
523873 Visited
8401985 Language centre. Wandarrang language.
Warawu
Waterhole. Lake Katherine. G9035432
Permanent. 506587 Visited
8418174 Language centre. Ngandi language.
Warrgujaja Waterhole Waterhole which is fresh now but as the water drops during the dry it will get salty. The mermaid that came from Numbulwar came through here and crossed to kangaroo island.
503600 Location estimated
8364600 Language Centre. Wandarrang language.
Wumulurru Spring This is a spring at the top of Naluwan. It flows all the time for a short distance. The goanna travelled there from Turkey lagoon.
493300 Location estimated
8374300 Language Centre.
Wunuwarriya Waterhole. This waterhole gets brackish. The waterhole dries out - it dried out last year.
534032 Visited
8408729 Language Centre.
Yawurrwarda Yalwarra lagoon G9035433
Permanent lagoon close to Ngukurr.
469300 Visited
8372600 Language Centre.
Yilakal
Waterhole
This waterhole dries up.
506953 Visited
8421913 Language centre. Ngandi language.
Lake Katherine community.
Situated along the Phelp river.
The community is also called Gurrurrukul.
507313 Visited
8421991
No name given spring 550600 Location estimated
8392700
No name given spring. This is a small permanent running spring.
487300 Location estimated
8373200

106
Indigenous name
Site Comment Easting Northing Transcribed
Phelp river River The Phelp River stops flowing here in a very dry year.
510986 8411618
Note: Transcriptions were undertaken at the language centre at Ngukurr with Walter Rogers in attendance. Transcribed by Greg Dickson, John Joshua and Aaron Joshua. The Language Centre was very generous in providing time to undertake these transcriptions. Benny Tyson Benny Tyson lives at Urapunga and is one of the older people who are referred to for knowledge on
the Wilton River area. The table details what he had to say about water for the region. He said that
pigs were a real problem in the area.
Table A8 Indigenous place names and details supplied by Benny Tyson Indigenous name
Site Comment Easting Northing Transcribed
Goyupi Spring/ waterhole
Big spring which runs into the Wilton River. It is a permanent waterhole. It stops flowing in December.
Ursula Zaar
Wallanji waterhole
waterhole Located between Ngukurr and Urapunga. The bottom waterhole is permanent but the top one may dry.
Ursula Zaar
5 mile spring Located 5 miles from Urapunga. Situated north of the Roper, north of Baddawaka. It is a soak and when the water dries out you can always dig for water.
Ursula Zaar
Clarey billabong
This billabong dries out in October.
Ursula Zaar
Crocodile Hole
It is 3-4 mile east of the Wilton. There was a big stock camp there. It stops running in Sept/Oct. It is above Ah Cup waterhole.
Ursula Zaar
Wilton river and Jalboi River
The Wilton stops running but has permanent waterholes all the way along. The Jalboi river stops running but there are permanent waterholes.
Ursula Zaar
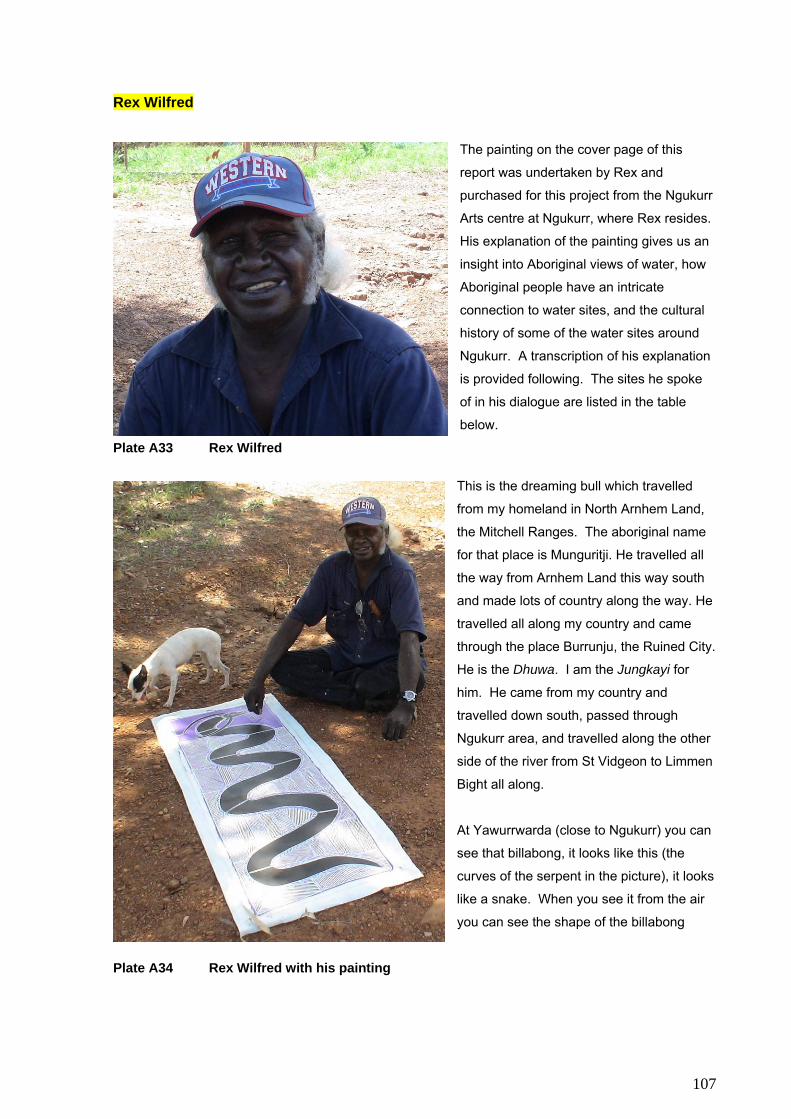
107
Rex Wilfred
The painting on the cover page of this
report was undertaken by Rex and
purchased for this project from the Ngukurr
Arts centre at Ngukurr, where Rex resides.
His explanation of the painting gives us an
insight into Aboriginal views of water, how
Aboriginal people have an intricate
connection to water sites, and the cultural
history of some of the water sites around
Ngukurr. A transcription of his explanation
is provided following. The sites he spoke
of in his dialogue are listed in the table
below. Plate A33 Rex Wilfred
This is the dreaming bull which travelled
from my homeland in North Arnhem Land,
the Mitchell Ranges. The aboriginal name
for that place is Munguritji. He travelled all
the way from Arnhem Land this way south
and made lots of country along the way. He
travelled all along my country and came
through the place Burrunju, the Ruined City.
He is the Dhuwa. I am the Jungkayi for
him. He came from my country and
travelled down south, passed through
Ngukurr area, and travelled along the other
side of the river from St Vidgeon to Limmen
Bight all along.
At Yawurrwarda (close to Ngukurr) you can
see that billabong, it looks like this (the
curves of the serpent in the picture), it looks
like a snake. When you see it from the air
you can see the shape of the billabong
Plate A34 Rex Wilfred with his painting
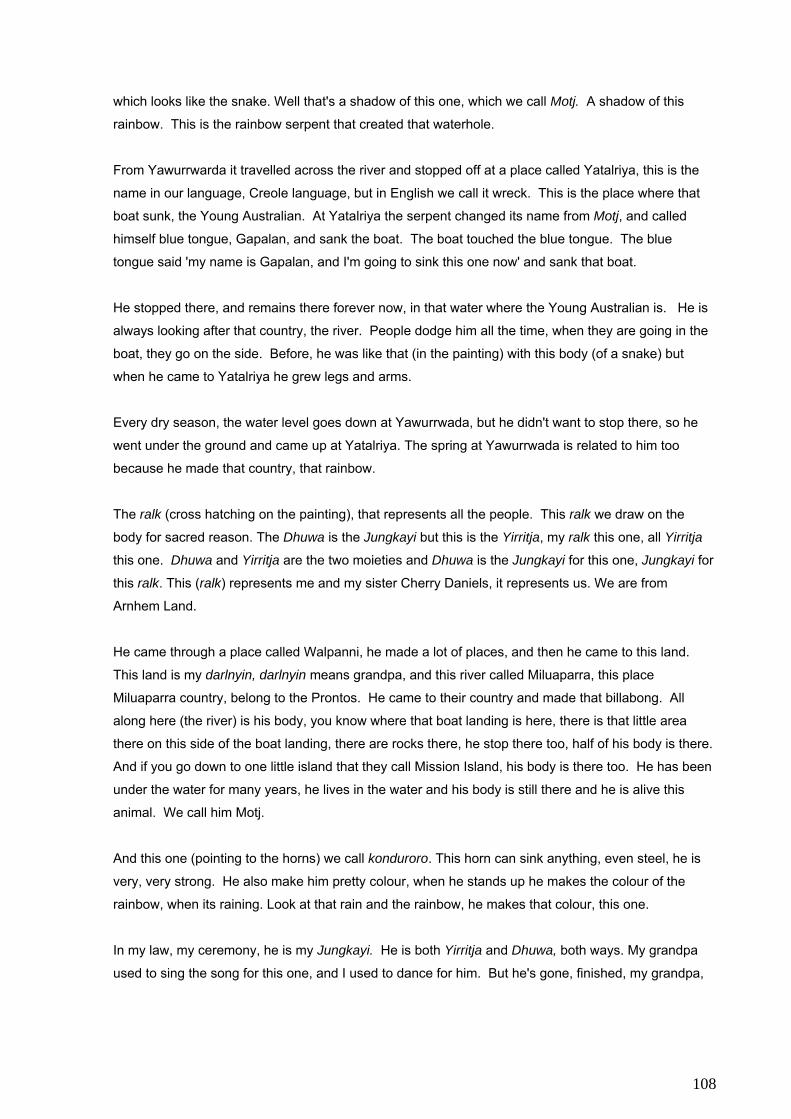
108
which looks like the snake. Well that's a shadow of this one, which we call Motj. A shadow of this
rainbow. This is the rainbow serpent that created that waterhole.
From Yawurrwarda it travelled across the river and stopped off at a place called Yatalriya, this is the
name in our language, Creole language, but in English we call it wreck. This is the place where that
boat sunk, the Young Australian. At Yatalriya the serpent changed its name from Motj, and called
himself blue tongue, Gapalan, and sank the boat. The boat touched the blue tongue. The blue
tongue said 'my name is Gapalan, and I'm going to sink this one now' and sank that boat.
He stopped there, and remains there forever now, in that water where the Young Australian is. He is
always looking after that country, the river. People dodge him all the time, when they are going in the
boat, they go on the side. Before, he was like that (in the painting) with this body (of a snake) but
when he came to Yatalriya he grew legs and arms.
Every dry season, the water level goes down at Yawurrwada, but he didn't want to stop there, so he
went under the ground and came up at Yatalriya. The spring at Yawurrwada is related to him too
because he made that country, that rainbow.
The ralk (cross hatching on the painting), that represents all the people. This ralk we draw on the
body for sacred reason. The Dhuwa is the Jungkayi but this is the Yirritja, my ralk this one, all Yirritja
this one. Dhuwa and Yirritja are the two moieties and Dhuwa is the Jungkayi for this one, Jungkayi for
this ralk. This (ralk) represents me and my sister Cherry Daniels, it represents us. We are from
Arnhem Land.
He came through a place called Walpanni, he made a lot of places, and then he came to this land.
This land is my darlnyin, darlnyin means grandpa, and this river called Miluaparra, this place
Miluaparra country, belong to the Prontos. He came to their country and made that billabong. All
along here (the river) is his body, you know where that boat landing is here, there is that little area
there on this side of the boat landing, there are rocks there, he stop there too, half of his body is there.
And if you go down to one little island that they call Mission Island, his body is there too. He has been
under the water for many years, he lives in the water and his body is still there and he is alive this
animal. We call him Motj.
And this one (pointing to the horns) we call konduroro. This horn can sink anything, even steel, he is
very, very strong. He also make him pretty colour, when he stands up he makes the colour of the
rainbow, when its raining. Look at that rain and the rainbow, he makes that colour, this one.
In my law, my ceremony, he is my Jungkayi. He is both Yirritja and Dhuwa, both ways. My grandpa
used to sing the song for this one, and I used to dance for him. But he's gone, finished, my grandpa,

109
so we don't use that bunggul (ceremony) any more. He has got a son but he doesn't know how to do
(this ceremony), it hasn't been passed on. That's a shame.
This one (serpent) travelled from the Mitchell ranges to here. It Stopped in Galnyin country, my gadu
country, Miluaparra river. I handle him also Miluappara, I know the law of Miluappara.
Plate A35 Wreck of the Young Australian steamer at Yatalriya on the Roper River. Table A9 Indigenous place names and details supplied by Rex Wilfred
Indigenous name
Site Comment Easting Northing Transcribed
Munguritji Mitchell Ranges
Location from which the dreaming bull or Rainbow Serpent came from.
Ursula Zaar
Yatalriya On the Roper River
Site where the wreck of the Young Australian is located.
0465692 Visited
8368880 Ursula Zaar
Miluaparra Reach of the Roper River and country around Ngukurr
Ursula Zaar
Walpanni Site The Rainbow serpent travelled through this location before coming to the Ngukurr region.
Ursula Zaar
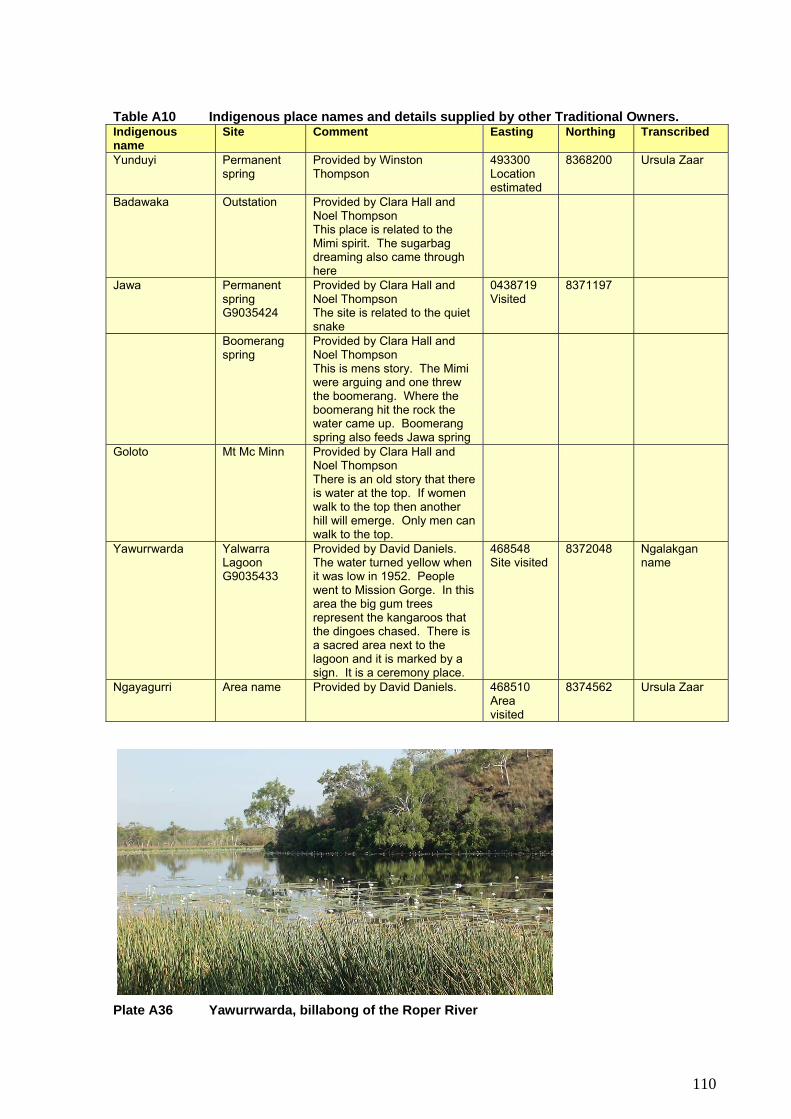
110
Table A10 Indigenous place names and details supplied by other Traditional Owners. Indigenous name
Site Comment Easting Northing Transcribed
Yunduyi Permanent spring
Provided by Winston Thompson
493300 Location estimated
8368200 Ursula Zaar
Badawaka Outstation Provided by Clara Hall and Noel Thompson This place is related to the Mimi spirit. The sugarbag dreaming also came through here
Jawa Permanent spring G9035424
Provided by Clara Hall and Noel Thompson The site is related to the quiet snake
0438719 Visited
8371197
Boomerang spring
Provided by Clara Hall and Noel Thompson This is mens story. The Mimi were arguing and one threw the boomerang. Where the boomerang hit the rock the water came up. Boomerang spring also feeds Jawa spring
Goloto Mt Mc Minn Provided by Clara Hall and Noel Thompson There is an old story that there is water at the top. If women walk to the top then another hill will emerge. Only men can walk to the top.
Yawurrwarda Yalwarra Lagoon G9035433
Provided by David Daniels. The water turned yellow when it was low in 1952. People went to Mission Gorge. In this area the big gum trees represent the kangaroos that the dingoes chased. There is a sacred area next to the lagoon and it is marked by a sign. It is a ceremony place.
468548 Site visited
8372048 Ngalakgan name
Ngayagurri Area name Provided by David Daniels. 468510 Area visited
8374562 Ursula Zaar
Plate A36 Yawurrwarda, billabong of the Roper River
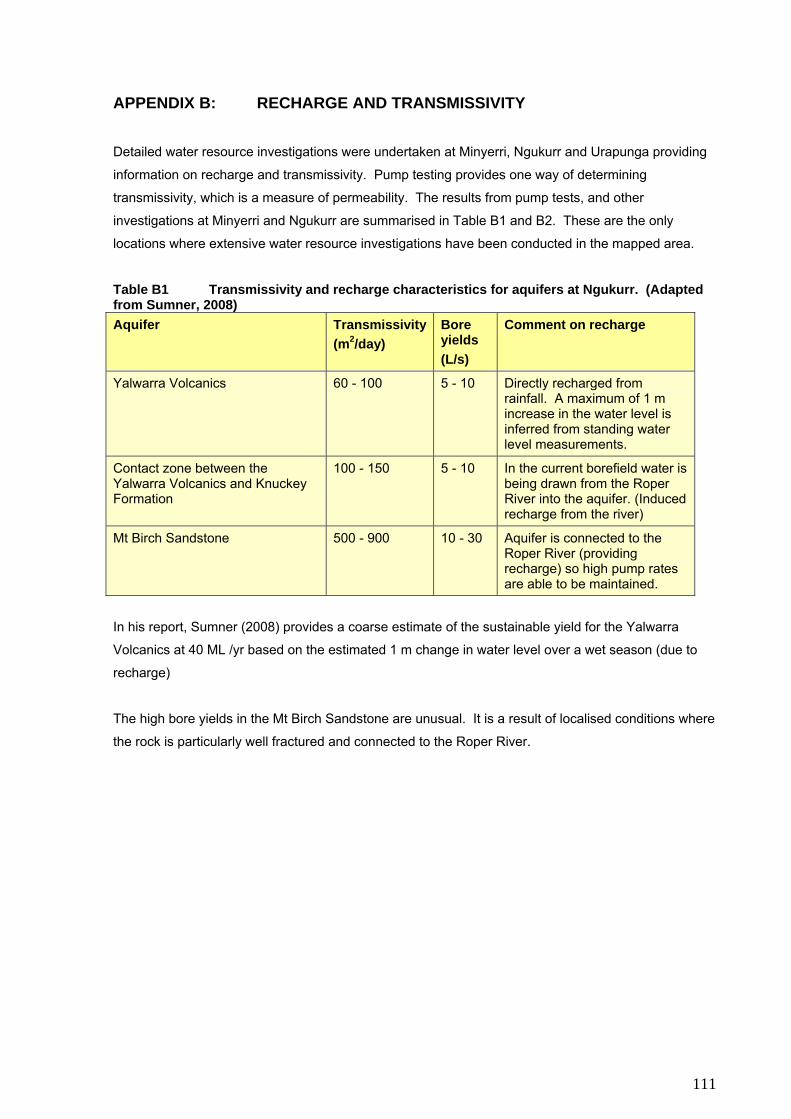
111
APPENDIX B: RECHARGE AND TRANSMISSIVITY
Detailed water resource investigations were undertaken at Minyerri, Ngukurr and Urapunga providing
information on recharge and transmissivity. Pump testing provides one way of determining
transmissivity, which is a measure of permeability. The results from pump tests, and other
investigations at Minyerri and Ngukurr are summarised in Table B1 and B2. These are the only
locations where extensive water resource investigations have been conducted in the mapped area.
Table B1 Transmissivity and recharge characteristics for aquifers at Ngukurr. (Adapted from Sumner, 2008) Aquifer Transmissivity
(m2/day) Bore yields (L/s)
Comment on recharge
Yalwarra Volcanics 60 - 100 5 - 10 Directly recharged from rainfall. A maximum of 1 m increase in the water level is inferred from standing water level measurements.
Contact zone between the Yalwarra Volcanics and Knuckey Formation
100 - 150 5 - 10 In the current borefield water is being drawn from the Roper River into the aquifer. (Induced recharge from the river)
Mt Birch Sandstone 500 - 900 10 - 30 Aquifer is connected to the Roper River (providing recharge) so high pump rates are able to be maintained.
In his report, Sumner (2008) provides a coarse estimate of the sustainable yield for the Yalwarra
Volcanics at 40 ML /yr based on the estimated 1 m change in water level over a wet season (due to
recharge)
The high bore yields in the Mt Birch Sandstone are unusual. It is a result of localised conditions where
the rock is particularly well fractured and connected to the Roper River.
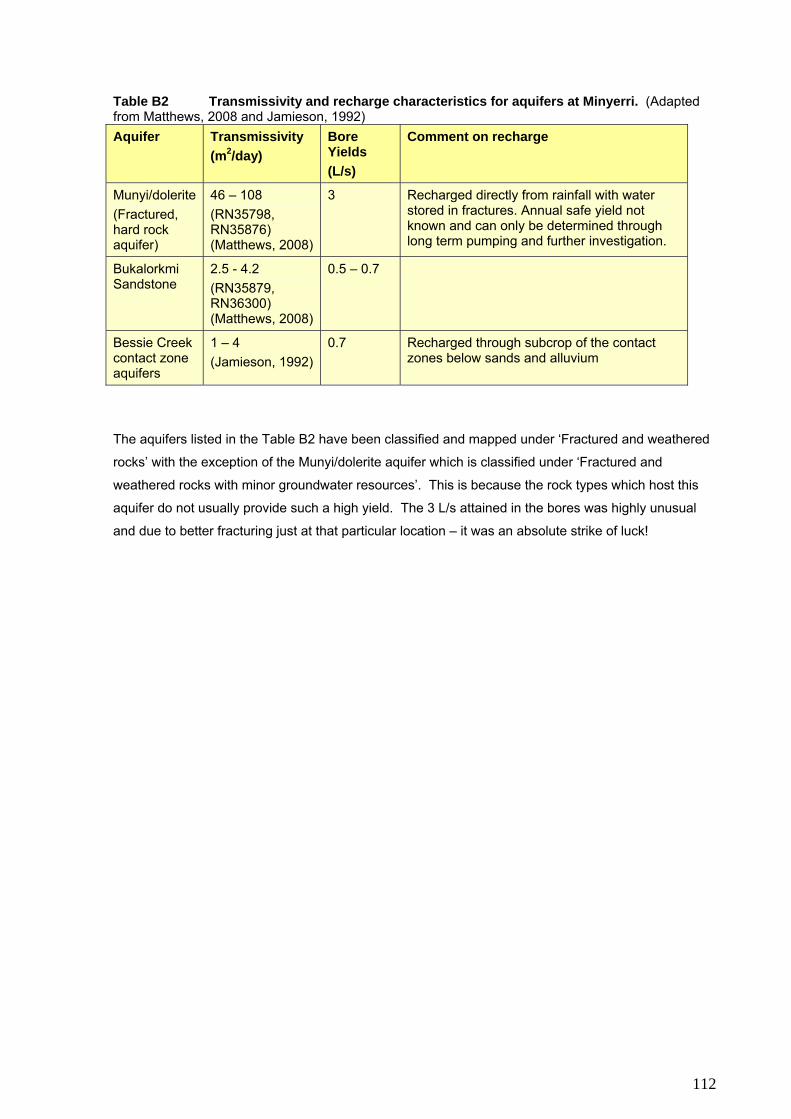
112
Table B2 Transmissivity and recharge characteristics for aquifers at Minyerri. (Adapted from Matthews, 2008 and Jamieson, 1992) Aquifer Transmissivity
(m2/day) Bore Yields (L/s)
Comment on recharge
Munyi/dolerite (Fractured, hard rock aquifer)
46 – 108 (RN35798, RN35876) (Matthews, 2008)
3 Recharged directly from rainfall with water stored in fractures. Annual safe yield not known and can only be determined through long term pumping and further investigation.
Bukalorkmi Sandstone
2.5 - 4.2 (RN35879, RN36300) (Matthews, 2008)
0.5 – 0.7
Bessie Creek contact zone aquifers
1 – 4 (Jamieson, 1992)
0.7 Recharged through subcrop of the contact zones below sands and alluvium
The aquifers listed in the Table B2 have been classified and mapped under ‘Fractured and weathered
rocks’ with the exception of the Munyi/dolerite aquifer which is classified under ‘Fractured and
weathered rocks with minor groundwater resources’. This is because the rock types which host this
aquifer do not usually provide such a high yield. The 3 L/s attained in the bores was highly unusual
and due to better fracturing just at that particular location – it was an absolute strike of luck!

113
APPENDIX C: RECESSION FLOW MEASUREMENTS
Table C1 Recession flow gaugings in cumecs. D
ate
Mat
aran
ka G
9030
176
Els
ey G
9030
013
Mor
oak
G90
3012
3
Judy
Cro
ssin
g
G90
3001
0
Flyi
ng F
ox J
unct
ion
G90
3001
1
Red
Roc
k G
9030
250
Pol
ice
Sta
tion
G90
3001
2
10/09/1953 0.59
04/09/1955 2.15
07/06/1960 2.58
18/08/1963 1.16 2.69 1.39 0.87
10/09/1963 1.13 2.69 0.89 0.29
24/10/1963 0.99 2.35 0.40
28/02/1964 0.75
21/05/1964 2.69 0.81
03/09/1964 0.82 2.18 0.41
14/08/1967 1.09 2.52 1.55 0.75
24/06/1968 1.42 2.68 2.18
22/08/1968 1.21 2.92 1.79 1.03
04/11/1968 0.99 2.52 1.08
27/06/1969 1.20 2.64 1.85 1.38 1.14 1.06
30/11/1969 1.08 2.79 1.01 0.46 0.31 0.07
23/03/1970 1.14 0.63 1.43
18/05/1970 0.98 2.72 1.36 1.07 0.84 0.85
18/07/1970 0.88 2.63 1.14 0.67 0.46 0.26
30/08/1970 0.95 2.54 1.07 0.68 0.39 0.17
17/10/1970 0.85 2.32 0.26 0.10
25/11/1970 0.95 2.07 0.83
17/12/1970 0.71
18/06/1971 1.00 2.36 1.31 0.55
12/08/1971 0.98 2.53 1.16 0.76 0.53 0.29
30/07/1975 2.20 2.74
01/10/1975 1.50 3.35 1.59 0.78
12/10/1976 1.95
26/10/1977 1.09
07/08/1980 2.67 1.99
30/06/1981 1.78 2.96
21/08/1981 1.43 3.83 2.11 1.59
21/09/1982 3.83 1.99 1.46
29/10/1982 1.89 3.68 1.84 1.57 0.81
19/07/1983 1.91 3.73 2.46 1.85 1.00
14/08/1985 4.10 2.70 2.29 2.32
01/10/1985 1.88 1.30
27/05/1986 1.75 3.51 2.25 1.51 1.10
22/07/1986 1.84 3.25 2.26 1.70 1.32
10/09/1986 1.85 3.05 2.01 1.44 0.96

114
20/09/1988 1.66 2.95 1.55 1.07 0.52
02/11/1988 0.26
14/07/1990 1.41 1.88
17/07/1991 1.78 3.39 1.98 1.65 1.29
03/10/1991 1.59 3.16 1.67 1.09 0.59
16/09/1992 1.51 3.14 0.94 0.55
04/10/2002 1.42 4.61 2.85 1.82
13/08/2003 3.82 6.01 4.32
Mat
aran
ka G
9035
255
Els
ey
G90
3529
4
Mor
oak
Jude
s C
ross
ing
G90
3512
2
Lone
som
e D
ove
G90
3506
8
Ups
tream
Fly
ing
Fox
junc
tion
Dow
nstre
am F
lyin
g Fo
x
junc
tion
Red
Roc
k G
9030
250
Rop
er B
ar G
9030
012
*Fly
ing
Fox
Riv
er
G90
3528
7
*Mai
wok
G90
3541
3
*Jal
boi G
9035
414
19/09/2007 2.23 5.388 4.59 3.64 5.14 3.335 3.806 3.185 3.611 0.471
17/11/2007 2.488 5.023 4.8 3.161 3.005 2.706 2.867 2.162 2.612 0.161 0 0
27/06/2008 4.53 7.19 6.77 6.01 6.405 5.722 7.122 6.75 7.32 1.4 0.045 0.063
08/09/2008 3.11 5.6 4.85 4.22 4.16 3.911 4.58 4.27 4.58 0.669 0 0
30/10/2008 2.21 3.95 3.44 2.79 2.92 2.488 2.856 2.62 2.696 0.368 0 0
• Gaugings were undertaken at sites within one week of date noted.
• For years 2007 – 2008:
Moroak site = G9035408+G9035398+G9035076
Upstream Flying Fox Junction site = G9035409+G9035410(sites on channels downstream
from Flying Fox Creek)-G9035287(site at Flying Fox Creek)
Flow has been listed upstream and downstream of Flying Fox junction because of the
significant inflow from the creek.
• Flow measurements were undertaken at Lonesome Dove however the section was poor so
the quality of the gauging is poor. The results are shown however.
• *These are tributary rivers.

APPENDIX D: FLOW LOSS ANALYSIS IN THE ROPER RIVER Section A: Elsey to Moroak
Plate D1 Satellite image of the river between Elsey and Moroak. (Google Earth)
Between Elsey and Moroak lie extensive wetlands which include Red Lily Lagoon (part of the Roper
River channel) and wetlands north and south of this lagoon. After the wetlands the river becomes
braided.
Dry Season flow at Elsey and Moroak
0
1
2
3
4
5
6
7
8
0 1 2 3 4 5 6 7 8Elsey (cumecs)
Mor
oak
(cum
ecs) 1963-1971
1975-19851986-19912002-20032007-2008y=1.169x-1.884
Figure D1 Correlation between gauged flow at Elsey and Moroak, grouped by rainfall period. The line of best fit for all data points is shown. Data points from Table C1. Elsey gauge site = G9030013 1963 – 2003, G9035294 2007- 2008. Moroak gauge site = G9030123 1963 – 2003, G9035408+G9035398+G9035076 2007 – 2008 as discharge occurred in several channels.
Wetland area Braids

In Figure D1 groupings are evident when flow gaugings for Elsey and Moroak are plotted according to
wetter and dryer rainfall periods. The average rainfall for these periods is provided in Table D1. As
expected in periods of higher rainfall, larger baseflows occurred. From 1962 to 1991 the dry and wet
periods appear to plot along the same trend line. The average rainfall for this period (829 mm) is
similar to the long term average (822 mm) (Table D1). 1962-1991 data has therefore been used in
regression analysis to provide an indication of the average loss between the gauge sites. Although
there are not many data points in the extremely wet period, the 2002-2003 flows show to plot
differently to the 2007-2008 flows as they lie either side of the line of best fit.
Table D1 Rainfall periods and averages. For rainfall at Mataranka (See Appendix E).
Rainfall period Average rainfall (mm) Period type
1962/1963-1970/1971 760 Dry
1974/1975-1984/1985 952 Wet
1985/1986-1990/1991 656 Dry
1996/1997-2007/2008 1066 Extremely wet
Long term average 1916/1917-
2007/2008 (91 years)
822
1962/1963-1990/1991 829
Dry Season flow at Elsey and Moroak
0
1
2
3
4
5
6
7
8
0 1 2 3 4 5 6 7 8Elsey (cumecs)
Mor
oak
(cum
ecs)
may-augsept-novy=1.169x-1.884
Figure D2 Correlation between gauged flow at Elsey and Moroak, grouped by month of gauging.
Viewing the data according to which month the gauging was undertaken results in a different trend
emerging (Figure D2). Flow gaugings undertaken late in the Dry between September and November
generally plot below the average line (line of best fit) with the exception of the data from 2002
onwards. This can largely be explained by changes in the evaporation rate. Evaporation is higher in

117
the late Dry compared to the early Dry season; October evaporation (250 mm) is 30% higher than July
evaporation (Table D2). The scatter in both of the plots can also be caused by changes in the
channels. The number of flow channels can vary from year to year affecting evaporation losses. Also
debris could build up or wash away in the outlet channels from the wetland reducing or enlarging the
size of the wetland and the amount of water that discharges further downstream. This has also been
accomplished by human intervention in the past through damming of channels and is documented by
Merlan (1996) and Thonemann (1949).
Table D2 Evaporation rates (From BOM website: www.bom.gov.au/jsp/ncc/climate_averages/evaporation)
Month Evaporation in Elsey-Moroak region
July (early Dry season) 175 mm
October (late Dry season) 250-300 mm
To compare actual losses with expected losses from evaporation during the Dry season the following
calculations were undertaken.
• Regression analysis on flow gaugings during the 1963-1991period
• Regression analysis on the 2007-2008 period as indicative of an extremely wet period (Table
D3)
• Flow loss due to evaporation calculated between Elsey and Moroak gauge sites. (Table D4)
Regression analysis provides a line of best fit through a set of paired data points. The resulting line
has the equation y=mx+c, where ‘y’ is the value on the y-axis (here the downstream flow at Moroak)
and ‘x’ is the value along the x-axis (flow at Elsey) and ‘m’ is the gradient of the line and ‘c’ is where
the line crosses the y-axis, the intercept. Results from the analyses are provided in Table D3.
Table D3 Data analysis for flow gaugings grouped in years noted. (Raw data Table C1)
1963 – 1991 Average period
2007 – 2008 Wet period
1963 – 2008 All years
Intercept -1.51 -0.56 -1.88
gradient 1.03 1.00 1.17
R squared 0.72 0.96 0.93
Calculated average loss m3/s -1.42 -0.54 -1.3
For each group of years the gradient in the regression analysis is close to one (Table D3) which
suggests that there is a constant loss of flow between Elsey and Moroak for each era. That ‘constant’
is provided by the intercept or the calculated average loss (Table D3). These values vary significantly
between the periods: -1.5 m3/s in the representative ‘average’ rainfall period and -0.56 m3/s in the wet
period.
An estimate of the evaporation loss between the sites is provided in Table D4. It includes the
estimated loss from a large wetland which exists along the river between Elsey and Moroak situated

118
north and south of Red Lily Lagoon (Plate D1). Most of the evaporation loss can be attributed to the
wetlands. Total evaporation loss may actually be higher as there are many braids downstream from
the wetland and the evaporation loss from these has not been accounted for in the calculation. Also
the extent of the wetlands are only estimated, they could be larger. The combined estimated
evaporation loss of 1.2 m3/s is close to the calculated ‘average period’ loss of 1.51 or 1.42 m3/s (Table
D3) and therefore provides confirmation that the large decrease in flow between the sites is primarily
due to evaporation.
Table D4 Estimated evaporation losses along the Roper River between Elsey and Moroak An average Dry season evaporation rate of 200 mm/month equivalent to about 7 mm/day was used. Flow loss due to Evaporation = 7 mm/day x length x width of open water area. Open water area length
Open water area width
Evaporation rate
Evaporation over section
Equivalent loss in river flow
Distance between Elsey and Moroak
Average river width
55 km 60 m 7 mm/day 23100 m3/day ≈ 0.3 m3/s
Wetland length (Southern side)
Wetland width (Southern side)
4.75 km 1800 m 7 mm/day 59850 m3/day ≈ 0.6 m3/s
Wetland length (Northern side)
Wetland width (Northern side)
2.2 km 1800 m 7 mm/day 27720 m3/day ≈ 0.3 m3/s
TOTAL 1.2 m3/s
In 2007-2008 losses due to evaporation are expected to be higher because there would be a greater
area of open water between the sites; the flow would spill into more river channels and wetlands would
cover a larger area. But what is observed is that the flow is reduced by only 0.54 m3/s between the
gauge sites in the wet period compared to 1.42 m3/s in the ‘average period’. The discrepancy is
attributed to extra groundwater inflow provided by the Tindall Limestone between the Elsey gauge site
and Red Lily Lagoon. The Tindall Limestone extends as far as Red Lily Lagoon, approximately 10km
further downstream of the Elsey gauge site (Figure D3). During the wet period, recharge to the Tindall
Limestone aquifer would have been significant, resulting in high ground water levels. This in turn
would provide higher spring discharges to the Roper River. Field investigations in 2009 provided
evidence to this and an approximately 10% gain in flow was measured between the Elsey gauge site
and Red Lily Lagoon in May 2009. This exercise should be repeated later in the Dry season to
substantiate and better quantify this finding. Groundwater discharge in this area may also explain the
difference between the 2002-2003 and 2007-2008 gaugings. After successive years of high rainfall
the aquifer water levels probably reached their maximum in 2007-2008 resulting in larger groundwater
discharges to the river in the latter years.
Recommended work:
• Gauge the flow along the river between the Elsey site and the wetland to ascertain how much
groundwater inflows in this section during various months of the Dry Season.

119
• Gauge the flow just downstream from the wetland to find out how much water is used by the
wetland.
• Refine length and width measurements of open water to better estimate evaporative loss.
Figure D3 Excerpt from geology map showing extent of Tindall Limestone. Tindall Limestone is denoted in pink and marked ‘Emt’.
Plate D2 Rodney Metcalfe measuring the flow in one of the channels of the Roper River at Moroak Station

120
Section B: Moroak to Judy Crossing
Plate D3 Satellite image of the river between Moroak and Judy Crossing (Google Earth)
Here the river is extensively braided in the sector close to Judy Crossing.
Dry Season flow at Moroak and Judy's Crossing
0
1
2
3
4
5
6
7
8
0 1 2 3 4 5 6 7 8Moroak (cumecs)
Judy
's
Cro
ssin
g 1969 - 19912007 - 2008y = .879 x - 0.279
Figure D4 Correlation between gauged flow at Moroak and Judy Crossing. Data points from Table C1. Moroak gauge site = G9030123 1963 – 2003, G9035408+G9035398+G9035076 2007 – 2008. Judy Crossing gauge site = G9030010 1969 – 1991, G9035122 2007 – 2008

121
There is less scatter in these points compared to Section A. This is because there are no extensive
wetlands in this section and little to no input from groundwater is expected.
As was done in Section A, data was analysed to ascertain the measured average loss in this section
of the river and comparisons made with the estimated loss due to evaporation.
Table D5 Data analysis for gaugings grouped in years noted. (Raw data from Table C1)
1969 – 1991 Average period
2007 – 2008 Wet period
1969 – 2008 All years
Y-Intercept -0.34 -0.89 -0.28
Gradient 0.93 0.99 0.88
R squared 0.94 0.89 0.97
Average loss -0.47 -0.93 -0.59
Regression analysis suggests a constant loss of 0.34 m3/s between the sites for the period 1969-1991
whereas the calculated average loss was 0.47 m3/s. A much higher loss was calculated for the wet
2007-2008 period (around 0.9 m3/s). This is in line with what may be expected, as in the wet period
the higher flows would spill into more channels in the braided sections which would result in higher
evaporation as there would be a greater area of open water.
Table D6 Estimated evaporation losses along the Roper River between Moroak and Judy Crossing for one channel. Open water area length
Open water area width
Evaporation rate
Evaporation over section
Equivalent loss in river flow
Distance between Moroak and Judy Crossing
Average river width
40 km 60 m 7 mm/day 16,800 m3/day ≈ 0.2 m3/s
An estimate of the evaporation loss for a single channel between the sites is provided in Table D6.
This value of 0.2 m3/s is lower than the calculated losses (Table D5), however the river is well braided
in about a third of this section and this could account for the difference. Given this, the analysis
indicates that flow losses can be due primarily to evaporation.
Recommended work:
• Gauge the flow just upstream and downstream from the braided sections to determine the loss
in these sections
• Refine length and width measurements of open water to better estimate evaporative loss.

122
Section C: Judy Crossing to Flying Fox Junction
Plate D4 Satellite image of the river between Judy Crossing and Flying Fox Junction
(Google Earth)
In this section the river largely consists of a single channel but extensive braids exist in the lower third
of the section.
Dry Season flow at Judy's Crossing and Upstream Flying Fox Jctn
0
1
2
3
4
5
6
7
0 1 2 3 4 5 6 7Judy's Crossing (cumecs)
Upst
ream
Fly
ing
Fox
Jctn
(c
umec
s) 1969 - 19712007 - 2008y=0.975x-.238
Figure D5 Correlation between gauged flow at Judy Crossing and Flying Fox Junction.
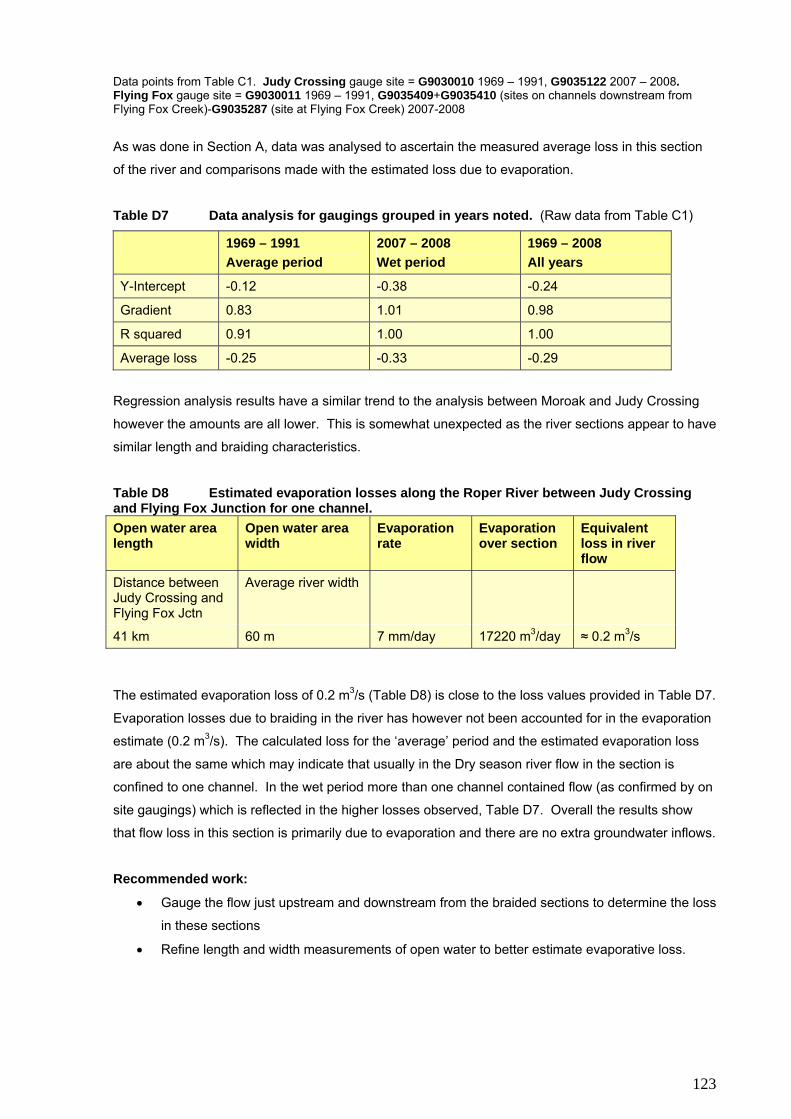
123
Data points from Table C1. Judy Crossing gauge site = G9030010 1969 – 1991, G9035122 2007 – 2008. Flying Fox gauge site = G9030011 1969 – 1991, G9035409+G9035410 (sites on channels downstream from Flying Fox Creek)-G9035287 (site at Flying Fox Creek) 2007-2008
As was done in Section A, data was analysed to ascertain the measured average loss in this section
of the river and comparisons made with the estimated loss due to evaporation.
Table D7 Data analysis for gaugings grouped in years noted. (Raw data from Table C1)
1969 – 1991 Average period
2007 – 2008 Wet period
1969 – 2008 All years
Y-Intercept -0.12 -0.38 -0.24
Gradient 0.83 1.01 0.98
R squared 0.91 1.00 1.00
Average loss -0.25 -0.33 -0.29
Regression analysis results have a similar trend to the analysis between Moroak and Judy Crossing
however the amounts are all lower. This is somewhat unexpected as the river sections appear to have
similar length and braiding characteristics.
Table D8 Estimated evaporation losses along the Roper River between Judy Crossing and Flying Fox Junction for one channel. Open water area length
Open water area width
Evaporation rate
Evaporation over section
Equivalent loss in river flow
Distance between Judy Crossing and Flying Fox Jctn
Average river width
41 km 60 m 7 mm/day 17220 m3/day ≈ 0.2 m3/s
The estimated evaporation loss of 0.2 m3/s (Table D8) is close to the loss values provided in Table D7.
Evaporation losses due to braiding in the river has however not been accounted for in the evaporation
estimate (0.2 m3/s). The calculated loss for the ‘average’ period and the estimated evaporation loss
are about the same which may indicate that usually in the Dry season river flow in the section is
confined to one channel. In the wet period more than one channel contained flow (as confirmed by on
site gaugings) which is reflected in the higher losses observed, Table D7. Overall the results show
that flow loss in this section is primarily due to evaporation and there are no extra groundwater inflows.
Recommended work:
• Gauge the flow just upstream and downstream from the braided sections to determine the loss
in these sections
• Refine length and width measurements of open water to better estimate evaporative loss.

124
Section D: Flying Fox Junction to Red Rock
Plate D5 Satellite image of the river between Flying Fox Junction and Red Rock and Roper Bar (Google Earth)
In this section of the river the flow is largely confined to one channel and two channels in the upper
portion. Braiding continues for a few kilometres just after Flying Fox Junction.
Dry Season flow at Downstream Flying Fox Jctn and Red Rock
0
1
2
3
4
5
6
7
8
0 1 2 3 4 5 6 7 8Downstream Flying Fox Jctn (cumecs)
Red
Rock
(cum
ecs)
1969 - 19712007 - 2008y=0.952x-0.182
Figure D6 Correlation between gauged flow at Flying Fox Junction and Red Rock. Data points from Table C1. Flying Fox gauge site = G9030011 1969 – 1991, G9035409+G9035410 (sites on channels downstream from Flying Fox Creek)-G9035287 (site at Flying Fox Creek) 2007-2008 Red Rock = G9030250 all years

125
Table D9 Data analysis for gaugings grouped in years noted. (Raw data from Appendix C) 1969 – 1991
Average period 2007 – 2008 Wet period
1969 – 2008 All years
Y-Intercept -0.31 -0.54 -0.18
Gradient 1.26 1.02 0.95
R squared 0.97 0.99 0.99
Average loss -0.16 -0.46 -0.29
Regression analysis results are similar to previous sections in that the wet period shows higher losses
than the average period. Again this may be attributed to braids with more channels containing flowing
water in the wet period.
Table D10 Estimated evaporation losses along the Roper River between Flying Fox Junction and Red Rock for one channel. Open water area length
Open water area width
Evaporation rate
Evaporation over section
Equivalent loss in river flow
Distance between Flying Fox Junction and Red Rock
Average river width
35 km 60 m 7 mm/day 14,700 m3/day ≈ 0.2 m3/s
The estimated evaporation loss is very similar to the calculated average loss in the ‘average’ period.
As explained for the adjacent upstream section such good correlation suggests that flow in the river
was confined to one channel in the average rainfall period. In the wet period it was observed that more
than one channel contained flow in this river section (confirmed by on site gaugings) and hence the
higher losses. Overall the results show that flow loss in this section of the river is primarily due to
evaporation and there are no extra groundwater inflows or outflows.
Recommended work:
• Gauge the flow just upstream and downstream from the braided sections to determine the loss
in these sections
• Refine length and width measurements of open water to better estimate evaporative loss.

126
Section E: Red Rock to Roper Bar There is a single channel between these two sites.
Dry Season flow at Red Rock and Roper Bar
012
3456
789
0 1 2 3 4 5 6 7 8Red Rock (cumecs)
Rop
er B
ar (c
umec
s)
227 - 2008y=1.055x+0.155
Figure D7 Correlation between gauged flow at Red Rock and Roper Bar. Data points from Table C1. Red Rock = G9030250, Roper Bar = G9030012
Table D11 Data analysis for gaugings. (Raw data from Table C1)
2007 – 2008 Wet period
Y-intercept 0.16
Gradient 1.06
R squared 0.99
Average gain 0.37
Between these two sites (Plate D5), gaugings were only undertaken during the wet era and the results
show a gain in flow. The river has become a gaining stream. This result is a little unexpected but on
further investigation there is some supporting evidence. Radon analysis was conducted in 2002 along
the Roper River including the Red Rock site and Cook (2003) in his report writes that ‘the data
suggests that significant groundwater inflow occurs near the (Red Rock) gauging station’. The
geology of this area also supports these results. The gauging station lies on outcrop of the Hodgson
Sandstone which is host to numerous small springs (see section on springs) a number of which are
located within a few kilometres of the gauging station. Aside from the Hodgson Sandstone lying
adjacent to the river, the Arnold Sandstone also outcrops along the river about 1.5 km downstream
from Red Rock. The Arnold Sandstone is similar to the Hodgson Sandstone and interestingly this is

127
the only location where it intersects with the river. These two rock formations are likely to be providing
groundwater discharge to the river although the amount of 0.37 cumecs is unexpected.
To test what contribution to flow these sandstone units provide it would be worthwhile to undertake
flow gaugings along this section of the river coincident with the sandstone units with the one flow
meter. The gaugings at the two sites were done by differing flow meters so the gain in flow may also
be attributed to this.
Table D12 Estimated evaporation losses along the Roper River between Red Rock and Roper Bar Open water area length
Open water area width
Evaporation rate
Evaporation over section
Equivalent loss in river flow
Distance between Red Rock and Roper Bar
Average river width
11 km 60 m 7 mm/day 4620 m3/day ≈ 0.05 m3/s
The evaporation loss between the sites would have been provided for by groundwater inflow. Hence
the actual groundwater contribution to the river in this section can be approximated at 0.37 + 0.05 =
0.42 m3/s
Recommended work:
• Gauge the flow at sites along the section coincident with the sandstone units to confirm the
location and amount of gain in flow.

128
APPENDIX E: MATARANKA RAINFALL RECORD
Rainfall has been recorded at Mataranka since 1916 at DR14610, however many years have missing
data. Interpolated long term rainfall data (SILO Data Drill) is however available through the Bureau of
Meteorology for the Mataranka location since 1889 (SILO 1998). Figure E1 provides a plot of the
recorded and interpolated data at Mataranka. Because the data drill record compares very well with
the actual data and has a long and complete record starting in 1889, it has been used in this report as
representative of Mataranka rainfall.
Interpolated and actual annual rainfall at Mataranka
0
200
400
600
800
1000
1200
1400
1600
1800
1916
/191
7
1921
/192
2
1926
/192
7
1931
/193
2
1936
/193
7
1941
/194
2
1946
/194
7
1951
/195
2
1956
/195
7
1961
/196
2
1966
/196
7
1971
/197
2
1976
/197
7
1981
/198
2
1986
/198
7
1991
/199
2
1996
/199
7
2001
/200
2
2006
/200
7Water Year
Rai
nfal
l mm
Interpolated Actual
Figure E1 Actual Wet Season rainfall at Mataranka DR14610 compared with Data Drill interpolated data for the same location. DR14610 data is shown where the wet season record is
complete or where there are minimal missing days.
Water Year refers to the total rain from September of one year to August of the following year so as to
cover the complete wet season.
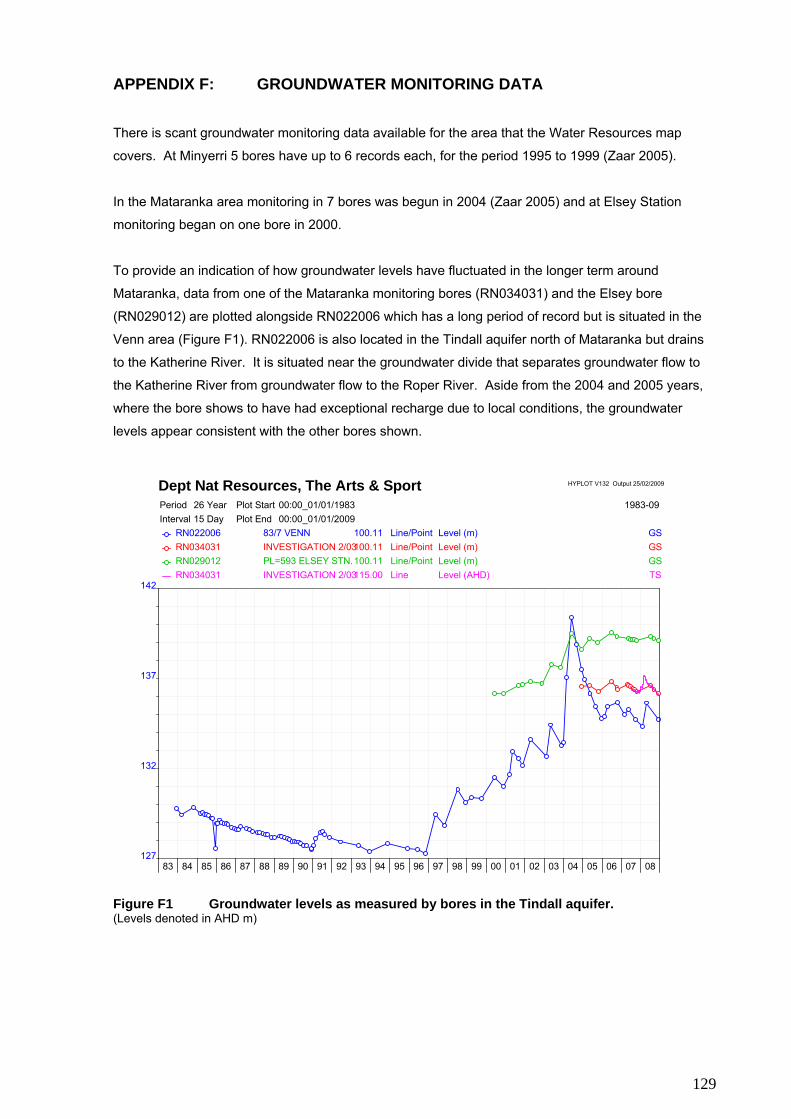
129
APPENDIX F: GROUNDWATER MONITORING DATA
There is scant groundwater monitoring data available for the area that the Water Resources map
covers. At Minyerri 5 bores have up to 6 records each, for the period 1995 to 1999 (Zaar 2005).
In the Mataranka area monitoring in 7 bores was begun in 2004 (Zaar 2005) and at Elsey Station
monitoring began on one bore in 2000.
To provide an indication of how groundwater levels have fluctuated in the longer term around
Mataranka, data from one of the Mataranka monitoring bores (RN034031) and the Elsey bore
(RN029012) are plotted alongside RN022006 which has a long period of record but is situated in the
Venn area (Figure F1). RN022006 is also located in the Tindall aquifer north of Mataranka but drains
to the Katherine River. It is situated near the groundwater divide that separates groundwater flow to
the Katherine River from groundwater flow to the Roper River. Aside from the 2004 and 2005 years,
where the bore shows to have had exceptional recharge due to local conditions, the groundwater
levels appear consistent with the other bores shown.
Dept Nat Resources, The Arts & Sport HYPLOT V132 Output 25/02/2009
Period 26 Year Plot Start 00:00_01/01/1983 1983-09Interval 15 Day Plot End 00:00_01/01/2009
RN022006 83/7 VENN 100.11 Line/Point Level (m) GSRN034031 INVESTIGATION 2/03100.11 Line/Point Level (m) GSRN029012 PL=593 ELSEY STN.100.11 Line/Point Level (m) GSRN034031 INVESTIGATION 2/03115.00 Line Level (AHD) TS
127
132
137
142
83 84 85 86 87 88 89 90 91 92 93 94 95 96 97 98 99 00 01 02 03 04 05 06 07 08
Figure F1 Groundwater levels as measured by bores in the Tindall aquifer. (Levels denoted in AHD m)

APPENDIX G: WHEN THE ROPER RIVER STOPPED FLOWING
Table G1 Rainfall at Mataranka and minimum flow at Roper Bar, when available, for era where flow ceased. Actual (DR14610) rainfall shown in blue (when available), Mataranka Data Drill rainfall data in black.
Year Rainfall
Minimum Flow (cumecs)
Month in which flow ceased
Data source
1944/1945 843
1945/1946 554
1946/1947 651
1947/1948 683
1948/1949 636
1949/1950 987
1950/1951 946
1951/1952 290 0 N/A Inferred by historical account (Cole 1968)
1952/1953 616 0 N/A Inferred from very low flow at G9030013
1953/1954 814 0 June G9030250 F34, G9030012 F42
1954/1955 797 0 July G9030012 F6, F42
1955/1956 1073 0 June G9030250 F34, G9030012 F42
1956/1957 1403 0 April G9030250 F34, G9030012 F42
1957/1958 606 0 September G9030250 F34, G9030012 F42
1958/1959 403 0 June G9030250 F34, G9030012 F42
1959/1960 694 0 August G9030250 F34, G9030012 F42
1960/1961 516 0 March G9030250 F34, G9030012 F42
1961/1962 606 0 March G9030250 F34, G9030012 F42
1962/1963 1038 0 N/A G9030012 F32, F42
1963/1964 509 0 July G9030250 F34
1964/1965 832 0 August G9030250 F34
1965/1966 649 0 September G9030250 F9, F34
1966/1967 834 0 September G9030250 F19, Moretti 1992
1967/1968 873 0.133 G9030250 Gaugings and water level record
1968/1969 719 0.04 G9030250 Gaugings and water level record
1969/1970 665 0 September G9030250 F58, 59. Moretti 1992.
1970/1971 739 0 October G9030250 Gaugings and water level record
1971/1972 690 N/A N/A
1972/1973 912 0 October G9030250 Gaugings and water

131
It is also noted on file G9030012 F39 that the river ceased to flow in 1939 and that there was a severe
drought in that year.
level record. Moretti 1992.
1973/1974 1173 0.09 G9030250 Gaugings and water level record
1974/1975 1014 0.57 G9030250 Gaugings and water level record
1975/1976 1336 1.3 G9030250 Gaugings and water level record
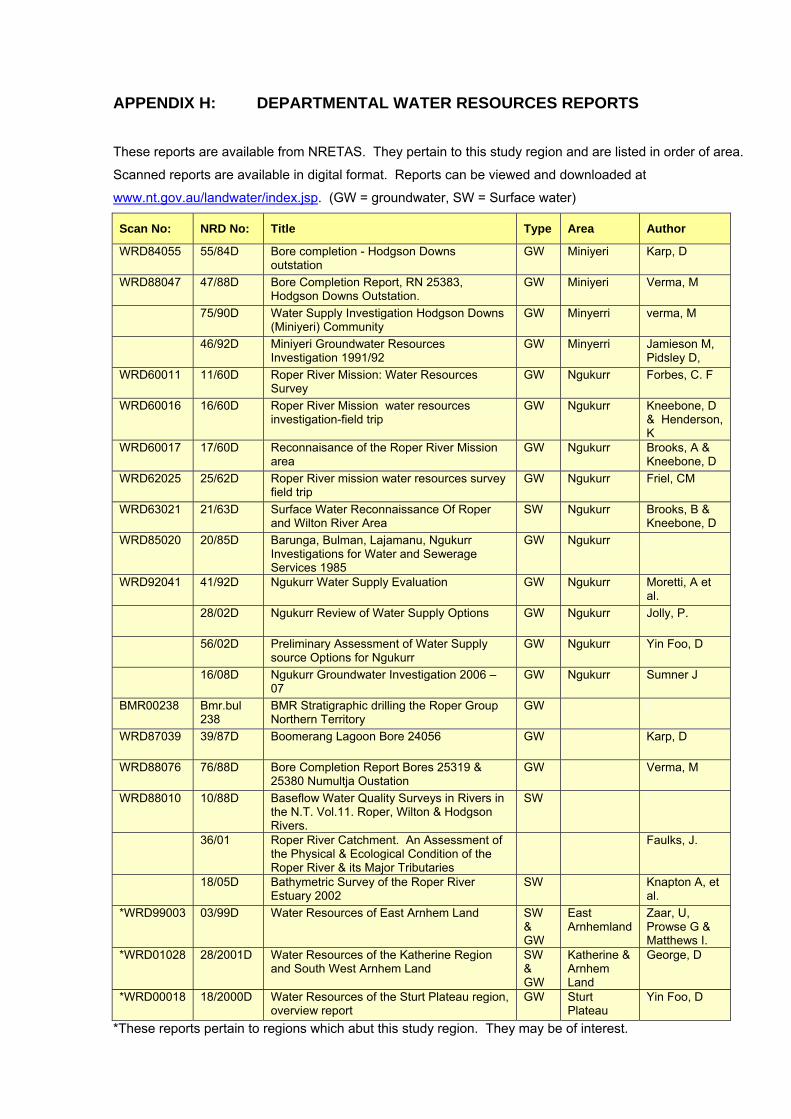
APPENDIX H: DEPARTMENTAL WATER RESOURCES REPORTS
These reports are available from NRETAS. They pertain to this study region and are listed in order of area.
Scanned reports are available in digital format. Reports can be viewed and downloaded at
www.nt.gov.au/landwater/index.jsp. (GW = groundwater, SW = Surface water)
Scan No: NRD No: Title Type Area Author
WRD84055 55/84D Bore completion - Hodgson Downs outstation
GW Miniyeri Karp, D
WRD88047 47/88D Bore Completion Report, RN 25383, Hodgson Downs Outstation.
GW Miniyeri Verma, M
75/90D Water Supply Investigation Hodgson Downs (Miniyeri) Community
GW Minyerri verma, M
46/92D Miniyeri Groundwater Resources Investigation 1991/92
GW Minyerri Jamieson M, Pidsley D,
WRD60011 11/60D Roper River Mission: Water Resources Survey
GW Ngukurr Forbes, C. F
WRD60016 16/60D Roper River Mission water resources investigation-field trip
GW Ngukurr Kneebone, D & Henderson, K
WRD60017 17/60D Reconnaisance of the Roper River Mission area
GW Ngukurr Brooks, A & Kneebone, D
WRD62025 25/62D Roper River mission water resources survey field trip
GW Ngukurr Friel, CM
WRD63021 21/63D Surface Water Reconnaissance Of Roper and Wilton River Area
SW Ngukurr Brooks, B & Kneebone, D
WRD85020 20/85D Barunga, Bulman, Lajamanu, Ngukurr Investigations for Water and Sewerage Services 1985
GW Ngukurr
WRD92041 41/92D Ngukurr Water Supply Evaluation GW Ngukurr Moretti, A et al.
28/02D Ngukurr Review of Water Supply Options GW Ngukurr Jolly, P.
56/02D Preliminary Assessment of Water Supply source Options for Ngukurr
GW Ngukurr Yin Foo, D
16/08D Ngukurr Groundwater Investigation 2006 – 07
GW Ngukurr Sumner J
BMR00238 Bmr.bul 238
BMR Stratigraphic drilling the Roper Group Northern Territory
GW
WRD87039 39/87D Boomerang Lagoon Bore 24056 GW Karp, D
WRD88076 76/88D Bore Completion Report Bores 25319 & 25380 Numultja Oustation
GW Verma, M
WRD88010 10/88D Baseflow Water Quality Surveys in Rivers in the N.T. Vol.11. Roper, Wilton & Hodgson Rivers.
SW
36/01 Roper River Catchment. An Assessment of the Physical & Ecological Condition of the Roper River & its Major Tributaries
Faulks, J.
18/05D Bathymetric Survey of the Roper River Estuary 2002
SW Knapton A, et al.
*WRD99003 03/99D Water Resources of East Arnhem Land SW & GW
East Arnhemland
Zaar, U, Prowse G & Matthews I.
*WRD01028 28/2001D Water Resources of the Katherine Region and South West Arnhem Land
SW & GW
Katherine & Arnhem Land
George, D
*WRD00018 18/2000D Water Resources of the Sturt Plateau region, overview report
GW Sturt Plateau
Yin Foo, D
*These reports pertain to regions which abut this study region. They may be of interest.

133
APPENDIX I: SUMMARY OF BORE INFORMATION
There are no bores in this map region which are currently monitored by NRETAS.
Bores previously monitored are situated at Minyeri and are listed below:
Minyeri
Bore Zone 53 Easting Northing Pipe Commence Cease
No. Records AHD level
RN027815 398796 8310840 1 11/11/1996 02/11/1999 3 64 RN027816 399308 8312185 1 25/09/1995 02/11/1999 6 59 RN027901 401538 8317822 1 25/09/1995 02/11/1999 6 54 RN027906 397687 8318340 1 25/09/1995 02/11/1999 6 62 RN027908 398279 8318383 1 25/09/1995 02/11/1999 6 58
AHD = Australian Height Datum.

134
The following summary data is provided in alphabetical order of land parcel name.
Alawa 1 Aboriginal Land Trust (Hodgson Downs Station)
Site Site Name Zone Easting Northing Start Date
Drill Depth
CasingDepth
Standing water level Yield L/s
RN005027 NEW HOMESTEAD HODGSON DOWNS STN 53 402527 8322366 31/08/1965 153 17 11.6 0.5
RN007322 A=162/70 HODGSON DOWNS STN 53 401627 8317166 24/08/1970 91.4 3.65 10.7 0.2pumped
RN008145 A=21/73 HODGSON DOWNS STN 53 411377 8310416 18/07/1973 45.7 NA NA NA
RN008146 A=23/73 HODGSON DOWNS STN 53 415127 8335066 17/07/1973 76.2 NA NA 0.3
RN008147 6 MILE A=22/73 HODGSON DOWNS STN 53 400027 8322666 16/07/1973 41.1 41.1 7 2.3
RN008436 GIBB 1/74 HODGSON DOWNS STN 53 401327 8315666 29/08/1974 100 Nil NA 0
RN008502 GIBB 74/2 HODGSON DOWNS STN 53 401577 8317266 30/09/1974 38 NA NA NA
RN008503 GIBB 74/3 HODGSON DOWNS 53 402677 8317266 4/10/1974 77 28.4 7.5 1.3
RN008504 GIBB 74/4 HODGSON DOWNS STN 53 401627 8317216 22/10/1974 56 25.5 6.1 1.3
RN021093 HODGSON DOWNS 2/81 HODGSON DOWNS STN 53 400277 8315566 11/09/1981 215 6 NA NA
RN021094 HODGSON DOWNS 1/81 HODGSON DOWNS STN 53 400927 8317166 9/09/1981 160 4 NA 0.2
RN022806 HODGSON DOWNS 1/84 HODGSON DOWNS STN 53 401727 8316866 10/08/1984 76.3 33 3 0.5
RN022807 HODGSON DOWNS 2/84 HODGSON DOWNS STN 53 402127 8316216 11/08/1984 88.5 NA NA 0.9
RN022808 HODGDSON DOWNS 3/84 HODGSSON DOWNS STN 53 401727 8316666 12/08/1984 70.3 38 3 0.9
RN022809 HODGSON DOWNS 4/84 HOGDSON DOWNS STN 53 401547 8316566 14/08/1984 45.9 NA 2.5 0.3
RN023161 HODGSON DOWNS 5/84 HODGSON DOWNS STN 53 401727 8316766 14/08/1984 73.4 NA 2.6 0.6
RN023162 HODGSON DOWNS 6/84 HODGSON DOWNS STN 53 401727 8316616 16/08/1984 61.5 NA 1.7 0.6
RN023163 HODGSON DOWN 7/84 HODGSON DOWN STN 53 401777 8316466 18/08/1984 49.4 NA 4.5 0.5
RN025381 HODGSON DOWNS 1/87 HODGSON DOWNS STN 53 401627 8316566 12/10/1987 150 NA 9 0.4
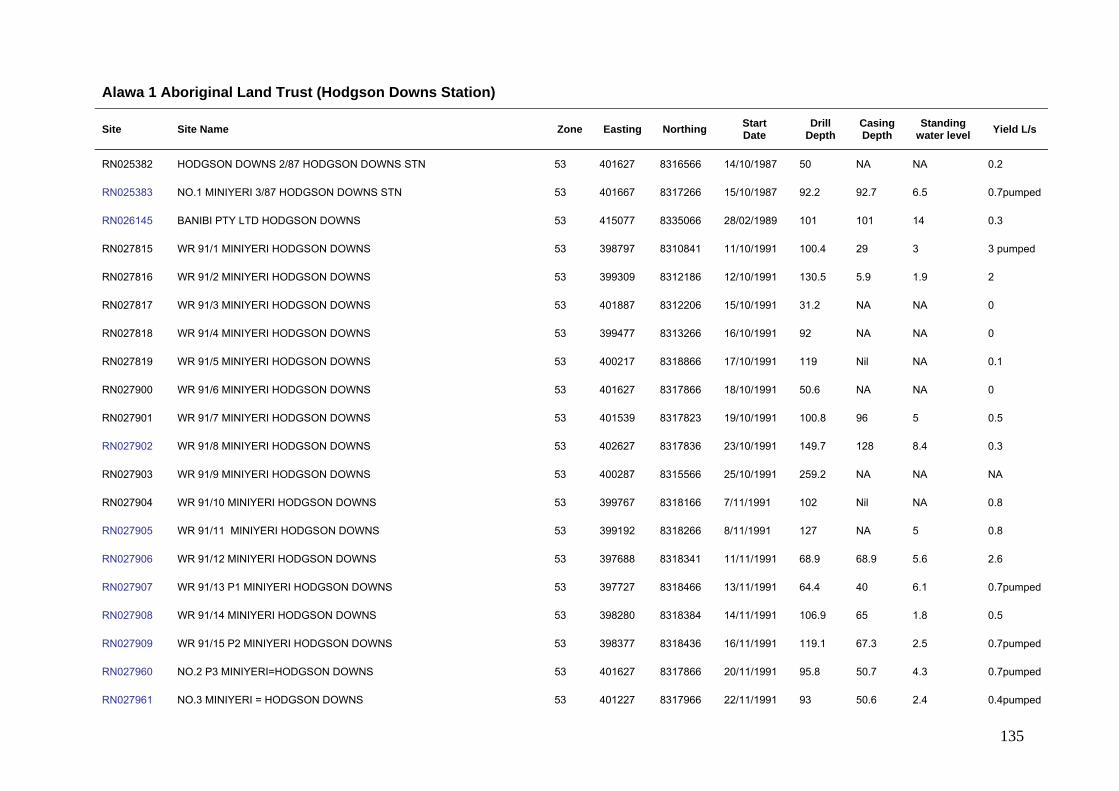
135
Alawa 1 Aboriginal Land Trust (Hodgson Downs Station)
Site Site Name Zone Easting Northing Start Date
Drill Depth
CasingDepth
Standing water level Yield L/s
RN025382 HODGSON DOWNS 2/87 HODGSON DOWNS STN 53 401627 8316566 14/10/1987 50 NA NA 0.2
RN025383 NO.1 MINIYERI 3/87 HODGSON DOWNS STN 53 401667 8317266 15/10/1987 92.2 92.7 6.5 0.7pumped
RN026145 BANIBI PTY LTD HODGSON DOWNS 53 415077 8335066 28/02/1989 101 101 14 0.3
RN027815 WR 91/1 MINIYERI HODGSON DOWNS 53 398797 8310841 11/10/1991 100.4 29 3 3 pumped
RN027816 WR 91/2 MINIYERI HODGSON DOWNS 53 399309 8312186 12/10/1991 130.5 5.9 1.9 2
RN027817 WR 91/3 MINIYERI HODGSON DOWNS 53 401887 8312206 15/10/1991 31.2 NA NA 0
RN027818 WR 91/4 MINIYERI HODGSON DOWNS 53 399477 8313266 16/10/1991 92 NA NA 0
RN027819 WR 91/5 MINIYERI HODGSON DOWNS 53 400217 8318866 17/10/1991 119 Nil NA 0.1
RN027900 WR 91/6 MINIYERI HODGSON DOWNS 53 401627 8317866 18/10/1991 50.6 NA NA 0
RN027901 WR 91/7 MINIYERI HODGSON DOWNS 53 401539 8317823 19/10/1991 100.8 96 5 0.5
RN027902 WR 91/8 MINIYERI HODGSON DOWNS 53 402627 8317836 23/10/1991 149.7 128 8.4 0.3
RN027903 WR 91/9 MINIYERI HODGSON DOWNS 53 400287 8315566 25/10/1991 259.2 NA NA NA
RN027904 WR 91/10 MINIYERI HODGSON DOWNS 53 399767 8318166 7/11/1991 102 Nil NA 0.8
RN027905 WR 91/11 MINIYERI HODGSON DOWNS 53 399192 8318266 8/11/1991 127 NA 5 0.8
RN027906 WR 91/12 MINIYERI HODGSON DOWNS 53 397688 8318341 11/11/1991 68.9 68.9 5.6 2.6
RN027907 WR 91/13 P1 MINIYERI HODGSON DOWNS 53 397727 8318466 13/11/1991 64.4 40 6.1 0.7pumped
RN027908 WR 91/14 MINIYERI HODGSON DOWNS 53 398280 8318384 14/11/1991 106.9 65 1.8 0.5
RN027909 WR 91/15 P2 MINIYERI HODGSON DOWNS 53 398377 8318436 16/11/1991 119.1 67.3 2.5 0.7pumped
RN027960 NO.2 P3 MINIYERI=HODGSON DOWNS 53 401627 8317866 20/11/1991 95.8 50.7 4.3 0.7pumped
RN027961 NO.3 MINIYERI = HODGSON DOWNS 53 401227 8317966 22/11/1991 93 50.6 2.4 0.4pumped

136
Alawa 1 Aboriginal Land Trust (Hodgson Downs Station)
Site Site Name Zone Easting Northing Start Date
Drill Depth
CasingDepth
Standing water level Yield L/s
RN032155 SITE A 53 399027 8311016 26/05/1999 101 5.8 4.2 0.2
RN032156 SITE B 53 398827 8310766 27/05/1999 94 5.8 5.3 0.3
RN032157 NO 1/99 53 399127 8310666 28/05/1999 78 78 14.5 5.5
RN035797 PAWA (MINYERRI) ALAWA 1 ABORIGINAL LAND TRUST 53 399045 8310652 8/07/2008 91.5 42 19 2.3
RN035798 PAWA (MINYERRI) ALAWA 1 ABORIGINAL LAND TRUST 53 398998 8310615 8/07/2008 97.4 80 17.7 3 pumped
RN035799 PAWA (MINYERRI) ALAWA 1 ABORIGINAL LAND TRUST 53 399741 8312264 11/07/2008 139.2 5.7 4.95 1.3
RN035870 PAWA (MINYERRI) ALAWA 1 ABORIGINAL LAND TRUST 53 400722 8326429 12/07/2008 73.5 5.7 NA 0
RN035871 PAWA (MINYERRI) ALAWA 1 ABORIGINAL LAND TRUST 53 405659 8323343 14/07/2008 55.5 5.7 NA 0
RN035872 PAWA (MINYERRI) ALAWA 1 ABORIGINAL LAND TRUST 53 398888 8310348 15/07/2008 49.5 Nil NA 0
RN035873 PAWA (MINYERRI) ALAWA 1 ABORIGINAL LAND TRUST 53 399043 8311093 16/07/2008 90.7 Nil NA 0
RN035874 PAWA (MINYERRI) 53 398675 8311010 1/08/2008 61.5 Nil NA 0
RN035875 PAWA (MINYERRI) 53 398791 8310933 4/08/2008 67.5 60 17.5 8.5
RN035876 PAWA (MINYERRI) 53 398850 8311030 7/08/2008 91.5 68.5 16 2 pumped
RN035877 PAWA (MINYERRI) 53 402982 8324515 9/08/2008 145.2 Nil NA 0
RN035878 PAWA (MINYERRI) 53 403429 8324939 15/08/2008 115.5 115.5 Flowing 0.1
RN035879 PAWA (MINYERRI) 53 403417 8324975 15/08/2008 136 67.6 Flowing 0.7pumped
RN036300 PAWA (MINYERRI) 53 402745 8324958 4/09/2008 150.8 82.0 Flowing 0.5pumped
RN036301 PAWA (MINYERRI) 53 398910 8311247 6/09/2008 61.5 61.5 12.95 0.1
__ Bores drilled into the Bessie Creek contact zone aquifers

137
Arnhem Land Aboriginal Land Trust
Site Site Name Zone Easting Northing Start Date
Drill Depth
CasingDepth
Standing water level Yield L/s
RN002735 TEST NO. 1 NGUKURR 53 470626 8372265 23/09/1961 17.4 NA NA NA
RN002736 TEST NO. 2 NGUKURR 53 470826 8371565 25/09/1961 3.8 NA NA NA
RN002737 TEST NO. 3 NGUKURR 53 473036 8384065 26/09/1961 31.7 NA 8 0
RN002738 TEST NO. 4 NGUKURR 53 474326 8375965 29/09/1961 10.2 NA NA NA
RN002739 TEST NO. 5 NGUKURR 53 472926 8372165 30/09/1961 12.8 NA NA NA
RN002740 TEST NO. 6 NGUKURR 53 479726 8372155 2/10/1961 10.6 NA NA NA
RN002741 TEST NO. 7 NGUKURR 53 475926 8369166 3/10/1961 16.2 NA NA NA
RN002742 TEST NO. 8 NGUKURR 53 492626 8366866 5/10/1961 11.8 NA NA NA
RN002743 TEST NO. 9 NGUKURR 53 492626 8366866 6/10/1961 21.6 NA 9.15 0.2
RN004098 NO. 2 NGUKURR 53 470534 8370965 28/09/1963 85.4 5.8 24.36 1.3
RN004099 NO. 3 NGUKURR 53 473926 8371645 11/10/1963 38.1 NA 17.96 3.9
RN004100 NO. 4 NGUKURR 53 473924 8371640 17/10/1963 19.4 NA 10.98 0.5
RN004219 NO.1 NGUKURR 53 473925 8371646 25/09/1963 43.9 NA 18.51 0.2
RN005955 PROD. 1 NUGKURR 53 469836 8374300 8/11/1967 57.9 51.8 30.38 12pumped
RN006035 PROD. 2 NGUKURR 53 469826 8374100 20/11/1967 50.6 37.8 29 4 pumped
RN006160 N.M.R.R.1 ROPER RIVER 53 533126 8365466 8/07/1968 22.87 NA 2.43 2.5
RN006161 N.M.R.R.2 ROPER RIVER 53 529926 8365916 8/07/1968 45.75 none 9.14 0.5
RN006162 N.M.R.R.3 ROPER RIVER 53 527526 8365766 8/07/1968 30.48 none 12.9 0.2
RN006163 N.M.R.R.4 ROPER RIVER 53 503876 8359866 9/07/1968 91.46 none 6.09 0.7

138
Arnhem Land Aboriginal Land Trust
Site Site Name Zone Easting Northing Start Date
Drill Depth
CasingDepth
Standing water level Yield L/s
RN007868 NO.3 NGUKURR 53 476926 8393065 29/05/1972 106.75 22.875 NA 0
RN007869 NO.2 NGUKURR 53 469016 8384365 26/05/1972 122 3.05 NA 0
RN007870 NO.1 NGUKURR 53 477526 8373965 25/05/1972 48.8 45.5 14.03 1.4
RN009323 78/1 NGUKURR 53 478616 8386165 25/09/1978 15 NA NA 0
RN009324 78/2 NGUKURR 53 469426 8380455 29/09/1978 35 NA NA 0
RN009325 78/3 NGUKURR 53 473026 8379445 6/10/1978 31.5 NA 3.8 0.1
RN009669 79/1 WUYAGIBA 53 555826 8383666 24/10/1979 6 NA NA 0
RN009871 79/3 WUYAGIBA 53 555806 8383646 26/10/1979 6 4 2.75 1
RN009872 79/2 WUYAGIBA 53 555816 8383626 25/10/1979 6 4 2.75 1.2
RN021481 PROD. NO.3 NGUKURR 53 469706 8374165 15/06/1982 49 49 27 5
RN021482 2/82 NAMALURI O/STN. 53 497826 8386665 10/06/1982 37 37 9 2.7
RN021483 1/82 NULLAWAN O/STN. 53 492326 8365516 4/06/1982 30 none 6 3.785
RN021484 2/82 NULLAWAN O/STN. 53 488526 8367566 7/06/1982 73 2 5 0.189
RN021485 3/82 NULLAWAN O/STN. 53 492226 8366366 16/06/1982 43 none NA 0
RN021486 4/82 NULLAWAN O/STN 53 495126 8366566 17/06/1982 43 none NA 0
RN021487 1/82 TURKEY LAGOON O/STN. 53 473126 8393665 8/06/1982 49 none NA 0
RN021488 2/82 TURKEY LAGOON O/STN. 53 473126 8393765 9/06/1982 37 none NA 0
RN021489 1/82 NAMALURI O/STN. 53 497926 8386635 9/06/1982 37 none NA 0
RN021500 1/82 COSTELLO O/STN. 53 487126 8389665 11/06/1982 43 none NA 0
RN021501 2/82 COSTELLO O/STN. 53 487126 8389365 11/06/1982 43 none NA 0

139
Arnhem Land Aboriginal Land Trust
Site Site Name Zone Easting Northing Start Date
Drill Depth
CasingDepth
Standing water level Yield L/s
RN021502 3/82 COSTELLO O/STN. 53 487126 8389265 11/06/1982 30 none NA 0
RN021503 1/82 NGUKURR 53 471626 8373645 12/06/1982 80 2 NA 0
RN021504 2/82 NGUKURR 53 472126 8373765 13/06/1982 27 none NA 0
RN021505 3/82 NGUKURR 53 472326 8373615 14/06/1982 54 2 12 1.3
RN021506 4/82 NGUKURR 53 472526 8373265 14/06/1982 43 none 15 0.75
RN021507 5/82 NGUKURR 53 469526 8373765 16/06/1982 43 none NA 0
RN024055 COMMUNITY DEVELOPMENT BOOMERANG LAGOON 53 504976 8402815 5/11/1985 60 none NA 0
RN024056 COMMUNITY DEVELOPMENT BOOMERANG LAGOON 53 505026 8402165 7/11/1985 23 24 10.8 3
RN030383 WUYAGIBA COMMUNITY 53 556116 8383881 21/11/1995 4 3.95 2.25 1
RN030405 NGUKURR MISSION BORE 53 469926 8373965 11/10/1996 58.2 58 NA 10
RN030407 WUYAGIBA OUTSTATION BORE 53 555926 8383866 18/10/1996 11.5 NA NA NA
RN032802 IVAN BOND 53 469500 8374823 20/10/2000 45 41 NA 8
RN032965 SITE 1 53 502401 8399510 18/07/2001 50 6 NA 0
RN032966 SITE 2 53 502056 8394615 19/07/2001 60 60 7.9 3
RN031986 N.T. GOVT (NGUKURR) 53 466243 8372837 11/11/2006 48.8 43.7 16.15 5.8
RN031987 N.T. GOVT (NGUKURR) 53 466106 8372042 17/11/2006 129 0 15 0
RN031988 N.T. GOVT (NGUKURR) 53 468903 8371998 16/11/2006 73.6 0 7.2 7
RN031989 N.T. GOVT (NGUKURR) 53 471308 8375760 20/11/2006 122.4 0 21.65 4.4
RN034908 D.N.R.E.T.A. (NGUKURR) 53 469826 8371955 23/09/2006 19.6 0 NA 0
RN034909 D.N.R.E.T.A. (NGUKURR) 53 469295 8373352 26/09/2006 79.5 79.5 5.3 9

140
Arnhem Land Aboriginal Land Trust
Site Site Name Zone Easting Northing Start Date
Drill Depth
CasingDepth
Standing water level Yield L/s
RN035300 D.N.R.E.T.A. (NGUKURR) 53 469314 8373832 27/09/2006 55.5 0 NA 0
RN035301 D.N.R.E.T.A. (NGUKURR) 53 468076 8374867 7/10/2006 109.5 64.7 17.3 18
RN035302 D.N.R.E.T.A. (NGUKURR) 53 467499 8375164 6/10/2006 109.5 94.5 14.9 16
RN035315 DEPT.NATURAL RESOURCES ENVIRONMENT AND THE ARTS 53 466785 8375323 31/05/2007 70 69.8 39.15 6.3
RN035316 DEPT. NATURAL RESOUCRES ENVIRONMENT AND THE ARTS 53 467502 8375157 8/06/2007 109.4 33.5 7.2 10
RN035317 DEPT. NATURAL RESOURCES ENVIRONMENT AND THE ARTS 53 468093 8374892 14/06/2007 109.5 48.5 17.7 20
RN035318 DEPT. NATURAL RESOURCES ENVIRONMENT AND THE ARTS 53 465394 8369162 18/06/2007 42.5 0 NA 0
RN035319 DEPT N.R.E.T.A. (NGUKURR) 53 465860 8369522 2/07/2007 44 41.7 4.25 20
RN035510 N.T. GOVT (NGUKURR) 53 472257 8373429 22/11/2006 122.1 0 8.2 7.1
RN035511 N.T. GOVT (NGUKURR) 53 470937 8373966 23/11/2006 61.3 0 19.5 2.8
RN035512 N.T. GOVT (NGUKURR) 53 467631 8374911 25/11/2006 110 42 14.15 3.5
RN035513 N.T. GOVT (NGUKURR) 53 465320 8369175 28/11/2006 42.9 0 5.71 15
RN035514 N.T. GOVT (NGUKURR) 53 464847 8371534 30/11/2006 30.6 0 5.1 2.3
RN035515 N.T. GOVT (NGUKURR) 53 465276 8370390 30/11/2006 54.1 0 10.18 3
RN035720 DEPT N.R.E.T.A. (NGUKURR) 53 465963 8369469 7/07/2007 43.5 41.8 4 26
RN035721 DEPT N.R.E.T.A. (NGUKURR) 53 465957 8369473 13/07/2007 43.5 40.6 4.25 30
Outstation bores denoted by brown font.

141
Big River
Site Site Name Zone Easting Northing Start Date
Drill Depth
Casing Depth
Standing water level
Yield L/s
RN003853 FLYING FOX NO.2 ROPER VALLEY STN. 53 412027 8383865 27/06/1963 106.75 NA 30.5 0.75
RN007088 69/70 MOUNTAIN VALLEY STN. 53 416056 8390065 14/06/1970 76.2 15.25 21.23 0.63
Flying Fox
Site Site Name Zone Easting Northing Start Date
Drill Depth
Casing Depth
Standing water level
Yield L/s
RN008444 Gibb 74/3 Roper Valley 53 377826 8355065 18/09/1974 84 NA NA DUD
RN008443 Gibb 74/2 Roper Valley 53 389826 8355465 5/09/1974 120 NA NA DUD
RN008435 Gibb 74/1 Roper Valley 53 393626 8355365 22/08/1974 66 Nil seepage DUD

142
Goondooloo
Site Site Name Zone Easting Northing Start Date
Drill Depth
Casing Depth
Standing water level
Yield L/s
RN006187 MUNGY BLUFF 1ST. ATT. MOROAK STN. 53 350127 8396465 22/08/1968 53.34 NA NA 0
RN006719 47/61 MOROAK STN. 53 347927 8381915 1/10/1969 30.48 17.06 10.66 2.27
RN024886 A=86/148 GOONDALOO STN 53 337327 8369715 14/11/1986 80 6 NA 0
RN024887 A=149/86 GOONDALOO STN 53 340327 8369565 14/11/1986 102 6 NA 0
RN026301 A=84/121 GOONDOOLOO STN 53 337577 8369790 22/02/1989 120 none 11.65 0
RN026302 A=88/146 GOONDOOLOO STN 53 336877 8368565 23/02/1989 110 none NA 0
Kewulyi Aboriginal Land Trust
Site Site Name Zone Easting Northing Start Date
Drill Depth
Casing Depth
Standing water level
Yield L/s
RN003850 Garden Bore 53 393426 8349265 16.11.62 122 NA NA seepage
RN005037 Roper Valley No 6 53 393776 8349645 21.11.64 138.7 Nil 12.49 0.1
RN030908 Dry Hole 53 393776 8349645 25.10.96 69 Nil NA DUD
RN030909 House bore 53 393500 8349500 26.10.96 98 98 17 0.6

143
Limmen National Park (St Vidgeon Station)
Site Site Name Zone Easting Northing Start Date
Drill Depth
Casing Depth
Standing water level
Yield L/s
RN001310 LION LAGOON HODGSON DOWNS STN 53 495026 8323066 NA 77.8 NA NA NA
RN006161 N.M.R.R.2 ROPER RIVER 53 529926 8365916 8/07/1968 45.75 none 9.14 0.5
RN006163 N.M.R.R.4 ROPER RIVER 53 503876 8359866 9/07/1968 91.5 none 6.09 0.12
RN025319 NUMULTJA 1/87 ST VIDGEON STN 53 547726 8308366 6/10/1987 120 none 8 20
RN025380 NUMULTJA 2/87 ST VIDGEON STN 53 547726 8308366 8/10/1987 37 none 10 10
RN026364 TOLLGATE CREEK 90/1 NGUKURR 53 475626 8367366 26/06/1989 46.3 46.8 9 1.5
RN035728 DEPT N.R.E.T.A. (LIMMEN N.P.) 53 466803 8369557 20/08/2007 31.5 31.5 5.55 9.5
RN035729 DEPT N.R.E.T.A. (LIMMEN N.P.) 53 466253 8368592 21/08/2007 49.5 0 9 0.25
Marra Aboriginal Land Trust
Site Site Name Zone Easting Northing Start Date
Drill Depth
Casing Depth
Standing water level
Yield L/s
RN006160 N.M.R.R.1 ROPER RIVER 53 533126 8365466 8/07/1968 22.875 none 2.43 2.5

144
Moroak
Site Site Name Zone Easting Northing Start Date
Drill Depth
Casing Depth
Standing water level
Yield L/s
RN005188 ADV. 53/65 PEAR TREE MOROAK STN. 53 372977 8367265 23/11/1965 152.5 18.3 9.75 0.05
RN005577 ADV. 55/65 RODMUIR MOROAK STN. 53 361107 8395165 3/08/1966 174.04 NA 16.47 0.37
RN005891 ADV. 109/66 FLAT TYRE MOROAK STN. 53 368627 8381965 22/07/1967 152.5 NA NA 0.12
RN006185 SNAPPY GUM MOROAK STN 53 363427 8393845 15/08/1968 82.96 24.4 FLOWING 0.1
RN006186 BOB GUM 1ST ATT. MOROAK STN. 53 355227 8380265 19/08/1968 122 none NA 0
RN006188 MUNGALO MOROAK STN. 53 360427 8390065 24/08/1968 45.72 NA 6 0.25
RN006189 BOB GUM 2ND ATT. MOROAK STN. 53 359727 8378115 25/08/1968 67.05 none NA 0
RN006308 DI-GUM ADV. 37/58 MOROAK STN. 53 362327 8373165 27/08/1968 5.4 NA NA 0
RN006720 48/69 MOROAK STN. 53 356627 8381065 19/09/1969 91.44 none 15.24 0.25
RN007324 GUMHOLE MOROAK STN. 53 363227 8406865 28/08/1970 68.58 10.66 6.09 0.88
RN007325 165/70 MOROAK STN. 53 370977 8392005 3/09/1970 106.68 none 7.62 0.18
RN007326 166/70 MOROAK STN. 53 357127 8366765 5/09/1970 45.72 none 7.67 1.26
RN007327 167/70 MOROAK STN. 53 367527 8369155 8/09/1970 76.2 11.58 9.14 1.76
RN007328 168/70 MOROAK STN. 53 374827 8362865 11/09/1970 137.16 none 9.14 0.25
RN007329 192/70 MOROAK STN. 53 357127 8364065 16/09/1970 45.72 none NA 0
RN007330 193/70 MOROAK STN 53 378127 8364565 14/09/1970 45.72 none NA 0
RN007331 197/70 MOROAK STN. 53 361947 8373865 19/09/1970 61 none NA 0
RN024249 MC FARLANE T A=88/85 MOROAK STN 53 361427 8372065 11/11/1985 85 none NA 0
RN024250 MC FARLANE T A=85/86 MOROAK STN 53 357727 8367465 11/11/1985 72 none NA 0.75

145
Moroak
Site Site Name Zone Easting Northing Start Date
Drill Depth
Casing Depth
Standing water level
Yield L/s
RN024741 YUMA PTY LTD A=89/85 MOROAK STN 53 365927 8402465 30/08/1986 75 3 10 0.2
RN024742 YUMA PTY LTD A=90/85 MOROAK STN 53 363627 8393265 28/08/1986 77 none NA 0.21
RN024746 YUMA PTY LTD MOROAK 53 357727 8367465 1/09/1986 43 none NA 0
RN027333 ADV. 104/80 MOROAK 53 362927 8399215 31/10/1990 60 none NA 0
RN027334 A=90/103 MOROAK 53 362227 8393465 1/11/1990 50 none NA 0
RN027335 A=90/110 MOROAK 53 371927 8407565 1/11/1990 50 none NA 0
RN028624 34 KL.DUD MOROAK 53 361527 8388665 23/08/1992 90 none NA 0
RN028625 LUCKY BORE MOROAK 53 365377 8397415 25/08/1992 37 37 22 1
RN029239 MOROAK STN BORE PL=751 53 370127 8369165 29/07/1993 97 none NA 0.3
Mt Mc Minn
Site Site Name Zone Easting Northing Start Date
Drill Depth
Casing Depth
Standing water level
Yield L/s
RN008769 SITE B/75 ADV.37/75 ROPER VALLEY STN. 53 440046 8360966 4/09/1975 99 99 4.5 1.26

146
Namul Namul
Site Site Name Zone Easting Northing Start Date
Drill Depth
Casing Depth
Standing water level
Yield L/s
RN003851 AIRSTRIP NO. 5 1ST ATT. ROPER VALLEY STN. 53 397377 8350616 14/06/1963 94.55 none 6.1 0.625
RN003852 AIRSTRIP NO.5 2ND ATT. ROPER VALLEY STN. 53 397377 8350612 19/06/1963 89.97 none NA 0
RN004119 AIRSTRIP NO.5 3RD ATT. ROPER VALLEY STN. 53 397377 8350616 24/10/1963 97.57 6 7.991 0.378
RN004568 HOLE NO.6 (DUD) ROPER VALLEY STN 53 399827 8351866 14/10/1964 152.4 none NA 0
RN004603 6 MILE BORE ROPER VALLEY STN. 53 403777 8351646 14/10/1964 152.4 none NA 0
RN006704 66/69 ROPER VALLEY STN. 53 400927 8349166 27/09/1969 98.4 none NA 0.1
RN006705 67/69 ROPER VALLEY STN. 53 400897 8344966 24/09/1969 152.5 none NA 0.042
RN006707 68/69 ROPER VALLEY STN. 53 394817 8348616 23/09/1969 70.5 14.7 31.16 4.5
RN007083 65/70 MOUNTAIN VALLEY STN. 53 403117 8354765 6/07/1970 76.25 none NA 0.06
RN007084 67/70 MOUNTAIN VALLEY STN. 53 407577 8354366 4/06/1970 106.68 none NA 0
RN007085 63/70 MOUNTAIN VALLEY STN. 53 395577 8354765 8/06/1970 137.16 none NA 0
RN007086 66/70 MOUNTAIN VALLEY STN. 53 413077 8364065 11/06/1970 53.34 15.24 9.14 2.84
RN007087 68/70 MOUNTAIN VALLEY STN. 53 413627 8362157 12/06/1970 76.2 none NA NA
RN008435 GIBB 74/1 ROPER VALLEY STN. 53 393627 8355365 22/08/1974 66 none NA 0
RN008768 MT. COOK SITE ADV. 40/75 ROPER VALLEY STN. 53 415377 8364585 9/09/1975 122 NA NA NA
RN008770 SITE D/75 ADV.39/75 ROPER VALLEY STN 53 413627 8362865 8/09/1975 107 NA NA NA
RN008771 DEEPENING ADV.36/75 ROPER VALLEY STN. 53 410527 8359017 12/09/1975 200 NA NA NA
RN026300 A=89/4 ROPER VALLEY STN 53 404027 8347366 17/02/1989 120 4 20.4 0.2
RN030954 B. TAPP AIRSTRIP BORE NO.2 CHATTAHOOCHIE STATION 53 398227 8349466 27/10/1996 120 120 23 0.4
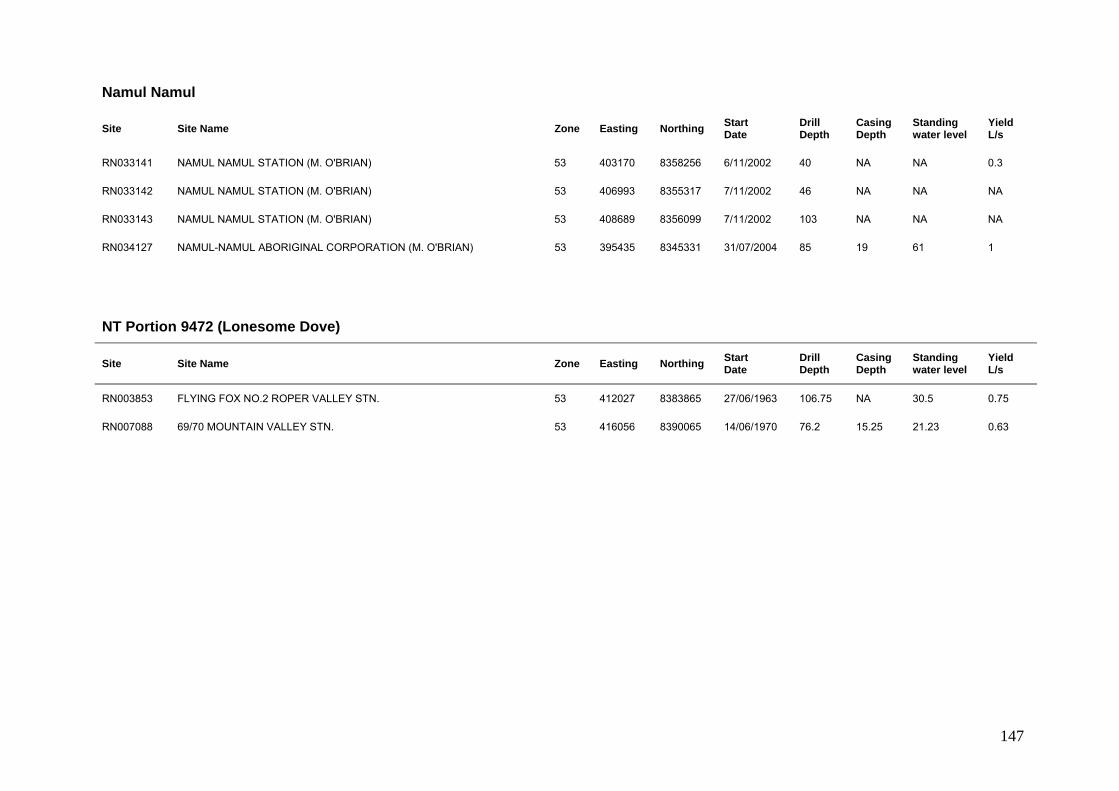
147
Namul Namul
Site Site Name Zone Easting Northing Start Date
Drill Depth
Casing Depth
Standing water level
Yield L/s
RN033141 NAMUL NAMUL STATION (M. O'BRIAN) 53 403170 8358256 6/11/2002 40 NA NA 0.3
RN033142 NAMUL NAMUL STATION (M. O'BRIAN) 53 406993 8355317 7/11/2002 46 NA NA NA
RN033143 NAMUL NAMUL STATION (M. O'BRIAN) 53 408689 8356099 7/11/2002 103 NA NA NA
RN034127 NAMUL-NAMUL ABORIGINAL CORPORATION (M. O'BRIAN) 53 395435 8345331 31/07/2004 85 19 61 1
NT Portion 9472 (Lonesome Dove)
Site Site Name Zone Easting Northing Start Date
Drill Depth
Casing Depth
Standing water level
Yield L/s
RN003853 FLYING FOX NO.2 ROPER VALLEY STN. 53 412027 8383865 27/06/1963 106.75 NA 30.5 0.75
RN007088 69/70 MOUNTAIN VALLEY STN. 53 416056 8390065 14/06/1970 76.2 15.25 21.23 0.63

148
Urapunga Aboriginal Land Trust
Site Site Name Zone Easting Northing Start Date
Drill Depth
Casing Depth
Standing water level
Yield L/s
RN009125 NO.1 URAPUNGA STN 53 453226 8374365 17/09/1977 38.4 39 18.3 3
RN009126 NO.2 URAPUNGA STN 53 453226 8373965 18/09/1977 36 36.5 18 3
RN028126 DUPLICATE HOMESTEAD URAPUNGA 53 452676 8373865 13/05/1992 46.5 46.5 28 3.2
RN030406 WUYAGIBA OUTSTATION 53 454726 8383665 17/10/1996 40 NA NA 0
RN035722 DEPT N.R.E.T.A. (URAPUNGA ABORIGINAL LAND TRUST) 53 453878 8374226 17/07/2007 49.5 0 9.4 1.7
RN035723 DEPT N.R.E.T.A. (URAPUNGA ABORIGINAL LAND TRUST) 53 453740 8373113 19/07/2007 50.9 50.4 9.28 10
RN035724 DEPT N.R.E.T.A. (URAPUNGA ABORIGINAL LAND TRUST) 53 451679 8373777 8/08/2007 91.2 91.2 9.9 8
RN035725 DEPT N.R.E.T.A. (URAPUNGA ABORIGINAL LAND TRUST) 53 452505 8373212 10/08/2007 34.7 24 7.9 7
RN035726 DEPT N.R.E.T.A. (URAPUNGA ABORIGINAL LAND TRUST) 53 453393 8372993 14/08/2007 55.5 55.1 7.7 20
RN035727 DEPT N.R.E.T.A. (URAPUNGA ABORIGINAL LAND TRUST) 53 453496 8372973 17/08/2007 57.5 57.3 7.95 15

149
Wongalara
Site Site Name Zone Easting Northing Start Date
Drill Depth
Casing Depth
Standing water level
Yield L/s
RN008218 80/72 (DUD) MAINORU STN. 53 402677 8432155 30/07/1973 45.75 none NA 0.06
Yutpundji-Djindiwirritj Aboriginal Land Trust
Site Site Name Zone Easting Northing Start Date
Drill Depth
Casing Depth
Standing water level
Yield L/s
RN008208 ROPER BAR STORE (DUD) ROPER RIVER 53 448626 8371765 21/09/1973 91.5 none NA 0
RN009320 78/1 ROPER BAR POLICE STN. 53 447926 8373245 15/08/1978 35 35 NA 0
RN009321 ROPERBAR POLICE STN. 2/78 ROPERBAR POLICE STATION 53 446776 8373265 1/09/1978 21 21 11.2 0
RN009322 78/3 ROPER BAR POLICE STN. 53 447926 8373246 7/09/1978 24 24 NA 0
RN022070 BADUWARRKA O/STN. 53 440506 8375165 18/05/1983 72 72 16 1
RN024332 DIETER ROPER BAR STORE 53 447226 8373165 5/11/1985 50 none NA 0
RN026365 JARWA 90/1 NGUKURR(JOYAR) 53 437626 8372015 26/06/1989 46.3 46.3 9 1.5

150
APPENDIX J: BORE WATER CHEMISTRY
All groundwater contains various kinds of dissolved salts (minerals). Small quantities of many of these salts
are essential to good health. Excessive concentrations however, can limit the uses of the water.
Following is some information to help you interpret the water quality represented on the following pages.
The information has been summarised from NRETAS technical fact sheet @
www.nt.gov.au/nreta/publications/natres/waterfactsheets.html. More information is available from this site.
Source of dissolves salts: Salts in the water originate from minute quantities dissolved in rain water and from the chemical breakdown
of rocks. Nitrate is also produced in the soil by natural biological activity. Over long periods of time
evaporation concentrates them to varying degrees.
Guideline Values: The maximum recommended values listed beside each salt are guidelines rather than strict limits. The
reason for this is because there are often many factors governing how a particular salt affects the user.
These can include a person’s age and the total volume of water consumed. The guidelines given below are
conservatively chosen in order to cover most situations. (Guideline values for stock noted in brown)
Fluoride 1.5 mg/L (Stock 2 mg/L)
This limit is based on health considerations. Excess fluoride can be removed by water
treatment.
Hardness 200 mg/L Hardness is a measure of the amount of calcium and magnesium in the water. Hard
waters can cause the build up of scale in hot water pipes and fittings. They also require
more soap to obtain a lather.
Iron 0.3 mg/L Above this limit, taste may be unacceptable but it does not pose a health problem. High
iron concentrations give water a rust brown appearance resulting in staining of laundry,
pipe encrustation and odour problems. A common way to remove iron is to aerate the
water by cascading it into a tank and allowing the iron to floc or settle.
Nitrate 50 mg/L (Stock 400 mg/L)
Based on health considerations a limit of 50mg/L is recommended for babies less than
three months old and 100mg/L for older children and adults. Nitrate levels can be reduced
if necessary by water treatment.
pH 6.5 - 8.5 (Stock 5.5 – 9.0)
This is a measure of the acidity or alkalinity. Values less than 6.5 indicate acidic water and
can results in corrosion of pipes and fittings. When pH is more than 7.5, the water is
alkaline and encrustation of pipes with calcium carbonate can occur. pH can be treated.
Total Dissolved Solids (TDS) 500 mg/L (Stock 10000 mg/L) Chloride 250 mg/L Sulphate 250 mg/L (Stock 2000 mg/L) Sodium 180 mg/L
Above these limits for TDS, chloride, sulphate and sodium, taste may be unacceptable but
it does not pose a health problem. (Aesthetic guideline only) TDS is approximately equal
to 0.6 x EC
The following bore water chemistry data is provided in alphabetical order of land parcel name.

151
Alawa 1 Aboriginal Land Trust (Hodgson Downs Station)
BoreRN Sample Date
Sample No:
EC (uS/cm) pH Total
Alkalinity Bicarb-onate
Total Hardness TDS Calcium Chloride NaCl Magn-
esium Nitrate Potass-ium Sodium Sulp-
hate Flou-ride Iron Silica Other
Analysis
RN005027 14/10/1968 8671 69 7 26 16 24 50 5 8 3 1 3 5 2 0.2 0.5 11
RN005027 14/10/1968 8672 530 7.7 276 168 256 320 53 16 28 5 2 20 2 0.6 0.2 42
RN007322 27/08/1970 13667 170 6.5 32 39 17 75 5 15 1 7 5 11 7 0.1 37 12
RN007322 22/01/1971 13668 60 5.5 18 22 11 50 1 8 1 1 2 4 2 0.1 1.8 14
RN007322 23/01/1971 13669 72 5.4 20 24 12 44 1 8 1 1 2 4 2 0.1 1.6 13
RN007322 15/11/1971 13670 90 6.1 32 39 25 60 6 9 1 2 2 6 2 0.1 9.5 13
RN007322 15/11/1971 13671 66 5.9 22 27 19 48 3 9 1 1 1 4 2 0.1 5.9 12
RN007322 13/12/1991 13672 80 6.3 22 27 9 55 2 7 11 1 2 2 7 4 0.1 14.6 14
RN008146 1/08/1973 15749 780 8.6 267 327 35 440 6 41 5 2 3 163 45 2 14
RN008147 16/07/1973 15750 69 7.4 23 28 23 52 1 1 5 1 1 4 2 0.4 47 22
RN008503 8/10/1974 17024 110 6.3 30 36 13 73 2 8 2 1 3 13 4 0.2 40 6
RN008503 15/10/1974 17025 100 6.3 33 40 13 79 2 12 34 1 3 13 4 0.2 34 5
RN008503 18/11/1974 17026 77 6.2 29 35 26 13
RN008503 18/11/1974 17027 69 6.1 22 27 13 46 2 10 16 2 1 2 6 8 0.1 17 11
RN008503 29/06/1982 17028 66 6 20 24 12 47 3 4 6 1 1 3 4 2 0.1 6.5 11
RN008503 30/06/1982 17029 64 6.1 17 21 11 8 12
RN008503 12/06/1985 17030 70 6 20 24 7 45 1 6 10 1 1 2 6 1 0.1 10 15
RN008504 16/11/1974 17031 82 6.1 29 35 16 53 3 6 10 2 1 3 7 9 0.1 58 9
RN022806 11/08/1984 42532 260 6.5 56 68 47 170 14 18 30 3 64 29 8 1 0.2 15
RN022806 11/08/1984 42533 85 6.7 5 6 13 85 2 14 21 2 14 10 7 6 0.1 13
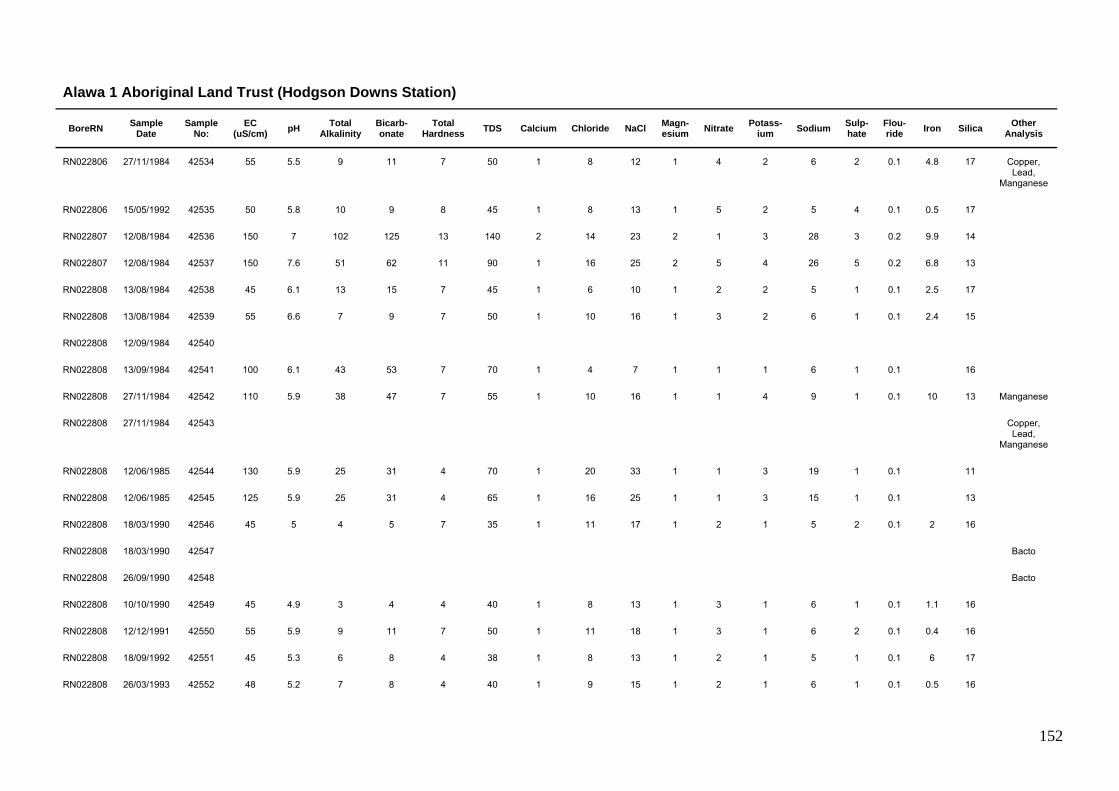
152
Alawa 1 Aboriginal Land Trust (Hodgson Downs Station)
BoreRN Sample Date
Sample No:
EC (uS/cm) pH Total
Alkalinity Bicarb-onate
Total Hardness TDS Calcium Chloride NaCl Magn-
esium Nitrate Potass-ium Sodium Sulp-
hate Flou-ride Iron Silica Other
Analysis
RN022806 27/11/1984 42534 55 5.5 9 11 7 50 1 8 12 1 4 2 6 2 0.1 4.8 17 Copper, Lead,
Manganese
RN022806 15/05/1992 42535 50 5.8 10 9 8 45 1 8 13 1 5 2 5 4 0.1 0.5 17
RN022807 12/08/1984 42536 150 7 102 125 13 140 2 14 23 2 1 3 28 3 0.2 9.9 14
RN022807 12/08/1984 42537 150 7.6 51 62 11 90 1 16 25 2 5 4 26 5 0.2 6.8 13
RN022808 13/08/1984 42538 45 6.1 13 15 7 45 1 6 10 1 2 2 5 1 0.1 2.5 17
RN022808 13/08/1984 42539 55 6.6 7 9 7 50 1 10 16 1 3 2 6 1 0.1 2.4 15
RN022808 12/09/1984 42540
RN022808 13/09/1984 42541 100 6.1 43 53 7 70 1 4 7 1 1 1 6 1 0.1 16
RN022808 27/11/1984 42542 110 5.9 38 47 7 55 1 10 16 1 1 4 9 1 0.1 10 13 Manganese
RN022808 27/11/1984 42543 Copper, Lead,
Manganese
RN022808 12/06/1985 42544 130 5.9 25 31 4 70 1 20 33 1 1 3 19 1 0.1 11
RN022808 12/06/1985 42545 125 5.9 25 31 4 65 1 16 25 1 1 3 15 1 0.1 13
RN022808 18/03/1990 42546 45 5 4 5 7 35 1 11 17 1 2 1 5 2 0.1 2 16
RN022808 18/03/1990 42547 Bacto
RN022808 26/09/1990 42548 Bacto
RN022808 10/10/1990 42549 45 4.9 3 4 4 40 1 8 13 1 3 1 6 1 0.1 1.1 16
RN022808 12/12/1991 42550 55 5.9 9 11 7 50 1 11 18 1 3 1 6 2 0.1 0.4 16
RN022808 18/09/1992 42551 45 5.3 6 8 4 38 1 8 13 1 2 1 5 1 0.1 6 17
RN022808 26/03/1993 42552 48 5.2 7 8 4 40 1 9 15 1 2 1 6 1 0.1 0.5 16

153
Alawa 1 Aboriginal Land Trust (Hodgson Downs Station)
BoreRN Sample Date
Sample No:
EC (uS/cm) pH Total
Alkalinity Bicarb-onate
Total Hardness TDS Calcium Chloride NaCl Magn-
esium Nitrate Potass-ium Sodium Sulp-
hate Flou-ride Iron Silica Other
Analysis
RN022808 4/10/1996 158302 48 5.47 6.6 8 6.6 42 1 7 11.54 1 2 1 6 1 1 8.8 14
RN022808 4/10/1996 154890 48 5.5 7 8 7 42 1 7 12 1 2 1 6 1 0.1 8.8 14
RN022808 27/10/1997 158303 47 5.3 5.7 7 4.1 41 1 10 16.48 1 3 1 6 1 0.1 0.3 39
RN022809 14/08/1984 42553 120 6.6 26 32 28 1 12 20 6 4 8 13 21 0.1 13
RN023161 15/08/1984 45123 60 6.4 26 32 19 60 1 6 10 4 6 4 8 2 0.1 16
RN023162 18/08/1984 45124 50 6.2 18 22 7 45 1 8 13 1 1 4 7 1 0.1 2.9 16
RN023162 18/08/1984 45125 55 6.6 7 9 7 45 1 14 21 1 1 3 7 2 0.1 2.5 15
RN023163 18/08/1984 45126 60 6.3 19 23 7 50 1 9 15 1 2 4 8 1 0.1 3.7 17
RN025383 13/11/1987 49037 60 5.6 13 15 9 40 1 2 4 1 1 2 5 4 0.1 5.6 13
RN025383 18/03/1990 49038 Bacto
RN025383 18/03/1990 49039 60 5.7 17 21 7 40 1 7 12 1 1 2 5 3 0.1 17.2 13
RN025383 21/11/1991 49040 45 6 7 9 6 35 1 6 10 1 1 1 5 3 0.1 7.7 13
RN025383 19/05/1992 49041 7.4
RN025383 19/05/1992 49042 7.1
RN025383 20/05/1992 49043 6.9 Copper, Lead,
Manganese
RN025383 21/05/1992 49044 5.7 Copper, Lead,
Manganese
RN025383 18/09/1992 49045 46 5.8 3 10 7 67 1 6 10 1 1 2 5 3 0.1 5.9 14
RN025383 26/03/1993 49046 63 5.9 18 22 7 49 1 5 8 1 1 2 5 7 0.1 7.7 14
RN025383 30/10/1995 146356 47 5.5 8 10 7 21 1 4 7 1 1 2 5 6 0.1 2.9 13

154
Alawa 1 Aboriginal Land Trust (Hodgson Downs Station)
BoreRN Sample Date
Sample No:
EC (uS/cm) pH Total
Alkalinity Bicarb-onate
Total Hardness TDS Calcium Chloride NaCl Magn-
esium Nitrate Potass-ium Sodium Sulp-
hate Flou-ride Iron Silica Other
Analysis
RN025383 1/11/1995 146357 58 5.7 12 15 7 14 1 8 13 1 1 2 7 9 0.1 9.3 13
RN025383 1/11/1995 148 Bacto
RN025383 16/08/1996 158346 550 3.08 0 19.8 200 3 1 1 3 2 2 5 1 0.1 46 14
RN025383 16/08/1996 154895 550 3.1 1 0 20 200 3 1 1 3 2 2 5 1 0.1 46 14
RN025383 4/10/1996 157401 49 5.43 16.4 20 19.1 49 6 7 11.54 1 1 2 5 5 0.1 5.2 14
RN025383 4/10/1996 154896 49 5.4 16 20 19 49 6 7 12 1 1 2 5 5 0.1 5.2 14
RN025383 11/11/1996 158347 58 6 14.8 18 11.6 38 3 6 10 1 1 1 4 6 0.1 13.5 13
RN025383 27/10/1997 158348 41 5.3 7.4 9 6.6 36 1 8 13.18 1 1 1 5 1 0.1 48 18
RN026145 1/03/1989 49735 550 7.7 250 304 120 320 25 18 30 14 6 24 68 23 0.7 10
RN027815 12/10/1991 51039 355 7.3 150 183 121 220 24 18 30 15 1 7 32 18 0.3 36
RN027815 20/05/1992 51040 330 6.8 121 147 100 205 22 16 26 11 1 6 24 16 0.3 1 28
RN027815 20/05/1992 51041 320 6.8 117 143 98 200 21 15 24 11 1 6 23 15 0.3 1.2 33
RN027815 13/06/2000 368 337 6.8 150.1 183 114 178 21 7 11.5 15 1 6 23 20 0.3 0.1 22
RN027815 20/06/2000 369 2.8
RN027816 15/10/1991 51042 820 7.8 207 253 176 450 39 114 188 19 1 12 102 33 0.3 15
RN027901 23/10/1991 51103 75 6.8 11 13 8 55 2 8 13 1 1 2 10 12 0.1 2.6 17
RN027902 24/10/1991 51104 625 8 193 235 118 375 21 35 58 15 1 21 89 80 0.4 10
RN027905 9/11/1991 51105 8140 7.7 150 183 1452 5250 108 1988 3276 281 1 35 1249 1109 0.3 12
RN027906 12/11/1991 51106 30 6.3 4 5 4 35 1 6 10 1 1 3 5 3 0.1 2.5 19
RN027907 14/11/1991 51107 25 6.4 4 5 1 35 1 5 8 1 1 1 4 2 0.1 0.7 19
RN027907 12/05/1992 51108 30 5.2 5 6 4 35 1 7 11 1 1 1 3 3 0.1 1.3 19

155
Alawa 1 Aboriginal Land Trust (Hodgson Downs Station)
BoreRN Sample Date
Sample No:
EC (uS/cm) pH Total
Alkalinity Bicarb-onate
Total Hardness TDS Calcium Chloride NaCl Magn-
esium Nitrate Potass-ium Sodium Sulp-
hate Flou-ride Iron Silica Other
Analysis
RN027908 15/11/1991 51109 395 8.2 143 174 63 235 17 37 60 5 1 17 52 5 0.3 4.7 15
RN027908 16/11/1991 51110 385 7.3 137 167 52 220 12 34 55 5 1 13 52 11 0.3 14
RN027909 20/11/1991 51111 345 8 126 154 49 195 13 32 52 4 1 8 44 7 0.2 3.1 13
RN027909 8/05/1992 51112 360 7.4 114 139 76 190 24 33 55 4 1 7 42 9 0.1 0.1 15
RN027960 22/11/1991 51149 60 6.8 15 18 8 45 2 6 10 1 1 3 7 5 0.1 4.7 13
RN027960 10/12/1991 51150 60 6.1 13 16 6 40 1 6 10 1 1 2 7 4 0.1 4.1 12
RN027960 1/11/1995 146358 71 5.9 19 23 7 13 1 10 16 1 1 2 9 6 0.1 5 13
RN027960 1/11/1995 25 Bacto
RN027960 4/10/1996 158402 55 5.8 14 17 19.1 42 6 6 10 1 1 2 6 6 0.1 2.6 12
RN027960 4/10/1996 154900 55 5.8 14 17 19 42 6 6 10 1 1 2 6 6 0.1 2.6 12
RN027960 11/11/1996 158403 65 6.2 19.7 24 11.6 45 3 4 6.6 1 1 1 6 5 0.1 2.6 10
RN027960 27/10/1997 158404 124 6.1 51 62 39.1 85 14 6 10 1 1 2 7 4 0.1 2.6 28
RN027961 25/11/1991 51151 60 6.9 19 24 12 45 3 6 10 1 1 2 6 3 0.1 1.6 13
RN027961 14/05/1992 51152 3.9
RN027961 15/05/1992 51153 55 5.8 15 18 7 45 1 6 10 1 1 2 5 2 0.1 2.6 14
RN027961 15/05/1992 51154 2.6 Copper, Lead,
Manganese
RN027961 1/11/1995 146359 51 5.8 14 17 7 9 1 8 13 1 1 2 6 7 0.1 2.6 13
RN027961 1/11/1995 24 Bacto
RN027961 4/10/1996 158405 42 7.23 13 16 6.6 40 1 4 6.6 1 1 2 5 3 0.1 2.4 12
RN027961 4/10/1996 154901 42 7.2 13 16 7 40 1 4 7 1 1 2 5 3 0.1 2.4 12
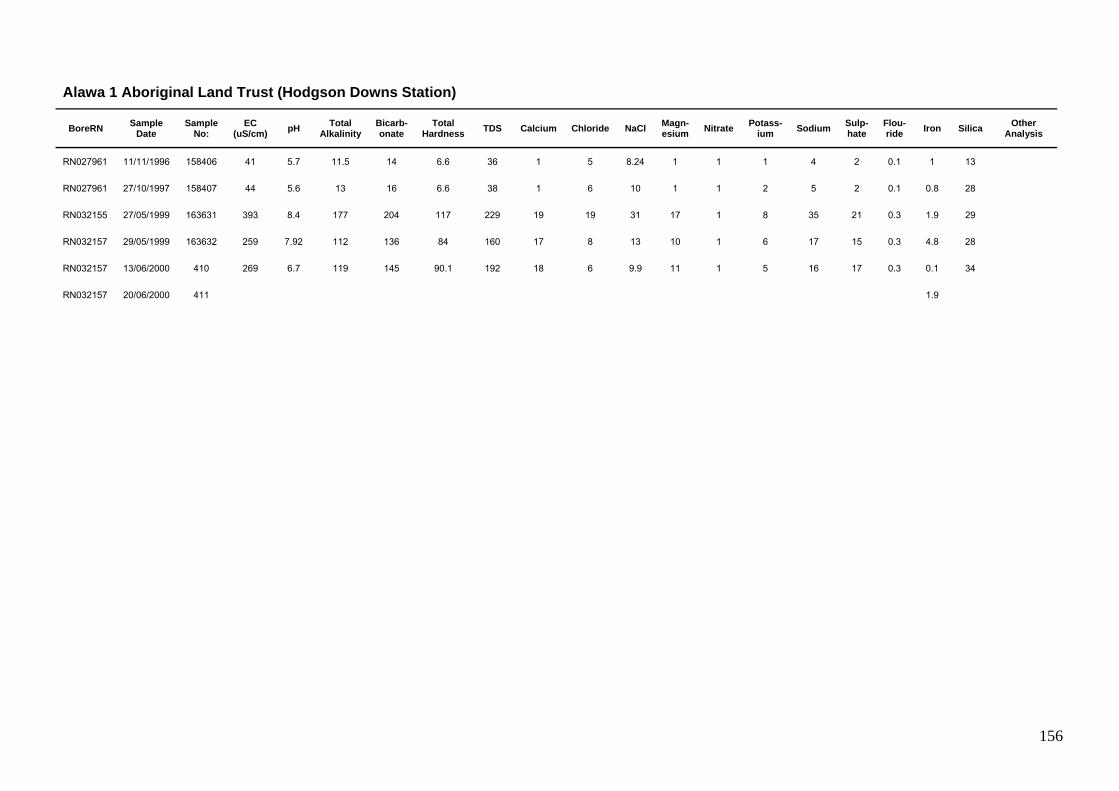
156
Alawa 1 Aboriginal Land Trust (Hodgson Downs Station)
BoreRN Sample Date
Sample No:
EC (uS/cm) pH Total
Alkalinity Bicarb-onate
Total Hardness TDS Calcium Chloride NaCl Magn-
esium Nitrate Potass-ium Sodium Sulp-
hate Flou-ride Iron Silica Other
Analysis
RN027961 11/11/1996 158406 41 5.7 11.5 14 6.6 36 1 5 8.24 1 1 1 4 2 0.1 1 13
RN027961 27/10/1997 158407 44 5.6 13 16 6.6 38 1 6 10 1 1 2 5 2 0.1 0.8 28
RN032155 27/05/1999 163631 393 8.4 177 204 117 229 19 19 31 17 1 8 35 21 0.3 1.9 29
RN032157 29/05/1999 163632 259 7.92 112 136 84 160 17 8 13 10 1 6 17 15 0.3 4.8 28
RN032157 13/06/2000 410 269 6.7 119 145 90.1 192 18 6 9.9 11 1 5 16 17 0.3 0.1 34
RN032157 20/06/2000 411 1.9

157
Arnhem Land Aboriginal Land Trust
BoreRN Sample Date
Sample No:
EC (uS/cm) pH Total
Alkalinity Bicarb-onate
Total Hardness TDS Calcium Chloride NaCl Magn-
esium Nitrate Potass-ium Sodium Sulp-
hate Flou-ride Iron Silica Other
Analysis
RN004098 10/10/1963 6982 7.3 310 2200 4950
RN004098 1/11/1963 6983 9342 6.65 330 2500 6500
RN004099 1/11/1963 6984 4898 7.55 410 1900 3000
RN004100 17/10/1963 6985 21042 7.35 350 5100 16000
RN004219 27/09/1963 7119 564 7.8 335 315 40
RN005955 17/09/1968 10775 1400 7.5 288 176 524 849 27 310 80 1 7 100 24 0.6 0.1 13
RN005955 9/10/1968 10776 1500 7.7 332 203 560 840 66 300 78 1 7 103 19 0.9 0.2 26
RN005955 23/07/1982 10777 1610 7.1 340 415 626 920 106 320 530 88 1 9 88 35 0.3 1.4 24
RN005955 6/06/1985 10778 1330 7.6 367 448 538 710 94 220 370 74 1 5 66 22 0.3 0.1 29
RN006035 12/12/1967 10806 1159 7.9 338 206 455 707 13 55 101 1.5 14 82 0.2 0.1
RN006035 12/12/1967 10807 1008 7.7 304 185 450 700 7 40 104 0.4 11 70 0.2 2.6
RN006035 23/07/1982 10808 1230 7 384 468 515 690 91 166 274 70 1 8 58 29 0.1 0.3 24
RN006035 3/10/1996 156754 1493 7.17 354.3 432 622 793 111 279 460 84 1 6 60 37 0.2 0.7 24
RN006035 3/10/1996 154843 1490 7.2 354 432 622 793 111 279 460 84 1 6 60 37 0.2 0.7 24
RN006160 29/07/1968 10998 27100 6.4 26 15.9 6100 13000 28
RN006160 29/07/1968 10999 30500 6.3 26 15.9 6200 12900
RN006160 29/07/1968 11000 28500 6.45 56 16 5800 12200 36
RN006163 29/07/1968 11001 10580 3.68 1760 3520 13
RN007870 26/05/1972 14813 26490 7.5 88 107 8000 1010 1684
RN007870 26/05/1972 14814 27000 7.3 75 92 8000 1030 1697
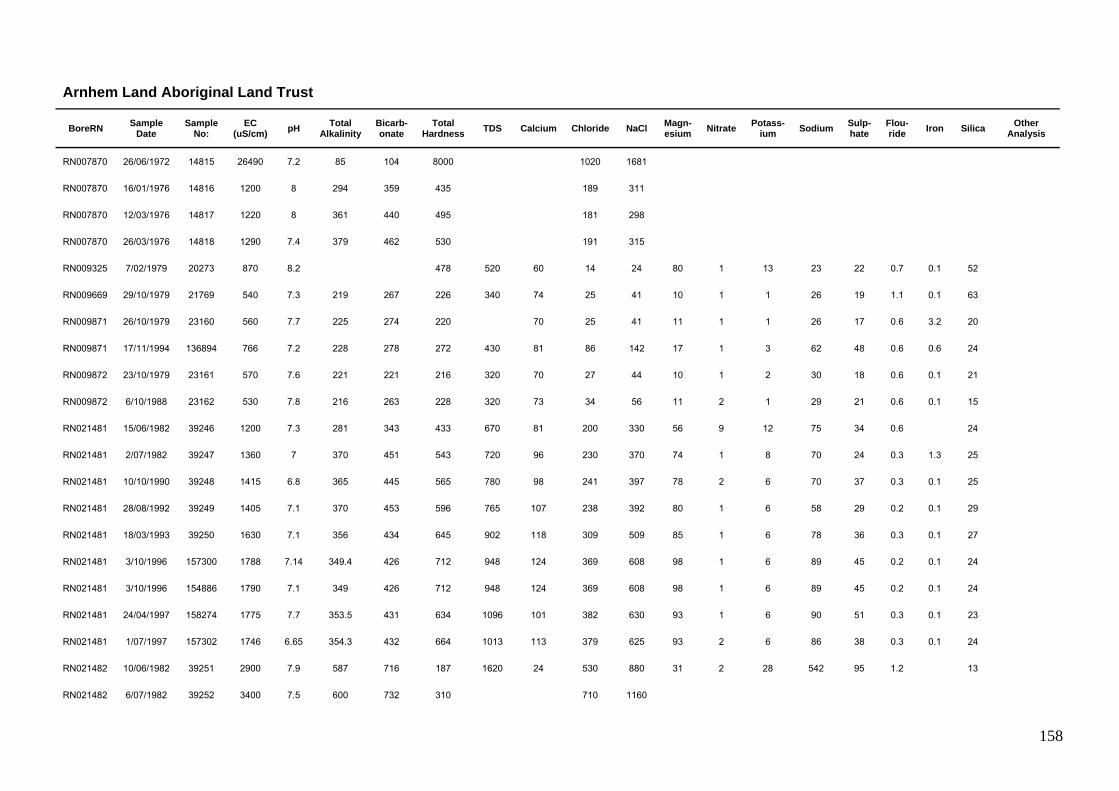
158
Arnhem Land Aboriginal Land Trust
BoreRN Sample Date
Sample No:
EC (uS/cm) pH Total
Alkalinity Bicarb-onate
Total Hardness TDS Calcium Chloride NaCl Magn-
esium Nitrate Potass-ium Sodium Sulp-
hate Flou-ride Iron Silica Other
Analysis
RN007870 26/06/1972 14815 26490 7.2 85 104 8000 1020 1681
RN007870 16/01/1976 14816 1200 8 294 359 435 189 311
RN007870 12/03/1976 14817 1220 8 361 440 495 181 298
RN007870 26/03/1976 14818 1290 7.4 379 462 530 191 315
RN009325 7/02/1979 20273 870 8.2 478 520 60 14 24 80 1 13 23 22 0.7 0.1 52
RN009669 29/10/1979 21769 540 7.3 219 267 226 340 74 25 41 10 1 1 26 19 1.1 0.1 63
RN009871 26/10/1979 23160 560 7.7 225 274 220 70 25 41 11 1 1 26 17 0.6 3.2 20
RN009871 17/11/1994 136894 766 7.2 228 278 272 430 81 86 142 17 1 3 62 48 0.6 0.6 24
RN009872 23/10/1979 23161 570 7.6 221 221 216 320 70 27 44 10 1 2 30 18 0.6 0.1 21
RN009872 6/10/1988 23162 530 7.8 216 263 228 320 73 34 56 11 2 1 29 21 0.6 0.1 15
RN021481 15/06/1982 39246 1200 7.3 281 343 433 670 81 200 330 56 9 12 75 34 0.6 24
RN021481 2/07/1982 39247 1360 7 370 451 543 720 96 230 370 74 1 8 70 24 0.3 1.3 25
RN021481 10/10/1990 39248 1415 6.8 365 445 565 780 98 241 397 78 2 6 70 37 0.3 0.1 25
RN021481 28/08/1992 39249 1405 7.1 370 453 596 765 107 238 392 80 1 6 58 29 0.2 0.1 29
RN021481 18/03/1993 39250 1630 7.1 356 434 645 902 118 309 509 85 1 6 78 36 0.3 0.1 27
RN021481 3/10/1996 157300 1788 7.14 349.4 426 712 948 124 369 608 98 1 6 89 45 0.2 0.1 24
RN021481 3/10/1996 154886 1790 7.1 349 426 712 948 124 369 608 98 1 6 89 45 0.2 0.1 24
RN021481 24/04/1997 158274 1775 7.7 353.5 431 634 1096 101 382 630 93 1 6 90 51 0.3 0.1 23
RN021481 1/07/1997 157302 1746 6.65 354.3 432 664 1013 113 379 625 93 2 6 86 38 0.3 0.1 24
RN021482 10/06/1982 39251 2900 7.9 587 716 187 1620 24 530 880 31 2 28 542 95 1.2 13
RN021482 6/07/1982 39252 3400 7.5 600 732 310 710 1160

159
Arnhem Land Aboriginal Land Trust
BoreRN Sample Date
Sample No:
EC (uS/cm) pH Total
Alkalinity Bicarb-onate
Total Hardness TDS Calcium Chloride NaCl Magn-
esium Nitrate Potass-ium Sodium Sulp-
hate Flou-ride Iron Silica Other
Analysis
RN021482 7/07/1982 39253 4300 7.4 595 725 463 2370 64 970 1600 74 1 15 730 180 0.8 0.6 16
RN021483 4/06/1982 39254 35500 7.3 317 387 6000 12200 20110
RN021483 4/06/1982 39255 780 7.7 395 482 391 410 53 26 44 63 1 8 16 13 0.8 0.6 25
RN021484 8/06/1982 39256 1710 5.9 10 12 174 920 17 450 740 32 1 30 245 98 0.2 29
RN021503 12/06/1982 39291 1090 7.7 372 543 427 610 38 140 230 81 2 39 50 28 0.3 0.9 20
RN021503 12/06/1982 39292 1150 7.5 343 418 482 630 60 175 290 81 1 9 53 24 0.2 0.3 19
RN021505 14/06/1982 39293 760 7.4 290 354 328 430 59 70 112 44 4 10 25 14 0.3 27
RN021506 14/06/1982 39294 1330 7.4 352 429 539 790 86 224 368 79 2 10 78 42 2 4 24
RN024056 8/11/1985 46818 1400 7.7 316 385 525 800 74 240 400 83 1 2 69 31 0.3 3.3 78
RN024056 19/11/1986 46819 1365 7 398 400 532 790 80 230 376 81 1 2 68 37 0.4 0.3 78
RN030383 22/11/1995 146672 617 7.7 221 270 172 346 49 49 81 12 7 2 65 35 0.8 0.1 21
RN030405 7/11/1996 157563 1788 7 356 434 709 1017 123 382 630 98 1 6 91 51 0.3 0.9 23
RN030405 7/11/1996 155263 1790 7 356 434 709 1020 123 382 630 98 1 6 91 51 0.3 0.9 23
RN030405 1/07/1997 157564 1810 6.79 358.4 437 660 1041 105 400 659 97 1 7 94 38 0.2 0.1 25
RN031986 10/11/2006 6825 675 8 333 333 328 370 36 30.6 57.7 0.26 6.1 22.8 4 0.4 4.55 23 Heavy metals
RN031987 13/11/2006 6825 744 8.2 210 210 267 430 17.6 104 54.2 0.035 10.8 54.2 27 0.3 0.74 13 Heavy metals
RN031988 18/11/2006 6825 1240 7.8 282 282 468 700 57.6 224 78.8 <0.005 7.3 75.3 34.2 0.4 4.26 28.6 Heavy metals
RN031988 18/11/2006 6825 2410 7.6 259 259 783 1450 100 652 129 0.035 9.7 188 94.4 0.4 3.28 26.2 Heavy metals
RN031989 20/11/2006 6825 552 8.1 289 289 290 300 20.2 14.3 58.2 0.235 6.5 8.7 1 0.6 4.2 25.2 Heavy metals

160
Arnhem Land Aboriginal Land Trust
BoreRN Sample Date
Sample No:
EC (uS/cm) pH Total
Alkalinity Bicarb-onate
Total Hardness TDS Calcium Chloride NaCl Magn-
esium Nitrate Potass-ium Sodium Sulp-
hate Flou-ride Iron Silica Other
Analysis
RN032802 22/11/2006 6825 1660 7.3 259 259 579 910 95 373 82.9 0.26 7.8 108 27.6 0.3 2.04 22.8 Heavy metals
RN034909 26/09/2006 6825 1030 7.4 341 341 431 570 69.7 126 62.4 0.075 5.4 56.2 17.5 0.3 0.66 27.4 Heavy metals
RN035301 29/09/2006 6825 922 7.4 438 438 497 520 53.9 44.4 88 0.565 9.9 19.6 2.5 0.7 0.36 20.8 Heavy metals
RN035302 30/09/2006 6825 830 7.4 412 412 465 460 78.9 26.8 65.1 0.17 6.5 14.5 1.4 0.3 0.62 20.4 Heavy metals
RN035315 17/08/2007 8039 655 8 333 333 338 360 42.1 16 56.4 0.415 5.6 10.9 1.8 0.5 19.4 Heavy metals
RN035316 14/09/2007 8365 815 7.5 404 404 421 470 73.7 26.3 57.4 0.16 6.3 11.7 0.7 0.5 19.2 Heavy metals
RN035317 17/08/2007 8039 804 8 246 246 337 440 56.7 105 47.4 0.26 5.5 30 22.3 0.1 26.4 Heavy metals
RN035317 17/09/2007 8365 1050 7.6 413 413 477 590 71.3 98.9 72.7 0.25 8.8 34.3 12.4 0.6 20.6 Heavy metals
RN035318 17/08/2007 8039 1520 8.1 267 267 350 870 47.6 262 56.2 0.26 3.4 194 139 0.6 0.26 25 Heavy metals
RN035319 17/08/2007 8039 2300 7.9 261 261 692 1280 100 504 107 0.255 6.7 213 165 0.4 0.44 29.2 Heavy metals
RN035319 17/08/2007 8039 2660 8 258 258 748 1540 108 584 116 0.25 5.6 276 222 0.5 3.64 26.8 Heavy metals
RN035319 17/08/2007 8039 602 8.1 246 246 276 340 48 45.6 37.9 0.255 5.4 17.8 7.5 0.1 0.44 25.6 Heavy metals
RN035510 22/11/2006 6825 789 8 387 387 413 450 34.9 33.6 79.2 0.005 8.3 25.9 3.9 0.4 1.35 23.8 Heavy metals
RN035511 23/11/2006 6825 620 8.1 259 259 277 350 40 43 43.1 0.295 3.8 24.7 1.5 0.8 1.75 19 Heavy metals
RN035512 25/11/2006 6825 672 8 323 323 329 370 34.4 24.9 59 0.04 6.2 20.4 2.1 0.5 0.6 18.2 Heavy metals

161
Arnhem Land Aboriginal Land Trust
BoreRN Sample Date
Sample No:
EC (uS/cm) pH Total
Alkalinity Bicarb-onate
Total Hardness TDS Calcium Chloride NaCl Magn-
esium Nitrate Potass-ium Sodium Sulp-
hate Flou-ride Iron Silica Other
Analysis
RN035513 28/11/2006 6825 855 7.8 296 296 384 530 60.9 87.2 56.2 <0.005 6.8 40.9 18.9 0.2 18.6 26.2 Heavy metals
RN035515 30/11/2006 6825 994 8 400 400 421 570 50.4 138 71.6 0.27 5.8 56.9 12.6 0.2 7.2 32.8 Heavy metals
RN035721 17/08/2007 8039 570 8.1 261 261 264 320 48.1 23.8 35 0.265 5.3 14 3.2 0.1 0.06 25.4 Heavy metals
RN035721 19/09/2007 8365 613 7.7 280 280 287 350 55.7 28.5 35.8 0.23 6 12.8 3.6 0.2 26.2 Heavy metals

162
Big River
BoreRN Sample Date
Sample No:
EC (uS/cm) pH Total
Alkalinity Bicarb-onate
Total Hardness TDS Calcium Chloride NaCl Magn-
esium Nitrate Potass-ium Sodium Sulp-
hate Flou-ride Iron Silica Other
Analysis
RN007088 28/09/1971 13309 470 8.1 249 303 237 320 37 4 33 1 3 13 12 1.7 27 62
Goondooloo
BoreRN Sample Date
Sample No:
EC (uS/cm) pH Total
Alkalinity Bicarb-onate
Total Hardness TDS Calcium Chloride NaCl Magn-
esium Nitrate Potass-ium Sodium Sulp-
hate Flou-ride Iron Silica Other
Analysis
RN006719 1/11/1969 12194 355 7.7 202 246 178 240 38 8 21 1 2 15 8 0.3 0.1 36
RN006719 3/01/1970 12195 2000 8 449 547 540 1380 54 175 102 2 36 258 442 2.2 0.7 12
RN026301 23/02/1989 49906 6270 6.2 138 168 3370 5475 577 392 646 470 1 50 468 3610 1.5 18
RN026302 24/02/1989 49907 26300 6.3 222 271 6700 6174 10175

163
Limmen National Park (St Vidgeon Station)
BoreRN Sample Date
Sample No:
EC (uS/cm) pH Total
Alkalinity Bicarb-onate
Total Hardness TDS Calcium Chloride NaCl Magn-
esium Nitrate Potass-ium Sodium Sulp-
hate Flou-ride Iron Silica Other
Analysis
RN006163 29/07/1968 11001 10580 3.68 1760 3520 13
Moroak
BoreRN Sample Date
Sample No:
EC (uS/cm) pH Total
Alkalinity Bicarb-onate
Total Hardness TDS Calcium Chloride NaCl Magn-
esium Nitrate Potass-ium Sodium Sulp-
hate Flou-ride Iron Silica Other
Analysis
RN005188 23/11/1965 8781 680 7.6 342 209 112 480 23 42 13 0.5
RN006185 27/08/1968 11019 100 6.6 34 21 56 77 10 14 3 1 4 10 37 0.6 1.2 13
RN006189 23/09/1968 11020 800 7.6 320 195 312 500 15 58 52 1 10 42 67 0.7 0.1 39
RN007324 9/09/1989 13674 750 7.3 418 510 385 460 72 12 20 50 1 1 22 16 0.5 0.1 60
RN006720 13/01/1970 53 2000 8 449 547 570 1380 54 175 102 2 36 258 442 2.2 0.7 12
RN007326 10/09/1970 13675 19400 7.5 366 366 8100 8050
RN007327 11/09/1970 13676 1180 8 406 495 114 750 16 152 18 25 7 230 13 1.9 11 34
RN024250 12/11/1985 47032 7510 7 79 96 2209 4940 280 1980 3263 368 1 18 760 859 0.2 1.1 14
RN024741 31/08/1986 47600 1201 3.8 1 1 340 820 70 30 60 40 3 20 85 510 0.8 65
RN024742 29/08/1986 47601 21800 7.5 220 270 6300 6500 10710

164
Namul Namul
BoreRN Sample Date
Sample No:
EC (uS/cm) pH Total
Alkalinity Bicarb-onate
Total Hardness TDS Calcium Chloride NaCl Magn-
esium Nitrate Potass-ium Sodium Sulp-
hate Flou-ride Iron Silica Other
Analysis
RN003852 27/11/1963 6582 538 8.15 270 205 70
RN003852 28/11/1963 6583 557 7.95 300 210 50
RN003852 14/10/1968 6584 570 7.7 244 149 248 400 53 28 27 28 1 31 12 1.2 0.2 92
RN006704 16/10/1969 12180 14000 7.1 200 244 5800 11710 740 5280 920 65 1550 1.1 7
RN006707 29/10/1963 12181 526 7.1 310 225 40
RN006707 16/10/1969 12182 1320 7 324 395 374 920 42 110 70 1 19 175 291 1.5 1.2 13
RN007086 12/06/1970 13308 4240 8.1 650 793 713 3060 18 860 163 1 5 844 765 1.3 2.7 33
RN008770 9/09/1975 17426 180 7.1 25 31 21 110 2 24 35 4 2 10 28 21 0.3 14
RN008771 7/09/1975 17427 190 6.9 29 35 17 110 2 27 44 3 1 7 29 23 0.4 13
RN030954 28/10/1996 158680 475 7.26 228.016 278 169.3 265 30 22 36 23 1 7 33 9 0.2 0.1 18
NT Portion 9472 (Lonesome Dove)
BoreRN Sample Date
Sample No:
EC (uS/cm) pH Total
Alkalinity Bicarb-onate
Total Hardness TDS Calcium Chloride NaCl Magn-
esium Nitrate Potass-ium Sodium Sulp-
hate Flou-ride Iron Silica Other
Analysis
RN007088 28/09/1971 13309 470 8.1 249 303 237 320 37 4 33 1 3 13 12 1.7 27 62

165
Urapunga Aboriginal Land Trust
BoreRN Sample Date
Sample No:
EC (uS/cm) pH Total
Alkalinity Bicarb-onate
Total Hardness TDS Calcium Chloride NaCl Magn-
esium Nitrate Potass-ium Sodium Sulp-
hate Flou-ride Iron Silica Other
Analysis
RN009125 18/09/1977 19142 550 7.7 260 317 267 320 51 27 44 34 1 3 14 10 0.5 0.5 22
RN009125 18/09/1977 19143 570 7.8 255 311 268 320 48 28 48 36 1 5 17 13 0.5 22
RN009125 2/08/1978 19144 550 7.2 255 311 269 300 50 24 40 35 1 2 14 10 0.2 3.4 23
RN009125 2/08/1978 19145 563 7.3 267 326 280 24 40
RN009125 3/10/1996 156812 573 7.85 277 338 272.6 320 50 28 46 36 2 3 13 13 0.2 0.1 22
RN009125 3/10/1996 154852 573 7.9 277 338 273 320 50 28 46 36 2 3 13 13 0.2 0.1 22
RN009126 19/09/1977 19146 570 7.8 265 323 263 330 46 31 51 36 2 4 20 9 0.5 0.7 23
RN009126 19/09/1977 19147 550 7.6 260 317 257 310 45 29 48 35 2 5 18 9 0.4 35 23
RN009126 12/07/1978 19148 550 7.3 260 317 263 300 51 23 38 33 1 2 13 11 0.2 3 24
RN009126 2/08/1978 19149 550 7.4 255 311 260 300 50 22 36 33 1 2 13 10 0.1 2.7 24
RN009126 10/10/1990 19150 580 7.5 273 333 285 305 53 28 46 37 1 3 14 13 0.2 1.1 19
RN009126 3/10/1996 156813 579 7.19 278 339 284.2 321 53 27 44.5 37 1 3 13 13 0.1 0.1 23
RN009126 3/10/1996 154853 579 7.2 278 339 284 321 53 27 44 37 1 3 13 13 0.1 0.1 23
RN009320 8/09/1978 20270 930 7.1 260 317 355 510 106 84 138 22 8 1 35 52 0.3 13 40
RN009321 5/09/1978 20271 1210 7.5 260 317 381 690 108 122 201 27 1 4 88 142 0.4 7 34
RN009322 11/09/1978 20272 710 7.7 226 275 283 400 82 54 89 19 7 1 26 36 0.2 0.1 45
RN028126 13/05/1992 51229 1220 7.2 258 314 367 621 66 185 305 49 2 5 131 28 0.1 21

166
Yutpundji-Djindiwirritj Aboriginal Land Trust
BoreRN Sample Date
Sample No:
EC (uS/cm) pH Total
Alkalinity Bicarb-onate
Total Hardness TDS Calcium Chloride NaCl Magn-
esium Nitrate Potass-ium Sodium Sulp-
hate Flou-ride Iron Silica Other
Analysis
RN009320 8/09/1978 20270 930 7.1 260 317 355 510 106 84 138 22 8 1 35 52 0.3 13 40
RN009321 5/09/1978 20271 1210 7.5 260 317 381 690 108 122 201 27 1 4 88 142 0.4 7 34
RN009322 11/09/1978 20272 710 7.7 226 275 283 400 82 54 89 19 7 1 26 36 0.2 0.1 45
RN022070 20/05/1983 40776 6000 7.5 153 186 573 3540 144 1900 3133 52 1 65 976 8 0.7 8.2 11
RN022070 1/12/1983 40777 4430 7.1 115 140 423 2360 105 1350 2226 39 1 34 753 4 0.6 0.2 6
RN022070 1/12/1983 40778 3620 7.6 178 217 545 3110 136 1760 2904 50 1 42 992 5 0.8 0.1 9
RN026365 24/06/1989 49943 610 7.9 282 344 300 355 56 32 53 39 1 5 12 10 0.5 0.1 20
RN026365 19/10/1989 49944 620 7 296 361 326 340 63 28 46 41 1 5 11 14 0.3 20 Cadmium, Manganese,
Lead, Copper, Zinc

167
APPENDIX K: SURFACE WATER SITES
Surface water sites include:
• Sites along a river
• Waterholes
• Springs
All NRETAS surface water sites have a unique ‘gauge site’, ‘G’ number and name eg. G9030250 Roper
River at Red Rock. Sites are numbered according to which basin (catchment) they lie within. The first 3
digits of the ‘G’ number refer to the basin number and the following digits identify the site. The following
surface water site listings are provided in numerical order of basin (catchment) number.
Basins represented in the Roper River Region
are shown in the figure to the left. These are:
• 903 Roper River Basin
• 904 Towns River Basin
• 905 Limmen Bight River Basin
Only those sites within the map sheet are listed.
River basins across the Roper River map region
For each of these basins data is listed in order of:
• River gauging stations with a continuous height record (and flow measurements)
• River gauging sites (Sites where flow has been measured)
• Water quality sites (Some of these sites have river flow measured)
For the river gauging sites that have a continuous height record and flow measurements, plots of river height
and discharge for the period of record are provided. These are:
• G9030102
• G9030146
• G9030250
The only site that is currently recording river level is G9030250 Roper River at Red Rock.
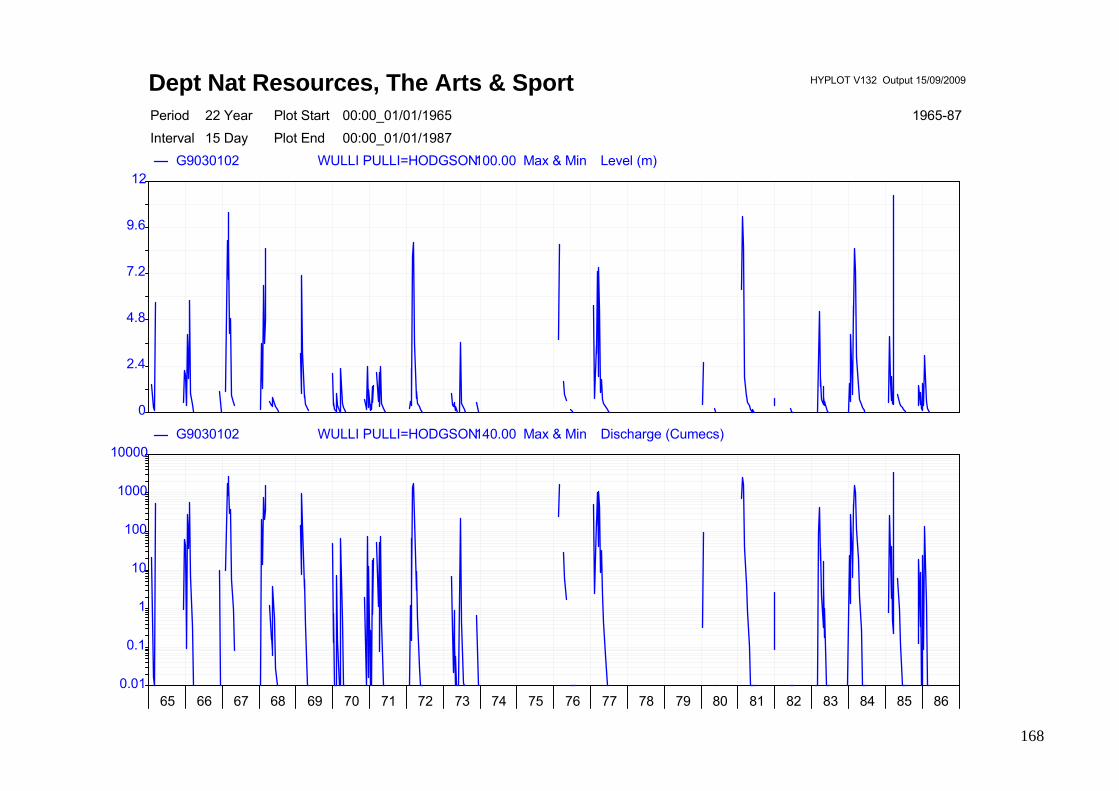
168
Dept Nat Resources, The Arts & Sport HYPLOT V132 Output 15/09/2009
Period 22 Year Plot Start 00:00_01/01/1965 1965-87Interval 15 Day Plot End 00:00_01/01/1987
G9030102 WULLI PULLI=HODGSON100.00 Max & Min Level (m)
G9030102 WULLI PULLI=HODGSON140.00 Max & Min Discharge (Cumecs)
0
2.4
4.8
7.2
9.6
12
0.01
0.1
1
10
100
1000
10000
65 66 67 68 69 70 71 72 73 74 75 76 77 78 79 80 81 82 83 84 85 86

169
Dept Nat Resources, The Arts & Sport HYPLOT V132 Output 15/09/2009
Period 24 Year Plot Start00:00_01/01/1963 1963-87Interval15 Day Plot End 00:00_01/01/1987
G9030146 Wilton Ri @ Qualari100.00 Max & MinLevel (m)
G9030146 Wilton Ri @ Qualari140.00 Max & MinDischarge (Cumecs)0
2.4
4.8
7.2
9.6
12
0.01
0.1
1
10
100
1000
10000
63 64 65 66 67 68 69 70 71 72 73 74 75 76 77 78 79 80 81 82 83 84 85 86

170
Dept Nat Resources, The Arts & Sport HYPLOT V132 Output 15/09/2009
Period 44 Year Plot Start 00:00_01/01/1966 1966-10Interval 1 Month Plot End 00:00_01/01/2010
G9030250 Roper Ri @ Red Rock100.00 Max & Min Level (m)
G9030250 Roper Ri @ Red Rock140.00 Max & Min Discharge (Cumecs)0
4
8
12
16
20
0.01
0.1
1
10
100
1000
10000
1966-75 1976-85 1986-95 1996-05
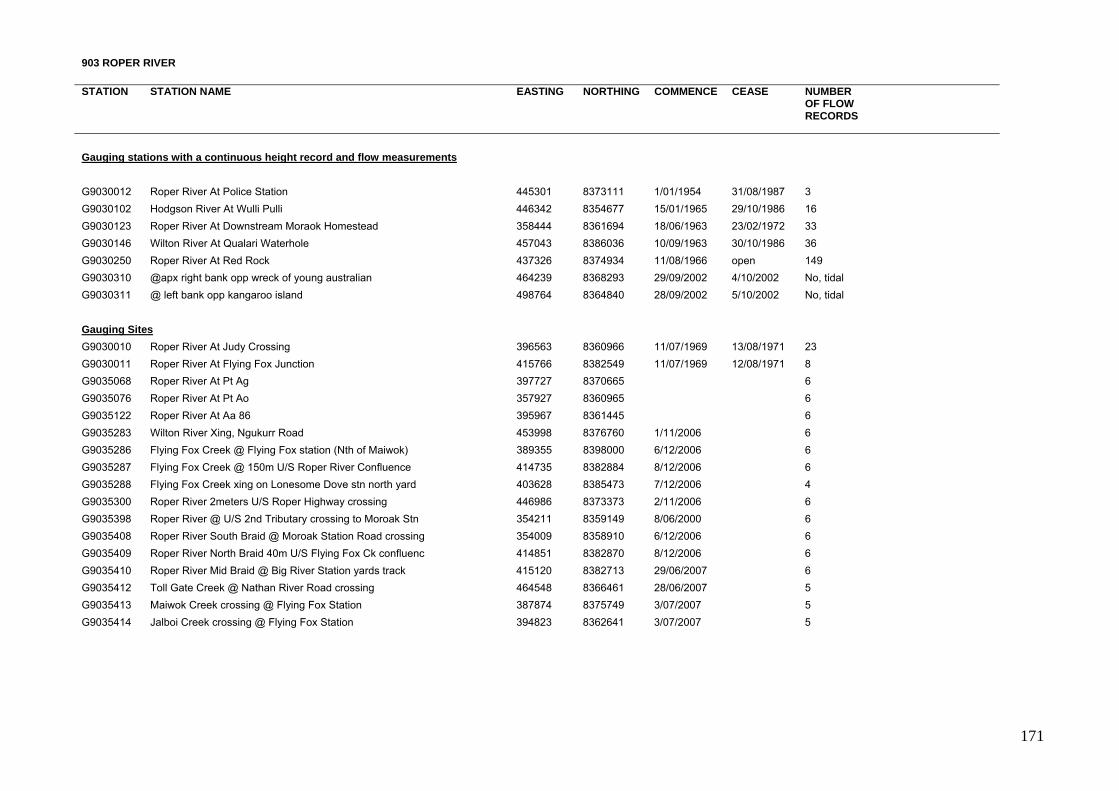
171
903 ROPER RIVER
STATION STATION NAME EASTING NORTHING COMMENCE CEASE NUMBER OF FLOW RECORDS
Gauging stations with a continuous height record and flow measurements G9030012 Roper River At Police Station 445301 8373111 1/01/1954 31/08/1987 3 G9030102 Hodgson River At Wulli Pulli 446342 8354677 15/01/1965 29/10/1986 16 G9030123 Roper River At Downstream Moraok Homestead 358444 8361694 18/06/1963 23/02/1972 33 G9030146 Wilton River At Qualari Waterhole 457043 8386036 10/09/1963 30/10/1986 36 G9030250 Roper River At Red Rock 437326 8374934 11/08/1966 open 149 G9030310 @apx right bank opp wreck of young australian 464239 8368293 29/09/2002 4/10/2002 No, tidal G9030311 @ left bank opp kangaroo island 498764 8364840 28/09/2002 5/10/2002 No, tidal Gauging Sites G9030010 Roper River At Judy Crossing 396563 8360966 11/07/1969 13/08/1971 23 G9030011 Roper River At Flying Fox Junction 415766 8382549 11/07/1969 12/08/1971 8 G9035068 Roper River At Pt Ag 397727 8370665 6 G9035076 Roper River At Pt Ao 357927 8360965 6 G9035122 Roper River At Aa 86 395967 8361445 6 G9035283 Wilton River Xing, Ngukurr Road 453998 8376760 1/11/2006 6 G9035286 Flying Fox Creek @ Flying Fox station (Nth of Maiwok) 389355 8398000 6/12/2006 6 G9035287 Flying Fox Creek @ 150m U/S Roper River Confluence 414735 8382884 8/12/2006 6 G9035288 Flying Fox Creek xing on Lonesome Dove stn north yard 403628 8385473 7/12/2006 4 G9035300 Roper River 2meters U/S Roper Highway crossing 446986 8373373 2/11/2006 6 G9035398 Roper River @ U/S 2nd Tributary crossing to Moroak Stn 354211 8359149 8/06/2000 6 G9035408 Roper River South Braid @ Moroak Station Road crossing 354009 8358910 6/12/2006 6 G9035409 Roper River North Braid 40m U/S Flying Fox Ck confluenc 414851 8382870 8/12/2006 6 G9035410 Roper River Mid Braid @ Big River Station yards track 415120 8382713 29/06/2007 6 G9035412 Toll Gate Creek @ Nathan River Road crossing 464548 8366461 28/06/2007 5 G9035413 Maiwok Creek crossing @ Flying Fox Station 387874 8375749 3/07/2007 5 G9035414 Jalboi Creek crossing @ Flying Fox Station 394823 8362641 3/07/2007 5
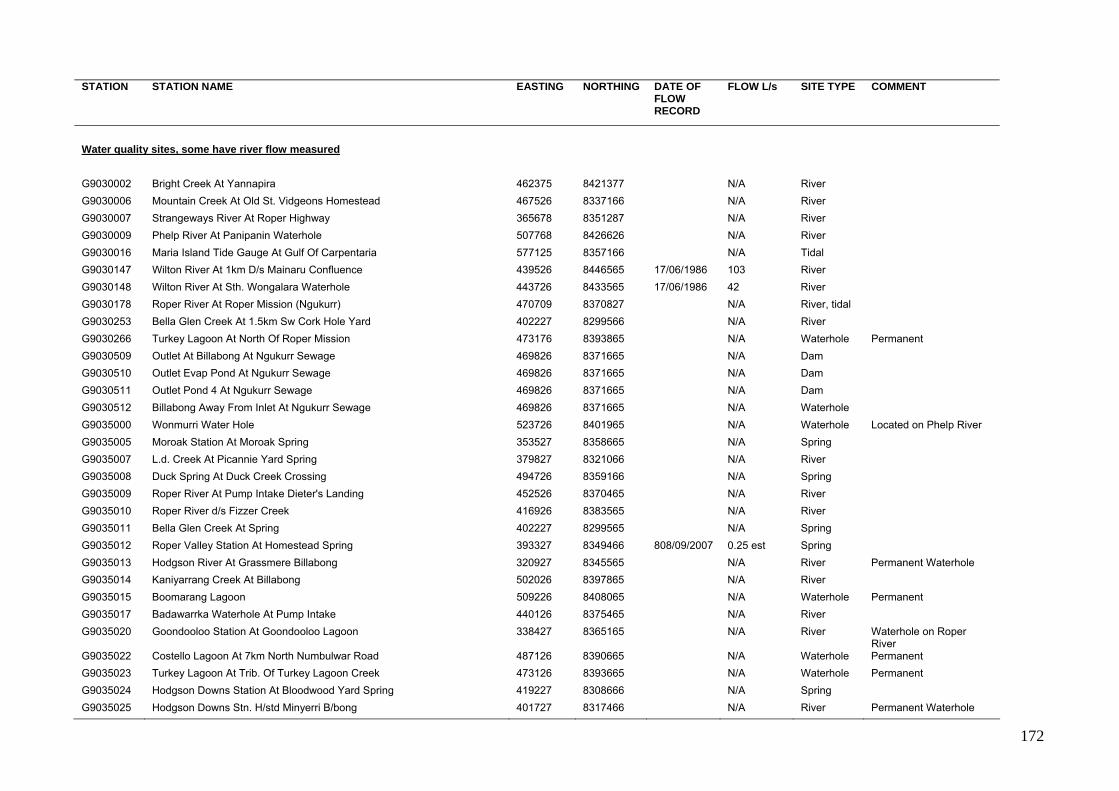
172
STATION STATION NAME EASTING NORTHING DATE OF
FLOW RECORD
FLOW L/s SITE TYPE COMMENT
Water quality sites, some have river flow measured G9030002 Bright Creek At Yannapira 462375 8421377 N/A River G9030006 Mountain Creek At Old St. Vidgeons Homestead 467526 8337166 N/A River G9030007 Strangeways River At Roper Highway 365678 8351287 N/A River G9030009 Phelp River At Panipanin Waterhole 507768 8426626 N/A River G9030016 Maria Island Tide Gauge At Gulf Of Carpentaria 577125 8357166 N/A Tidal G9030147 Wilton River At 1km D/s Mainaru Confluence 439526 8446565 17/06/1986 103 River G9030148 Wilton River At Sth. Wongalara Waterhole 443726 8433565 17/06/1986 42 River G9030178 Roper River At Roper Mission (Ngukurr) 470709 8370827 N/A River, tidal G9030253 Bella Glen Creek At 1.5km Sw Cork Hole Yard 402227 8299566 N/A River G9030266 Turkey Lagoon At North Of Roper Mission 473176 8393865 N/A Waterhole Permanent G9030509 Outlet At Billabong At Ngukurr Sewage 469826 8371665 N/A Dam G9030510 Outlet Evap Pond At Ngukurr Sewage 469826 8371665 N/A Dam G9030511 Outlet Pond 4 At Ngukurr Sewage 469826 8371665 N/A Dam G9030512 Billabong Away From Inlet At Ngukurr Sewage 469826 8371665 N/A Waterhole G9035000 Wonmurri Water Hole 523726 8401965 N/A Waterhole Located on Phelp River G9035005 Moroak Station At Moroak Spring 353527 8358665 N/A Spring G9035007 L.d. Creek At Picannie Yard Spring 379827 8321066 N/A River G9035008 Duck Spring At Duck Creek Crossing 494726 8359166 N/A Spring G9035009 Roper River At Pump Intake Dieter's Landing 452526 8370465 N/A River G9035010 Roper River d/s Fizzer Creek 416926 8383565 N/A River G9035011 Bella Glen Creek At Spring 402227 8299565 N/A Spring G9035012 Roper Valley Station At Homestead Spring 393327 8349466 808/09/2007 0.25 est Spring G9035013 Hodgson River At Grassmere Billabong 320927 8345565 N/A River Permanent Waterhole G9035014 Kaniyarrang Creek At Billabong 502026 8397865 N/A River G9035015 Boomarang Lagoon 509226 8408065 N/A Waterhole Permanent G9035017 Badawarrka Waterhole At Pump Intake 440126 8375465 N/A River G9035020 Goondooloo Station At Goondooloo Lagoon 338427 8365165 N/A River Waterhole on Roper
River G9035022 Costello Lagoon At 7km North Numbulwar Road 487126 8390665 N/A Waterhole Permanent G9035023 Turkey Lagoon At Trib. Of Turkey Lagoon Creek 473126 8393665 N/A Waterhole Permanent G9035024 Hodgson Downs Station At Bloodwood Yard Spring 419227 8308666 N/A Spring G9035025 Hodgson Downs Stn. H/std Minyerri B/bong 401727 8317466 N/A River Permanent Waterhole

173
STATION STATION NAME EASTING NORTHING DATE OF FLOW RECORD
FLOW L/s SITE TYPE COMMENT
Water quality sites, some have river flow measured G9035026 Roper Valley Station At Spring 392327 8342666 N/A Spring G9035028 St Vidgeons Station At Spring 467426 8336566 N/A Spring G9035029 St. Vidgeons Station At Billabong 467626 8336466 N/A River G9035031 Nullowan Lagoon 491326 8365766 N/A Waterhole G9035032 Yellow Waterhole 474526 8394165 N/A Waterhole G9035033 Namaluri Waterhole 497726 8386965 N/A Waterhole Permanent G9035034 Hodgson River At Pt A 454426 8364466 N/A River G9035035 Mountain Creek At Pt A 478826 8366866 N/A River G9035036 Roper River At Pt A 511426 8367466 N/A River, tidal G9035037 Roper River At Pt B 511026 8365566 N/A River, tidal G9035038 Roper River At Pt C 509726 8363666 N/A River, tidal G9035039 Roper River At Pt D 508026 8362666 N/A River, tidal G9035040 Roper River At Pt E 506126 8362166 N/A River, tidal G9035041 Roper River At Pt F 504026 8361666 N/A River, tidal G9035042 Roper River At Pt. G 502226 8362566 N/A River, tidal G9035043 Roper River At Pt H 500426 8363866 N/A River, tidal G9035044 Roper River At Pt I 497926 8364866 N/A River, tidal G9035045 Roper River At Pt J 496026 8366166 N/A River, tidal G9035046 Roper River At Pt K 495726 8364766 N/A River, tidal G9035047 Roper River At Pt L 494326 8364266 N/A River, tidal G9035048 Roper River At Pt M 492326 8364666 N/A River, tidal G9035049 Roper River At Pt N 490326 8365566 N/A River, tidal G9035050 Roper River At Pt O 488726 8366566 N/A River, tidal G9035051 Roper River At Pt P 485826 8367866 N/A River, tidal G9035052 Roper River At Pt Q 482826 8367866 N/A River, tidal G9035053 Roper River At Pt R 479126 8367066 N/A River, tidal G9035054 Roper River At Pt S 474426 8369865 N/A River, tidal G9035055 Roper River At Pt T 447426 8373465 N/A River, tidal G9035056 Roper River At Pt U 448326 8373065 N/A River, tidal G9035057 Roper River At Pt V 451726 8371765 N/A River, tidal G9035058 Roper River At Pt W 452726 8369465 N/A River, tidal G9035059 Roper River At Pt X 453926 8367165 N/A River, tidal G9035060 Roper River At Pt Y 455626 8365166 N/A River, tidal

174
STATION STATION NAME EASTING NORTHING DATE OF FLOW RECORD
FLOW L/s SITE TYPE COMMENT
Water quality sites, some have river flow measured G9035061 Roper River At Pt Z 459426 8366465 N/A River, tidal G9035062 Roper River At Pt Aa 463626 8368165 N/A River, tidal G9035063 Roper River At Pt Ab 467126 8370565 N/A River, tidal G9035064 Roper River At Pt Ac 432826 8376165 N/A River G9035065 Roper River At Pt Ad 431126 8379565 N/A River G9035066 Roper River At Pt Ae 432326 8380765 N/A River G9035067 Roper River At Pt Af 429226 8381965 N/A River G9035069 Roper River At Pt Ah 395627 8365865 N/A River G9035070 BRINGUNG.PTAI ROPER RIVER 394627 8359465 N/A River G9035071 Roper River At Pt Aj 387927 8357765 N/A River G9035072 Roper River At Pt Ak 382427 8359365 N/A River G9035073 Roper River At Pt Al 374527 8356765 N/A River G9035074 Roper River At Pt Am 369727 8357765 N/A River G9035075 Roper River At Pt An 367627 8359965 N/A River G9035076 Roper River At Pt Ao 357926 8360965 N/A River G9035077 Roper River At Pt Ap 354327 8359165 N/A River G9035078 Roper River At Pt Aq 346327 8357565 N/A River G9035098 Hodgson River At A 86 453426 8355366 N/A River G9035099 HODGSON R. ROCKY BAR XING 451576 8353366 N/A River G9035100 Hodgson River At C 86 453926 8363866 N/A River G9035101 Hodgson River At D 86 454826 8358466 N/A River G9035102 Hodgson River At E 86 455526 8361866 N/A River G9035103 Arnold River At F 86 414427 8297866 N/A River G9035105 Wilton River At H 86 439396 8446565 N/A River G9035106 Wilton River At I 86 443726 8433565 N/A River G9035107 Wilton River At J 86 453426 8398965 N/A River G9035108 Wilton River At K 86 456126 8392865 N/A River G9035109 Wilton River At L 86 457126 8382755 N/A River G9035110 Wilton River At M 86 453926 8372645 N/A River G9035111 Wilton River At N 86 453576 8374985 30/09/2002 207 River G9035112 Sherwin Creek At P 86 429126 8378540 N/A River G9035115 Mainoru River At 30km East Of Homestead 432426 8450015 20/06/2006 163 River G9035116 Roper River At U 86 472916 8369395 N/A River, tidal

175
STATION STATION NAME EASTING NORTHING DATE OF FLOW RECORD
FLOW L/s SITE TYPE COMMENT
Water quality sites, some have river flow measured G9035117 Roper River At V 86 465916 8369065 N/A River, tidal G9035118 Roper River At W 86 495726 8364016 N/A River, tidal G9035119 Roper River At X 86 456936 8364866 N/A River, tidal G9035120 Roper River At Y 86 453376 8367865 N/A River, tidal G9035121 Mainoru River At 5 Km U/s Wilton Confluence 436326 8450065 17/06/1986 122 River G9035125 Roper River At Mole Hill 374027 8355665 N/A River G9035126 Tollgate Ck 465856 8367366 30/09/2002 36 River G9035127 Spring At Hodgson Downs Stn 402227 8310366 N/A Spring G9035129 Billabong At Roper Valley Stn. 393127 8349716 N/A Waterhole G9035131 Lagoon At Wadjali Lagoon (Roper) 472126 8370065 N/A Waterhole G9035133 Minimere Lagoon Arnold River 412737 8295496 N/A River Permanent Waterhole G9035134 Tank yard Ngukurr 471416 8371305 N/A Tank G9035140 Hodgson Downs = O/H Tank 401727 8317466 N/A Tank G9035143 Hodgson R. Sth Roper Bar 446311 8355660 N/A River G9035144 Roper River (Rocky Bar Xing) Roper Valley Stn 397838 8370405 N/A River G9035150 Arraruru Waterhole 547451 8383894 N/A Waterhole Permanent G9035151 Alirranya Spring 538586 8391512 28/10/1998 0.3 Spring G9035152 Allunbunji 538592 8397499 N/A Soak Permanent G9035295 Bella Glen Gorge @ pool 24km Sth of Minyerri community 397523 8296323 8/09/2007 0.25 est Spring G9035301 Roper River @ 5km U/S Ngukurr community 466558 8369691 N/A River, tidal G9035302 Roper River @ 7km D/S Ngukurr Community 475922 8369655 N/A River, tidal G9035303 Roper River @ 5km D/S Ngukurr Community 473786 8369701 N/A River, tidal G9035304 Roper River @ 2.3km D/S Ngukurr Community 471983 8369117 N/A River, tidal G9035305 Roper River @ 1.9km U/S Ngukurr Community 469011 8371221 N/A River, tidal G9035306 Roper River @ 1.5km U/S Wilton River Confluence 450445 8372409 N/A River, tidal G9035307 Wilton River @ 0.7km U/S Roper River confluence 452429 8372056 N/A River, tidal G9035308 Roper River @ 2km D/S Wilton River confluence 452624 8369974 N/A River, tidal G9035309 Roper River @ 1km U/S Hodgson River confluence 454727 8365500 N/A River, tidal G9035310 Roper River @ 2km D/S Hodgson River confluence 457670 8365254 N/A River, tidal G9035311 Roper River @ 6km D/S Ngukurr Community 480891 8366650 N/A River, tidal G9035312 Roper River @ 5.4km U/S Ngukurr Community 466558 8369691 N/A River, tidal G9035313 Roper River @ 7.3km D/S Hodgson River confluence 462051 8367327 N/A River, tidal G9035314 Hodgson River @ 5.7km U/S Roper River cinfluence 455687 8361014 N/A River

176
STATION STATION NAME EASTING NORTHING DATE OF FLOW RECORD
FLOW L/s SITE TYPE COMMENT
Water quality sites, some have river flow measured G9035315 Roper River @ 1.2km D/S Roper Bar crossing 448127 8373628 N/A River, tidal G9035317 Phelps River @ Numbulwar road crossing 513130 8406175 N/A River G9035417 Toll Gate Creek 100m D/S Spring 465549 8365709 5/09/2007 121 Spring G9035418 Phelp River 5km U/S Numbulwar Xing 510986 8411618 11/09/2007 89 River G9035419 Wurdawawa swamp 453116 8356977 N/A Waterhole Permanent G9035420 Namarlil Waterhole 469610 8370780 N/A Waterhole Permanent G9035421 Wadangarda Lagoon near Ngukurr 467826 8370399 N/A Waterhole Permanent G9035423 Balubalumani spring / waterhole near Roper Valley Stn 393486 8351859 N/A Spring G9035424 Jowar (Jawa) spring discharge 438719 8371197 8/09/2007 1 est Spring G9035425 Mission Gorge, Nyawurlbarr, Walmudga Creek 473223 8380296 10/09/2007 CTF River Permanent spring fed
waterhole G9035426 Nanggabarra waterhole north of Costello 487995 8391646 N/A Waterhole Permanent G9035427 Najarrwayung waterhole 2km west of Nummerloori cmty 495729 8386675 N/A Waterhole Permanent G9035428 Durrungutjbanganya waterhole 5km east of Costello cmty 492105 8388115 N/A Waterhole Permanent G9035429 Ganiyarrang waterhole north of Nummerloori 502236 8399741 N/A Waterhole Intermittent G9035430 Burrunju Creek near track, west of Phelp River 498118 8425867 11/09/2007 CTF River G9035431 Phelp River at Gurrurrukul (L. Katherine) Community 507400 8422000 11/09/2007 20 est River G9035432 Warawu Lagoon (Lake Katherine) west of Phelp River 506587 8418174 11/09/2007 N/A Waterhole Permanent G9035433 Yawurrwada lagoon near Ngukurr 469071 8372490 N/A Waterhole Permanent
904 TOWNS RIVER
STATION STATION NAME EASTING NORTHING DATE OF FLOW RECORD
FLOW L/s SITE TYPE COMMENT
Surface Water sites, some have river flow measured G9040001 Towns River At St Vidgeons 522676 8336866 N/A River, tidal G9045001 Nawarlbur Swamp/ Waterhole 530400 8324400 N/A Waterhole G9045002 Little Towns River at hwy crossing 518950 8337600 29/11/2007 10 est River

177
905 LIMMEN BIGHT RIVER
STATION STATION NAME EASTING NORTHING DATE OF FLOW RECORD
FLOW L/s SITE TYPE COMMENT
Water quality sites, some have river flow measured G9055022 Cox River 18km U/S Highway 523526 8300266 N/A River G9055023 Limmen Bight River U/S Maria Lagoon 552826 8312166 N/A River, tidal G9055024 Limmen Bight River near Maria Lagoon 547626 8307566 N/A River, tidal G9055025 Cox River at Limmen Bight Confluence 544626 8305366 N/A River G9055029 Cox River At Crossing 537026 8305966 21/07/2007 0.5 est River G9055031 Beatrice Island At Point Q 583825 8331066 N/A River, tidal G9055032 Limmen Bight River At Mouth Point R 576125 8330666 N/A River, tidal G9055033 Limmen Bight River At Point S 570426 8325366 N/A River, tidal G9055034 Limmen Bight River At Point T 567926 8319966 N/A River, tidal G9055035 Limmen Bight River At West Is Point U 561926 8317566 N/A River, tidal G9055046 Maria Lagoon At Namultja 547826 8308356 N/A Waterhole

178
APPENDIX L: CHEMISTRY OF SURFACE WATER SITES
All water contains various kinds of dissolved salts (minerals). Small quantities of many of these salts are
essential to good health. Excessive concentrations however, can limit the uses of the water.
Following is some information to help you interpret the water quality represented on the following pages.
The information has been summarised from NRETAS technical fact sheet @
www.nt.gov.au/nreta/publications/natres/waterfactsheets.html. More information is available from this site.
Guideline Values: The maximum recommended values listed beside each salt are guidelines rather than strict limits. The
reason for this is because there are often many factors governing how a particular salt affects the user.
These can include a person’s age and the total volume of water consumed. The guidelines given below are
conservatively chosen in order to cover most situations. (Guideline values for stock noted in brown)
Fluoride 1.5 mg/L (Stock 2 mg/L)
This limit is based on health considerations. Excess fluoride can be removed by water
treatment.
Hardness 200 mg/L Hardness is a measure of the amount of calcium and magnesium in the water. Hard
waters can cause the build up of scale in hot water pipes and fittings. They also require
more soap to obtain a lather.
Iron 0.3 mg/L Above this limit, taste may be unacceptable but it does not pose a health problem. High
iron concentrations give water a rust brown appearance resulting in staining of laundry,
pipe encrustation and odour problems. A common way to remove iron is to aerate the
water by cascading it into a tank and allowing the iron to floc or settle.
Nitrate 50 mg/L (Stock 400 mg/L)
Based on health considerations a limit of 50mg/L is recommended for babies less than
three months old and 100mg/L for older children and adults. Nitrate levels can be reduced
if necessary by water treatment.
pH 6.5 - 8.5 (Stock 5.5 – 9.0)
This is a measure of the acidity or alkalinity. Values less than 6.5 indicate acidic water and
can results in corrosion of pipes and fittings. When pH is more than 7.5, the water is
alkaline and encrustation of pipes with calcium carbonate can occur. pH can be treated.
Total Dissolved Solids (TDS) 500 mg/L (Stock 10000 mg/L) Chloride 250 mg/L Sulphate 250 mg/L (Stock 2000 mg/L) Sodium 180 mg/L
Above these limits for TDS, chloride, sulphate and sodium, taste may be unacceptable but
it does not pose a health problem. (Aesthetic guideline only) TDS is approximately equal
to 0.6 x EC
The sites are listed in numerical order according to ‘G’ number.

179
Surface Water Site
Sample Date
Sample No:
Specific Conduct (uS/cm)
pH Total
Alkalinity (mg/L)
Bicarb-onate (mg/L)
Total Hardness
(mg/L) TDS
(mg/L) Calcium (mg/L)
Chloride (mg/L)
NaCl (mg/L)
Magn-esium (mg/L)
Nitrate (mg/L)
Potass-ium
(mg/L) Sodium (mg/L)
Sulp-hate
(mg/L)
Flou-ride
(mg/L) Iron
(mg/L) Silica (mg/L)
Other Analysis
G9030010 3/12/1969 115206 Turbidity
G9030012 20/08/1959 115207 249 7 80 25 40
G9030012 11/08/1963 115208 685 7.7 200 252 85 136
G9030012 11/08/1963 115209 8.3 360 280 170 275
G9030012 11/08/1963 115210 8.3 360 285 170 275
G9030012 11/08/1963 115211 7.9 300 850 155 250
G9030012 28/02/1964 115212 609 8 130 170 65 107
G9030012 28/02/1964 115213 609 8 130 170 454 28 65 107 24 10
G9030012 16/01/1967 115214 505 7.45 140 85 166 54 86
G9030012 17/05/1967 115215 446 8 136 154 48
G9030012 15/08/1967 115216 832 7.75 296 126 296 515 45 108 168 44 0.5 8 70 50 0.2
G9030012 4/12/1969 115217 Turbidity
G9030012 11/12/1970 115218 490 7.7 96 117 130 260 20 64 105 19 2 7 48 60 0.2 3.4 8
G9030012 15/11/1977 115219 1570 7.8 250 305 415 250 412
G9030012 9/10/1980 115220 1637 8.5 249 304 58 117 193 63 1 16 157 180 0.4 0.1 18
G9030012 21/06/1986 115221 1540 8.4 305 364 425 955 63 225 372 65 1 17 165 189 0.3 0.3 28
G9030013 18/08/1967 115222 1760 7.6 438 267 630 90 240 97 1 20 190 24 0.1 0.2
G9030013 15/10/1968 115223 1700 7.7 348 212 500 1010 52 255 71 1 23 190 187 0.7 0.2 42
G9030013 4/12/1969 115224 Turbidity
G9030013 3/10/1975 115225 1920 7.7 455 555 620 250 412
G9030013 13/10/1980 115226 2180 7.4 415 506 105 252 416 69 1 23 183 235 0.4 0.1 38
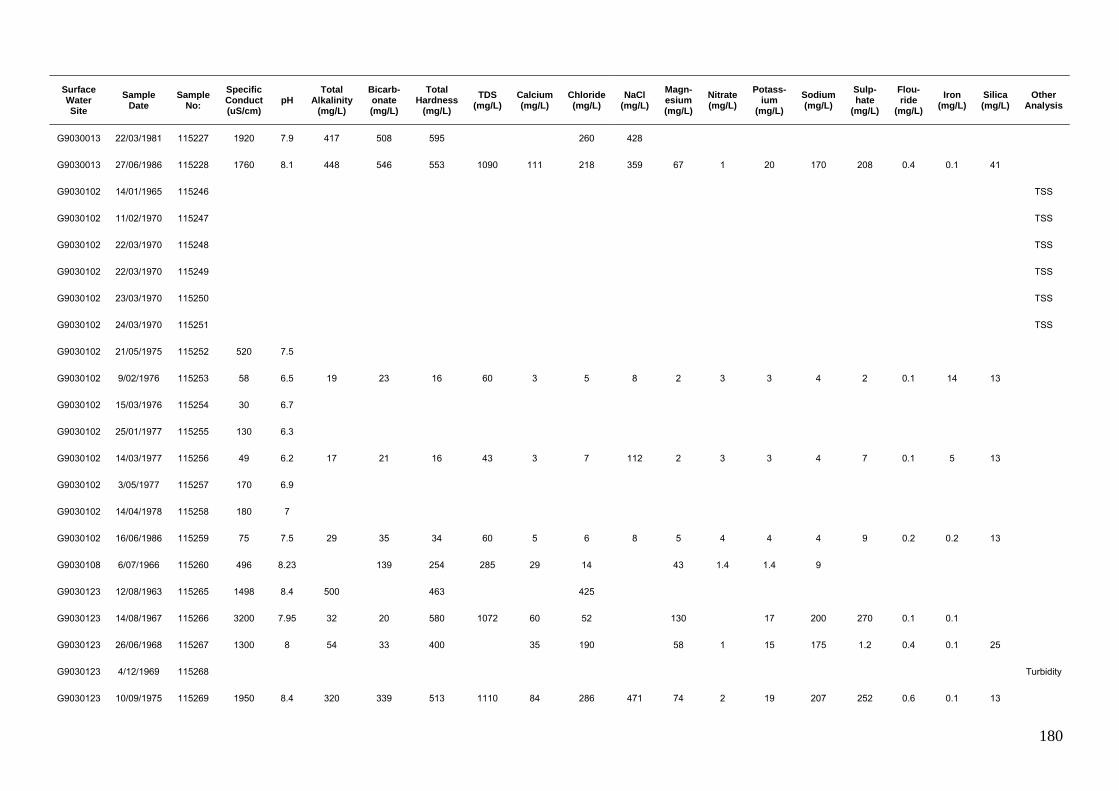
180
Surface Water Site
Sample Date
Sample No:
Specific Conduct (uS/cm)
pH Total
Alkalinity (mg/L)
Bicarb-onate (mg/L)
Total Hardness
(mg/L) TDS
(mg/L) Calcium (mg/L)
Chloride (mg/L)
NaCl (mg/L)
Magn-esium (mg/L)
Nitrate (mg/L)
Potass-ium
(mg/L) Sodium (mg/L)
Sulp-hate
(mg/L)
Flou-ride
(mg/L) Iron
(mg/L) Silica (mg/L)
Other Analysis
G9030013 22/03/1981 115227 1920 7.9 417 508 595 260 428
G9030013 27/06/1986 115228 1760 8.1 448 546 553 1090 111 218 359 67 1 20 170 208 0.4 0.1 41
G9030102 14/01/1965 115246 TSS
G9030102 11/02/1970 115247 TSS
G9030102 22/03/1970 115248 TSS
G9030102 22/03/1970 115249 TSS
G9030102 23/03/1970 115250 TSS
G9030102 24/03/1970 115251 TSS
G9030102 21/05/1975 115252 520 7.5
G9030102 9/02/1976 115253 58 6.5 19 23 16 60 3 5 8 2 3 3 4 2 0.1 14 13
G9030102 15/03/1976 115254 30 6.7
G9030102 25/01/1977 115255 130 6.3
G9030102 14/03/1977 115256 49 6.2 17 21 16 43 3 7 112 2 3 3 4 7 0.1 5 13
G9030102 3/05/1977 115257 170 6.9
G9030102 14/04/1978 115258 180 7
G9030102 16/06/1986 115259 75 7.5 29 35 34 60 5 6 8 5 4 4 4 9 0.2 0.2 13
G9030108 6/07/1966 115260 496 8.23 139 254 285 29 14 43 1.4 1.4 9
G9030123 12/08/1963 115265 1498 8.4 500 463 425
G9030123 14/08/1967 115266 3200 7.95 32 20 580 1072 60 52 130 17 200 270 0.1 0.1
G9030123 26/06/1968 115267 1300 8 54 33 400 35 190 58 1 15 175 1.2 0.4 0.1 25
G9030123 4/12/1969 115268 Turbidity
G9030123 10/09/1975 115269 1950 8.4 320 339 513 1110 84 286 471 74 2 19 207 252 0.6 0.1 13

181
Surface Water Site
Sample Date
Sample No:
Specific Conduct (uS/cm)
pH Total
Alkalinity (mg/L)
Bicarb-onate (mg/L)
Total Hardness
(mg/L) TDS
(mg/L) Calcium (mg/L)
Chloride (mg/L)
NaCl (mg/L)
Magn-esium (mg/L)
Nitrate (mg/L)
Potass-ium
(mg/L) Sodium (mg/L)
Sulp-hate
(mg/L)
Flou-ride
(mg/L) Iron
(mg/L) Silica (mg/L)
Other Analysis
G9030123 1/10/1975 115270 1820 8 326 397 503 1090 80 284 468 74 1 25 196 234 0.4 0.1 27
G9030123 22/07/1976 115271 1620 7.6 316 385 480 56 93
G9030123 12/10/1980 115272 2239 8.3
G9030123 13/12/1994 140493 1410 8.2 280 350 0.004
G9030123 21/08/1995 148104 1615 8.2 351 428 0.012
G9030123 21/08/1995 152928 1615 8.2 351 428 0.012
G9030123 20/11/1995 153112 1320 8.2 318 388 0.155
G9030146 25/09/1974 115282 380 7.7 179 218 173 210 30 14 23 24 1 2 9 4 0.4 0.1 16
G9030146 4/11/1974 115283 380 7.6 180 219
G9030146 22/05/1975 115284 240 7.3 130 159 100 130 12 20 1 0.2
G9030146 6/06/1975 115285 280 7.6
G9030146 2/08/1975 115286 350 8.2
G9030146 3/10/1975 115287 380 8.4
G9030146 9/02/1976 115288 140 7.4 53 65 50 90 10 9 15 6 1 2 6 2 0.1 9.1 15
G9030146 15/03/1976 115289 46 6.8
G9030146 27/04/1976 115290 290 7.4
G9030146 9/06/1976 115291 390 7.4
G9030146 13/10/1976 115292 470 8.2
G9030146 25/01/1977 115293 84 6.7
G9030146 14/03/1977 115294 92 6.3
G9030146 3/05/1977 115295 220 7 75 92 87 120 15 14 23 12 5 3 11 3 0.2 1.4 17
G9030146 20/01/1978 115296 210 7.7

182
Surface Water Site
Sample Date
Sample No:
Specific Conduct (uS/cm)
pH Total
Alkalinity (mg/L)
Bicarb-onate (mg/L)
Total Hardness
(mg/L) TDS
(mg/L) Calcium (mg/L)
Chloride (mg/L)
NaCl (mg/L)
Magn-esium (mg/L)
Nitrate (mg/L)
Potass-ium
(mg/L) Sodium (mg/L)
Sulp-hate
(mg/L)
Flou-ride
(mg/L) Iron
(mg/L) Silica (mg/L)
Other Analysis
G9030146 14/04/1978 115297 130 7.5
G9030146 8/08/1980 115298 420 8.4 181 214 176 200 31 8 13 24 1 3 6 6 0.1 0.1 14
G9030176 5/02/1964 115299 TSS
G9030176 6/12/1964 115300 TSS
G9030176 8/02/1966 115301 Turbidity
G9030176 9/02/1966 115302 Turbidity
G9030176 9/02/1966 115303 Turbidity
G9030176 10/02/1966 115304 36 6.8 26 21
G9030176 10/02/1966 115305 Turbidity
G9030176 11/02/1966 115306 Turbidity
G9030176 12/02/1966 115307 Turbidity
G9030176 7/07/1966 115308 1565 7.98 376 229 380 960 37 195 70 0.7 19 355 150
G9030176 21/01/1967 115309 502 7.7 148 90 162 303 52
G9030176 12/08/1967 115310 1660 7.55 380 232 590 245
G9030176 4/12/1969 115311 Turbidity
G9030176 6/11/1974 115312 1670 7.5 390 476 516 1060 98 247 407 66 1 22 172 196 0.4 0.2 40
G9030176 7/05/1975 115313 910 7.7 Turbidity
G9030176 20/05/1975 115314 760 7.6 Turbidity
G9030176 4/06/1975 115315 950 7.8 Turbidity
G9030176 29/07/1975 115316 1460 7.7 Turbidity
G9030176 1/10/1975 115317 1750 7.6 Turbidity
G9030176 7/05/1976 115318 910 7.7 Turbidity

183
Surface Water Site
Sample Date
Sample No:
Specific Conduct (uS/cm)
pH Total
Alkalinity (mg/L)
Bicarb-onate (mg/L)
Total Hardness
(mg/L) TDS
(mg/L) Calcium (mg/L)
Chloride (mg/L)
NaCl (mg/L)
Magn-esium (mg/L)
Nitrate (mg/L)
Potass-ium
(mg/L) Sodium (mg/L)
Sulp-hate
(mg/L)
Flou-ride
(mg/L) Iron
(mg/L) Silica (mg/L)
Other Analysis
G9030176 5/08/1976 115319 1540 7.7 Turbidity
G9030176 13/01/1977 115320 720 7.2 175 214 225 470 47 83 137 26 2 10 60 68 0.4 2.3 10
G9030176 14/03/1977 115321 180 7.2
G9030176 20/01/1978 115322 580 7.7
G9030176 14/04/1978 115323 1010 7.9
G9030176 3/08/1995 143155 1613 7.8 403 491 477 1003 87 213 351 63 1 7 163 202 0.3 0.1 40
G9030178 25/05/1960 115324 7 35 34 15
G9030178 25/05/1960 115325 7 35 34 15
G9030178 27/07/1960 115326 7.5 32 43 16
G9030178 16/08/1960 115327 7 44 44 22
G9030178 17/08/1960 115328 7 42 44 22
G9030178 7/09/1960 115329 7 45 46 25
G9030178 7/09/1960 115330 7 45 47 25
G9030178 14/09/1960 115331 7 48 49 30
G9030178 14/09/1960 115332 7.5 44 46 25
G9030178 25/09/1960 115333 161 7.5 45 48 30
G9030178 28/09/1960 115334 162 7.5 45 48 30
G9030178 12/10/1960 115335 183 7 45 49 50
G9030178 12/10/1960 115336 175 7 45 49 35
G9030178 19/10/1960 115337 178 7 45 51 40
G9030178 19/10/1960 115338 179 7 45 51 40
G9030178 2/11/1960 115339 210 7.5 49 57 50

184
Surface Water Site
Sample Date
Sample No:
Specific Conduct (uS/cm)
pH Total
Alkalinity (mg/L)
Bicarb-onate (mg/L)
Total Hardness
(mg/L) TDS
(mg/L) Calcium (mg/L)
Chloride (mg/L)
NaCl (mg/L)
Magn-esium (mg/L)
Nitrate (mg/L)
Potass-ium
(mg/L) Sodium (mg/L)
Sulp-hate
(mg/L)
Flou-ride
(mg/L) Iron
(mg/L) Silica (mg/L)
Other Analysis
G9030178 3/11/1960 115340 225 7.5 48 56 50
G9030178 9/11/1960 115341 250 7 47 59 60
G9030178 9/11/1960 115342 207 7 50 56 35
G9030178 23/11/1960 115343 215 7.5 48 58 50
G9030178 23/11/1960 115344 201 7.5 50 59 45
G9030178 30/11/1960 115345 197 7.5 51 59 37
G9030178 3/12/1960 115346 203 7.5 51 63 48
G9030178 14/12/1960 115347 215 7.5 54 61 45
G9030178 14/12/1960 115348 220 7.5 55 62 53
G9030178 20/12/1960 115349 265 7.5 49 66 71
G9030178 20/12/1960 115350 213 7.5 50 63 50
G9030178 28/12/1960 115351 315 68 56 61
G9030178 28/12/1960 115352 253 61 76 63
G9030178 3/01/1961 115353 113 7 33 35 26
G9030178 11/01/1961 115354 163 7.5 37 49 30
G9030178 11/01/1961 115355 165 7.5 38 50 30
G9030178 17/01/1961 115356 154 7 36 21 30
G9030178 17/01/1961 115357 222 7.5 46 31 48
G9030178 25/01/1961 115358 247 7.5 50 70 45
G9030178 25/01/1961 115359 206 7.5 42 58 38
G9030178 31/01/1961 115360 287 7.5 54 80 60
G9030178 31/01/1961 115361 265 7.5 50 72 50

185
Surface Water Site
Sample Date
Sample No:
Specific Conduct (uS/cm)
pH Total
Alkalinity (mg/L)
Bicarb-onate (mg/L)
Total Hardness
(mg/L) TDS
(mg/L) Calcium (mg/L)
Chloride (mg/L)
NaCl (mg/L)
Magn-esium (mg/L)
Nitrate (mg/L)
Potass-ium
(mg/L) Sodium (mg/L)
Sulp-hate
(mg/L)
Flou-ride
(mg/L) Iron
(mg/L) Silica (mg/L)
Other Analysis
G9030178 1/02/1961 115362 305 7.5 56 85 61
G9030178 1/02/1961 115363 267 7.5 52 74 51
G9030178 8/02/1961 115364 283 7.5 60 78 62
G9030178 8/02/1961 115365 357 8.5 70 100 78
G9030178 15/02/1961 115366 393 7 78 112 88
G9030178 15/02/1961 115367 548 7.5 105 168 124
G9030178 22/02/1961 115368 487 7.5 101 135 96
G9030178 22/02/1961 115369 491 7.5 104 135 104
G9030178 1/03/1961 115370 493 7.5 105 136 102
G9030178 1/03/1961 115371 489 7.5 105 132 92
G9030178 8/03/1961 115372 435 7.5 100 125 90
G9030178 8/03/1961 115373 419 7.5 100 119 84
G9030178 15/03/1961 115374 420 7.5 99 120 84
G9030178 15/03/1961 115375 430 7.5 99 122 88
G9030178 22/03/1961 115376 470 8.5 100 126 90
G9030178 22/03/1961 115377 469 8.5 100 124 90
G9030178 29/03/1961 115378 471 7.5 103 126 89
G9030178 29/03/1961 115379 472 7.5 102 127 90
G9030178 14/04/1961 115380 484 7.5 105 131 90
G9030178 14/04/1961 115381 501 7.5 100 130 98
G9030178 19/04/1961 115382 501 7.5 105 125 98
G9030178 19/04/1961 115383 501 7.5 105 140 98

186
Surface Water Site
Sample Date
Sample No:
Specific Conduct (uS/cm)
pH Total
Alkalinity (mg/L)
Bicarb-onate (mg/L)
Total Hardness
(mg/L) TDS
(mg/L) Calcium (mg/L)
Chloride (mg/L)
NaCl (mg/L)
Magn-esium (mg/L)
Nitrate (mg/L)
Potass-ium
(mg/L) Sodium (mg/L)
Sulp-hate
(mg/L)
Flou-ride
(mg/L) Iron
(mg/L) Silica (mg/L)
Other Analysis
G9030178 26/04/1961 115384 492 7.5 109 125 94
G9030178 26/04/1961 115385 494 7.5 105 130 96
G9030178 5/05/1961 115386 499 7.5 112 142 92
G9030178 5/05/1961 115387 516 7.5 108 145 98
G9030178 10/05/1961 115388 532 7.5 106 140 94
G9030178 10/05/1961 115389 541 7.5 106 142 98
G9030178 24/05/1961 115390 529 7.5 107 140 84
G9030178 24/05/1961 115391 543 8 105 122 102
G9030178 2/06/1961 115392 537 7.5 110 155 94
G9030178 2/06/1961 115393 537 7.5 108 150 96
G9030178 2/06/1961 115394 537 7.5 109 150 96
G9030178 2/06/1961 115395 550 7 111 150 96
G9030178 2/06/1961 115396 551 7 110 149 95
G9030178 2/06/1961 115397 559 7.5 109 143 95
G9030178 2/06/1961 115398 536 7.5 114 145 94
G9030178 7/06/1961 115399 549 7 131 140 92
G9030178 7/06/1961 115400 537 7 115 138 100
G9030178 23/11/1961 115401 215 7.5 48 58 50
G9030178 23/11/1961 115402 201 7.5 50 59 45
G9030178 17/04/1962 115403 94 7.4 20 20 33
G9030178 17/04/1962 115404 180 6 5 20 82
G9030178 24/04/1962 115405 120 7 35 33 32

187
Surface Water Site
Sample Date
Sample No:
Specific Conduct (uS/cm)
pH Total
Alkalinity (mg/L)
Bicarb-onate (mg/L)
Total Hardness
(mg/L) TDS
(mg/L) Calcium (mg/L)
Chloride (mg/L)
NaCl (mg/L)
Magn-esium (mg/L)
Nitrate (mg/L)
Potass-ium
(mg/L) Sodium (mg/L)
Sulp-hate
(mg/L)
Flou-ride
(mg/L) Iron
(mg/L) Silica (mg/L)
Other Analysis
G9030178 7/05/1962 115406 135 7.3 30 30 30
G9030178 8/05/1962 115407 138 7.5 35 35 30
G9030178 20/05/1962 115408 113 7.4 35 36 36
G9030178 20/05/1962 115409 133 7.4 35 36 36
G9030178 21/05/1962 115410 140 7.4 35 38 38
G9030178 21/05/1962 115411 140 7.4 35 38 38
G9030178 29/05/1962 115412 260 5.8 10 38 112
G9030178 2/06/1962 115413 168 7.8 40 34 34
G9030178 2/06/1962 115414 89 7.6 45 31 35
G9030178 23/07/1963 115415 250 7.6 83 92 52 20
G9030178 23/07/1963 115416 263 7.6 87 86 54 20
G9030178 10/08/1963 115417 289 7 100 98 58
G9030178 23/09/1963 115418 1780 7.25 88 215 600
G9030178 23/09/1963 115419 1273 7.5 83 155 500
G9030178 24/09/1963 115420 1958 7.4 95 240 950
G9030178 24/09/1963 115421 1762 7.6 80 140 550
G9030178 25/09/1963 115422 2331 7.6 85 265 1150
G9030178 25/09/1963 115423 2422 7.25 83 280 1120
G9030178 26/09/1963 115424 1043 7.25 80 150 550
G9030178 26/09/1963 115425 450 7 100 88 155
G9030178 8/06/1964 115426 256 7.6 74 78 208 36
G9030178 5/08/1964 115427 336 7.61 75 78 257 33
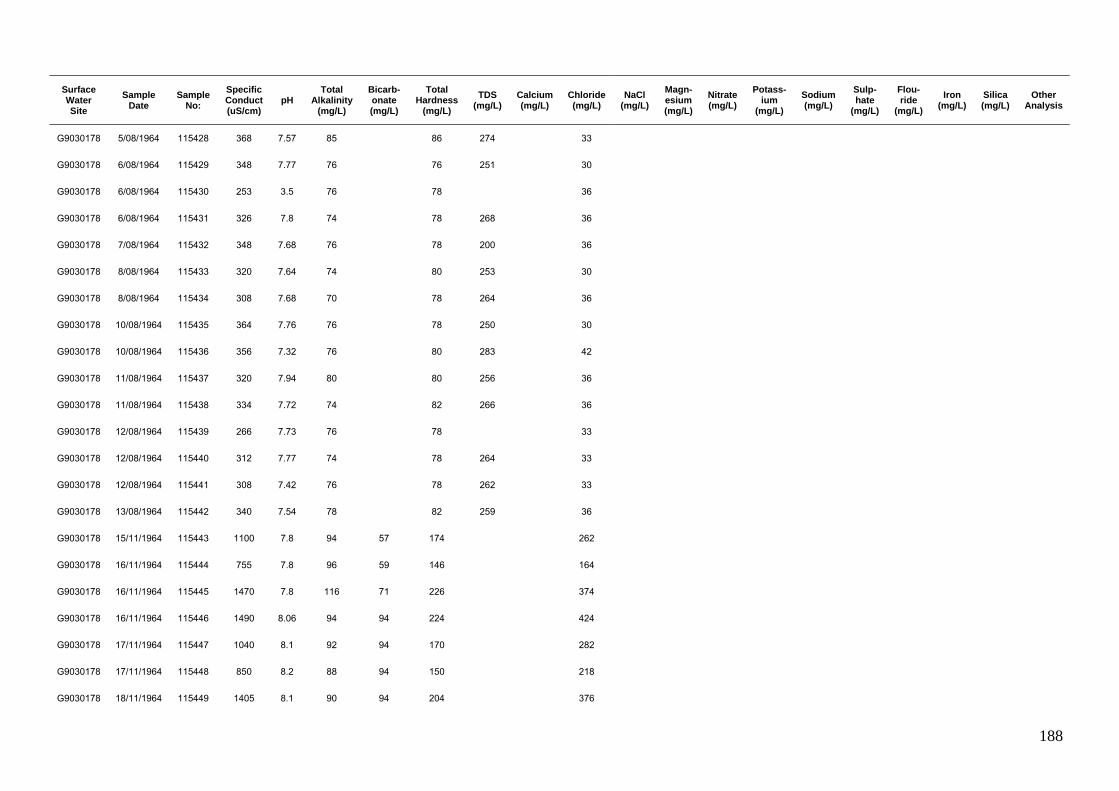
188
Surface Water Site
Sample Date
Sample No:
Specific Conduct (uS/cm)
pH Total
Alkalinity (mg/L)
Bicarb-onate (mg/L)
Total Hardness
(mg/L) TDS
(mg/L) Calcium (mg/L)
Chloride (mg/L)
NaCl (mg/L)
Magn-esium (mg/L)
Nitrate (mg/L)
Potass-ium
(mg/L) Sodium (mg/L)
Sulp-hate
(mg/L)
Flou-ride
(mg/L) Iron
(mg/L) Silica (mg/L)
Other Analysis
G9030178 5/08/1964 115428 368 7.57 85 86 274 33
G9030178 6/08/1964 115429 348 7.77 76 76 251 30
G9030178 6/08/1964 115430 253 3.5 76 78 36
G9030178 6/08/1964 115431 326 7.8 74 78 268 36
G9030178 7/08/1964 115432 348 7.68 76 78 200 36
G9030178 8/08/1964 115433 320 7.64 74 80 253 30
G9030178 8/08/1964 115434 308 7.68 70 78 264 36
G9030178 10/08/1964 115435 364 7.76 76 78 250 30
G9030178 10/08/1964 115436 356 7.32 76 80 283 42
G9030178 11/08/1964 115437 320 7.94 80 80 256 36
G9030178 11/08/1964 115438 334 7.72 74 82 266 36
G9030178 12/08/1964 115439 266 7.73 76 78 33
G9030178 12/08/1964 115440 312 7.77 74 78 264 33
G9030178 12/08/1964 115441 308 7.42 76 78 262 33
G9030178 13/08/1964 115442 340 7.54 78 82 259 36
G9030178 15/11/1964 115443 1100 7.8 94 57 174 262
G9030178 16/11/1964 115444 755 7.8 96 59 146 164
G9030178 16/11/1964 115445 1470 7.8 116 71 226 374
G9030178 16/11/1964 115446 1490 8.06 94 94 224 424
G9030178 17/11/1964 115447 1040 8.1 92 94 170 282
G9030178 17/11/1964 115448 850 8.2 88 94 150 218
G9030178 18/11/1964 115449 1405 8.1 90 94 204 376
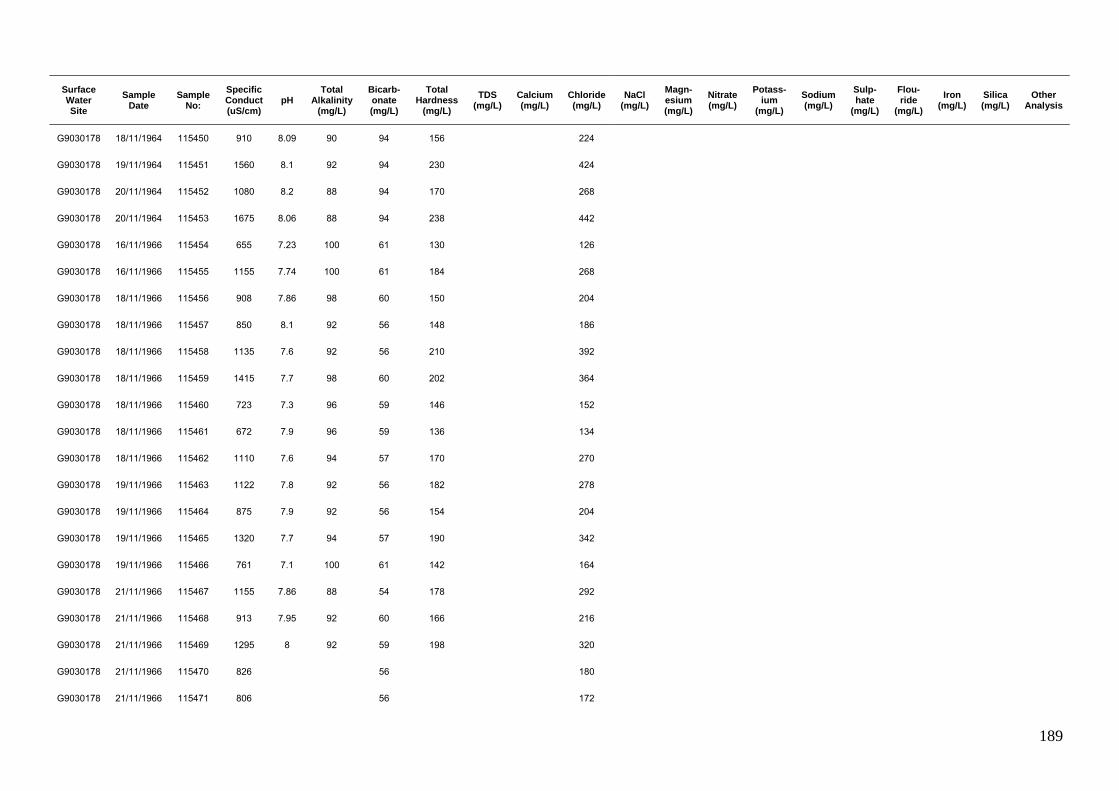
189
Surface Water Site
Sample Date
Sample No:
Specific Conduct (uS/cm)
pH Total
Alkalinity (mg/L)
Bicarb-onate (mg/L)
Total Hardness
(mg/L) TDS
(mg/L) Calcium (mg/L)
Chloride (mg/L)
NaCl (mg/L)
Magn-esium (mg/L)
Nitrate (mg/L)
Potass-ium
(mg/L) Sodium (mg/L)
Sulp-hate
(mg/L)
Flou-ride
(mg/L) Iron
(mg/L) Silica (mg/L)
Other Analysis
G9030178 18/11/1964 115450 910 8.09 90 94 156 224
G9030178 19/11/1964 115451 1560 8.1 92 94 230 424
G9030178 20/11/1964 115452 1080 8.2 88 94 170 268
G9030178 20/11/1964 115453 1675 8.06 88 94 238 442
G9030178 16/11/1966 115454 655 7.23 100 61 130 126
G9030178 16/11/1966 115455 1155 7.74 100 61 184 268
G9030178 18/11/1966 115456 908 7.86 98 60 150 204
G9030178 18/11/1966 115457 850 8.1 92 56 148 186
G9030178 18/11/1966 115458 1135 7.6 92 56 210 392
G9030178 18/11/1966 115459 1415 7.7 98 60 202 364
G9030178 18/11/1966 115460 723 7.3 96 59 146 152
G9030178 18/11/1966 115461 672 7.9 96 59 136 134
G9030178 18/11/1966 115462 1110 7.6 94 57 170 270
G9030178 19/11/1966 115463 1122 7.8 92 56 182 278
G9030178 19/11/1966 115464 875 7.9 92 56 154 204
G9030178 19/11/1966 115465 1320 7.7 94 57 190 342
G9030178 19/11/1966 115466 761 7.1 100 61 142 164
G9030178 21/11/1966 115467 1155 7.86 88 54 178 292
G9030178 21/11/1966 115468 913 7.95 92 60 166 216
G9030178 21/11/1966 115469 1295 8 92 59 198 320
G9030178 21/11/1966 115470 826 56 180
G9030178 21/11/1966 115471 806 56 172

190
Surface Water Site
Sample Date
Sample No:
Specific Conduct (uS/cm)
pH Total
Alkalinity (mg/L)
Bicarb-onate (mg/L)
Total Hardness
(mg/L) TDS
(mg/L) Calcium (mg/L)
Chloride (mg/L)
NaCl (mg/L)
Magn-esium (mg/L)
Nitrate (mg/L)
Potass-ium
(mg/L) Sodium (mg/L)
Sulp-hate
(mg/L)
Flou-ride
(mg/L) Iron
(mg/L) Silica (mg/L)
Other Analysis
G9030178 21/11/1966 115472 762 57 162
G9030178 21/11/1966 115473 714 7.66 94 61 148 148
G9030178 21/11/1966 115474 632 148
G9030178 29/11/1966 115475 1965 8.06 98 850 1175 60 0.04
G9030178 21/12/1966 115476 2600 7.9 96 59 310 1519 710
G9030178 28/12/1966 115477 3800 7.86 100 450 2359 61
G9030178 2/01/1967 115478 4950 8 100 61 530 2967 1380 0.19
G9030178 3/01/1967 115479 4330 7.99 102 62 505 2749 1270 0.03
G9030178 4/01/1967 115480 4440 7.78 98 59 620 2760 1300 0.95
G9030178 10/01/1967 115481 2790 8.07 102 62 370 1537 730 0.25
G9030178 11/01/1967 115482 5530 7.88 102 62 690 3582 1700 0.1
G9030178 17/01/1967 115483 3035 7.58 106 64 410 910
G9030178 17/01/1967 115484 5590 7.65 102 62 750 1800
G9030178 24/01/1967 115485 872 7.75 106 64 164 198
G9030178 24/01/1967 115486 1290 7.75 104 63 208 328
G9030178 24/01/1967 115487 1552 7.68 106 64 230 298
G9030178 12/05/1969 115488 240 6.8 94 115 94 160 22 16 11 1 3 14 11 0.2 0.6 14
G9030178 14/08/1969 115489 315 8.1 123 150 126 200 26 24 15 1 3 18 10 0.1 0.5 8
G9030178 4/09/1969 115490 300 7.5 122 149 130 170 26 24 15 1 3 18 14 0.1 0.8 5
G9030178 23/09/1969 115491 320 8.2 126 154 133 180 27 26 15 1 3 20 17 0.1 0.5 6
G9030178 21/05/1970 115492 245 8 70 85 78 110 16 26 10 2 3 17 23 0.2 4
G9030178 27/07/1970 115493 7.5 40 46 18

191
Surface Water Site
Sample Date
Sample No:
Specific Conduct (uS/cm)
pH Total
Alkalinity (mg/L)
Bicarb-onate (mg/L)
Total Hardness
(mg/L) TDS
(mg/L) Calcium (mg/L)
Chloride (mg/L)
NaCl (mg/L)
Magn-esium (mg/L)
Nitrate (mg/L)
Potass-ium
(mg/L) Sodium (mg/L)
Sulp-hate
(mg/L)
Flou-ride
(mg/L) Iron
(mg/L) Silica (mg/L)
Other Analysis
G9030178 8/09/1970 115494 400 7.2 82 100 107 240 20 60 14 2 5 37 36 0.2 1.4 2
G9030178 3/11/1970 115495 1620 427
G9030178 4/10/1973 115496 240 8 75 92 86 140 18 23 38 10 1 4 17 20 0.2 2.2 1
G9030178 19/09/1974 115497 700 8.1 177 216 221 480 44 77 127 27 1 6 47 55 0.3 1 7
G9030178 26/09/1974 115498 Turbidity
G9030178 10/10/1974 115499 Turbidity
G9030178 24/10/1974 115500 Turbidity
G9030178 1/11/1974 115501 1070 8.1 226 275 330 778 58 155 255 45 1 10 100 124 0.2 0.4 10
G9030178 1/11/1974 115502 1070 8.1 226 275 330 777 58 155 255 45 1 10 100 123 0.3 0.5 10
G9030178 5/11/1974 115503 1180 8.2 231 282 343 824 60 170 280 47 1 11 110 138 0.3 1.1 5
G9030178 5/11/1974 115504 1140 8.1 233 284 333 789 59 160 264 45 1 10 100 126 0.3 0.9 4
G9030178 7/11/1974 115505 Turbidity
G9030178 12/11/1974 115506 1200 7.5 228 278 343 833 60 175 288 47 1 11 109 142 0.4 0.1 10
G9030178 14/11/1974 115507 Turbidity
G9030178 19/11/1974 115508 Turbidity
G9030178 21/11/1974 115509 Turbidity
G9030178 25/11/1974 115510 Turbidity
G9030178 25/11/1974 115511 1240 8.1 232 283 343 859 60 171 282 47 1 12 119 156 0.4 0.5 10
G9030178 5/12/1974 115512 Turbidity
G9030178 6/12/1974 115513 1180 8 224 273 341 819 59 165 272 47 1 11 107 142 0.1 1.2 9
G9030178 10/12/1974 115514 1250 8.1 226 275 353 853 59 184 303 50 1 11 120 148 0.3 0.6 10
G9030178 19/12/1974 115515 1170 8.3 215 262 353 826 64 174 287 47 1 11 112 146 0.3 0.5 9

192
Surface Water Site
Sample Date
Sample No:
Specific Conduct (uS/cm)
pH Total
Alkalinity (mg/L)
Bicarb-onate (mg/L)
Total Hardness
(mg/L) TDS
(mg/L) Calcium (mg/L)
Chloride (mg/L)
NaCl (mg/L)
Magn-esium (mg/L)
Nitrate (mg/L)
Potass-ium
(mg/L) Sodium (mg/L)
Sulp-hate
(mg/L)
Flou-ride
(mg/L) Iron
(mg/L) Silica (mg/L)
Other Analysis
G9030178 9/02/1975 115516 Turbidity
G9030178 4/03/1975 115517 Turbidity
G9030178 13/03/1975 115518 Turbidity
G9030178 26/03/1975 115519 Turbidity
G9030178 24/04/1975 115520 Turbidity
G9030178 8/05/1975 115521 210 20 33
G9030178 22/05/1975 115522 290 25 41
G9030178 12/06/1975 115523 360 7.1 110 134 120 264 26 31 51 14 1 3 20 21 0.2 0.4 14
G9030178 19/06/1975 115524 380 35 57
G9030178 3/07/1975 115525 430 39 64
G9030178 24/07/1975 115526 450 42 69
G9030178 14/08/1975 115527 510 48 79
G9030178 9/10/1975 115528 570 59 97
G9030178 9/10/1975 115529 590 59 97
G9030178 23/10/1975 115530 630 67 110
G9030178 6/11/1975 115531 600 63 104
G9030178 21/11/1975 115532 650 69 114
G9030178 5/12/1975 115533 720 73
G9030178 12/12/1975 115534 52 6.9 21 26 21 32 5 2 3 2 1 2 2 2 0.2 9 8
G9030178 20/01/1976 115535 150 12
G9030178 13/02/1976 115536 100 9
G9030178 27/02/1976 115537 73 7

193
Surface Water Site
Sample Date
Sample No:
Specific Conduct (uS/cm)
pH Total
Alkalinity (mg/L)
Bicarb-onate (mg/L)
Total Hardness
(mg/L) TDS
(mg/L) Calcium (mg/L)
Chloride (mg/L)
NaCl (mg/L)
Magn-esium (mg/L)
Nitrate (mg/L)
Potass-ium
(mg/L) Sodium (mg/L)
Sulp-hate
(mg/L)
Flou-ride
(mg/L) Iron
(mg/L) Silica (mg/L)
Other Analysis
G9030178 23/04/1976 115538 360 7.7 29 48
G9030178 6/05/1976 115539 410 7.7 33 54
G9030178 20/05/1976 115540 490 7.9 43 71
G9030178 3/06/1976 115541 550 7.9 49 81
G9030178 1/07/1976 115542 700 72 119
G9030178 29/07/1976 115543 790 95 157
G9030178 15/11/1977 115544 1570 7.8 255 311 415 250 412
G9030178 15/08/1979 115545 530 8.1 165 201 189 300 38 49 81 23 1 5 36 36 0.2 0.5 10
G9030178 14/02/1980 115546 Turbidity
G9030178 4/03/1980 115547 Turbidity
G9030178 4/03/1980 115548 Turbidity
G9030178 30/06/1980 115549 455 8.4 118 138 136 200 28 37 61 16 1 3 25 26 0.2 0.5 6
G9030178 9/10/1980 115550 708 174 212 40 75 124 28 1 5 46 50 0.2 0.4 6
G9030178 9/02/1983 115551 Faecal
G9030178 15/11/1983 115552 Faecal
G9030178 27/01/1984 115553 Faecal
G9030178 21/02/1984 115554 Faecal
G9030178 6/06/1985 115555 280 7 84 102 86 150 18 24 40 10 1 3 19 17 0.1 0.7 18
G9030178 29/04/1986 115556 Faecal
G9030178 21/07/1987 115557 Faecal
G9030178 14/08/1992 115558 280 8.2 89 109 100 165 22 25 41 11 2 4 18 17 0.1 1.1 3
G9030178 23/09/1993 115559 44 7.4 21 25 11 37 1 7 12 2 1 2 4 2 0.1 0.3 11

194
Surface Water Site
Sample Date
Sample No:
Specific Conduct (uS/cm)
pH Total
Alkalinity (mg/L)
Bicarb-onate (mg/L)
Total Hardness
(mg/L) TDS
(mg/L) Calcium (mg/L)
Chloride (mg/L)
NaCl (mg/L)
Magn-esium (mg/L)
Nitrate (mg/L)
Potass-ium
(mg/L) Sodium (mg/L)
Sulp-hate
(mg/L)
Flou-ride
(mg/L) Iron
(mg/L) Silica (mg/L)
Other Analysis
G9030250 15/08/1967 115560 832 7.75 206 126 296 515 45 108 44 0.5 8 70 50 0.2
G9030250 8/02/1970 115561 Turbidity
G9030250 8/02/1970 115562 Turbidity
G9030250 8/02/1970 115563 Turbidity
G9030250 9/02/1970 115564 Turbidity
G9030250 9/02/1970 115565 Turbidity
G9030250 15/03/1973 115566 TSS
G9030250 16/03/1973 115567 TSS
G9030250 16/03/1973 115568 TSS
G9030250 17/03/1973 115569 TSS
G9030250 17/03/1973 115570 TSS
G9030250 18/03/1973 115571 TSS
G9030250 19/03/1973 115572 TSS
G9030250 19/03/1973 115573 TSS
G9030250 20/03/1973 115574 TSS
G9030250 21/03/1973 115575 TSS
G9030250 22/03/1973 115576 TSS
G9030250 23/03/1973 115577 TSS
G9030250 24/03/1973 115578 TSS
G9030250 24/03/1973 115579 TSS
G9030250 25/03/1973 115580 TSS
G9030250 25/03/1973 115581 TSS
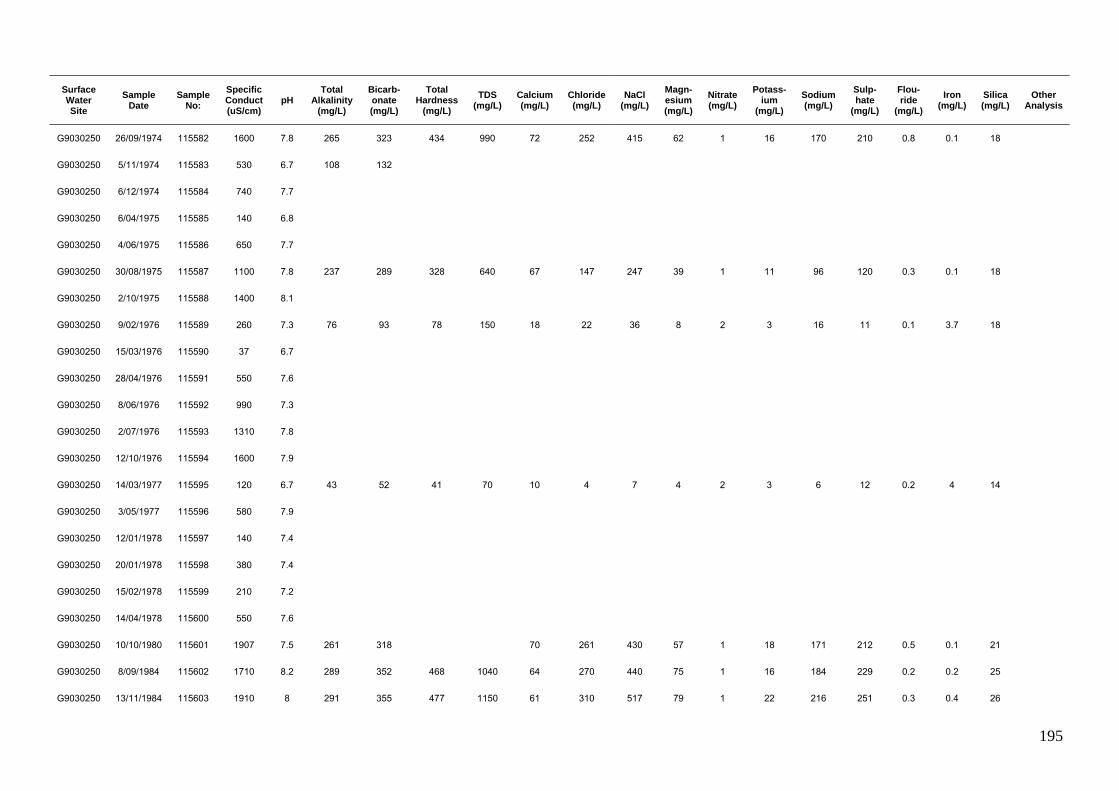
195
Surface Water Site
Sample Date
Sample No:
Specific Conduct (uS/cm)
pH Total
Alkalinity (mg/L)
Bicarb-onate (mg/L)
Total Hardness
(mg/L) TDS
(mg/L) Calcium (mg/L)
Chloride (mg/L)
NaCl (mg/L)
Magn-esium (mg/L)
Nitrate (mg/L)
Potass-ium
(mg/L) Sodium (mg/L)
Sulp-hate
(mg/L)
Flou-ride
(mg/L) Iron
(mg/L) Silica (mg/L)
Other Analysis
G9030250 26/09/1974 115582 1600 7.8 265 323 434 990 72 252 415 62 1 16 170 210 0.8 0.1 18
G9030250 5/11/1974 115583 530 6.7 108 132
G9030250 6/12/1974 115584 740 7.7
G9030250 6/04/1975 115585 140 6.8
G9030250 4/06/1975 115586 650 7.7
G9030250 30/08/1975 115587 1100 7.8 237 289 328 640 67 147 247 39 1 11 96 120 0.3 0.1 18
G9030250 2/10/1975 115588 1400 8.1
G9030250 9/02/1976 115589 260 7.3 76 93 78 150 18 22 36 8 2 3 16 11 0.1 3.7 18
G9030250 15/03/1976 115590 37 6.7
G9030250 28/04/1976 115591 550 7.6
G9030250 8/06/1976 115592 990 7.3
G9030250 2/07/1976 115593 1310 7.8
G9030250 12/10/1976 115594 1600 7.9
G9030250 14/03/1977 115595 120 6.7 43 52 41 70 10 4 7 4 2 3 6 12 0.2 4 14
G9030250 3/05/1977 115596 580 7.9
G9030250 12/01/1978 115597 140 7.4
G9030250 20/01/1978 115598 380 7.4
G9030250 15/02/1978 115599 210 7.2
G9030250 14/04/1978 115600 550 7.6
G9030250 10/10/1980 115601 1907 7.5 261 318 70 261 430 57 1 18 171 212 0.5 0.1 21
G9030250 8/09/1984 115602 1710 8.2 289 352 468 1040 64 270 440 75 1 16 184 229 0.2 0.2 25
G9030250 13/11/1984 115603 1910 8 291 355 477 1150 61 310 517 79 1 22 216 251 0.3 0.4 26

196
Surface Water Site
Sample Date
Sample No:
Specific Conduct (uS/cm)
pH Total
Alkalinity (mg/L)
Bicarb-onate (mg/L)
Total Hardness
(mg/L) TDS
(mg/L) Calcium (mg/L)
Chloride (mg/L)
NaCl (mg/L)
Magn-esium (mg/L)
Nitrate (mg/L)
Potass-ium
(mg/L) Sodium (mg/L)
Sulp-hate
(mg/L)
Flou-ride
(mg/L) Iron
(mg/L) Silica (mg/L)
Other Analysis
G9030250 20/06/1986 115604 825 8.4 210 250 254 480 44 110 175 35 2 9 78 63 0.2 0.3 18
G9030250 31/08/1994 135205 1418 8.3 263 321 402 830 72 201 331 54 1 15 134 194 0.2 2.1 19
G9030250 9/12/1994 140495 1880 8.3 190 230 0.005
G9030250 9/12/1994 151647 1880 8.3 190 230 0.005
G9030250 3/08/1995 143156 788 8.4 202 240 228 469 45 95 157 28 1 3 71 82 0.2 0.1 15
G9030250 22/08/1995 152929 833 8.4 215 250 0.008
G9030250 22/11/1995 153115 252 6.4 58 70 0.177
G9030250 9/09/1998 160314 1514 8.3 286.2498 349 406.7 891 61 230 379.04 62 1 15 146 173 0.2 0.2 22
G9030509 18/02/1992 115631 1160 8.2 732
G9030509 18/02/1992 115632 Faecal
G9030509 11/03/1992 115633 8.1
G9030509 11/03/1992 115634 Faecal
G9030509 13/07/1993 115635 1580 8.4 997
G9030509 13/07/1993 115636 Faecal
G9030509 9/08/1993 115637 Faecal
G9030509 6/09/1993 115638 Faecal
G9030509 1/11/1993 115639 Faecal
G9030509 12/01/1994 115640 Faecal
G9030509 7/02/1994 115641 Faecal
G9030509 16/05/1994 115642 Faecal
G9030509 16/05/1994 1354 Faecal
G9030509 8/06/1994 120011 Faecal

197
Surface Water Site
Sample Date
Sample No:
Specific Conduct (uS/cm)
pH Total
Alkalinity (mg/L)
Bicarb-onate (mg/L)
Total Hardness
(mg/L) TDS
(mg/L) Calcium (mg/L)
Chloride (mg/L)
NaCl (mg/L)
Magn-esium (mg/L)
Nitrate (mg/L)
Potass-ium
(mg/L) Sodium (mg/L)
Sulp-hate
(mg/L)
Flou-ride
(mg/L) Iron
(mg/L) Silica (mg/L)
Other Analysis
G9030509 8/06/1994 1353 Faecal
G9030509 13/07/1994 130356 Faecal
G9030509 13/07/1994 1352 Faecal
G9030510 27/06/1987 115643 1260 8.4 286 347 795 187
G9030510 21/07/1987 115644 Faecal
G9030510 18/02/1992 115645 1200 8.1 757
G9030510 18/02/1992 115646 Faecal
G9030510 11/03/1992 115647 8.8
G9030510 11/03/1992 115648 Faecal
G9030511 21/07/1987 115649 Faecal
G9030511 27/06/1989 115650 1235 8.8 264 336 780 190
G9030511 18/02/1992 115651 990 8.3 625
G9030511 18/02/1992 115652 Faecal
G9030511 11/03/1992 115653 9.9
G9030511 11/03/1992 115654 Faecal
G9030511 24/11/1992 115655 Faecal
G9030511 12/01/1993 115656 Faecal
G9030511 13/07/1993 115657 1570 8.4 991
G9030511 13/07/1993 115658 Faecal
G9030511 9/08/1993 115659 Faecal
G9030511 6/09/1993 115660 Faecal
G9030511 1/11/1993 115661 Faecal

198
Surface Water Site
Sample Date
Sample No:
Specific Conduct (uS/cm)
pH Total
Alkalinity (mg/L)
Bicarb-onate (mg/L)
Total Hardness
(mg/L) TDS
(mg/L) Calcium (mg/L)
Chloride (mg/L)
NaCl (mg/L)
Magn-esium (mg/L)
Nitrate (mg/L)
Potass-ium
(mg/L) Sodium (mg/L)
Sulp-hate
(mg/L)
Flou-ride
(mg/L) Iron
(mg/L) Silica (mg/L)
Other Analysis
G9030511 12/01/1994 115662 Faecal
G9030511 7/02/1994 115663 Faecal
G9030511 16/05/1994 115664 Faecal
G9030511 16/05/1994 1351 Faecal
G9030511 8/06/1994 120012 Faecal
G9030511 8/06/1994 1350 Faecal
G9030511 13/07/1994 130357 Faecal
G9030511 13/07/1994 1349 Faecal
G9030512 25/02/1992 115665 82 7 52
G9030512 25/02/1992 115666 Faecal
G9030512 11/03/1992 115667 8.1
G9030512 11/03/1992 115668 Faecal
G9035000 23/09/1963 115682 287 7.6 85 78 45
G9035000 23/09/1963 115683 210 8 97 155 45
G9035000 11/09/2007 544
G9035005 27/06/1986 115838 35 6.2 7 9 4 40 1 8 12 1 1 2 4 2 0.1 0.8 17
G9035007 24/06/1986 115840 55 6.5 13 16 16 55 3 8 13 2 3 4 3 5 0.1 2.2 14
G9035008 2/12/1974 115841 Faecal
G9035008 27/06/1986 115842 1645 7.2 522 637 573 1025 137 180 295 56 1 20 143 179 0.6 0.1 43
G9035009 7/06/1978 115843 1102 8.3 239 290 344 670 62 144 237 46 1 9 103 104 0.3 0.7 20
G9035009 10/10/1980 115844 1510 7.9 245 299 371 830 53 206 339 58 1 15 144 170 0.3 0.1 19
G9035009 26/06/1986 115845 685 8.3 189 231 217 400 46 80 133 29 2 7 55 49 0.2 0.2 16

199
Surface Water Site
Sample Date
Sample No:
Specific Conduct (uS/cm)
pH Total
Alkalinity (mg/L)
Bicarb-onate (mg/L)
Total Hardness
(mg/L) TDS
(mg/L) Calcium (mg/L)
Chloride (mg/L)
NaCl (mg/L)
Magn-esium (mg/L)
Nitrate (mg/L)
Potass-ium
(mg/L) Sodium (mg/L)
Sulp-hate
(mg/L)
Flou-ride
(mg/L) Iron
(mg/L) Silica (mg/L)
Other Analysis
G9035010 20/06/1986 115846 1210 8.3 253 308 363 720 60 166 269 52 1 13 122 137 0.2 0.1 22
G9035011 16/06/1986 115847 20 6.1 4 5 7 35 1 6 10 1 1 1 3 1 0.1 0.5 14
G9035011 12/12/1994 151648 142 6.9 50 61
G9035011 23/08/1995 152930 117 6.6 44.5 54.3
G9035011 21/11/1995 153114 137 6.4 56 68
G9035012 14/10/1968 115848 47 6.6 8 5 10 40 1 12 1 1 1 6 2 0.2 0.8 14
G9035012 22/09/1970 115849 47 5.7 10 12 5 48 1 10 1 1 1 4 2 0.1 6.8 18
G9035012 2/06/1973 115850 54 6.1 10 12 7 47 1 9 15 1 1 1 7 2 0.1 2 20
G9035012 11/07/1979 115851 40 5.6 3 4 7 43 1 12 20 1 1 2 4 1 0.1 1.8 18
G9035012 24/06/1986 115852 40 6 5 6 4 40 1 10 15 1 1 1 5 1 0.1 1 19
G9035012 14/09/1993 115853 73 6.6 16 19 11 55 1 13 21 2 1 3 8 1 0.1 6 20
G9035012 14/09/1993 115854 Faecal
G9035012 14/09/1993 115855 Faecal
G9035012 14/09/1993 115856 56 6.4 11 13 8 44 1 12 20 2 1 2 7 1 0.1 4.8 18
G9035012 14/09/1993 115857 Faecal
G9035012 14/09/1993 115858 Faecal
G9035012 8/09/2007 50
G9035013 16/06/1986 115859 95 7 38 46 31 65 6 8 12 4 2 3 6 3 0.1 10 12
G9035013 16/06/1986 115860 Turbidity
G9035014 4/09/1985 115861 140 6.9 40 49 38 70 5 19 32 6 1 1 12 1 0.1 0.6 1
G9035015 4/09/1985 115862 40 6.2 1 1 11 80 1 4 8 2 4 3 4 4 0.1 4.5 11
G9035015 11/09/2007 56
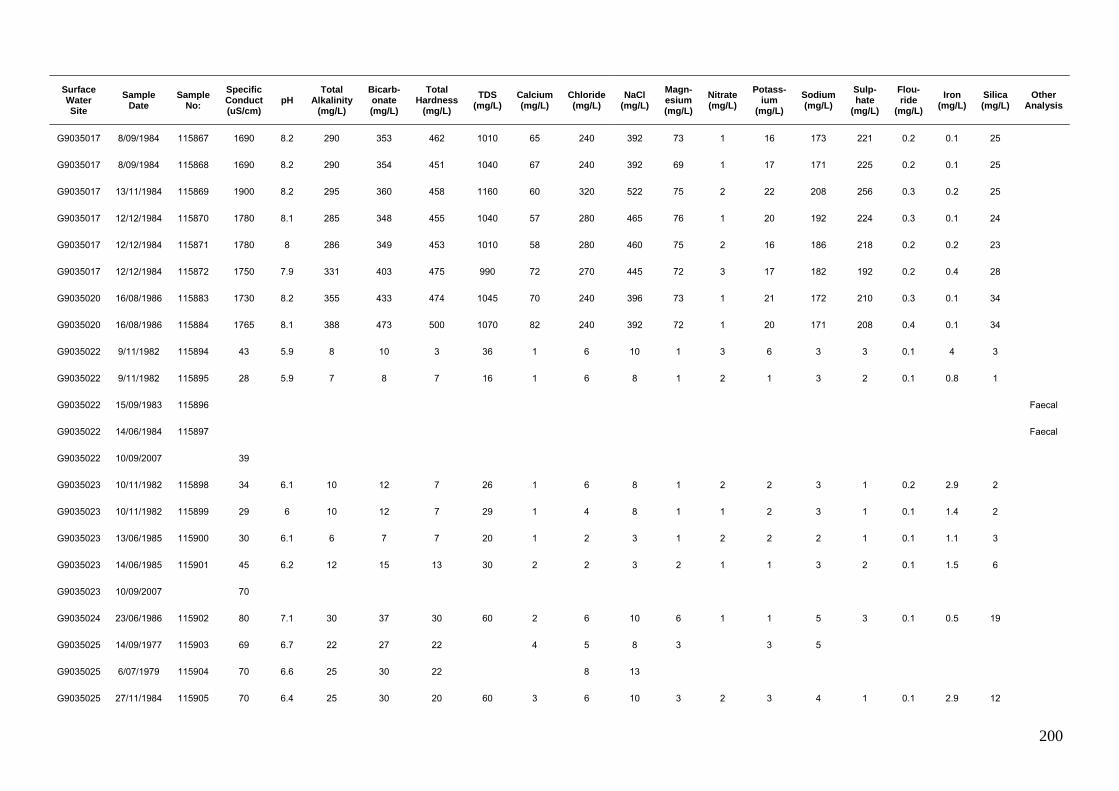
200
Surface Water Site
Sample Date
Sample No:
Specific Conduct (uS/cm)
pH Total
Alkalinity (mg/L)
Bicarb-onate (mg/L)
Total Hardness
(mg/L) TDS
(mg/L) Calcium (mg/L)
Chloride (mg/L)
NaCl (mg/L)
Magn-esium (mg/L)
Nitrate (mg/L)
Potass-ium
(mg/L) Sodium (mg/L)
Sulp-hate
(mg/L)
Flou-ride
(mg/L) Iron
(mg/L) Silica (mg/L)
Other Analysis
G9035017 8/09/1984 115867 1690 8.2 290 353 462 1010 65 240 392 73 1 16 173 221 0.2 0.1 25
G9035017 8/09/1984 115868 1690 8.2 290 354 451 1040 67 240 392 69 1 17 171 225 0.2 0.1 25
G9035017 13/11/1984 115869 1900 8.2 295 360 458 1160 60 320 522 75 2 22 208 256 0.3 0.2 25
G9035017 12/12/1984 115870 1780 8.1 285 348 455 1040 57 280 465 76 1 20 192 224 0.3 0.1 24
G9035017 12/12/1984 115871 1780 8 286 349 453 1010 58 280 460 75 2 16 186 218 0.2 0.2 23
G9035017 12/12/1984 115872 1750 7.9 331 403 475 990 72 270 445 72 3 17 182 192 0.2 0.4 28
G9035020 16/08/1986 115883 1730 8.2 355 433 474 1045 70 240 396 73 1 21 172 210 0.3 0.1 34
G9035020 16/08/1986 115884 1765 8.1 388 473 500 1070 82 240 392 72 1 20 171 208 0.4 0.1 34
G9035022 9/11/1982 115894 43 5.9 8 10 3 36 1 6 10 1 3 6 3 3 0.1 4 3
G9035022 9/11/1982 115895 28 5.9 7 8 7 16 1 6 8 1 2 1 3 2 0.1 0.8 1
G9035022 15/09/1983 115896 Faecal
G9035022 14/06/1984 115897 Faecal
G9035022 10/09/2007 39
G9035023 10/11/1982 115898 34 6.1 10 12 7 26 1 6 8 1 2 2 3 1 0.2 2.9 2
G9035023 10/11/1982 115899 29 6 10 12 7 29 1 4 8 1 1 2 3 1 0.1 1.4 2
G9035023 13/06/1985 115900 30 6.1 6 7 7 20 1 2 3 1 2 2 2 1 0.1 1.1 3
G9035023 14/06/1985 115901 45 6.2 12 15 13 30 2 2 3 2 1 1 3 2 0.1 1.5 6
G9035023 10/09/2007 70
G9035024 23/06/1986 115902 80 7.1 30 37 30 60 2 6 10 6 1 1 5 3 0.1 0.5 19
G9035025 14/09/1977 115903 69 6.7 22 27 22 4 5 8 3 3 5
G9035025 6/07/1979 115904 70 6.6 25 30 22 8 13
G9035025 27/11/1984 115905 70 6.4 25 30 20 60 3 6 10 3 2 3 4 1 0.1 2.9 12

201
Surface Water Site
Sample Date
Sample No:
Specific Conduct (uS/cm)
pH Total
Alkalinity (mg/L)
Bicarb-onate (mg/L)
Total Hardness
(mg/L) TDS
(mg/L) Calcium (mg/L)
Chloride (mg/L)
NaCl (mg/L)
Magn-esium (mg/L)
Nitrate (mg/L)
Potass-ium
(mg/L) Sodium (mg/L)
Sulp-hate
(mg/L)
Flou-ride
(mg/L) Iron
(mg/L) Silica (mg/L)
Other Analysis
G9035025 12/06/1985 115906 50 6.8 15 18 16 55 3 6 10 2 2 1 3 5 0.1 2.9 13
G9035025 24/06/1986 115907 70 6.6 28 34 20 55 3 6 8 3 2 3 5 3 0.2 3 11
G9035025 22/03/1988 115908 Faecal
G9035025 18/03/1990 115909 Faecal
G9035025 18/03/1990 115910 65 6.8 28 34 26 65 4 4 6 4 2 4 4 9 0.1 11.3 13
G9035025 26/09/1990 115911 Faecal
G9035025 10/10/1990 115912 85 6.9 33 40 33 85 7 6 10 4 3 4 6 4 0.2 19.5 16
G9035025 11/12/1994 151649 77.4 6.1 29 35
G9035025 23/08/1995 152936 78 6.6 27.3 33.3
G9035025 21/11/1995 153737 96 6.5 35 43
G9035026 24/06/1986 115913 40 6.3 7 9 4 55 1 8 13 1 1 3 4 1 0.1 4.3 26
G9035028 13/08/1966 115918 170 8 58 33 46 96 1 10 10 3 17 2 0.2 2.7
G9035029 12/10/1965 115919 90 6.3 30 18 9 113 4 18 2 3 16 1
G9035029 12/12/1970 115920 140 7.1 36 44 42 100 6 18 7 11 8 13 21 0.2 7.4
G9035031 22/06/1961 115924 1260 7.5 108 205
G9035031 10/11/1982 115925 500 4.3 1 1 47 250 7 120 200 7 1 10 62 20 0.1 1.8 22
G9035031 13/06/1984 115926 360 7.7 130 120 200 25 38 63 14 1 3 27 26 0.1
G9035032 26/05/1960 115927 6.5 25 26 15
G9035032 27/07/1960 115928 6.5 20 16 7
G9035032 17/08/1960 115929 6.5 20 18 10 0.1
G9035032 7/09/1960 115930 6.5 15 16 15
G9035032 14/09/1960 115931 6.5 23 17 11
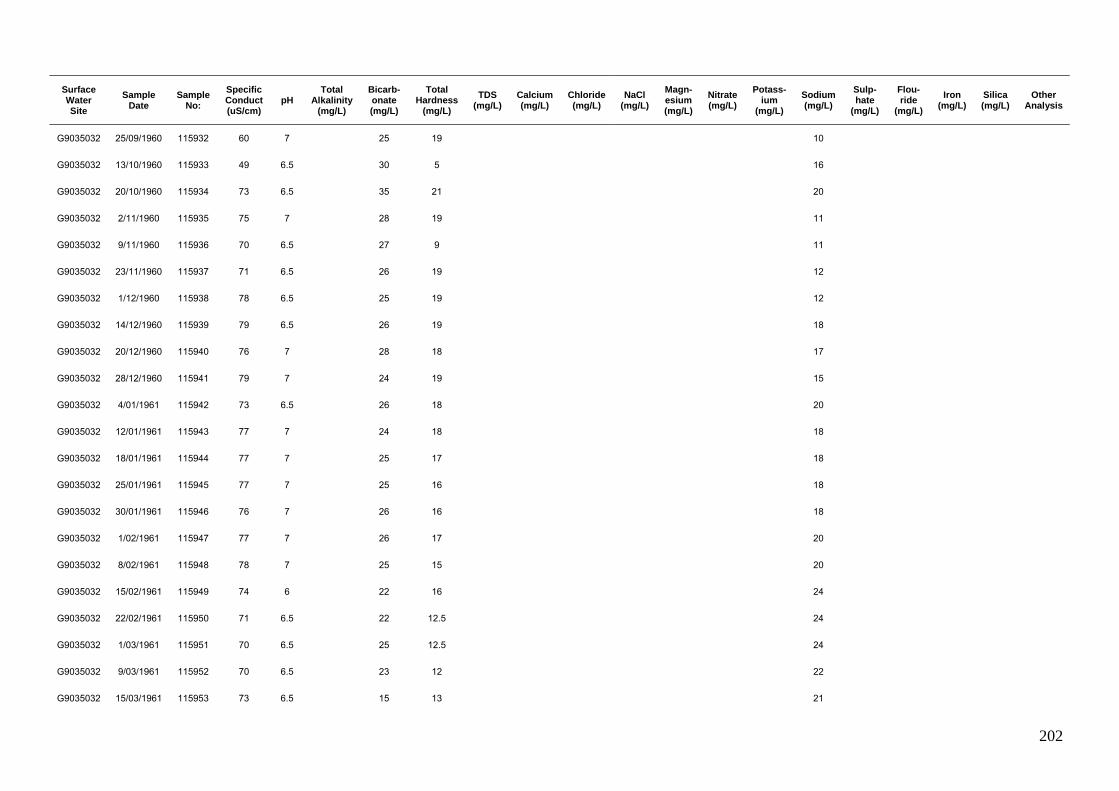
202
Surface Water Site
Sample Date
Sample No:
Specific Conduct (uS/cm)
pH Total
Alkalinity (mg/L)
Bicarb-onate (mg/L)
Total Hardness
(mg/L) TDS
(mg/L) Calcium (mg/L)
Chloride (mg/L)
NaCl (mg/L)
Magn-esium (mg/L)
Nitrate (mg/L)
Potass-ium
(mg/L) Sodium (mg/L)
Sulp-hate
(mg/L)
Flou-ride
(mg/L) Iron
(mg/L) Silica (mg/L)
Other Analysis
G9035032 25/09/1960 115932 60 7 25 19 10
G9035032 13/10/1960 115933 49 6.5 30 5 16
G9035032 20/10/1960 115934 73 6.5 35 21 20
G9035032 2/11/1960 115935 75 7 28 19 11
G9035032 9/11/1960 115936 70 6.5 27 9 11
G9035032 23/11/1960 115937 71 6.5 26 19 12
G9035032 1/12/1960 115938 78 6.5 25 19 12
G9035032 14/12/1960 115939 79 6.5 26 19 18
G9035032 20/12/1960 115940 76 7 28 18 17
G9035032 28/12/1960 115941 79 7 24 19 15
G9035032 4/01/1961 115942 73 6.5 26 18 20
G9035032 12/01/1961 115943 77 7 24 18 18
G9035032 18/01/1961 115944 77 7 25 17 18
G9035032 25/01/1961 115945 77 7 25 16 18
G9035032 30/01/1961 115946 76 7 26 16 18
G9035032 1/02/1961 115947 77 7 26 17 20
G9035032 8/02/1961 115948 78 7 25 15 20
G9035032 15/02/1961 115949 74 6 22 16 24
G9035032 22/02/1961 115950 71 6.5 22 12.5 24
G9035032 1/03/1961 115951 70 6.5 25 12.5 24
G9035032 9/03/1961 115952 70 6.5 23 12 22
G9035032 15/03/1961 115953 73 6.5 15 13 21

203
Surface Water Site
Sample Date
Sample No:
Specific Conduct (uS/cm)
pH Total
Alkalinity (mg/L)
Bicarb-onate (mg/L)
Total Hardness
(mg/L) TDS
(mg/L) Calcium (mg/L)
Chloride (mg/L)
NaCl (mg/L)
Magn-esium (mg/L)
Nitrate (mg/L)
Potass-ium
(mg/L) Sodium (mg/L)
Sulp-hate
(mg/L)
Flou-ride
(mg/L) Iron
(mg/L) Silica (mg/L)
Other Analysis
G9035032 22/03/1961 115954 78 6.5 22 12 25
G9035032 29/03/1961 115955 79 7 22 11 19
G9035032 13/04/1961 115956 74 6.5 20 8 20
G9035032 19/04/1961 115957 74 6.5 20 10 28
G9035032 26/04/1961 115958 72 6 15 8 24
G9035032 4/05/1961 115959 72 6 17 8.6 26
G9035032 10/05/1961 115960 72 6.5 13 8 24
G9035032 24/05/1961 115961 72 6 10 7 30
G9035032 31/05/1961 115962 67 6 10 7 26
G9035032 6/06/1961 115963 68 6.5 10 8 24
G9035033 9/11/1982 115964 61 6.3 20 24 18 37 4 8 12 2 1 2 4 1 0.1 0.3 3
G9035033 10/09/2007 37
G9035034 9/10/1980 115965 967 8.4 208 253 48 109 180 36 1 8 70 81 0.2 0.2 14
G9035035 8/10/1980 115966 573 7.9 148 180 36 58 96 22 1 4 36 37 0.2 0.2 4
G9035036 8/10/1980 115967 11970 8 115 500 88 3570 5890 247 2 77 1897 500 0.7 17 5
G9035036 8/10/1980 115968 12010 8.1
G9035036 8/10/1980 115969 11130 8.2
G9035036 25/06/1986 115970 15380 7.9 98 119 1820 5100 8403
G9035037 8/10/1980 115971 8540 8 120 146 70 2356 3883 179 1 56 1336 360 0.5 10 5
G9035038 8/10/1980 115972 4500 8.2
G9035039 8/10/1980 115973 3588 8.4
G9035040 8/10/1980 115974 2700 8.4
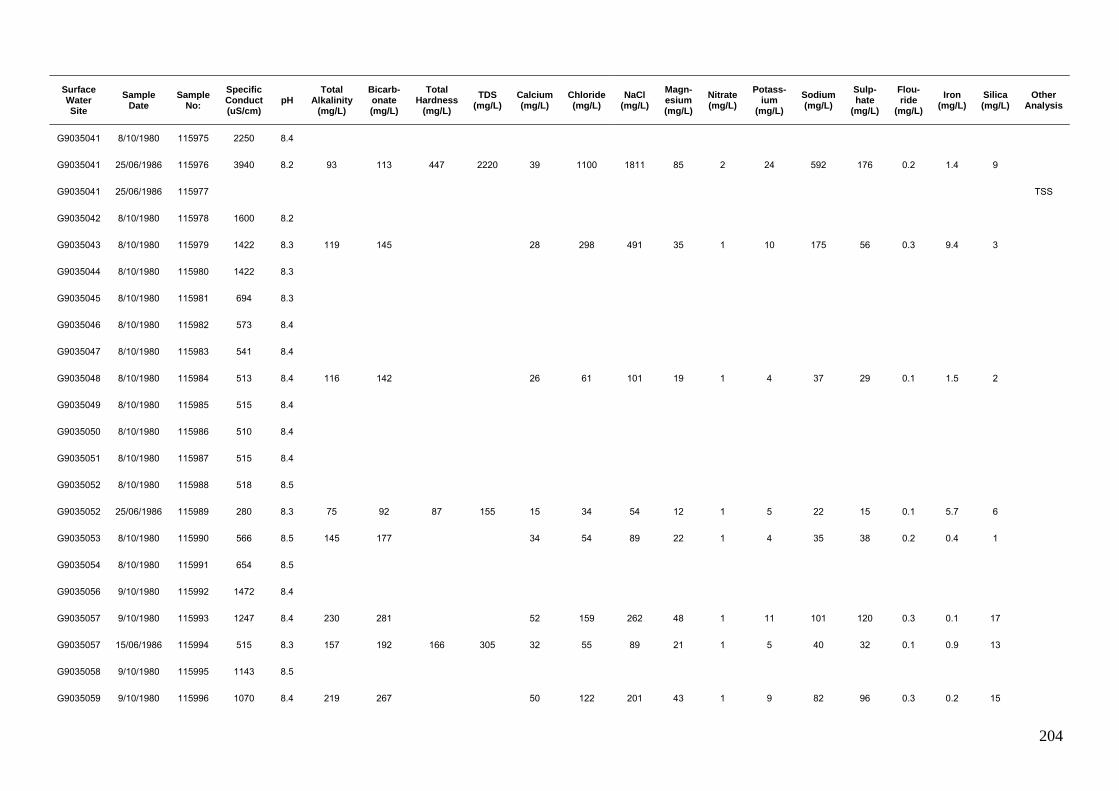
204
Surface Water Site
Sample Date
Sample No:
Specific Conduct (uS/cm)
pH Total
Alkalinity (mg/L)
Bicarb-onate (mg/L)
Total Hardness
(mg/L) TDS
(mg/L) Calcium (mg/L)
Chloride (mg/L)
NaCl (mg/L)
Magn-esium (mg/L)
Nitrate (mg/L)
Potass-ium
(mg/L) Sodium (mg/L)
Sulp-hate
(mg/L)
Flou-ride
(mg/L) Iron
(mg/L) Silica (mg/L)
Other Analysis
G9035041 8/10/1980 115975 2250 8.4
G9035041 25/06/1986 115976 3940 8.2 93 113 447 2220 39 1100 1811 85 2 24 592 176 0.2 1.4 9
G9035041 25/06/1986 115977 TSS
G9035042 8/10/1980 115978 1600 8.2
G9035043 8/10/1980 115979 1422 8.3 119 145 28 298 491 35 1 10 175 56 0.3 9.4 3
G9035044 8/10/1980 115980 1422 8.3
G9035045 8/10/1980 115981 694 8.3
G9035046 8/10/1980 115982 573 8.4
G9035047 8/10/1980 115983 541 8.4
G9035048 8/10/1980 115984 513 8.4 116 142 26 61 101 19 1 4 37 29 0.1 1.5 2
G9035049 8/10/1980 115985 515 8.4
G9035050 8/10/1980 115986 510 8.4
G9035051 8/10/1980 115987 515 8.4
G9035052 8/10/1980 115988 518 8.5
G9035052 25/06/1986 115989 280 8.3 75 92 87 155 15 34 54 12 1 5 22 15 0.1 5.7 6
G9035053 8/10/1980 115990 566 8.5 145 177 34 54 89 22 1 4 35 38 0.2 0.4 1
G9035054 8/10/1980 115991 654 8.5
G9035056 9/10/1980 115992 1472 8.4
G9035057 9/10/1980 115993 1247 8.4 230 281 52 159 262 48 1 11 101 120 0.3 0.1 17
G9035057 15/06/1986 115994 515 8.3 157 192 166 305 32 55 89 21 1 5 40 32 0.1 0.9 13
G9035058 9/10/1980 115995 1143 8.5
G9035059 9/10/1980 115996 1070 8.4 219 267 50 122 201 43 1 9 82 96 0.3 0.2 15

205
Surface Water Site
Sample Date
Sample No:
Specific Conduct (uS/cm)
pH Total
Alkalinity (mg/L)
Bicarb-onate (mg/L)
Total Hardness
(mg/L) TDS
(mg/L) Calcium (mg/L)
Chloride (mg/L)
NaCl (mg/L)
Magn-esium (mg/L)
Nitrate (mg/L)
Potass-ium
(mg/L) Sodium (mg/L)
Sulp-hate
(mg/L)
Flou-ride
(mg/L) Iron
(mg/L) Silica (mg/L)
Other Analysis
G9035060 9/10/1980 115997 1009 8.5
G9035061 9/10/1980 115998 932 8.5
G9035062 9/10/1980 115999 793 8.5 187 228 43 82 135 29 1 6 52 60 0.2 0.6 8
G9035063 9/10/1980 116000 776 8.6
G9035064 10/10/1980 116001 1907 8.5 272 332 74 273 450 60 1 19 186 221 0.4 0.1 15
G9035066 10/10/1980 116002 2050 8.3 278 339 75 284 468 63 2 19 183 215 0.5 0.1 22
G9035067 11/10/1980 116003 1956 8.4 281 342 76 279 460 63 1 19 195 224 0.4 0.1 21
G9035068 11/10/1980 116004 2140 8.4 310 378 81 284 468 68 1 21 196 220 0.5 0.1 26
G9035069 11/10/1980 116005 2131 8.3
G9035070 11/10/1980 116006 2140 8.4 309 377 81 282 465 64 1 22 202 223 0.4 0.2 26
G9035070 11/10/1980 143017 2140 8.4 309 377 81 282 465 64 22 202 223 0.4 0.2 26
G9035071 11/10/1980 116007 2170 8.2 320 390 82 284 468 73 1 21 184 245 0.5 0.1 27
G9035072 11/10/1980 116008 2219 8.4
G9035073 12/10/1980 116009 2180 8.3 321 391 86 283 466 68 1 21 199 240 0.3 0.1 30
G9035073 12/10/1980 116010 2190 8.3 331 403 83 285 470 69 1 21 206 240 0.5 0.1 29
G9035073 12/10/1980 116011 2040 7.7 330 402 75 261 430 78 1 19 180 208 0.5 0.6 28
G9035074 12/10/1980 116012 2161 8.3
G9035075 12/10/1980 116013 2220 8 336 410 83 270 445 70 1 21 205 235 0.5 0.1 30
G9035076 12/10/1980 116014 2250 8.3 352 429 84 297 489 76 1 22 208 230 0.5 0.2 30
G9035077 12/10/1980 116015 2200 8.5 333 406 69 280 460 81 1 23 205 270 0.4 0.1 29
G9035077 27/06/1986 116016 1640 8.3 334 407 490 990 68 230 379 78 1 19 166 216 0.3 0.2 35
G9035078 12/10/1980 116017 2153 8.2

206
Surface Water Site
Sample Date
Sample No:
Specific Conduct (uS/cm)
pH Total
Alkalinity (mg/L)
Bicarb-onate (mg/L)
Total Hardness
(mg/L) TDS
(mg/L) Calcium (mg/L)
Chloride (mg/L)
NaCl (mg/L)
Magn-esium (mg/L)
Nitrate (mg/L)
Potass-ium
(mg/L) Sodium (mg/L)
Sulp-hate
(mg/L)
Flou-ride
(mg/L) Iron
(mg/L) Silica (mg/L)
Other Analysis
G9035095 11/10/1968 116048 200 7.4 88 54 88 130 21 10 16 5 1 3 7 3 0.3 0.2 7
G9035098 18/06/1986 116058 70 7 22 27 34 5 6 10 5 3 9 0.2 20 18
G9035099 18/06/1986 116059 50 6.6 15 18 24 50 3 5 8 4 3 3 4 9 0.1 15 13
G9035099 13/12/1994 140492 1810 8.2 300 360
G9035100 13/06/1986 116060 345 8.1 117 143 122 215 24 30 48 15 1 4 22 18 0.1 1.1 9
G9035101 13/06/1986 116061 235 7.4 81 99 83 150 15 22 35 11 1 3 15 11 0.1 4.7 13
G9035102 13/06/1986 116062 290 7.9 100 122 106 165 21 25 41 13 1 4 18 15 0.1 2 12
G9035103 24/06/1986 116063 35 6.3 7 9 9 30 2 6 10 1 1 2 4 2 0.1 0.3 8
G9035105 17/06/1986 116065 485 8.5 268 314 275 290 38 10 16 44 1 3 6 9 0.1 0.2 16
G9035106 17/06/1986 116066 290 8.2 145 177 141 170 25 10 16 19 1 4 6 3 0.1 0.1 14
G9035107 17/06/1986 116067 315 8 160 195 156 185 28 8 13 21 1 4 6 3 0.1 0.8 12
G9035108 19/06/1986 116068 295 8.3 148 180 147 170 26 10 16 20 1 3 6 5 0.1 0.1 11
G9035109 19/06/1986 116069 270 8.1 133 162 132 160 23 8 13 18 1 3 5 5 0.1 0.2 10
G9035110 15/06/1986 116070 430 8.1 146 178 151 265 29 40 64 19 1 4 29 22 0.1 0.3 15
G9035111 15/06/1986 116071 320 7.9 134 163 133 195 25 18 28 17 1 3 14 10 0.1 0.1 11
G9035111 25/05/1995 151652 218 8.2 108 131
G9035111 27/09/1995 152934 420 8.3 221 265
G9035112 20/06/1986 116072 925 8.5 222 259 280 545 48 120 198 39 1 10 89 82 0.2 0.1 19
G9035115 20/06/1986 116075 485 8.4 262 304 262 295 39 14 21 40 1 4 6 9 0.1 0.2 16
G9035116 25/06/1986 116076 245 8.2 83 101 85 130 16 20 35 11 1 4 15 12 0.1 2.2 3
G9035117 25/06/1986 116077 265 8.2 90 110 94 150 18 22 36 12 1 4 16 13 0.1 1.7 4
G9035118 25/06/1986 116078 770 8.2 83 101 131 410 18 165 275 21 1 8 96 36 0.1 6.5 9

207
Surface Water Site
Sample Date
Sample No:
Specific Conduct (uS/cm)
pH Total
Alkalinity (mg/L)
Bicarb-onate (mg/L)
Total Hardness
(mg/L) TDS
(mg/L) Calcium (mg/L)
Chloride (mg/L)
NaCl (mg/L)
Magn-esium (mg/L)
Nitrate (mg/L)
Potass-ium
(mg/L) Sodium (mg/L)
Sulp-hate
(mg/L)
Flou-ride
(mg/L) Iron
(mg/L) Silica (mg/L)
Other Analysis
G9035119 13/06/1986 116079 310 8.3 107 131 111 185 23 25 41 13 1 4 19 16 0.1 1.6 6
G9035120 13/06/1986 116080 390 8.2 130 159 138 245 27 35 58 17 1 4 27 22 0.1 0.9 10
G9035121 17/06/1986 116081 480 8.5 265 311 275 275 38 10 16 44 1 3 6 8 0.1 0.2 16
G9035122 26/06/1986 116082 1650 8.4 318 375 463 1000 64 250 415 74 1 21 179 212 0.3 0.2 30
G9035125 18/10/1989 116085 1730 8 331 404 447 1060 59 257 424 73 1 21 189 218 0.3 0.1 30
G9035125 18/10/1989 116086 180 6.5 67 82 57 115 8 10 16 9 7 10 10 4 0.3 8
G9035126 2/06/1989 116087 435 8.4 228 278 220 225 24 15 25 39 1 2 9 7 0.2 0.2 2
G9035127 4/11/1977 116088 420 7.5 176 214 170 22 36
G9035127 20/08/1991 116089 15 5.3 2 2 2 20 1 3 5 1 1 1 1 3 0.1 0.1 13
G9035129 24/09/1974 116091 1770 7.9 277 338 478 1080 68 281 463 75 2 192 20 244 0.4 0.5 22
G9035129 14/09/1993 116092 35 5.8 6 7 4 31 1 9 15 1 1 1 4 1 0.1 1.8 19
G9035129 14/09/1993 116093 Faecal
G9035129 14/09/1993 116094 Faecal
G9035131 26/05/1960 116101 6.5 25 22 10 16
G9035131 27/07/1960 116102 6.5 19 14 5 8
G9035131 17/08/1960 116103 6.5 16 12 6 10 0.1
G9035131 7/09/1960 116104 6.5 13 9 15 24
G9035131 14/09/1960 116105 6.5 13 9 10 16
G9035131 28/09/1960 116106 48 7 20 11 10 16
G9035131 20/10/1960 116107 48 6.5 15 8 10 16
G9035131 30/10/1960 116108 70 6.5 30 19 20 32
G9035131 2/11/1960 116109 47 7 17 8 11 17

208
Surface Water Site
Sample Date
Sample No:
Specific Conduct (uS/cm)
pH Total
Alkalinity (mg/L)
Bicarb-onate (mg/L)
Total Hardness
(mg/L) TDS
(mg/L) Calcium (mg/L)
Chloride (mg/L)
NaCl (mg/L)
Magn-esium (mg/L)
Nitrate (mg/L)
Potass-ium
(mg/L) Sodium (mg/L)
Sulp-hate
(mg/L)
Flou-ride
(mg/L) Iron
(mg/L) Silica (mg/L)
Other Analysis
G9035131 9/11/1960 116110 44 6.5 18 6 8 13
G9035131 23/11/1960 116111 47 6.5 7 10 16
G9035131 30/11/1960 116112 54 6.5 17 5 9 15
G9035131 14/12/1960 116113 55 6.5 19 10 10 16
G9035131 19/12/1960 116114 51 6.5 17 9 8 13
G9035131 28/12/1960 116115 48 7 12 7 10 16
G9035131 4/01/1961 116116 38 6.5 14 6 16 26
G9035131 12/01/1961 116117 43 6.5 13 7 10 16
G9035131 18/01/1961 116118 39 6.5 12 6 14 22
G9035131 25/01/1961 116119 40 6.5 9 6 8 13
G9035131 30/01/1961 116120 40 6.5 10 6 10 16
G9035131 1/02/1961 116121 40 6.5 7 7 10 16
G9035131 8/02/1961 116122 40 6.5 10 6 14 22
G9035131 15/02/1961 116123 40 6.5 10 7 8 14
G9035131 22/02/1961 116124 39 6 15 7 12 20
G9035131 1/03/1961 116125 39 6 17 7 20 32
G9035131 9/03/1961 116126 39 6 10 7 20 32
G9035131 15/03/1961 116127 40 6 9 7 15 25
G9035131 22/03/1961 116128 47 6 7 10 30 48
G9035131 29/03/1961 116129 43 6 8 10 12 20
G9035131 13/04/1961 116130 45 6 5 9 20 32
G9035131 19/04/1961 116131 47 6 10 11 22 36

209
Surface Water Site
Sample Date
Sample No:
Specific Conduct (uS/cm)
pH Total
Alkalinity (mg/L)
Bicarb-onate (mg/L)
Total Hardness
(mg/L) TDS
(mg/L) Calcium (mg/L)
Chloride (mg/L)
NaCl (mg/L)
Magn-esium (mg/L)
Nitrate (mg/L)
Potass-ium
(mg/L) Sodium (mg/L)
Sulp-hate
(mg/L)
Flou-ride
(mg/L) Iron
(mg/L) Silica (mg/L)
Other Analysis
G9035131 26/04/1961 116132 56 5.5 5 12 20 34
G9035131 4/05/1961 116133 54 5.5 10 9 18 28
G9035131 10/05/1961 116134 55 5.5 6 13 22 34
G9035131 24/05/1961 116135 58 6 5 6 20 32
G9035131 31/05/1961 116136 58 5.5 8 11 22 34
G9035131 7/06/1961 116137 61 6 10 12 22 34
G9035133 12/12/1994 140487 47.7 6.7 11 13
G9035133 12/12/1994 151655 47.7 6.7 11 13
G9035133 23/08/1995 152938 34 6.3 7.4 9
G9035133 21/11/1995 153113 40 6.8 11 13
G9035134 1/09/1972 145411 220 7.4 83 101 78 120 18 16 26 8 3 12 9 0.2 0.1 1
G9035134 9/04/1976 145412 250 7.2 83 101 82 196 18 18 30 9 3 15 14 0.1 0.1 17
G9035134 22/04/1991 145415 Faecal
G9035134 14/05/1991 145416 Faecal
G9035134 6/06/1991 145417 Faecal
G9035134 4/07/1991 145418 Faecal
G9035134 16/08/1991 145419 Faecal
G9035134 28/09/1991 145420 Faecal
G9035134 3/10/1991 145421 Faecal
G9035134 7/11/1991 145422 Faecal
G9035134 7/01/1992 145423 Faecal
G9035134 18/02/1992 145424 Faecal

210
Surface Water Site
Sample Date
Sample No:
Specific Conduct (uS/cm)
pH Total
Alkalinity (mg/L)
Bicarb-onate (mg/L)
Total Hardness
(mg/L) TDS
(mg/L) Calcium (mg/L)
Chloride (mg/L)
NaCl (mg/L)
Magn-esium (mg/L)
Nitrate (mg/L)
Potass-ium
(mg/L) Sodium (mg/L)
Sulp-hate
(mg/L)
Flou-ride
(mg/L) Iron
(mg/L) Silica (mg/L)
Other Analysis
G9035134 11/03/1992 145425 Faecal
G9035134 5/05/1992 145426 Faecal
G9035134 9/06/1992 145427 Faecal
G9035134 11/08/1992 145428 Faecal
G9035134 24/11/1992 145429 Faecal
G9035134 6/12/1992 145413 7.5 342 417
G9035134 8/12/1992 145430 Faecal
G9035134 9/02/1993 145431 Faecal
G9035134 2/03/1993 145432 Faecal
G9035134 18/03/1993 145414 1460 7.1 337 411 580 803 112 265 437 73 6 65 31 0.2 0.1 25
G9035134 18/05/1993 145433 Faecal
G9035134 15/06/1993 145434 Faecal
G9035134 11/10/1993 145435 Faecal
G9035134 29/03/1994 145436 Faecal
G9035134 8/08/1994 145437 Faecal
G9035134 8/08/1994 1312 Faecal
G9035134 26/09/1994 1311 Faecal
G9035134 10/10/1994 1310 Faecal
G9035134 21/11/1994 1309 Faecal
G9035134 5/12/1994 1308 Faecal
G9035134 3/05/1995 1307 Faecal
G9035134 5/06/1995 1306 Faecal

211
Surface Water Site
Sample Date
Sample No:
Specific Conduct (uS/cm)
pH Total
Alkalinity (mg/L)
Bicarb-onate (mg/L)
Total Hardness
(mg/L) TDS
(mg/L) Calcium (mg/L)
Chloride (mg/L)
NaCl (mg/L)
Magn-esium (mg/L)
Nitrate (mg/L)
Potass-ium
(mg/L) Sodium (mg/L)
Sulp-hate
(mg/L)
Flou-ride
(mg/L) Iron
(mg/L) Silica (mg/L)
Other Analysis
G9035134 17/07/1995 1305 Faecal
G9035134 1/11/1995 1304 Faecal
G9035134 3/01/1996 1303 Faecal
G9035134 31/01/1996 1302 Faecal
G9035134 18/03/1996 1301 Faecal
G9035134 3/04/1996 1300 Faecal
G9035134 8/05/1996 1299 Faecal
G9035134 5/06/1996 1298 Faecal
G9035134 3/07/1996 1297 Faecal
G9035134 21/08/1996 1296 Faecal
G9035134 9/09/1996 1295 Faecal
G9035134 7/10/1996 1294 Faecal
G9035134 6/11/1996 1293 Faecal
G9035134 13/01/1997 1292 Faecal
G9035134 10/02/1997 1291 Faecal
G9035134 10/03/1997 1290 Faecal
G9035134 26/03/1997 1289 Faecal
G9035134 12/05/1997 1288 Faecal
G9035134 18/06/1997 1287 Faecal
G9035134 7/07/1997 1286 Faecal
G9035134 25/08/1997 1285 Faecal
G9035134 6/10/1997 1284 Faecal
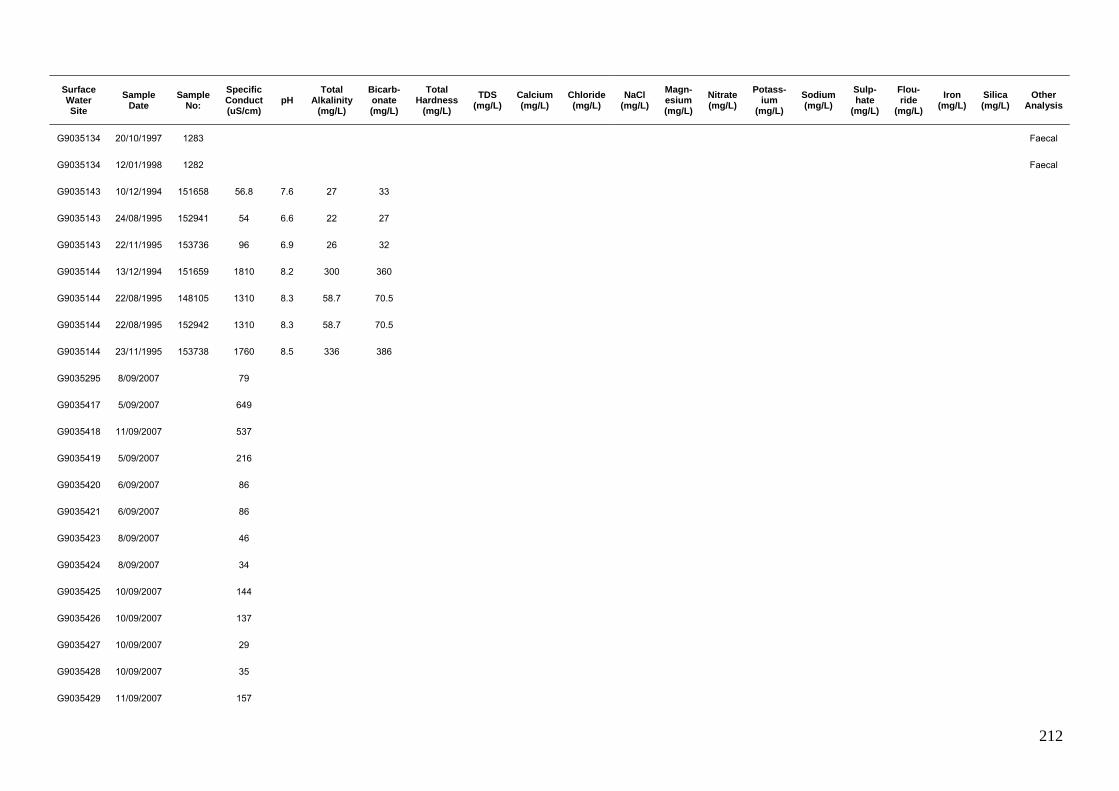
212
Surface Water Site
Sample Date
Sample No:
Specific Conduct (uS/cm)
pH Total
Alkalinity (mg/L)
Bicarb-onate (mg/L)
Total Hardness
(mg/L) TDS
(mg/L) Calcium (mg/L)
Chloride (mg/L)
NaCl (mg/L)
Magn-esium (mg/L)
Nitrate (mg/L)
Potass-ium
(mg/L) Sodium (mg/L)
Sulp-hate
(mg/L)
Flou-ride
(mg/L) Iron
(mg/L) Silica (mg/L)
Other Analysis
G9035134 20/10/1997 1283 Faecal
G9035134 12/01/1998 1282 Faecal
G9035143 10/12/1994 151658 56.8 7.6 27 33
G9035143 24/08/1995 152941 54 6.6 22 27
G9035143 22/11/1995 153736 96 6.9 26 32
G9035144 13/12/1994 151659 1810 8.2 300 360
G9035144 22/08/1995 148105 1310 8.3 58.7 70.5
G9035144 22/08/1995 152942 1310 8.3 58.7 70.5
G9035144 23/11/1995 153738 1760 8.5 336 386
G9035295 8/09/2007 79
G9035417 5/09/2007 649
G9035418 11/09/2007 537
G9035419 5/09/2007 216
G9035420 6/09/2007 86
G9035421 6/09/2007 86
G9035423 8/09/2007 46
G9035424 8/09/2007 34
G9035425 10/09/2007 144
G9035426 10/09/2007 137
G9035427 10/09/2007 29
G9035428 10/09/2007 35
G9035429 11/09/2007 157

213
Surface Water Site
Sample Date
Sample No:
Specific Conduct (uS/cm)
pH Total
Alkalinity (mg/L)
Bicarb-onate (mg/L)
Total Hardness
(mg/L) TDS
(mg/L) Calcium (mg/L)
Chloride (mg/L)
NaCl (mg/L)
Magn-esium (mg/L)
Nitrate (mg/L)
Potass-ium
(mg/L) Sodium (mg/L)
Sulp-hate
(mg/L)
Flou-ride
(mg/L) Iron
(mg/L) Silica (mg/L)
Other Analysis
G9035430 11/09/2007 377
G9035431 11/09/2007 526
G9035432 11/09/2007 48 6.6
G9035433 13/09/2006 70 7.2
G9040001 21.07.2007 903
G9045001 29.07.2007 51
G9045002 29.11.2007 912
G9055022 17/09/1983 116163 75 6.5 17 20 20 80 3 10 15 3 3 4 6 3 0.1 4.5 14
G9055023 24/09/1983 116164 39900 7.6 105 128 4900 14820 24410
G9055025 24/09/1983 116166 29900 7.6 95 116 2580 11020 18164
G9055029 26/09/1983 116170 2790 7.5 75 91 385 1560 44 868 1430 67 1 30 430 102 0.1 0.5 16
G9055029 21/07/2007 353
G9055031 23/09/1983 116171 58400 7.7 117 142 7240 22840 37640
G9055032 24/09/1983 116172 57700 7.9 120 146 7360 22420 36951
G9055033 24/09/1983 116173 56300 7.8 125 153 7300 22560 37179
G9055034 24/09/1983 116174 53300 7.8 121 148 6800 20720 34132
G9055035 24/09/1983 116175 46900 7.7 114 139 6120 17600 29020
G9055046 17/07/1989 116184 30 6.2 11 14 9 20 2 2 3 1 1 2 2 1 0.1 0.3 2

214
APPENDIX M: RAINFALL RECORDER SITES
Station Number Site Easting Northing Commence Cease Recommence Status
DE014609 Ngukurr 470704 8371648 1/08/1971 31/08/1971 closed
DE014633 Roper Bar Store 449894 8371276 1/07/1993 31/12/1993 closed
DR014602 Wongalara 443005 8436417 31/12/1998 28/02/2003 open
DR014604 Roper Bar 424674 8404393 31/05/1957 30/06/1958 closed
DR014605 Moroak Stn 360249 8359861 30/11/1967 31/12/1975 30/04/2001 closed
DR014608 St Vidgeon Stn 487571 8365795 31/10/1967 31/12/1976 closed
DR014609 Ngukurr Roper R 471422 8371311 31/12/1909 31/03/2003 open
DR014614 Hodgson Downs 401674 8317663 31/12/1900 31/05/1991 closed
DR014616 Urapunga 453478 8373126 31/12/1962 31/10/1988 29/02/1996 closed
DR014617 Roper Valley Stn 392581 8348966 31/12/1962 31/03/1988 31/01/1997 closed
DR014620 Roper R Police Stn 446301 8373111 31/12/1893 31/12/1976 closed
DR014630 Port Roper 536003 8369459 31/10/1971 30/09/1972 closed
DR014633 Roper Bar Store 449897 8369432 30/04/1976 28/02/1995 closed
DR014643 Roper Aquafarm 521405 8360597 31/07/1993 31/12/1993 closed
DR014645 Limmen River 553751 8312092 31/05/1995 31/03/2003 open
DR014646 Flying Fox 396191 8357643 31/10/1996 31/03/2003 closed
G9030250 Roper Ri @ Red Rock 437326 8374934 11/08/1966 10/04/2006 open
Sites are all located in zone 53, Datum MGA94.

215
Back Cover: Indigenous wooden food and water carrier – Coolamon or Lujuluju -purchased from Waralungku Arts, Borroloola
Daphne Mawson, a Garrwa woman, related the following story about a
coolamon of water. She lives in Borroloola and works at the Borroloola primary
school teaching indigenous culture in Garrwa.
Daphne Mawson
Story about the frog and the Pee Wee Every night when I was little, my grandmother told me a story about the frog and the Pee Wee. It is a story of
how the rivers came to be and not to be greedy. She said that a long, long time ago in the dreamtime there
was a Pee Wee and a frog. The Pee Wee was the owner of a coolamon of water. He used to carry it
around.
One day the Pee Wee camped under a tree and hid the Coolamon of water. The frog came to the Pee Wee
to ask where he got water from. The Pee Wee said go north and the frog went north. In the evening he
came back tired and weary and said there was no water there. ‘Where did you get the water from’ he
asked? The Pee Wee replied ‘ah I forgot, I got the water from the east’. So the frog went to the east and as
he traveled he was getting very tired but he made it back to the Pee Wee. Once again he asked ‘where did
you get the water from’? The Pee Wee said ‘Oh silly me, that’s right I got it from the south’. Off he slowly
went, he was getting very tired and very thirsty. But the frog still didn’t find the water and went back to the
Pee Wee. He asked the Pee Wee again, his lips were dry and parched, his voice was croaky ‘Where did
you get the water from’? The Pee Wee said ‘I’m getting old, I keep forgetting, that’s right, I got it from the
west’. So off went the frog, he was very tired and dehydrated. By this time the Pee Wee was getting tired
because he hadn’t slept for days as he was guarding his coolamon from the frog. He fell asleep. Poor old
frog slowly dragged himself back after not finding any water. He saw the Pee Wee had fallen asleep and
grabbed a rock and smashed the coolamon. Water gushed everywhere and that’s how the rivers were
created. The Pee Wee woke up with a start and found his water gushing everywhere, he ran and grabbed
the stick and bashed himself over the head crying for his water. Blood streamed all over his body and that’s
why today the black marks you see on the Pee Wee are the blood stains for when he cried for his water.
Today when you hear the first storms you hear the frogs in the lagoons, that’s the frogs teasing the greedy
Pee Wee who wouldn’t share his water.
This was the story my grandmother told to teach us to share everything, especially water which is needed for
everyone’s survival.

216