Embed Size (px)
Citation preview

SEDAR
Southeast Data, Assessment, and Review
_________________________________________________________________
Stock Assessment Report
of SEDAR 9
Gulf of Mexico Gray Triggerfish
SEDAR9 Assessment Report 1
2006
SEDAR One Southpark Circle #306
Charleston, SC 29414 (843) 571-4366


Table of Contents
Section 1. Introduction
Section 2. Data Workshop Report
Section 3. Assessment Workshop Report
Section 4. Review Workshop Reports
Section 5. Addenda and Post-Review Updates


SEDAR 9
Stock Assessment Report 1
Gulf of Mexico Gray Triggerfish
SECTION I. Introduction
SEDAR 1 Southpark Circle # 306
Charleston, SC 29414


1. SEDAR Overview
SEDAR (Southeast Data, Assessment and Review) was initially developed by the Southeast Fisheries Science Center and the South Atlantic Fishery Management Council to improve the quality and reliability of stock assessments and to ensure a robust and independent peer review of stock assessment products. SEDAR was expanded in 2003 to address the assessment needs of all three Fishery Management Council in the Southeast Region (South Atlantic, Gulf of Mexico, and Caribbean) and to provide a platform for reviewing assessments developed through the Atlantic and Gulf States Marine Fisheries Commissions and state agencies within the southeast.
SEDAR strives to improve the quality of assessment advice provided for managing fisheries resources in the Southeast US by increasing and expanding participation in the assessment process, ensuring the assessment process is transparent and open, and providing a robust and independent review of assessment products. SEDAR is overseen by a Steering Committee composed of NOAA Fisheries representatives: Southeast Fisheries Science Center Director and the Southeast Regional Administrator; Regional Council representatives: the Executive Directors and Chairs of the South Atlantic, Gulf of Mexico, and Caribbean Fishery Management Councils; and Interstate Commissions: the Executive Directors of the Atlantic States and Gulf States Marine Fisheries Commissions.
SEDAR is organized around three workshops. First is the Data Workshop, during which fisheries, monitoring, and life history data are reviewed and compiled. Second is the Assessment workshop, during which assessment models are developed and population parameters are estimated using the information provided from the Data Workshop. Third and final is the Review Workshop, during which independent experts review the input data, assessment methods, and assessment products.
SEDAR workshops are organized by SEDAR staff and the lead Council. Data and Assessment Workshops are chaired by the SEDAR coordinator. Participants are drawn from state and federal agencies, non-government organizations, Council members, Council advisors, and the fishing industry with a goal of including a broad range of disciplines and perspectives. All participants are expected to contribute to the process by preparing working papers, contributing, providing assessment analyses, and completing the workshop report.
SEDAR Review Workshop Panels consist of a chair and 3 reviewers appointed by the Center for Independent Experts (CIE), an independent organization that provides independent, expert reviews of stock assessments and related work. The Review Workshop Chair is appointed by the SEFSC director and is usually selected from a NOAA Fisheries regional science center. Participating councils may appoint representatives of their SSC, Advisory, and other panels as observers to the review workshop.
SEDAR 9 was charged with assessing 3 stocks under the jurisdiction of the Gulf of Mexico Fishery Management Council: greater amberjack, gray triggerfish, and vermilion snapper.
SEDAR 9 Stock Assessment Introduction i Gulf of Mexico Gray Triggerfish

2. Management Overview
2.1 Management Unit Definition Gray triggerfish is the only Balistid of 40 species of reef fish in the management unit for
the Gulf of Mexico Reef Fish FMP. Two are not managed, leaving 15 groupers, 14 snappers, five tilefishes, four jacks, in addition to gray triggerfish and one wrasse. The jurisdiction of the Gulf of Mexico Reef Fish FMP includes all waters of the GOM bounded outside by 200 nautical miles (nm) and inside by the state’s territorial waters which are 3 nm in Alabama, Mississippi and Louisiana and 3 leagues or about 9 nm in Florida and Texas.
2.2 History of Management Relating to Gray Triggerfish
2.2.1 Fishery management plan and regulatory amendments The Reef Fish FMP (with its associated EIS) was implemented in November 1984. It
established four management objectives for the reef fish fishery. The FMP established the list of species in the management unit, which included gray triggerfish, and an inshore stressed area within which certain gear was prohibited, including fish traps and roller trawls [49FR 39548].
Amendment 16B including EA, RIR and IRFA, was implemented on November 24, 1999. This amendment set a 12 inch TL minimum size for gray triggerfish.
2.3 Current Management Criteria and Stock Benchmarks There are no management criteria or stock benchmarks for gray triggerfish.
The only management regulations for gray triggerfish is a 12 inch TL minimum size and a recreational bag limit of up to 20 fish within the recreational reef fish aggregate bag limit.
SEDAR 9 Stock Assessment Introduction ii Gulf of Mexico Gray Triggerfish

Southeast Data, Assessment, and Review
SEDAR 9
Gulf of Mexico Gray Triggerfish
Balistes capriscus
SECTION II. Data Workshop Report
Developed by the Data Workshop Panel
Edited by Joshua Sladek Nowlis, Southeast Fisheries Science Center, Miami, FL
August 2005
SEDAR
1 Southpark Circle #306
Charleston, SC 29414


Table of Contents
1 Introduction............................................................................................................................. 1 1.1 Workshop Time and Place .............................................................................................. 1 1.2 Terms of Reference......................................................................................................... 1 1.3 List of Participants .......................................................................................................... 2 1.4 List of Data Workshop Working Papers......................................................................... 3
2 Life History............................................................................................................................. 5 2.1 Age and Growth.............................................................................................................. 5
2.1.1 Annulus Formation ................................................................................................. 5 2.1.2 Age and Growth Studies ......................................................................................... 6
2.2 Reproduction................................................................................................................... 7 2.3 Mortality ......................................................................................................................... 8
2.3.1 Previous Studies...................................................................................................... 8 2.3.2 Total Mortality ........................................................................................................ 9 2.3.3 Natural Mortality .................................................................................................... 9 2.3.4 Fishing Mortality .................................................................................................... 9 2.3.5 Release Mortality .................................................................................................... 9
2.4 Conversion Factors ....................................................................................................... 10 2.5 Stock Recruitment Relationships.................................................................................. 10 2.6 Habitat........................................................................................................................... 10 2.7 Stock Definition ............................................................................................................ 10
3 Commercial Fishery Description, Data Sources, and Statistics............................................ 12 3.1 Commercial Landings Collection and Statistics ........................................................... 12
3.1.1 Commercial Landings Data Collection................................................................. 12 3.1.2 History and overview of landings data collection................................................ 12
3.1.2.1 Florida ............................................................................................................... 12 3.1.2.2 Alabama ............................................................................................................ 13 3.1.2.3 Mississippi ........................................................................................................ 13 3.1.2.4 Louisiana........................................................................................................... 13 3.1.2.5 Texas ................................................................................................................. 13 3.1.2.6 Inter-State Transport ......................................................................................... 13
3.1.3 Commercial Landings Data Base Organization and Data Handling .................... 14 3.1.3.1 Accummulated Landings System (ALS) .......................................................... 14 3.1.3.2 Florida Annual Canvas Landings...................................................................... 14 3.1.3.3 Assignment of gear and area of capture 1990-present...................................... 15
3.1.4 Commercial Landings........................................................................................... 15 3.1.4.1 Commercial landings by State .......................................................................... 15 3.1.4.2 Commercial Landings Species Composition.................................................... 15 3.1.4.3 Commercial Landings for Assessment by State ............................................... 16 3.1.4.4 Commercial Landings for Assessment by Gear and Area ................................ 16
3.2 Bycatch ......................................................................................................................... 16 3.2.1 Commercial Finfish Fishery Discards .................................................................. 16 3.2.2 Shrimp Fishery Bycatch........................................................................................ 16
3.3 Size composition........................................................................................................... 17 4 Recreational .......................................................................................................................... 18
5 Fishery-Dependent Survey Data ........................................................................................... 19 5.1 Commercial Fishery Catch Rates.................................................................................. 19
5.1.1 Commercial Handline ........................................................................................... 19 5.2 Recreational Fishery Catch Rates ................................................................................. 19
5.2.1 Marine Recreational Fisheries Statistics Survey Catch Rates .............................. 19 5.2.2 Headboat Survey Catch Rates............................................................................... 20
5.3 Recommendations......................................................................................................... 20 5.3.1 Indices to be considered for use in the assessment ............................................... 20 5.3.2 Data and/or analysis revisions .............................................................................. 20
6 Fishery-Independent Survey Data......................................................................................... 22 6.1 SEAMAP Ichthyoplankton Surveys ............................................................................. 22 6.2 SEAMAP Reef Fish Survey ......................................................................................... 23 6.3 SEAMAP Trawl Surveys.............................................................................................. 23 6.4 Summary of Outstanding Items .................................................................................... 24
7 Literature Cited ..................................................................................................................... 25 8 Tables.................................................................................................................................... 27
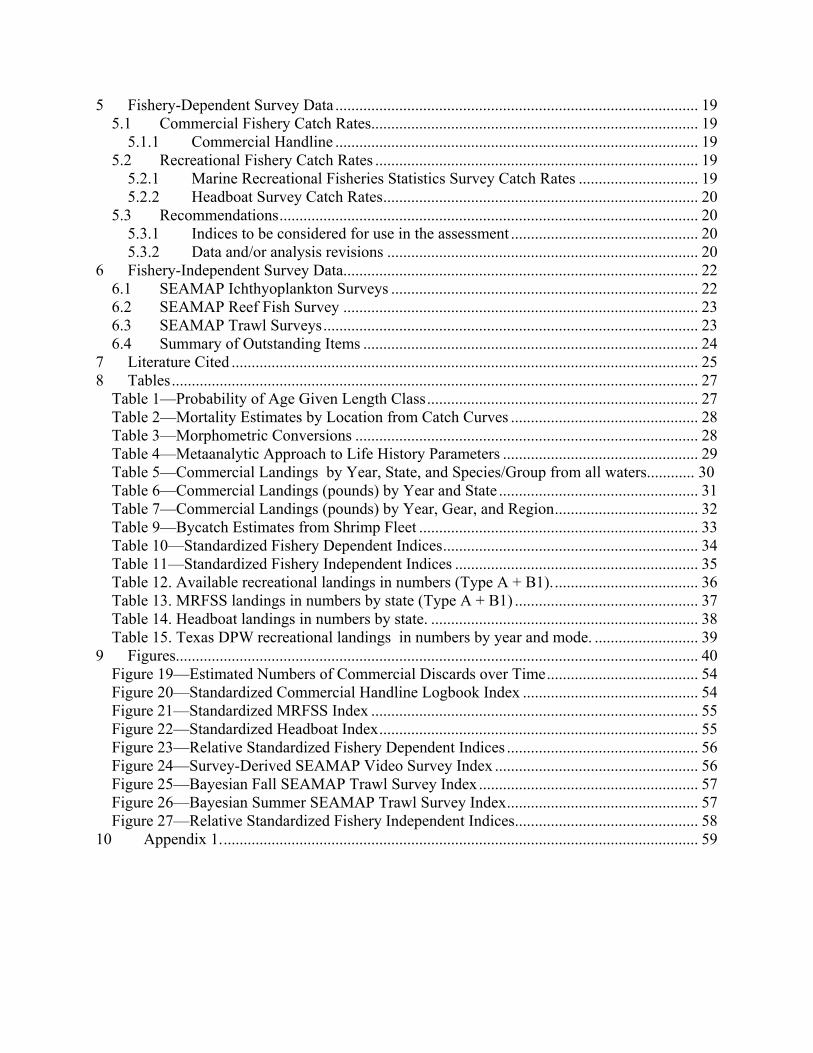
Table 1—Probability of Age Given Length Class.................................................................... 27 Table 2—Mortality Estimates by Location from Catch Curves ............................................... 28 Table 3—Morphometric Conversions ...................................................................................... 28 Table 4—Metaanalytic Approach to Life History Parameters ................................................. 29 Table 5—Commercial Landings by Year, State, and Species/Group from all waters............ 30 Table 6—Commercial Landings (pounds) by Year and State .................................................. 31 Table 7—Commercial Landings (pounds) by Year, Gear, and Region.................................... 32 Table 9—Bycatch Estimates from Shrimp Fleet ...................................................................... 33 Table 10—Standardized Fishery Dependent Indices................................................................ 34 Table 11—Standardized Fishery Independent Indices ............................................................. 35 Table 12. Available recreational landings in numbers (Type A + B1)..................................... 36 Table 13. MRFSS landings in numbers by state (Type A + B1) .............................................. 37 Table 14. Headboat landings in numbers by state. ................................................................... 38 Table 15. Texas DPW recreational landings in numbers by year and mode. .......................... 39
9 Figures................................................................................................................................... 40 Figure 19—Estimated Numbers of Commercial Discards over Time...................................... 54 Figure 20—Standardized Commercial Handline Logbook Index ............................................ 54 Figure 21—Standardized MRFSS Index .................................................................................. 55 Figure 22—Standardized Headboat Index................................................................................ 55 Figure 23—Relative Standardized Fishery Dependent Indices ................................................ 56 Figure 24—Survey-Derived SEAMAP Video Survey Index ................................................... 56 Figure 25—Bayesian Fall SEAMAP Trawl Survey Index....................................................... 57 Figure 26—Bayesian Summer SEAMAP Trawl Survey Index................................................ 57 Figure 27—Relative Standardized Fishery Independent Indices.............................................. 58
10 Appendix 1........................................................................................................................ 59

SEDAR9-Data Workshop Report Gray Triggerfish
1 Introduction
1.1 Workshop Time and Place
The SEDAR 9 Data Workshop convened 20-24 June 2005, at the Hotel Moteleone, New Orleans, Louisiana.
1.2 Terms of Reference
1. Characterize stock structure and develop a unit stock definition.
2. Tabulate available life history information (e.g., age, growth, natural mortality, reproductive characteristics). Provide models to describe growth, maturation, and fecundity by age, sex, or length as appropriate; recommend life history parameters (or ranges of parameters) for use in population modeling; evaluate the adequacy of life-history information for conducting stock assessments.
3. Provide indices of population abundance. Consider fishery dependent and independent data sources; develop index values for appropriate strata (e.g., age, size, area, and fishery); provide measures of precision; conduct analyses evaluating the degree to which available indices adequately represent fishery and population conditions. Document all programs used to develop indices, addressing program objectives, methods, coverage, sampling intensity, and other relevant characteristics.
4. Characterize commercial and recreational catches, including both landings and discard removals, in weight and numbers. Evaluate the adequacy of available data for accurately characterizing harvest and discard by species and fishery sector. Provide length and age distributions if feasible.
5. Evaluate the adequacy of available data for estimating the impacts of current management actions.
6. Recommend assessment methods and models that are appropriate given the quality and scope of the data sets reviewed and management requirements.
7. Provide recommendations for future research in areas such as sampling, fishery monitoring, and stock assessment. Include specific guidance on sampling intensity and coverage where possible.
8. Prepare complete documentation of workshop actions and decisions (Section II. of the SEDAR assessment report).
-1-

SEDAR9-Data Workshop Report Gray Triggerfish
1.3 List of Participants
Workshop Panel Members: Robert Allman................................................NMFS/SEFSC Panama City, FL Luiz Barbieri ..................................................FWC St. Petersburg, FL Craig Brown...................................................NMFS/SEFSC Miami, FL Shannon Calay ...............................................NMFS/SEFSC Miami, FL Alan Collins ...................................................NMFS/SEFSC Panama City, FL Marianne Cufone ...........................................Environment Matters Guy Davenport...............................................NMFS/SEFSC Miami, FL Guillermo Diaz...............................................NMFS/SEFSC Miami, FL Bob Dixon......................................................NMFS/SEFSC Beaufort, NC Dave Donaldson.............................................GSFMC Chris Dorsett ..................................................The Ocean Conservancy Chris Gledhill.................................................NMFS/SEFSC Pensacola FL Terry Henwood ..............................................NMFS/SEFSC, Pascagoula MS David Hamisko ..............................................NOAA Fisheries Pensacola, FL Walter Ingram ................................................NMFS/SEFSC Pascagoula MS Joanne Lyczkowski-Shultz ............................NMFS.SEFSC Pascagoula, MS Kevin McCarthy.............................................NMFS/SEFSC Miami FL Debra Murie ...................................................University of Florida Josh Sladek Nowlis ........................................NMFS/SEFSC Miami, FL Scott Nichols..................................................NMFS/SEFSC Pascagoula MS Dennis O’Hearn .............................................GMFMC Advisory Panel Butch Pellegrin...............................................NMFS/SEFSC Pascagoula MS Larry Perruso .................................................NMFS/SEFSC Pascagoula MS Jennifer Potts..................................................NMFS/SEFSC Beaufort, NC Jay Rooker .....................................................Texas A&M University Steven Saul.....................................................RSMAS/University of Miami Jerry Scott ......................................................NMFS/SEFSC Miami, FL Bob Shipp.......................................................University of South Alabama Tom Turke .....................................................GMFMC Advisory Panel Steve Turner...................................................NMFS/SEFSC Miami, FL Russell Underwood........................................GMFMC Advisory Panel Glenn Zapfe ...................................................NOAA Fisheries Pascagoula, MS
Observers Bobbi Walker .................................................GMFMC Donald Waters ...............................................Fisherman Bob Zales II....................................................Panama City Boatmens Assoc.
Staff John Carmichael.............................................SEDAR Stu Kennedy...................................................GMFMC Dawn Aring....................................................GMFMC Patrick Gilles..................................................NMFS/SEFSC Miami
-2-

SEDAR9-Data Workshop Report Gray Triggerfish
1.4 List of Data Workshop Working Papers
Document # Title Authors
Documents Prepared for the SEDR 9 Data Workshop
SEDAR9-DW1 History of vermillion snapper, greater amberjack, and gray triggerfish management in Federal waters of the US Gulf of Mexico, 1984-2005
Hood, P
SEDAR9-DW11
Length Frequency Analysis and Calculated Catch at Age Estimations for Commercially Landed Gray Triggerfish (Balistes capriscus) From the Gulf of Mexico
Steven Saul
SEDAR9-DW12 Estimated Gray Triggerfish (Balistes capriscus) Landings From the Gulf of Mexico Headboat Fishery Steven Saul
SEDAR9-DW13 Estimated Gray Triggerfish (Balistes capriscus) Commercial Landings and Price Information for the Gulf of Mexico Fishery
Steven Saul
SEDAR9-DW14 Estimated Gray Triggerfish (Balistes capriscus) Recreational Landings for the State of Texas Steven Saul
SEDAR9-DW15 Estimated Gray Triggerfish (Balistes capriscus) Landings From the Marine Recreational Fishery Statistics Survey (MRFSS) In the Gulf of Mexico
Steven Saul and Patty Phares
SEDAR9-DW16 Length Frequency Analysis for the Gray Triggerfish (Balistes capriscus) Recreational Fishery In the Gulf of Mexico
Steven Saul
SEDAR9-DW17 Estimates of Vermilion Snapper, Greater Amberjack, and Gray Triggerfish Discards by Vessels with Federal Permits in the Gulf of Mexico
Kevin J. McCarthy
SEDAR9-DW18 Size Composition Data from the SEAMAP Trawl Surveys Scott Nichols
SEDAR9-DW21 SEAMAP Reef Fish Survey of Offshore Banks: Yearly indices of Abundance for Vermilion Snapper, Greater Amberjack, and Gray Triggerfish
Gledhill, et. al.
SEDAR9-DW22
Data Summary of Gray Triggerfish (Balistes capriscus), Vermilion Snapper (Rhomboplites aurorubens), and Greater Amberjack (Seriola dumerili) Collected During Small Pelagic Trawl Surveys, 1988 – 1996
G. Walter Ingram, Jr.
SEDAR9-DW23 Abundance Indices of Gray Triggerfish and Vermilion Snapper Collected in Summer and Fall SEAMAP Groundfish Surveys (1987 – 2004)
G. Walter Ingram, Jr.
SEDAR9-DW25
Review of the early life history of gray triggerfish, Balistes capriscus, with a summary of data from SEAMAP plankton surveys in the Gulf of Mexico: 1982, 1984 – 2002
Lyczkowski-Shultz, J., Hanisko, D. and Zapfe, G.
-3-

SEDAR9-Data Workshop Report Gray Triggerfish
SEDAR9-DW26 Shrimp Fleet Bycatch Estimates for the SEDAR9 Species Scott Nichols
SEDAR9-DW27 SEAMAP Trawl Indices for the SEDAR9 Species Scott Nichols
SEDAR9-DW-28
Standardized Abundance Indices for Gulf of Mexico Gray Triggerfish (Balistes capriscus) based on catch rates as measured by the Marine Recreational Fisheries Statistics Survey (MRFSS)
Josh Sladek Nowlis
SEDAR9-DW-29
Standardized Abundance Indices for Gulf of Mexico Gray Triggerfish (Balistes capriscus) based on catch rates as measured by the NMFS Southeast Zone Headboat Survey
Josh Sladek Nowlis
SEDAR9-DW-30
Standardized Abundance Indices for Gulf of Mexico Gray Triggerfish (Balistes capriscus) based on catch rates as measured from commercial logbook entries with handline gear
Josh Sladek Nowlis
-4-

SEDAR9-Data Workshop Report Gray Triggerfish
2 Life History
2.1 Age and Growth
2.1.1 Annulus Formation
Patterns in recreationally-caught, Alabama gray trigger growth, catch-per-unit-effort (CPUE), reproduction, and increment formation in first dorsal spines, as well as the relatedness of these patterns, is summarized by Ingram (2001) in order to validate the use of the first dorsal spine as an age estimator (Fig. 1). Both the relative marginal increment analysis, and the monthly condition of the margin of the first dorsal spines indicate that a translucent annual ring forms in December-February, and that a spawning check forms in some fish during July-August. Both of these time periods represent periods of slow somatic growth and low CPUE. The spring increase in CPUE corresponds with spring growth as indicated in the first dorsal spine by the formation an opaque band. Ingram (2001) reasoned that changes in CPUE directly correspond to changes in feeding activity and not to changes in abundance, and provide a rough index of feeding activity. Ingram (2001) reports gray trigger to have high site fidelity based on tagging. Therefore, seasonal changes in abundance due to emigration/immigration should not be the cause of changes in CPUE. During the summer months, as both male and female gonosomatic indices (GSI’s) of spawning activity peaked, CPUE dropped to its lowest point during the year. After the peak in spawning activity and the observed CPUE minimum, CPUE began to increase, and a spawning check forms as indicated as another translucent band in some spines. The formation of these spawning checks is probably attributable to reproductive behavior. During the spawning season, the territorial male gray trigger prepare a number of nests (see Ingram, 2001 for review). Males then coax females to the nests, not allowing them to leave. Ingram (2001) suggested that this haremic spawning behavior, which has been described for many other species of triggerfishes (e.g., Fricke, 1980; Nellis, 1980; Thresher, 1984; Gladstone, 1994; Ishihara and Kuwamura, 1996; and Kuwamura, 1997), may affect growth of both males and females, possibly leading to the formation of false annuli in the spine. Finally, the annulus is completed when the wide opaque band indicative of fall growth forms in the spine, which is correlated with sustained high levels of CPUE. The formation of the next winter annual mark corresponds with the decrease in CPUE during the winter. With the pattern of annulus formation established, enumeration of annuli and age estimation was straightforward. There also appears to be a settlement mark that forms near the focus in the first dorsal spine of most Alabama gray trigger sampled (~ 89 %). The settlement mark is a translucent ring encircling the focus. Due to the mark’s close proximity to the focus, even in small fish (80 – 100 mm fork length) less than 1 year old, it is assumed to be associated with the period of transition between pelagic and demersal habitats. The settlement mark was the only mark in the first dorsal spine resorbed by increased vacularization in larger and older fish, and thus did not affect estimates of age (Ingram, 2001).
-5-
SEDAR9-Data Workshop Report Gray Triggerfish
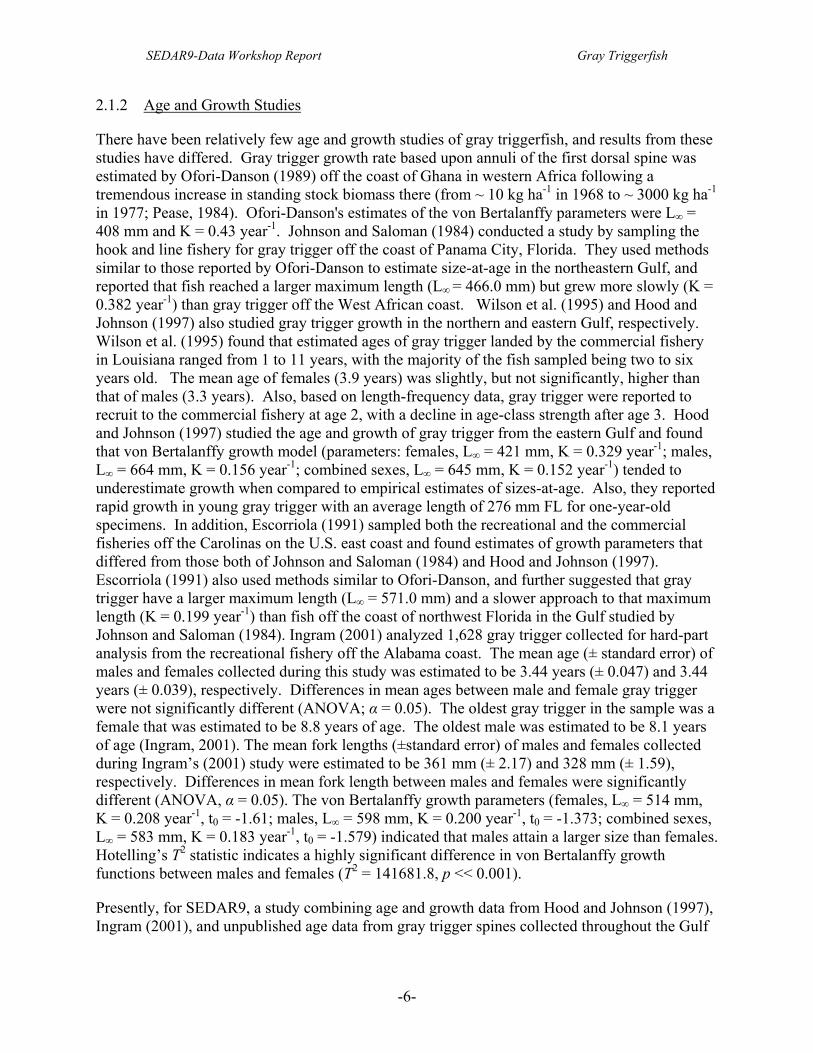
2.1.2 Age and Growth Studies
There have been relatively few age and growth studies of gray triggerfish, and results from these studies have differed. Gray trigger growth rate based upon annuli of the first dorsal spine was estimated by Ofori-Danson (1989) off the coast of Ghana in western Africa following a tremendous increase in standing stock biomass there (from ~ 10 kg ha-1 in 1968 to ~ 3000 kg ha-1 in 1977; Pease, 1984). Ofori-Danson's estimates of the von Bertalanffy parameters were L∞ = 408 mm and K = 0.43 year-1. Johnson and Saloman (1984) conducted a study by sampling the hook and line fishery for gray trigger off the coast of Panama City, Florida. They used methods similar to those reported by Ofori-Danson to estimate size-at-age in the northeastern Gulf, and reported that fish reached a larger maximum length (L∞ = 466.0 mm) but grew more slowly (K = 0.382 year-1) than gray trigger off the West African coast. Wilson et al. (1995) and Hood and Johnson (1997) also studied gray trigger growth in the northern and eastern Gulf, respectively. Wilson et al. (1995) found that estimated ages of gray trigger landed by the commercial fishery in Louisiana ranged from 1 to 11 years, with the majority of the fish sampled being two to six years old. The mean age of females (3.9 years) was slightly, but not significantly, higher than that of males (3.3 years). Also, based on length-frequency data, gray trigger were reported to recruit to the commercial fishery at age 2, with a decline in age-class strength after age 3. Hood and Johnson (1997) studied the age and growth of gray trigger from the eastern Gulf and found that von Bertalanffy growth model (parameters: females, L∞ = 421 mm, K = 0.329 year-1; males, L∞ = 664 mm, K = 0.156 year-1; combined sexes, L∞ = 645 mm, K = 0.152 year-1) tended to underestimate growth when compared to empirical estimates of sizes-at-age. Also, they reported rapid growth in young gray trigger with an average length of 276 mm FL for one-year-old specimens. In addition, Escorriola (1991) sampled both the recreational and the commercial fisheries off the Carolinas on the U.S. east coast and found estimates of growth parameters that differed from those both of Johnson and Saloman (1984) and Hood and Johnson (1997). Escorriola (1991) also used methods similar to Ofori-Danson, and further suggested that gray trigger have a larger maximum length (L∞ = 571.0 mm) and a slower approach to that maximum length (K = 0.199 year-1) than fish off the coast of northwest Florida in the Gulf studied by Johnson and Saloman (1984). Ingram (2001) analyzed 1,628 gray trigger collected for hard-part analysis from the recreational fishery off the Alabama coast. The mean age (± standard error) of males and females collected during this study was estimated to be 3.44 years (± 0.047) and 3.44 years (± 0.039), respectively. Differences in mean ages between male and female gray trigger were not significantly different (ANOVA; α = 0.05). The oldest gray trigger in the sample was a female that was estimated to be 8.8 years of age. The oldest male was estimated to be 8.1 years of age (Ingram, 2001). The mean fork lengths (±standard error) of males and females collected during Ingram’s (2001) study were estimated to be 361 mm (± 2.17) and 328 mm (± 1.59), respectively. Differences in mean fork length between males and females were significantly different (ANOVA, α = 0.05). The von Bertalanffy growth parameters (females, L∞ = 514 mm, K = 0.208 year-1, t0 = -1.61; males, L∞ = 598 mm, K = 0.200 year-1, t0 = -1.373; combined sexes, L∞ = 583 mm, K = 0.183 year-1, t0 = -1.579) indicated that males attain a larger size than females. Hotelling’s T2 statistic indicates a highly significant difference in von Bertalanffy growth functions between males and females (T2 = 141681.8, p << 0.001).
Presently, for SEDAR9, a study combining age and growth data from Hood and Johnson (1997), Ingram (2001), and unpublished age data from gray trigger spines collected throughout the Gulf
-6-

SEDAR9-Data Workshop Report Gray Triggerfish
from 1992-2002 by the NMFS Panama City Lab is currently being conducted. Presently, this study consists of the following data sets:
Alabama Recreational, 1996-2000, N=1545 Florida Panhandle Recreational, 1992-1998, N=221 Florida West Coast Commercial, 1995, 1996, 1998, 2000, 2001 and 2002, N=499 Florida West Coast Recreational, 1992, 1993, 1995, 1996, 1997, 2000, 2001 and 2002,
N=198 Louisiana Recreational, 1992, 1993, 1994, 1995, 1996, 2000 and 2001 N=184 Texas Recreational, 1992-1994, N=44 Summer SEAMAP Groundfish Survey, 1999, N = 71.
Regular or sloped von Bertalanffy growth models were derived for each region/fishery sector category using the trawl captured gray trigger (age-0 and age-1 gray trigger) as an ‘anchor’ due to the lack age-0 and age-1 gray trigger in the other data sets (Figure 2). Model fit was assessed using residual analyses and corrected R2. Due to the very high variability in size at age, all data were combined and probabilities of age by 25-mm FL classes were derived (Table 1). Also, age-frequency histograms by year and each region/sector category (Figs. 3-7). Any years with extremely low sample sizes were not shown.
2.2 Reproduction
A study of the reproductive ecology of gray trigger was performed on specimens from Ghana in West Africa (Ofori-Danson, 1990). Ofori-Danson defined the breeding season as October to December by assigning each gonad they collected to one of five gonad maturity categories. Peak spawning occurred in the warmer months, which in Ghana are November and December. First time spawners were 133 - 157 mm in FL, 50.0 - 70.5 g, and one year old. Fecundity (F) was correlated with fork length (FL) and was described by the linear regression log F = 1.176 + 1.642 log FL. In the Gulf of Mexico, there have been a number of studies concerning the reproductive biology of gray trigger. Dooley (1972) estimated the spawning season to be from July to October in the Gulf based upon the presence of small, recently spawned gray trigger in samples. Wilson et al. (1995) reported that ovarian histology indicated that gray trigger captured off Louisiana are iteroparous and spawn during late spring and summer (April through August), with a peak in the gonosomatic index (GSI) in June for both male and female fish. Hood and Johnson (1997) similarly reported iteroparity in gray trigger and suggested that ovarian histology indicated that fish captured off west Florida spawn during summer and early fall (June through September) with a peak in the GSI in August for female fish, and in September for male fish. Mature females with ovaries containing vitellogenic oocytes were first observed in June, and were present through September. Spent females were observed from September through October. From October to March most fish had developing gonads that contained primary growth oocytes and some atretic bodies. Finally, maturing gonads first appeared in April and were present through August in fish from the eastern Gulf (Hood and Johnson, 1997). Hood and Johnson (1997) also report that 87.5% of the female fish were sexually mature by age 1, and no immature males were observed. The smallest mature male observed was 110 mm FL (age 0). Batch fecundities in fish from the eastern Gulf ranged from 213,912 to 1,172,854 oocytes from fish ranging from 267 to 388 mm FL, and relative batch fecundity had a mean of 13,809 oocytes per gram ovary and ranged from 6,318 to 24,188 oocytes per gram (Hood and Johnson, 1997). Ingram (2001) reported that both histological condition of maturity and GSI indicate that
-7-

SEDAR9-Data Workshop Report Gray Triggerfish
spawning activity for both male and female gray trigger from Alabama increases in May, peaks during June and July, and then decreases during August (Figs. 8-10). Sex-specific plots of GSI versus age and fork length provide insight into size and age at maturity for gray trigger (Figs. 11-14). These plots indicate that 1-year-old males (>250 mm fork length) and 2-year-old females (>250 mm fork length) exhibit seasonal maturation cycles associated with spawning. No hydrated oocytes were found in histological sections of females. Therefore, Ingram (2001) enumerated oocytes undergoing final oocyte maturation (FOM) to estimate batch fecundity. Mean diameter (± standard error) of oocytes undergoing FOM was estimated to be 418 µm (± 1). Of the 613 females from which gonads were taken, 59 were observed to be at FOM stage. Of these, 34 were used to estimate batch fecundity. Batch fecundity estimates ranged from 96,379 to 2,649,027 oocytes undergoing FOM per ovary. The mean (± standard error) number of oocytes undergoing FOM per gram was estimated to be 8,015 (± 247). The batch fecundity-fork length relationship (Fig. 15), batch fecundity-age relationship (Fig. 16), and batch fecundity-weight relationship (Fig. 17) all indicated an increase in fecundity with size and age. The mean percent (± standard error) of females spawning per day during the spawning season was 27.3 % (± 4.6). The mean interval between (± standard error) spawnings was estimated to be 3.7 days (± 0.6). Females with ovaries containing oocytes undergoing FOM were observed from late May to late August (~ 90 days). Therefore, the mean number of spawnings (± standard error) per spawning season was estimated to be 24.3 (± 4.1). Mean total annual fecundity (± standard error) was estimated to be 17,071,634 eggs year-1 (± 2,010,787).
2.3 Mortality
2.3.1 Previous Studies
Jones (1991) reviewed patterns of mortality in reef fishes and reported that data on mortality are difficult to obtain, and may differ widely among locations. Jones (1986) provided estimates of mortality for juvenile damselfishes Pomacentrus wardi and P. amboinensis, and mortality rates were greater on shallow reefs than deeper reefs in the same reef area. On a larger scale, mortality rates of red snapper, Lutjanus campechanus, tagged above artificial reefs off the Alabama coast differed greatly (i.e. instantaneous fishing mortality ranged from 0.047 to 0.620 year-1) (Watterson, 1998). Watterson (1998) also estimated instantaneous fishing mortality of red snapper inhabiting publicly known reefs off the coast of Alabama and Florida to be much higher (i.e. 1.12 year-1) than the more private artificial reefs off the Alabama coast. Hood and Johnson (1997) estimated instantaneous total mortality of recreationally and commercially caught gray trigger off the west Florida coast to be 0.836 and 0.825 year-1, respectively. Instantaneous total mortality for gray trigger off the coast of Panama City Beach, Florida was estimated to be 0.67 year-1 (Johnson and Saloman, 1984). Ingram (2001) estimated instantaneous total annual mortality rate (Z ± standard error) and subsequently annual survival (S ± standard error) to be 0.82 year-1 (± 0.08) and 0.44 year-1 (± 0.04), respectively, for gray trigger off Alabama. One and two-year-old gray trigger were found to be 7.3 % and 41.4 % recruited, respectively, to the recreational fishery after back calculation. M was estimated to be 0.50 for Alabama gray trigger using Hoenig’s method (1983), and F was estimated to be 0.32 (Ingram, 2001).
-8-

SEDAR9-Data Workshop Report Gray Triggerfish
2.3.2 Total Mortality
From the current study for SEDAR9 of combined data sets, Z was derived from the descending limbs of the age-frequency histograms (Fig. 18). Table 2 summarizes the estimates of Z from each region/sector category.
2.3.3 Natural Mortality
Gray triggerfish live to at least 16 years, based on age samples available from the current SEDAR9 study. Based upon this information, the method of Hoenig (1983) results in a value for M of 0.27. As this results from a sample taken from an exploited population, the value could be considered somewhat high. Application of this method to the maximum age observed in the age samples from Ingram (2001) results in a maximum value of 0.5, from a sample with a maximum observed age of 8. However, due to the high fishing pressure indicated off Alabama, the estimated M of 0.5 is based on data from an age-truncated stock. Therefore, an M of 0.5 is probably too high to consider even for a sensitivity analyses. Based upon these observations, it is suggested to use a value of M of 0.27 for baseline evaluations, with the range of M from 0.2 to 0.4 for sensitivity evaluations.
2.3.4 Fishing Mortality
Using the aforementioned estimate of M (i.e., 0.27), estimates of F were derived by subtracting M from the Z of each region/fishery sector category (Table 2). This indicates that the Alabama Recreational sector has a higher F, with the Florida West Coast Recreational sector having the lowest.
2.3.5 Release Mortality
For an estimate of acute release mortality, Ingram (2001) visually assessed the condition of the triggerfish upon release after tagging based upon the following scale (Patterson, 1999; Ingram and Patterson, 1999; Patterson and Ingram, 2000): (1) Gray trigger immediately oriented itself toward the bottom and swam down vigorously; (2) Gray trigger appeared disoriented upon entering the water, oriented toward the bottom but swam erratically; (3) Gray trigger appeared very disoriented upon entering the water and remained at the surface; and (4) Gray trigger was either dead or unresponsive upon entering the water. Gray trigger released in a condition other than condition-1 were assigned as having suffered release mortality. Acute mortality of gray trigger due to tagging was estimated to be 1.5 %, but this percentage was statistically significant from zero (Z-test, p < 0.05). Out of 1,271 releases (i.e. this included initial releases and subsequent releases after recaptures), four gray trigger were released in condition-2, 14 were released in condition-3 and one was released in condition-4. Out of the 19 gray trigger released in a condition other than condition-1, two (11 %) were recaptured and released again in condition-1, indicating that some proportion of the gray trigger that were assumed to have died as a result of the tagging process actually survived. Also, the probability of occurrence of acute mortality increased slightly with gray trigger size, and the depth of capture did not significantly affect release condition.
-9-
SEDAR9-Data Workshop Report Gray Triggerfish
2.4 Conversion Factors
Conversion factors for gray trigger are provided in Table 3.
2.5 Stock Recruitment Relationships
The classification scheme developed at the FAO SECOND TECHNICAL CONSULTATION ON THE SUITABILITY OF THE CITES CRITERIA FOR LISTING COMMERCIALLY-EXPLOITED AQUATIC SPECIES (Windhoek, Namibia, 22-25 October 2001; FAO 2001) was used to characterize the relative productivity of gray trigger. This information is provided in Table 4. A productivity rank was assigned to each life-history characteristic (a value of 1 was assigned for low, 2 for medium, and 3 for high productivity characteristics) and the ranks were averaged to produce an overall productivity score. This score was then used to prescribe a prior probability density function on steepness in the stock-recruitment relationship from the periodic life history strategists as summarized by Rose et.al. (2001). The dominant portion of the steepness values from these analogous species range from 0.6-0.8 with 90% of the values less than 0.9. As the gray triggerfish productivity score from this exercise is midway between the medium and high category, it is recommended that the prior probability density function on steepness for this species be lognormal with a mode of 0.8 and a CV such that there is no greater than a 10% probability of steepness values greater than 0.9.
2.6 Habitat
Eggs of Gulf gray trigger incubate in demersal nests between within 12 to 58 hours, after which they enter the plankton (Thresher, 1984). Gray triggerfish are collected in SEAMAP neuston tows, usually associated with seaweed and flotsam (mostly Sargassum), at sizes from 2 to 80 mm SL with a median length frequency of 15 mm SL (SEDAR9-DW25). Also, Wells and Rooker (2004) reported the SL of gray trigger associated with Sargassum to range from 10 to 80 mm SL, with a mode around 40 mm SL. Ingram (2001) reports that gray trigger settle between 40 and 160 mm FL with a mode around 70 mm FL (i.e., 31 to 130 mm SL, mode 56 mm SL), based on settlement marks in the first dorsal spine of trawl-caught gray trigger. Fork length of gray trigger collected in SEAMAP groundfish surveys ranged from 60 to >280 mm FL with a mode of 90 mm FL during the Summer SEAMAP Groundfish Surveys and a mode of 120 mm FL during Fall SEAMAP Groundfish Surveys. In the Gulf, the gray trigger inhabit reef areas (natural and artificial reefs, low or high-relief reefs) in waters from 10 m (Smith, 1976; Johnson and Saloman, 1984, Ingram, 2001) to 106 m (Kevin Rademacher, pers. comm.1) in depth as adults. National Marine Fisheries Service (NMFS) videos taken of reefs in the Gulf indicate that gray trigger are distributed from south Texas around the northern Gulf to just north of the Florida Keys with increased concentration of adults associated with the numerous artificial reef permit areas (Kevin Rademacher, per. comm., SEDAR9-DW21).
2.7 Stock Definition
Adult gray trigger off Alabama exhibit high site fidelity (Ingram, 2001). High site fidelity may result from the territorial nature of adult fish (Ingram, 2001). Bohnsack (1989) infers that fishes
1 National Marine Fisheries Service, Pascagoula, Mississippi
-10-

SEDAR9-Data Workshop Report Gray Triggerfish
exhibiting high site fidelity may be more easily overexploited. In the case of gray trigger in Ingram’s (2001) study, loss of older age classes resulting from increases in fishing pressure in publicly known fishing grounds is apparent. Selective removal of large, fast-growing members of the population may be resulting in decreased growth rates of survivors on small spatiotemporal scales (Ingram, 2001).
Population parameters of adult gray trigger are heterogeneous on multiple spatial scales. Estimates of growth rates on the scale of individual reefs indicate high variability, which precludes a finding of stock heterogeneity on this small scale (Ingram, 2001). However, at a slightly larger scale (i.e. at the reef-complex or reef-permit-area scale), adult gray trigger appear to have differences in specific population parameters; differences may be attributable to differential fishing pressure between reef areas (Ingram, 2001). On a Gulf-wide scale, temporal differences in growth and mortality parameters may result from different levels of exploitation and/or habitat characteristics, and may preclude any meaningful comparisons of growth and mortality to gain insight into stock structure.
The length of the pelagic phase of young gray trigger is characterized as being prolonged and indeterminate by Richards and Lindeman (1987). Gray trigger may choose to inhabit structure in surface waters until suitable demersal habitat is found, and may be pelagic from a few weeks to several months. Gray trigger associate with Sargassum spp. patches and other flotsom during their pelagic phase. Gray trigger may exhibit homogeneous stock structure in relation to genetic variability, due to a prolonged pelagic phase and the potential of wide dispersal (Richards and Lindeman, 1987). However, if young gray trigger are entrained within cyclonic or anti-cyclonic currents that retain them in the same area from which they were spawned, the result would be a mostly self-recruiting population or sub-population. Moreover, comparisons between length-frequency histograms of gray trigger collected as larvae/juveniles in nueston tows during SEAMAP Ichthyoplankton Surveys (SEDAR9-DW25) and gray trigger collected during SEAMAP Groundfish Surveys (SEDAR9-DW23 and SEDAR9-DW27) indicate that many gray trigger probably settle out of surface waters to trawling grounds by late Fall.
-11-
SEDAR9-Data Workshop Report Gray Triggerfish
3 Commercial Fishery Description, Data Sources, and Statistics
3.1 Commercial Landings Collection and Statistics
3.1.1 Commercial Landings Data Collection
Commercial fishery statistics include information on landings of seafood products, fishing effort, and biological characteristics of the catch. A variety of sources of information are used to obtain these statistics.
The quantity (usually weight) and value of seafood products sold to licensed seafood dealers have been collected through various state and federal programs overtime. Currently these landing statistics are collected by state fisheries agencies in Alabama, Florida, and Louisiana on each fishing trip (trip ticket programs). In Mississippi and Texas, monthly dealer reports of landings are either sent in by the dealer or collected by state and federal port agents. Prior to the implementation of trip ticket programs landings were collected from seafood dealers each month by NMFS and state agents. Trip ticket programs generally provide information on the gear used and the fishing area. For the historical landings obtained from dealers each month, fishing gear and area were assigned by the agents on an annual basis.
At the National Marine Fisheries Service (NMFS), Southeast Fisheries Science Center (SEFSC) commercial landings statistics from North Carolina through Texas from 1962 to present are maintained in a data base referred to as the Accumulated Landings System (ALS). Statistics on all seafood products other than shrimp are maintained in that data base. Landings statistics from before 1962 are maintained by NMFS in Silver Springs, MD.
3.1.2 History and overview of landings data collection
3.1.2.1 Florida
Prior to 1986, commercial landings statistics were collected by a combination of monthly mail submissions and port agent visits. These procedures provided quantity and value, but did not provide information on gear, area or distance from shore. Because of the large number of dealers, port agents were not able to provide the gear, area and distance information for monthly data. Gear, area and distance from shore, however, are provided for annual summaries of the quantity and value and known as the Florida Annual Canvas data.
Beginning in 1986, mandatory reporting by all seafood dealers was implemented by the State of Florida. The state requires that a report (ticket) be completed and submitted to the state for every trip from which seafood was sold. Dealers have to report the type of gear as well as the quantity (pounds) purchased for each species. Information on the area of catch can also be provided on the tickets for individual trips. As of 1986 the ALS system relies solely on the Florida trip ticket data to create the ALS landings data for all species other than shrimp.
-12-

SEDAR9-Data Workshop Report Gray Triggerfish
3.1.2.2 Alabama
Until the year 2000 data collection in Alabama was voluntary and was conducted by state and federal port agents that visit dealers and docks monthly. Summaries of the total landings (pounds) and value for species or market category were recorded. Port agents provided information on gear and fishing area from their knowledge of the fisheries and interaction with fishermen and dealers. As of mid- 2000 the State of Alabama required fishermen and dealers to report all commercial landings data through a trip ticket system. As of 2001 the ALS system relies solely on the Alabama trip ticket data to create the ALS landings data for Alabama.
3.1.2.3 Mississippi
Data collection in Mississippi is voluntary and is conducted by state and federal port agents that visit dealers and docks monthly. Summaries of the total landings (pounds) and value for species or market category are recorded. Port agents provide information on gear and fishing area from their knowledge of the fisheries and interaction with fishermen and dealers.
3.1.2.4 Louisiana
Prior to 1993, commercial landings statistics were collected in Louisiana by federal port agents following the traditional procedures established by the NMFS. Monthly summaries of the quantity and value were collected from each dealer in the state. The information on gear, area and distance from shore were added by the individual port agents.
Beginning in January 1993, the Department of Wildlife and Fisheries, State of Louisiana began to enforce the states' mandatory reporting requirement. Dealers have to be licensed by the state and are required to submit monthly summaries of the purchases that were made for individual species or market categories. With the implementation of the state statute, federal port agents did not participate in the collection of commercial fishery statistics.
After the implementation of the state program, information on the gear used, the area of catch and the distance from shore has not been added to the landings statistics (1992-1999). In 1998 the State of Louisiana required fishermen and dealers to report all commercial landings data through a trip ticket system. This data contains detailed landings information by trip including gear, area of capture and vessel information. As of 2000 the ALS system relies solely on the Louisiana trip ticket data to create the ALS landings data for Louisiana.
3.1.2.5 Texas
The state has mandatory reporting requirement for dealers licensed by the state. Dealers are required to submit monthly summaries of the quantities (pounds) and value of the purchases that were made for individual species or market categories. Information on gear, area and distance from shore are added to the state data by SEFSC personnel.
3.1.2.6 Inter-State Transport
Often seafood products are landed in one state and transported by the purchasing dealer to another state; such landings may be recorded both in the state of landing and where the
-13-

SEDAR9-Data Workshop Report Gray Triggerfish
purchasing dealer is located. State and SEFSC personnel track these landings to assure that double counting does not occur and assign them to the state of landing.
3.1.3 Commercial Landings Data Base Organization and Data Handling
The data are organized into three primary components: historical annual data (1962-1976), monthly data (1977-present) and Florida annual data (1976-1996). The monthly 1977-present data for Florida does not have gear or fishing area for the period 1977-1996, while the annual Florida data (1976-1996) has gear and fishing area information which was provided by port agents based on their knowledge of the fisheries.
3.1.3.1 Accummulated Landings System (ALS)
1962-1976 Annual Landings by Year, State, County, Area, Gear, and Species for Florida West Coast through Texas.
1977-present Monthly Landings by Year, Month, State, County, Area, Gear, and Species for Florida West Coast through Texas. Data reported from some states do not have information on the area and gear of capture particularly during the 1990s.
Historically the state and county recorded in the ALS indicates where the marine resource was landed. However in recent years (with the advent of trip tickets as the source of the landings data) in some states the state and county reflect the location of the main office of the purchasing dealer..
Fishing takes place in many different regions including United States waters of the Gulf of Mexico, the South Atlantic and in foreign waters. For the years 1976-present the area codes assigned to those regions are:
• South Atlantic catch in the ALS is considered all area codes 0010, 0019, and 7xxx and higher.
• Foreign Waters are area codes 022x- 060x and 186x.
• In order to define the area of capture for Florida West coast for years 1976-1996 previous assessments use the Florida Annual Canvass data set. (Note* -The State of Florida implemented their trip ticket program in 1985 with more complete reporting starting in 1986. This data set was to contain area of capture information, but due to the nature of a public reporting, some fields on the ticket (such as area) may not have been reported consistently or completely in the early implementation years.)
3.1.3.2 Florida Annual Canvas Landings
1976-1996 - Florida Annual Canvass for area and gear estimates by county which are not in the Monthly Landings for Florida West Coast.
The Florida Annual Data files from 1976 – 1996 represent annual landings by county(from dealer reports) which are broken out on a percentage estimate by species, gear, area of capture,
-14-
SEDAR9-Data Workshop Report Gray Triggerfish
and distance from shore. These estimates are submitted by Port agents, which were assigned responsibility for the particular county, from interviews and discussions with dealers and fishermen collected through out the year. The estimates are processed against the annual landings totals by county on a percentage basis to create the estimated proportions of catch by the gear, area and distance from shore.(The sum of percentages for a given Year, State, County, Species combination will equal 100.)
Florida Annual Canvass 1976-1996 considerations:
• 1976-1985 Data is as landed weight which for amberjack and vermilion snapper was normally landed in a gutted condition. In order to convert to whole weight a factor of 1.04 is universally applied for amberjack and 1.11 for vermilion. Gray Trigger fish is normally landed whole.
• All Area codes 0010, 0019, and 7xxx and higher are considered South Atlantic catch
• State 00 and Grid 0000 in the data set are marine product landed else where and trucked into the State of Florida and are considered duplicated else where because they are theoretically reported back to the state of landing and are not included in the Florida totals.
• State 12 is in the data set which represent Florida interior counties which were landed on Florida East Coast and not included in the Gulf catches.
3.1.3.3 Assignment of gear and area of capture 1990-present
The gear and fishing area designations in the landings data base has been provided by a variety of sources including port agents (annual and/or monthly landing reports), dealers (some trip ticket reports) and permit applications (some trip ticket reports, used only for gear). For some states the fishing gear and area were not reported when trip ticket programs were initiated. Beginning in 1990 fishermen have provided log books which indicate fishing gear, and area as well as catch and effort. The working group recommended that starting in 1990, landings be classified by gear and area using year and state specific information from logbooks.
3.1.4 Commercial Landings
3.1.4.1 Commercial landings by State
Commercial landings in pounds by state and year are shown in Table 5. Those landings are shown for landings reported as for gray triggerfish and unclassified triggerfish. The panel chose to consider both of these categories as gray triggerfish (see below).
3.1.4.2 Commercial Landings Species Composition
In the ALS four codes for for unclassified triggerfish and three triggerfish species have been used. Prior to 1993 only unclassified triggerfish was recorded. Starting in 1993 landings were recorded for gray triggerfish, ocean triggerfish, and queen triggerfish as well as unclassified triggerfish. Since 1993 gray triggerfish has accounted for nearly all of the landings.
-15-

SEDAR9-Data Workshop Report Gray Triggerfish
Consequently, the assumption is made that those landings belonging to the unclassified triggerfish were gray triggerfish. (SEDAR9-DW13).
3.1.4.3 Commercial Landings for Assessment by State
Commercial landings by state are shown in Table 6.
3.1.4.4 Commercial Landings for Assessment by Gear and Area
Table 7 shows commercial landings by gear and region. For landings from 1990-2004 gear and statistical area were assigned from log books by year and state. The eastern and western regions were separated at approximately the Mississippi River with east including statistical areas 1-12 and the west including areas 13-21. Longline included vertical longline, trap included all pot and trap gears and handline included all other gears.
3.2 Bycatch
3.2.1 Commercial Finfish Fishery Discards
Estimates of gray triggerfish commercial discards were presented in SEDAR9-DW17. A 20% sample of the vessels with a Gulf of Mexico reef fish, king mackerel, Spanish mackerel or shark permit were selected to report discards. Data were available for the period August, 2001 through December, 2004. There were only about 50 trips on which gray triggerfish were reported. As a result, there were not sufficient data to conduct generalized linear modeling (GLM) analyses for gray triggerfish. Instead, the data were solely stratified by time of year (Jan-Jul or Aug-Dec).
The estimated number of discards was calculated by multiplying the number of trips in a statum by the average catch rate in the stratum. Estimates were made only for the handline fishery (included electric reel and hydraulic ‘bandit rig’ gear) due to small sample sizes of discards reported from other gears. Additionally estimates were calculated for years before the discard program was initiated. These were made using the 2001-2004 average discard rates for each stratum. These pre-July 2001 estimates were made only for periods when the size limit was the same as the size limit in 2001-2004. Since a size limit was enacted for gray triggerfish in late November, 1999, estimates were made starting in 2000 (Fig. 19).
The committee reviewed existing data which might be useful in estimating the average weight of discards. The committee suggested that the average size of discards might be estimated from information on the compostion before and after minimum sized restrictions were imposed. A review of the gray triggerfish data before and after 2000 indicated no differences in the size composition with very few fish below the minimum size; therefore the committee suggested that the weight associated with the minimum size might be used.
3.2.2 Shrimp Fishery Bycatch
The Bayesian techniques used to estimate shrimp fleet bycatch for red snapper during SEDAR7 (SEDAR7-DW3 and 54) were applied to vermilion snapper, gray triggerfish, and greater amberjack in SEDAR9-DW26. Results for all three species do not appear to be as reliable as the results for red snapper, probably in large part due to their lower abundances, but also due to
-16-

SEDAR9-Data Workshop Report Gray Triggerfish
reasons unique for each species. Gray triggerfish have a relatively even distribution and are probably abundant enough for a reasonable analysis, but the species was not on the list of 22 species for which data were to be recorded during “Evaluation Protocol” observer trips. Hence, shrimp observer data relevant to gray triggerfish are very, very sparse. It was not possible to obtain an estimate for bycatch with BRDs for triggerfish with the Bayesian model. Because of doubts about the reliability of the annual estimates for these species from the SEDAR7 model, a delta distribution-based version of the Bayesian approach was introduced, and a fully mixed effects model (“Model 3”) was resurrected. The mixed model had been considered for red snapper but was ultimately rejected. There is some evidence that the delta implementation may underestimate bycatch, while Model 3 central tendencies tended to be intermediate between the SEDAR7 and delta results, but the uncertainty estimates were enormous. Table 9 provides some summary statistics of the performances of the models when applied to gray triggerfish, and compare them with the more successful situation for red snapper. In view of the unrealistic results that cropped up for all three SEDAR9 species, the DW recommends setting aside the estimates of interannual variation in favor of estimating an overall average, and then constructing wide uncertainty intervals to incorporate estimation error within models, variation among model choices, and interannual variation. Working at a resolution below an annual time step is not recommended. The simplest statistic from SEDAR9-DW26 (average CPUE in all observer trips times an approximate recent effort level) is recommended as the estimate of central tendency. It was not possible to partition the bycatch estimates by age as per SEDAR7-AW20, as only a handful of fish for these 3 species have been measured across all the observer studies.
The recommended central tendency for shrimp fleet bycatch for gray triggerfish is 3.8 million fish per year.
3.3 Size composition
SEDAR9-DW-11 presented information on the size composition of gray triggerfish caught in commercial fisheries. The report showed that trap caught fish were generally smaller than fish caught by handlines and that fish caught by other gears (primarily longline were generally larger than fish caught by handlines. The report also showed that the relatively small number of fish measured from statistical areas 2-5 tended to be larger than the fish caught in the other areas. The committee recommended that if catch at age was to be estimated from size composition samples that stratification be used to account for these differences; it was noted that sample sizes were low particularly for the other gear category and for statistical areas 2-5, so that there were probably not be sufficient samples to adequately characterize the annual size composition for those strata.
-17-

SEDAR9-Data Workshop Report Gray Triggerfish
4 Recreational
The recreational fishery statistics for gray triggerfish are collected by three separate surveys: Marine Recreational Fishing Statistical Survey (MRFSS), Texas Parks and Wildlife Department (TPW) and the Headboat Survey (HB). MRFSS captures statistics on shore based, charter boat and private/rental boat fishing since 1981 from Florida through Louisiana. MRFSS included headboats in the survey from 1981-1985. HB began in 1986 from Florida through Texas. TPW collects recreational fishing statistics for all fishing modes except headboats in the state of Texas.
This group expressed concern over the accuracy of the MRFSS data for the reef fish species. The group agrees that these three species are major components of the recreational fishery. The group’s concern centers on the low number of intercepted fish that is used in conjunction with the fishing effort estimates from the phone survey to estimate total catch (e.g., small anomalies in the data can be expanded to large anomalies). Another concern is over species identification by contract port agents in the early years of the survey and by fisherman for the B1 and B2 catches. Species identification is the greatest issue for the jack family. The group decided that MRFSS provides the best available data at this time. The relatively high CVs associated with the landings will be incorporated into the assessment models.
Group Decision: The MRFSS data is the best available data and cannot be ignored. The landings have CVs associated with them which will capture the high level of uncertainty.
MRFSS
1. The MRFSS data has missing information for landings in some years, waves, or states that need to be filled with some value.
Group decision: Staff of NMFS SEFSC are developing methodology by which to fill in the missing landings information. The missing landings are most commonly from the first wave in 1981 and Texas for all years. The group decided to accept the methodology from the SEFSC staff (Appendix 1). The group was not able to review the methodology at the time of the data workshop.
Headboat
1. Headboats have no estimates of released fish. Group Decision: Use the rate of B2 from MRFSS charter boat mode only. The group felt that charter boat and headboat fishing is most similar and the rate of released fish would be most like. Private boat fishing would not be the same as the “for-hire” sector.
2. Headboat landings from the Florida Keys and Atlantic based trips to the Dry Tortugas (areas 12 and 17):
Group Decision: The group should not be included in the Gulf of Mexico analysis. The group felt that better than 99% of the trips in area 12 and 17 are in Atlantic jurisdiction.
-18-
SEDAR9-Data Workshop Report Gray Triggerfish
5 Fishery-Dependent Survey Data
5.1 Commercial Fishery Catch Rates
5.1.1 Commercial Handline
An abundance index was developed for Gulf of Mexico gray triggerfish using data from the National Marine Fisheries Service (NMFS) reef fish commercial logbook program when handline or electric reel gear was used (SEDAR9-DW30). This index spanned from 1993 to 2004, with good sample sizes throughout. Gray triggerfish was the 6th most common species in the Gulf of Mexico MRFSS dataset but occurred in 23% of trips. The Stephens and MacCall (2004) species association approach was used to identify trips that were likely to catch gray triggerfish based on the composition of other species landed. This approach selected 32,119 trips for consideration, and gray triggerfish occurred in 19,575 (61%) of them. Nominal CPUEs from these trips indicated that gray trigger may have declined over the time series. Using these trips, a delta-lognormal model was constructed considering the following factors: year, season, red snapper season, red snapper permit (class 1 or not), hooks per line, and state. The model identified year, state, and red snapper permit as significant on the binomial portion of the model, and year, hooks per line, state, state*hooks, and year*state in the lognormal portion. The resulting standardized index suggested the stock had generally increased over the time period, with relatively good confidence throughout the time period (Table 10; Fig. 20). This index will be reconstructed after including a relatively small number of unidentified gray triggerfish. These are most likely gray triggerfish and will most likely only make a small difference in the results. Additionally, concern was raised about whether hook-hours was the appropriate measure of effort for this fishery, especially considering the significance of hooks per line in the analysis. Consequently, effort will be paid to examining this and an alternative measure of effort, line-hours.
5.2 Recreational Fishery Catch Rates
5.2.1 Marine Recreational Fisheries Statistics Survey Catch Rates
An abundance index was developed (SEDAR9-DW28) for Gulf of Mexico gray triggerfish using data from the Marine Recreational Fisheries Statistics Survey (MRFSS). MRFSS data include fish landed and observed by the interviewer (A), dead fish not observed by the interviewer (B1; e.g., unavailable, filleted, used for bait, discarded dead at sea) and fish released alive (B2). Since the indices were estimated on the total catch (A+B1+B2) instead of on landings, it is expected that any impact of size limits would be minimized. This index spanned from 1981 to 2004, although data prior to 1986 was based on few sample sizes. Although there were many trips in the MRFSS system, many caught few species and so no species occurred frequently in trips. Gray triggerfish was the 13th most common species in the Gulf of Mexico MRFSS dataset but occurred in only 6.7% of trips. The Stephens and MacCall (2004) species association approach was used to identify trips that were likely to catch gray triggerfish based on the composition of other species caught. This approach selected 7,248 trips for consideration, and gray triggerfish occurred in 4,308 (59%) of them. Nominal CPUEs from these trips indicated that gray trigger may have increased over the early part of the time series and declined more recently. Using
-19-

SEDAR9-Data Workshop Report Gray Triggerfish
these trips, a delta-lognormal model was constructed considering the following factors: year, season, red snapper season, state, and mode. The model identified year, mode, and state as significant on the binomial portion of the model, and year, season, state, red snapper season, year*state, and year*season in the lognormal portion. The resulting standardized index suggested the stock had increased and then declined over the time period, with greater confidence on the recent observations than the older ones (Table 10; Fig. 21). This index will be reconstructed after including a relatively small number of unidentified gray triggerfish. These are most likely gray triggerfish and could make a difference in the early years of the survey, when sample sizes were generally low.
5.2.2 Headboat Survey Catch Rates
An abundance index was developed (SEDAR9-DW29) for Gulf of Mexico gray triggerfish using data from the NMFS Southeast Zone Headboat Survey. This index spanned from 1986 to 2003, with large sample sizes each year. Additionally, vessels could be tracked individually. Gray triggerfish was the most common species in the Gulf of Mexico headboat dataset and occurred in 46% of trips. The Stephens and MacCall (2004) species association approach was used to identify trips that were likely to catch gray triggerfish based on the composition of other species landed. This approach selected 64,006 trips for consideration. These were further limited to vessels that had at least 30 trips within the species association dataset. This restriction eliminated 58 of 161 vessels (36%) but only 615 trips (1%). Gray triggerfish occurred in 74% of the retained trips. Nominal CPUEs from these trips indicated that gray trigger may have increased over the early part of the time series and declined more recently. Using these trips, a delta-lognormal model was constructed considering the following factors: year, season, state, vessel, time of day, and trip duration. The model identified year, state, and year*state in the binomial portion and year, vessel, season, year*vessel, and year*season in the lognormal portion. Vessel was also significant in the binomial portion of the model and the season*vessel interaction in the lognormal portion. However, inclusion of these factors prevented the model from converging, so they were withheld. The resulting standardized index suggested the stock had increased and then declined over the time period, with fairly good confidence across all observations (Table 10; Fig. 22). This index will be reconstructed with data from 2004 when those data are available. Additional effort may also be paid to incorporating the vessel terms that caused convergence problems.
5.3 Recommendations
5.3.1 Indices to be considered for use in the assessment
As a general recommendation, each of these indices is recommended for use pending the expected revisions to the analyses and input data. Their relative values are shown for comparison in Fig. 23.
5.3.2 Data and/or analysis revisions
Investigations will be made into the appropriate measure of effort in the commercial handline analysis, and revisions made if necessary. The unidentified triggerfish will be included as gray triggerfish for both the commercial handline analysis and the MRFSS analysis.
-20-

SEDAR9-Data Workshop Report Gray Triggerfish
Data are now available from the Headboat Survey in 2004. These should be incorporated in the headboat analysis prior to the assessment.
The question of whether or not size limit changes may have impacted the indices should be considered, incorporating information such as size frequency distributions, and included in the paper(s).
-21-

SEDAR9-Data Workshop Report Gray Triggerfish
6 Fishery-Independent Survey Data
In preparation for the SEDAR, four fishery independent surveys were analyzed and indices of relative abundance developed. These were the Southeast Area Monitoring and Assessment Program (SEAMAP) shrimp/bottomfish surveys and their predecessors, the SEAMAP ichthyoplankton surveys, the SEAMAP reef fish survey, and the small pelagics trawl survey. The small pelagics data may be useful for extended distributional information, but is not a rigorous time series, and is not considered further here. The ichthyoplankton and reef fish surveys are intended to index spawning stock size. The trawl indices are intended to index new recruitment.
6.1 SEAMAP Ichthyoplankton Surveys
Examination of proportion occurrence and nominal mean abundance of gray triggerfish larvae captured during all SEAMAP surveys indicated that larvae consistently occurred most frequently and in highest abundance in neuston net samples during the annual Fall Plankton survey. Gray triggerfish occurred more frequently and were caught in higher numbers in this survey when compared to summer and fall shrimp/bottomfish surveys. Additionally, this is the only established SEAMAP survey that samples the entire spawning grounds of gray triggerfish in the U.S. Gulf of Mexico. The time series of larval data available for the upcoming assessment includes the years, 1986-2002 with 1998 observations excluded due to curtailed sampling that year. Catches of gray triggerfish larvae from sampling during the summer and fall shrimp/bottomfish surveys were not included in estimates of annual abundance because these surveys do not extend east of Mobile Bay, Alabama and, therefore, do not adequately sample the gray triggerfish spawning stock. It is evident from a comparison of mean annual abundances, coefficients of variation of mean abundance (CV), and annual proportion occurrence in the two plankton gear types that gray triggerfish larvae are taken more consistently in neuston than in bongo samples. CV’s over the time series for neuston net catches are lower and relatively more stable than for bongo net catches. We recommend that the gray triggerfish index of larval abundance be based on neuston net samples from the SEAMAP Fall Plankton survey. This index, as reported in working document SEDAR9-DW25, should be considered a nominal or raw index only.
Two sampling issues were discussed by the workgroup that need addressing before standardized larval indices are constructed and evaluated. The first was duplicate and/or multiple sampling at some SEAMAP systematic grid sites, and the second, was gaps in spatial coverage over the survey area. Two methods to mitigate any potential bias in survey indices caused by variable spatial coverage were discussed. First was a two step process to filter sample sites used to estimate larval abundance. Step one deletes duplicate samples at a systematic grid site, retaining a single sample at each grid site in accordance with SEAMAP sample design. Priority is given to samples collected by NMFS vessels since these vessels generally collect the majority of survey samples overall, and then to the sample nearest the actual grid site. The second step deletes any sites on the systematic grid not sampled during at least 75% of years in the time series resulting in a more consistent area of coverage over the time series.
-22-
SEDAR9-Data Workshop Report Gray Triggerfish
The workgroup also briefly discussed the need to construct an age or size corrected index due to inter-annual differences in size (age) composition of young gray triggerfish over the index time series. An attempt will be made, as time permits, to construct a size adjusted index (as described in Hanisko et al. SEDAR7-RW-7). The final step will be construction of a model based larval abundance index using the delta-lognormal approach (Lo et al., 1992). Joanne Lyczkowski-Shultz will provide the final indices prior to the August stock assessment.
6.2 SEAMAP Reef Fish Survey
The SEAMAP reef fish survey employs video cameras to estimate the abundance offish associated with reefs and banks located on the continental shelf of the Gulf of Mexico. Fish traps are also employed to capture fish for aging. Details of survey design and estimates of abundance for gray triggerfish are in the working paper (SEDAR9-DW21). We recommend the use of design-based estimates of abundance for gray triggerfish. There was no advantage to using the model-based estimates because no gaps were present in the survey time series that could be accounted for using a GLM approach. The size of the fish observed during the survey come from two sources, fish captured in traps and fish measured on video tape with lasers. Lasers were first introduced in 1995. However, since both the capture of fish in traps, and the instances where fish are hit by lasers was infrequent, size distributions were not estimated. We report only the average size and size range of fish. Survey indices are in working paper SEDAR9-DW21 and presented in Table 11 and Fig. 24. The size of gray triggerfish observed ranged from 123 mm FL to 623 mm FL. Therefore the video survey observes fish age 1+. The results of a 2004 survey will be added. These will be provided prior to the August stock assessment by Chris Gledhill, NMFS Pascagoula, MS.
6.3 SEAMAP Trawl Surveys
The procedures used in SEDAR7 to derive trawl survey indices of abundance for red snapper (SEDAR7-DW1 and DW2; and the age composition portion of SEDAR7-AW15) were applied to gray triggerfish, and reported in SEDAR9-DW27. A Bayesian modeling procedure is used to combine different survey designs from different time series to create a Fall index for 1972-2004 (Table 11, Fig. 25), and a summer index for 1981-2004 (Table 11, Fig. 26) based on the SEAMAP standard. Standard SEAMAP surveys are conducted between 5 and 50 fm, from Mobile Bay to the Mexican border. Within the survey area, gray triggerfish are abundant and frequent enough for derivation of meaningful indices. Triggerfish occur east of the survey area as well; where the rough, live bottom makes standard surveys impractical. Sporadic observations in the eastern Gulf suggest triggerfish catch rates there may comparable to those within the survey area, so a substantial fraction of the population probably is covered, even though the total range cannot be. Size composition data are available for 1987 forward. There appear to be at least two peaks in the summer size composition, but one broad peak in the fall size composition.
A temporary working group consisting of age / growth, larval index, and trawl index specialists met during the Data Workshop to interpret the size compositions from the SEAMAP trawl surveys collected in SEDAR9-DW-18, concentrating on the plots made from fish from all years, combined. Size data are available from 1987 forward.
-23-

SEDAR9-Data Workshop Report Gray Triggerfish
For gray triggerfish in the summer, size data combined over years showed two overlapping peaks. Imposing a boundary at 140 mm would results in a reasonable separation, very consistent with a sharp transition between ages 0 and 1 from aged fish from all sources combined. (Direct ageing of trawl catches alone exist, but only for about 80 fish in one year.) The peak of smaller fish are clearly young of the year, but most of the seasonal recruitment is yet to come. Therefore, the interannual variations of fish under 140 mm are probably not suitable for describing variations in year class strength. Fish above 140 mm are interpreted as age 1+. Age 1 and 2 are known to overlap broadly in size. There are also indications of strong selection by size among gear – fish aged 1 taken in the directed fisheries are substantially larger than trawl-caught age 1s.
In the fall, only a single peak is evident. The catch is almost certainly dominated by age 0s. Based on larval CPUE patterns, recruitment to the trawls is probably substantially complete in time for the fall survey. (Triggerfish are known to be able to remain in the plankton for extended periods, but we founding nothing to indicate that any substantial fraction of the population follows that path.) We did not see a basis for extracting separate classes from the single peak. The fall survey index could probably treated in the assessment as either an index of age 0 with minor error from contamination of older fish, or of age 0+ without internal information on age selectivity.
In red snapper (SEDAR7-AW15), it was possible to establish age 0 / age 1 boundaries that varied over years. (The annual size compositions were not ambiguous for that more abundant species.) There are some cases of apparent shifting in the annual plots in SEDAR9-DW-18, but on an annual basis, the data become quite sparse. We decided to recommend against changing age 0 / age 1 boundaries among years. Such a procedure would probably add more noise than signal. Scott Nichols will provide the age composition vectors prior to the August stock assessment.
6.4 Summary of Outstanding Items
In summary, fishery independent index items still outstanding, but slated for completion prior to the SEDAR9-AW in August are: final larval indices (Lyczkowski-Shultz); updated reeffish indices (Gledhill), and trawl index age compositions (Nichols).
-24-

SEDAR9-Data Workshop Report Gray Triggerfish
7 Literature Cited
Bohnsack, J.A. 1989. Are high densities of fishes at artificial reefs the result of habitat limitation or behavioral preference? Bull. Mar. Sci. 44:631-645.
Dooley, J.K. 1972. Fishes associated with the pelagic Sargassum complex, with a discussion of the Sargassum community. Contrib. Mar. Sci. 16:1-32.
Escorriola, J.I. 1991. Age and growth of the gray triggerfish, Balistes capriscus, from the southeastern United States. M.Sc. thesis, University of North Carolina at Wilmington.
FAO 2001. Report of the Second Technical Consultation on the Sustainability of the CITES Criteria for Listing Comercially-Exploited Aquatic Species. Available at: http://www.fao.org/docrep/meeting/003/X1627E.htm
Fricke, H.W. 1980. Mating systems, maternal and biparental care in triggerfish (Balistidae). Z. Tierpsychol., 53:105-122.
Gladstone, W. 1994. Lek-like spawning, parental care ad mating periodicity of the triggerfish Pseudobalites flavimarginatus (Balistidae). Environ. Biol. Fishes 39:249-257.
Hoenig, J.M. 1983. Empirical use of longevity data to estimate mortality rates. Fish. Bull. 82:898-903.
Hood, P.B. and A.K. Johnson. 1997. A study of the age structure, growth, maturity schedules and fecundity of gray triggerfish (Balistes capriscus), red porgy (Pagrus pagrus), and vermillion snapper (Rhomboplites aurorubens) from the eastern Gulf of Mexico. MARFIN Final Report.
Ingram, GW 2001. Stock structure of gray triggerfish, Ballistes capriscus, on multiple spatial scales in the Gulf of Mexico. PhD Dissertation, Department of Marine Sciences, University of South Alabama. 229pp.
Ingram, G.W., Jr. and W.F. Patterson, III. 1999. Movement patterns of red snapper (Lutjanus campechanus), greater amberjack (Seriola dumerili), and gray triggerfish (Balistes capriscus) in the Gulf of Mexico and the utility of marine reserves as management tools. Proceedings of 52nd Gulf and Caribbean Fisheries Institute, Key West, Florida.
Ishihara, M. and T. Kuwamura. 1996. Bigamy or monogamy with maternal egg care in the triggerfish, Sufflamen chrysopterus. Ichthyol. Res. 43:307-313.
Johnson, A.G. and C.H. Saloman. 1984. Age, growth, and mortality of gray triggerfish, Balistes capriscus, from the northeastern Gulf of Mexico. Fish. Bull. vol. 82, no. 3, p.485 - 492.
-25-

SEDAR9-Data Workshop Report Gray Triggerfish
-26-
Jones, G.P. 1986. Food availability affects growth in a coral reef fish. Oecologia. 70:136-139.
Jones, G.P. 1991. Postrecruitment Processes in the Ecology of Coral reef Fish Populations: A Multifactorial Perspective. Chapter 11 (pages 294–328) in P.F. Sale, ed. The Ecology of Fishes on Coral Reefs. Academic Press. 754 pp.
Kuwamura, T. 1997. Evolution of female egg care in haremic triggerfish, Rhinecanthus aculeatus. Ethology. 103:1015-1023.
Nellis, D.W. 1980. Reproduction in the ocean triggerfish, Canthidermis sufflamen. Carib. J. Sci. 16:167.
Ofori-Danson, P.K. 1989. Growth of grey triggerfish, Balistes capriscus, based on checks of the dorsal spine. Fishbyte. December 1989, p. 11-12.
Ofori-Danson, P.K. 1990. Reproductive ecology of the triggerfish, Balistes capriscus, from the Ghanaian coastal waters. Tropical Ecology. 31:1-11.
Pease, N.L. 1984. Triggerfish: A Promising Net Profit. Horizons. Spring 1984, p. 30 -32.
Richards, W.J. and K.C. Lindeman. 1987. Recruitment dynamics of reef fishes: planktonic processes, settlement and demersal ecologies, and fishery analysis. Bull. Mar. Sci. 41:392-410.
Rose, K.A, JH Cowan, KO Williams, RA Myers, and R Hilborn 2001. Compensatory density dependence in fish populations: importance, controversy, understanding and prognosis. Fish and Fisheries 2001 (2):293-327
Smith, G.B. 1976. Ecology and distribution of eastern Gulf of Mexico reef fishes. Fla. Dep. Nat. Resour., Mar. Res. Publ. 19, 78 p.
Stephens, A. and A. MacCall. 2004. A multispecies approach to subsetting logbook data for purposes of estimating CPUE. Fisheries Research 70 (2004), 299–310.
Thresher, R.E. 1984. Reproduction in Reef Fishes. T.F.H. Publications, Inc., Ltd., Hong Kong. 399 pp.
Watterson, J.C. 1998. Estimates of site fidelity and short-term movements of red snapper (Lutjanus campechanus) based upon mark/recapture on north-central Gulf of Mexico artificial reefs. M.S. Thesis. University of South Alabama. 75 p.
Wells, R.J.D. and J.R. Rooker. 2004. Spatial and temporal patterns of habitat use by fishes associated with Sargassum mats in the northwestern Gulf of Mexico. Bull. Mar. Sci. 74(1): 81-99.
Wilson, C.A., D.L. Nieland, and A.L. Stanley. 1995. Age, growth and reproductive biology of gray triggerfish (Balistes capriscus) from the northern Gulf of Mexico commercial harvest. Final Report, Coastal Fisheries Institute, Louisiana State University.
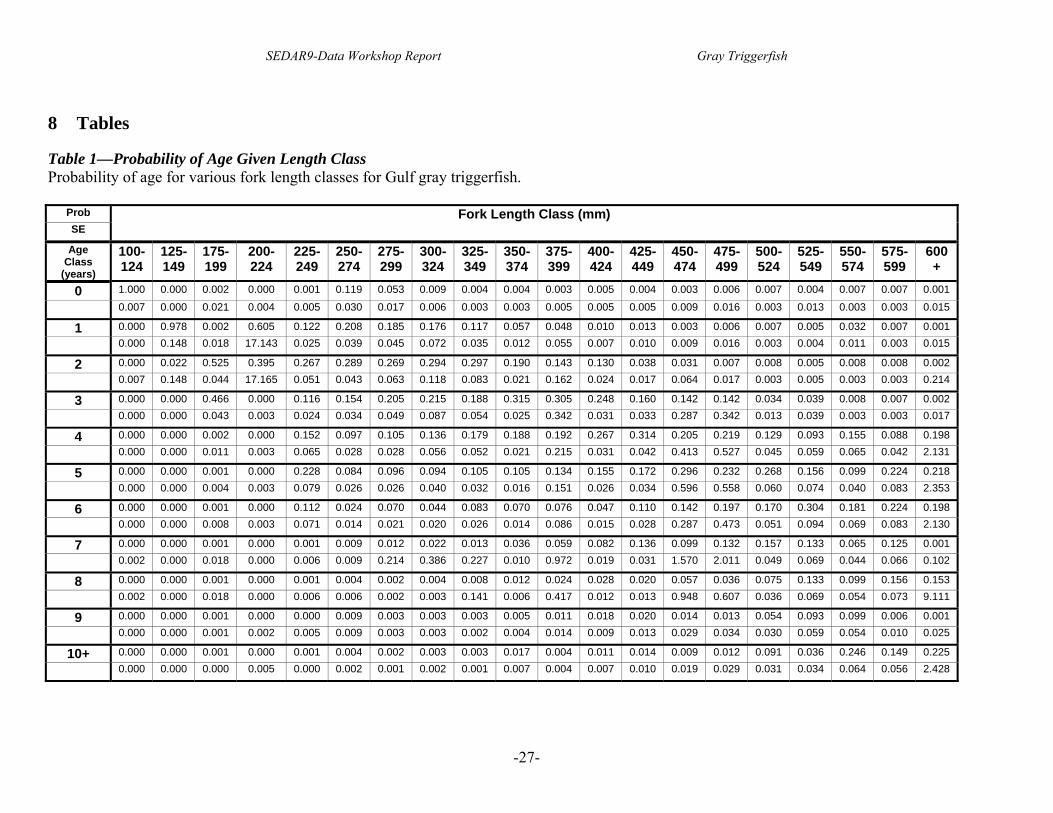
SEDAR9-Data Workshop Report Gray Triggerfish
-27-
8 Tables
Table 1—Probability of Age Given Length Class Probability of age for various fork length classes for Gulf gray triggerfish.
Prob SE
Fork Length Class (mm)
Age Class
(years)
100-124
125-149
175-199
200-224
225-249
250-274
275-299
300-324
325-349
350-374
375-399
400-424
425-449
450-474
475-499
500-524
525-549
550-574
575-599
600+
0 1.000 0.000 0.002 0.000 0.001 0.119 0.053 0.009 0.004 0.004 0.003 0.005 0.004 0.003 0.006 0.007 0.004 0.007 0.007 0.001
0.007 0.000 0.021 0.004 0.005 0.030 0.017 0.006 0.003 0.003 0.005 0.005 0.005 0.009 0.016 0.003 0.013 0.003 0.003 0.015
1 0.000 0.978 0.002 0.605 0.122 0.208 0.185 0.176 0.117 0.057 0.048 0.010 0.013 0.003 0.006 0.007 0.005 0.032 0.007 0.001
0.000 0.148 0.018 17.143 0.025 0.039 0.045 0.072 0.035 0.012 0.055 0.007 0.010 0.009 0.016 0.003 0.004 0.011 0.003 0.015
2 0.000 0.022 0.525 0.395 0.267 0.289 0.269 0.294 0.297 0.190 0.143 0.130 0.038 0.031 0.007 0.008 0.005 0.008 0.008 0.002
0.007 0.148 0.044 17.165 0.051 0.043 0.063 0.118 0.083 0.021 0.162 0.024 0.017 0.064 0.017 0.003 0.005 0.003 0.003 0.214
3 0.000 0.000 0.466 0.000 0.116 0.154 0.205 0.215 0.188 0.315 0.305 0.248 0.160 0.142 0.142 0.034 0.039 0.008 0.007 0.002
0.000 0.000 0.043 0.003 0.024 0.034 0.049 0.087 0.054 0.025 0.342 0.031 0.033 0.287 0.342 0.013 0.039 0.003 0.003 0.017
4 0.000 0.000 0.002 0.000 0.152 0.097 0.105 0.136 0.179 0.188 0.192 0.267 0.314 0.205 0.219 0.129 0.093 0.155 0.088 0.198
0.000 0.000 0.011 0.003 0.065 0.028 0.028 0.056 0.052 0.021 0.215 0.031 0.042 0.413 0.527 0.045 0.059 0.065 0.042 2.131
5 0.000 0.000 0.001 0.000 0.228 0.084 0.096 0.094 0.105 0.105 0.134 0.155 0.172 0.296 0.232 0.268 0.156 0.099 0.224 0.218
0.000 0.000 0.004 0.003 0.079 0.026 0.026 0.040 0.032 0.016 0.151 0.026 0.034 0.596 0.558 0.060 0.074 0.040 0.083 2.353
6 0.000 0.000 0.001 0.000 0.112 0.024 0.070 0.044 0.083 0.070 0.076 0.047 0.110 0.142 0.197 0.170 0.304 0.181 0.224 0.198
0.000 0.000 0.008 0.003 0.071 0.014 0.021 0.020 0.026 0.014 0.086 0.015 0.028 0.287 0.473 0.051 0.094 0.069 0.083 2.130
7 0.000 0.000 0.001 0.000 0.001 0.009 0.012 0.022 0.013 0.036 0.059 0.082 0.136 0.099 0.132 0.157 0.133 0.065 0.125 0.001
0.002 0.000 0.018 0.000 0.006 0.009 0.214 0.386 0.227 0.010 0.972 0.019 0.031 1.570 2.011 0.049 0.069 0.044 0.066 0.102
8 0.000 0.000 0.001 0.000 0.001 0.004 0.002 0.004 0.008 0.012 0.024 0.028 0.020 0.057 0.036 0.075 0.133 0.099 0.156 0.153
0.002 0.000 0.018 0.000 0.006 0.006 0.002 0.003 0.141 0.006 0.417 0.012 0.013 0.948 0.607 0.036 0.069 0.054 0.073 9.111
9 0.000 0.000 0.001 0.000 0.000 0.009 0.003 0.003 0.003 0.005 0.011 0.018 0.020 0.014 0.013 0.054 0.093 0.099 0.006 0.001
0.000 0.000 0.001 0.002 0.005 0.009 0.003 0.003 0.002 0.004 0.014 0.009 0.013 0.029 0.034 0.030 0.059 0.054 0.010 0.025
10+ 0.000 0.000 0.001 0.000 0.001 0.004 0.002 0.003 0.003 0.017 0.004 0.011 0.014 0.009 0.012 0.091 0.036 0.246 0.149 0.225
0.000 0.000 0.000 0.005 0.000 0.002 0.001 0.002 0.001 0.007 0.004 0.007 0.010 0.019 0.029 0.031 0.034 0.064 0.056 2.428

SEDAR9-Data Workshop Report Gray Triggerfish
Table 2—Mortality Estimates by Location from Catch Curves Total and fishing mortality with 95% confidence limits.
State-Sector Z LCLZ UCLZ M F LCLF UCLF AL recreational 0.6477 0.4339 0.8614 0.27047 0.37720 0.16342 0.59097FL Panhandle recreational 0.4070 0.2438 0.5701 0.27047 0.13651 -0.02665 0.29968FLWest Coast commercial 0.4022 0.2868 0.5176 0.27047 0.13170 0.01629 0.24711FL West Coast recreational 0.3432 0.2055 0.4809 0.27047 0.07275 -0.06492 0.21042LA recreational 0.5555 0.3562 0.7548 0.27047 0.28501 0.08568 0.48434TX recreational 0.4083 0.2786 0.5379 0.27047 0.13779 0.00818 0.26740
Table 3—Morphometric Conversions Various morphometric conversion factors by source.
Region Y X Sex Equation r2 n
TL(mm) FL(mm) pooled Y=-10.5017 + 1.1889X 0.96 2873
Weight(kg) FL(mm) male Y=(1.566×10⁻⁸)(X)3.0616 0.99 748
Weight(kg) FL(mm) female Y=(1.792×10⁻⁸)(X)3.0457 0.99 775
Alabama (Ingram 2001)
Weight(kg) FL(mm) pooled Y=(2.039×10⁻⁸)(X)3.0203 0.99 1533
TL(mm) FL(mm) pooled Y=-2.6 + 1.13X 0.99 854
FL(mm) TL(mm) pooled Y=3.4 + 0.88X 0.99 854
Weight(g) Gutted Weight(g) pooled Y=-11.8 + 1.15X 0.99 89
log10Weight(g) log10TL pooled log10(Y)=-4.60 + 2.87log10(X) 0.91 646
FL West Coast (Hood and
Johnson 1997)
log10Gutted Weight(g) log10TL pooled log10(Y)=-5.01 + 3.03log10(X) 0.99 170
-28-

SEDAR9-Data Workshop Report Gray Triggerfish
-29-
Table 4—Metaanalytic Approach to Life History Parameters Proposed guideline indices of productivity for exploited fish species based on meta-analysis of similar species.
Parameter Productivity Species Low Medium High Gray Triggerfish
0.2, 0.27, 0.5 M <0.2 0.2 - 0.5 >0.5
0.43 K <0.15 0.15 - 0.33 > 0.33
1 tmat (years) > 8 3.3 - 8 < 3.3
16 tmax (years) >25 14 - 25 <14
Examples orange roughy, many sharks
cod, hake sardine, anchovy
Gray Triggerfish Productivity Score = 2.5 (HighMedium)

SEDAR9-Data Workshop Report Gray Triggerfish
-30-
Table 5—Commercial Landings (pounds) by Year, State, and Species/Group from all waters (Gulf of Mexico, Atlantic, Caribbean)
TX LA MS AL wFL eFL subtotal TX LA MS AL wFL eFL subtotal total1963 11,500 6,900 18,400 18,4001964 24,000 5,600 29,600 29,6001965 25,700 2,200 27,900 27,9001966 13,900 1,600 15,500 15,5001967 17,400 3,500 20,900 20,9001968 12,500 3,300 15,800 15,8001969 22,300 1,700 24,000 24,0001970 24,200 2,300 26,500 26,5001971 40,400 5,300 45,700 45,7001972 62,600 9,300 71,900 71,9001973 53,200 9,900 63,100 63,1001974 54,000 17,600 71,600 71,6001975 78,000 35,000 113,000 113,0001976 84,500 21,700 106,200 106,2001977 59,386 20,801 80,187 80,1871978 58,823 27,818 86,641 86,6411979 101,403 26,628 128,031 128,0311980 96,529 17,129 113,658 113,6581981 89,860 9,876 99,736 99,7361982 96,673 7,666 104,339 104,3391983 2,670 71,360 18,180 92,210 92,2101984 32 14,694 55,450 21,078 91,254 91,2541985 336 4,766 25 11,840 75,961 23,777 116,705 116,7051986 572 14,493 4,008 5,881 70,978 17,601 113,533 113,5331987 289 21,941 5,550 3,778 92,742 16,979 141,279 141,2791988 1,885 36,980 8,242 7,641 140,790 29,477 225,015 225,0151989 429 60,856 7,682 10,389 238,974 50,063 368,393 368,3931990 6,951 69,798 9,027 16,613 359,553 84,691 546,633 546,6331991 6,242 90,572 7,991 6,993 332,674 105,267 549,739 549,7391992 7,941 101,495 12,433 6,551 321,883 86,731 537,034 537,0341993 11,287 123,484 27,045 10,413 374,260 75,966 622,455 5,345 11,228 16,573 639,0281994 96,757 50 8,389 247,156 71,009 423,361 15,428 23,001 15,332 53,761 477,1221995 75,736 3 5,268 208,449 89,641 379,097 27,371 22,678 50,049 429,1461996 76,151 198 2,867 158,525 61,522 299,263 17,226 3,162 12,446 32,834 332,0971997 48,973 21 2,534 109,762 62,241 223,531 16,798 1,105 8,792 26,695 250,2261998 37,952 82 1,288 107,574 40,533 187,429 21,057 10,038 31,095 218,5241999 147 1,709 119,777 31,599 153,232 13,281 83,394 5,466 102,141 255,3732000 66 2,211 69,643 21,989 93,909 9,775 73,359 4,485 140 87,759 181,6682001 19 3,795 104,275 21,938 130,027 15,202 51,317 2,222 132 68,873 198,9002002 8 142,034 36,268 178,310 14,548 71,144 1,530 6,988 94,210 272,5202003 26 158,849 26,298 185,173 20,810 62,251 1,754 9,135 93,950 279,1232004 14 131188 45252 176454 27695 48666 1676 10828 88865 265319
triggerfish unclassified gray triggerfish

SEDAR9-Data Workshop Report Gray Triggerfish
Table 6—Commercial Landings (pounds) by Year and State Totals include fish classified as gray trigger and unclassified triggerfish from Gulf of Mexico waters.
TX LA MS AL wFL eFL total1963 7,300 7,3001964 20,000 20,0001965 21,700 21,7001966 13,800 13,8001967 17,400 17,4001968 12,500 12,5001969 22,300 22,3001970 24,200 24,2001971 40,400 40,4001972 62,600 62,6001973 53,200 53,2001974 53,100 53,1001975 78,000 78,0001976 84,500 84,5001977 59,386 59,3861978 58,715 58,7151979 101,403 101,4031980 96,423 96,4231981 89,860 89,8601982 96,673 96,6731983 2,670 70,749 73,4191984 32 14,694 55,435 33 70,1941985 336 4,766 25 11,840 75,659 92,6261986 572 14,493 4,008 5,881 70,675 95,6291987 289 21,941 5,550 3,778 92,045 123,6031988 1,885 36,980 7,933 7,641 140,623 195,0621989 429 60,856 7,682 10,389 238,276 317,6321990 6,908 69,758 9,027 16,613 356,654 78 459,0381991 6,203 90,572 7,991 6,993 332,674 97 444,5301992 7,891 101,436 12,433 6,551 321,883 450,1951993 11,154 128,588 38,273 10,413 370,174 126 558,7281994 15,391 119,758 15,382 8,389 245,785 14 404,7201995 27,356 75,736 22,681 5,268 206,836 337,8771996 17,138 79,313 12,644 2,867 155,283 272 267,5161997 16,767 50,078 8,813 2,534 106,419 79 184,6891998 21,037 37,952 10,120 1,288 106,312 15 176,7231999 13,281 83,394 5,613 1,709 114,906 117 219,0202000 9,703 73,359 4,551 2,351 68,148 24 158,1372001 15,202 51,317 2,241 3,927 103,495 176,1822002 14,548 71,144 1,538 6,988 141,138 206 235,5632003 20,804 62,251 1,780 9,135 157,840 251,8102004 27,589 48,666 1,690 10,828 129,697 62 218,533
-31-

SEDAR9-Data Workshop Report Gray Triggerfish
Table 7—Commercial Landings (pounds) by Year, Gear, and Region Totals include fish classified as gray trigger and unclassified triggerfish from Gulf of Mexico waters.
west US Gulf east US Gulf west US Gulf east US Gulf west US Gulf east US Gulf total1963 4,200 3,100 7,3001964 4,300 15,700 20,0001965 4,300 17,400 21,7001966 5,200 8,600 13,8001967 5,200 12,200 17,4001968 3,900 8,600 12,5001969 7,700 14,600 22,3001970 8,200 16,000 24,2001971 9,900 30,500 40,4001972 15,200 47,400 62,6001973 13,200 40,000 53,2001974 13,100 40,000 53,1001975 16,000 62,000 78,0001976 14,800 69,700 84,5001977 9,290 50,096 59,3861978 10,197 48,518 58,7151979 31,814 65,670 3,919 101,4031980 28,707 64,015 2,294 1,406 96,4231981 20,636 61,465 4,726 3,033 89,8601982 26,316 55,317 7,398 7,642 96,6731983 19,350 40,486 4,481 9,102 73,4191984 29,392 29,099 3,334 8,346 23 70,1941985 32,230 43,333 5,556 11,507 92,6261986 14,919 60,397 7,852 12,461 95,6291987 33,653 65,974 637 23,339 123,6031988 54,586 124,927 2,498 13,051 195,0621989 77,330 187,798 9,941 30,166 12,397 317,6321990 99,018 270,238 279 12,979 54 76,469 459,0381991 103,179 341,216 32 8 96 444,5301992 111,628 173,268 368 143,092 79 21,758 450,1951993 174,339 286,999 452 13,557 2,657 80,723 558,7281994 152,702 200,702 439 20,207 30,669 404,7201995 130,156 182,072 509 6,385 18,755 337,8771996 124,950 112,642 381 6,722 22,821 267,5161997 75,918 80,972 991 10,456 16,352 184,6891998 70,479 87,576 92 5,521 13,055 176,7231999 102,620 93,581 206 9,516 13,097 219,0202000 94,814 48,132 281 5,467 9,442 158,1372001 67,669 87,073 49 6,129 15,261 176,1822002 86,904 128,026 59 3,052 17,522 235,5632003 85,385 143,688 8,571 14,166 251,8102004 76,381 114,102 741 14,229 13,080 218,533
longline traphandline+
-32-

SEDAR9-Data Workshop Report Gray Triggerfish
Table 9—Bycatch Estimates from Shrimp Fleet Summary of unexpected levels and ranges for shrimp fleet bycatch estimates for the SEDAR9 species from SEDAR9-DW-26, compared with similar analyses for red snapper, and some supporting statistics. Gray Triggerfish Red Snapper average CPUE x approx effort 3.8M 27.6M SEDAR7 model results median of annual medians 8.3M 26.3M range of annual medians 130x 15x range of annual 95% ci ranges 4.9x-67x 1.7x-29x Delta model results median of annuals 2.2m 13M range of annual medians 140x 6x range of annual 95% ci ranges 3.9x-360x 1.4x-6.7x Model 3 results median of annuals 1.7M 14M range of annual medians 160x 19x range of annual 95% ci ranges 810x-1300x 190x-270x frequency of occurrence in C 9% 43% frequency of occurrence in R 8% 30% frequency of occurrence in B 0 55% number of stations C 2863 9943 R 26983 26486 B 402 8130
C refers to observer data for commercial shrimp tows without BRDs B refers to observer data for commercial shrimp tows with BRDs R refers to research vessel (Oregon II) tows
-33-

SEDAR9-Data Workshop Report Gray Triggerfish
Table 10—Standardized Fishery Dependent Indices Preliminary results from a generalized linear modeling (GLM) standardization procedure, applied to each of three fishery dependent data series: Marine Recreational Fisheries Statistics Survey (MRFSS), headboat surveys (HB), and commercial handline logbook records (CmHL).
MRFSS HB CmHL YEAR ln(CPUE) SE ln(CPUE) SE ln(CPUE) SE
1981 -0.73841 0.664575 1982 -0.13741 0.791705 1983 -0.75398 0.701211 1984 -1.00749 1.129571 1985 -1.28787 0.7645 1986 0.095956 0.228956 0.358655 0.2372421987 -0.3655 0.271743 0.435488 0.2364961988 0.173357 0.328415 0.634518 0.2342491989 0.791917 0.523376 0.892188 0.2300571990 0.846615 0.49101 1.001365 0.215881991 0.274018 0.297221 1.072999 0.2166551992 0.61553 0.223591 1.217308 0.2149831993 0.035172 0.240358 0.921846 0.21026 0.066111 0.1317821994 -0.02243 0.273638 0.758721 0.208563 0.306531 0.1196441995 -0.02395 0.325085 0.557595 0.213566 0.561 0.1423561996 -0.40134 0.275559 0.458898 0.217863 0.311129 0.1082231997 -0.30689 0.212177 0.370537 0.221584 0.247547 0.1045751998 -0.59082 0.169536 0.349206 0.218645 0.137542 0.1043351999 -0.29001 0.134901 0.346791 0.226467 0.261546 0.0954022000 -0.54454 0.138038 0.225678 0.231349 0.124708 0.1050212001 -0.22646 0.150328 0.125933 0.229549 0.244972 0.1034532002 -0.32847 0.137688 0.192833 0.245457 0.432149 0.0978822003 -0.44001 0.136298 0.348264 0.245239 0.61988 0.0975572004 -0.09139 0.124442 0.506137 0.101281
-34-

SEDAR9-Data Workshop Report Gray Triggerfish
Table 11—Standardized Fishery Independent Indices Preliminary results from analyses of various Southeast Area Monitoring and Assessment Program (SEAMAP) surveys, including fall and summer trawl surveys and video surveys.
Fall Trawl Summer Trawl
Video YEAR
Median CPUE
Median CPUE
Frequency Occurrence
1972 4.478 1973 2.838 1974 2.128 1975 0.9269 1976 0.4308 1977 4.49 1978 1.348 1979 1.326 1980 3.888 1981 2.628 0.1286 1982 4.18 0.634 1983 2.086 0.5065 1984 1.75 0.3237 1985 1.855 0.2881 1986 2.119 0.4816 1987 2.212 0.5751 1988 1.902 0.2917 1989 3.379 0.6378 1990 0.7793 0.9617 1991 12.91 1.377 1992 0.7577 0.5725 0.685491993 6.407 0.3844 0.373951994 6.133 1.48 0.336321995 2.572 1.099 0.318231996 2.263 0.3611 0.296541997 1.545 0.8732 0.625331998 0.1468 0.2662 1999 3.463 2.321 2000 6.024 3.764 2001 11.14 4.151 2002 2.58 1.111 0.299572003 2.188 0.3406 2004 2.616 0.3721
-35-

SEDAR9-Data Workshop Report Gray Triggerfish
Table 12. Available recreational landings in numbers (Type A + B1).
Recreational Headboat MRFSS Texas DFW
Year Gulf East West Gulf East West 1981 345898 307135 38763 1982 892388 834149 58239 1983 357551 159396 198156 27889 1984 120098 53267 66831 36599 1985 120334 104775 15559 7237 1986 45042 29024 16018 327963 316590 11373 4425 1987 38730 22033 16697 443284 438551 4732 6522 1988 68565 27125 41440 679382 669026 10356 14058 1989 80522 55630 24892 776593 727140 49453 32744 1990 131381 105816 25565 1057504 961088 96416 9190 1991 89259 58121 31138 756265 658143 98121 8930 1992 110677 68925 41752 609676 572261 37415 72429 1993 102971 58787 44184 545558 528962 16596 39204 1994 110185 53468 56717 498669 458115 40555 6302 1995 97666 45825 51841 567541 502196 65345 4439 1996 76526 36195 40331 259844 254894 4950 2317 1997 63685 34458 29227 272134 257813 14321 4965 1998 53188 37085 16103 232073 225889 6184 4852 1999 40981 34143 6838 211015 178960 32055 2973 2000 32223 26245 5978 180783 128213 52570 6741 2001 40057 32563 7494 216954 198300 18654 4460 2002 53854 44858 8996 298349 292474 5876 2767 2003 63483 46468 17015 366181 353300 12880 1885 2004 56216 43101 13115 432002 403068 28934
-36-

SEDAR9-Data Workshop Report Gray Triggerfish
Table 13. MRFSS landings in numbers by state (Type A + B1) Year AL FL LA MS TX
1981 19562 287573 27197 115661982 42019 791901 53685 229 45541983 10405 148991 198156 1984 355 52912 35198 0 316331985 104775 10785 47741986 24226 292364 11373 1987 21248 415858 4732 1446 1988 95308 572660 10356 1058 1989 165717 558956 49453 2467 1990 597233 354460 96416 9395 1991 152593 504151 98121 1399 1992 177880 390688 37415 3692 1993 177417 349715 16596 1830 1994 86137 367505 40555 4473 1995 217284 276246 65345 8666 1996 126955 122138 4950 5800 1997 96917 158213 14321 2683 1998 64765 152620 6184 8505 1999 51916 126197 32055 847 2000 42455 85254 52570 504 2001 62384 135559 18654 356 2002 107235 183227 5876 2012 2003 92958 259561 12880 781 2004 129301 260953 28934 12815
-37-
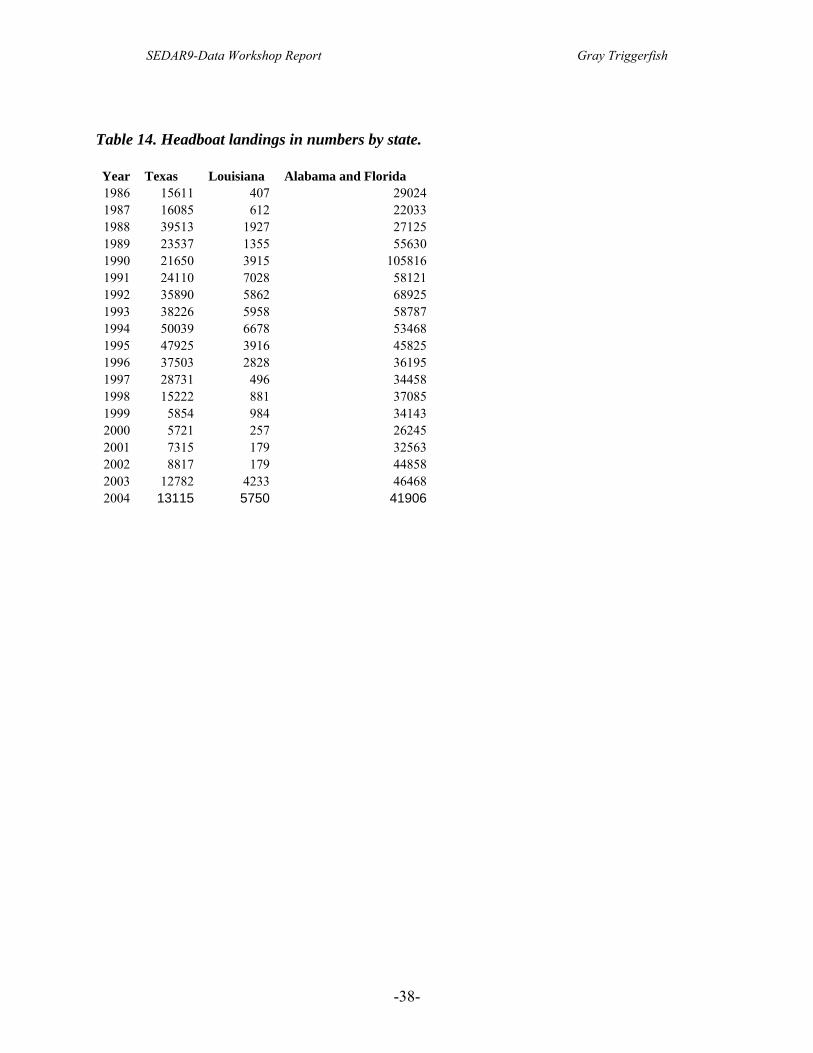
SEDAR9-Data Workshop Report Gray Triggerfish
Table 14. Headboat landings in numbers by state. Year Texas Louisiana Alabama and Florida 1986 15611 407 29024 1987 16085 612 22033 1988 39513 1927 27125 1989 23537 1355 55630 1990 21650 3915 105816 1991 24110 7028 58121 1992 35890 5862 68925 1993 38226 5958 58787 1994 50039 6678 53468 1995 47925 3916 45825 1996 37503 2828 36195 1997 28731 496 34458 1998 15222 881 37085 1999 5854 984 34143 2000 5721 257 26245 2001 7315 179 32563 2002 8817 179 44858 2003 12782 4233 46468 2004 13115 5750 41906
-38-

SEDAR9-Data Workshop Report Gray Triggerfish
Table 15. Texas DPW recreational landings in numbers by year and mode.
Year Headboat Landings (# fish)
Charter Landings (# fish)
Private Landings (# fish)
1983 23897 152 38401984 33679 29201985 80 71571986 31 43941987 1388 51341988 58 203 137971989 53 102 325891990 112 315 87631991 137 87931992 1870 705591993 392041994 30 62721995 44391996 26 22911997 815 41501998 559 42931999 510 24632000 67412001 792 36682002 307 24602003 449 1436
-39-

SEDAR9-Data Workshop Report Gray Triggerfish
9 Figures
Figure 1. Annulus formation in the first dorsal spine of gray triggerfish.
Month1 2 3 4 5 6 7 8 9 10 11 12
Rel
ativ
e Fr
eque
ncy
of T
rans
lusc
ent M
argi
nR
elat
ive
Gon
osom
atic
Inde
xR
elat
ive
Cat
ch P
er U
nit E
ffort
Margin ConditionCatch Per Unit EffortFemale Gonosomatic Index Male Gonosomatic Index
Winter AnnulusForms
Increase in CPUESpring Growth
Peaks in GSI'sDecrease in CPUE
Spawning CheckForms
Increase in CPUEFall Growth
Transverse section ofthe first dorsal spine
-40-
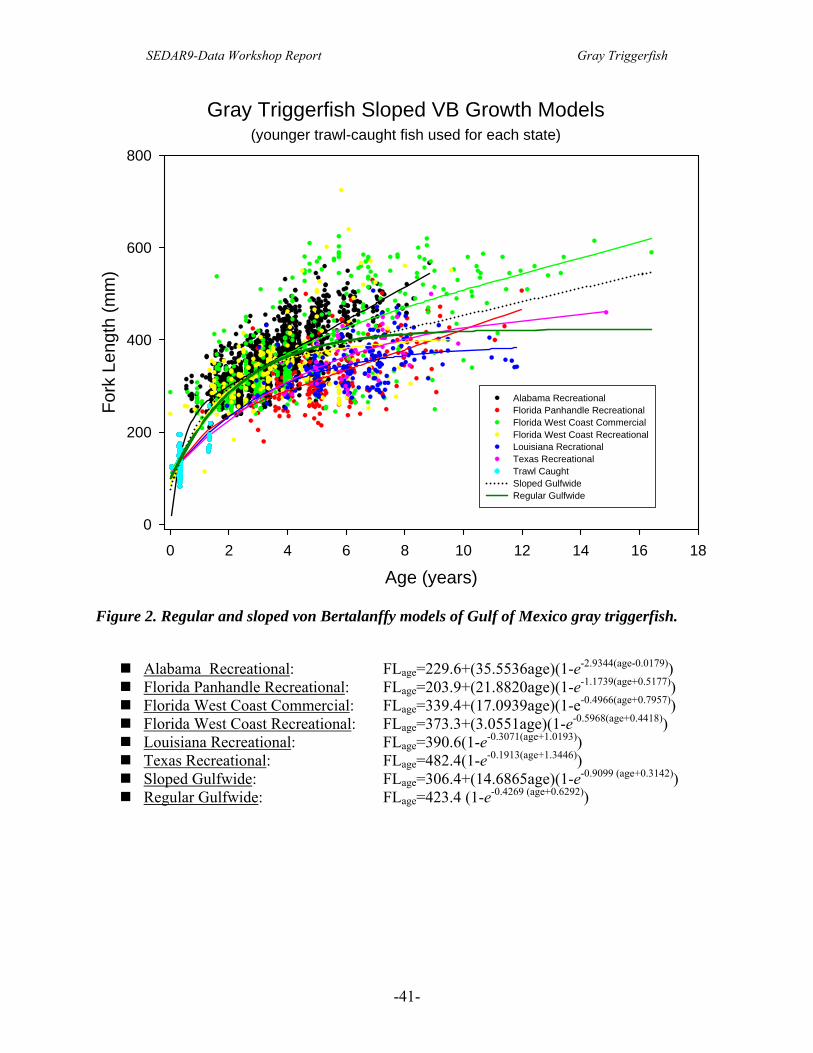
SEDAR9-Data Workshop Report Gray Triggerfish
Gray Triggerfish Sloped VB Growth Models(younger trawl-caught fish used for each state)
Age (years)0 2 4 6 8 10 12 14 16 18
Fork
Len
gth
(mm
)
0
200
400
600
800
Alabama RecreationalFlorida Panhandle RecreationalFlorida West Coast CommercialFlorida West Coast RecreationalLouisiana RecrationalTexas RecreationalTrawl CaughtSloped GulfwideRegular Gulfwide
Figure 2. Regular and sloped von Bertalanffy models of Gulf of Mexico gray triggerfish.
Alabama Recreational: FLage=229.6+(35.5536age)(1-e-2.9344(age-0.0179)) Florida Panhandle Recreational: FLage=203.9+(21.8820age)(1-e-1.1739(age+0.5177)) Florida West Coast Commercial: FLage=339.4+(17.0939age)(1-e-0.4966(age+0.7957)) Florida West Coast Recreational: FLage=373.3+(3.0551age)(1-e-0.5968(age+0.4418)) Louisiana Recreational: FLage=390.6(1-e-0.3071(age+1.0193)) Texas Recreational: FLage=482.4(1-e-0.1913(age+1.3446)) Sloped Gulfwide: FLage=306.4+(14.6865age)(1-e-0.9099 (age+0.3142)) Regular Gulfwide: FLage=423.4 (1-e-0.4269 (age+0.6292))
-41-

SEDAR9-Data Workshop Report Gray Triggerfish
Figure 3. Age frequency histograms of gray triggerfish collected off Alabama.
0
10
20
30
40AL_1996, N = 56
0
10
20
30
40
AL_1997, N = 382
Freq
uenc
y (%
)
0
10
20
30
40
AL_1998, N = 556
0
10
20
30
40
AL_1999, N = 335
Age (years)0 2 4 6 8 10
0
10
20
30
40
AL_2000, N = 216
-42-

SEDAR9-Data Workshop Report Gray Triggerfish
Figure 4. Age frequency histograms of gray triggerfish collected from Florida panhandle recreational fishery (1992 - 1998).
010203040
FLPR_1992, N = 35
010203040
FLPR_1993, N = 32
Freq
uenc
y (%
) 010203040
FLPR_1994, N = 46
010203040
FLPR_1995, N = 36
010203040
FLPR_1996, N = 30
010203040 FLPR_1997, N = 26
Age (years)0 2 4 6 8 10 12 14 16 18
010203040 FLPR_1998, N = 16
-43-
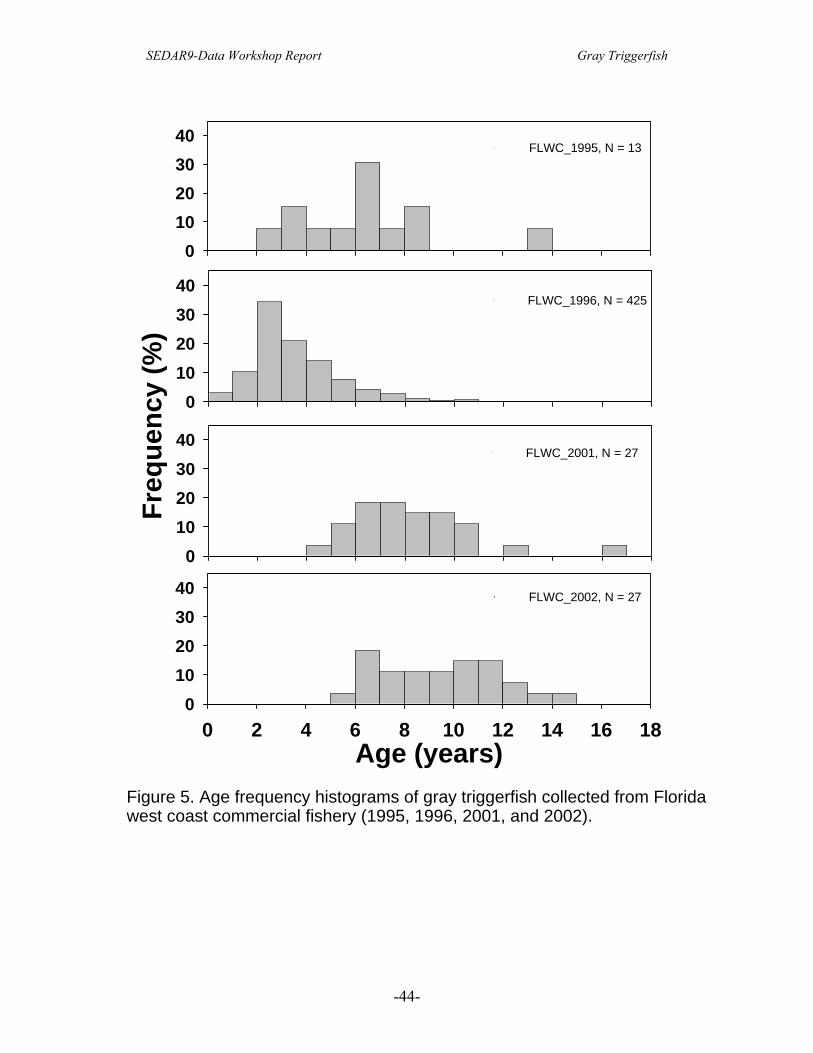
SEDAR9-Data Workshop Report Gray Triggerfish
Figure 5. Age frequency histograms of gray triggerfish collected from Floridawest coast commercial fishery (1995, 1996, 2001, and 2002).
010203040
FLWC_1995, N = 13
010203040
FLWC_1996, N = 425
Freq
uenc
y (%
)
010203040
FLWC_2001, N = 27
Age (years)0 2 4 6 8 10 12 14 16 18
010203040 FLWC_2002, N = 27
-44-
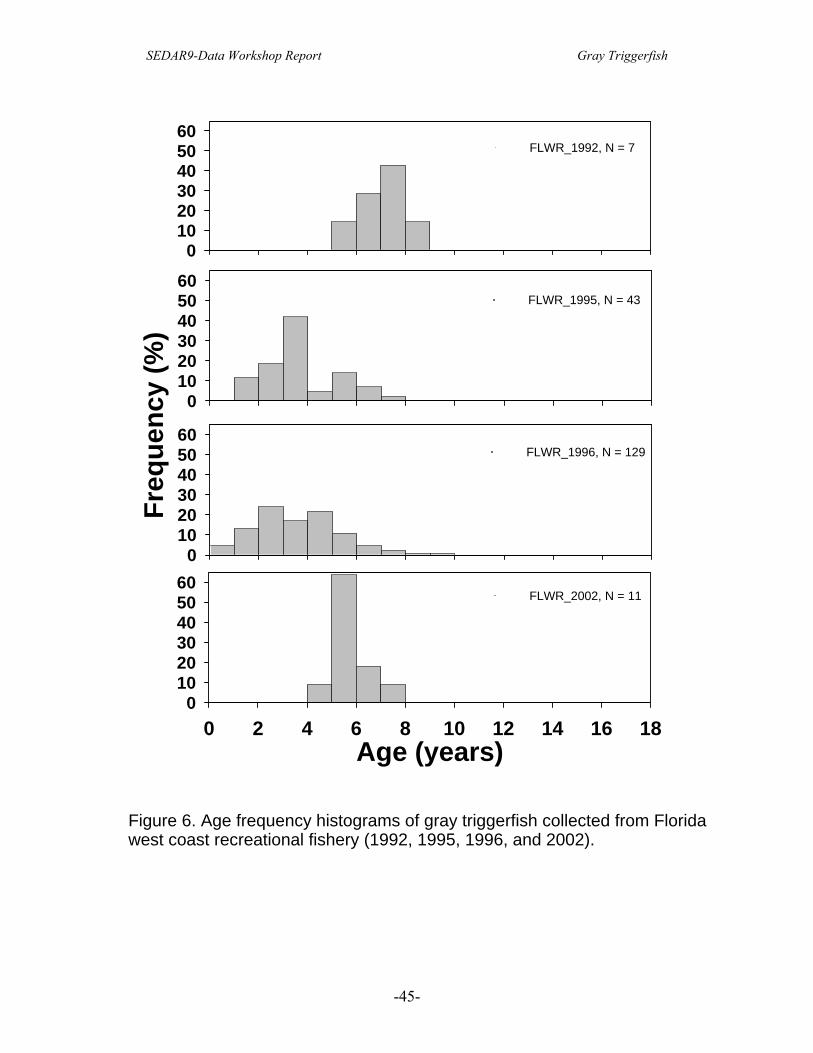
SEDAR9-Data Workshop Report Gray Triggerfish
Figure 6. Age frequency histograms of gray triggerfish collected from Floridawest coast recreational fishery (1992, 1995, 1996, and 2002).
0102030405060
FLWR_1992, N = 7
0102030405060
FLWR_1995, N = 43
Freq
uenc
y (%
)
0102030405060
FLWR_1996, N = 129
Age (years)0 2 4 6 8 10 12 14 16 18
0102030405060
FLWR_2002, N = 11
-45-

SEDAR9-Data Workshop Report Gray Triggerfish
Figure 7. Age frequency histograms of gray triggerfish collected offLouisiana and Texas (1992 - 1994).
010203040
LA_1992, N = 52
010203040
LA_1993, N = 50
Freq
uenc
y (%
)
010203040
LA_1994, N = 68
010203040
TX_1992, N = 7
010203040
TX_1993, N = 14
Age (years)0 2 4 6 8 10 12 14 16 18
010203040
TX_1994, N = 18
-46-

SEDAR9-Data Workshop Report Gray Triggerfish
0
2
4
6
8
10
Figure 8. Mean monthly gonosomatic indices for male[100*(gonad weight as % body weight)] and female(gonad weight as % body weight) gray triggerfish. Errorbars represent standard error and numbers representmonthly sample sizes.
Month
Female Male
GSI
0 1 2 3 4 5 6 7 8 9 10 11 12
-47-
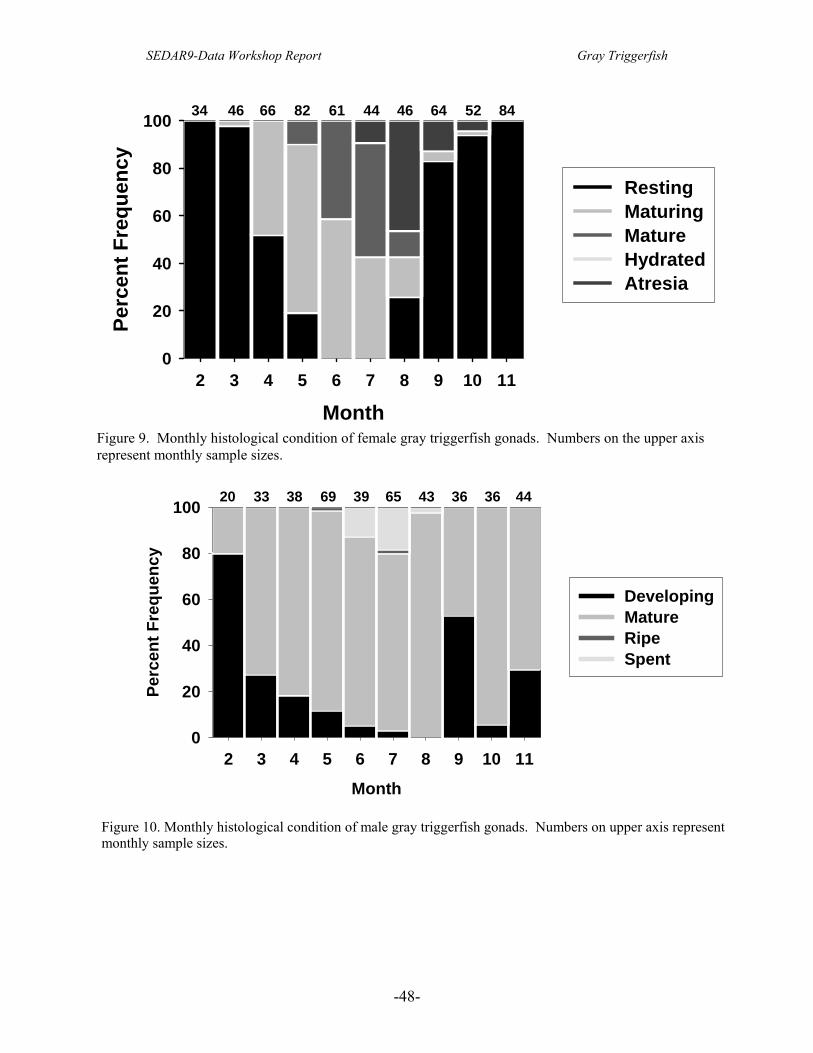
SEDAR9-Data Workshop Report Gray Triggerfish
Figure 9. Monthly histological condition of female gray triggerfish gonads. Numbers on the upper axisrepresent monthly sample sizes.
Month2 3 4 5 6 7 8 9 10 11
Perc
ent F
requ
ency
0
20
40
60
80
100
RestingMaturingMatureHydratedAtresia
34 46 66 82 61 44 46 64 52 84
Figure 10. Monthly histological condition of male gray triggerfish gonads. Numbers on upper axis representmonthly sample sizes.
Month
2 3 4 5 6 7 8 9 10 11
Perc
ent F
requ
ency
0
20
40
60
80
100
DevelopingMatureRipeSpent
20 33 38 69 39 65 43 36 36 44
-48-

SEDAR9-Data Workshop Report Gray Triggerfish
Figure 11. Gonosomatic index (gonad weight as % body weight) versusage of female gray triggerfish.
Age (Years)0 1 2 3 4 5 6 7 8 9
GSI
0
2
4
6
8
10
12
Figure 12. Gonosomatic index [100*(gonad weight as % body weight)]versus age of male gray triggerifsh.
Age (years)
0 1 2 3 4 5 6 7 8 9 10
GSI
0
2
4
6
8
10
12
14
16
18
-49-

SEDAR9-Data Workshop Report Gray Triggerfish
Figure 13. Gonosomatic index (gonad weight as % body weight)versus fork length of female gray triggerfish.
Fork Length (mm)100 200 300 400 500 600
GSI
0
2
4
6
8
10
12
Figure 14. Gonosomatic index [100*(gonad weight as percent body weight)]versus fork length of male gray triggerfish.
Fork Length (mm)
100 150 200 250 300 350 400 450 500 550 600
GSI
0
2
4
6
8
10
12
14
16
18
-50-

SEDAR9-Data Workshop Report Gray Triggerfish
Figure 15. Batch fecundity versus fork length of gray triggerfish.Fork Length (mm)
200 250 300 350 400 450 500 550
Bat
ch F
ecun
dity
0
500000
1000000
1500000
2000000
2500000
3000000
f = 13573e0.0109(FL)
R2 = 0.72
Figure 16. Batch fecundity versus age of gray triggerfish.Age (years)
1 2 3 4 5 6 7 8 9
Bat
ch F
ecun
dity
0
500000
1000000
1500000
2000000
2500000
3000000
f = 170289e0.3159(age)
R2 = 0.52
-51-

SEDAR9-Data Workshop Report Gray Triggerfish
Figure 17. Batch fecundity versus total weight of gray triggerfish.Total Weight (kg)
0 1 2 3
Bat
ch F
ecun
dity
0
500000
1000000
1500000
2000000
2500000
3000000f = 836415(W) - 202904r ² = 0.83
-52-

SEDAR9-Data Workshop Report Gray Triggerfish
Figure 18. Age frequency histograms and total instantaneous mortality
estimates by state (95 % confidence intervals shown).
Age (years)0 2 4 6 8 10 12 14 16 18
Per
cent
Fre
quen
cy
0
10
20
30
40
Alabama Age Frequency, N = 1545Florida Panhandle Recreational Age Frequency, N = 221Florida West Coast Commercial Age Frequency, N = 499Florida West Coast Recreational Age Frequency, N = 199Louisiana Age Frequency, N = 184Texas Age Frequency, N = 44Alabama Mortality Curve, Z = 0.6477Florida Panhandle Recreational Mortality Curve, Z = 0.4070Florida West Coast Commercial Mortality Curve, Z = 0.4022Florida West Coast Recreational Mortality Curve, Z = 0.3432Louisiana Mortality Curve, Z = 0.5555Texas Mortality Curve, Z = 0.4083
-53-

SEDAR9-Data Workshop Report Gray Triggerfish
Gray Triggerfish Estimated Numbers of Discards by Discard Period
0200400600800
1,000
1/93
-7/9
3
1/94
-7/9
4
1/95
-7/9
5
1/96
-7/9
6
1/97
-7/9
7
1/98
-7/9
8
8/99
-12/
99
1/00
-7/0
0
1/01
-7/0
1
1/02
-7/0
2
1/03
-7/0
3
1/04
-7/0
4
Discard Period
Num
ber o
f Dis
card
s
Figure 19—Estimated Numbers of Commercial Discards over Time
Gray TriggerfishStandardized CmHL Index
-0.2
-0.1
0
0.1
0.2
0.3
0.4
0.5
0.6
0.7
0.8
1980 1985 1990 1995 2000 2005
Year
ln-C
PUE
Figure 20—Standardized Commercial Handline Logbook Index Generalized linear model (GLM) used to standardize observation. Error bars represent standard errors.
-54-

SEDAR9-Data Workshop Report Gray Triggerfish
Gray TriggerfishStandardized MRFSS Index
-2.5
-2
-1.5
-1
-0.5
0
0.5
1
1.5
2
1980 1985 1990 1995 2000 2005
Year
ln-C
PUE
Figure 21—Standardized MRFSS Index
GLM used to standardize observation. Error bars represent standard errors.
Gray TriggerfishStandardized HB Index
-0.2
0
0.2
0.4
0.6
0.8
1
1.2
1.4
1.6
1980 1985 1990 1995 2000 2005
Year
ln-C
PUE
Figure 22—Standardized Headboat Index GLM used to standardize observation. Error bars represent standard errors.
-55-

SEDAR9-Data Workshop Report Gray Triggerfish
Gray TriggerfishRelative Standardized Indices
0
0.5
1
1.5
2
2.5
3
3.5
1980 1985 1990 1995 2000 2005
Year
MRFSSHBCmHL
Figure 23—Relative Standardized Fishery Dependent Indices Normalized to share an average value of 1 from the period of complete overlap, 1993-2003
Gray TriggerfishVideo Index
0
0.1
0.2
0.3
0.4
0.5
0.6
0.7
0.8
1990 1992 1994 1996 1998 2000 2002 2004
Year
Cat
ch P
er U
nit E
ffort
Figure 24—Survey-Derived SEAMAP Video Survey Index
-56-
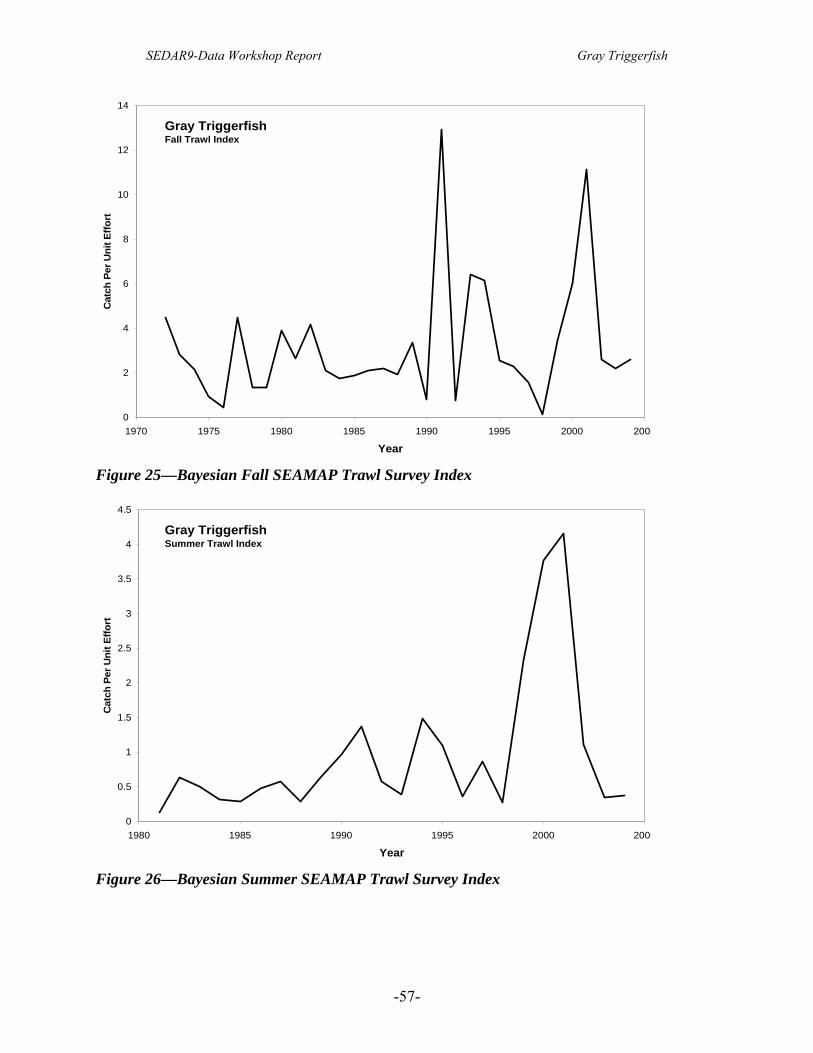
SEDAR9-Data Workshop Report Gray Triggerfish
Gray TriggerfishFall Trawl Index
0
2
4
6
8
10
12
14
1970 1975 1980 1985 1990 1995 2000 2005
Year
Cat
ch P
er U
nit E
ffort
Figure 25—Bayesian Fall SEAMAP Trawl Survey Index
Gray TriggerfishSummer Trawl Index
0
0.5
1
1.5
2
2.5
3
3.5
4
4.5
1980 1985 1990 1995 2000 2005
Year
Cat
ch P
er U
nit E
ffort
Figure 26—Bayesian Summer SEAMAP Trawl Survey Index
-57-

SEDAR9-Data Workshop Report Gray Triggerfish
Gray TriggerfishRelative Standardized Indices
0
0.5
1
1.5
2
2.5
3
3.5
1970 1975 1980 1985 1990 1995 2000 2005
Year
Fall TrawlSummer TrawlVideo Gulfwide
Figure 27—Relative Standardized Fishery Independent Indices
-58-

SEDAR9-Data Workshop Report Gray Triggerfish
10 Appendix 1.
Recreational landings estimates for TX, 1981-1985.
Prepared June 21, 2005, Patty Phares
I. Available estimates for gray triggerfish, greater amberjack and vermilion snapper in TX
A. TPWD Management Data Series 204 – Private and charterboat only (no headboat).
Annual landings estimates, with a year defined as May 15 - May 14, for 1983/84 through 1997/98.
(Estimates for 1998-99 and later years have not been received yet.)
These annual estimates are what TPWD uses and are based on the same survey data they use to compute the TPWD wave estimates sent to us. If landings by wave are not needed, these annual estimates may be best, at least until the wave estimates for 1983-1997 are replaced (see notes below).
Notes:
(1) The annual estimates were recomputed in the mid-1990s using a revision to the "pressure files", thus eliminating some extreme estimates.
The wave estimates for the 1980s and early 1990s have not yet been recomputed to use the revised pressure files and still contain outliers which may disappear when the wave estimates are recomputed.
(2) The annual estimates are based on 2 fishing seasons (high use and low use) and may be more precise than the sum of the 6 wave estimates.
(3) The annual estimates incorporate data entry corrections not yet made to the wave estimates.
(4) TPWD makes species-specific estimates for selected "target species". The rest of the species are combined in to "other". A "substitute" estimate can be derived for the species in "other" based on the counts of species observed, but these may not be very reliable estimates.
The annual estimates have species-specific estimates for each of these 3 species in gulf areas (not bays) in all years.
Before 1994, the wave estimates have species-specific estimates for vermilion snapper in gulf areas but not for gray triggerfish and vermilion snapper.
B. TPWD Management Data Series 29 and 58 – gulf headboats, through May 1983.
(#29) Annual landings estimates (use gulf headboats):
Sept 1978 - Aug 1979
Sept 1980 -- Aug 1981
Sept 1981 -- Aug 1982
(#58) Landings estimates for a partial year (use gulf headboats):
-59-

SEDAR9-Data Workshop Report Gray Triggerfish
Sept 1 1982 -- May 14 1983
Notes:
(1) These MDSs were published in 1984 and may not incorporate needed revisions as do those in MDS 204 (no confirmation from TPWD on this yet).
(2) The Sept-Aug years are not comparable to either the May 15-May 14 years or to calendar years.
(3) According to the MDS, not all headboat in the survey areas were found and contacted (apparently a census was attempted) and possibly not all regions were covered (survey areas listed do not include the current "major areas" of gulf waters off Sabine Lake, Matagorda, San Antonio). The MDS 29 states "Harvest estimates in this study should be considered minimum estimates...".
C. TPWD wave estimates (estimates made for NMFS) – summed into May-April.
Summed to be comparable to TPWD annual estimates in A (May 1 - April 30, 1983/84 -- 2002/03).
Private and charterboats all years, headboats only in May 1983 - Aug 1984.
D. TPWD wave estimate (estimates made for NMFS) – same as C. but summed into annual Jan-Dec
Summed into annual estimates (Jan-Dec) as would be used in assessments.
Private and charterboats (wave 3-6 only in 1983), headboats only in May 1983 - Aug 1984.
F. MRFSS 1981- 1985. The only estimates are:
1981 waves 2, 3, 5, 6 (waves 1 and 4 are missing). All modes, charterboat and headboat combined.
1982-1984 waves 1-3, 5-6 (wave 4 is missing). Only shore mode.
1985 waves 1-2, 5-6 (wave 4 is missing). All modes, charterboat and headboat combined.
G. NMFS HEADBOAT SURVEY, 1986-1989
Use these estimates to evaluate magnitude and trends in pre-1986 headboat landings in TX.
Before 1997, TX landings were combined for Jan-May and for Sept-Dec.
Area (TTS, EEZ is not known), but all can be assigned to EEZ (area=4) for this purpose. These are gulf headboats (not in the bays).
-60-

SEDAR9-Data Workshop Report Gray Triggerfish
II. Summary of “holes”
If both MRFSS and TPWD wave estimates are used:
* charter and headboat are combined in MRFSS (are bay headboats included in MRFSS?) .
x = “hole” (no survey or MRFSS estimate lost)
Shore Private Charter Headboat (gulf) Headboat (bay)
1981 wave 1 x x x x x wave 2 MR MR MR* MR* with gulf? wave 3 MR MR MR* MR* with gulf? wave 4 x x x x x wave 5 MR MR MR* MR* with gulf? wave 6 MR MR MR* MR* with gulf?
1982 wave 1 MR x x x x wave 2 MR x x x x wave 3 MR x x x x wave 4 x x x x x wave 5 MR x x x x wave 6 MR x x x x
1983 wave 1 MR x x x x wave 2 MR x x x x wave 3 MR TX TX TX TX wave 4 X TX TX TX TX wave 5 MR TX TX TX TX wave 6 MR TX TX TX TX
1984 wave 1 MR TX TX TX TX wave 2 MR TX TX TX TX wave 3 MR TX TX TX TX wave 4 X TX TX TX TX wave 5 MR TX TX x TX wave 6 MR TX TX x TX
1985 wave 1 MR TX/MR TX/MR* x/MR* TX/MR* wave 2 MR TX/MR TX/MR* x/MR* TX/MR* wave 3 MR TX/MR TX/MR* x/MR* TX/MR* wave 4 x TX/x TX/x x/x TX/x wave 5 MR TX/MR TX/MR* x/MR* TX/MR* wave 6 MR TX/MR TX/MR* x/MR* TX/MR*
-61-

SEDAR9-Data Workshop Report Gray Triggerfish
III. DISCUSSION
Comparing data sources in Tables 1 and 2, there is not appearance of comparability among data sources. For instance, in Table 1(a) for gray triggerfish, the TPWD Management Data Series estimates (based on May15-May14 year) and TPWD wave estimates made for NMFS are very different in many years. For MRFSS, there are almost no gray triggerfish estimates, but the leatherjacket family (Table 1(d) bears slight resemblance to the estimates from other sources.
This is true for private and charter (including MRFSS charter + headboat) for all three species (gray triggerfish, greater amberjack, vermilion snapper).
For headboats (without charterboats) compared between TPWD and the NMFS Headboat Survey, the comparisons cannot be made in the same year, but the general magnitude of TPWD estimates before 1985 is not like that of Headboat Survey estimates in 1986+ except for vermilion snapper.
Comparisons are destined to be faulty because of the abundance of “holes” and the different time periods for estimates (not the same 12-month period), different grouping of modes (charterboat and headboat alone vs. separate), and poor quality of some of the estimates. The TPWD wave estimates for these years do not have the benefit of revisions slated to be done, and the sampling levels are especially low for charterboats. The MRFSS estimates before 1986 also are considered less reliable – the charterboat component uses the “old” method for charterboats, and there are weaknesses in the estimates for all modes (early years of survey, less thorough editing of data when all estimates were revised in early 1990s, some procedural or methodological differences?).
In short, it’s too messy to try to consolidate the different estimates and fill in the holes. My suggestions are:
(1) Use MDS private and charterboat estimates for 1983-1997 (and use then as though they are calendar year estimates)
(2) Use TPWD wave estimates for 1998+ (these use the calculation procedures that will be applied to the earlier years when time allows for TPWD to do replace the old estimates).
(3) Use the average of the Headboat Survey for 1986-1989 for all years 1981-1985 (perhaps modified by Bob Dixon and TPWD if they believe the fleet was smaller or different).
If this is unsatisfactory, anyone’s procedure may be just as good. But there will never be more data, just re-hashing of the same data presented here.
-62-

SEDAR
SouthEast Data, Assessment, and Review
SEDAR 9 Stock Assessment Report 1
Gulf of Mexico
Gray Triggerfish
SECTION 3. Assessment Workshop
-1-

-2-

-3-
Table of Contents
1. Introduction................................................................................................................................4
1.1. Workshop Time and Place .................................................................................................4
1.2. Terms of Reference............................................................................................................4
1.3. List of Participants .............................................................................................................5
1.4. List of Assessment Workshop Working Papers, Assessment Workshop I & II ................7
2. Data Issues .................................................................................................................................8
2.1. Harvest ...............................................................................................................................8
2.1.1. Shrimp Fleet Bycatch....................................................................................................8
2.1.2. Directed Harvest...........................................................................................................8
2.2. Indices ................................................................................................................................9
3. Models........................................................................................................................................9
3.1. ASPIC MODEL .................................................................................................................9
3.1.1. ASPIC Methods ............................................................................................................9
3.1.2. ASPIC Results.............................................................................................................11
3.2. State-Space Age Structured Production Model................................................................12
3.2.1. State Space Age-Structured Production Model Overview..........................................12
3.2.2. SSASPM Methods ......................................................................................................13
3.2.3. SSASPM Results.........................................................................................................15
3.2.4. Base Model Recommendation ....................................................................................16
3.2.5. Stock Status.................................................................................................................17
4. Assessment Workshop Panel Recommendations and Comment .............................................17
4.1. Model Comparisons .........................................................................................................17
4.1.1. Compare and Contrast Models Considered ................................................................17
4.2. Preferred Model Recommendation ..................................................................................18
4.3. Selected Rebuilding Trajectories .....................................................................................18
5. References ................................................................................................................................19
6. Tables .......................................................................................................................................20
7. Figures......................................................................................................................................30

-4-
1. Introduction
1.1. Workshop Time and Place
The SEDAR 9 Assessment Workshop was held in Miami, FL, August 22 – 26, 2005.
A follow-up Assessment Workshop was held in Atlanta, GA, December 19-20, 2005
1.2. Terms of Reference
1. Select several appropriate modeling approaches, based on available data sources, parameters and values required to manage the stock, and recommendations of the Data Workshop.
2. Provide justification for the chosen data sources and for any deviations from Data Workshop recommendations.
3. Estimate stock parameters (fishing mortality, abundance, biomass, selectivity, stock-recruitment relationship, etc); include appropriate and representative measures of precision for parameter estimates and measures of model ‘goodness of fit’.
4. Characterize uncertainty in the assessment, considering components such as input data, modeling approach, and model configuration.
5. Provide yield-per-recruit and stock-recruitment analyses. 6. Provide complete SFA criteria. This may include evaluating existing SFA benchmarks or
estimating alternative SFA benchmarks (SFA benchmarks include MSY, Fmsy, Bmsy, MSST, and MFMT). Develop stock control rules.
7. Provide declarations of stock status relative to SFA benchmarks: MSY, Fmsy, Bmsy, MSST, MFMT.
8. Estimate Allowable Biological Catch (ABC) and provide an appropriate confidence interval.
9. Project future stock conditions and develop rebuilding schedules if warranted; include estimated generation time. Projections shall be developed in accordance with the following: A) If stock is overfished:
F=0, F=current, F=Fmsy, Ftarget (OY),
F=Frebuild (max that rebuild in allowed time)
B) If stock is overfishing
F=Fcurrent, F=Fmsy, F= Ftarget (OY)
C) If stock is neither overfished nor overfishing
F=Fcurrent, F=Fmsy, F=Ftarget (OY)
10. Evaluate the results of past management actions and probable impacts of current management actions with emphasis on determining progress toward stated management goals.
11. Provide recommendations for future research and data collection (field and assessment); be as specific as practicable in describing sampling design and sampling intensity. Prioritize recommendations based on their likelihood for improving stock assessment.
SEDAR 9 SAR1, Sect. III Gray Triggerfish Assessment Workshop

-5-
12. Fully document all activities: Draft Section III of the SEDAR Stock Assessment Report and provide complete tables of estimated values.
Reports are to be finalized and distributed to the panel for review by September 30. Comments due to editors by October 14. Final version due to Coordinator by October 28.
1.3. List of Participants
1.3.1 Assessment Workshop I, August 22-26 2005
Workshop Participants:
Harry Blanchet .......................................................... LA DWF/ GMFMC FSAP Liz Brooks................................................................. NMFS/SEFSC Miami, FL Craig Brown.............................................................. NMFS/SEFSC Miami, FL Shannon Calay .......................................................... NMFS/SEFSC Miami, FL Guillermo Diaz.......................................................... NMFS/SEFSC Miami, FL Bob Dixon ................................................................. NMFS/SEFSC Beaufort, NC Bob Gill..................................................................... GMFMC Advisory Panel George Guillen .......................................................... Univ. Houston/GMFMC SSC David Hanisko........................................................... NMFS/SEFSC, Pascagoula MS Walter Ingram ........................................................... NMFS/SEFSC Pascagoula MS Bob Muller ................................................................ FL FWCC/GMFMC SSC Debra Murie .............................................................. University of Florida/GMFMC FSAP Josh Sladek Nowlis ................................................... NMFS/SEFSC Miami, FL Scott Nichols ............................................................. NMFS/SEFSC Pascagoula MS Dennis O’Hern .......................................................... GMFMC Advisory Panel Larry Perruso............................................................. NMFS/SEFSC Pascagoula MS Steven Saul................................................................ RSMAS/ SEFSC Miami FL Jerry Scott ................................................................. NMFS/SEFSC Miami, FL Steve Turner .............................................................. NMFS/SEFSC Miami, FL
Observers:
Kay Williams ............................................................ GMFMC Elizabeth Fetherston.................................................. Ocean Conservancy Albert Jones............................................................... .GMFMC SSC
Staff:
John Carmichael........................................................ SEDAR Stu Kennedy.............................................................. GMFMC Dawn Aring............................................................... GMFMC Patrick Gilles............................................................. NMFS/SEFSC Miami FL
1.3.2 Assessment Workshop II, December 19-20 2005
Workshop Participants:
Liz Brooks................................................................. NMFS/SEFSC Miami, FL Craig Brown.............................................................. NMFS/SEFSC Miami, FL
SEDAR 9 SAR1, Sect. III Gray Triggerfish Assessment Workshop
-6-
Shannon Calay .......................................................... NMFS/SEFSC Miami, FL Guillermo Diaz.......................................................... NMFS/SEFSC Miami, FL George Guillen .......................................................... Univ. Houston/GMFMC SSC Walter Ingram ........................................................... NMFS/SEFSC Pascagoula MS Bob Muller ................................................................ FL FWCC/GMFMC SSC Debra Murie .............................................................. University of Florida/GMFMC FSAP Josh Sladek Nowlis ................................................... NMFS/SEFSC Miami, FL Dennis O’Hern .......................................................... GMFMC Advisory Panel Jerry Scott ................................................................. NMFS/SEFSC Miami, FL Steve Turner .............................................................. NMFS/SEFSC Miami, FL
Observers:
Roy Williams ............................................................ GMFMC
Staff:
John Carmichael........................................................ SEDAR Stu Kennedy.............................................................. GMFMC Dawn Aring............................................................... GMFMC Patrick Gilles............................................................. NMFS/SEFSC Miami FL
SEDAR 9 SAR1, Sect. III Gray Triggerfish Assessment Workshop

-7-
1.4. List of Assessment Workshop Working Papers, Assessment Workshop I & II
SEDAR9-AW1 Incorporating age information into SEAMAP trawl indices for SEDAR9 species Nicholls, S.
SEDAR9-AW2 Separating Vermilion Snapper Trawl Indexes into East and West Components Nicholls, S
SEDAR9-AW3 Modeling Shrimp Fleet Bycatch for the SEDAR9 Assessments Nicholls, S
SEDAR9-AW4 Status of the Vermilion Snapper (Rhomboplites Aurorubens) Fisheries of the Gulf of Mexico Cass-Calay, S.
SEDAR9-AW5 Gulf of Mexico Greater Amberjack Stock Assessment Diaz, Guillermo A., and Elizabeth Brooks
SEDAR9-AW6 A Categorical Approach to Modeling Catch at Age for Various Sectors of the Gray Triggerfish (Balistes Capriscus) Fishery in the Gulf of Mexico
Saul, Steven and G. Walter Ingram, Jr.
SEDAR9-AW7 Updated Fishery-Dependent Indices of Abundance for Gulf of Mexico Gray Triggerfish (Balistes Capriscus) Nowlis, Joshua Sladek
SEDAR9-AW8 An Aggregated Production Model for the Gulf of Mexico Gray Triggerfish (Balistes Capriscus) Stock
Nowlis, Joshua Sladek and Steven Saul
SEDAR9-AW9 Age-Based Analyses of the Gulf of Mexico Gray Triggerfish (Balistes capriscus) Stock Nowlis, J. S.
SEDAR9-AW10 Gulf of Mexico greater amberjack virtual population analysis assessment
Brown, C. A.,C. E. Porch, and G. P. Scott
SEDAR9-AW11 Rebuilding Projections for the Gulf of Mexico Gray Triggerfish (Balistes capriscus) Stock.
Nowlis, J. S.
SEDAR 9 SAR1, Sect. III Gray Triggerfish Assessment Workshop

-8-
2. Data Issues
The AW did not identify any deviations from the recommendations of the Data Workshop with regards to data issues.
The DW recommended that gray triggerfish in the Gulf of Mexico be considered a single stock based on its prolonged, indeterminate larval stage. For the most part, the AW agrees with this conclusion. However, the AW notes that examination of the Gulf as Eastern and Western sub-regions could help elucidate variations in stock dynamics, including variations in age at recruitment and in fishing mortality rates. Therefore, the AW suggested that age-based models be considered that used sub-regions, as well as models based on gulf-wide stocks. This is not seen as a deviation from the recommendations of the DW, as many of the indices developed for the AW from recommendations of the DW were divided into eastern and western GOM at the Mississippi River. These analyses are viewed as sensitivity runs to evaluate potential for trends in different regions rather than as a recommendation to divide the species into separate stocks.
2.1. Harvest
2.1.1. Shrimp Fleet Bycatch
Three methods were examined to estimate shrimp fleet bycatch of gray triggerfish. The initial approach was the Bayesian approach used for the red snapper assessment (SEDAR9-DW-26), but results did not appear to be as reliable for the current species, in part due to lower abundance, but also due to reasons unique to gray triggerfish. Gray triggerfish have a distribution appropriate for analysis, and are probably abundant enough for a reasonable analysis, but the species was not on the list of 22 species to be worked up during “Evaluation Protocol” observer trips aboard the shrimp fleet. Hence, shrimp observer data relevant to gray triggerfish are very, very sparse. As a result, it was not possible to obtain an estimate for bycatch with BRDs for triggerfish with the Bayesian model.
Because of doubts about the reliability of the annual estimates for any of the SEDAR 9 species from the SEDAR7 model, Nichols (SEDAR9-AW-03) also examined a delta distribution-based version of the Bayesian approach, and brought back Model 3 from the red snapper assessment (Nichols 2004, SEDAR7-DW-03). There is some evidence that the delta implementation may be underestimating bycatch, and the frequencies of occurrence of vermilion and greater amberjack are so low that one has to be suspicious about results of the CPUE portion of the delta distribution analysis. Model 3 central tendency was generally intermediate between the SEDAR7 and delta results, but the uncertainty estimates were enormous. It was not possible to partition the bycatch estimates by age as per Nichols (2004, SEDAR7-AW-20), as only a handful of fish for the SEDAR9 species have been measured across all the observer studies.
Estimates of catch from the shrimp fleet were given CVs that were double those of other harvest estimates. It was the recommendation of the AW that this was a good starting value, and if the model seemed to be fitting the shrimp bycatch at the expense of fit on the directed fishery, the CVs would be expanded to allow a better fit to the directed harvest. Based on the ability of the delta log-normal model to capture information on annual harvest, the AW accepted that model as the most appropriate method to estimate shrimp fleet harvest.
2.1.2. Directed Harvest
Directed harvest estimates were aggregated into three fleets: recreational headboat, other recreational, and all commercial. Discards were ignored because of the extraordinarily high discard survival rate of gray triggerfish (SEDAR9-DW Report). At present, bycatch of juvenile fish by the shrimp
SEDAR 9 SAR1, Sect. III Gray Triggerfish Assessment Workshop

-9-
fleet was not included in the surplus production model due to data limitations. The models were conditioned on catches, meaning that they were assumed to be correct measures of fishing removals. Values are shown in Table 1 and Fig. 1.
2.2. Indices
Six indices were available. The three catch fleets were used to develop three related fishery-dependent indices calculated from (1) the NMFS Southeast zone headboat survey, (2) the marine recreational fisheries statistics survey (MRFSS), and (3) commercial handline logbook entries (Sladek Nowlis 2005 - SEDAR9-AW-7). Additionally, three fishery-independent surveys were considered: (4) the Neuston larval survey (using the standardized index with diurnal cycle accounted for), (5) an age-1-based trawl survey index, and (6) a video survey. Values are shown in Table 2 and Fig. 2a and 2b (from SEDAR9-AW08, assessment). There were E, W, and Gulf-Wide indices developed from each of these datasets. For the surplus production model, only GW indices were used. For the age-structured, E and W versions were used for the fishery-dependent indices to address differences in F and selectivity.
Two general analyses of the trawl survey data were available for consideration. Nichols (SEDAR9-AW-01) developed two methods of estimating the fishery-independent trawl survey abundance. Both created a Summer Index from the Summer SEAMAP, Early SEAMAP, and Texas Closure datasets, and a Fall Index from the Fall SEAMAP, "First Fall" and Fall Groundfish data. He used a Bayesian, Markov Chain Monte Carlo approach to handle problems with missing observations, to adjust for differences among cruise programs, and to deal with observations of zero catch. Both models assumed a negative binomial distribution for samples within each dataset. The models differed in the information used to predict catch rates, and in the assumptions about the structure of survey error above the level of within-stratum variation (Nichols 2004, SEDAR7–DW-02). The output from the model provided a lognormal distribution of indexed abundance estimates from each index.
For future assessments, the group concluded that more careful examination should be given to a separate, alternative estimate of the fishery-independent trawl survey (SEDAR9-DW-23). In this alternative approach, Ingram generated indices based on an age-1 standardized index of annual average CPUE (number of fish per trawl-hour) for gray triggerfish, developed through use of a delta-lognormal model as described by Lo et al. (1992) and comparable with the standard methods used when generating fishery-dependent indices. This technique seems promising and future assessments would benefit from comparing it to the Bayesian model described above.
3. Models
Two different model types were used to examine the gray triggerfish stock condition: an aggregated stock production model and an age-based stock production. These models were selected because there was relatively little information on the age structure of the harvest of gray triggerfish. VPA models typically assume that the harvest at age is known. That is a weak assumption in the case of this fish, since length is not a very good predictor of age, and there are very few age (or length) samples taken.
The previous stock assessment used A Stock Production Model Incorporating Covariates (ASPIC) procedure (NOAA Fisheries Toolbox Version 5.10, 2005, http://nft.nefsc.noaa.gov). That model was used for the continuity case, and some exploration of that methodology was evaluated to include additional information in that model.
3.1. ASPIC MODEL
3.1.1. ASPIC Methods
SEDAR 9 SAR1, Sect. III Gray Triggerfish Assessment Workshop

-10-
The ASPIC model was explored using a number of data sets for the Gulf of Mexico gray triggerfish (Balistes capriscus) stock (see SEDAR9-AW-08 for more detail).
ASPIC is a non-equilibrium implementation of the Schaefer (1954, 1957) surplus production model. ASPIC also allows one to run models with other stock-recruitment relationships along the continuum identified by Pella and Tomlinson (1969). More details can be found in Prager (1994). ASPIC models presented here were conditioned on catch, forcing the model to match the catch inputs while estimating the abundance-related parameters (i.e., effort, CPUE), and all runs used the logistic or Schaefer version of the stock-recruitment relationship.
3.1.1.1. Data Sources ASPIC relies on catch and abundance estimates to reconstruct a stock’s history. Because ASPIC
assumes that a unit of biomass is equivalent regardless of the age of the fish in question, life history information does not influence this aggregated production model. Instead, the model is driven entirely by catch in biomass terms and abundance indices.
3.1.1.2. Model Configuration and Equations A "continuity case" model was constructed, in the sense that all fishery-dependent indices were
used, similar to the previous assessment (Valle et al., 2001). The previous assessment removed the earlier data (1986-1989) to achieve greater stability. Our continuity case did so as well. Since understanding of this model required exploring the full time series, additional analyses were performed.
An initial model was configured using a logistic stock-recruitment relationship, equal weighting of fishery-dependent and fishery-independent indices, and starting points for parameter estimation specified as follows: initial biomass ratio (B0/K) = 0.75, maximum sustainable yield (MSY) = 1.5 m (range 1m to 4, 6, or 12m), and carrying capacity (K) equal to 10 times MSY (implies an intrinsic population growth rate parameter, r, value of 0.4). Note that total catches average about 1.5 m pounds over the time period being modeled. The consequences of varying the maximum possible MSY values were explored.
Next, a similar model was constructed except that the Neuston larval and trawl survey indices were down weighted to 1% of the influence of other indices, effectively turning them off. The base model used a logistic stock-recruitment relationship and starting points for parameter estimation specified as follows: B0/K = 0.75, MSY = 1.5 m (range 1m to 6m), and K = 10xMSY. Consequences of varying the starting point for the estimation procedure were explored. In a well-conditioned model, the final estimation result should be insensitive to the starting point of its estimation. A finding of sensitivity would raise concern about the ability to make robust conclusions from the model results.
3.1.1.3. Parameters Estimated ASPIC estimates surplus production parameters (carrying capacity, intrinsic population growth
rate) and biomass trajectories over the course of the time period modeled. These parameters are then combined to determine other useful benchmarks, such as MSY-related biomass and fishing mortality rates, and fishing mortality rate trajectories.
ASPIC contains no information on the size of the individuals or the age of the harvest, therefore has no basis to determine such characteristics of the stock as F at age, age at recruitment to the fishery, numbers of individuals in the population, or other age-dependent and size-dependent parameters.
3.1.1.4. Uncertainty and Measures of Precision Uncertainties in the ASPIC models were explored in two main steps. First, we checked for
sensitivities to the starting point of the fitting procedure by varying the initial estimates. Had that exercise
SEDAR 9 SAR1, Sect. III Gray Triggerfish Assessment Workshop

-11-
indicated a well-conditioned model, then we would have examined sensitivity to one or more key parameters.
3.1.2. ASPIC Results
The first problem encountered with the gray triggerfish ASPIC model was conflicting trends among indices. The Neuston larval and trawl survey indices were negatively correlated with several others. Nonetheless, the models did converge, although the model’s behavior suggested that convergence on a clear best fit was problematic given the data.
When all indices were weighted equally, results were highly dependent on the value set for the maximum boundary for the estimation of MSY. When varied from 4 to 12m, the current status of fishing on the population changed by nearly a factor of two (Fig. 3). Oddly, the best fit, in terms of sum of square errors, was the estimate produced with the smallest range (4m → SSE =36.8, 6m → SSE = 46.4, 12m → SSE = 68.4). Due to this problem and the negative correlation among the larval, trawl, and other indices, further runs were conducted with the larval and trawl indices substantially down weighted (1% of others).
Runs with these new weightings indicated a generally good fit of the model to the data (Fig. 4). Additionally, population trajectories were consistent with the general findings of indices and conceptually plausible (Fig. 5). Even with the larval and trawl indices down weighted, the model showed sensitivities to the starting points for the estimation procedure. Starting biomass values varied by more than a factor of four, although the lowest estimate was for a solution that fit poorly (Table 3). Final biomass and fishing mortality ratios also varied over a fairly broad range (Table 3, Fig. 6). And, with the exception of the run with initial estimation point for carrying capacity (K) set lower relative to MSY, all runs produced generally good fits to the data (Table 3).
As was true in the previous gray triggerfish assessment (Valle et al., 2001), limiting the analysis to only fishery-dependent indices and the timeframe to only 1990-present (2004 in our case) made the model more stable (Table 4, Fig. 7). This stability is especially notable in the contrast between Figs. 6 and 7. Both show the sensitivity of the model’s predictions to where the estimation procedure started. It is apparent that the continuity case showed far less sensitivity. It also produced similar conclusions about stock status. In both the former assessment model and the continuity case, biomass declined from 1990-1999. The continuity case showed a slight increase in biomass in the first few years of the new millennium, but followed by a recent decline back to 1999 levels. Both also showed a peak in fishing mortality rates relative to MSY levels in 1995, followed by a consistent decline through the late 1990s. The continuity case shows increasing fishing mortalities from 2000 to present. These results confirm that the addition of recent data did not appreciably change the dynamics or the details of the model’s predictions.
Due to the sensitivity of the model to the starting point for the estimation procedure, we have concerns about our ability to make robust conclusions from the model results. Clearly, the data are not adequate to resolve the status of the Gulf of Mexico gray triggerfish stock with any precision using an aggregated production model.
In total, the ASPIC runs were thus of limited value because of the need to use only a subset of the data. However, one finding does appear to be robust. Nearly every run conducted, both those presented here and numerous runs with draft data, indicated that the Gulf of Mexico gray triggerfish stock was overfished and experiencing overfishing. However, large differences among runs make it difficult to ascertain the magnitude of the problem.
For future research, we recommend that the performance of the ASPIC model be explored further. The sensitivities identified here are not unique to this stock (e.g., see Caribbean yellowtail snapper, SEDAR8-AW Report). Phenomena such as the apparent observation of poor status for the Gulf of Mexico
SEDAR 9 SAR1, Sect. III Gray Triggerfish Assessment Workshop

-12-
gray triggerfish stock could possibly be resolved by investigating a surface of goodness-of-fit values across a broad range of parameter values. Results here and from previous experience would suggest that there is often a ridge of relatively good fit, with many small local peaks. If this is indeed the case, one might be able to draw conclusions about the status of the stock based on where the ridge lies, and might even be able to explore probabilistic projections by bootstrapping across this ridge.
3.2. State-Space Age Structured Production Model
3.2.1. State Space Age-Structured Production Model Overview
A state space age-structured production model (SSASPM) was developed for the Gulf of Mexico gray triggerfish stock. This model was possible due to great improvements in our understanding of gray triggerfish growth and age distribution, largely as a result of work by Ingram (2001).
Using our more detailed understanding of gray triggerfish growth patterns, size distributions were used to estimate age distributions. These were combined with other life history, fishery-dependent, and fishery-independent data to produce the age-structured production model.
Several decisions were made about the basic structure of the SSASPM model when used to describe gray triggerfish. These decisions were primarily based on conclusions made at the SEDAR9 Data Workshop (SEDAR9-DW-Report). Structural and data choices for the base model are summarized below, and additional details can be found in SEDAR9-AW2-09.
3.2.1.1. Stock Structure The Data Workshop concluded that although multiple Gulf stocks of gray trigger were possible,
the evidence did not support a split. Nonetheless, examination of the age or size composition from the eastern and western Gulf indicated that younger fish are generally caught in the eastern Gulf (Saul and Ingram SEDAR9-AW06), presumably as a result of differential fishing pressure. Consequently, we modeled directed fleets separately as eastern and western components, with the split occurring at the Mississippi River.
3.2.1.2. Age structure Gray triggerfish are caught as bycatch in shrimp trawls during their first year of life. However,
modeling age-0 fish presents a number of difficulties, including the technical problem that SSASPM is not yet designed to accommodate age-0 fish. Moreover, it is very likely that age-0 fish experience much heavier natural mortality than older fish and this mortality may have density-dependent relationships which could differ from the patterns of density-dependence during reproduction. We can get around some of these problems by using a model that starts with age-1 fish, but this approach also raises the issue of how to account for fishing mortality on the youngest fish (in this case, from the shrimp fleet). This issue is addressed below. Gray triggerfish can live to at least 16 years of age. However, they become uncommon after age 10. Consequently, we modeled the stock in age classes starting at 1 and ending at 10+ years old.
3.2.1.3. Stock-recruitment SSASPM allows one to model recruitment as a Beverton-Holt or Ricker curve. We chose a
Beverton-Holt curve as it is believed to fit most stocks better, excepting those that experience especially strong, population-wide density-dependent competition. For initial exploration of the model, a prior distribution of the α parameter was used. It relied on a meta-analysis by Myers and colleagues (1999), which was modified to address various life history strategies by Rose and co-authors (2001). Gray triggerfish fit Rose and colleagues’ definition of a periodic life history species. The distribution of α parameters for periodic species had a median value of 12.85, a mean of 17.98, and a log-normally
SEDAR 9 SAR1, Sect. III Gray Triggerfish Assessment Workshop

-13-
distributed standard deviation of 0.97. These values closely correspond with the data workshop’s advice to examine a range of steepness values centered around 0.8 (α = 16) (SEDAR9-DW-Report).
3.2.1.4. Time Period The quantity and quality of data streams for gray triggerfish improved dramatically in 1981 and
again in 1986. From 1963 to 1980, only commercial catches were recorded. Starting in 1981, catch and catch-at-size information were recorded from the recreational fishery. In 1986, recreational sampling improved markedly, and by 1993 all current data streams were online. Although 1993 was the first year when virtually all sources were operational, the information in 1981 was deemed adequate to inform the model directly. The historic phase of the model stretches from 1963, when commercial catches were first reported, to 1980. Given the low level of catches in 1963, it may be reasonable to consider the stock virgin at that time. However, shrimp bycatch may have reduced it even at that early date.
3.2.2. SSASPM Methods
3.2.2.1. Data Sources
Catches Catch information was derived from several fleets (SEDAR9-DW-Report). Based on age-structure
of the catches, these were pooled into four directed fleet categories: recreational east, recreational west, commercial east, and commercial west, with the east-west split occurring at the Mississippi River. Shrimp bycatch was derived for the Gulf as a whole (Table 5, Fig. 8). Bycatch from other fleets was ignored because of the extremely low release mortality of gray triggers (SEDAR9-DW-Report).
All directed catches were converted into weights even though SSASPM is capable of taking catches in numbers. Recreational catches were reported in numbers and converted using size distributions. This conversion provided consistency with the non-age-structured surplus production model but could be explored further. Commercial catches were reported in weight and so required no conversions. Shrimp bycatch were reported in numbers.
Shrimp trawls catch both 0- and 1-year old fish, which can be difficult to distinguish without direct aging. However, we chose a model structure that started with 1-year olds for reasons described above. Using unconverted numbers would imply many more 1-year old fish were killed than was the case, while ignoring age-0 fish entirely would under represent bycatch by the shrimp fishery. Instead, a catch series was produced for age-1 equivalents. To do so, the total shrimp bycatch estimates were separated into age-0 and age-1 portions using an estimated total mortality for this age class of Z = 2. Specifically, the number of age-1 fish for a given year was calculated from the number of age-0 fish estimated to have been caught in the previous year, as reduced by estimated total mortality. Finally, when calculating the age-1 equivalency of bycatch for any year, the number of age-1 fish was added to the number of age-0 fish that would have survived from the previous year.
The resulting catch series are shown in Table 5 and Fig. 8.
Indices of Abundance Eight indices of abundance were used for the SSASPM model. Five fishery-dependent indices
were based on MRFSS data from the eastern Gulf (western Gulf data were inadequate), headboat data from the eastern and western Gulf, and commercial logbook reports for handline gear from the eastern and western Gulf. These indices are discussed in greater detail elsewhere (Sladek Nowlis, SEDAR9-AW07) and are presented in Table 6 and Fig. 9a.
Three fishery-independent indices were also used, all Gulf-wide since selectivity differences should not be a concern for scientific surveys. These included Neuston net surveys, which sample pelagic
SEDAR 9 SAR1, Sect. III Gray Triggerfish Assessment Workshop

-14-
larvae, assumed to represent spawning biomass; bottom trawl surveys, which sample young fish; and video surveys, which sample adults on hard bottom habitat using a baited video camera.
These indices are presented in Table 6 and Fig. 9b.
Age Composition Catch at age data were derived from size distributions and probabilistic assignment of age. Size
distributions came from the Trip Interview Program. Interviews included the direct measurement of catches from both commercial and recreational fishers in the eastern and western Gulf (split as close to the Mississippi River as the data allowed). The resulting size distributions were converted to ages using age-length relationships developed in the SEDAR9 Data Workshop (SEDAR9-DW- Report).
Instead of directly assigning an age to each fish based on its size, a probabilistic approach was used (Saul and Ingram, SEDAR9-AW06). Fish were sorted into 25 mm length bins and a multinomial model was used to estimate the probability of a fish of a particular length class occurring in a particular age class. The probability distributions for each fish were stacked to produce an overall distribution for strata defined by year, region (eastern or western Gulf), and sector (commercial or recreational).
3.2.2.2. Base Model Configuration
Fixed Parameters A number of life history parameters were treated as fixed and taken from the Data Workshop
report (SEDAR9-DW-Report). These included:
Maturity = 87.5% of 1-year olds and 100% of other age classes assumed to be mature.
Fecundity = 170289e0.3159x, where x = age.
M = 0.27 for all modeled age classes.
FL = 423.4 (1-e-0.4269(x+0.6292)), where FL = fork length in mm and x = age.
Wt = 4.4858*10-8 FL3.0203, where Wt = weight in lbs and FL = fork length in mm.
Parameters Estimated Several parameters were estimated, or at least explored over a range of values. These included:
The unfished recruitment levels;
Catchability for each fleet and index; and
Fleet selectivities.
In tuning the Gulf of Mexico gray triggerfish SSASPM model, three elements proved to have strong influence on the results. The first element was the α parameter from the stock-recruitment relationship. The second was a variance scalar applied to recruitment deviations. The third was a similar variance scalar applied to the shrimp fleet fishing effort.
α When run using the prior distribution of α values from the meta-analysis of periodic life history
strategists, the SSASPM model estimated a very high parameter value (70.9, corresponding to a steepness of 0.95). Alternatively, several runs were conducted using highly constrained estimates of α, ranging from 6 to 36 (runs with fixed values had the disconcerting property that they usually produced non-positive-definite Hessian matrices, suggesting instability). A reasonable base model might be the one that used a
SEDAR 9 SAR1, Sect. III Gray Triggerfish Assessment Workshop

-15-
constrained α = 12, which estimated α = 13.5, just above the median of the meta-analytic distribution. The equivalent steepness = 0.77.
Recruitment Deviations Initially, the model was constructed with a variance scalar applied to recruitment deviations that
was high but on par with those applied to index observation errors (i.e., 2). Configured like this, the model predicted recruitment from the mid-1980s to the mid-1990s at levels that exceeded the underlying maximum recruitment parameter (Fig. 10a). This disconnect could have been addressed by assuming it was a signal that recent recruitment has been higher than it was in the past or by assuming that the deviations were inadequately constrained. Using the second approach, the variance scalar was set to 0.05, below even the value applied to effort deviations for most fleets (0.223). When constructed this way, the model predicted recruitment patterns (Fig. 10b) much more in line with dynamics of the population as indicated by abundance indices.
Shrimp Effort Deviations Initially, the model was constructed with variance scalars applied to effort deviations of all fleets
at values that corresponded with CVs of 50% (0.223). For most fleets, we don’t have independent measures of effort and there is real potential for big fluctuations, especially given the less preferred nature of gray triggerfish. However, we do have independent estimates of shrimp fleet effort dynamics, derived for the recent Gulf of Mexico red snapper assessment (Nance 2004, SEDAR7-DW-24). The effort series for eastern and western Gulf fleets are shown in Fig. 11a. When the variance scalar for shrimp effort was set at the same level as other fleets, the model estimated large fluctuations in shrimp effort, which did not agree well with the independent estimates (Fig. 11b). When this variance scalar was set lower (0.0392, equivalent to a 20% CV), the modeled effort fluctuations were more on par with those estimated in the red snapper assessment (Fig. 11b).
Uncertainty and Measures of Precision A number of sensitivity analyses were performed. These runs explored the degree to which the
conclusions from the base model were sensitive to potential inaccuracies in the specification of various model parameters. The sensitivity runs included:
Runs described above, which explored a range of α, recruitment deviations, and shrimp effort deviations values.
Beginning the burning-in period in 1950 instead of 1963.
Using natural mortality values of M = 0.25 or M = 0.3.
3.2.3. SSASPM Results
3.2.3.1. SSASPM Overall Model Fit The base model generally performed well compared to sensitivity runs, according to AIC scores
(Tables 7 and 8). There were some exceptions, though. Fits were best with very high α values, and so runs with values constrained higher than the base or estimated were more parsimonious with the data than the base run. Additionally, the model fit the data slightly better when natural mortality were set at M = 0.3.
3.2.3.2. SSASPM Catch Fits Catches fits were mediocre for the base model (Fig. 12), although they did not improve markedly
in any sensitivity analyses. Directed commercial catches showed the best fit, while shrimp bycatch was too flat (see discussion, above, of effort deviations) and recreational catches only captured some of the patterns of the underlying data.
SEDAR 9 SAR1, Sect. III Gray Triggerfish Assessment Workshop
-16-
3.2.3.3. SSASPM Index Fits Indices fit better. They generally captured the broad pattern of the underlying data but missed most
spikes (Fig. 13). Since the spikes may represent data issues rather than true population fluctuations, this result may be desirable.
3.2.3.4. Stock Recruitment Parameters As is typical for most fisheries models, especially those with relatively short time series of
information, the stock-recruitment relationship was poorly resolved. In addition to the a priori considerations paid to this important issue, we performed some posteriori analyses to further explore it. To do so, we began by examining the results from the base run. Only years with extensive data were used (1986-2004), and these were examined to identify what the recent pattern of stock-recruitment has been, noting that these recent years included recruitment deviations that could have produced a different relationship than the underlying one defined by the stock-recruitment parameters themselves. The result indicated a steepness of 0.65 (Fig. 14a), a bit lower than the median value proposed in the base run (which corresponded to a steepness of 0.77. This difference was relatively minor and provided further support for the proposed base run.
However, this result was highly sensitive to the degree to which recruitment deviations were constrained. Recall from the earlier discussion that they were constrained so as to resolve the inconsistency between recent recruitment levels and the stock-recruitment relationship. When these constraints were removed, the model produced a series of recruitments with a steepness of 0.2, suggesting no density-dependent compensation at reduced abundance (Fig. 14b). Alternatively, when recruitment deviations were eliminated (i.e., fully constrained), so that recruitment in the model had to fit the internal stock-recruitment relationship, recruitment since 1986 appears to follow a relationship with a steepness of 0.976 (Fig. 14c), near the maximum of 1. The ramifications of various steepness values were explored in sensitivity analyses and do have a significant influence on estimated stock status.
3.2.4. Base Model Recommendation
Weighing all of the evidence, the assessment workshop panel recommended the originally-proposed base model to serve that purpose for the gray triggerfish assessment. The rationale for doing so was as follows. First, although recruitment deviations were discovered to play a more important role in determining stock status than was originally anticipated, this finding does not change the logic behind the constraints that were used on the size of deviations. The constrained deviations limited the model from estimating greater-than-virgin recruitment levels from the mid-1980s through the mid-1990s (Fig. 10). Note, though, that another approach would have been to assume that recent recruitment has been higher than the underlying stock-recruitment relationship would suggest.
The other issue to resolve is an appropriate treatment of the α parameter in the stock-recruitment relationship. Although the best fits were associated with high values of α, the improvement in fit over a wide range of α values was slight (Table 7). Thus, we can conclude that the data were not very informative about the stock-recruitment relationship. Our additional efforts to examine this relationship by looking only at the most data rich years (1986-2004) were also inconclusive (Fig. 14). Accepting the treatment of recruitment deviations recommended above, the value of α is driven lower by examining only the most data rich years (Fig. 14a).
Thus, we have the data en masse providing weak justification for using a high steepness and the most informative data providing a weak justification for lower steepness. Lacking any conclusive analysis illustrating that the data point to a single value for this parameter, the assessment workshop panel concluded that using the median value of the meta-analysis was appropriate. To aid consideration of this meta-analysis, the species used are listed in Table 9.
SEDAR 9 SAR1, Sect. III Gray Triggerfish Assessment Workshop

-17-
3.2.5. Stock Status
Although the base model’s behavior was not ideal, it may have been adequate. Greater confidence was gained by examining the key management benchmarks across a wide range of sensitivity analyses (Tables 7 and 8). Current status as a function of SPR- and MSY-based management benchmarks was consistent with those analyses across a range of input parameters.
Using SPR benchmarks, the base run and most sensitivity analyses indicated that the Gulf of Mexico gray triggerfish stock was overfished and experiencing overfishing (Tables 7 and 8, Fig. 15). Exceptions included the α ~ 6, M = 0.3, no or large recruitment deviations, and equal shrimp effort deviations runs, which estimated the stock was not overfished (but in most cases was close to it). All runs indicated overfishing was occurring relative to a 30% SPR benchmark.
Using MSY benchmarks, the base run and most sensitivity analyses also indicated that the Gulf of Mexico gray triggerfish stock was overfished and experiencing overfishing (Tables 7 and 8, Fig. 16). The only exceptions here were the two highest α runs, which indicated the stock was above SSBMSY and not experiencing overfishing; the M = 0.3 run, which indicated the stock was nearly but not quite overfished but still experiencing overfishing; the large recruitment deviations run which indicated the stock was just above SSBMSY levels but still experiencing overfishing.
According to the base run, the stock dropped below MSY levels in the late 1970s, recovered briefly in the late 1980s and has steadily declined since 1990 (Fig. 17a). The model indicates that stock abundance reflects overfishing, which began in the 1970s and has continued to the present day (Fig. 17b).
4. Assessment Workshop Panel Recommendations and Comment
4.1. Model Comparisons
4.1.1. Compare and Contrast Models Considered
4.1.1.1. Aggregated Production Model (ASPIC implementation) The ASPIC model was the only model considered in the previous assessment of gray triggerfish
(Valle et al., 2001). The current application of the model does add the benefit of allowing uncertainty in model inputs. As in the prior assessment, the ASPIC model was very sensitive to input parameters. After updating the continuity case, additional runs of the model deleted some of the fishery-independent indices and provided more consistent results. However, since there is probably some correlation between fishery-dependent indices and harvest, the AW is concerned that removal of information from the model might provide a better fit to the data but may not increase the ability of the model to characterize the status of the stock. As was also noted in the vermilion snapper portion of this report, the model does not have information on age (or size) selectivity compared to age at maturity, thus may not capture resiliency of the stock.
4.1.1.2. State-Space Age-Structured Production Model (SSASPM) The AW preferred the SSASPM model for several reasons. It incorporates information on life
history and on the age structure of the harvest. This allows information on relative ages of maturity and harvest to be evaluated within the model structure. In a case such as gray triggerfish, where selectivity seems to be different across the geographic range, this information has the potential to provide more realistic evaluation of the stock status. While the model seemed to still have significant problems coming to resolution regarding the exact status of the stock, the general consensus of the outputs was persuasive regarding the estimated condition of the stock.
SEDAR 9 SAR1, Sect. III Gray Triggerfish Assessment Workshop
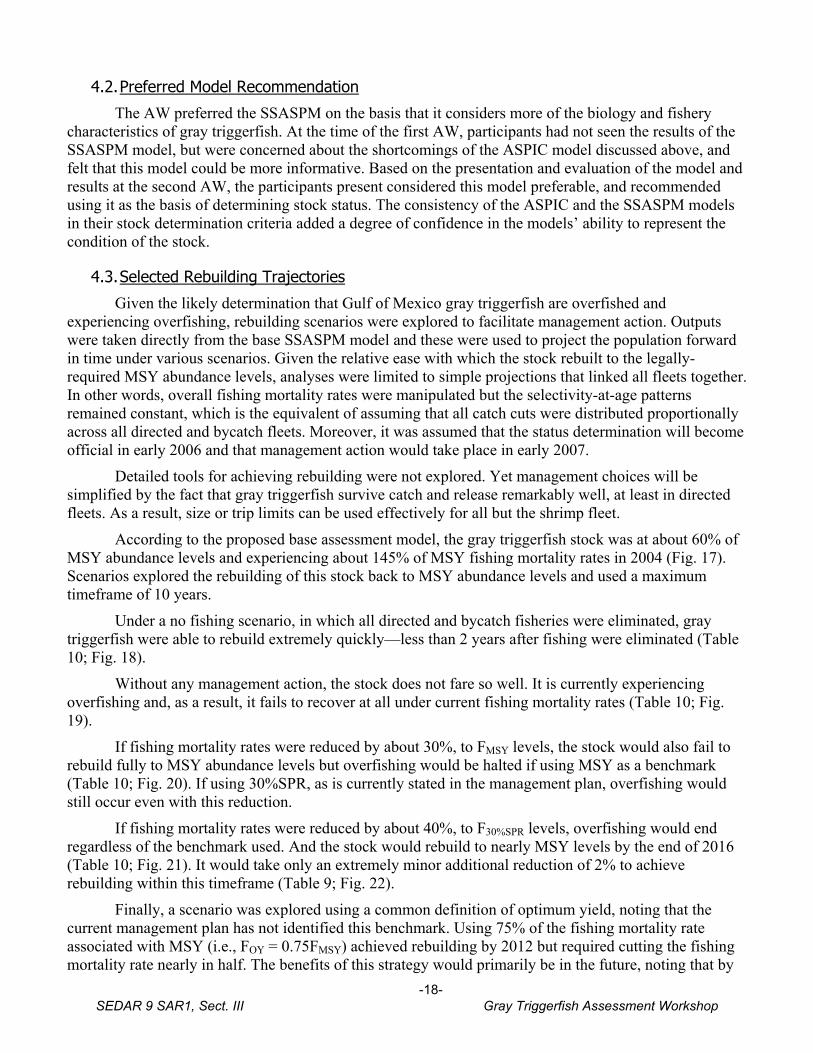
-18-
4.2. Preferred Model Recommendation
The AW preferred the SSASPM on the basis that it considers more of the biology and fishery characteristics of gray triggerfish. At the time of the first AW, participants had not seen the results of the SSASPM model, but were concerned about the shortcomings of the ASPIC model discussed above, and felt that this model could be more informative. Based on the presentation and evaluation of the model and results at the second AW, the participants present considered this model preferable, and recommended using it as the basis of determining stock status. The consistency of the ASPIC and the SSASPM models in their stock determination criteria added a degree of confidence in the models’ ability to represent the condition of the stock.
4.3. Selected Rebuilding Trajectories
Given the likely determination that Gulf of Mexico gray triggerfish are overfished and experiencing overfishing, rebuilding scenarios were explored to facilitate management action. Outputs were taken directly from the base SSASPM model and these were used to project the population forward in time under various scenarios. Given the relative ease with which the stock rebuilt to the legally-required MSY abundance levels, analyses were limited to simple projections that linked all fleets together. In other words, overall fishing mortality rates were manipulated but the selectivity-at-age patterns remained constant, which is the equivalent of assuming that all catch cuts were distributed proportionally across all directed and bycatch fleets. Moreover, it was assumed that the status determination will become official in early 2006 and that management action would take place in early 2007.
Detailed tools for achieving rebuilding were not explored. Yet management choices will be simplified by the fact that gray triggerfish survive catch and release remarkably well, at least in directed fleets. As a result, size or trip limits can be used effectively for all but the shrimp fleet.
According to the proposed base assessment model, the gray triggerfish stock was at about 60% of MSY abundance levels and experiencing about 145% of MSY fishing mortality rates in 2004 (Fig. 17). Scenarios explored the rebuilding of this stock back to MSY abundance levels and used a maximum timeframe of 10 years.
Under a no fishing scenario, in which all directed and bycatch fisheries were eliminated, gray triggerfish were able to rebuild extremely quickly—less than 2 years after fishing were eliminated (Table 10; Fig. 18).
Without any management action, the stock does not fare so well. It is currently experiencing overfishing and, as a result, it fails to recover at all under current fishing mortality rates (Table 10; Fig. 19).
If fishing mortality rates were reduced by about 30%, to FMSY levels, the stock would also fail to rebuild fully to MSY abundance levels but overfishing would be halted if using MSY as a benchmark (Table 10; Fig. 20). If using 30%SPR, as is currently stated in the management plan, overfishing would still occur even with this reduction.
If fishing mortality rates were reduced by about 40%, to F30%SPR levels, overfishing would end regardless of the benchmark used. And the stock would rebuild to nearly MSY levels by the end of 2016 (Table 10; Fig. 21). It would take only an extremely minor additional reduction of 2% to achieve rebuilding within this timeframe (Table 9; Fig. 22).
Finally, a scenario was explored using a common definition of optimum yield, noting that the current management plan has not identified this benchmark. Using 75% of the fishing mortality rate associated with MSY (i.e., FOY = 0.75FMSY) achieved rebuilding by 2012 but required cutting the fishing mortality rate nearly in half. The benefits of this strategy would primarily be in the future, noting that by
SEDAR 9 SAR1, Sect. III Gray Triggerfish Assessment Workshop

-19-
2016 catches under this lighter fishing pressure would nearly equal those under other, more aggressive fishing pressure scenarios (Table 10; Fig. 23).
5. References
Ingram, GW, Jr. 2001. Stock Structure of Gray Triggerfish, Balistes capriscus, on multiple spatial scales in the Gulf of Mexico. PhD Dissertation, Department of Marine Science, University of South Alabama. 229 p.
Myers, RM, KG Bowen, NJ Barrowman. 1999. Maximum reproductive rate of fish at low population sizes. Can. J. Fish. Aquat. Sci. 56: 2404-2419.
Pella, JJ, PK Tomlinson. 1969. A generalized stock production model. Int. Amer. Trop. Tuna Comm. Bull. 13: 419-496.
Prager, MH. 1994. A suite of extensions to a nonequilibrium surplus-production model. Fish. Bull. 92: 374-389.
Rose, KA, JH Cowan Jr, KO Winemiller, RA Myers, R Hilborn. 2001. Compensatory density dependence in fishing populations: importance, controversy, understanding and prognosis. Fish Fish. 2: 293-327.
Schaefer, MB. 1954. Some aspects of dynamics of populations important to the management of commercial marine fisheries. Int. Amer. Trop. Tuna Comm. Bull. 1: 25-56.
Schaefer, MB. 1957. A study of the dynamics of the fishery for yellowfin tuna in the eastern tropical Pacific Ocean. Int. Amer. Trop. Tuna Comm. Bull. 2: 247-268.
Valle, M, CM Legault, M Ortiz. 2001. A Stock Assessment for Gray Triggerfish, Balistes capriscus, in the Gulf of Mexico. Sustainable Fisheries Division Contribution SFD-00/01-124, NOAA Fisheries, Department of Commerce, Miami, FL. 56 p.
SEDAR 9 SAR1, Sect. III Gray Triggerfish Assessment Workshop

-20-
6. Tables
TABLE 1—Catches by Fleet (in lbs)
Year Headboat Other recreational Commercial Total
1986 93,772 864,229 95,629 1,053,630 1987 76,584 1,115,841 123,603 1,316,027 1988 134,501 1,592,524 195,062 1,922,088 1989 162,639 1,672,689 317,632 2,152,960 1990 263,606 2,184,440 459,038 2,907,083 1991 187,270 1,758,437 444,530 2,390,237 1992 222,532 1,497,032 450,195 2,169,759 1993 215,132 1,268,698 558,728 2,042,558 1994 222,428 1,077,372 404,720 1,704,519 1995 200,838 1,125,930 337,877 1,664,645 1996 156,388 673,879 267,516 1,097,783 1997 129,477 605,403 184,689 919,569 1998 107,159 517,647 176,723 801,530 1999 82,666 388,552 219,020 690,238 2000 67,913 341,086 158,137 567,136 2001 82,164 531,165 176,182 789,511 2002 110,960 670,356 235,563 1,016,879 2003 128,529 775,486 251,810 1,155,825 2004 115,965 889,761 218,533 1,224,258
TABLE 2—Index Values (CPUE)
Year Headboat MRFSS Commercial Handline Larval Trawl Video
1986 0.8094 1.7697 0.8122 1987 0.6924 0.8929 0.5985 0.8678 1988 0.9383 2.5591 0.4037 0.4113 1989 1.3966 3.0805 0.2314 0.3900 1990 2.1313 5.5935 0.3990 1.1514 1991 1.9838 3.0457 0.8050 1.3974 1992 2.0453 3.1726 2.6547 0.8699 1.8348 1993 1.7649 1.3323 1.5312 0.9001 0.3532 1.0011 1994 1.4882 1.2347 1.4616 1.0343 1.0221 0.9002 1995 1.2666 2.6720 1.4322 1.0305 1.3458 0.8517 1996 1.0442 1.1268 0.8714 0.6992 0.5557 0.7936 1997 1.0093 0.7435 0.8598 0.7347 0.7730 1.6737 1998 0.9698 0.5663 0.8463 0.2781 1999 0.7009 0.6776 0.7264 0.2326 0.7434 2000 0.5770 0.5961 0.6296 2.4034 0.3067 2001 0.6140 0.6567 0.6727 0.3967 1.5582 0.1430 2002 0.8430 0.8021 0.9638 0.5497 1.5220 0.8019 2003 0.8353 0.7308 1.0854 0.2740 2004 0.8867 0.8609 0.9196 0.5518
SEDAR 9 SAR1, Sect. III Gray Triggerfish Assessment Workshop

-21-
SEDAR 9 SAR1, Sect. III Gray Triggerfish Assessment Workshop

-22-
TABLE 3—Sensitivities to Starting Points of the Estimation Procedure Results from models where larval and trawl survey indices were down weighted. The base model used a logistic stock-recruitment relationship and starting points for parameter estimation specified as follows: B0/K = 0.75, MSY = 1.5 m (range 1m to 6m), and K = 10xMSY.
Model Bratio Fratio Bo ratio Bo (m) SSE Base 0.2828 1.94 0.6661 3.41 31.498 max MSY 4 m lb 0.2128 3.107 0.9872 8.46 52.799 Bo ratio 0.25 0.3003 1.901 0.7408 3.76 25.26 MSY 2.1 m lb. 0.2047 3.509 1.137 9.97 38.58 K=5*MSY 0.2336 2.146 0.7069 2.3 1348
TABLE 4—Sensitivities to Starting Points of the Estimation Procedure in Continuity Case Results from models where only fishery-dependent indices were used and the timeframe was restricted to 1990-2004. The base model used a logistic stock-recruitment relationship and starting points for parameter estimation specified as follows: B0/K = 0.75, MSY = 1.5 m (range 500t to 6m), and K = 10xMSY.
Model Bratio Fratio Bo ratio Bo (m) SSE Base 0.2762 1.933 1.009 4.666 2.959 max MSY 4 m lb 0.3547 1.834 1.614 5.744 3.003 Bo ratio 0.25 0.3578 1.808 1.655 5.632 2.996 MSY 2.1 m lb. 0.3826 1.795 1.945 6.438 3.071 K=5*MSY 0.4085 1.756 2.46 7.517 3.204
SEDAR 9 SAR1, Sect. III Gray Triggerfish Assessment Workshop
-23-
TABLE 5—Gulf of Mexico Gray Triggerfish Catches Directed catches are reported in pounds, while shrimp bycatch is reported in age-1 equivalent fish (described in text). YEAR Recreational
EAST Recreational WEST
Commercial EAST
Commercial WEST
Shrimp Age-1 Equivalent
1963 3100 4200 1964 15700 4300 1965 17400 4300 1966 8600 5200 1967 12200 5200 1968 8600 3900 1969 14600 7700 1970 16000 8200 1971 30500 9900 1972 47400 15200 1973 40000 13200 112278 1974 40000 13100 342365 1975 62000 16000 380204 1976 69700 14800 220050 1977 50096 9290 189051 1978 48518 10197 460315 1979 65670 35733 1771057 1980 65422 31001 606638 1981 748779 179617 64498 25362 1467734 1982 2032601 362711 62959 33714 1206518 1983 397614 387301 49588 23831 1462755 1984 120970 844623 37445 32749 304994 1985 280865 479950 54840 37786 855586 1986 898096 79077 72858 22771 279374 1987 1135998 199066 89313 34290 1044555 1988 1638073 158328 137978 57084 1364168 1989 1765965 212002 230361 87271 906437 1990 2313261 184941 359686 99351 1286703 1991 1688392 399955 341319 103211 523154 1992 1434485 688825 338119 112076 3100516 1993 1317044 309425 381279 177448 432660 1994 1152103 186425 251578 153141 1951471 1995 1139967 329441 207212 130664 1065855 1996 618125 226006 142185 125332 1498133 1997 664794 100211 107780 76909 1751775 1998 560509 93309 106153 70571 1004208 1999 445430 43997 116194 102826 242741 2000 337241 109209 63042 95095 1656166 2001 487622 152571 108464 67718 490376 2002 721872 77016 148600 86963 5115407 2003 856626 58622 166425 85385 854441 2004 951559 78092 141411 77122 167162
SEDAR 9 SAR1, Sect. III Gray Triggerfish Assessment Workshop
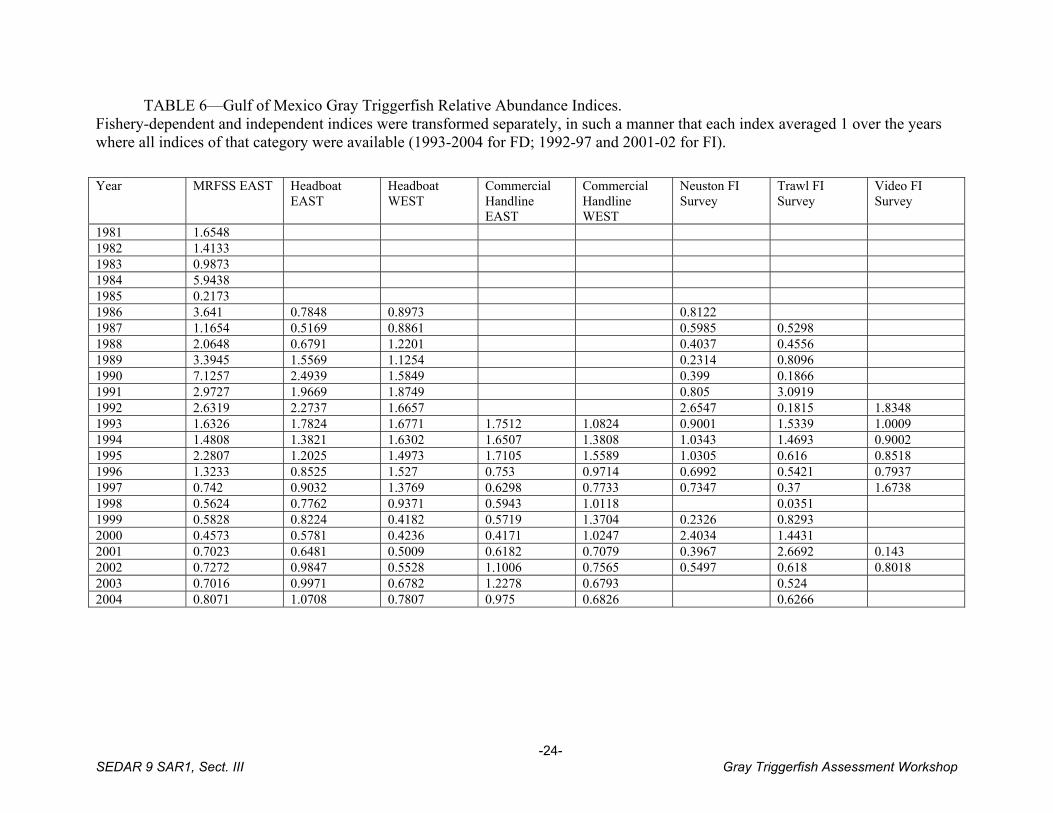
-24-
TABLE 6—Gulf of Mexico Gray Triggerfish Relative Abundance Indices. Fishery-dependent and independent indices were transformed separately, in such a manner that each index averaged 1 over the years where all indices of that category were available (1993-2004 for FD; 1992-97 and 2001-02 for FI). Year MRFSS EAST Headboat
EAST Headboat WEST
Commercial Handline EAST
Commercial Handline WEST
Neuston FI Survey
Trawl FI Survey
Video FI Survey
1981 1.6548 1982 1.4133 1983 0.9873 1984 5.9438 1985 0.2173 1986 3.641 0.7848 0.8973 0.8122 1987 1.1654 0.5169 0.8861 0.5985 0.5298 1988 2.0648 0.6791 1.2201 0.4037 0.4556 1989 3.3945 1.5569 1.1254 0.2314 0.8096 1990 7.1257 2.4939 1.5849 0.399 0.1866 1991 2.9727 1.9669 1.8749 0.805 3.0919 1992 2.6319 2.2737 1.6657 2.6547 0.1815 1.8348 1993 1.6326 1.7824 1.6771 1.7512 1.0824 0.9001 1.5339 1.0009 1994 1.4808 1.3821 1.6302 1.6507 1.3808 1.0343 1.4693 0.9002 1995 2.2807 1.2025 1.4973 1.7105 1.5589 1.0305 0.616 0.8518 1996 1.3233 0.8525 1.527 0.753 0.9714 0.6992 0.5421 0.7937 1997 0.742 0.9032 1.3769 0.6298 0.7733 0.7347 0.37 1.6738 1998 0.5624 0.7762 0.9371 0.5943 1.0118 0.0351 1999 0.5828 0.8224 0.4182 0.5719 1.3704 0.2326 0.8293 2000 0.4573 0.5781 0.4236 0.4171 1.0247 2.4034 1.4431 2001 0.7023 0.6481 0.5009 0.6182 0.7079 0.3967 2.6692 0.143 2002 0.7272 0.9847 0.5528 1.1006 0.7565 0.5497 0.618 0.8018 2003 0.7016 0.9971 0.6782 1.2278 0.6793 0.524 2004 0.8071 1.0708 0.7807 0.975 0.6826 0.6266
SEDAR 9 SAR1, Sect. III Gray Triggerfish Assessment Workshop

-25-
TABLE 7—Stock Recruitment α Runs. 292 data points, 170 estimated parameters, base run described in the text used an α value of 12 since the estimation procedure tended to inflate this number in the final estimate (median steepness was ~ 13).
α ~ 6 α ~ 9.33 Base α ~ 16 α ~ 36 Est α FIT Estimated params 170 170 170 170 170 170 Objective function 383.8 373.6 369.9 367 362.8 364.6 AIC 1108 1087 1080 1074 1066 1069 BENCHMARKS Alpha 8 11 13.5 17.4 37.1 70.9 Steepness 0.67 0.73 0.77 0.81 0.9 0.95 Max recr (m) 3.462 3.081 2.911 2.758 2.504 2.409 SSBVIRGIN (m) 12.118 10.782 10.188 9.652 8.764 8.433 SSBMSY (m) 3.083 2.447 2.158 1.881 1.36 1.117 SSB20%tSPR (m) 1.052 1.298 1.391 1.46 1.559 1.593 FMSY 0.273 0.332 0.372 0.424 0.594 0.74 F30%SPR 0.331 0.327 0.325 0.324 0.321 0.32 MSY (m) 1.846 1.848 1.861 1.887 1.988 2.067 CURRENTLY SSB2004 (m) 1.208 1.287 1.326 1.362 1.426 1.45 SSB2004/SSBMSY 0.39 0.53 0.61 0.72 1.05 1.3 SSB2004/SSB20%tSPR 1.15 0.99 0.95 0.93 0.91 0.91 F2004 0.561 0.545 0.537 0.531 0.52 0.515 F2004/FMSY 2.05 1.64 1.44 1.25 0.87 0.7 F2004/F30%SPR 1.69 1.67 1.65 1.64 1.62 1.61
TABLE 8—Sensitivity Runs. 292 data points, base run described in Table 3.
Base 1950 start M 0.25 M 0.3 No recr. devs
Lg recr devs
Eq effort devs
FIT Estimated params 170 170 170 170 146 170 170 Objective function 369.9 389.8 378.5 358.8 431.4 391.3 379.1 AIC 1080 1120 1097 1058 1155 1123 1098 BENCHMARKS Alpha 13.5 13.4 14 13.1 14.2 12.7 13.6 Steepness 0.77 0.77 0.78 0.77 0.78 0.76 0.77 Max recr (m) 2.911 3.061 2.867 3.03 3.366 1.798 2.969 SSBVIRGIN (m) 10.188 10.713 11.784 8.481 11.782 6.293 10.393 SSBMSY (m) 2.158 2.276 2.49 1.807 2.455 1.37 2.197 SSB20%tSPR (m) 1.391 1.456 1.629 1.136 1.646 0.829 1.418 FMSY 0.372 0.371 0.339 0.427 0.384 0.343 0.379 F30%SPR 0.325 0.326 0.294 0.378 0.327 0.313 0.33 MSY (m) 1.861 1.955 1.92 1.828 2.177 1.122 1.906 CURRENTLY SSB2004 (m) 1.326 1.359 1.257 1.436 1.779 1.486 1.437 SSB2004/SSBMSY 0.61 0.6 0.5 0.79 0.72 1.08 0.65 SSB2004/SSB20%tSPR 0.95 0.93 0.77 1.26 1.08 1.79 1.01 F2004 0.537 0.529 0.559 0.504 0.433 0.513 0.511 F2004/FMSY 1.44 1.43 1.65 1.18 1.13 1.5 1.35 F2004/F30%SPR 1.65 1.62 1.9 1.33 1.32 1.64 1.55
SEDAR 9 SAR1, Sect. III Gray Triggerfish Assessment Workshop

-26-
SEDAR 9 SAR1, Sect. III Gray Triggerfish Assessment Workshop

-27-
TABLE 9—Species Used in Meta-Analysis of α Parameter Values Adapted from Rose et al. (2001) using “periodic” species.
Species α
Pacific hake 1.9
bombay duck 2
chub mack 2.4
silver hake 2.7
southern bluefin 2.9
medit. Horse mack 3.5
walleye pollock 5
atlantic bluefin tuna 5.2
Gulf menhaden 5.3
bigeye tuna 5.3
European flounder 5.3
alewife 5.7
northern pike 6.1
black angler 6.7
yellowfin tuna 9.3
walleye 9.5
Blue whiting 10
atka mack 12
horse mack 12.1
Pacific sardine 12.7
haddock 13
yellowtail flounder 13
hake 18
pollock 18
shad 18.5
SEDAR 9 SAR1, Sect. III Gray Triggerfish Assessment Workshop

-28-
striped bass 18.6
Atl Herring 22.1
Atl. Menhaden 24.8
plaice 25.1
Atlantic cod 26
white croaker 26.1
sole 28.7
greenland halibut 29.3
swordfish 30.1
whiting 30.8
atlantic mack 31.8
blueback herring 31.9
Gulf of Mexico red snapper 47.8
new zealand snapper 65.6
scup 74.6
SEDAR 9 SAR1, Sect. III Gray Triggerfish Assessment Workshop
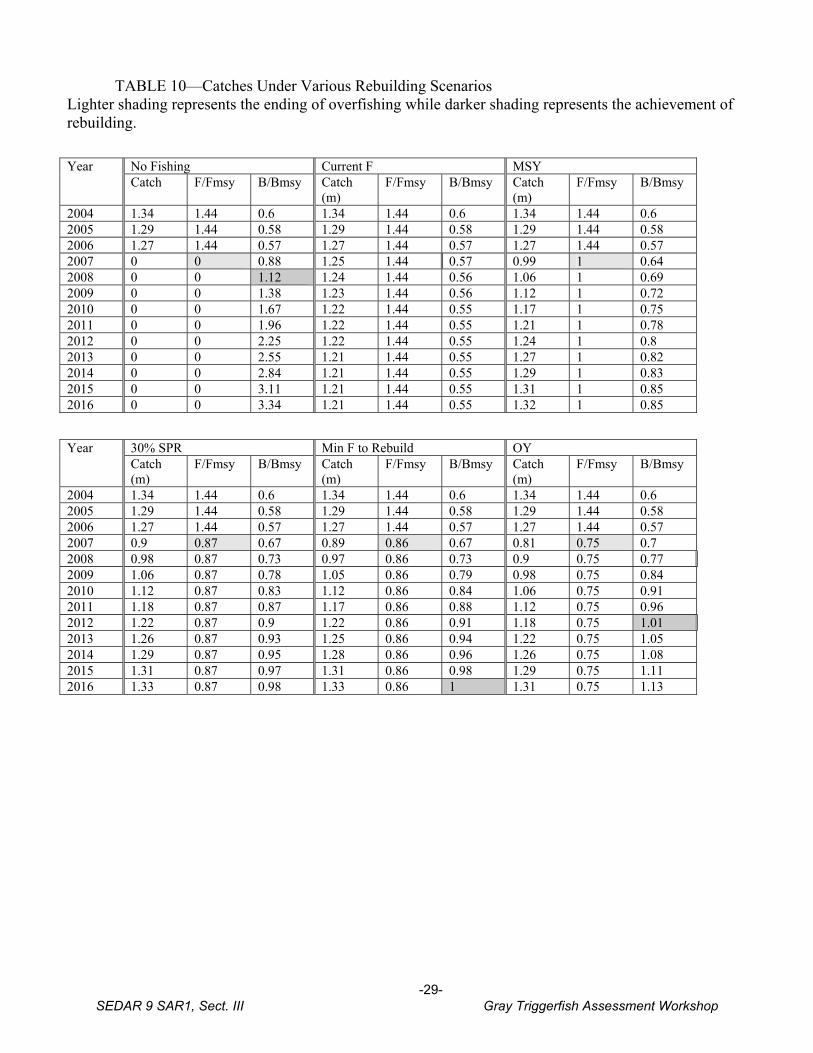
-29-
TABLE 10—Catches Under Various Rebuilding Scenarios Lighter shading represents the ending of overfishing while darker shading represents the achievement of rebuilding.
No Fishing Current F MSY Year Catch F/Fmsy B/Bmsy Catch
(m) F/Fmsy B/Bmsy Catch
(m) F/Fmsy B/Bmsy
2004 1.34 1.44 0.6 1.34 1.44 0.6 1.34 1.44 0.6 2005 1.29 1.44 0.58 1.29 1.44 0.58 1.29 1.44 0.58 2006 1.27 1.44 0.57 1.27 1.44 0.57 1.27 1.44 0.57 2007 0 0 0.88 1.25 1.44 0.57 0.99 1 0.64 2008 0 0 1.12 1.24 1.44 0.56 1.06 1 0.69 2009 0 0 1.38 1.23 1.44 0.56 1.12 1 0.72 2010 0 0 1.67 1.22 1.44 0.55 1.17 1 0.75 2011 0 0 1.96 1.22 1.44 0.55 1.21 1 0.78 2012 0 0 2.25 1.22 1.44 0.55 1.24 1 0.8 2013 0 0 2.55 1.21 1.44 0.55 1.27 1 0.82 2014 0 0 2.84 1.21 1.44 0.55 1.29 1 0.83 2015 0 0 3.11 1.21 1.44 0.55 1.31 1 0.85 2016 0 0 3.34 1.21 1.44 0.55 1.32 1 0.85
30% SPR Min F to Rebuild OY Year Catch (m)
F/Fmsy B/Bmsy Catch (m)
F/Fmsy B/Bmsy Catch (m)
F/Fmsy B/Bmsy
2004 1.34 1.44 0.6 1.34 1.44 0.6 1.34 1.44 0.6 2005 1.29 1.44 0.58 1.29 1.44 0.58 1.29 1.44 0.58 2006 1.27 1.44 0.57 1.27 1.44 0.57 1.27 1.44 0.57 2007 0.9 0.87 0.67 0.89 0.86 0.67 0.81 0.75 0.7 2008 0.98 0.87 0.73 0.97 0.86 0.73 0.9 0.75 0.77 2009 1.06 0.87 0.78 1.05 0.86 0.79 0.98 0.75 0.84 2010 1.12 0.87 0.83 1.12 0.86 0.84 1.06 0.75 0.91 2011 1.18 0.87 0.87 1.17 0.86 0.88 1.12 0.75 0.96 2012 1.22 0.87 0.9 1.22 0.86 0.91 1.18 0.75 1.01 2013 1.26 0.87 0.93 1.25 0.86 0.94 1.22 0.75 1.05 2014 1.29 0.87 0.95 1.28 0.86 0.96 1.26 0.75 1.08 2015 1.31 0.87 0.97 1.31 0.86 0.98 1.29 0.75 1.11 2016 1.33 0.87 0.98 1.33 0.86 1 1.31 0.75 1.13
SEDAR 9 SAR1, Sect. III Gray Triggerfish Assessment Workshop

7. Figures
Harvest of Gray Triggerfish in the GOM
-
1
1
2
2
319
63
1966
1969
1972
1975
1978
1981
1984
1987
1990
1993
1996
1999
2002
Year
Mill
ions
of P
ound
s MRFSSCommercialHeadboat
Fig. 1—Gulf of Mexico Gray Triggerfish Catches By Fleet
Values stacked to demonstrate trends in cumulative landings. Note: MRFSS survey began in 1981, and Headboat Survey (HB) began in 1984.(from SEDAR9-AW-08)
-30- SEDAR 9 SAR1, Sect. III Gray Triggerfish Assessment Workshop

FIG. 2—Gulf of Mexico Gray Triggerfish Indices of Abundance
(a) Fishery-independent and (b) fishery-dependent indices of abundance. Normalized across the years where all indices were calculated (1992-97, 2001-02 for FI; 1993-2004 for FD).
-31- SEDAR 9 SAR1, Sect. III Gray Triggerfish Assessment Workshop
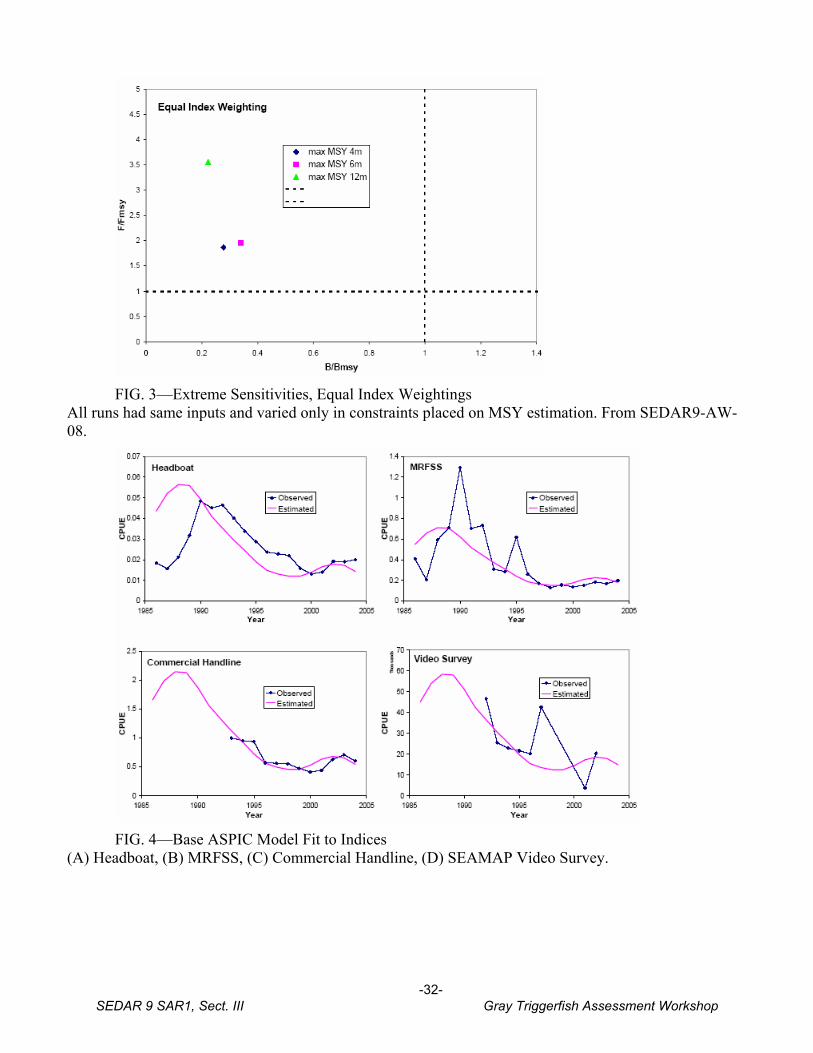
FIG. 3—Extreme Sensitivities, Equal Index Weightings
All runs had same inputs and varied only in constraints placed on MSY estimation. From SEDAR9-AW-08.
FIG. 4—Base ASPIC Model Fit to Indices
(A) Headboat, (B) MRFSS, (C) Commercial Handline, (D) SEAMAP Video Survey.
-32- SEDAR 9 SAR1, Sect. III Gray Triggerfish Assessment Workshop

FIG. 5—Status Trajectories of ASPIC Base Model
FIG. 6—Continued Extreme Sensitivities, Minimal Weightings on Larval and Trawl Indices
All runs had same inputs and varied only in constraints placed on MSY or in the starting point used for the estimation procedure. From SEDAR9-AW-08.
-33- SEDAR 9 SAR1, Sect. III Gray Triggerfish Assessment Workshop

Continuity Case (FD only, 1990-2004)
0
0.5
1
1.5
2
2.5
3
3.5
4
4.5
5
0 0.2 0.4 0.6 0.8 1 1.2
B/Bmsy
F/Fm
sy
1.4
Basemax MSY 4mBo ratio 0.25MSY 2.1mK 5xMSY
FIG. 7—Less Sensitive, Continuity Case
Similar figure as Figs. 5 and 6, but restricting analysis to fishery-dependent indices and years 1990-2004 increased stability.
-34- SEDAR 9 SAR1, Sect. III Gray Triggerfish Assessment Workshop

0
0.5
1
1.5
2
2.5
1960 1965 1970 1975 1980 1985 1990 1995 2000 2005
Mill
ions
Year
Dire
cted
Cat
ches
(lbs
)
0
1
2
3
4
5
6
Mill
ions
Shrimp B
ycatch (Age-1 equiv)
Rec-ERec-WComm-EComm-WShrimp
FIG. 8—Gulf of Mexico Gray Triggerfish Catches By Fleet and Region
Directed catches are reported in pounds, while shrimp bycatch is reported in age-1 equivalent fish (described in text).
-35- SEDAR 9 SAR1, Sect. III Gray Triggerfish Assessment Workshop
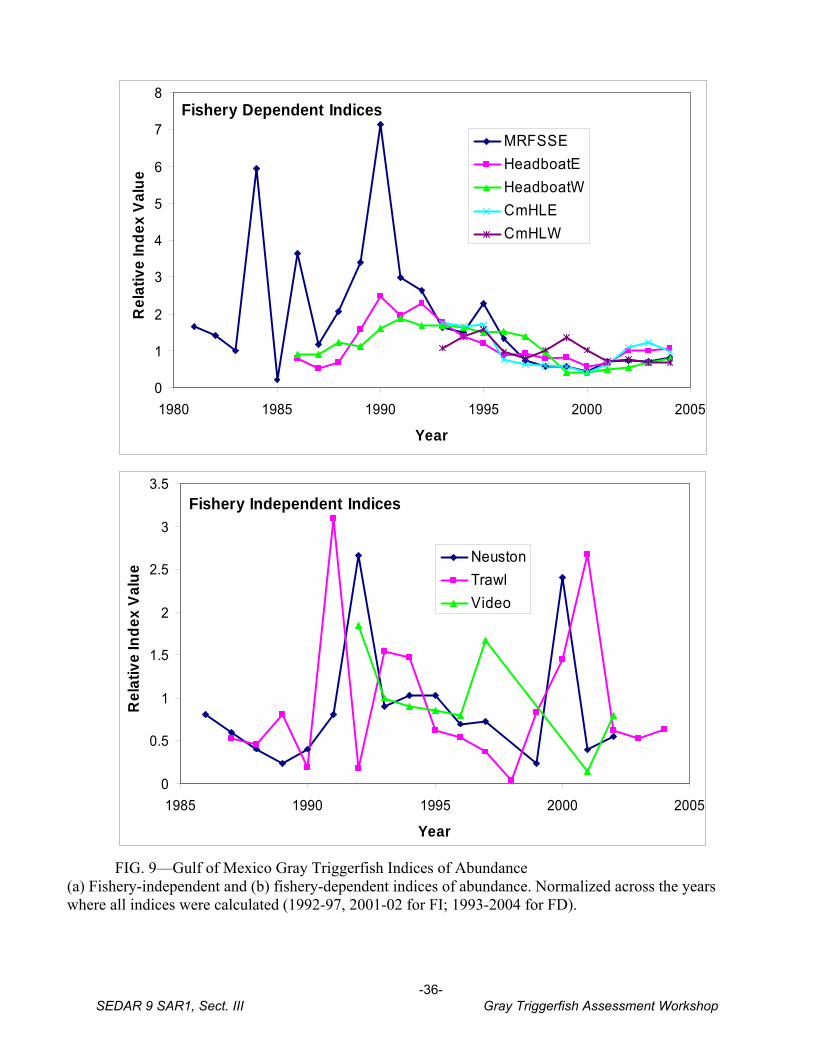
Fishery Dependent Indices
0
1
2
3
4
5
6
7
8
1980 1985 1990 1995 2000 2005
Year
Rel
ativ
e In
dex
Valu
eMRFSSEHeadboatEHeadboatWCmHLECmHLW
Fishery Independent Indices
0
0.5
1
1.5
2
2.5
3
3.5
1985 1990 1995 2000 2005
Year
Rel
ativ
e In
dex
Valu
e
NeustonTrawlVideo
FIG. 9—Gulf of Mexico Gray Triggerfish Indices of Abundance
(a) Fishery-independent and (b) fishery-dependent indices of abundance. Normalized across the years where all indices were calculated (1992-97, 2001-02 for FI; 1993-2004 for FD).
-36- SEDAR 9 SAR1, Sect. III Gray Triggerfish Assessment Workshop
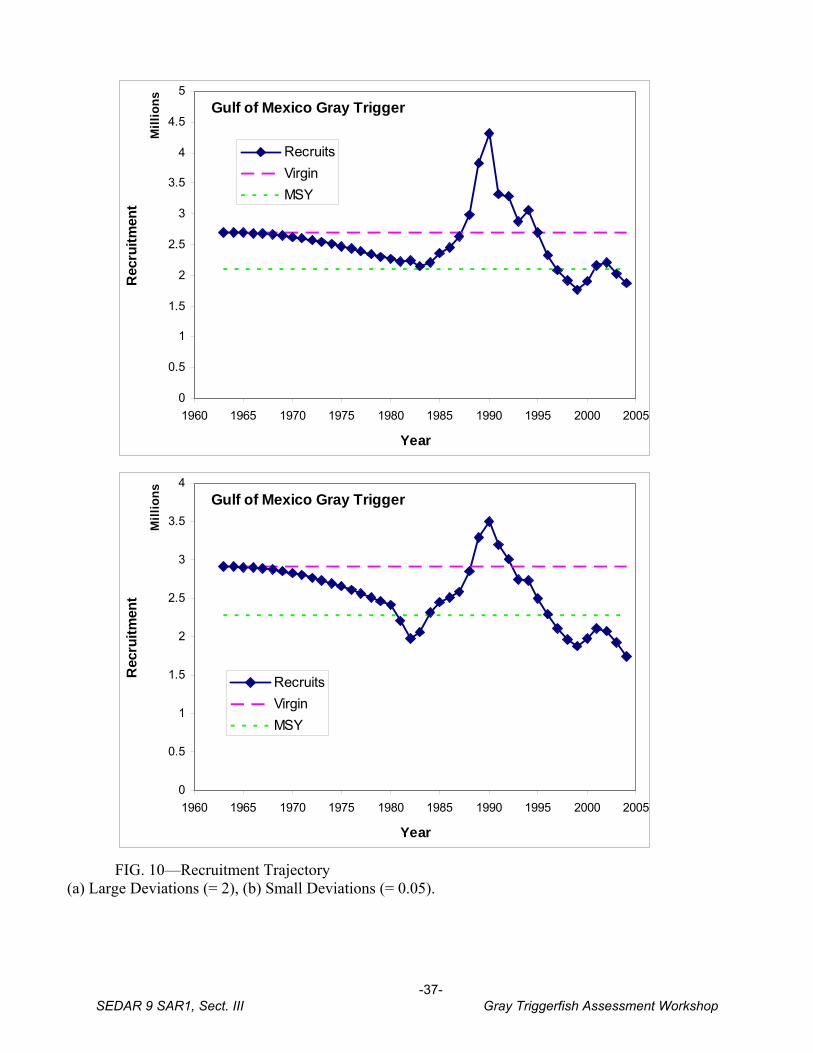
Gulf of Mexico Gray Trigger
0
0.5
1
1.5
2
2.5
3
3.5
4
4.5
5
1960 1965 1970 1975 1980 1985 1990 1995 2000 2005
Mill
ions
Year
Rec
ruitm
ent
RecruitsVirginMSY
Gulf of Mexico Gray Trigger
0
0.5
1
1.5
2
2.5
3
3.5
4
1960 1965 1970 1975 1980 1985 1990 1995 2000 2005
Mill
ions
Year
Rec
ruitm
ent
RecruitsVirginMSY
FIG. 10—Recruitment Trajectory
(a) Large Deviations (= 2), (b) Small Deviations (= 0.05).
-37- SEDAR 9 SAR1, Sect. III Gray Triggerfish Assessment Workshop

Estimated
0
50000
100000
150000
200000
250000
1960 1970 1980 1990 2000 2010
Year
Effo
rt
EastWest
Modeled
0
0.1
0.2
0.3
0.4
0.5
0.6
1960 1970 1980 1990 2000 2010
Year
Effo
rt
20% CV50% CV
FIG. 11—Shrimp Effort Deviations
(a) Estimated values, (b) modeled values.
-38- SEDAR 9 SAR1, Sect. III Gray Triggerfish Assessment Workshop

Rec-E
0
0.5
1
1.5
2
2.5
1960 1965 1970 1975 1980 1985 1990 1995 2000 2005
Mill
ions
Year
Catc
h
0
0.05
0.1
0.15
0.2
0.25
0.3
0.35
0.4
0.45
Effo
rt
ObsPredEffort
Rec-W
0
0.1
0.2
0.3
0.4
0.5
0.6
0.7
0.8
0.9
1960 1965 1970 1975 1980 1985 1990 1995 2000 2005
Mill
ions
Year
Catc
h
0
0.1
0.2
0.3
0.4
0.5
0.6
Effo
rt
ObsPredEffort
Comm-E
0
0.05
0.1
0.15
0.2
0.25
0.3
0.35
0.4
0.45
1960 1965 1970 1975 1980 1985 1990 1995 2000 2005
Mill
ions
Year
Catc
h
0
0.01
0.02
0.03
0.04
0.05
0.06
0.07
Effo
rt
ObsPredEffort
Comm-W
0
0.02
0.04
0.06
0.08
0.1
0.12
0.14
0.16
0.18
0.2
1960 1965 1970 1975 1980 1985 1990 1995 2000 2005
Mill
ions
Year
Catc
h
0
0.02
0.04
0.06
0.08
0.1
0.12
0.14
0.16
Effo
rt
ObsPredEffort
Shrimp
0
1
2
3
4
5
6
1960 1965 1970 1975 1980 1985 1990 1995 2000 2005
Mill
ions
Year
Catc
h
0
0.05
0.1
0.15
0.2
0.25
0.3
0.35
0.4
Effo
rt
ObsPredEffort
FIG. 12—Base Run Catch Fits
-39- SEDAR 9 SAR1, Sect. III Gray Triggerfish Assessment Workshop

MRFSS-E
0
50
100
150
200
250
300
1980 1985 1990 1995 2000 2005
Mill
ions
Year
Inde
x
ObsPred
HB-W
0
1
2
3
4
5
6
1980 1985 1990 1995 2000 2005
Mill
ions
Year
Inde
x
ObsPred
HB-E
0
1
2
3
4
5
6
1980 1985 1990 1995 2000 2005
Mill
ions
Year
Inde
x
ObsPred
CmHL-W
0
10
20
30
40
50
60
70
80
90
1980 1985 1990 1995 2000 2005
Mill
ions
Year
Inde
x
ObsPred
CmHL-E
0
20
40
60
80
100
120
140
160
180
1980 1985 1990 1995 2000 2005
Mill
ions
Year
Inde
x
ObsPred
Neuston
0
10
20
30
40
50
60
70
80
90
100
1980 1985 1990 1995 2000 2005
Mill
ions
Year
Inde
x
ObsPred
Trawl
0
200
400
600
800
1000
1200
1400
1980 1985 1990 1995 2000 2005
Mill
ions
Year
Inde
x
ObsPred
Video
0
10
20
30
40
50
60
70
80
1980 1985 1990 1995 2000 2005
Mill
ions
Year
Inde
x
ObsPred
FIG. 13—Base Run Index Fits
-40- SEDAR 9 SAR1, Sect. III Gray Triggerfish Assessment Workshop

Constrained Recruitment Deviations
0
0.5
1
1.5
2
2.5
3
3.5
4
0 0.5 1 1.5 2 2.5 3 3.5 4
Mill
ions
Millions
Spawners
Rec
ruits
ObservedExpected
Ro = 7.0e6stp = 0.65
No Constraints on Recruitment Deviations
0
1
2
3
4
5
6
0 0.5 1 1.5 2 2.5 3 3.5
Mill
ions
Millions
Spawners
Rec
ruits
4
ObservedExpected
Ro = 8.4e10stp = 0.2
FIG. 14—Gray Triggerfish Stock Recruitment Relationships.
All based on recruitment patterns since 1986. (a) Base run with constraints on recruitment deviations as described in the text. (b) No constraints on the size of recruitment deviations.
-41- SEDAR 9 SAR1, Sect. III Gray Triggerfish Assessment Workshop

No Recruitment Deviations
0
0.5
1
1.5
2
2.5
3
0 0.5 1 1.5 2 2.5
Mill
ions
Millions
Spawners
Rec
ruits
3
ObservedExpected
Ro = 2.7e6stp = 0.976
FIG. 14 (cont.)—Gray Triggerfish Stock Recruitment Relationships Under Various Scenarios.
All based on recruitment patterns since 1986. (c) No recruitment deviations allowed.
-42- SEDAR 9 SAR1, Sect. III Gray Triggerfish Assessment Workshop

Gulf of Mexico Gray Triggerfish Status
α = 6Est α
0
0.5
1
1.5
2
2.5
0 0.5 1 1
SSB/SSB20%
F/F3
0%
.5
Neither
Overfishing
Overfished
Both
Gulf of Mexico Gray Triggerfish Status
M 0.25
M 0.3
Base1950 start
No recr. devs
Lg recr devsEq effort devs
0
0.5
1
1.5
2
2.5
0 0.5 1 1.5
SSB/SSB20%
F/F3
0%
2
Neither
Overfishing
Overfished
Both
FIG. 15—Gray Triggerfish Status Relative to SPR
(a) Across steepness values; (b) across sensitivity trials.
-43- SEDAR 9 SAR1, Sect. III Gray Triggerfish Assessment Workshop

Gulf of Mexico Gray Triggerfish Status
α = 16Base
α = 6
α = 9.33
α = 36
Est α
0
0.5
1
1.5
2
2.5
0 0.5 1 1
SSB/SSBmsy
F/Fm
s
.5
y
Neither
Overfishing
Overfished
Both
Gulf of Mexico Gray Triggerfish Status
M 0.25
M 0.3
Base1950 start
No recr. devs
Lg recr devs
Eq effort devs
0
0.5
1
1.5
2
0 0.5 1 1
SSB/SSBmsy
F/Fm
s
.5
y
Neither
Overfishing
Overfished
Both
FIG. 16—Gray Triggerfish Status Relative to MSY
(a) Across steepness values; (b) across sensitivity trials.
-44- SEDAR 9 SAR1, Sect. III Gray Triggerfish Assessment Workshop

Gulf of Mexico Gray Trigger
0
2
4
6
8
10
12
1960 1965 1970 1975 1980 1985 1990 1995 2000 2005
Mill
ions
Year
Spaw
ning
Sto
ck B
iom
ass
SSBVirginMSY
Gulf of Mexico Gray Trigger
0
0.1
0.2
0.3
0.4
0.5
0.6
0.7
0.8
1960 1965 1970 1975 1980 1985 1990 1995 2000 2005
Year
Fish
ing
Mor
talit
y R
ate
FMSY
FIG. 17—Gray Triggerfish Status in 2004
(a) Spawning stock biomass (overfished); (b) Fishing mortality rate (overfishing).
-45- SEDAR 9 SAR1, Sect. III Gray Triggerfish Assessment Workshop

Gray Triggerfish
0
0.1
0.2
0.3
0.4
0.5
0.6
2004 2006 2008 2010 2012 2014 2016
Year
Fish
ing
Mor
talit
y R
ate
FFmsyF30%
Gray Triggerfish
0
0.5
1
1.5
2
2.5
3
2004 2006 2008 2010 2012 2014 2016
Mill
ions
Year
Spaw
ning
Sto
ck B
iom
ass
SSBSSBmsySSB20%
Gray Triggerfish
0
0.5
1
1.5
2
2004 2006 2008 2010 2012 2014 2016
Mill
ions
Year
Cat
ch
CatchMSY
FIG. 18—Projections Under No Fishing
(a) Spawning stock biomass; (b) Allowable catch; (c) Fishing mortality rate.
-46- SEDAR 9 SAR1, Sect. III Gray Triggerfish Assessment Workshop
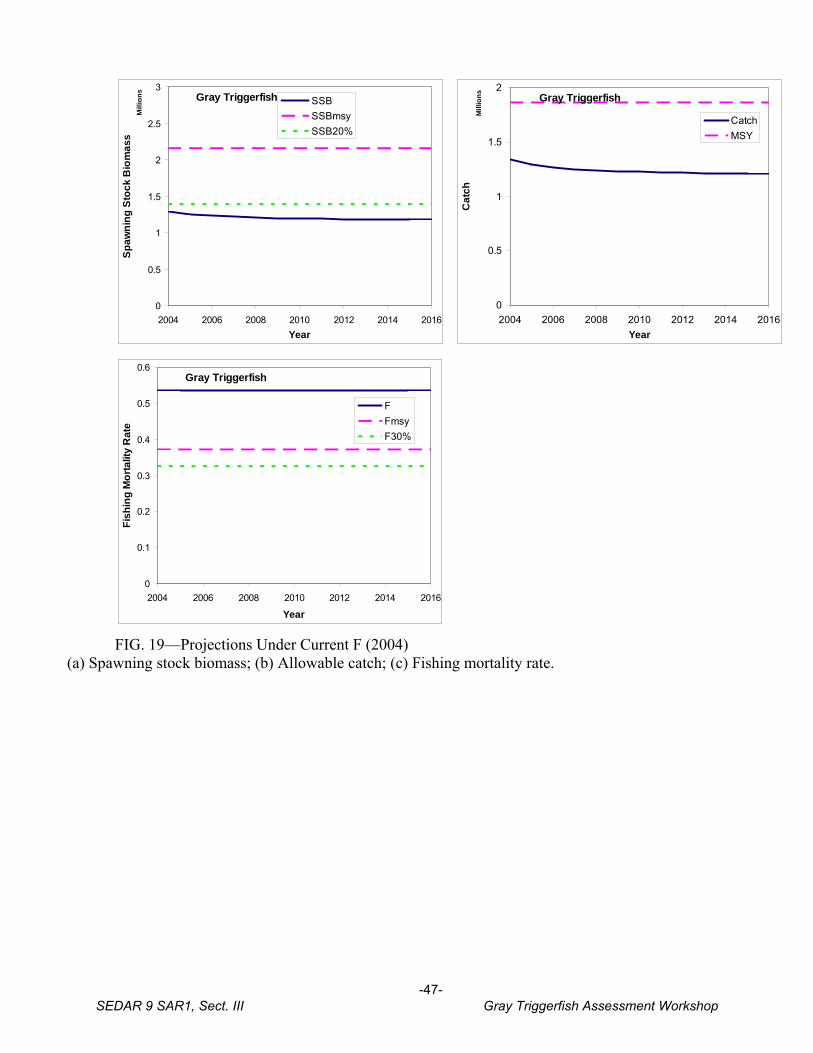
Gray Triggerfish
0
0.1
0.2
0.3
0.4
0.5
0.6
2004 2006 2008 2010 2012 2014 2016
Year
Fish
ing
Mor
talit
y R
ate
FFmsyF30%
Gray Triggerfish
0
0.5
1
1.5
2
2.5
3
2004 2006 2008 2010 2012 2014 2016
Mill
ions
Year
Spaw
ning
Sto
ck B
iom
ass
SSBSSBmsySSB20%
Gray Triggerfish
0
0.5
1
1.5
2
2004 2006 2008 2010 2012 2014 2016
Mill
ions
Year
Cat
ch
CatchMSY
FIG. 19—Projections Under Current F (2004)
(a) Spawning stock biomass; (b) Allowable catch; (c) Fishing mortality rate.
-47- SEDAR 9 SAR1, Sect. III Gray Triggerfish Assessment Workshop

Gray Triggerfish
0
0.1
0.2
0.3
0.4
0.5
0.6
2004 2006 2008 2010 2012 2014 2016
Year
Fish
ing
Mor
talit
y R
ate
FFmsyF30%
Gray Triggerfish
0
0.5
1
1.5
2
2.5
3
2004 2006 2008 2010 2012 2014 2016
Mill
ions
Year
Spaw
ning
Sto
ck B
iom
ass
SSBSSBmsySSB20%
Gray Triggerfish
0
0.5
1
1.5
2
2004 2006 2008 2010 2012 2014 2016
Mill
ions
Year
Cat
ch
CatchMSY
FIG. 20—Projections Under FMSY
(a) Spawning stock biomass; (b) Allowable catch; (c) Fishing mortality rate.
-48- SEDAR 9 SAR1, Sect. III Gray Triggerfish Assessment Workshop

Gray Triggerfish
0
0.1
0.2
0.3
0.4
0.5
0.6
2004 2006 2008 2010 2012 2014 2016
Year
Fish
ing
Mor
talit
y R
ate
FFmsyF30%
Gray Triggerfish
0
0.5
1
1.5
2
2.5
3
2004 2006 2008 2010 2012 2014 2016
Mill
ions
Year
Spaw
ning
Sto
ck B
iom
ass
SSBSSBmsySSB20%
Gray Triggerfish
0
0.5
1
1.5
2
2004 2006 2008 2010 2012 2014 2016
Mill
ions
Year
Cat
ch
CatchMSY
FIG. 21—Projections Under F30%SPR
(a) Spawning stock biomass; (b) Allowable catch; (c) Fishing mortality rate.
-49- SEDAR 9 SAR1, Sect. III Gray Triggerfish Assessment Workshop

Gray Triggerfish
0
0.1
0.2
0.3
0.4
0.5
0.6
2004 2006 2008 2010 2012 2014 2016
Year
Fish
ing
Mor
talit
y R
ate
FFmsyF30%
Gray Triggerfish
0
0.5
1
1.5
2
2.5
3
2004 2006 2008 2010 2012 2014 2016
Mill
ions
Year
Spaw
ning
Sto
ck B
iom
ass
SSBSSBmsySSB20%
Gray Triggerfish
0
0.5
1
1.5
2
2004 2006 2008 2010 2012 2014 2016
Mill
ions
Year
Cat
ch
CatchMSY
FIG. 22—Projections Under Minimum F Required to Rebuild by 2016
(a) Spawning stock biomass; (b) Allowable catch; (c) Fishing mortality rate.
-50- SEDAR 9 SAR1, Sect. III Gray Triggerfish Assessment Workshop
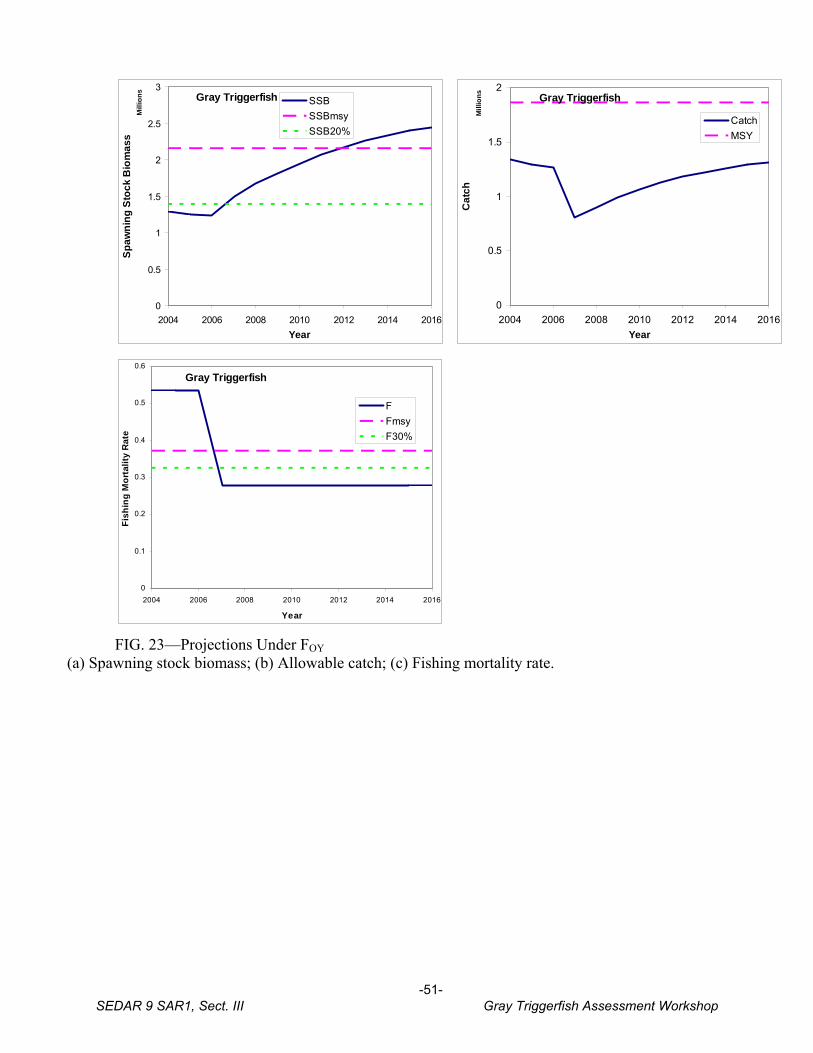
Gray Triggerfish
0
0.1
0.2
0.3
0.4
0.5
0.6
2004 2006 2008 2010 2012 2014 2016
Year
Fish
ing
Mor
talit
y R
ate
FFmsyF30%
Gray Triggerfish
0
0.5
1
1.5
2
2.5
3
2004 2006 2008 2010 2012 2014 2016
Mill
ions
Year
Spaw
ning
Sto
ck B
iom
ass
SSBSSBmsySSB20%
Gray Triggerfish
0
0.5
1
1.5
2
2004 2006 2008 2010 2012 2014 2016
Mill
ions
Year
Cat
ch
CatchMSY
FIG. 23—Projections Under FOY
(a) Spawning stock biomass; (b) Allowable catch; (c) Fishing mortality rate.
-51- SEDAR 9 SAR1, Sect. III Gray Triggerfish Assessment Workshop


SEDAR
SouthEast Data, Assessment, and Review
Gulf of Mexico Gray Triggerfish
SEDAR 9 Stock Assessment Report 1
SECTION 4. Review Workshop


Contents
1. Review Panel Consensus Report 2. Review Panel Advisory Report


Consensus Summary Report Gulf of Mexico Gray Triggerfish (Balistes capriscus) Prepared by the SEDAR 9 Review Panel Edited by M. Elizabeth Clarke for SEDAR 9, March 27- 31, 2006 New Orleans, Louisiana
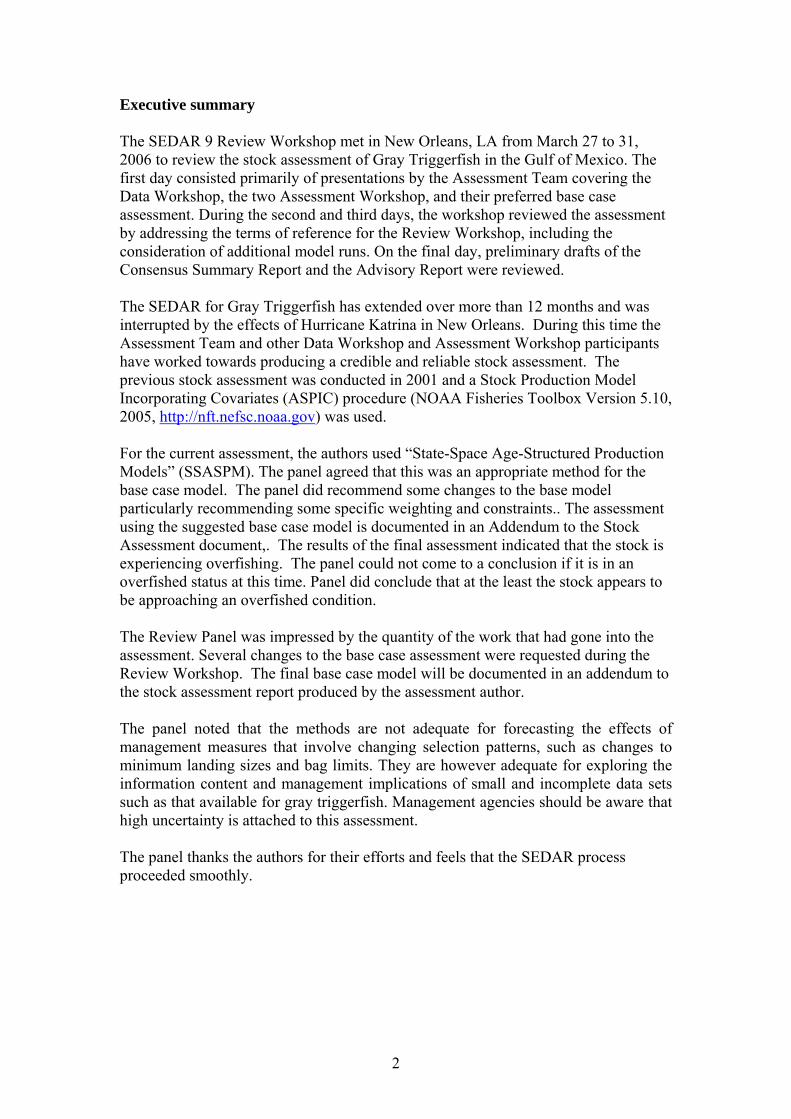
Executive summary The SEDAR 9 Review Workshop met in New Orleans, LA from March 27 to 31, 2006 to review the stock assessment of Gray Triggerfish in the Gulf of Mexico. The first day consisted primarily of presentations by the Assessment Team covering the Data Workshop, the two Assessment Workshop, and their preferred base case assessment. During the second and third days, the workshop reviewed the assessment by addressing the terms of reference for the Review Workshop, including the consideration of additional model runs. On the final day, preliminary drafts of the Consensus Summary Report and the Advisory Report were reviewed. The SEDAR for Gray Triggerfish has extended over more than 12 months and was interrupted by the effects of Hurricane Katrina in New Orleans. During this time the Assessment Team and other Data Workshop and Assessment Workshop participants have worked towards producing a credible and reliable stock assessment. The previous stock assessment was conducted in 2001 and a Stock Production Model Incorporating Covariates (ASPIC) procedure (NOAA Fisheries Toolbox Version 5.10, 2005, http://nft.nefsc.noaa.gov) was used. For the current assessment, the authors used “State-Space Age-Structured Production Models” (SSASPM). The panel agreed that this was an appropriate method for the base case model. The panel did recommend some changes to the base model particularly recommending some specific weighting and constraints.. The assessment using the suggested base case model is documented in an Addendum to the Stock Assessment document,. The results of the final assessment indicated that the stock is experiencing overfishing. The panel could not come to a conclusion if it is in an overfished status at this time. Panel did conclude that at the least the stock appears to be approaching an overfished condition. The Review Panel was impressed by the quantity of the work that had gone into the assessment. Several changes to the base case assessment were requested during the Review Workshop. The final base case model will be documented in an addendum to the stock assessment report produced by the assessment author. The panel noted that the methods are not adequate for forecasting the effects of management measures that involve changing selection patterns, such as changes to minimum landing sizes and bag limits. They are however adequate for exploring the information content and management implications of small and incomplete data sets such as that available for gray triggerfish. Management agencies should be aware that high uncertainty is attached to this assessment. The panel thanks the authors for their efforts and feels that the SEDAR process proceeded smoothly.
2

1. Introduction 1.1 Time and Place The SEDAR 9 Review Workshop met in New Orleans, Louisiana, from 27 to 31 March 2006. 1.2 Terms of Reference for the Review Workshop
1. Evaluate the adequacy, appropriateness, and application of data used in the assessment.
2. Evaluate the adequacy, appropriateness, and application of methods used to assess the stocks.
3. Recommend appropriate estimates of stock abundance, biomass, and exploitation.
4. Evaluate the methods used to estimate population benchmarks and management parameters (e.g., MSY, Fmsy, Bmsy, MSST, MFMT, or their proxies); provide estimated values for management benchmarks, a range of ABC, and declarations of stock status.
5. Evaluate the adequacy, appropriateness, and application of the methods used to project future population status; recommend appropriate estimates of future stock condition (e.g., exploitation, abundance, biomass).
6. Evaluate the adequacy, appropriateness, and application of methods used to characterize uncertainty in estimated parameters. Provide measures of uncertainty for estimated parameters. Ensure the implications of uncertainty in technical conclusions are clearly stated.
7. Ensure that stock assessment results are clearly and accurately presented in the Stock Assessment Report and that reported results are consistent with Review Panel recommendations. (In the event corrections are made in the assessment, alternative model configurations are recommended, or additional analyses are prepared as a result of review panel findings regarding the TORs above, ensure that corrected estimates are provided by addenda to the assessment report)
8. Evaluate the performance of the Data and Assessment Workshops with regard to their respective Terms of Reference; state whether or not the Terms of Reference for those previous workshops were met and are adequately addressed in the Stock Assessment Report.
9. Review research recommendations provided by the Data and Assessment workshops and make any additional recommendations warranted. Clearly indicate the research and monitoring needs that may appreciably improve the reliability of future assessments.
10. Prepare a Peer Review Consensus Summary summarizing the Panel’s evaluation of the stock assessment and addressing each Term of Reference. Prepare an Advisory Report summarizing key assessment results. (Reports to be drafted by the Panel during the review workshop with a final report due two weeks after the workshop ends.)
3

1.3 List of Participants
Participants Affiliation
Panel Chair:
M. Elizabeth Clarke NOAA Fisheries/NWFSC
Review Panel:
Haddon, Malcolm CIE Reviewer Patterson, Kenneth CIE Reviewer Chen, Din CIE Reviewer Presenters:
Craig Brown NMFS/SEFSC Miami Shannon Cass-Calay NMFS/SEFSC Miami Guillermo Diaz NMFS/SEFSC Miami Josh Sladek Nowlis NMFS/SEFSC Miami Steve Turner NMFS/SEFSC Miami Jerry Scott ` SEFSC Observers:
Chris Dorsett The Ocean Conservancy/GMFMC AP
Myron Fischer GMFMC Mike Nugent GMFMC AP Andy Strelcheck NMFS/SERO Wayne Werner GMFMC AP Joseph Powers NMFS/SEFSC Miami Staff support:
John Carmichael SEDAR Dawn Aring GMFMC Staff Patrick Gilles NMFS/SEFSC Miami Stu Kennedy GMFMC Staff Joseph Powers NMFS/SEFSC Miami Jerry Scott ` SEFSC
4

1.4 Review Workshop Documents The following documents were available to the Review Panel during SEDAR 9.
Document # Title Authors
Documents Prepared for the Data Workshop
SEDAR9-DW1
History of vermillion snapper, greater amberjack, and gray triggerfish management in Federal waters of the US Gulf of Mexico, 1984-2005
Hood, P.
SEDAR9-DW2 Vermillion Snapper Otolith Aging: 2001-2004 Data Summary
Allman, R J., J. A. Tunnell. B. K. Barnett
SEDAR9-DW3 Reproduction of vermillion snapper from the Northern and Eastern Gulf of Mexico, 1991-2002.
Collins, L. A., R. J. Allman, and H. M Lyon
SEDAR9-DW4 Standardized catch rate indices for vermilion snapper landed by the US recreational fishery in the Gulf of Mexico, 1986-2004
Cass-Calay, S. L.
SEDAR9-DW5
Standardized catch rate indices for vermilion snapper landed by the US commercial handline fishery in the Gulf of Mexico, 1990-2004
McCarthy, Kevin J., and Shannon L. Cass-Calay
SEDAR9-DW6 Standardized catch rates of vermilion snapper from the US headboat fishery in the Gulf of Mexico, 1986-2004
Brown, Craig A.
SEDAR9-DW7 Estimated Gulf of Mexico greater amberjack recreational landings (MRFSS, Headboat, TXPW) for 1981-2004
Diaz, Guillermo
SEDAR9-DW8
Size frequency distribution of greater amberjack from dockside sampling of recreational landings in the Gulf of Mexico 1986-2003
Diaz, Guillermo
SEDAR9-DW9
Size frequency distribution of greater amberjack from dockside sampling of commercial landings in the Gulf of Mexico 1986-2003
Diaz, Guillermo
SEDAR9-DW10
Standardized catch rates of gulf of Mexico greater amberjack for the commercial longline and handline fishery 1990-2004
Diaz, Guillermo
SEDAR9-DW11
Length Frequency Analysis and Calculated Catch at Age Estimations for Commercially Landed Gray Triggerfish (Balistes capriscus) From the Gulf of Mexico
Saul, Steven
SEDAR9-DW12
Estimated Gray Triggerfish (Balistes capriscus) Landings From the Gulf of Mexico Headboat Fishery
Saul, Steven
5

SEDAR9-DW13
Estimated Gray Triggerfish (Balistes capriscus) Commercial Landings and Price Information for the Gulf of Mexico Fishery
Saul, Steven
SEDAR9-DW14
Estimated Gray Triggerfish (Balistes capriscus) Recreational Landings for the State of Texas
Saul, Steven
SEDAR9-DW15
Estimated Gray Triggerfish (Balistes capriscus) Landings From the Marine Recreational Fishery Statistics Survey (MRFSS) In the Gulf of Mexico
Saul, Steven, and Patty Phares
SEDAR9-DW16
Length Frequency Analysis for the Gray Triggerfish (Balistes capriscus) Recreational Fishery In the Gulf of Mexico
Saul, Steven
SEDAR9-DW17
Estimates of Vermilion Snapper, Greater Amberjack, and Gray Triggerfish Discards by Vessels with Federal Permits in the Gulf of Mexico
McCarthy, Kevin J.
SEDAR9-DW18
Size Composition Data from the SEAMAP Trawl Surveys Nichols, Scott
SEDAR9-DW19
Species Composition of the various amberjack species in the Gulf of Mexico Chih, Ching-Ping
SEDAR9-DW20
Standardized Catch rates of Gulf of Mexico greater amberjack catch rates for the recreational fishery (MRFSS, Headboat) 1981-2004
Diaz, Guillermo
SEDAR9-DW21
SEAMAP Reef Fish Survey of Offshore Banks: Yearly indices of Abundance for Vermilion Snapper, Greater Amberjack, and Gray Triggerfish
Gledhill, et. al.
SEDAR9-DW22
Data Summary of Gray Triggerfish (Balistes capriscus),Vermilion Snapper (Rhomboplites aurorubens), and Greater Amberjack (Seriola dumerili) Collected During Small Pelagic Trawl Surveys, 1988 – 1996
Ingram, Jr., G. Walter
SEDAR9-DW23
Abundance Indices of Gray Triggerfish and Vermilion Snapper Collected in Summer and Fall SEAMAP Groundfish Surveys (1987 – 2004)
Ingram, Jr., G. Walter
SEDAR9-DW24
Review of the Early Life History of Vermilion Snapper, Rhomboplites auroubens, With a Summary of Data from SEAMAP plankton surveys in the Gulf of Mexico: 1982 – 2002
Lyczkowski-Shultz, J. and Hanisko, D.
SEDAR9-DW25
Review of the early life history of gray triggerfish, Balistes capriscus, with a summary of data from SEAMAP plankton surveys in the Gulf of Mexico: 1982, 1984 – 2002
Lyczkowski-Shultz, J., Hanisko, D. and Zapfe, G.
SEDAR9-DW26
Shrimp Fleet Bycatch Estimates for the SEDAR9 Species Nichols, Scott
6

SEDAR9-DW27
SEAMAP Trawl Indexes for the SEDAR9 Species Nichols, Scott
SEDAR9-DW-28
Standardized Abundance Indices for Gulf of Mexico Gray Triggerfish (Balistes capriscus) based on catch rates as measured by the Marine Recreational Fisheries Statistics Survey (MRFSS)
Nowlis, Josh Sladek
SEDAR9-DW-29
Standardized Abundance Indices for Gulf of Mexico Gray Triggerfish (Balistes capriscus) based on catch rates as measured by the NMFS Southeast Zone Headboat Survey
Nowlis, Josh Sladek
SEDAR9-DW-30
Standardized Abundance Indices for Gulf of Mexico Gray Triggerfish (Balistes capriscus) based on catch rates as measured from commercial logbook entries with handline gear
Nowlis, Josh Sladek
SEDAR9-DW-31
Estimated Gulf of Mexico vermillion snapper recreational landings (MRFSS, headboat, TPWD) for 1981-2004
Cass-Calay, Shannon, & Guillermo Diaz
Documents Prepared for the Assessment Workshop
SEDAR9-AW1 Incorporating age information into SEAMAP trawl indices for SEDAR9 species Nicholls, S.
SEDAR9-AW2 Separating Vermilion Snapper Trawl Indexes into East and West Components Nicholls, S
SEDAR9-AW3 Modeling Shrimp Fleet Bycatch for the SEDAR9 Assessments Nicholls, S
SEDAR9-AW4 Status of the Vermilion Snapper (Rhomboplites Aurorubens) Fisheries of the Gulf of Mexico
Cass-Calay, S.
SEDAR9-AW5 Gulf of Mexico Greater Amberjack Stock Assessment
Diaz, Guillermo A., and Elizabeth Brooks
SEDAR9-AW6
A Categorical Approach to Modeling Catch at Age for Various Sectors of the Gray Triggerfish (Balistes Capriscus) Fishery in the Gulf of Mexico
Saul, Steven and G. Walter Ingram, Jr.
SEDAR9-AW7 Updated Fishery-Dependent Indices of Abundance for Gulf of Mexico Gray Triggerfish (Balistes Capriscus)
Nowlis, Joshua Sladek
SEDAR9-AW8 An Aggregated Production Model for the Gulf of Mexico Gray Triggerfish (Balistes Capriscus) Stock
Nowlis, Joshua Sladek and Steven Saul
SEDAR9-AW9 Age-Based Analyses of the Gulf of Mexico Gray Triggerfish (Balistes capriscus) Stock Nowlis, J. S.
SEDAR9-AW10
Gulf of Mexico greater amberjack virtual population analysis assessment
Brown, C. A.,C. E. Porch, and G. P.
7
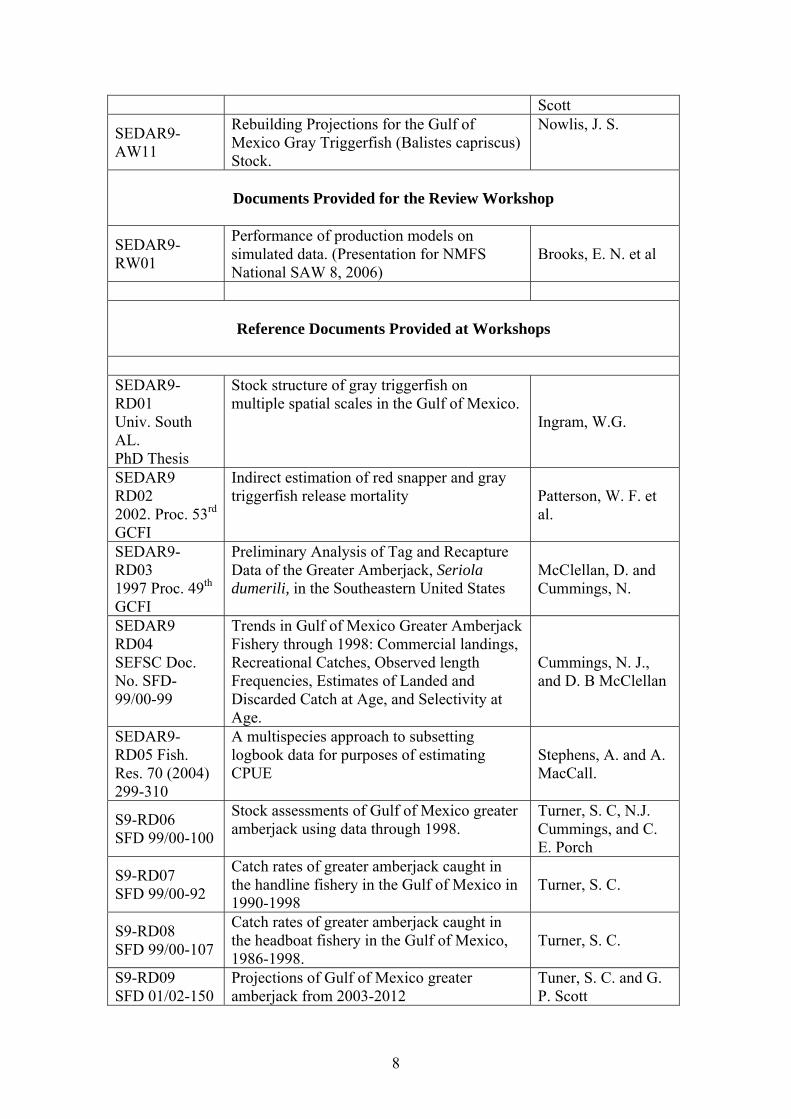
Scott
SEDAR9-AW11
Rebuilding Projections for the Gulf of Mexico Gray Triggerfish (Balistes capriscus) Stock.
Nowlis, J. S.
Documents Provided for the Review Workshop
SEDAR9-RW01
Performance of production models on simulated data. (Presentation for NMFS National SAW 8, 2006)
Brooks, E. N. et al
Reference Documents Provided at Workshops
SEDAR9-RD01 Univ. South AL. PhD Thesis
Stock structure of gray triggerfish on multiple spatial scales in the Gulf of Mexico.
Ingram, W.G.
SEDAR9 RD02 2002. Proc. 53rd GCFI
Indirect estimation of red snapper and gray triggerfish release mortality Patterson, W. F. et
al.
SEDAR9-RD03 1997 Proc. 49th GCFI
Preliminary Analysis of Tag and Recapture Data of the Greater Amberjack, Seriola dumerili, in the Southeastern United States
McClellan, D. and Cummings, N.
SEDAR9 RD04 SEFSC Doc. No. SFD-99/00-99
Trends in Gulf of Mexico Greater Amberjack Fishery through 1998: Commercial landings, Recreational Catches, Observed length Frequencies, Estimates of Landed and Discarded Catch at Age, and Selectivity at Age.
Cummings, N. J., and D. B McClellan
SEDAR9-RD05 Fish. Res. 70 (2004) 299-310
A multispecies approach to subsetting logbook data for purposes of estimating CPUE
Stephens, A. and A. MacCall.
S9-RD06 SFD 99/00-100
Stock assessments of Gulf of Mexico greater amberjack using data through 1998.
Turner, S. C, N.J. Cummings, and C. E. Porch
S9-RD07 SFD 99/00-92
Catch rates of greater amberjack caught in the handline fishery in the Gulf of Mexico in 1990-1998
Turner, S. C.
S9-RD08 SFD 99/00-107
Catch rates of greater amberjack caught in the headboat fishery in the Gulf of Mexico, 1986-1998.
Turner, S. C.
S9-RD09 SFD 01/02-150
Projections of Gulf of Mexico greater amberjack from 2003-2012
Tuner, S. C. and G. P. Scott
8

S9-RD10 SFD 99/00-98
Gulf of Mexico greater amberjack abundance from recreational charter and private boat anglers from 1981-1998.
Cummings, N. J.
S9-RD11 SFD00/01-124
A stock assessment for gray triggerfish in the Gulf of Mexico.
Valle, M, C. Legault, and M. Ortiz.
S9-RD12 SFD00/01-126
Another assessment of gray triggerfish in the Gulf of Mexico using a space-state implementation of the Pella-Tomlinson production Model
Porch, C. E.
S9-RD13 SFD01/02-129
Status of the vermilion snapper fishery in the Gulf of Mexico. Assessment 5.0
Porch, C. E. and S. Cass-Calay.
S9-RD14 Panama City 01-1
Report of vermilion snapper otolith aging; 1994-2000 data summary
Allman, R. J., G. R. Fitzhugh, and W. A. Fable
S9-RD15 FWRI IHR2005-3
Genetic stock structure of vermilion snapper in the Gulf of Mexico and southeastern United States
Tringali, M. D. and M. Higham
S9-RD16 SCDNR
Age, growth, and reproduction of greater amberjack in the Southwestern North Atlantic. December 2004 Analytical Report
Harris, P. J.
S9-RD17 Preliminary Assessment of Atlantic white marlin using a state-space implementation of an age-structured production model
Porch, C. E.
S9-RD18 VPA-2BOX Program Documentation, Version 2.01. 2003. ICCAT Assessment Program Documentation.
Porch, C. E.
S9-RD19 VPA-2BOX Program Documentation, Version 3.01. 2003. ICCAT Assessment Program Documentation.
Porch, C. E.
Final Assessment Reports
SEDAR9-AR1 Gray Triggerfish SEDAR9-AR2 Greater Amberjack SEDAR9-AR3 Vermillion Snapper
9

2. Response to Terms of Reference 2.1. Background
• The Review Workshop is the third meeting in the SEDAR 9 process. The Panel was provided reports (documents: S9DWREP GT.pdf and S9AWREP GRT.pdf ) from both Data Workshop (DW) and Assessment Workshop (AW) before the Review Workshop. The panel reviewed these documents and the series of working documents cited in those reports.
• The Gray Triggerfish assessment was presented by Dr. Josh Sladek-Nowlis on
Monday, the March 27th.
• The Assessment was based on the data from the Data Workshop. The assessment methodologies used for this assessment were “A Stock Production Model Incorporating Covariates" (ASPIC) and “State-Space Age-Structured Production Models” (SSASPM).
• The review Panel evaluated the assessment and identified a number of
concerns. Consequently, the Panel requested several sensitivity runs. With this investigation, the Panel recommended a preferred “base model” for this stock. The recommended “base model” utilized a number of constraints and weightings and the details can be found from the Addendum to the Assessment Report and outlined below. Data series were weighted as follows using CV multipliers unless otherwise stated, such that larger numbers represent greater uncertainty:
o Commercial catch: 1;
o Recreational catch: 2 from 1981-1987; 1 from 1988-2004;
o Shrimp bycatch: 2;
o All indices: 1.5; and
o Catch at age was weighted using a sample size equivalent—these were set annually with a maximum of 25, and 1 sample counted for every 10 fish.
Restrictions were placed on deviations of various series as follows:
o Recruitment deviations were penalized using a variance term of 0.15, equivalent to a 40% CV;
o Effort deviations for directed fleets were penalized using a variance term of 0.223, equivalent to a 50% CV;
o Effort deviations for the shrimp fleet were penalized using a variance term of 0.0392, equivalent to a 20% CV; and
10

o All effort series were serially autocorrelated with a correlation coefficient of 0.5.
2.2. Review of the Panel’s deliberations The deliberations on each species are presented in the form of responses to the terms of reference questions specifically, followed by relevant comments on the discussions.
2.2.1. Evaluate the adequacy, appropriateness and application of the data used in the assessment.
- The data for this species were finalized from the SEDAR Data Workshop
(DW) and reported in S9DWREP GT.pdf. Overall, the panel deemed the data appropriate and applied in an appropriate manner. There were serious concerns about the amount of information on bycatch in shrimp fleet.
- Data used for the assessment were:
o Annual catches of gray triggerfish by relevant sector (recreational East, recreational West, commercial East, commercial West, shrimp bycatch).
o Indices of abundance from a variety of sources, including fishery-dependent catch and effort series from headboat surveys, other recreational surveys (MRFSS), and commercial logbooks (restricted to handlines and equivalent gears). Fishery-independent surveys were also used, including a Neuston net larval survey, a shrimp-trawl style young-of-year survey, and a video survey which primarily sampled adult habitat.
o Life history parameters were entered based on recent studies of the biology of gray triggerfish in the Gulf of Mexico.
o Catch at age, which was inferred from size at age data using area-specific growth patterns.
However, there are serious weaknesses in the data: - Shrimp bycatch: data were very sparse since this species was not
separately noted by the observers”, therefore this data series was lack of adequate sampling of the shrimp bycatch. However it is a major source of mortality on this stock (more than 1 million fish for some years). There were concerns that the shrimp bycatch might be biased high if fishers reported gray triggerfish only when they caught large amounts and the known catches were extrapolated to cover the fleet and all catches.
- The high variability in the MRFSS recreational index; essentially fishery-
dependent index since it is tracing the fishery; limited coverage with mostly in Florida (eastern) and not in western (such as TX, note that TX conducts its own survey, so not included in comparisons of MRFSS).
- The panel questioned if the fishery dependent indices of abundance were
truly representative. The fishery dependent data only come from Florida
11

but this is species is fished in both the eastern and western gulf with different effort in both areas.
- No discard information for Headboat fishery. The discard mortality was
assumed to be zero in the assessment – The absence of complete catch-at-age information substantially limited the
precision of the analysis and the accuracy of the forecasts. – Stock structure – there are two management regions of east and west. The
assessment should treat the stock as two management areas (since they have different Fs and selectivity). A more precautionary approach would be to separate the Gulf into two management areas.
– There were no quantitative studies, such as mark-recapture, that describes
the movement of fish between these two regions. It is known that there is little or no adult movement but there is long larval phase and therefore there could be plenty of mixing during this phase.
2.2.2. Evaluate the adequacy, appropriateness and application of methods used to assess the stocks.
- The assessment methods are considered to be appropriate for the available
data. The methods used for standardization of the catch and effort data are appropriate.
- For the available data, two models (ASPIC and SSASPM) were used as
the assessment methods for this stock. - The ASPIC model was used as a continuity run from the previous
assessment and still concluded that the stock is overfished and experiencing overfishing. There are questionable issues in ASPIC about convergence, ignoring all fishery-independent indices and age information; therefore it is not very informative and not recommended by this Panel.
- The SSASPM was the newly developed age-structured model for this
stock using more information from growth patterns, size/age distribution, age-structure of the harvest, etc. with a weighted likelihood-based structure. Therefore the SSASPM was determined as more informative and preferable by the Panel.
- However, concerns about the time series structures in the model residuals
indicated that the model did not fit the data properly possibly because of the lack of optimal/appropriate weighting and the implemented first-order autoregressive model assumption. The following figures are used to illustrate this concern, which are the autocorrelation function (ACF) and partial ACF for commercial Headline and Headboat residuals (other landing series and indices can be also generated). It revealed that the residuals from the default SSASPM model structure with first-order
12

autoregressive assumption still existed further time series structure, i.e. first-order autoregressive and moving average for commercial headline, second-order autoregressive and first-order moving average for headboat.
0 2 4 6 8 10 12
-0.5
0.0
0.5
1.0
Lag
AC
F
Com HL
2 4 6 8 10 12
-0.4
0.0
0.4
Lag
Par
tial A
CF
0 2 4 6 8 10 12
-0.5
0.0
0.5
1.0
Lag
AC
F
Headboat
2 4 6 8 10 12
-0.4
0.0
0.4
Lag
Par
tial A
CF
No absolute levels of adequacy of the assessments methods can be determined at present. Simulation testing of the assessment methods would have to be performed under conditions approximating those believed to pertain to gray triggerfish. Such simulations were not available to the review panel.
- The methods are not adequate for forecasting the effects of management
measures that involve changing selection patterns, such as changes to minimum landing sizes and bag limit. They are however adequate for exploring the information content and management implications of small and incomplete data sets such as that available for gray triggerfish. Although it is true that the assessment models do not specifically address such management measures, it is worth noting that (1) they are sufficient for exploring total allowable catches, and (2) the very low release mortality indicates that size limits and bag/trip limits would be appropriate methods for controlling total allowable catches. It is noted that data collection in the Gulf of Mexico fisheries is a difficult and challenging task.
- The application of the methods was considered to be appropriate.
Sensitivity runs were established in order to identify the change in
13

perception of stock status in response to new information. Methods were chosen in order to reflect the availability of data and the way in which it was collected. However, it was clear that insufficient time and resources had been made available to consider fully the model constraints and parameterizations. In this context, further model and data explorations at the review workshop were a helpful step in the process.
- The practice of testing the sensitivity of model interest parameters (e.g.
current F/F msy) to the use of simulated data series, and to the fixing of structural parameters and constraints is essential in the application of stock assessment models and should be developed and continued.
2.2.3. Recommend appropriate estimates of stock abundance, biomass and exploitation.
- The panel evaluated the original assessment results and requested several
sensitivity runs - Further evaluated the sensitivity runs, the panel had a consensus for the
preferred “base model” for this stock defined in Section 2.1 “Background” and also detailed in the Addendum to the Assessment Report prepared by Dr. Josh Sladek Nowlis.
- A number of issues were explored but not fully resolved during the
meeting. The assessment model was unexpectedly inflexible in fitting to simulated indices of abundance, which could suggest that some structural features of the model could have a strong influence on the model fit. Also, the review meeting did not identify which – if any – of the model parameters were bound constrained at the solution, did not investigate correlations in the parameters at the solution, and did not examine parameter uncertainty estimates. Despite this, the review panel considered the final assessment as an acceptable representation of the stock dynamics because the main data trends were represented and the model structure was, a priori, reasonable. However, some research recommendations concerning the foregoing concerns are included below.
- The details for the appropriate estimate of stock abundance, biomass and
exploitation are listed in the Addendum to the Assessment Report.
- SEDAR and management agencies should be aware that high uncertainties are attached to this assessment
2.2.4. Evaluate the methods used to estimate population benchmarks and management parameters (e.g. MSY, Fmsy, Bmsy, MSST, MFMT or their proxies); provide estimated values for management benchmarks, a range of ABC, and declarations of stock status.
- The methods to estimate population benchmarks and management
14

parameters are based on the maximum-likelihood parameter estimates from the recommended “base model”. The estimates of these benchmarks are listed in the Addendum to the Assessment report.
- In general, the ASPIC model (the continuity case) estimates the surplus
production parameters (carrying capacity, intrinsic population growth) and biomass trajectories over the course of the time period in the assessment model. These estimated parameters are then combined to produce other useful population benchmarks and management parameters, such as MSY-related reference points of biomass and fishing mortality rates and fishing mortality rate trajectories.
- For the SSASPM base model, the reference points are calculated
numerically with reference to the maximum of the product of the equilibrium fecundity-per-recruit and recruitment-per-fecundity functions
- These methods are considered to be appropriate for the available data and
in the present situation. However, improved methods based on stochastic modeling of the fishery, the stock, and the sampling from the stock could be developed that would give greater insight into the dynamics of the assessment and management process if more resources were available. Such studies could lead to different benchmarks.
- With the recommended base model run, the detailed estimates of
management benchmarks and management parameters with reference to the population parameters from the SSASPM are listed in the Addendum to the Assessment report and summarized as follows:
• Current MFMT, the Maximum Fishing Mortality Threshold, =
F30%SPR. • Current MSST, the Minimum Stock Size Threshold, = SSB20%SPR. • FOY, the optimum yield, is not currently defined..
The parameters relevant to management are estimated as follows:
Parameter Base Value (Low-High Steepness) Population parameters and management benchmarks F20%SPR 0.419 F30%SPR = MFMT 0.269 F40%SPR 0.186 Fmsy 0.45 (0.294-0.525) SSBmsy (eggs) 1.21t (1.78t-1.049t) SSB20%SPR = MSST 1.316t (1.083t-1.355t) FOY Not defined MSY (lbs, incl shrimp bycatch)
1.638m (1.441m-1.707m)
15

Parameter Base Value (Low-High Steepness) Stock parameters in 2004 F2004 0.435 (0.431-0.435) F2004/MFMT 1.62 (1.6-1.62) SSB2004 (eggs) 1.345t (1.323t-1.351t) SSB2004/MSST 1.02 (1.22-1) F2004/OY Not defined
16
Declarations of Stock Status:
• The stock experienced overfishing, but there is high uncertainty in the underlying stock-recruitment relationship .
• The Review Workshop could not come to a conclusion whether the
stock is overfished or not, although it appears to be approaching an overfished condition.
2.2.5. Evaluate the adequacy, appropriateness and application of methods used to project future population status; recommend appropriate estimates of future stock condition (e.g., exploitation, abundance, biomass)
- Projection of this stock is based on the “base model” recommended by the
Panel.
- Projections of the future population status for this stock depend upon the assumption that the both the fishery catches and shrimp bycatch continue along the current trends and the model assumptions remain unchanged.
- The methods are not adequate for forecasting the effects of management measures that involve changing selection patterns, such as changes to minimum landing sizes and bag limits. They are however adequate for exploring the information content and management implications of small and incomplete data sets such as that available for gray triggerfish. It is noted that data collection in the Gulf of Mexico fisheries is a difficult and challenging task.
- Management agencies should be aware that high uncertainty is attached to this assessment
- The panel recommended the present “base model” be used for the projection for this stock and the estimate the stock condition (Fig 9 in the Assessment Report Addendum).
2.2.6. Evaluate the adequacy, appropriateness and application of methods
used to characterize uncertainty in estimated parameters. Provide measures of uncertainty for estimated parameters. Ensure the implications of uncertainty in technical conclusions are clearly stated.
- The primary uncertainties are from the model process errors and the data
measurement errors. Because of the inherited high uncertainties from the data and the model structure, the basic tool for evaluating this type of uncertainty is the calculation of sensitivity analyses, by investigating the robustness of interest parameter estimates to alternative choices about data
17

usage, to specification of structural parameters. Numerous trial runs are calculated in order to identify key sensitivities and develop appropriate relevant treatments. This is considered highly appropriate.
- With the selected base model, the model-based estimates of the standard
errors in the most important parameter estimates were calculated. The method is based on using automatically-calculated derivatives of the interest parameter with respect to the inverse Hessian matrix of the likelihood at the solution (the method is specific to the software used, “AD model builder”). The AD will automatically produce the standard error for the parameters and the specified MSY management benchmark parameters. The uncertainty measures for the ratio estimates, such as SSB/SSBmsy and F/Fmsy should be produced and in fact can be produced by the delta (approximate Taylor expansion) method and recommended by the panel to be included in the assessment report.
- Improvement in the documentation of the method would be encouraged. These uncertainty estimates are considered to be more useful as diagnostics of model fitting rather than as reflecting the “real” uncertainty in the assessment.
2.2.7. Ensure that stock assessment results are clearly and accurately presented in the Stock Assessment Report and that reported results are consistent with Review Panel recommendations. (In the event corrections are made in the assessment, alternative model configurations are recommended, or additional analyses are prepared as a result of review panel findings regarding the TORs above, ensure that corrected estimates are provided by addenda to the assessment report).
• The panel recommended a new “base model” for this stock and the alternative configurations for the new base model are listed in the Assessment Report Addendum.
2.2.8. Evaluate the performance of the data and assessment workshops with regard to their respective Terms of Reference; state whether or not the Terms of Reference for those previous workshops were met and are adequately addressed in the Stock Assessment Report.
• The terms of reference and the results of gray triggerfish Data Workshop are documented in S9DWREP GT.pdf. The review panel evaluated the terms of reference and agreed that the TOR were met in general except for TOR 5 (“Evaluate the adequacy of available data for estimating the impacts of current management actions”) and TOR 6 (“Recommend assessment methods and models that are appropriate given the quality and scope of the data sets reviewed and management requirements”), which were not pertinent and outside the scope of the Data Workshop and
18

recommended removing these from the TOR in the future data workshop. The TOR 7 (“Provide recommendations for future research in areas such as sampling, fishery monitoring, and stock assessment. Include specific guidance on sampling intensity and coverage where possible”) was not addressed sufficiently in the Report.
• The terms of reference and the results of gray triggerfish Assessment Workshop are documented in S9AWREP GRT.pdf. The review panel evaluated the terms of reference with consensus that the TOR were met generally with deviations for the best possible base model. The panel evaluated data and the model and suggested several sensitivity runs. The Panel recommended a preferred “base model” for gray triggerfish (see Addendum to the Assessment Report for details).
• In general, there were not sufficient recommendations for research that needed to addressed contained both Data and Assessment Workshop
2.2.9. Review research recommendations provided by the Data and
Assessment workshops and make any additional recommendations warranted. Clearly indicate the research and monitoring needs that may appreciably improve the reliability of future assessments.
The Panel strongly recommends:
• The Review Panel should be provided an executive summary for substantive documents from Data and Assessment Workshops, a succinct table of model structural equation and parameters, and if appropriate a table of management options. A glossary of all the acronyms used in the assessments should be provided as an appendix in every assessment report.
• All of the data used for the assessment should be included in the Reports
as well as the model formulations for the assessment. Some of the data in gray Triggerfish (such as age composition data) used in the assessment were missing from the Assessment Report, which could preclude further independent evaluation of the assessment results. The Addendum to the gray triggerfish Assessment Report includes these data now.
• An observer program should be implemented to estimate levels of shrimp
bycatch and appropriate age composition with some well-designed, systematic research programs, which are essential to provide the data necessary for effective management. Shrimp by catches for gray triggerfish are the dominant removals for this species and it is scientifically important for better estimates for an accurate stock assessment. Catch in numbers of fish is dominated by shrimp bycatch which mainly consists of age-0 and age-1 fish (Table 1 and Fig 1 in the Addendum). The shrimp bycatch fishery annually removes roughly 1 million fish age-1 equivalent and peaked at 5 million fish at year 2002. However the recreational and commercial fisheries’ combined take was
19
roughly 1 million pounds in recent years but had past peaks reaching 3 million pounds annually.
• A comprehensive age-reading programme should be established in the
major sectors. This will allow a more accurate age distribution and therefore a more accurate and precise assessment. This is more important for this species since the assessment method has changed from ASPIC model to SSASPM using catch at age data.
• MRFSS programme should be strengthened so that more precise estimations of total catches are available for the assessment.
• A mark-recapture study should be initiated. Such a study will help:
- Identifying movements and migrations between east and west regions;
- Estimating fishing mortality; - Enhancing the population estimates; and - Identifying the stock structure; - Better understanding habitat preferences.
• The methods should be more thoroughly documented, including the
structural model equations, the observation-error models, process-error models (if appropriate), values of constants, constraints and priors, and description of the fitting algorithm including the uncertainty-estimation method.
• The panel should be provided more detailed model diagnostics, such as
complete lists of estimated parameters together with their estimated standard errors, the most important investigation of model sensitivity runs.
• The model residuals diagnostics should be included to test whether there is
still time series autocorrelation for lack of goodness of fit in the assessment.
• The resources available to the assessment data collection, processing and
modeling teams should be significantly increased. This increase in resources would be required in order to allow the foregoing recommendations to be implemented realistically.
• The panel’s internally-adopted guidelines for assessing assessments
developed during the SEDAR 9 Review Workshop (see Appendix 1) should be followed.
2.3. General recommendations to SEDAR - There were some concerns expressed in the Review Workshop that
pressure may have been brought to participants at some of those workshops to progress management further than was possible within the available time frame and with available time series data.
20

- - Incorporation of fishermen’s knowledge into the data and assessment
process.
- There was large volume of documentation associated with this Review Workshop. The Review Panel recommended the need for a clear executive summary for all substantive Data and Assessment Documents. It could be more informative to distribute a succinct table of model equations and parameters (estimated and observed) to be provided for each assessment along with, if appropriate, a table of management options (e.g. a decision table) and the risks associated with them.
21
Appendix: Panel's approach to evaluating stock assessments Basic Principles The review panel considered the characteristics that would ideally be desirable in a stock assessment process used for advisory purposes. In order to guide its deliberations relevant to the terms of reference, the panel considered the following attributes to be desirable. Specific issues of concern addressed for each stock are addressed in this framework. Overall conclusions are summarized in Section 2.2. 1. All relevant data should be used, unless there is an a priori reason to exclude a data series, or a sound a posteriori reason can be identified. Data should be real observations, not “filled-in” using assumptions or other criteria, to the extent possible. Fish stock assessment depends on having reasonably long time-series of catch, effort and fishery-independent abundance estimates. 2. Conclusions about stock status with respect to reference points should be robust to underlying assumptions about data and structural model, e.g. reliance on filling-in assumptions, dependence on most contested parts of the data sets. 3. Assessments should include the following :
– 3.1 Data screening, to check assumptions in 1 and 2. – 3.2 Model screening, to see if broadly similar conclusions are drawn from
different models, including sensitivity to constraints etc. – 3.3 Residual pattern screening: Does the model replicate the trends in the
data? – 3.4 Credibility check: are the estimated model parameters reasonable (e.g.
selection pattern, r, B0/Bmsy , trends in F etc. in the context of biological knowledge about the stock and the fishery ?
– 3.5 Variance estimates (or posteriors) for the estimated interest parameters, and a priori model testing, using simulated data, which should demonstrate that the model has useful precision in predicting interest parameters when presented with data.
4. Assessment documentation should include :
– 4.1. Data used to fit the assessment model. – 4.2. Structural model equations, including process-error model if
applicable – 4.3. Observation-error model – 4.4. Description of estimating algorithm – 4.5. List of final parameter estimates and their sd.s – 4.6. Computational validation, including simulation testing – 4.7. Source code (and ideally documentation) of the programs used should
be made available.
22

Review Workshop Advisory Report
Gulf of Mexico Gray Triggerfish SEDAR 9 Review Workshop
Stock Distribution:
• The gray triggerfish are found throughout the Gulf of Mexico, which is considered a single stock based on its prolonged, indeterminate larval stage.
• This assessment addresses gray triggerfish in the U.S. Gulf of Mexico. The stock is divided into eastern and western gulf components at the Mississippi River to allow application of area-specific life history characteristics, catch statistics, and survey indices.
Assessment Methods & Data:
• Gray triggerfish in the Gulf of Mexico were assessed with two models, including ASPIC and SSASPM. Within each type of model various configurations and sensitivity runs were explored. Details of all models are available in the Stock Assessment Report and the Review Panel Consensus Summary.
• The Assessment Workshop chose the SSASPM model to provide the base assessment results based on its flexibility and better mathematical rigor to incorporate more information on life history and on the age structure of the harvest. The RW accepted this model with modifications that are detailed in the Assessment Report Addendum (prepared by Dr. Josh Sladek Nowlis and attached with this report in the Appendix) and summarized here in a subsequent section.
• Data sources include landings by relevant sectors from recreational east, recreational west, commercial east, commercial west and shrimp bycatch (Table 1 and Fig 1 in the Addendum); five fishery-dependent indices and three fishery-independent indices (Table 2 and Fig 2 in the Addendum); gray triggerfish life history parameters based on the biological studies (Table 3 in the Addendum), as well as relative age composition data inferred from size at age data using area-specific growth patterns (Table 4 in the Addendum).
Sources of Information:
• Results are summarized in the following bullets. Complete details are available in the SEDAR 9 Data and Assessment Reports, Assessment Report Addendum and the SEDAR 9 Review Panel Consensus Summary, and the many SEDAR 9 workshop working papers.
• Complete results of the SSASPM model configuration preferred by the Review Panel are contained in the Stock Assessment Report Addendum.
Catch Trends:
1

• Catch in numbers of fish is dominated by shrimp bycatch which mainly consists of age-0 and age-1 fish (Table 1 and Fig 1 in the Addendum). The shrimp bycatch fishery annually removes roughly 1 million age-1 equivalent and peaked at 5 million fish at year 2002 (Table 1 and Fig 1 in the Addendum). The recreational and commercial fisheries combined take roughly 1 million pounds in recent years but had past peaks reaching 3 million pounds annually.
• Catch information was derived from several fleets (SEDAR9-DW-Report). Based on age-structure of the catches, these were pooled into four directed fleet categories: recreational east, recreational west, commercial east, and commercial west, with the east-west split occurring at the Mississippi River.
Fishing mortality trends
• Fishing mortality is variable and irregular ranged about between 0.4 to 0.6 with MSY at 0.45 (Fig 6 in the Addendum). Generally, it shows a decreasing trend from the mid 80s to the early 90s and an increasing trend to its peak during the mid 90s (F = 0.65), then decreasing from the mid 90s to 2000, slowly building to FMSY in recent years.
Stock abundance and biomass trends
• Model assumed virgin condition in 1963 with virgin SSB of 7.5 trillion eggs, model predicts a drop to ¼ virgin at trough in the mid 1980s, 50% increase through early 1990s, cut in half by late 1990s to MSST, 25% rise by 2002 and drop by 10% in 2004 (Fig 6 in the Addendum).
Status determination criteria and Stock Status
• The parameters relevant to management are estimated from the preferred base model by the Review Workshop as follows:
Parameter Base Value (Low-High Steepness)
Population parameters and management benchmarks F20%SPR 0.419 F30%SPR = MFMT 0.269 F40%SPR 0.186 Fmsy 0.45 (0.294-0.525) SSBmsy (measured as egg production) 1.21t (1.78t-1.049t) SSB20%SPR = MSST 1.316t (1.083t-1.355t) FOY Not defined MSY (lbs, incl. shrimp bycatch) 1.638m (1.441m-1.707m) Stocks parameters in 2004 F2004 0.435 (0.431-0.435) F2004/MFMT 1.62 (1.6-1.62)
2

Parameter Base Value (Low-High Steepness) SSB2004 (eggs) 1.345t (1.323t-1.351t) SSB2004/MSST 1.02 (1.22-1) F2004/OY Not defined
• Declarations of Stock Status: o The stock experienced overfishing. According to the existing F30%SPR maximum
fishing mortality threshold (MFMT), current fishing mortality rates are 60% too high (Table 6 and Fig 8 in the Addendum). Current fishing mortality rates are in the range of MSY-based fishing mortality rates (FMSY) as estimated by the base model (F2004/FMSY = 0.97). However, this status measure is sensitive to the stock-recruitment relationship, which is poorly estimated with the data available on this stock. Over a range of potentially realistic parameter values, current fishing mortality rates range from 83 to 147 percent of FMSY (Table 6 and Fig 8 in the Addendum).
o The Review Workshop cannot come to a conclusion whether the stock is overfished or not, although it appears to be approaching an overfished condition. The stock is estimated to be just above the minimum stock size threshold, currently defined as a stock condition below 20%SPR. This status measure has some sensitivity to the stock-recruitment relationship, but in most cases the stock is identified as being just above the threshold. However, current fishing rates are predicted to drive the stock below the threshold in the near future.
Projections
• Quantitative projections are available for the preferred base model from Review Workshop (Table 7 and Fig 9 in the Addendum). These indicate:
o If conditions in 2004 continue, forecasts are uncertain but indicate the stock is slightly more likely to decrease than to increase;
o The extent of reduction in fishing mortality brought about by additional management measures in 2005 cannot be evaluated at present since no new management measures were put in place for gray triggerfish in 2005.
3


SEDAR
SouthEast Data, Assessment, and Review
SEDAR 9 Stock Assessment Report 1
Gulf of Mexico Gray Triggerfish
SECTION 5. Post Review Addendums


Contents
Addendum 1. Updated ASPM Model Results for Gray Triggerfish.
Summary of model configuration changes recommended by the Review Workshop Panel. Includes input data, results and measures of fit, and projections.


Addendum
Assessment Report for Gray Triggerfish
by Josh Sladek Nowlis
March 2006
SFD Contribution ###
Based on Results of the Southeast Data Assessment Review (SEDAR) 9 Review Workshop
Held 27-31 March 2006 New Orleans, LA

Gray Trigger Assessment Report March 2006
-2-
BASE MODEL STRUCTURE
After extensive review of available data and attributes of gray triggerfish biology and the fisheries that catch it, it was determined that an age-structured production model would best describe the Gulf of Mexico gray triggerfish (Balistes capriscus) stock. The particular model used, a State Space Age-Structured Production Model (SSASPM) is described elsewhere (Porch 2002). Its fundamental features include:
• Fits to catch, abundance index, and catch-at-age data;
• Fits to or use of fixed parameters describing the life history of the stock (e.g., natural mortality, growth rates, stock-recruitment relationships);
• Recruitment deviations from the stock-recruitment relationship, constraints on which are controlled by the user—note that these recruitment deviations can be asymmetrical (i.e., they need not sum to 1) and as a result they can create a circumstance in which recruitment patterns in recent years, and corresponding management benchmarks, may differ from the underlying stock-recruitment relationship;
• Effort deviations that can include serial autocorrelation;
• The ability to weight the importance of each data series in the objective function, as well as specifying interannual variability within each series; and
• A “pre-historical” or “burn in” period, which begins the model at virgin condition and uses prescribed effort patterns (e.g., linear increase) until the time period when more data streams are available—this feature is principally used to condition the model for the beginning of the “historical” period.
DATA INPUTS
Several types of data were used as input to the model. These included:
• Annual catches of gray triggerfish by relevant sector (recreational East, recreational West, commercial East, commercial West, shrimp bycatch). See Table 1 and Fig. 1 for the data.
• Indices of abundance from a variety of sources, including fishery-dependent catch and effort series from headboat surveys, other recreational surveys (MRFSS), and commercial logbooks (restricted to handlines and equivalent gears). Fishery-independent surveys were also used, including a Neuston net larval survey, a shrimp-trawl style young-of-year survey, and a video survey which primarily sampled adult habitat. See Table 2 and Fig. 2 for the data.
• Life history parameters were entered based on recent studies of the biology of gray triggerfish in the Gulf of Mexico. See Table 3 for the data.

Gray Trigger Assessment Report March 2006
-3-
• Catch at age, which was inferred from size at age data using area-specific growth patterns. See Table 4 for the data.
The model began in 1963, at which point the stock was assumed to be unfished. The burn in/pre-historic period lasted through 1980, while the historical/data-oriented period stretched from 1981 to 2004. A single stock was assumed for the entire US Gulf of Mexico, but directed fishing sectors were split into western and eastern components at the Mississippi River (resulting in five fleets—recreational west, recreational east, commercial west, commercial east, and shrimp Gulf-wide). The stock was modeled using 10 age classes spanning from 1 year olds to 10+ year olds.
The base model used a number of constraints and weightings that reflected tinkering and the advice and input of the review panel. Data series were weighted as follows using CV multipliers unless otherwise stated, such that larger numbers represent greater uncertainty:
• Commercial catch: 1;
• Recreational catch: 2 from 1981-1987; 1 from 1988-2004;
• Shrimp bycatch: 2;
• All indices: 1.5; and
• Catch at age was weighted using a sample size equivalent—these were set annually with a maximum of 25, and 1 sample counted for every 10 fish.
Restrictions were placed on deviations of various series as follows:
• Recruitment deviations were penalized using a variance term of 0.15, equivalent to a 40% CV;
• Effort deviations for directed fleets were penalized using a variance term of 0.223, equivalent to a 50% CV;
• Effort deviations for the shrimp fleet were penalized using a variance term of 0.0392, equivalent to a 20% CV; and
• All effort series were serially autocorrelated with a correlation coefficient of 0.5.
This fully summarizes the base model. The actual input files are shown in Appendix 1.
FITS TO DATA
The base model’s fits to the data series were generally good. Catches were not perfectly fit but captured most of the dynamics of rising and falling catches over time (Fig. 3). The fit to shrimp bycatch was most problematic, but so was that data and as a result the model was given more latitude to sacrifice this fit to the benefit of better fits elsewhere. Indices also generally fit well, although only in broad form and not necessarily in detail (Fig. 4). In particular, large spikes in abundance were not well represented in the model’s predictions (e.g., MRFSS 1990, trawl 1991

Gray Trigger Assessment Report March 2006
-4-
and 2001). Catch at ages, despite having been down weighted substantially compared to previous version of the base model, were still fit well as exemplified by the 2004 fits (Fig. 5).
MODEL ESTIMATES
Estimates for key parameters and management benchmarks from both the base model and sensitivity analyses are shown in Table 5. These data illustrate the sensitivity of the model to changes in assumptions.
The model estimated trajectories for spawning stock biomass, fishing mortality rates, and recruitment (Fig. 6). With respect to SSB, the model assumed virgin condition in 1963 and predicted a drop to one-fourth virgin SSB in the mid-1980s. It then predicted a 50 percent increase through early 1990s, followed by a drop to the minimum stock size threshold by the late-1990s. The stock was predicted to have risen about 25 percent by 2002 and then to have dropped by 10 percent in 2004. These patterns were consistent across different stock-recruitment relationships, but with differences in benchmark reference points (see Table 5).
Fishing mortality rates were predicted to have ranged between about 0.4 and 0.6 in the base model, with peaks in the early-1980s and throughout the 1990s, and troughs in the late 1980s and in 2000, slowly building to FMSY in recent years. In this version, FMSY was estimated at 0.45, corresponding to an SPR level of less than 20 percent, and the maximum fishing mortality threshold (MFMT) of 30% SPR corresponded to a fishing mortality rate equal to 0.269. Different stock recruitment relationships showed the same annual trends but with shifted FMSY values (see Table 5).
Recruitment followed the underlying stock-recruitment relationship in the pre-historical/burn in period. However, the pattern of recruitment was clearly different when the model was allowed to estimate recruitment deviations starting in the early 1980s. One can see that recruitment was estimated to be above virgin levels throughout most of the 1980s and into the early-1990s, with a subsequent high peak occurring in 2001. When recruitment in recent years (1986 to 2004) was examined as a function of spawning stock biomass, a dramatically different stock-recruitment relationship is inferred. The underlying S-R relationship was fixed at a steepness of 0.89, and the maximum recruitment was estimated as 2.146 million fish, while the relationship estimated from the model’s results, which included deviations, was a steepness of only 0.442 and a maximum recruitment of 15.3 million fish (Fig. 7). Considering that steepness must fall between 0.2 and 1, these results are starkly different and illustrate the inability of the data on gray triggerfish to inform us of the actual stock-recruitment function. As a result, any S-R dependent benchmarks, including MSY and its associated reference points, should be viewed as highly uncertain. SPR-based benchmarks, which are independent (F) or only slightly dependent (SSB) on S-R, should be viewed as more reliable.
STOCK STATUS
The stock experienced overfishing. According to the existing F30%SPR maximum fishing mortality threshold (MFMT), current fishing mortality rates are 60% too high (Table 6, Fig. 8). Current fishing mortality rates are in the range of MSY-based fishing mortality rates (FMSY) as estimated by the base model (F2004/FMSY = 0.97). However, this status measure is sensitive to the

Gray Trigger Assessment Report March 2006
-5-
stock-recruitment relationship, which is poorly estimated with the data available on this stock. Over a range of potentially realistic parameter values, current fishing mortality rates range from 83 to 147 percent of FMSY (Table 6, Fig. 8).
We cannot come to a conclusion whether the stock is overfished or not, although it appears to be approaching an overfished condition. The stock is estimated to be just above the minimum stock size threshold, currently defined as a stock condition below 20%SPR. This status measure has some sensitivity to the stock-recruitment relationship, but in most cases the stock is identified as being just above the threshold. However, current fishing rates are predicted to drive the stock below the threshold in the near future.
MODEL PROJECTIONS
The base model was used to project stock status into the future under various F-based management scenarios (Table 7, Fig. 9). The scenarios included no fishing (F=0) and fishing at current rates (Fcurr), rates associated with the poorly estimated MSY level (Fmsy), 30% SPR rates (F30, also MFMT), and 75 percent of F30 (0.75F30). All scenarios were predicted to result in a reduction in catches over the next five to ten years, while fishing at Fcurr or Fmsy were predicted to drive the stock to an overfished condition. The F30 scenario was significant because it would end overfishing, and it and the more restrictive 0.75F30 would avoid an overfished condition.
REFERENCES
Porch, CE. 2002. Preliminary assessment of Atlantic white marlin (Tetrapturus albidus) using a state-space implementation ff an age-structured production model. Col. Vol. Sci. Pap. ICCAT 55(2): 559-577.

Gray Trigger Assessment Report March 2006
-6-
TABLES
Table 1—Catches. Directed fleets expressed in pounds, while shrimp bycatch is expressed in the number of age-1 equivalent fish. Year Rec-E Rec-W Comm-E Comm-W Shrimp
1963 3100 4200 1964 15700 4300 1965 17400 4300 1966 8600 5200 1967 12200 5200 1968 8600 3900 1969 14600 7700 1970 16000 8200 1971 30500 9900 1972 47400 15200 1973 40000 13200 112277.61974 40000 13100 342364.61975 62000 16000 380204.41976 69700 14800 220049.91977 50095.91 9290.086 189051.11978 48518.03 10196.7 460314.51979 65670.02 35732.98 17710571980 65421.67 31001.23 606637.61981 748779.46 179616.8 64498 25362 14677341982 2032601.4 362711 62959 33714 12065181983 397613.53 387301.1 49588 23831 14627551984 120970.49 844622.8 37445 32749 304993.51985 280865.15 479950.2 54840 37786 8555861986 898096.37 79076.84 72858 22771 279373.71987 1135997.7 199066.1 89313 34290 10445551988 1638073.3 158328.2 137978 57084 13641681989 1765965.4 212002 230361 87271 906437.21990 2313261.1 184940.6 359686.4 99351.17 12867031991 1688391.7 399955 341319.2 103211.2 523154.41992 1434485.1 688825 338118.9 112075.7 31005161993 1317044.1 309425.4 381279.2 177448.4 432659.91994 1152103 186425.4 251578.1 153141.4 19514711995 1139966.8 329440.7 207212.3 130664.3 10658551996 618124.69 226005.8 142184.6 125331.6 14981331997 664793.77 100211.2 107779.8 76909.41 17517751998 560509.32 93309.19 106152.6 70570.89 10042081999 445429.52 43997.12 116194.3 102826.1 242741.52000 337240.63 109208.6 63041.56 95094.95 16561662001 487621.94 152571.5 108463.6 67718.28 490376.22002 721871.85 77016.21 148600.1 86962.79 51154072003 856626.38 58622.49 166424.7 85385.05 854441.32004 951559.09 78092.38 141411.1 77121.77 167161.8

Gray Trigger Assessment Report March 2006
-7-
Table 2—Indices
Year MRFSS E
Rel CV HB E
Rel CV
HB W
Rel CV
CmHL E
Rel CV
CmHL W
Rel CV Neuston
Rel CV Trawl
Rel CV Video
Rel CV
1981 59.56 2.35 1982 50.87 2.07 1983 35.54 2.76 1984 213.94 6.95 1985 7.82 7.2 1986 131.05 0.94 1.58 1.37 2.46 0.95 28.09 1987 41.94 1.21 1.04 1.83 2.43 0.85 20.7 0.93 221.22 1.06 1988 74.32 1.13 1.37 1.29 3.34 0.72 13.96 1.09 190.22 1.12 1989 122.18 1.15 3.13 0.68 3.08 0.81 8 1.16 338.04 0.53 1990 256.47 1.09 5.02 0.45 4.34 0.61 13.8 0.87 77.93 3.7 1991 107 1.05 3.96 0.55 5.13 0.52 27.84 0.83 1291 0.21 1992 94.73 0.85 4.57 0.48 4.56 0.56 91.81 0.9 75.78 3.27 68.55 0.871993 58.76 1 3.59 0.57 4.59 0.56 155.57 1.06 55.92 1.02 31.13 1.13 640.45 0.31 37.4 0.911994 53.3 1.09 2.78 0.71 4.46 0.53 146.65 0.97 71.33 1 35.77 0.84 613.49 0.33 33.63 0.881995 82.09 1.17 2.42 0.85 4.1 0.56 151.96 1.08 80.53 1.02 35.64 0.81 257.2 0.74 31.82 0.971996 47.63 1.22 1.72 1.05 4.18 0.57 66.9 1.01 50.18 1.01 24.18 0.97 226.35 0.82 29.65 0.871997 26.71 1.07 1.82 1.02 3.77 0.66 55.95 1.07 39.95 1.01 25.41 0.93 154.5 1.79 62.53 1.061998 20.24 1.04 1.56 1.11 2.57 0.87 52.8 1.11 52.27 1 1.18 14.68 0.74 1999 20.98 0.9 1.65 1.04 1.14 1.73 50.81 0.95 70.79 0.99 8.05 0.86 346.25 0.51 2000 16.46 0.98 1.16 1.38 1.16 1.64 37.05 1.07 52.93 0.99 83.12 1.18 602.55 0.31 2001 25.28 0.9 1.3 1.33 1.37 1.39 54.92 1.02 36.57 1 13.72 1.03 1114.51 0.21 5.34 1.42002 26.18 0.89 1.98 1.02 1.51 1.39 97.78 0.91 39.08 0.99 19.01 0.82 258.03 0.7 29.96 1.042003 25.25 0.9 2.01 1 1.86 1.09 109.07 0.85 35.09 0.99 1.44 218.78 0.88 2004 29.05 0.82 2.15 0.91 2.14 1 86.61 0.92 35.26 0.99 1.02 261.61 0.77

Gray Trigger Assessment Report March 2006
-8-
Table 3—Life History Attributes
• Maturity: 87.5% @ 1 yr, 100% when older.
• Fec = 170289e0.3159x, where x = age.
• M = 0.27 for all modeled age classes.
• FL = 423.4 (1-e-0.4269(x+0.6292)), where FL = fork length in mm and x = age.
• Wt = 4.4858*10-8 FL3.0203, where Wt = weight in lbs and FL = fork length in mm.

Gray Trigger Assessment Report March 2006
-9-
Table 4—Catch at Age by Fleet and Year.
A. Recreational East
Year N Age 1 Age 2 Age 3 Age 4 Age 5 Age 6 Age 7 Age 8 Age 9 Age 10+
1981 5 0.136 0.34 0.47 0.51 0.42 0 0 0 0 01982 9 0.14 0.32 0.46 0.51 0.47 0 0 0 0 01983 7 0.114 0.32 0.46 0.5 0.42 0 0 0 0 01984 2 0.158 0.41 0.48 0.44 0.36 0 0 0 0 01985 3 0.1 0.25 0.34 0.43 0.39 0 0 0 0 01986 25 0.103 0.29 0.41 0.46 0.45 0.01 0 0 0 01987 25 0.135 0.31 0.4 0.46 0.49 0.01 0.01 0 0 01988 25 0.128 0.33 0.44 0.49 0.49 0.01 0.01 0 0 01989 25 0.179 0.36 0.43 0.47 0.52 0.02 0.01 0 0 01990 25 0.177 0.4 0.47 0.49 0.52 0.03 0.01 0 0 01991 25 0.136 0.33 0.44 0.5 0.51 0.03 0.01 0 0 01992 25 0.136 0.34 0.45 0.5 0.5 0.04 0.01 0.01 0 01993 25 0.141 0.36 0.46 0.5 0.5 0.02 0.01 0 0 01994 25 0.164 0.38 0.46 0.49 0.51 0.02 0.01 0 0 01995 25 0.156 0.39 0.48 0.5 0.51 0.02 0.01 0 0 01996 25 0.148 0.38 0.48 0.51 0.51 0.01 0.01 0 0 01997 25 0.143 0.36 0.46 0.49 0.51 0.02 0.01 0 0 01998 25 0.14 0.38 0.49 0.5 0.5 0.04 0.01 0 0 01999 25 0.136 0.38 0.49 0.51 0.5 0.04 0.01 0 0 02000 25 0.126 0.34 0.46 0.5 0.51 0.04 0.01 0 0 02001 25 0.139 0.38 0.48 0.5 0.51 0.05 0.01 0 0 02002 25 0.129 0.37 0.48 0.5 0.5 0.05 0.01 0 0 02003 25 0.133 0.37 0.48 0.51 0.51 0.05 0.01 0 0 02004 25 0.128 0.36 0.48 0.51 0.5 0.05 0.01 0 0 0

Gray Trigger Assessment Report March 2006
-10-
Table 4 (cont.)—Catch at Age by Fleet and Year.
B. Recreational West Year N 0 0 0.05506 0.27679 0.33185 0.45536 0.42411 0.28274 0.05506 0.119051981 1 0 0 0.02 0.14 0.23 0 0 0 0 01982 1 0.014 0.11 0.13 0.23 0.3 0 0 0 0 01983 1 0 0 0.03 0.14 0.09 0 0 0 0 01984 3 0 0 0.03 0.06 0.14 0 0.01 0 0 01985 1 0 0.02 0.03 0.15 0.14 0 0 0 0 01986 22 0.026 0.09 0.11 0.21 0.32 0.02 0.01 0 0 01987 24 0.021 0.07 0.09 0.2 0.33 0.02 0.02 0 0 01988 17 0.015 0.09 0.1 0.22 0.34 0.02 0.01 0 0 01989 25 0.008 0.06 0.08 0.2 0.34 0.03 0.02 0.01 0 01990 25 0.007 0.05 0.07 0.19 0.32 0.04 0.02 0.01 0 01991 25 0.004 0.03 0.06 0.18 0.31 0.03 0.02 0.01 0 0.011992 25 0.013 0.06 0.08 0.2 0.33 0.07 0.05 0.02 0 0.011993 25 0.003 0.03 0.05 0.16 0.29 0.05 0.04 0.01 0 0.011994 25 0.005 0.05 0.07 0.18 0.32 0.07 0.05 0.02 0.01 0.011995 25 0.003 0.03 0.05 0.17 0.32 0.06 0.04 0.01 0 0.011996 25 0.005 0.04 0.06 0.18 0.34 0.05 0.04 0.01 0 0.011997 19 0.005 0.05 0.07 0.18 0.28 0.02 0.02 0.01 0 01998 25 0.004 0.04 0.06 0.17 0.32 0.04 0.03 0.01 0 01999 14 0.003 0.03 0.06 0.18 0.32 0.02 0.01 0 0 02000 6 0 0.03 0.06 0.14 0.29 0.01 0.01 0 0 02001 11 0.003 0.03 0.05 0.18 0.33 0.01 0.01 0 0 02002 15 0.005 0.02 0.03 0.17 0.3 0.02 0.01 0 0 02003 18 0.003 0.04 0.06 0.18 0.3 0.02 0.01 0.01 0 02004 12 0.001 0.03 0.06 0.17 0.31 0.01 0.01 0 0 0
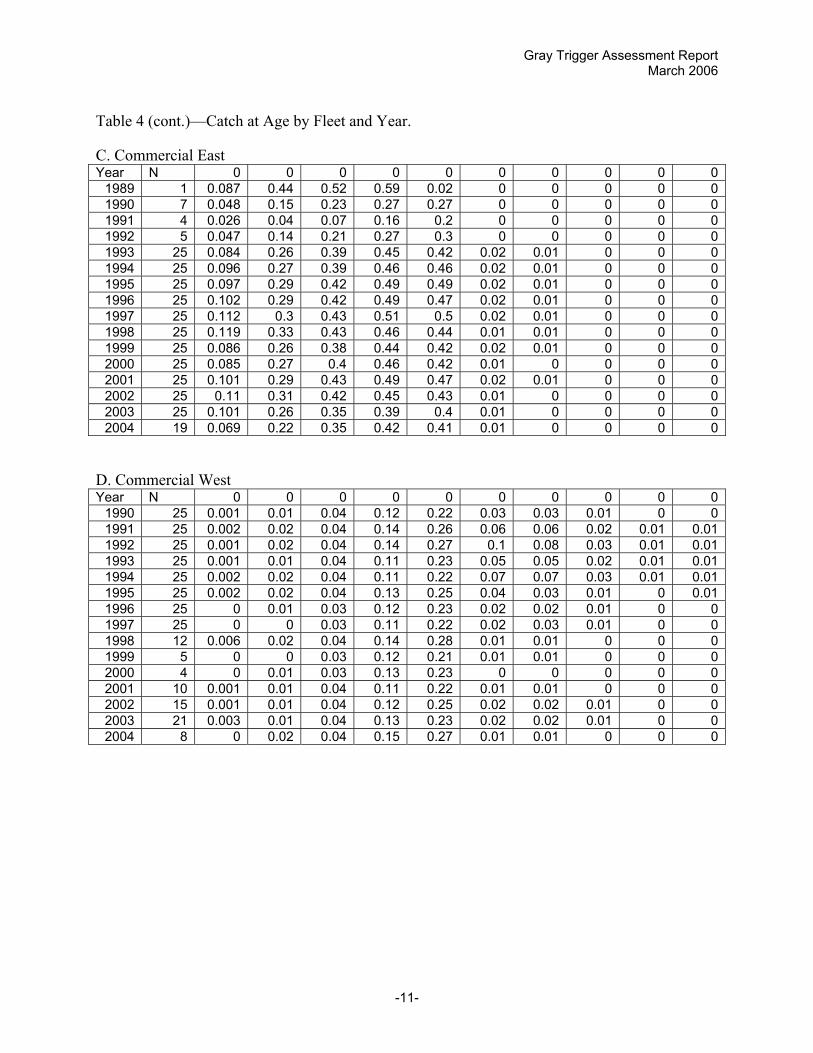
Gray Trigger Assessment Report March 2006
-11-
Table 4 (cont.)—Catch at Age by Fleet and Year.
C. Commercial East Year N 0 0 0 0 0 0 0 0 0 0
1989 1 0.087 0.44 0.52 0.59 0.02 0 0 0 0 01990 7 0.048 0.15 0.23 0.27 0.27 0 0 0 0 01991 4 0.026 0.04 0.07 0.16 0.2 0 0 0 0 01992 5 0.047 0.14 0.21 0.27 0.3 0 0 0 0 01993 25 0.084 0.26 0.39 0.45 0.42 0.02 0.01 0 0 01994 25 0.096 0.27 0.39 0.46 0.46 0.02 0.01 0 0 01995 25 0.097 0.29 0.42 0.49 0.49 0.02 0.01 0 0 01996 25 0.102 0.29 0.42 0.49 0.47 0.02 0.01 0 0 01997 25 0.112 0.3 0.43 0.51 0.5 0.02 0.01 0 0 01998 25 0.119 0.33 0.43 0.46 0.44 0.01 0.01 0 0 01999 25 0.086 0.26 0.38 0.44 0.42 0.02 0.01 0 0 02000 25 0.085 0.27 0.4 0.46 0.42 0.01 0 0 0 02001 25 0.101 0.29 0.43 0.49 0.47 0.02 0.01 0 0 02002 25 0.11 0.31 0.42 0.45 0.43 0.01 0 0 0 02003 25 0.101 0.26 0.35 0.39 0.4 0.01 0 0 0 02004 19 0.069 0.22 0.35 0.42 0.41 0.01 0 0 0 0
D. Commercial West Year N 0 0 0 0 0 0 0 0 0 0
1990 25 0.001 0.01 0.04 0.12 0.22 0.03 0.03 0.01 0 01991 25 0.002 0.02 0.04 0.14 0.26 0.06 0.06 0.02 0.01 0.011992 25 0.001 0.02 0.04 0.14 0.27 0.1 0.08 0.03 0.01 0.011993 25 0.001 0.01 0.04 0.11 0.23 0.05 0.05 0.02 0.01 0.011994 25 0.002 0.02 0.04 0.11 0.22 0.07 0.07 0.03 0.01 0.011995 25 0.002 0.02 0.04 0.13 0.25 0.04 0.03 0.01 0 0.011996 25 0 0.01 0.03 0.12 0.23 0.02 0.02 0.01 0 01997 25 0 0 0.03 0.11 0.22 0.02 0.03 0.01 0 01998 12 0.006 0.02 0.04 0.14 0.28 0.01 0.01 0 0 01999 5 0 0 0.03 0.12 0.21 0.01 0.01 0 0 02000 4 0 0.01 0.03 0.13 0.23 0 0 0 0 02001 10 0.001 0.01 0.04 0.11 0.22 0.01 0.01 0 0 02002 15 0.001 0.01 0.04 0.12 0.25 0.02 0.02 0.01 0 02003 21 0.003 0.01 0.04 0.13 0.23 0.02 0.02 0.01 0 02004 8 0 0.02 0.04 0.15 0.27 0.01 0.01 0 0 0

Gray Trigger Assessment Report March 2006
-12-
Table 5—Model Estimates and Benchmarks. *Note that the estimated α run is presented in a form where α was fixed to facilitate comparison to other runs, which also fixed α.
A. Fits
Base Median α Est α* M = 0.25 M = 0.3 20% recr dev
60% recr dev
1950 start
Data pts 292 292 292 292 292 292 292 292Est params 170 170 170 170 170 170 170 170Obj Func -78.5 -74.1 -79.3 -74.4 -77.7 -82.3 -75.8 -49.9AIC 183 192 181 191 185 175 188 240
B. Benchmarks
Base Median α Est α* M = 0.25 M = 0.3 20% recr dev
60% recr dev
1950 start
Alpha 32.8 12.9 50.3 33 32.5 32.9 32.6 32.9Steepness 0.89 0.76 0.93 0.89 0.89 0.89 0.89 0.89Max Recr (m fish) 2.146 2.326 2.105 2.019 2.344 2.522 1.893 2.193SSBvirgin (t eggs) 7.513 8.14 7.369 8.298 6.561 8.826 6.627 7.675SSBMSY (t eggs) 1.21 1.78 1.049 1.345 1.051 1.421 1.071 1.233SSB20%SPR (t eggs) 1.316 1.083 1.355 1.456 1.148 1.546 1.159 1.343SSB30%SPR (t eggs) 2.094 1.967 2.109 2.315 1.823 2.458 1.842 2.138SSB40%SPR (t eggs) 2.868 2.855 2.861 3.17 2.505 3.373 2.526 2.933SSB50%SPR (t eggs) 3.648 3.743 3.618 4.029 3.188 4.276 3.215 3.722FMSY 0.45 0.294 0.525 0.406 0.484 0.448 0.447 0.465F20%SPR 0.419 0.421 0.419 0.38 0.449 0.417 0.418 0.432F30%SPR 0.269 0.27 0.269 0.246 0.289 0.268 0.269 0.276F40%SPR 0.186 0.186 0.186 0.171 0.199 0.185 0.186 0.19F50%SPR 0.131 0.131 0.131 0.121 0.14 0.131 0.131 0.134MSY (m lbs) 1.638 1.441 1.707 1.595 1.703 1.925 1.443 1.678

Gray Trigger Assessment Report March 2006
-13-
Table 6—Stock Status.
Base Median α Est α* M = 0.25 M = 0.3 20% recr dev
60% recr dev
1950 start
SSB2004 (t) 1.345 1.323 1.351 1.286 1.461 1.478 1.319 1.372 /SSBMSY 1.11 0.74 1.29 0.96 1.39 1.04 1.23 1.11 /SSB20%SPR 1.02 1.22 1 0.88 1.27 0.96 1.14 1.02 /SSB30%SPR 0.64 0.67 0.64 0.56 0.8 0.6 0.72 0.64F2004 0.435 0.431 0.435 0.451 0.371 0.422 0.435 0.436 /FMSY 0.97 1.47 0.83 1.11 0.77 0.94 0.97 0.94 /F30%SPR 1.62 1.6 1.62 1.83 1.28 1.58 1.62 1.58

Gray Trigger Assessment Report March 2006
-14-
Table 7—Projections. New F rates applied starting in 2007.
Directed Catches (m lbs) Under Various Fishing Mortality Rates. Year F=0 F2004 FMSY F30%SPR 0.75*F30%SPR
2000 0.762 0.762 0.762 0.762 0.7622001 1.0032 1.0032 1.0032 1.0032 1.00322002 1.1784 1.1784 1.1784 1.1784 1.17842003 1.0896 1.0896 1.0896 1.0896 1.08962004 0.9864 0.9864 0.9864 0.9864 0.98642005 0.9828 0.9828 0.9828 0.9828 0.98282006 0.9168 0.9168 0.9168 0.9168 0.91682007 0 0.8598 0.8826 0.56514 0.432782008 0 0.7998 0.8148 0.57924 0.462062009 0 0.8328 0.8442 0.6384 0.522122010 0 0.8526 0.861 0.6882 0.576482011 0 0.735 0.738 0.6342 0.546662012 0 0.6978 0.6996 0.6216 0.54512013 0 0.6546 0.6546 0.6042 0.53912014 0 0.657 0.657 0.6102 0.547862015 0 0.6636 0.663 0.621 0.559622016 0 0.696 0.696 0.645 0.580142017 0 0.8178 0.8196 0.7374 0.6552
Spawning Stock Biomass Relative to 20% SPR Levels Under Various Fishing Mortality Rates. Year F=0 F2004 FMSY F30%SPR 0.75*F30%SPR
2000 0.953753 0.953753 0.953753 0.953753 0.9537532001 1.123578 1.123578 1.123578 1.123578 1.1235782002 1.129644 1.129644 1.129644 1.129644 1.1296442003 1.064443 1.064443 1.064443 1.064443 1.0644432004 0.980288 0.980288 0.980288 0.980288 0.9802882005 0.97953 0.97953 0.97953 0.97953 0.979532006 0.912813 0.912813 0.912813 0.912813 0.9128132007 1.030326 0.874905 0.870356 0.931008 0.9545112008 1.269901 0.815011 0.803639 0.961334 1.0303262009 1.608795 0.838514 0.822593 1.065201 1.1789232010 1.937074 0.835481 0.81577 1.13116 1.2896132011 2.145565 0.743518 0.721531 1.084913 1.2789992012 2.402578 0.719333 0.696133 1.094769 1.3191812013 2.608795 0.663306 0.639651 1.059894 1.3085672014 2.86884 0.664746 0.640561 1.079606 1.3495072015 3.091736 0.655118 0.630705 1.082638 1.3692192016 3.345716 0.683927 0.658908 1.125853 1.4283552017 3.651251 0.777104 0.750569 1.242608 1.561789

Gray Trigger Assessment Report March 2006
-15-
Table 7 (cont.)—Projections. New F rates applied starting in 2007.
Fishing Mortality Rates Relative to 30% SPR Levels Under Various Fishing Mortality Rates. Year F=0 F2004 FMSY F30%SPR 0.75*F30%SPR
2000 1.412698 1.412698 1.412698 1.412698 1.4126982001 1.501512 1.501512 1.501512 1.501512 1.5015122002 1.566893 1.566893 1.566893 1.566893 1.5668932003 1.613757 1.613757 1.613757 1.613757 1.6137572004 1.643235 1.643235 1.643235 1.643235 1.6432352005 1.60771 1.60771 1.60771 1.60771 1.607712006 1.60771 1.60771 1.60771 1.60771 1.607712007 0 1.60771 1.657596 1 0.7482992008 0 1.60771 1.657596 1 0.7482992009 0 1.60771 1.657596 1 0.7482992010 0 1.60771 1.657596 1 0.7482992011 0 1.60771 1.657596 1 0.7482992012 0 1.60771 1.657596 1 0.7482992013 0 1.60771 1.657596 1 0.7482992014 0 1.60771 1.657596 1 0.7482992015 0 1.60771 1.657596 1 0.7482992016 0 1.60771 1.657596 1 0.7482992017 0 1.60771 1.657596 1 0.748299
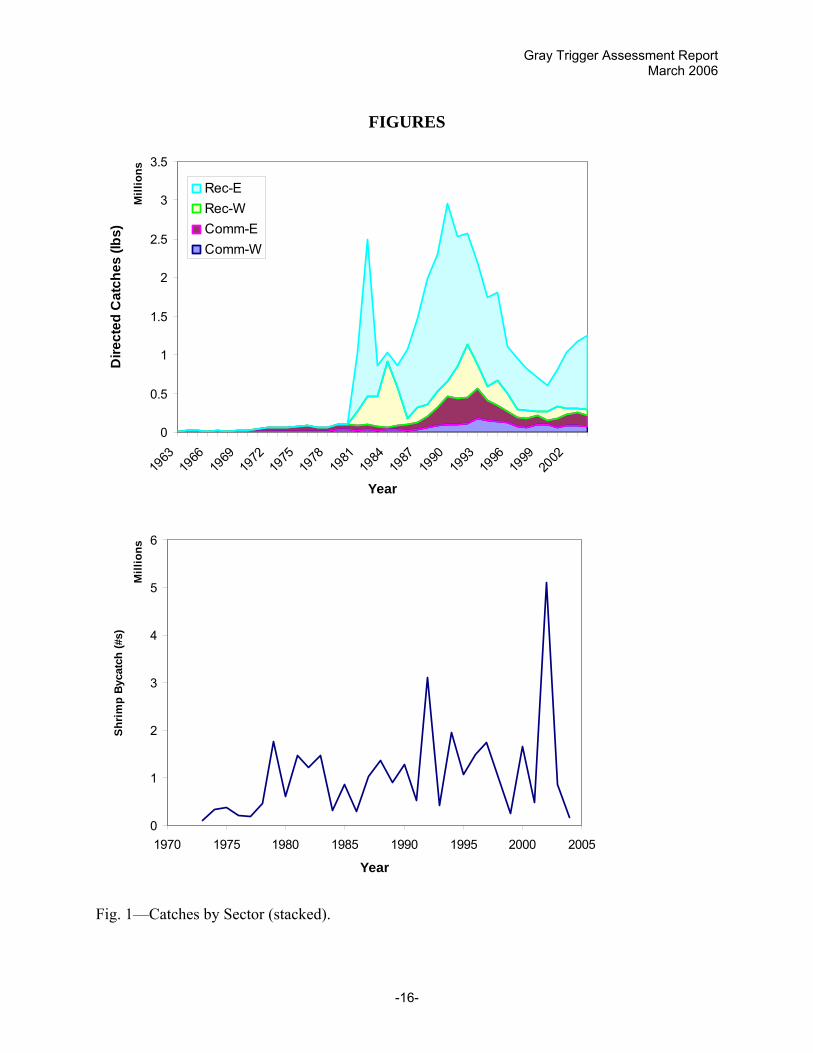
Gray Trigger Assessment Report March 2006
-16-
FIGURES
0
0.5
1
1.5
2
2.5
3
3.5
1963
1966
1969
1972
1975
1978
1981
1984
1987
1990
1993
1996
1999
2002
Mill
ions
Year
Dire
cted
Cat
ches
(lbs
)
Rec-ERec-WComm-EComm-W
0
1
2
3
4
5
6
1970 1975 1980 1985 1990 1995 2000 2005
Mill
ions
Year
Shr
imp
Byca
tch
(#s)
Fig. 1—Catches by Sector (stacked).

Gray Trigger Assessment Report March 2006
-17-
Fishery Dependent Indices
0
1
2
3
4
5
6
7
8
1980 1985 1990 1995 2000 2005
Year
Rel
ativ
e In
dex
Valu
e
MRFSSEHeadboatEHeadboatWCmHLECmHLW
Fishery Independent Indices
0
0.5
1
1.5
2
2.5
3
3.5
1985 1990 1995 2000 2005
Year
Rel
ativ
e In
dex
Valu
e NeustonTrawlVideo
Fig. 2—Indices of Abundance.
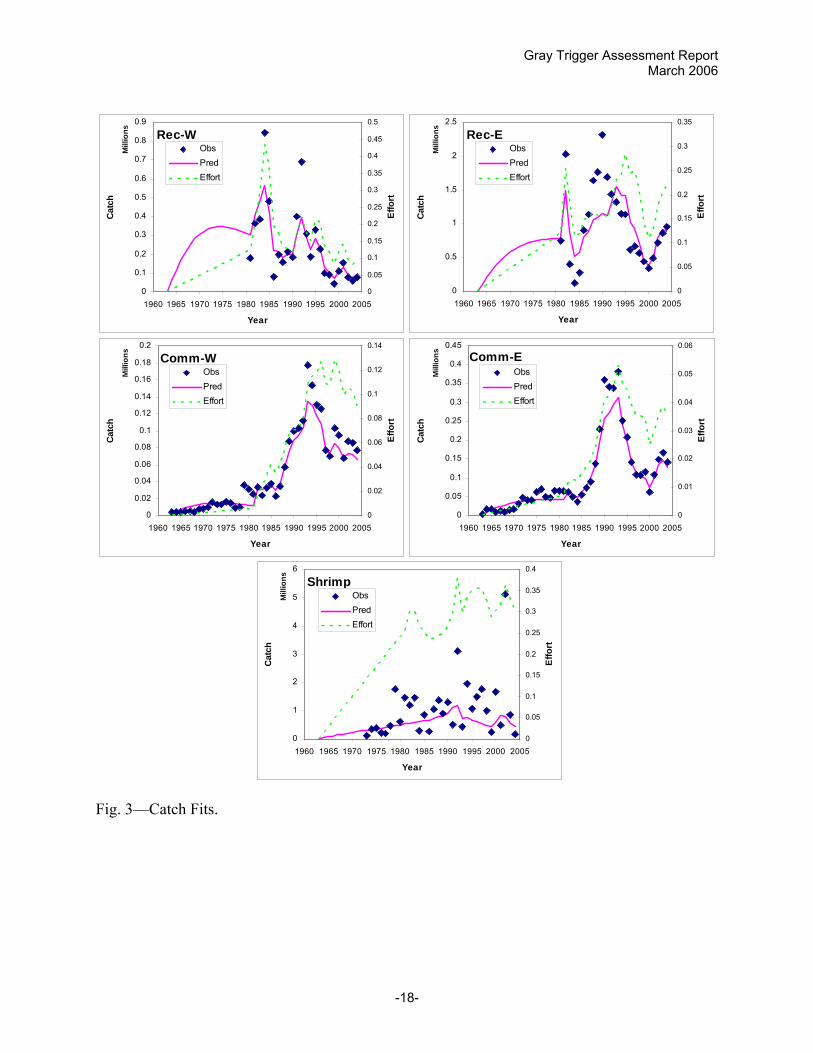
Gray Trigger Assessment Report March 2006
-18-
Rec-W
0
0.1
0.2
0.3
0.4
0.5
0.6
0.7
0.8
0.9
1960 1965 1970 1975 1980 1985 1990 1995 2000 2005
Mill
ions
Year
Catc
h
0
0.05
0.1
0.15
0.2
0.25
0.3
0.35
0.4
0.45
0.5
Effo
rt
ObsPredEffort
Comm-W
0
0.02
0.04
0.06
0.08
0.1
0.12
0.14
0.16
0.18
0.2
1960 1965 1970 1975 1980 1985 1990 1995 2000 2005
Mill
ions
Year
Catc
h
0
0.02
0.04
0.06
0.08
0.1
0.12
0.14
Effo
rt
ObsPredEffort
Rec-E
0
0.5
1
1.5
2
2.5
1960 1965 1970 1975 1980 1985 1990 1995 2000 2005
Mill
ions
Year
Catc
h
0
0.05
0.1
0.15
0.2
0.25
0.3
0.35
Effo
rt
ObsPredEffort
Comm-E
0
0.05
0.1
0.15
0.2
0.25
0.3
0.35
0.4
0.45
1960 1965 1970 1975 1980 1985 1990 1995 2000 2005
Mill
ions
Year
Catc
h
0
0.01
0.02
0.03
0.04
0.05
0.06
Effo
rt
ObsPredEffort
Shrimp
0
1
2
3
4
5
6
1960 1965 1970 1975 1980 1985 1990 1995 2000 2005
Mill
ions
Year
Catc
h
0
0.05
0.1
0.15
0.2
0.25
0.3
0.35
0.4
Effo
rt
ObsPredEffort
Fig. 3—Catch Fits.
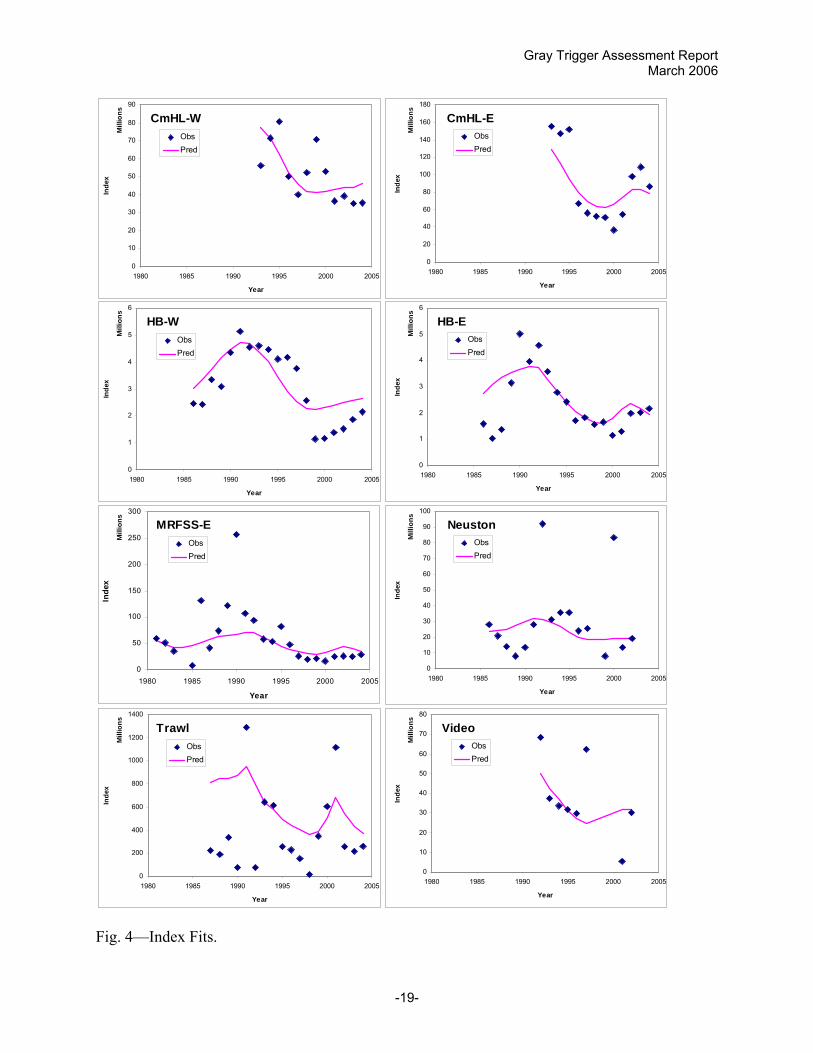
Gray Trigger Assessment Report March 2006
-19-
Neuston
0
10
20
30
40
50
60
70
80
90
100
1980 1985 1990 1995 2000 2005
Mill
ions
Year
Inde
x
ObsPred
Trawl
0
200
400
600
800
1000
1200
1400
1980 1985 1990 1995 2000 2005
Mill
ions
Year
Inde
x
ObsPred
Video
0
10
20
30
40
50
60
70
80
1980 1985 1990 1995 2000 2005
Mill
ions
Year
Inde
x
ObsPred
CmHL-W
0
10
20
30
40
50
60
70
80
90
1980 1985 1990 1995 2000 2005
Mill
ions
Year
Inde
x
ObsPred
HB-E
0
1
2
3
4
5
6
1980 1985 1990 1995 2000 2005
Mill
ions
Year
Inde
x
ObsPred
HB-W
0
1
2
3
4
5
6
1980 1985 1990 1995 2000 2005
Mill
ions
Year
Inde
x
ObsPred
CmHL-E
0
20
40
60
80
100
120
140
160
180
1980 1985 1990 1995 2000 2005
Mill
ions
Year
Inde
x
ObsPred
MRFSS-E
0
50
100
150
200
250
300
1980 1985 1990 1995 2000 2005
Mill
ions
Year
Inde
x
ObsPred
Fig. 4—Index Fits.
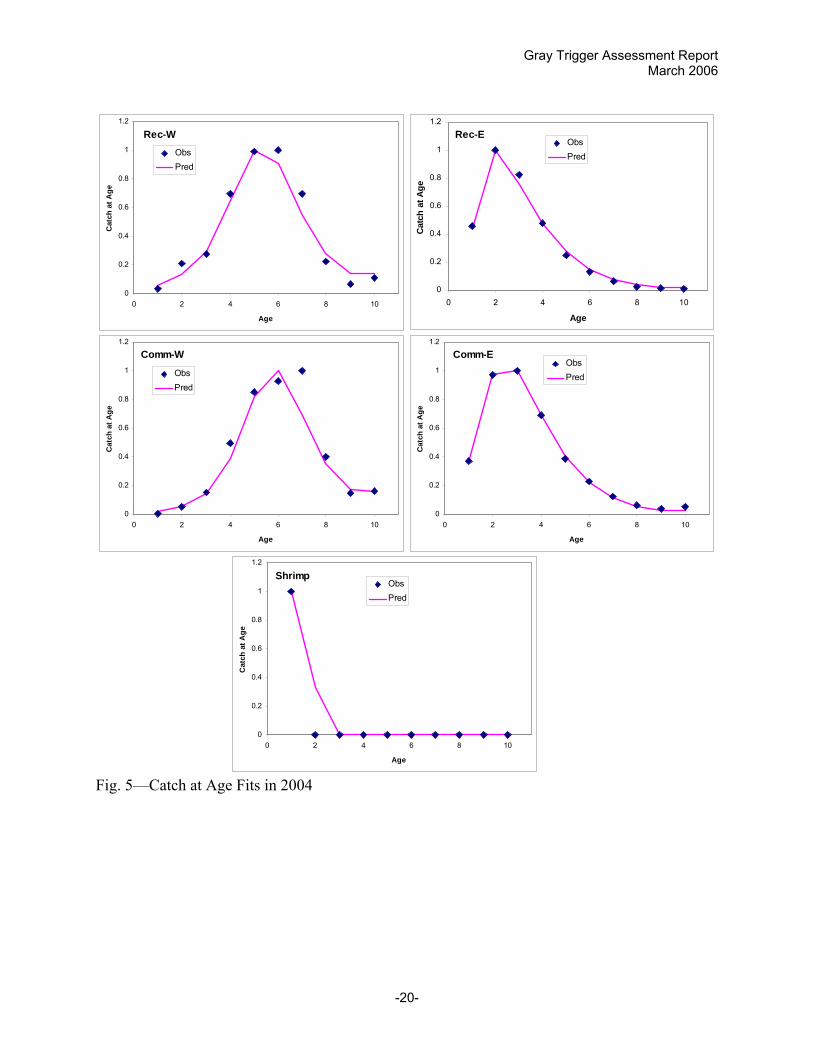
Gray Trigger Assessment Report March 2006
-20-
Rec-W
0
0.2
0.4
0.6
0.8
1
1.2
0 2 4 6 8 10
Age
Cat
ch a
t Age
ObsPred
Comm-W
0
0.2
0.4
0.6
0.8
1
1.2
0 2 4 6 8 10
Age
Cat
ch a
t Age
ObsPred
Rec-E
0
0.2
0.4
0.6
0.8
1
1.2
0 2 4 6 8 10
Age
Catc
h at
Age
ObsPred
Comm-E
0
0.2
0.4
0.6
0.8
1
1.2
0 2 4 6 8 10
Age
Cat
ch a
t Age
ObsPred
Shrimp
0
0.2
0.4
0.6
0.8
1
1.2
0 2 4 6 8 10
Age
Cat
ch a
t Age
ObsPred
Fig. 5—Catch at Age Fits in 2004

Gray Trigger Assessment Report March 2006
-21-
Gulf of Mexico Gray Trigger
0
1
2
3
4
5
6
7
8
1960 1965 1970 1975 1980 1985 1990 1995 2000 2005
Trill
ions
Year
Spaw
ning
Sto
ck B
iom
ass
SSBVirginMSY
Gulf of Mexico Gray Trigger
0
0.1
0.2
0.3
0.4
0.5
0.6
0.7
1960 1965 1970 1975 1980 1985 1990 1995 2000 2005
Year
Fish
ing
Mor
talit
y R
ate
FMSY
Gulf of Mexico Gray Trigger
0
0.5
1
1.5
2
2.5
3
3.5
4
4.5
1960 1965 1970 1975 1980 1985 1990 1995 2000 2005
Mill
ions
Year
Rec
ruitm
ent
RecruitsVirginMSY
Fig. 6—Trajectories According to the Base Model. (a) SSB, (b) F, (c) recruitment.

Gray Trigger Assessment Report March 2006
-22-
Fixed alpha 32 (stp = 0.89)
0
0.5
1
1.5
2
2.5
3
3.5
4
4.5
5
0 0.5 1 1.5 2 2.5 3 3.5 4 4.5
Mill
ions
Trillions
Spawners
Rec
ruits
ObservedExpected Ro = 1.53e7
stp = 0.442
Fig. 7—Stock-Recruitment Patterns Considering the Deviations Predicted by the Model.
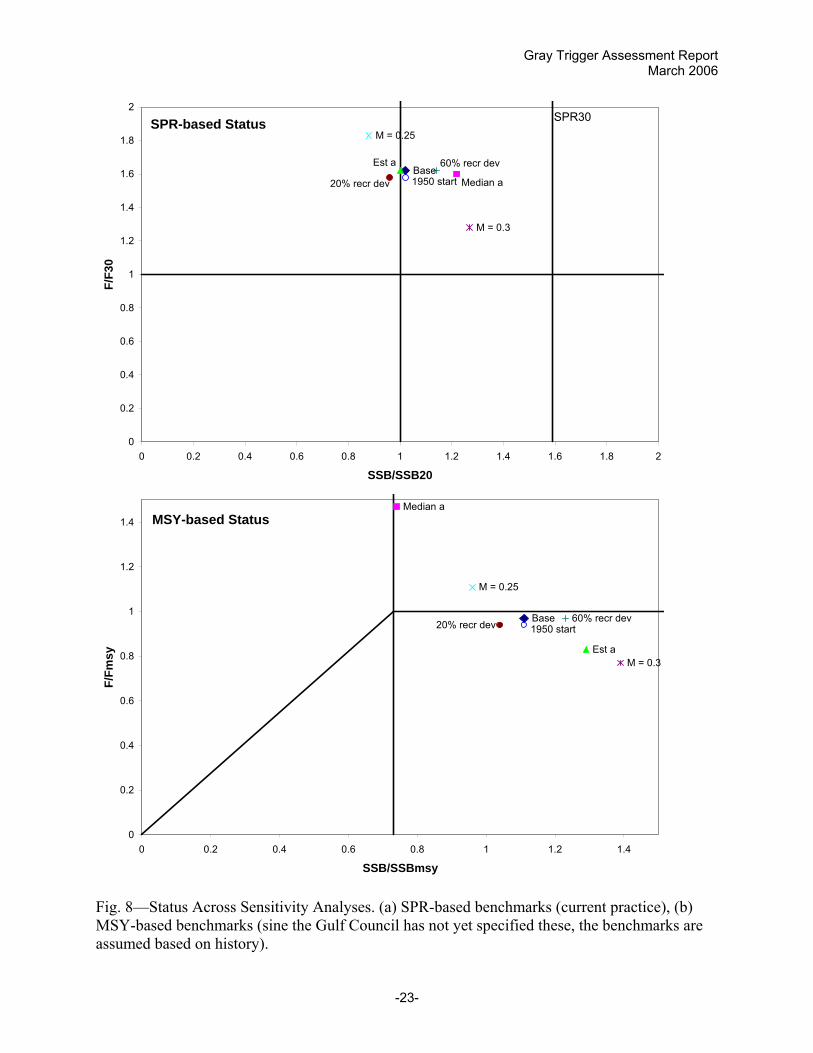
Gray Trigger Assessment Report March 2006
-23-
SPR-based Status
Base
M = 0.25
M = 0.3
Median a
Est a
20% recr dev
60% recr dev
1950 start
SPR30
0
0.2
0.4
0.6
0.8
1
1.2
1.4
1.6
1.8
2
0 0.2 0.4 0.6 0.8 1 1.2 1.4 1.6 1.8 2
SSB/SSB20
F/F3
0
MSY-based Status
Base
Median a
Est a
M = 0.25
M = 0.3
60% recr dev20% recr dev 1950 start
0
0.2
0.4
0.6
0.8
1
1.2
1.4
0 0.2 0.4 0.6 0.8 1 1.2 1.4
SSB/SSBmsy
F/Fm
sy
Fig. 8—Status Across Sensitivity Analyses. (a) SPR-based benchmarks (current practice), (b) MSY-based benchmarks (sine the Gulf Council has not yet specified these, the benchmarks are assumed based on history).
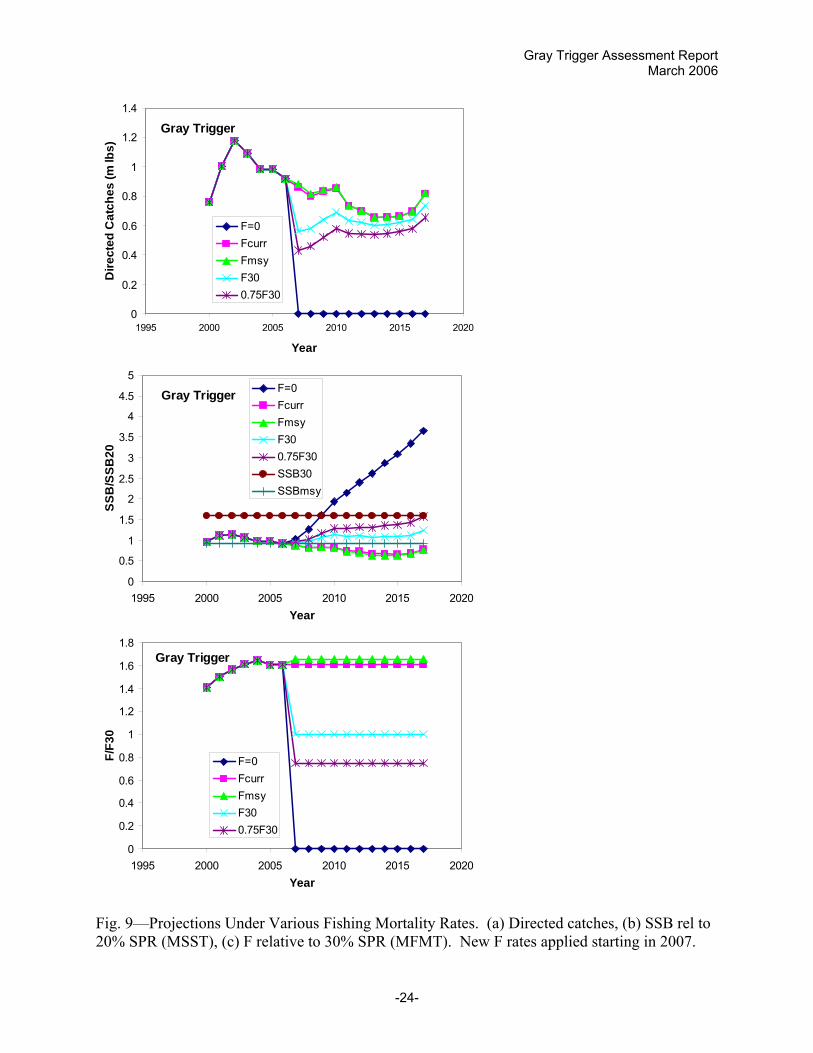
Gray Trigger Assessment Report March 2006
-24-
Gray Trigger
0
0.2
0.4
0.6
0.8
1
1.2
1.4
1995 2000 2005 2010 2015 2020
Year
Dire
cted
Cat
ches
(m lb
s)
F=0FcurrFmsyF300.75F30
Gray Trigger
0
0.5
1
1.5
2
2.5
3
3.5
4
4.5
5
1995 2000 2005 2010 2015 2020Year
SSB
/SSB
20
F=0FcurrFmsyF300.75F30SSB30SSBmsy
Gray Trigger
0
0.2
0.4
0.6
0.8
1
1.2
1.4
1.6
1.8
1995 2000 2005 2010 2015 2020Year
F/F3
0
F=0FcurrFmsyF300.75F30
Fig. 9—Projections Under Various Fishing Mortality Rates. (a) Directed catches, (b) SSB rel to 20% SPR (MSST), (c) F relative to 30% SPR (MFMT). New F rates applied starting in 2007.

Gray Trigger Assessment ReportMarch 2006
Appendix 1--Input Data Files for SSASPM Base Run
#////////////////////////////////////////////////////////////////////////////////////////////#////////////////////////////////////////////////////////////////////////////////////////////#// INPUT DATA FILE FOR PROGRAM SSASPM#//#// Gulf of Mexico Gray Triggerfish#// August 2005 Modified 30-Mar-06#//#// Josh Sladek Nowlis#// NOAA Fisheries#// Southeast Fisheries Science Center#// Miami, FL#// (305) 361-4222#// [email protected]#//#//#// Select columns A-M, save as ssaspmlinear.dat#// Important notes:#// (1) Comments may be placed BEFORE or AFTER any line of data, however they MUST begin#// with a # symbol in the first column.#// (2) No comments of any kind may appear on the same line as the data (the ##// symbol will not save you here)#// (3) Blank lines without a # symbol are not allowed.#// #////////////////////////////////////////////////////////////////////////////////////////////#////////////////////////////////////////////////////////////////////////////////////////////###################################################### GENERAL INFORMATION##################################################### first and last year of data
1963 2004# number of years of historical period
18# Historic effort (0 = exact match to effort data, 1 = estimated constant, 2 = estimated linear)
2# first and last age of data
1 10# number of seasons (months) per year
12# type of overall variance parameter (1 = log scale variance, 2 = observation scale variance, 0=force equal weighting)
1# spawning season (integer representing season/month of year when spawning occurs)
7# maturity schedue (fraction mof each age class that is sexually mature
0.875 1 1 1 1 1 1 1 1 1# fecundity schedule (index of per capita fecundity of each age class--batch fecundity in millions of eggs)0.2335502 0.320312 0.439306 0.602506 0.826332 1.133309 1.5543255 2.131747 2.923676 4.009801##################################################### CATCH INFORMATION ##################################################### number of catch data series (if there are no series, there should be no entries after the next line below)
5# pdf of observation error for each series (1) lognormal, (2) normal
1 1 1 1 1# units (1=numbers, 2=weight)
2 2 2 2 1# season (month) when fishing begins for each series
1 1 1 1 7# season (month) when fishing ends for each series
12 12 12 12 12# set of catch variance parameters each series is linked to
1 1 1 1 2# set of q parameters each series is linked to
1 2 3 4 5# set of s parameters each series is linked to
1 2 3 4 5# set of e parameters each series is linked to
Page 25
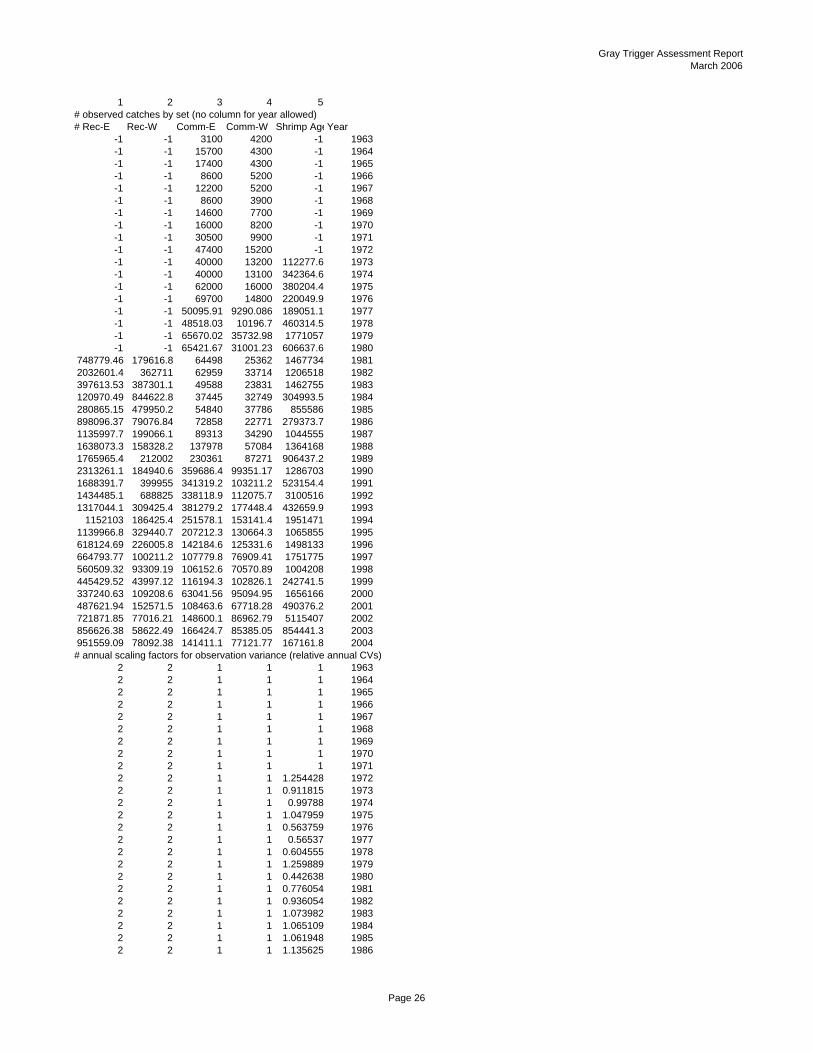
Gray Trigger Assessment ReportMarch 2006
1 2 3 4 5# observed catches by set (no column for year allowed)# Rec-E Rec-W Comm-E Comm-W Shrimp AgeYear
-1 -1 3100 4200 -1 1963-1 -1 15700 4300 -1 1964-1 -1 17400 4300 -1 1965-1 -1 8600 5200 -1 1966-1 -1 12200 5200 -1 1967-1 -1 8600 3900 -1 1968-1 -1 14600 7700 -1 1969-1 -1 16000 8200 -1 1970-1 -1 30500 9900 -1 1971-1 -1 47400 15200 -1 1972-1 -1 40000 13200 112277.6 1973-1 -1 40000 13100 342364.6 1974-1 -1 62000 16000 380204.4 1975-1 -1 69700 14800 220049.9 1976-1 -1 50095.91 9290.086 189051.1 1977-1 -1 48518.03 10196.7 460314.5 1978-1 -1 65670.02 35732.98 1771057 1979-1 -1 65421.67 31001.23 606637.6 1980
748779.46 179616.8 64498 25362 1467734 19812032601.4 362711 62959 33714 1206518 1982397613.53 387301.1 49588 23831 1462755 1983120970.49 844622.8 37445 32749 304993.5 1984280865.15 479950.2 54840 37786 855586 1985898096.37 79076.84 72858 22771 279373.7 19861135997.7 199066.1 89313 34290 1044555 19871638073.3 158328.2 137978 57084 1364168 19881765965.4 212002 230361 87271 906437.2 19892313261.1 184940.6 359686.4 99351.17 1286703 19901688391.7 399955 341319.2 103211.2 523154.4 19911434485.1 688825 338118.9 112075.7 3100516 19921317044.1 309425.4 381279.2 177448.4 432659.9 1993
1152103 186425.4 251578.1 153141.4 1951471 19941139966.8 329440.7 207212.3 130664.3 1065855 1995618124.69 226005.8 142184.6 125331.6 1498133 1996664793.77 100211.2 107779.8 76909.41 1751775 1997560509.32 93309.19 106152.6 70570.89 1004208 1998445429.52 43997.12 116194.3 102826.1 242741.5 1999337240.63 109208.6 63041.56 95094.95 1656166 2000487621.94 152571.5 108463.6 67718.28 490376.2 2001721871.85 77016.21 148600.1 86962.79 5115407 2002856626.38 58622.49 166424.7 85385.05 854441.3 2003951559.09 78092.38 141411.1 77121.77 167161.8 2004# annual scaling factors for observation variance (relative annual CVs)
2 2 1 1 1 19632 2 1 1 1 19642 2 1 1 1 19652 2 1 1 1 19662 2 1 1 1 19672 2 1 1 1 19682 2 1 1 1 19692 2 1 1 1 19702 2 1 1 1 19712 2 1 1 1.254428 19722 2 1 1 0.911815 19732 2 1 1 0.99788 19742 2 1 1 1.047959 19752 2 1 1 0.563759 19762 2 1 1 0.56537 19772 2 1 1 0.604555 19782 2 1 1 1.259889 19792 2 1 1 0.442638 19802 2 1 1 0.776054 19812 2 1 1 0.936054 19822 2 1 1 1.073982 19832 2 1 1 1.065109 19842 2 1 1 1.061948 19852 2 1 1 1.135625 1986
Page 26

Gray Trigger Assessment ReportMarch 2006
2 2 1 1 1.177493 19871 1 1 1 1.155266 19881 1 1 1 1.109468 19891 1 1 1 1.139841 19901 1 1 1 1.144917 19911 1 1 1 0.477896 19921 1 1 1 0.443595 19931 1 1 1 0.935097 19941 1 1 1 1.088391 19951 1 1 1 1.143002 19961 1 1 1 1.120295 19971 1 1 1 1.127864 19981 1 1 1 1.074978 19991 1 1 1 1.184296 20001 1 1 1 1.187074 20011 1 1 1 1.173661 20021 1 1 1 1.219074 20031 1 1 1 1.400728 2004
##################################################### INDICES OF ABUNDANCE (e.g., CPUE) If there are no series, there should be no entries between the comment lines.##################################################### number of index data series
8# pdf of observation error for each series (1) lognormal, (2) normal
1 1 1 1 1 1 1 1# units (1=numbers, 2=weight)
1 1 1 2 2 1 1 1# season (month) when index begins for each series
1 1 1 1 1 10 9 5# season (month) when index ends for each series
12 12 12 12 12 11 11 8# option to (1) scale or (0) not to scale index observations
0 0 0 0 0 0 0 0# set of index variance parameters each series is linked to
1 1 1 1 1 1 1 1# set of q parameters each series is linked to
6 7 8 9 10 11 12 13# set of s parameters each series is linked to
1 1 2 3 4 6 7 8# observed indices by series x 10^8 (no column for year allowed)# MRFSSE HBE HBW CmHLE CmHLW LarvalGW- TrawlGW VideoGW Year
-1 -1 -1 -1 -1 -1 -1 -1 1963-1 -1 -1 -1 -1 -1 -1 -1 1964-1 -1 -1 -1 -1 -1 -1 -1 1965-1 -1 -1 -1 -1 -1 -1 -1 1966-1 -1 -1 -1 -1 -1 -1 -1 1967-1 -1 -1 -1 -1 -1 -1 -1 1968-1 -1 -1 -1 -1 -1 -1 -1 1969-1 -1 -1 -1 -1 -1 -1 -1 1970-1 -1 -1 -1 -1 -1 -1 -1 1971-1 -1 -1 -1 -1 -1 -1 -1 1972-1 -1 -1 -1 -1 -1 -1 -1 1973-1 -1 -1 -1 -1 -1 -1 -1 1974-1 -1 -1 -1 -1 -1 -1 -1 1975-1 -1 -1 -1 -1 -1 -1 -1 1976-1 -1 -1 -1 -1 -1 -1 -1 1977-1 -1 -1 -1 -1 -1 -1 -1 1978-1 -1 -1 -1 -1 -1 -1 -1 1979-1 -1 -1 -1 -1 -1 -1 -1 1980
59559378 -1 -1 -1 -1 -1 -1 -1 198150868542 -1 -1 -1 -1 -1 -1 -1 198235535094 -1 -1 -1 -1 -1 -1 -1 1983
213935444 -1 -1 -1 -1 -1 -1 -1 19847822068.2 -1 -1 -1 -1 -1 -1 -1 1985131048572 1578860 2456749 -1 -1 28090000 -1 -1 198641944300 1039815 2426165 -1 -1 20700000 221222766 -1 198774319582 1366135 3340596 -1 -1 13960000 190217886 -1 1988
122178177 3132138 3081381 -1 -1 8002000 338042013 -1 1989256472874 5017220 4339279 -1 -1 13800000 77926820 -1 1990106996949 3957055 5133360 -1 -1 27840000 1.291E+09 -1 1991
Page 27

Gray Trigger Assessment ReportMarch 2006
94729530 4574219 4560725 -1 -1 91810000 75775134 68549000 199258760545 3585924 4591890 1.56E+08 55916617 31130000 640449444 37395000 199353296524 2780550 4463384 1.47E+08 71327783 35770000 613493817 33632000 199482087588 2419154 4099585 1.52E+08 80526939 35640000 257204165 31823000 199547628834 1715052 4180940 66896638 50180949 24180000 226347219 29654000 199626705984 1816977 3769818 55949368 39948460 25410000 154496306 62533000 199720243170 1561531 2565767 52796109 52268125 -1 14675364 -1 199820977824 1654448 1144995 50808752 70790644 8045000 346253161 -1 199916458045 1162980 1159826 37050498 52932912 83120000 602549721 -1 200025277308 1303939 1371411 54917389 36569329 13720000 1.115E+09 5343000 200126175442 1981108 1513616 97778962 39080538 19010000 258028537 29957000 200225252012 2005931 1856765 1.09E+08 35090550 -1 218780772 -1 200329049705 2154191 2137627 86613049 35260095 -1 261614013 -1 2004
# annual scaling factors for observation variance (relative annual CVs)1 1 1 1 1 1 1 1 19631 1 1 1 1 1 1 1 19641 1 1 1 1 1 1 1 19651 1 1 1 1 1 1 1 19661 1 1 1 1 1 1 1 19671 1 1 1 1 1 1 1 19681 1 1 1 1 1 1 1 19691 1 1 1 1 1 1 1 19701 1 1 1 1 1 1 1 19711 1 1 1 1 1 1 1 19721 1 1 1 1 1 1 1 19731 1 1 1 1 1 1 1 19741 1 1 1 1 1 1 1 19751 1 1 1 1 1 1 1 19761 1 1 1 1 1 1 1 19771 1 1 1 1 1 1 1 19781 1 1 1 1 1 1 1 19791 1 1 1 1 1 1 1 1980
2.3481011 1 1 1 1 1 1 1 19812.070742 1 1 1 1 1 1 1 19822.761414 1 1 1 1 1 1 1 1983
6.9512632 1 1 1 1 1 1 1 19847.2024144 1 1 1 1 1 1 1 19850.9399457 1.371901 0.951521 1 1 1 1 1 19861.2098526 1.832588 0.853511 1 1 0.934014 1.0551807 1 19871.1323095 1.285721 0.715741 1 1 1.090213 1.1171951 1 19881.1524367 0.684331 0.810134 1 1 1.158219 0.5279337 1 19891.0877329 0.446229 0.605246 1 1 0.868347 3.6978365 1 19901.0518819 0.549589 0.520694 1 1 0.834705 0.2072022 1 19910.8458045 0.480808 0.56144 1 1 0.900859 3.274347 0.865553 19921.0022765 0.566484 0.557139 1.060936 1.018465 1.132716 0.3129469 0.914865 19931.0913614 0.714003 0.528381 0.966938 0.999512 0.841992 0.3307473 0.878982 19941.174345 0.850946 0.563249 1.077523 1.01527 0.812304 0.7384777 0.974878 1995
1.2204588 1.053125 0.569626 1.006893 1.005816 0.970142 0.8194269 0.866941 19961.0742782 1.021767 0.661811 1.07055 1.006119 0.928487 1.7887012 1.060699 19971.041824 1.113295 0.873661 1.107454 0.996958 1.177347 0.7444719 1 1998
0.9039276 1.036357 1.727267 0.947706 0.985043 0.860483 0.5112333 1 19990.9771672 1.37544 1.643842 1.071766 0.992177 1.183722 0.3145877 1 20000.8978562 1.334974 1.392549 1.015394 1.003783 1.031773 0.2086763 1.395689 20010.8906162 1.023834 1.39093 0.906473 0.993139 0.820741 0.7019244 1.042393 20020.9040351 1.004179 1.088876 0.852938 0.991271 1.436616 0.8752888 1 20030.8218537 0.905594 1.002669 0.915428 0.992447 1.017321 0.7738224 1 2004##################################################### EFFORT OBSERVATIONS If there are no series, there should be no entries between the comment lines.##################################################### number of effort data series
0##################################################### AGE COMPOSITION OBSERVATIONS If there are no series, there should be no entries between the comment lines.##################################################### number of age-composition series (If there are no series,there should be no more entries in this section)
5# first year in age-composition series
1981# probability densities used for age-comp. series (0 = ignore, 3 = multinomial, 8 = robustified normal)
3 3 3 3 0
Page 28

Gray Trigger Assessment ReportMarch 2006
# units (only 1=numbers, no other options at this time)1 1 1 1 1
# season (month) when age collections begin for each series 1 1 1 1 7
# season (month) when age collections end for each series 12 12 12 12 12
# age composition data for all years in the modern period MAX 25 Divisor 10# series year sample sizeAge 1 Age 2 Age 3 Age 4 Age 5 Age 6 Age 7 Age 8 Age 9 Age 10+
1 1981 5 6.683833 14.55645 12.9313 7.567416 3.479636 1.86342 0.940379 0.330072 0.289612 0.3578061 1982 9 12.85183 25.20349 24.64398 15.073289 7.110661 3.663385 1.909051 0.78574 0.472655 0.2856861 1983 7 7.990986 20.09468 19.24166 11.4367 5.114646 3.066469 1.520591 0.673263 0.395281 0.4654881 1984 2 3.781056 8.243904 5.741553 2.7614778 1.589708 0.953419 0.424684 0.258591 0.068488 0.1771311 1985 3 2.700271 6.048892 6.216951 5.2300015 3.051017 1.439593 1.254609 0.325129 0.32401 0.4095681 1986 25 28.21374 70.70483 71.30153 47.530052 25.87361 14.52127 8.029534 3.354134 2.084648 2.3860211 1987 25 77.85847 155.1662 139.2159 93.993625 54.70624 29.33744 14.72234 6.233203 3.829021 2.936781 1988 25 88.74984 199.2801 177.8355 112.98372 57.91839 30.61759 16.32679 5.815902 3.698644 2.7727211 1989 25 199.2858 328.4621 251.3632 158.14253 91.6563 47.31169 21.74484 6.898737 5.589603 3.545861 1990 25 279.2999 513.461 367.1782 203.73874 112.1557 60.73686 25.98431 7.854036 5.91847 2.6745261 1991 25 204.1712 429.8621 380.9281 240.65181 125.4167 62.43495 31.82659 11.70053 6.905953 5.0999611 1992 25 299.4172 649.6174 557.9516 343.99012 175.938 91.81638 46.84962 16.35747 10.17757 7.8829391 1993 25 136.4747 297.766 246.7135 143.60209 73.76489 38.88499 19.11463 6.714899 4.328258 2.6354911 1994 25 183.1159 350.1557 267.5916 155.36889 82.61143 42.67374 20.02459 6.420062 4.929604 3.1090591 1995 25 160.9987 340.6296 255.2023 137.58128 71.90313 38.45555 17.59014 5.710101 3.93704 1.9927121 1996 25 116.6681 257.0968 200.7716 108.20571 54.18175 28.8908 13.41826 4.2366 2.812408 1.7178711 1997 25 170.5544 370.4786 295.6585 173.42588 92.33329 47.65315 23.86941 7.484731 5.364065 3.178021 1998 25 292.6357 690.8389 540.5222 286.97132 142.7198 79.01015 37.66422 11.9715 7.591233 4.0741141 1999 25 324.4544 783.6046 623.2016 330.54404 160.4864 87.17141 42.04689 13.71274 8.469533 5.3074291 2000 25 304.7471 727.429 635.6375 382.59334 193.4004 97.14375 50.6322 17.15259 10.91044 6.3512831 2001 25 381.862 893.3115 704.6439 388.95179 198.6706 105.1803 50.56173 16.96656 10.31893 5.5319691 2002 25 377.7485 940.5624 773.9294 421.04542 211.4095 114.5846 57.40986 19.16064 11.54815 7.5984421 2003 25 353.2094 850.1884 691.0708 385.17401 191.5441 101.3534 50.3486 16.11704 10.23873 5.754671 2004 25 368.1259 918.0599 769.2028 423.83612 204.467 109.6062 54.97446 18.06407 10.85488 6.8062222 1981 1 0 0.02439 0.22147 1.38688 2.40068 2.49219 1.964 0.8144 0.37098 0.325062 1982 1 0.1 0.78328 0.82376 1.21632 1.84668 1.259 0.97096 0 0 02 1983 1 0 0 0.05506 0.27679 0.33185 0.45536 0.42411 0.28274 0.05506 0.119052 1984 3 0 0.02439 0.85605 1.75242 3.97362 5.38987 10.2954 3.87882 1.17946 1.650142 1985 1 0 0.02439 0.02439 0.14634 0.39024 0.21951 0.19512 0 0 02 1986 22 5.591276 19.81634 21.39219 36.251755 43.17054 42.44633 30.95531 8.980596 3.388802 4.0071882 1987 24 4.983782 16.3795 18.42267 39.556984 52.39132 49.35746 35.28577 9.594876 3.031628 5.996182 1988 17 2.582747 15.16451 15.19125 30.095936 36.39325 32.59676 22.6764 6.318001 1.705891 4.2753622 1989 25 2.260948 17.06062 20.2946 47.757383 64.05226 64.58842 38.17077 10.98458 3.011971 5.8185652 1990 25 2.62216 17.66238 23.04167 59.816901 80.84969 83.91376 52.33052 17.59651 4.795701 9.3707792 1991 25 1.107287 10.73989 16.57688 50.80844 72.12251 73.15469 51.76513 19.5431 5.201813 10.980912 1992 25 9.33545 47.53322 54.58139 126.46244 169.0177 165.7886 108.88 33.36381 9.402623 17.635542 1993 25 1.47559 12.00779 21.49249 62.411733 96.49948 101.2756 78.60541 29.74856 9.93158 12.526762 1994 25 3.325708 32.10039 45.05173 105.50355 155.0755 154.479 114.62 35.88974 11.63157 16.323052 1995 25 1.817169 19.09081 28.97476 89.68223 137.9308 138.6886 94.52591 30.80543 9.820216 14.664122 1996 25 2.338714 18.38168 27.43717 80.172516 121.5692 120.4059 77.01096 22.42297 6.666286 11.594752 1997 19 1.005982 8.613619 12.12966 28.707928 38.76528 43.95521 31.70517 12.18747 3.051064 4.87872 1998 25 1.40533 14.12528 20.35309 51.766045 79.09085 78.06189 56.20971 17.2914 6.112707 7.5837952 1999 14 0.399998 4.56866 6.943022 21.573414 32.16997 32.84531 20.35465 6.793916 2.146123 3.2050292 2000 6 0 1.533119 3.191339 7.0636873 13.14988 11.8594 11.89793 3.459279 1.418 1.427572 2001 11 0.302969 3.511307 5.182332 18.268734 28.32873 29.09136 17.28685 5.235766 1.331844 2.4601552 2002 15 0.794001 2.824699 5.025956 24.522922 36.30256 39.41294 25.9285 10.08559 2.863372 5.239722 2003 18 0.611716 7.061209 10.78633 28.637659 40.70334 43.90187 31.34596 11.07285 2.816449 5.0628332 2004 12 0.1 3.417449 6.372952 18.543997 28.95136 29.17832 20.22771 7.128822 1.929466 3.1501613 1981 0 0 0 0 0 0 0 0 0 0 03 1982 0 0 0 0 0 0 0 0 0 0 03 1983 0 0 0 0 0 0 0 0 0 0 03 1984 0 0 0 0 0 0 0 0 0 0 03 1985 0 0 0 0 0 0 0 0 0 0 03 1986 0 0 0 0 0 0 0 0 0 0 03 1987 0 0 0 0 0 0 0 0 0 0 03 1988 0 0 0 0 0 0 0 0 0 0 03 1989 1 0.08717 0.401937 0.263922 0.1452803 0.053267 0.026638 0.012108 0.009687 0 03 1990 7 3.223407 9.623322 12.35797 11.236006 9.087983 8.766192 4.093127 3.342451 1.814501 3.4547473 1991 4 0.927806 1.428554 2.411908 5.037953 5.961932 7.114225 3.314033 3.135205 2.005321 4.6629763 1992 5 2.540079 7.25546 9.242561 9.5551401 8.409575 6.419864 3.518082 2.517056 1.457359 3.084713 1993 25 52.34089 146.1499 167.2291 115.84978 61.15442 36.30718 19.4739 10.53481 5.468831 8.488973 1994 25 93.8867 242.8888 253.3765 179.87201 97.70492 52.67382 29.59293 13.16928 8.164492 8.668242
Page 29

Gray Trigger Assessment ReportMarch 2006
3 1995 25 94.54778 256.4688 264.0245 177.27583 92.28004 46.03134 26.24207 10.57459 6.319682 5.2331853 1996 25 92.30825 236.7039 244.5612 163.37036 81.63231 42.79206 23.94791 9.86463 5.960975 5.8559543 1997 25 82.35543 195.5767 195.7529 132.18528 65.6331 31.99752 17.51549 6.860957 3.947595 3.173323 1998 25 75.84935 183.8084 161.3491 98.080283 52.03049 30.7372 15.78697 7.378001 4.090488 5.8891453 1999 25 48.66077 134.9053 145.8223 103.79679 56.57937 33.67083 18.91222 10.08299 5.131431 8.4364793 2000 25 30.45848 88.99176 96.32543 65.183714 34.06245 19.67907 11.51744 5.719862 2.659451 4.4012943 2001 25 82.69642 216.3159 224.6094 143.27417 71.31313 38.49329 20.43596 8.898379 5.136658 5.8241593 2002 25 57.53503 145.6692 134.4771 84.572832 45.46871 26.0167 14.22372 6.490751 4.172445 6.3724063 2003 25 34.69652 81.44614 79.33191 57.920221 37.21914 23.10775 12.2144 7.239466 3.722304 6.101393 2004 19 12.79279 38.78265 46.5092 36.885832 22.33516 12.768 7.427791 3.727102 2.090014 2.6809314 1981 0 0 0 0 0 0 0 0 0 0 04 1982 0 0 0 0 0 0 0 0 0 0 04 1983 0 0 0 0 0 0 0 0 0 0 04 1984 0 0 0 0 0 0 0 0 0 0 04 1985 0 0 0 0 0 0 0 0 0 0 04 1986 0 0 0 0 0 0 0 0 0 0 04 1987 0 0 0 0 0 0 0 0 0 0 04 1988 0 0 0 0 0 0 0 0 0 0 04 1989 0 0 0 0 0 0 0 0 0 0 04 1990 25 0.3 3.33243 9.28439 29.86115 50.66102 57.17613 68.93896 26.529 8.57147 11.347054 1991 25 1.4 13.77083 27.65188 82.34424 134.2891 143.8223 137.1464 52.49309 18.41527 21.670274 1992 25 1.7 18.80012 44.07285 156.88276 258.6317 274.6359 239.1921 93.90986 34.31449 39.866344 1993 25 0.5 5.47739 20.07087 61.22433 109.0858 124.808 141.8139 58.74066 21.98465 21.297614 1994 25 1.8 14.49279 34.95952 88.9082 152.6647 173.3878 218.1225 83.99081 31.0788 34.600194 1995 25 0.6 5.7624 13.31641 44.3335 75.55197 82.39726 87.12224 33.63071 11.02511 13.262214 1996 25 0 1.50873 8.32633 27.21919 47.39304 51.31487 60.1971 25.68764 9.79453 10.560294 1997 25 0 0.60627 6.64874 25.3365 47.4027 53.94095 64.01243 25.37671 9.33828 10.338754 1998 12 0.664652 2.249573 4.84175 15.321409 26.78601 25.54883 23.64832 8.248703 3.970953 3.720414 1999 5 0 0.04878 1.41746 6.04058 10.00084 11.9494 11.63542 5.82904 2.06428 2.014544 2000 4 0 0.21603 1.02486 4.36068 7.56322 7.14625 8.50205 3.10815 1.32224 1.756774 2001 10 0.1 0.92962 3.54888 10.26101 19.50143 20.32304 25.21073 9.93736 4.14388 4.044614 2002 15 0.1 1.52893 5.41801 17.18919 30.95911 32.34375 33.10108 13.47699 5.64968 5.234084 2003 21 0.563019 1.791486 7.408921 24.81121 40.73053 47.11034 45.68147 20.2789 7.706452 7.9164244 2004 8 0 1.31709 3.28814 11.01523 17.66183 16.45391 16.19646 5.51711 1.91302 3.637765 1981 1 1 0 0 0 0 0 0 0 0 05 1982 1 1 0 0 0 0 0 0 0 0 05 1983 1 1 0 0 0 0 0 0 0 0 05 1984 1 1 0 0 0 0 0 0 0 0 05 1985 1 1 0 0 0 0 0 0 0 0 05 1986 1 1 0 0 0 0 0 0 0 0 05 1987 1 1 0 0 0 0 0 0 0 0 05 1988 1 1 0 0 0 0 0 0 0 0 05 1989 1 1 0 0 0 0 0 0 0 0 05 1990 1 1 0 0 0 0 0 0 0 0 05 1991 1 1 0 0 0 0 0 0 0 0 05 1992 1 1 0 0 0 0 0 0 0 0 05 1993 1 1 0 0 0 0 0 0 0 0 05 1994 1 1 0 0 0 0 0 0 0 0 05 1995 1 1 0 0 0 0 0 0 0 0 05 1996 1 1 0 0 0 0 0 0 0 0 05 1997 1 1 0 0 0 0 0 0 0 0 05 1998 1 1 0 0 0 0 0 0 0 0 05 1999 1 1 0 0 0 0 0 0 0 0 05 2000 1 1 0 0 0 0 0 0 0 0 05 2001 1 1 0 0 0 0 0 0 0 0 05 2002 1 1 0 0 0 0 0 0 0 0 05 2003 1 1 0 0 0 0 0 0 0 0 05 2004 1 1 0 0 0 0 0 0 0 0 0
Page 30

Gray Trigger Assessment ReportMarch 2006
############################################################################################## PARAMETER INPUT FILE--Gray Triggerfish September 2005 Modified 30-Mar-06###############################################################################################================================================================================# Total number of process parameters (must match number of entries in 'Specifications 1' section)#================================================================================
58#================================================================================# Number of sets of each class of parameters (must be at least 1)#================================================================================# q (catchability)# | Effort# | | Vulnerability (selectivity)# | | | catch observation variance scalar# | | | | index variance scalar# | | | | | effort variance scalar# | | | | | |#-----------------------------------------------------------------------------------------------------------------------------------
13 5 8 2 1 1#================================================================================# Specifications 1: process parameters and observation error parameters#================================================================================# class (nature) of parameter (1=constant, 2-4 = polynomial of degree x)# | best estimate (or central tendency of prior)# | | lower bound upper bound # | | | | phase to estimate (-1 = don't estimate)# | | | | | prior density (1= lognormal, 2=normal, 3=uniform)# | | | | | | prior variance# | | | | | | | #-----------------------------------------------------------------------------------------------------------------------------------# Natural mortality rate
1 0.27 0.19 0.41 -3 1 0.25# Recruitment (10=Beverton/Holt, 11=Ricker)
10 20000000 1000000 1000000000 1 3 110 32 1.1 100 2 1 0.0098
# Growth (type 8 = von Bertalanfy/Richards, Linf, K, t0, m, a, b (weight=al^b))8 423.4 0.0001 1000000 -1 0 18 0.4269 0 2 -1 0 18 -0.6292 -5 5 -1 0 18 1 0 10 -1 0 18 4.4858E-08 0 100 -1 0 18 3.0203 0 5 -1 0 1
# catchability1 1 1E-10 10 -1 0 1 # Rec-E1 1 1E-10 10 -1 0 1 # Rec-W1 1 1E-10 10 -1 0 1 # Comm-E1 1 1E-10 10 -1 0 1 # Comm-W1 1 1E-10 10 -1 0 1 # Shrimp1 0.1 0.001 1000 1 0 1 # MRFSSE1 0.1 0.001 1000 1 0 1 # HBE1 0.1 0.001 1000 1 0 1 # HBW1 0.1 0.001 1000 1 0 1 # CmHLE1 0.1 0.001 1000 1 0 1 # CmHLW1 0.1 0.001 1000 1 0 1 # Larval
Page 31

Gray Trigger Assessment ReportMarch 2006
1 0.1 0.001 1000 1 0 1 # Trawl1 0.1 0.001 1000 1 0 1 # Video
# effort for 'prehistoric' period when data is sparse (Fix at anything if linear estimation is used)1 0.0001 -1E-32 1.1 -4 0 1 # Rec-E1 0.0001 -1E-32 1.1 -4 0 1 # Rec-W1 0.0001 0.000001 1.1 4 0 1 # Comm-E1 0.0001 0.000001 1.1 4 0 1 # Comm-W1 0.0001 -1E-32 1.1 -4 0 1 # Shr
# effort for period with useful data1 0.001 0.00001 0.3 1 0 1 # Rec-E1 0.001 0.00001 0.3 1 0 1 # Rec-W1 0.001 0.00001 0.3 1 0 1 # Comm-E1 0.001 0.00001 0.3 1 0 1 # Comm-W1 0.001 0.00001 0.3 1 0 1 # Shr
# vulnerability (selectivity) (5=knife edge, 6=logistic, 7=gamma, 15 = double logistic)6 0.4 0 2 3 0 1 # Rec-E6 1.65 0.5 10 4 0 0.06256 0.7 0 2 3 0 1 # Rec-W6 1.2 0.5 10 4 0 0.06256 0.5 0 2 3 0 1 # Comm-E6 1.2 0.5 10 4 0 0.06256 0.7 0 2 3 0 1 # Comm-W6 1.7 0.5 10 4 0 0.0625
15 0 -1 10 -3 0 0.0625 #Shrimp15 0.01 0 2 -4 0 115 2.1 -1 10 -3 0 0.062515 0.2 0 2 -4 0 115 0.99592986 0 1 -4 0 16 0.7 0 2 -3 0 0.0625 #Larval6 8 0 10 -4 0 1
15 0 -1 10 -3 0 0.0625 #Trawl15 0.01 0 2 -4 0 115 2.1 -1 10 -3 0 0.062515 0.2 0 2 -4 0 115 0.99592986 0 1 -4 0 16 0.5 0 2 -3 0 1 #Video6 1 0.5 10 -4 0 0.0625
# catch observation error variance scalar1 1 0.01 5 -1 0 1 # All others1 2 0.01 5 -1 0 1 # Shrimp
# index observation error variance scalar1 1.5 0.1 5 -1 0 1
# effort observation error variance scalar1 1 0.1 5 -1 0 1
#================================================================================# Specifications 2: process ERROR parameters#================================================================================# best estimate (or central tendency of prior)# | lower bound upper bound# | | phase to estimate (<0 = don't estimate)# | | | | prior density (1=lognormal, 2=normal, 3=uniform)# | | | | | prior variance# | | | | | |#-----------------------------------------------------------------------------------------------------------------------------------# overall variance (negative value indicates a CV)
Page 32

Gray Trigger Assessment ReportMarch 2006
-0.2 -2 -0.01 3 0 1# recruitment process variation parameters (allows year to year fluctuations)# correlation coefficient
0 -1E-32 0.99 -1 0 1# variance scalar (multiplied by overall variance)
0.15 0 1E+20 -1 0 1# annual deviation parameters (last entry is arbitrary for deviations)
0 -5 5 4 1 1# catchability process variation parameters (allows year to year fluctuations)# correlation coefficients
0 -1E-32 0.99 -1 0 1 # Rec-E0 -1E-32 0.99 -1 0 1 # Rec-W0 -1E-32 0.99 -1 0 1 # Comm-E0 -1E-32 0.99 -1 0 1 # Comm-W0 -1E-32 0.99 -1 0 1 # Shrimp0 -1E-32 0.99 -1 0 1 # MRFSSE0 -1E-32 0.99 -1 0 1 # HBE0 -1E-32 0.99 -1 0 1 # HBW0 -1E-32 0.99 -1 0 1 # CmHLE0 -1E-32 0.99 -1 0 1 # CmHLW0 -1E-32 0.99 -1 0 1 # Larval0 -1E-32 0.99 -1 0 1 # Trawl0 -1E-32 0.99 -1 0 1 # Video
# variance scalars (multiplied by overall variance)0 -1E-32 1E+20 -1 0 1 # Rec-E0 -1E-32 1E+20 -1 0 1 # Rec-W0 -1E-32 1E+20 -1 0 1 # Comm-E0 -1E-32 1E+20 -1 0 1 # Comm-W0 -1E-32 1E+20 -1 0 1 # Shrimp0 -1E-32 1E+20 -1 0 1 # MRFSSE0 -1E-32 1E+20 -1 0 1 # HBE0 -1E-32 1E+20 -1 0 1 # HBW0 -1E-32 1E+20 -1 0 1 # CmHLE0 -1E-32 1E+20 -1 0 1 # CmHLW0 -1E-32 1E+20 -1 0 1 # Larval0 -1E-32 1E+20 -1 0 1 # Trawl0 -1E-32 1E+20 -1 0 1 # Video
# annual deviation parameters (last entry is arbitrary for deviations)0 -5 5 -1 0 1 # Rec-E0 -5 5 -1 0 1 # Rec-W0 -5 5 -1 0 1 # Comm-E0 -5 5 -1 0 1 # Comm-W0 -5 5 -1 0 1 # Shrimp0 -5 5 -1 0 1 # MRFSSE0 -5 5 -1 0 1 # HBE0 -5 5 -1 0 1 # HBW0 -5 5 -1 0 1 # CmHLE0 -5 5 -1 0 1 # CmHLW0 -5 5 -1 0 1 # Larval0 -5 5 -1 0 1 # Trawl0 -5 5 -1 0 1 # Video
# effort process variation parameters (allows year to year fluctuations)# correlation coefficients
0.5 0 0.99 -1 0 1 # Rec-E0.5 0 0.99 -1 0 1 # Rec-W
Page 33

Gray Trigger Assessment ReportMarch 2006
0.5 0 0.99 -1 0 1 # Comm-E0.5 0 0.99 -1 0 1 # Comm-W0.5 0 0.99 -1 0 1 # Shr
# variance scalars (multiplied by overall variance)0.223 0 1E+20 -1 0 1 # Rec-E0.223 0 1E+20 -1 0 1 # Rec-W0.223 0 1E+20 -1 0 1 # Comm-E0.223 0 1E+20 -1 0 1 # Comm-W
0.0392 0 1E+20 -1 0 1 # Shr# annual deviation parameters (last entry is arbitrary for deviations)
0.0001 -5 5 2 1 1 # Rec-E0.0001 -5 5 2 1 1 # Rec-W0.0001 -5 5 2 1 1 # Comm-E0.0001 -5 5 2 1 1 # Comm-W0.0001 -5 5 2 1 1 # Shr
Page 34

Year SSB Abundance Recruits F(trillion eggs) (millions of fish) (millions of fish)
1963 7.51 9.07 2.15 0.001964 7.46 9.07 2.15 0.011965 7.33 8.98 2.15 0.031966 7.11 8.83 2.14 0.041967 6.83 8.63 2.14 0.061968 6.51 8.41 2.14 0.071969 6.15 8.16 2.14 0.091970 5.77 7.91 2.13 0.101971 5.39 7.66 2.13 0.111972 5.01 7.40 2.12 0.131973 4.64 7.16 2.11 0.141974 4.30 6.92 2.11 0.161975 3.98 6.70 2.10 0.171976 3.69 6.48 2.09 0.191977 3.42 6.27 2.08 0.201978 3.18 6.08 2.07 0.221979 2.96 5.89 2.06 0.231980 2.76 5.72 2.05 0.241981 2.59 5.64 2.13 0.261982 2.24 5.36 1.94 0.491983 1.89 4.95 2.10 0.521984 1.77 5.19 2.47 0.601985 1.80 5.72 2.73 0.551986 1.92 6.24 2.89 0.401987 2.11 6.92 3.22 0.391988 2.28 7.44 3.35 0.381989 2.40 7.63 3.27 0.391990 2.53 8.01 3.55 0.391991 2.67 8.57 3.97 0.431992 2.58 8.10 3.28 0.521993 2.24 6.82 2.57 0.571994 2.01 6.14 2.50 0.551995 1.71 5.28 2.07 0.661996 1.47 4.56 1.93 0.621997 1.31 4.10 1.77 0.531998 1.18 3.58 1.46 0.471999 1.18 3.58 1.66 0.392000 1.33 4.26 2.21 0.372001 1.58 5.43 2.98 0.402002 1.59 5.17 2.12 0.412003 1.47 4.55 1.78 0.432004 1.35 3.96 1.49 0.43