Embed Size (px)
Citation preview

GUINNESSOMETRICS AGAINST CULT OF STATISTICAL SIGNIFICANCE [WHY RANDOMIZATION + SIGNIFICANCE DOES NOT EQUAL VALIDITY] BY STEPHEN T. ZILIAK ROOSEVELT UNIVERSITY CHICAGO CARMA WORKSHOP UNIVERSITY OF NEWCASTLE

Previous work on Guinnessometrics Archival work at Guinness Archives, UCL Special
Collections, Museum for English Rural Life, and Cork County Archives, 2007-present
Representative publications: • The Cult of Statistical Significance (2008) • Guinnessometrics (JEP, 2008) • The Validus Medicus (Lancet, 2010) • Brief of Amici Curiae (U.S. Supreme Court, 2010, with McCloskey • Guinnessometrics II (JWE, 2011) • Student v. Fisher and Matrixx v. Siracusano (Significance,
2011) • Balanced vs Randomized Field Experiments in Economics: Why Gosset Matters (RBE, 2014) Unprincipled Randomization Principle in Economics and
Medicine (Oxford Handbook; with Teather-Posadas)

Statistical Significance + Randomization Costs Us More than Jobs, Justice, & Lives
The test of statistical significance is the most important technique in the empirical branches of the life and human sciences, economics to medicine - and it is broken
The main problem? 80-to-90% of scientists
don’t “test for” or “estimate” what we want, which is: Oomph and its odds
(but Oomph, especially)

Examples of Oomphless Science in Economics, Government, & Medicine
Two diet pills, Oomph vs. Precision
which pill for Mom? Zero black unemployment
rates for urban teens why can’t we find them? The 4,953+ cases of Vioxx why insist on 19-to-1
odds? The 9-0 Supreme Court
Decision Court rejects “significance”
rules in Matrixx v. Siracusano et al.
369 articles in the American
Economic Review, 1980-1999

Randomization + Statistical Significance is Said to be the Gold Standard of Statistics after Fisher For example, 307 of 414 articles (75%) published in Agronomy between 2001 and 2003 used Randomized Blocks See also: Ziliak (RBE, 2013), Deaton (JEL, 2007) and Harrison (2011) on ubiquity of RCTs in development econ, welfare econ, and industrial organization In medicine, pharmacology, and epidemiology: Altman et al. (BMJ, 2001); Rothman et al. (2008); Ziliak (Lancet, 2010)
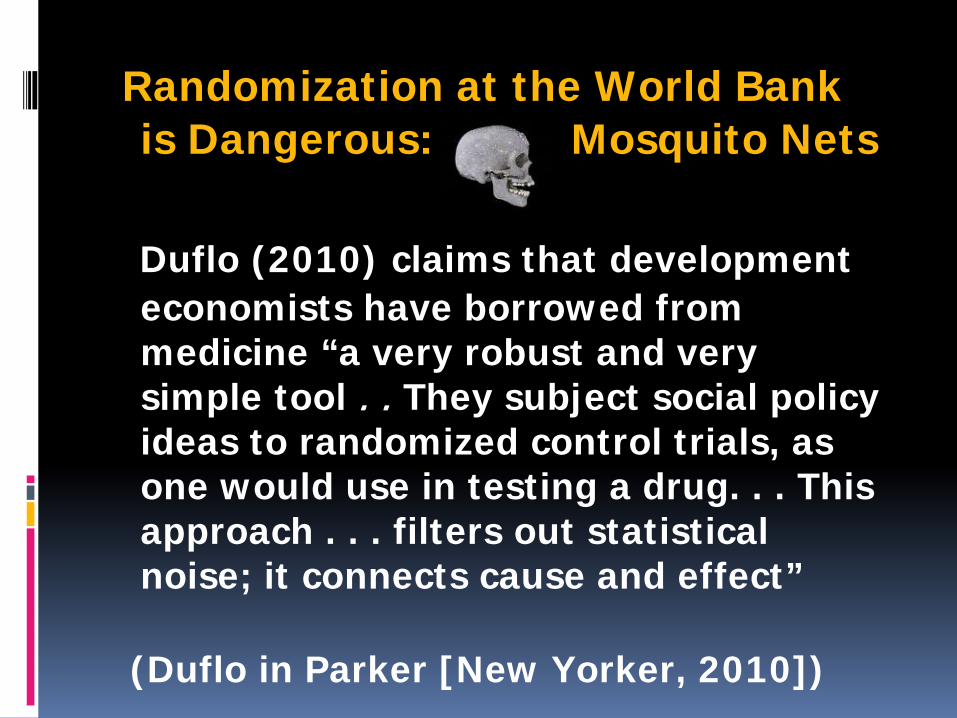
Randomization at the World Bank is Dangerous: Mosquito Nets
Duflo (2010) claims that development
economists have borrowed from medicine “a very robust and very simple tool . . They subject social policy ideas to randomized control trials, as one would use in testing a drug. . . This approach . . . filters out statistical noise; it connects cause and effect”
(Duflo in Parker [New Yorker, 2010])

Levitt and List (EEJ, 2009) claim that random
assignment of treatments and controls is the ”lynchpin” (p. 4)—”the foundation” (p. 1)—of a well-designed experiment
They claim that randomization is the only “valid”
(p. 4) justification “for use of Student‘s test of statistical significance” and that the test of significance—a low level of Type I error—is the crucial test

Hal Varian (2011)—the Chief Economist of Google—told The Economist magazine: “Randomized trials are the gold standard for causal inference” and at Google they ran about “6,000 “ of them in 2010 alone — perhaps on economists and statisticians, though unaware.
:

Three Big Losses Caused By Randomization
Randomization leads to Simpson’s Paradox, reversing the sign of causal effects (known since 1950s)
Randomization raises the probability of imbalance, biasing estimation and tests of significance, and possibly reversing the impact of treatments and controls (known since Student [1911, 1923]
Randomized controls fail at the margin of economics - and ethics, too (see ZTP, on Chinese Eyeglass Experiment)

Simpson’s Paradox
Results for All Participants (n=160)
S F Total Success Rate Treatment T 40 40 80 50% P 32 48 80 40%
Where T= Treatment, P= Placebo or Other
Control, S=Success, F=Failure

Simpson’s Paradox reverses the ranking of treatments
Results for Stratum 1 (Men only)
S F Total Success Rate Treatment T 36 24 60 60% P 14 6 20 70%
Where T= Treatment, P= Placebo or Other
Control, S= Success, F= Failure

And RCTs risk Simpson’s Paradox: What’s bad for men & women is good for all!
Results for Stratum 2 (Women)
S F Total Success Rate Treatment T 4 16 20 20% P 18 42 60 30%
Where T= Treatment, P= Placebo or Other
Control, S= Success, F= Failure

Fisher’s False Sociology of Statistical Significance and the Randomization “Principle” is Causing
More Than Headaches
Statistical Methods for Research Workers (1925)
“Arrangement of Field Experiments” (1926)
Design of Experiments (1935)
Statistical Methods and Scientific Inference (1955/1956)
Statistical Tables for Bio., Agri., and Medical Res. (with Yates, 1938)
And in scores of articles, letters, and speeches

Fisher said in his blockbuster book,
Statistical Methods for Research Workers:
“The value for which P=.05, or 1 in 20, is 1.96 or nearly 2; it is convenient to take this point as a limit in judging whether a deviation is to be considered significant or not. Deviations exceeding twice the standard deviation are thus formally regarded as significant.”

R.A. Fisher 1926, “Arrangement of Field
Experiments,” p. 504
“Personally, the writer prefers to set a low standard of significance at the 5 per cent point, and ignore entirely all results which fail to reach this level.”

William S. Gosset aka “Student” took an economic approach to the logic of uncertainty
Student (1876-1937) pioneered statistical and experimental methods to solve economic problems in the Main & Experimental divisions of Guinness’s Brewery, Dublin Student’s methods were distorted, his warnings ignored, by Fisher and Fisherians Copyright: The Galton Laboratory, University College London

“Student” was a Great Experimentalist
Rising in Rank to Head Brewer of Guinness
He invented or inspired half of modern statistics: Student’s t, Monte Carlo, power of the test, loss function, industrial quality control, random & balanced designs of experiments & more. He co-invented 3 barley varieties grown by the 1920s on over 5 million acres in the UK, helping breakfast eaters, beer drinkers, & other wild beasts And he served at Guinness’s as: Apprentice Brewer (1899-1906), Head Experimental Brewer (1907-1935), Head Statistician (c. 1922-35), and Head Brewer (Park Royal & Dublin, 1935-37)

Gosset worked at the Dawn of Scientific Brewing
Guinness was in 1899 the largest Brewery in the world Economies of scale: 100 million gallons of stout annually Cecil Guinness, scientist- managers, & quality assurance

Scientific Brewers at Guinness, Gosset included, were Chemistry Graduates from Oxford and Cambridge (Credit: Guinness Archives, 1923)

In 1898 Thomas B. Case, a Guinness chemist, tested hops for % soft resins
Case was excited by the first hops experiments on 5 varieties of American and Kentish hops in 2 harvests (1897-98)
He calculated mean % resin content
But he worried about “defects in his sampling procedure” and sought to recruit a mathematical mind
In 1899 he hired Gosset

“The Application of the Law of Error to the Work of the Brewery” (1904)
“Results are only valuable when the amount by which they probably differ from the truth is so small as to be insignificant for the purposes of the experiment.
What the odds should be depends:
1. On the degree of accuracy the experiment allows
2. On the importance of the issues at stake”

The first Small Sample Test was on the alcohol content of Guinness Stout (1904)
Gosset’s report of 1904 focused on MALT EXTRACT, measured in degrees saccharine per barrel of 168 lbs. malt
EXTRACT = ([Specific gravity of the wort] – 1000) x 4.67
133˚ saccharine gave targeted level of alcohol But excise tax a brewer owed to the state varied with the alcohol content of the beer
± .5˚ was an error around the targeted amount that beer drinkers and taxpayers could swallow

“It might be maintained that malt extract should be [estimated] within ± .5 ̊of the true result with a probability of 10 to 1.”
Given his small samples he calculated the odds of observing the stipulated accuracy:
“Odds in favour of smaller error than .5
2 observations 4:1
3 “ “ 7:1
4 “ “ 12:1
5 “ “ 19:1
82 “ “ practically infinite”
CONCLUSION n =4 does the trick. But how in general to set the odds with such small samples?

English Language Statistics in the early 1900s
Tone was set by the Karl Pearson – later the Galton Professor of National Eugenics Large sample Biometrics at University College London Pearson’s rule: scientific significance equals “3σ”

“The Probable Error of a Mean,” by Student (1908, Biometrika)
• Student’s 1906-07 sabbatical at Pearson’s UCL Biometric Laboratory
• Finds distribution and table of z (“t,” after 1925)
• Gives Monte Carlo proof of z
• Gives analytic proof of z
• Illustrates use of z
• On “Student’s” name

Student rejected bright-line rules of statistical significance . He told Karl Pearson in 1905:
“When I first reported on the subject [of "The Application of the 'Law of Error' to the Work of the Brewery“ (Gosset, 1904)] I thought that perhaps there might be some degree of probability which is conventionally treated as sufficient in such work as ours and I advised that some outside authority in mathematics [such as Karl Pearson] should be consulted as to what certainty is required to aim at in large scale work.
However it would appear that in such work as ours the degree of certainty to be aimed at must depend on the pecuniary advantage to be gained by following the result of the experiment, compared with the increased cost of the new method, if any, and the cost of each experiment.”
Source: W. S. Gosset to Karl Pearson, c. April 1905, in E. S. Pearson 1939, pp. 215-216; Ziliak 2008; first italics in original

Student pioneered Random and Balanced Designs of Experiments from 1905 to 1937 His seminal articles on experimental design are: Student (1911, Jnl. of Agric. Science) Student (1923, Biometrika) Gosset (1936, Jnl. Royal Stat. Soc.) Student (1938, Biometrika)

Student told Fisher in a letter of July 1923: “I have come across the July J. A. S. [Journal of Agricultural Science] and read your paper and I fear that some people may be misled into thinking that because you have found no [statistically] significant difference in the response of different varieties to manures that there isn’t any.” “The experiment seems to me to be quite badly planned, you should give them a hand in it; you probably do now.” Source: Gosset (Letters to R.A. Fisher, 1962)

“I don’t agree with your controlled randomness,” Student again told Fisher, in a letter of October 1924 (in reference to Fisher’s SMRW [1925]) “You would want a large lunatic asylum for the operators who are apt to make mistakes enough even at present,” Student said of Fisher’s so-called randomization principle. “If you say anything about Student in your preface you should I think make a note of his disagreement with the practical part of the thing” (Student, 1924).

“Obviously the important thing . . . is to have a low real error, not to have a "significant" result at a particular station. The latter [Student told Egon S. Pearson, the editor of Biometrika] seems to me to be nearly valueless in itself . . . “What you really want is a low real error. You want to be able to say not only "We have significant evidence that if farmers in general do this they will make money by it", but also "we have found it so in nineteen cases out of twenty and we are finding out why it doesn't work in the twentieth.” To do that you have to be as sure as possible which is the 20th—your real error must be small.” To Student, “real error” is the experimental error which remains after controlling for both random and non-random sources of variance in a series of repeated and independent experiments. Source: Letter of W.S. Gosset to E. S. Pearson 1937, in Pearson 1939, p. 244.

When the Real Treatment/Variety Effect is Large, Power Curves Cross, Yielding Advantage to Balanced over Random Designs
P o w e r
Range of Oomphful difference
Null
Size of real treatment effect measured by the variance of Student’s Δ’s
Source: Student (Biom., 1923, 1938), Pearson (Biom., 1938), Ziliak (RBE, 2013; JWE, 2011)
Balanced
designs beat Random

Matrixx v. Siracusano (March 22, 2011) presented the Supreme Court of the United States with the question whether a plaintiff can file a claim of securities fraud against a company which fails to warn investors about adverse effects that are not statistically significant. Matrixx Initiatives—the maker of Zicam—claimed not, arguing that a bright-line rule of statistical significance is necessary to establish causation. The question was considered and decided by the Supreme Court in light of rule §10(b) of the Securities Exchange Act of 1934 as amended by §10b-5.

“Matrixx’s argument rests on the premise that statistical significance is the only reliable indication of causation. This premise is flawed.” [Supreme Court Decision, Matrixx v. Siracusano, p. 11]
“We conclude that the materiality of adverse event reports cannot be reduced to a bright-line rule. “Although in many cases reasonable
investors would not consider reports of adverse events to be material information, respondents have alleged facts plausibly suggesting that reasonable investors would have viewed
these particular reports as material”

Consider the Reasoning of Justices During Oral Arguments for the Zicam Case (Matrixx v. Siracusano, March 22, 2011)
“Statistical importance [that is, statistical significance] can’t be a measure because it depends on the nature of the study”.
Justice Sotomayor, Oral
Arguments, thanking amici, Matrixx v. Siracusano, Supreme Court of the United States, Jan. 2011.
JUSTICE BREYER: And that could be devastating to a drug even though there isn't one person yet who has been hurt.

Justice Kagan, Oral Arguments, Matrixx v. Siracusano (the Zicam case) “If I heard that, ten
people went blind, three used it in one eye, [and] three went blind in that eye, I'd stop using the product.”
“And if I were holding
stock in that company, I would sell the stock.”

“This statistical significance always works and always doesn’t work.”
Justice Breyer, Oral
Arguments, Matrixx v. Siracusano, Jan. 2011

Chief Justice Roberts appealed to the “total mix of information” required by the “reasonable investor”, as in Basic v. Levinson (1976)
CHIEF JUSTICE ROBERTS: “A reasonable investor is
going to worry about the fact that thousands of unreasonable investors are going to dump their Matrixx stock. “
Justice Roberts, Oral Arguments, Matrixx v. Siracusano

JUSTICE SCALIA: “Mr. Shah, what do you think about Satan? “ MR. SHAH: “Let me try to unpack the satanic connection hypotheticals a little bit. “
Justice Scalia, opening question to U.S. Acting Solicitor General Pratik Shah, Oral Arguments, Matrixx v. Siracusano, January 2011
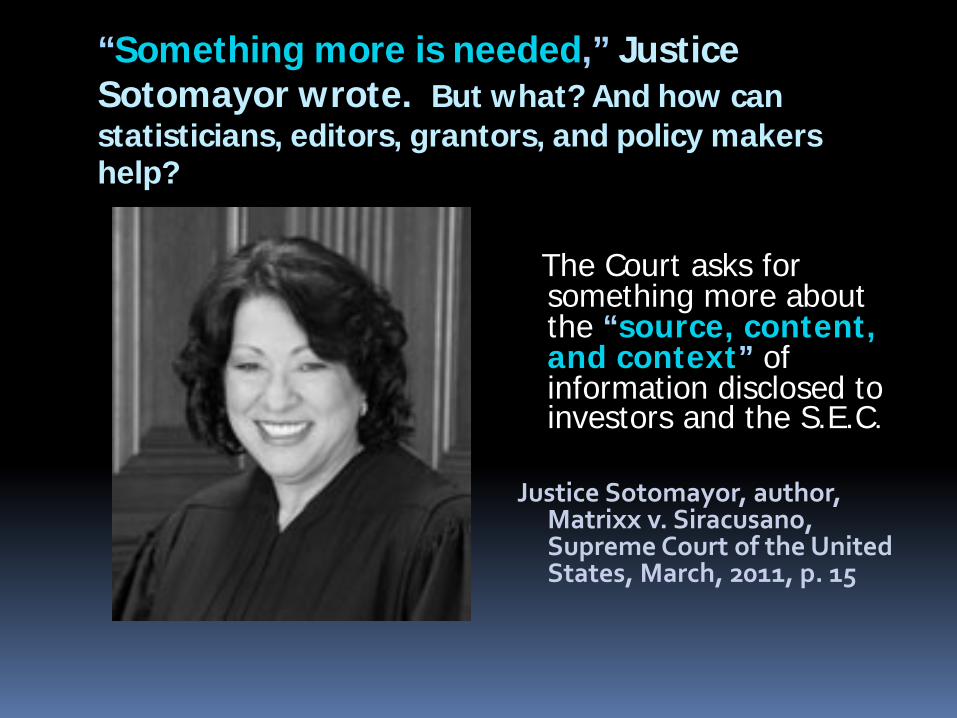
“Something more is needed,” Justice Sotomayor wrote. But what? And how can statisticians, editors, grantors, and policy makers help?
The Court asks for something more about the “source, content, and context” of information disclosed to investors and the S.E.C.
Justice Sotomayor, author,
Matrixx v. Siracusano, Supreme Court of the United States, March, 2011, p. 15
JUSTICE BREYER: And that could be devastating to a drug even though there isn't one person yet who has been hurt.

What the Supreme Court did not say is that statistical significance gives us the wrong information—false hope and skepticism
(1) The “Size Matters/How Much”
Question cannot be answered by statistical significance—
Ziliak and McCloskey find that
evaluation of regression coefficients is eschewed in 8 or 9 of every 10 articles published in leading journals of science—actuaries included
(2) The Probability of a Hypothesis
(degree of belief) cannot revealed by a Fisher test of significance—the fallacy of the transposed conditional.

Teach the “Size Matters/How Much” Question Teach “Confounding” and “Maximum Balance” Teach the Fallacy of the Transposed Conditional (and How to Avoid It)
Student’s economic approach was advanced by Harold Jeffreys, in Theory of Probability (1939) and by Egon Pearson (Biometrika, 1938) and others Student’s sampling distributions and tests of significance were based on actual repetitions, not imaginary

Randomization + Statistical Significance ≠ Validity
The Good News: (1) Balanced Designs, combined with
Economic Approach, are More Precise and Efficient
(2) Balanced Designs Have Higher
Power to Detect a Large Treatment Difference (“Oomph”) when the Oomph is Actually There
(3) Balanced, Repeated and
Independent Experiments on Correlated Variables is a Way Forward

Most textbooks have to be revised
We should teach less Fisher, more Student
Student offers a way forward

Copyright and References
“Guinnessometrics against Cult of Statistical Significance: Why Randomization + Significance does not equal Validity” was presented at the University of Newcastle, AU Workshop on Behavioral Economics and Quantitative Finance, Nov. 13th 2015.
The contents of these slides are from Ziliak’s “Guinnessometrics” (JEP, 2008), “Guinnessometrics II” (JWE, 2011), “Balanced vs. Randomized Field Experiments “(RBE, 2013), Ziliak’s and McCloskey’s The Cult of Statistical Significance (University of Michigan Press, 2008) and Brief of Amici Curiae (U.S. Supreme Court 2010), and Dennis Lindley’s Making Decisions (1984).
Stephen T. Ziliak is Professor of Economics
at Roosevelt University, Chicago. His articles, books, and reviews are available at his websites:
http://blogs.roosevelt.edu/sziliak/
Copyright: 2015 Stephen T. Ziliak All rights reserved.