Embed Size (px)
Citation preview

Guilford Public Schools
Math Curriculum
Kindergarten through Grade 12
Approved by the Guilford Public Schools Board of Education June 10, 2013

INTRODUCTION
Guilford’s Mathematics Curriculum Guide has been revised and aligned to meet the new Common Core State Standards for Mathematics. The
Principles of Learning; Common Core, Inc.’s math curriculum maps; and the North Carolina Department of Instruction Unpacked Content
documents were used as additional guides. Beginning in fall 2012, committee representatives from each level began their work with these
professional reference materials and others to create a document that reflects the current thinking in mathematics education and one that establishes a
guide for mathematical growth for the students of Guilford, grades K-12.
The guide is divided into four major sections.
(1) Philosophy Statement and Introduction to the Common Core State Standards for Mathematics
(2) Year-Long Curriculum Map: Teachers may use this section to see the distribution of topics over the course of a year.
(3) Curricular Expectations: Teachers will use specific grade level or course sections to determine classroom and student goals.
(4) Glossary: An addenda including math definitions, the Standards for Mathematical Practice, tables with information applicable to multiple
grades, and a list of works consulted in the development of the Common Core State Standards for Mathematics.
The committee will develop supplemental resources for formative assessment to help guide instructional decisions for the teacher and to help build
awareness of learning for the student. These tasks encourage the integration of real-life, problem-solving skills with the deep mathematical concepts
of the standards. We will continue to expand components by receiving feedback during the implementation of the curriculum.
The following are the 2012 committee members:
Gail Whitney, Grade 1, Melissa Jones School Jen Brown, Grade 2, Guilford Lakes School Vinny Mascola, Grade 3, A.W. Cox School Jamie Froelick, Grade 4, Calvin Leete School Anne Lombard, Grade 5, Baldwin Middle School Courtney Barbour, Grade 6, Baldwin Middle School Jessica Gellert, Grade 8, Adams Middle School Barbara Tokarska, Math Teacher, Guilford High School Alison Strzepek, Math Teacher, Guilford High School Donna Pudlinski, Math Chair, Guilford High School Maria Curreri, Math Specialist, Guilford Public Schools

PHILOSOPHY STATEMENT
The ability to think and reason mathematically as well as to communicate and apply mathematical understandings has been the over-riding goal of
Guilford Public School’s Mathematics Curriculum. This goal aligns seamlessly with the new Common Core State Standards. Fundamental to the
mathematics program is the development within our students of an inquisitive mind, a positive attitude, and persistent effort required to solve
complex problems. Mathematical skills are presented as tools to be used both in and out of school in addressing conceptual as well as authentic, real-
life situations. Computational fluency and an understanding of mathematical vocabulary are considered important components of the mathematics
program. Of equal importance is the development of meaningful mathematical concepts that promote high level thinking skills. In the course of
learning mathematics, students must have the opportunity to explore and share multiple strategies for problem solving, connect mathematical
concepts to various content areas, apply mathematics in various situations, and analyze information. In addition, students must effectively convey
their findings orally, in writing, pictorially, graphically, and with models. All aspects of mathematical communication and investigation can and
should be enhanced through the use of technology at all levels.
The Guilford Public School’s Mathematics Curriculum K-12 has been designed to build the mathematical concepts and skills needed by our children
to become good thinkers and problem solvers. The research behind the development of the Common Core State Standards revealed the need for
United States standards to become more focused and coherent in order to improve mathematics achievement in this country. It is important to
recognize that “fewer standards” are no substitute for focused standards. Instead, these standards aim for clarity and specificity. We value the
Common Core State Standards and have used them to guide the development of our district curriculum document.
A willingness to learn, mutual respect and a classroom atmosphere that promotes accountable talk make for healthy learning environments. We
encourage the use of approaches and materials that motivate, support, and challenge our students. We welcome assistance and cooperation between
children, parents, teachers and our district in implementing the mathematics curriculum of Guilford Public Schools. Continual effort by all will
ensure that the students of Guilford are successful in receiving a high quality mathematics education that ensures college and career readiness.
GUIDING PRINCIPLES
Build math knowledge and reasoning skills through problem solving
Build math confidence and perseverance
Integrate the content and practice standards
Make connections with other subjects through content connections and a focus on communication
Communicate mathematical understanding through speaking, reading, and writing
Use technology effectively, pervasively, and appropriately
Develop math understanding through accountable talk
Allow students to struggle to enhance learning and view mistakes as an opportunity to learn
Provide students relevant and real world problems with multiple entry points so that all students have access
Use multiple representations to illustrate problems and their solutions
Arrange classroom environment to support individual, group and class work
Focus on big ideas/concepts and build coherence across time
Use assessment to monitor and adjust instruction
Mathematics Review Committee
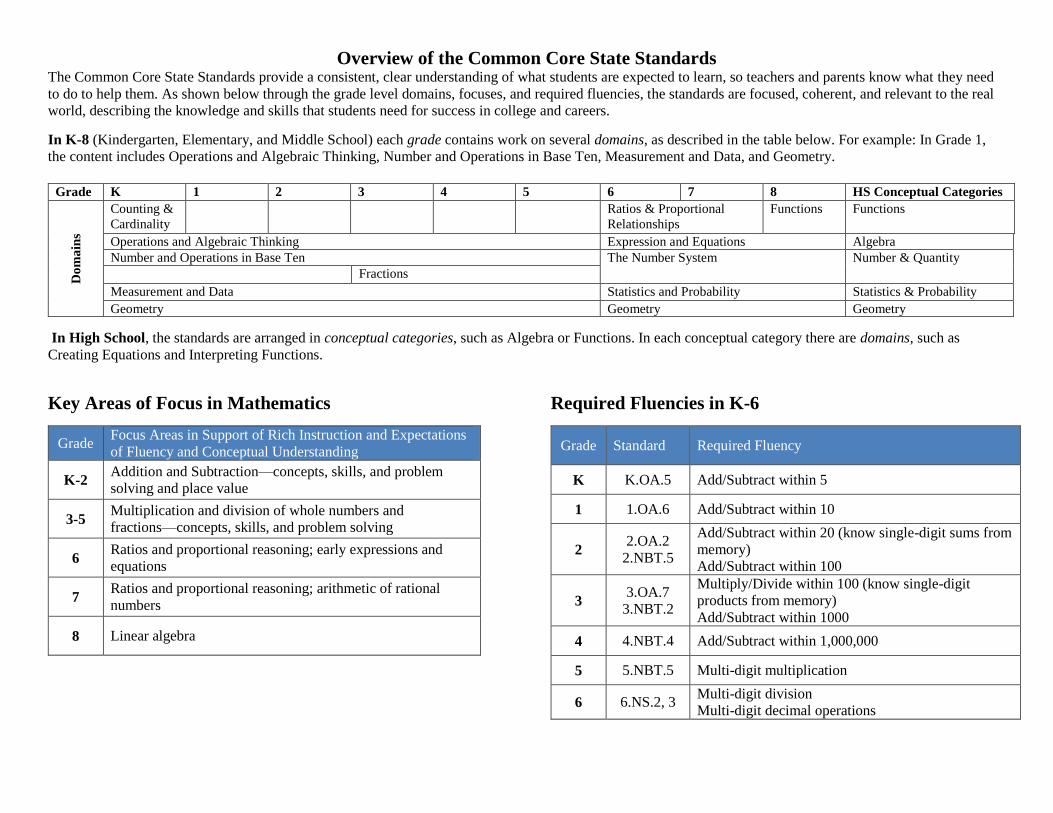
Overview of the Common Core State Standards The Common Core State Standards provide a consistent, clear understanding of what students are expected to learn, so teachers and parents know what they need
to do to help them. As shown below through the grade level domains, focuses, and required fluencies, the standards are focused, coherent, and relevant to the real
world, describing the knowledge and skills that students need for success in college and careers.
In K-8 (Kindergarten, Elementary, and Middle School) each grade contains work on several domains, as described in the table below. For example: In Grade 1,
the content includes Operations and Algebraic Thinking, Number and Operations in Base Ten, Measurement and Data, and Geometry.
Grade K 1 2 3 4 5 6 7 8 HS Conceptual Categories
Do
ma
ins
Counting &
Cardinality
Ratios & Proportional
Relationships
Functions Functions
Operations and Algebraic Thinking Expression and Equations Algebra
Number and Operations in Base Ten The Number System Number & Quantity
Fractions
Measurement and Data Statistics and Probability Statistics & Probability
Geometry Geometry Geometry
In High School, the standards are arranged in conceptual categories, such as Algebra or Functions. In each conceptual category there are domains, such as
Creating Equations and Interpreting Functions.
Key Areas of Focus in Mathematics
Grade Focus Areas in Support of Rich Instruction and Expectations
of Fluency and Conceptual Understanding
K-2 Addition and Subtraction—concepts, skills, and problem
solving and place value
3-5 Multiplication and division of whole numbers and
fractions—concepts, skills, and problem solving
6 Ratios and proportional reasoning; early expressions and
equations
7 Ratios and proportional reasoning; arithmetic of rational
numbers
8 Linear algebra
Required Fluencies in K-6
Grade Standard Required Fluency
K K.OA.5 Add/Subtract within 5
1 1.OA.6 Add/Subtract within 10
2 2.OA.2
2.NBT.5
Add/Subtract within 20 (know single-digit sums from
memory)
Add/Subtract within 100
3 3.OA.7
3.NBT.2
Multiply/Divide within 100 (know single-digit
products from memory)
Add/Subtract within 1000
4 4.NBT.4 Add/Subtract within 1,000,000
5 5.NBT.5 Multi-digit multiplication
6 6.NS.2, 3 Multi-digit division
Multi-digit decimal operations

Mathematics
Mathematical Practices
The Standards for Mathematical Practice describe characteristics and traits that mathematics educators at all levels should seek to develop in their
students. These practices rest on important “processes and proficiencies” with longstanding importance in mathematics education. The first of these
are the NCTM process standards of problem solving, reasoning and proof, communication, representation, and connections. The second are the
strands of mathematical proficiency specified in the National Research Council’s report Adding It Up: adaptive reasoning, strategic competence,
conceptual understanding (comprehension of mathematical concepts, operations and relations), procedural fluency (skill in carrying out procedures
flexibly, accurately, efficiently and appropriately), and productive disposition (habitual inclination to see mathematics as sensible, useful, and
worthwhile, coupled with a belief in diligence and one’s own efficacy). These eight practices can be clustered into the following categories as shown
in the chart below: Habits of Mind of a Productive Mathematical Thinker, Reasoning and Explaining, Modeling and Using Tools, and Seeing
Structure and Generalizing.
Ha
bit
s o
f M
ind
of
a P
rod
uct
ive M
ath
ema
tica
l T
hin
ker
MP
.1 M
ake
sen
se o
f pro
ble
ms
and
per
sev
ere
in s
olv
ing
th
em.
MP
.6 A
tten
d t
o p
reci
sio
n.
Reasoning and Explaining
MP. 2 Reason abstractly and quantitatively.
MP. 3 Construct viable arguments and critique the reasoning of others.
Modeling and Using Tools
MP. 4 Model with mathematics.
MP. 5 Use appropriate tools strategically.
Seeing Structure and Generalizing
MP. 7 Look for and make use of structure.
MP. 8 Look for and express regularity in repeated reasoning.
Arizona Department of Education: Standards and Assessment Division
2010

Mathematics
Weeks Kindergarten 1st Grade 2nd Grade 3rd Grade 4th Grade 5th Grade
1-4 Classify and Count:
Numbers to 5 and 10
Addition/Subtraction of
Numbers to 10 and
Fluency
Fluency with Sums
and Differences to 20
Addition and
Subtraction Strategies
and Problem Solving
Multiplicative
Thinking
Developing Concepts
and Contexts for
Multiplication and
Division
5-9 Counting, Composing,
and Comparing with
Numbers to 10
Addition/Subtraction
Strategies with Single
Digit Sums
Place Value, Addition
and Subtraction with
Measurement
Concepts
Introduction to
Multiplication
Multi-Digit
Multiplication and
Early Division
Addition and
Subtraction of
Fractions with
Fraction Concepts
10-13
Number Pairs, Addition
and Subtraction
Place Value,
Comparison, and
Addition/Subtraction
Strategies of Numbers
to 20
Addition and
Subtraction within
100
Problem-solving with
Multi-digit Addition
and Subtraction
Decimals and
Fractions
Whole Number and
Decimal Place Value
14-18 Measuring and Solving
Using the Number Line
with Numbers to 100
and Measurement
Contexts
Measurement Measurement and
Fractions
Addition and
Subtraction of
Length, Weight, and
Capacity
Multiplication and
Division of Whole
Numbers and
Decimals
19-22 Two-Dimensional
Geometry
Identify, Compose, and
Partition Shapes Place Value to 1,000
Multiplication and
Division with
Contexts
Two-dimensional
Shape Exploration
Multiplication and
Division of Fractions
23-27
Three-Dimensional
Geometry and Numbers
10 to 20
Addition/Subtraction of
Numbers to 20 with
Fluency, Story
Problems, and
Equations
Geometry- Reasoning
about Arrays, Shapes,
and Fractions of
Shapes
Measuring and
Classifying Shapes
Extending
Multiplication and
Division
Graphing, Geometry
and Volume
28-31
Weight and Place Value
Place Value,
Comparison,
Addition/Subtraction of
Numbers to 100
Addition and
Subtraction of
Numbers to 1,000
with Problem-Solving
and Measurement
Extending
Multiplication and
Fractions
Patterns and More
Challenging
Problems
Division and
Decimals
32-36 Culminating Unit:
Challenge and
Application
Culminating Unit:
Challenge and
Application
Culminating Unit:
Challenge and
Application
Culminating Unit:
Challenge and
Application
Culminating Unit:
Challenge and
Application
Culminating Unit:
Challenge and
Application
* Each quarter incorporates one additional week for flexibility.
KEY: Operations and Algebraic Thinking Number Fractions Measurement and Data Geometry Application

Mathematics
Weeks Grade 6 Grade 7 Grade 8 Algebra Geometry Algebra II
1-4 Unit 1: Factors,
Multiples, and
Expressions
Unit 1: Rational
Numbers
Unit 1: Linear
Equations and
Functions
Unit 1: Patterns Unit 1:
Transformations
Unit 1: Functions and
Inverses
5-8 Unit 2: Ratios and
Rational Numbers
Unit 2: Pythagorean
Theorem and the
Number System
Unit 2: Linear
Equations and
Inequalities Unit 2: Congruence,
Proof, and
Constructions
Unit 2: Polynomial
Functions Unit 2: Expressions and
Equations
9-12
Unit 3: Operations with
Fractions
Unit 3: Functions
Unit 3: Two –
Dimensional Geometry Unit 3: Congruence and
Similarity
Unit 3: Three
Dimensional Geometry
Unit 3: Rational
Expressions and
Functions 13-16 Unit 4: Linear
Functions
Unit 4: Geometry Unit 4: Ratios in
Geometry
Unit 4: Linear Models
and Variability Unit 4: Exponential
and Logarithmic
Functions 17-20 Unit 4: Similarity,
Proof, and
Trigonometry Unit 5: Scatter Plots
and Trend Lines
21-24 Unit 5: Operations
Including Decimals and
Percents
Unit 5: Ratios, Rates,
Percents, and
Proportions
Unit 5: Modeling with
Equations Unit 5: Trigonometric
Functions Unit 6: Systems of
Equations
Unit 5: Circles and
Other Conic Sections
25-28
Unit 6: Expression and
Equations
Unit 6: Probability Unit 7: Introduction to
Exponential Equations Unit 6: Systems of
Equations Unit 6:
Statistics
Unit 6: Applications
and Probability 29-32 Unit 7: Three
Dimensional Geometry Unit 8: Quadratic
Functions and
Equations
Unit 7: Introduction to
Statistics
Unit 8: Statistics Unit 7: Exponents Performance Task
33-36 Performance Task
Performance Task
KEY: Ratios and Proportional Reasoning Number System Expressions and Equations/ Functions Geometry Statistics and Probability

Mathematics
CC= Counting and Cardinality OA= Operations and Algebraic Thinking NBT= Numbers and Operations in Base Ten
MD= Measurement and Data G= Geometry
Kindergarten
In Kindergarten, instructional time should focus on two critical areas: (1) representing and comparing whole numbers, initially with sets of objects;
(2) describing shapes and space. More learning time in Kindergarten should be devoted to number than to other topics.
(1) Students use numbers, including written numerals, to represent quantities and to solve quantitative problems, such as counting objects in a
set; counting out a given number of objects; comparing sets or numerals; and modeling simple joining and separating situations with sets of
objects, or eventually with equations such as 5 + 2 = 7 and 7 – 2 = 5. (Kindergarten students should see addition and subtraction equations,
and student writing of equations in kindergarten is encouraged, but it is not required.) Students choose, combine, and apply effective
strategies for answering quantitative questions, including quickly recognizing the cardinalities of small sets of objects, counting and
producing sets of given sizes, counting the number of objects in combined sets, or counting the number of objects that remain in a set after
some are taken away.
(2) Students describe their physical world using geometric ideas (e.g., shape, orientation, spatial relations) and vocabulary. They identify,
name, and describe basic two-dimensional shapes, such as squares, triangles, circles, rectangles, and hexagons, presented in a variety of ways
(e.g., with different sizes and orientations), as well as three-dimensional shapes such as cubes, cones, cylinders, and spheres. They use basic
shapes and spatial reasoning to model objects in their environment and to construct more complex shapes.
Mathematical Practices
1. Make sense of problems and persevere in solving them.
2. Reason abstractly and quantitatively.
3. Construct viable arguments and critique the reasoning of others.
4. Model with mathematics.
5. Use appropriate tools strategically.
6. Attend to precision.
7. Look for and make use of structure.
8. Look for and express regularity in repeated reasoning.

Mathematics
CC= Counting and Cardinality OA= Operations and Algebraic Thinking NBT= Numbers and Operations in Base Ten
MD= Measurement and Data G= Geometry
Kindergarten: Suggested Distribution of Units in Instructional Days Time Approx.
# of weeks
Unit 1: Classify and Count: Numbers to 5 and 10 12.5% ~ 4 weeks
Unit 2: Counting, Composing, and Comparing with Numbers to 10 12.5% ~ 4 weeks
Unit 3: Number Pairs, Addition and Subtraction 12.5% ~ 4 weeks
Unit 4: Measuring and Solving 12.5% ~ 4 weeks
Unit 5: Two-Dimensional Geometry 12.5% ~ 4 weeks
Unit 6: Three-Dimensional Geometry and Numbers 10 to 20 12.5% ~ 4 weeks
Unit 7: Weight and Place Value 12.5% ~ 4 weeks
Unit 8: Culminating Unit: Challenge and Application Using All Standards 12.5% ~ 4 weeks
Instructional
Focus of Unit:
Operations and
Algebraic Thinking Number Fractions
Measurement
and Data Geometry Application
Unit 1: Classify and Count:
NUmbers to 5 and 10
Unit 2: Counting, Composing, and Comparing with Numbers to 10
12.5%
Unit 3: Number Pairs, Addition and Subtration
12.5%
Unit 4: Measurement
and Solving12.5%
Unit 5: Two-Dimensional
Geometry12.5%
Unit 6: 3-D Geometry and NUmbers 10 to
2012.5%
Unit 7: Weight and Place Value
12.5%
Unit 8: Culminating Unit
12.5%
Instructional Time

Mathematics
CC= Counting and Cardinality OA= Operations and Algebraic Thinking NBT= Numbers and Operations in Base Ten
MD= Measurement and Data G= Geometry
Kindergarten Unit 1: Classify and Count: Numbers to 5 and 10 (~ 4 weeks) Unit Overview: Kindergarten numeracy starts out solidifying the meaning of numbers to 10, the number word sequence from 1 to 20, one-to-one correspondence,
and cardinality. Students will focus on the quantities of 5 and 10 using models to see each quantity as a combination of other quantities. This unit provides
opportunities for students to look for and express regularity in repeated reasoning (MP 8) as students observe the relationship between counting and cardinality as
in determining strategies for naming a given amount.
Guiding Question: What are some good ways to know how many objects are in a group?
The student will be able to: The teacher will use appropriate instructional strategies/approaches based on the needs of the student.
Component Cluster K.CC Know number names and the count sequence.*
*within 20 only for this unit
K.CC.1 Count to 100 by ones and by tens.
Students rote count by starting at one and counting to 100. When students count by tens they are only expected to
master counting on the decade (0, 10, 20, 30, 40 …). This objective does not require recognition of numerals. It is
focused on the rote number sequence.
K.CC.2 Count forward beginning from a given number
within the known sequence (instead of having to begin at
1).
Students begin a rote forward counting sequence from a number other than 1. Thus, given the number 4, the
student would count, “4, 5, 6, 7 …” This objective does not require recognition of numerals. It is focused on the
rote number sequence 0-100.
K.CC.3 Write numbers from 0 to 20. Represent a number
of objects with a written numeral 0-20 (with 0
representing a count of no objects).
Students write the numerals 0-20 and use the written numerals 0-20 to represent the amount within a set. Students
can record the quantity of a set by selecting a number card/tile (numeral recognition) or writing the numeral.
Students can also create a set of objects based on the numeral presented.
(Due to varied development of fine motor and visual development, reversal of numerals is anticipated. While
reversals should be pointed out to students and correct formation modeled in instruction, the emphasis of this
standard is on the use of numerals to represent quantities rather than the correct handwriting formation of the actual
numeral itself.)
Component Cluster K.CC Count to tell the number of objects.*
*within 10 only for this unit
K.CC.4 Understand the relationship between numbers
and quantities; connect counting to cardinality.
Students count a set of objects and see sets and numerals in relationship to one another. These connections are
higher-level skills that require students to analyze, reason about, and explain relationships between numbers and
sets of objects. The expectation is that students are comfortable with these skills with the numbers 1-20 by the end
of K.
a. When counting objects, say the number names in the
standard order, pairing each object with one and only one
number name and each number name with one and only
one object.
Students implement correct counting procedures by pointing to one object at a time (one-to-one correspondence),
using one counting word for every object (synchrony/ one-to-one tagging), while keeping track of objects that have
and have not been counted. This is the foundation of counting.
b. Understand that the last number name said tells the
number of objects counted. The number of objects is the
same regardless of their arrangement or the order in
which they were counted.
Students answer the question “How many are there?” by counting objects in a set and understanding that the last
number stated when counting a set (…8, 9, 10) represents the total amount of objects: “There are 10 bears in this
pile.” (cardinality). Since an important goal for children is to count with meaning, it is important to have children

Mathematics
CC= Counting and Cardinality OA= Operations and Algebraic Thinking NBT= Numbers and Operations in Base Ten
MD= Measurement and Data G= Geometry
answer the question, “How many do you have?” after they count. Often times, children who have not developed
cardinality will count the amount again, not realizing that the 10 they stated means 10 objects in all.
Young children believe what they see. Therefore, they may believe that a pile of cubes that they counted may be
more if spread apart in a line. As children move towards the developmental milestone of conservation of number,
they develop the understanding that the number of objects does not change when the objects are moved,
rearranged, or hidden. Children need many different experiences with counting objects, as well as maturation,
before they can reach this developmental milestone.
c. Understand that each successive number name refers to
a quantity that is one larger.
Another important milestone in counting is inclusion (aka hierarchal inclusion). Inclusion is based on the
understanding that numbers build by exactly one each time and that they nest within each other by this amount.
For example, a set of three objects is nested within a set of 4 objects; within this same set of 4 objects is also a set
of two objects and a set of one. Using this understanding, if a student has four objects and wants to have 5 objects,
the student is able to add one more- knowing that four is within, or a sub-part of, 5 (rather than removing all 4
objects and starting over to make a new set of 5). This concept is critical for the later development of part/whole
relationships.
Students are asked to understand this concept with and without (0-20) objects. For example, after counting a set of
8 objects, students answer the question, “How many would there be if we added one more object?”; and answer a
similar question when not using objects, by asking hypothetically, “What if we have 5 cubes and added one more.
How many cubes would there be then?”
K.CC.5 Count to answer “how many?” questions about
as many as 20 things arranged in a line, a rectangular
array, or a circle, or as many as 10 things in a scattered
configuration; given a number from 1–20, count out that
many objects.
In order to answer “how many?” students need to keep track of objects when counting. Keeping track is a method
of counting that is used to count each item once and only once when determining how many. After numerous
experiences with counting objects, along with the developmental understanding that a group of objects counted
multiple times will remain the same amount, students recognize the need for keeping track in order to accurately
determine “how many”. Depending on the amount of objects to be counted, and the students’ confidence with
counting a set of objects, students may move the objects as they count each, point to each object as counted, look
without touching when counting, or use a combination of these strategies. It is important that children develop a
strategy that makes sense to them based on the realization that keeping track is important in order to get an accurate
count, as opposed to following a rule, such as “Line them all up before you count”, in order to get the right answer.
As children learn to count accurately, they may count a set correctly one time, but not another. Other times they
may be able to keep track up to a certain amount, but then lose track from then on. Some arrangements, such as a
line or rectangular array, are easier for them to get the correct answer but may limit their flexibility with developing
meaningful tracking strategies, so providing multiple arrangements help children learn how to keep track. Since
scattered arrangements are the most challenging for students, this standard specifies that students only count up to
10 objects in a scattered arrangement and count up to 20 objects in a line, rectangular array, or circle.
Component Cluster K.MD Describe and compare measureable attributes.
K.MD.3 Classify objects into given categories; count the
numbers of objects in each category and sort the
categories by count.
(Limit category counts to be less than or equal to 10)
Students identify similarities and differences between objects (e.g., size, color, shape) and use the identified
attributes to sort a collection of objects. Once the objects are sorted, the student counts the amount in each set.
Once each set is counted, then the student is asked to sort (or group) each of the sets by the amount in each set.
Thus, like amounts are grouped together, but not necessarily ordered.

Mathematics
CC= Counting and Cardinality OA= Operations and Algebraic Thinking NBT= Numbers and Operations in Base Ten
MD= Measurement and Data G= Geometry
Component Cluster K.OA Understand addition as putting together and adding to, and understand subtraction as taking apart and taking from.
K.OA.3 Decompose numbers less than or equal to 10 into
pairs in more than one way, e.g., by using objects or
drawings, and record each decomposition by a drawing or
equation (e.g., 5 = 2 + 3 and 5 = 4 + 1).
Students develop an understanding of part-whole relationships as they recognize that a set of objects (5) can be
broken into smaller sub-sets (3 and 2) and still remain the total amount (5). In addition, this objective asks students
to realize that a set of objects (5) can be broken in multiple ways (3 and 2; 4 and 1). Thus, when breaking apart a
set (decompose), students use the understanding that a smaller set of objects exists within that larger set (inclusion).
Example: “Bobby Bear is missing 5 buttons on his jacket. How many ways can you use blue and red buttons
to finish his jacket? Draw a picture of all your ideas.
Students could draw pictures of:
4 blue and 1 red button 3 blue and 2 red buttons 2 blue and 3 red buttons 1 blue and 4 red buttons
In Kindergarten, students need ample experiences breaking apart numbers and using the vocabulary “and” & “same
amount as” before symbols (+, =) and equations (5= 3 + 2) are introduced. If equations are used, a mathematical
representation (picture, objects) needs to be present as well.

Mathematics
CC= Counting and Cardinality OA= Operations and Algebraic Thinking NBT= Numbers and Operations in Base Ten
MD= Measurement and Data G= Geometry
Kindergarten Unit 2: Counting, Comparing, and Composing with Numbers to 10 (~ 4 weeks) Unit Overview: Students continue to focus on strategies for counting and recognizing quantities as well as deepening their understanding that a single quantity can
be composed of smaller quantities. Work with comparisons begins as students now grapple with “Which is more? Which is less?” This unit requires students to
attend to precision (MP6) as they compare numbers and objects paying attention to accurate counting strategies and precise written numerical symbols.
Guiding Question: What strategies help with comparing two different sets of objects?
The student will be able to: The teacher will use appropriate instructional strategies/approaches based on the needs of the student.
Component Cluster K.CC Know number names and the count sequence.
K.CC.1 Count to 100 by ones and by tens.
See Unit 1.
K.CC.2 Count forward beginning from a given number
within the known sequence (instead of having to begin at
1).
See Unit 1.
K.CC.3 Write numbers from 0 to 20. Represent a number
of objects with a written numeral 0-20 (with 0
representing a count of no objects).
See Unit 1.
Component Cluster K.CC Count to tell the number of objects.*
*within 10 only for this unit
K.CC.4 Understand the relationship between numbers
and quantities; connect counting to cardinality.
See Unit 1.
a. When counting objects, say the number names in the
standard order, pairing each object with one and only one
number name and each number name with one and only
one object.
See Unit 1.
b. Understand that the last number name said tells the
number of objects counted. The number of objects is the
same regardless of their arrangement or the order in
which they were counted.
See Unit 1.
c. Understand that each successive number name refers to
a quantity that is one larger.
See Unit 1.

Mathematics
CC= Counting and Cardinality OA= Operations and Algebraic Thinking NBT= Numbers and Operations in Base Ten
MD= Measurement and Data G= Geometry
K.CC.5 Count to answer “how many?” questions about
as many as 20 things arranged in a line, a rectangular
array, or a circle, or as many as 10 things in a scattered
configuration; given a number from 1–20, count out that
many objects.
See Unit 1.
Component Cluster K.CC Compare numbers.
K.CC.6 Identify whether the number of objects in one
group is greater than, less than, or equal to the number of
objects in another group, e.g., by using matching and
counting strategies.1
1Include groups with up to ten objects.
Students use their counting ability to compare sets of objects (0-10). They may use matching strategies (Student 1),
counting strategies (Student 2) or equal shares (Student 3) to determine whether one group is greater than, less than,
or equal to the number of objects in another group.
Student 1
I lined up one square and one
triangle. Since there is one extra
triangle, there are more triangles
than squares.
Student 2
I counted the squares and I
got 4. Then I counted the
triangles and got 5. Since
5 is bigger than 4, there
are more triangles than
squares.
Student 3
I put them in a pile. I then took
away objects. Every time I took a
square, I also took a triangle.
When I had taken almost all of the
shapes away, there was still a
triangle left. That means that there
are more triangles than squares.
K.CC.7 Compare two numbers between 1 and 10
presented as written numerals.
Students apply their understanding of numerals 1-10 to compare one numeral from another. Thus, looking at the
numerals 8 and 10, a student is able to recognize that the numeral 10 represents a larger amount than the numeral 8.
Students need ample experiences with actual sets of objects (K.CC.3 and K.CC.6) before completing this standard
with only numerals.
Component Cluster K.OA Understand addition as putting together and adding to, and understand subtraction as taking apart and taking from.
K.OA.3 Decompose numbers less than or equal to 10
into pairs in more than one way, e.g., by using objects or
drawings, and record each decomposition by a drawing or
equation (e.g., 5 = 2 + 3 and 5 = 4 + 1).
Students develop an understanding of part-whole relationships as they recognize that a set of objects (5) can be
broken into smaller sub-sets (3 and 2) and still remain the total amount (5). In addition, this objective asks students
to realize that a set of objects (5) can be broken in multiple ways (3 and 2; 4 and 1). Thus, when breaking apart a
set (decompose), students use the understanding that a smaller set of objects exists within that larger set (inclusion).
Example: “Bobby Bear is missing 5 buttons on his jacket. How many ways can you use blue and red buttons
to finish his jacket? Draw a picture of all your ideas.
Students could draw pictures of:
4 blue and 1 red button 3 blue and 2 red buttons 2 blue and 3 red buttons 1 blue and 4 red buttons
In Kindergarten, students need ample experiences breaking apart numbers and using the vocabulary “and” & “same
amount as” before symbols (+, =) and equations (5= 3 + 2) are introduced. If equations are used, a mathematical
representation (picture, objects) needs to be present as well.

Mathematics
CC= Counting and Cardinality OA= Operations and Algebraic Thinking NBT= Numbers and Operations in Base Ten
MD= Measurement and Data G= Geometry
Kindergarten Unit 3: Number Pairs, Addition and Subtraction (~ 4 weeks)
Unit Overview: Students solidify skills related to counting, composing, and comparing from the previous units. Composing numbers and solving addition and
subtraction story problems leads to looking at how an equation can help represent students’ math thinking. This unit requires students to model with mathematics
(MP 4) as they represent real-life problem situations in multiple ways such as with numbers, words (mathematical language), drawings, objects, acting out, charts,
lists, and number sentences.
Guiding Question: What different ways can you represent the math you find in real-life problems?
The student will be able to: The teacher will use appropriate instructional strategies/approaches based on the needs of the student.
Component Cluster K.OA Understand addition as putting together and adding to, and understand subtraction as taking apart and taking from.
K.OA.1 Represent addition and subtraction with objects,
fingers, mental images, drawings*, sounds (e.g., claps),
acting out situations, verbal explanations, expressions, or
equations.
*Drawings need not show details, but should show the
mathematics in the problem. (This applies wherever
drawings are mentioned in the standards.)
Students demonstrate the understanding of how objects can be joined (addition) and separated (subtraction) by
representing addition and subtraction situations in various ways. This objective is focused on understanding the
concept of addition and subtraction, rather than reading and solving addition and subtraction number sentences
(equations).
Common Core State Standards for Mathematics states, “Kindergarten students should see addition and subtraction
equations, and student writing of equations in kindergarten is encouraged, but it is not required.” Please note that it
is not until First Grade when “Understand the meaning of the equal sign” is an expectation (1.OA.7).
Therefore, before introducing symbols (+, -, =) and equations, kindergarteners require numerous experiences using
joining (addition) and separating (subtraction) vocabulary in order to attach meaning to the various symbols. For
example, when explaining a solution, kindergartens may state, “Three and two is the same amount as 5.” While the
meaning of the equal sign is not introduced as a standard until First Grade, if equations are going to be modeled and
used in Kindergarten, students must connect the symbol (=) with its meaning (is the same amount/quantity as).
K.OA.2 Solve addition and subtraction word problems,
and add and subtract within 10, e.g., by using objects or
drawings to represent the problem.
Kindergarten students solve four types of problems within 10: Result Unknown/Add To; Result Unknown/Take
From; Total Unknown/Put Together-Take Apart; and Addend Unknown/Put Together-Take Apart (See Table 1 at
end of document for examples of all problem types). Kindergarteners use counting to solve the four problem types
by acting out the situation and/or with objects, fingers, and drawings.
Add To Result Unknown
Take From Result Unknown
Put Together/Take Apart Total Unknown
Put Together/Take Apart Addend
Unknown

Mathematics
CC= Counting and Cardinality OA= Operations and Algebraic Thinking NBT= Numbers and Operations in Base Ten
MD= Measurement and Data G= Geometry
Two bunnies sat on the grass. Three more bunnies hopped there. How many bunnies are on the grass now? 2 + 3 = ?
Five apples were on the table. I ate two apples. How many apples are on the table now? 5 – 2 = ?
Three red apples and two green apples are on the table. How many apples are on the table? 3 + 2 = ?
Five apples are on the table. Three are red and the rest are green. How many apples are green? 3 + ? = 5, 5 – 3 = ?
K.OA.3 Decompose numbers less than or equal to 10
into pairs in more than one way, e.g., by using objects or
drawings, and record each decomposition by a drawing or
equation (e.g., 5 = 2 + 3 and 5 = 4 + 1).
Students develop an understanding of part-whole relationships as they recognize that a set of objects (5) can be
broken into smaller sub-sets (3 and 2) and still remain the total amount (5). In addition, this objective asks students
to realize that a set of objects (5) can be broken in multiple ways (3 and 2; 4 and 1). Thus, when breaking apart a
set (decompose), students use the understanding that a smaller set of objects exists within that larger set (inclusion).
Example: “Bobby Bear is missing 5 buttons on his jacket. How many ways can you use blue and red buttons
to finish his jacket? Draw a picture of all your ideas.
Students could draw pictures of:
4 blue and 1 red button 3 blue and 2 red buttons 2 blue and 3 red buttons 1 blue and 4 red buttons
In Kindergarten, students need ample experiences breaking apart numbers and using the vocabulary “and” & “same
amount as” before symbols (+, =) and equations (5= 3 + 2) are introduced. If equations are used, a mathematical
representation (picture, objects) needs to be present as well.
K.OA.4 For any number from 1 to 9, find the number
that makes 10 when added to the given number, e.g., by
using objects or drawings, and record the answer with a
drawing or equation.
Students build upon the understanding that a number (less than or equal to 10) can be decomposed into parts
(K.OA.3) to find a missing part of 10. Through numerous concrete experiences, kindergarteners model the various
sub-parts of ten and find the missing part of 10. In addition, kindergarteners use various materials to solve tasks
that involve decomposing and composing 10 such as ten-frame, think addition, or fluently add/subtract.
K.OA.5 Fluently add and subtract within 5.
Students are fluent when they display accuracy (correct answer), efficiency (a reasonable amount of steps in about
3-5 seconds* without resorting to counting), and flexibility (using strategies such as the distributive property).
Students develop fluency by understanding and internalizing the relationships that exist between and among
numbers. Oftentimes, when children think of each “fact” as an individual item that does not relate to any other
“fact”, they are attempting to memorize separate bits of information that can be easily forgotten. Instead, in order to
fluently add and subtract, children must first be able to see sub-parts within a number (inclusion, K.CC.4.c).
Once they have reached this milestone, children need repeated experiences with many different types of concrete
materials (such as cubes, chips, and buttons) over an extended amount of time in order to recognize that there are
only particular sub-parts for each number. Therefore, children will realize that if 3 and 2 is a combination of 5, then
3 and 2 cannot be a combination of 6.
Traditional flash cards or timed tests have not been proven as effective instructional strategies for developing
fluency.** Rather, numerous experiences with breaking apart actual sets of objects and developing relationships
between numbers help children internalize parts of number and develop efficient strategies for fact retrieval.
* Van de Walle & Lovin (2006). Teaching student centered mathematics K-3 (p.94). Boston: Pearson.
**Burns (2000) About Teaching Mathematics; Fosnot & Dolk (2001) Young Mathematicians at Work; Richardson
(2002) Assessing Math Concepts; Van de Walle & Lovin (2006) Teaching Student-Centered Mathematics

Mathematics
CC= Counting and Cardinality OA= Operations and Algebraic Thinking NBT= Numbers and Operations in Base Ten
MD= Measurement and Data G= Geometry
CONTINUE WORK WITH ALL STANDARDS FROM EACH CLUSTER BELOW INTRODUCED IN PREVIOUS UNITS:
Component Cluster K.CC.1-3 Know number names and the count sequence.
Component Cluster K.CC.4-5 Count to tell the number of objects.
Component Cluster K.CC.6-7 Compare numbers.
Kindergarten Unit 4: Measuring and Solving (~ 4 weeks)
Unit Overview: The counting sequence extends up to 50 and story problems extend to within 10. While this unit continues and extends previous work, activities
with the number line and measurement can provide new opportunities for students to consider the relationship between numbers and quantities as they compare
numbers and solve story problems. This unit provides a rich opportunity for looking for and making use of structure (MP 7) as students investigate the relationship
of numbers and quantities in the context of the number line and measurement situations.
Guiding Question: What does it mean for two things to be equal?
Component Cluster K.MD Describe and compare measureable attributes.
K.MD.1 Describe measurable attributes of objects, such
as length or weight. Describe several measurable
attributes of a single object.
*Focus on length.
Students describe measurable attributes of objects, such as length, weight, size, and color. Students often initially
hold undifferentiated views of measurable attributes, saying that one object is “bigger” than another whether it is
longer, or greater in area, or greater in volume, and so forth. Conversations about how they are comparing- one
building may be taller (greater in length) and another may have a larger base (greater in area)- help students learn to
discriminate and name these measureable attributes. As they discuss these situations and compare objects using
different attributes, they learn to distinguish, label, and describe several measureable attributes of a single object.
Thus, teachers listen for and extend conversations about things that are “big”, or “small,” as well as “long,” “tall,”
or “high,” and name, discuss, and demonstrate with gestures the attribute being discussed.
K.MD.2 Directly compare two objects with a measurable
attribute in common, to see which object has “more
of”/“less of” the attribute, and describe the difference.
For example, directly compare the heights of two children
and describe one child as taller/shorter.
Direct comparisons are made when objects are put next to each other, such as two children, two books, two pencils.
Students are not comparing objects that cannot be moved and lined up next to each other. Similar to the
development of the understanding that keeping track is important to obtain an accurate count, kindergarten students
need ample experiences with comparing objects in order to discover the importance of lining up the ends of objects
in order to have an accurate measurement.
As this concept develops, children move from the idea that “Sometimes this block is longer than this one and
sometimes it’s shorter (depending on how I lay them side by side) and that’s okay.” to the understanding that “This
block is always longer than this block (with each end lined up appropriately).” Since this understanding requires
conservation of length, a developmental milestone for young children, kindergarteners need multiple experiences
measuring a variety of items and discussing findings with one another. As students develop conservation of length,
learning and using language such as “It looks longer, but it really isn’t longer” is helpful.
K.MD.3 Classify objects into given categories; count the
numbers of objects in each category and sort the
categories by count.
(Limit category counts to be less than or equal to 10)
Students identify similarities and differences between objects (e.g., size, color, shape) and use the identified
attributes to sort a collection of objects. Once the objects are sorted, the student counts the amount in each set.
Once each set is counted, then the student is asked to sort (or group) each of the sets by the amount in each set.
Thus, like amounts are grouped together, but not necessarily ordered.

Mathematics
CC= Counting and Cardinality OA= Operations and Algebraic Thinking NBT= Numbers and Operations in Base Ten
MD= Measurement and Data G= Geometry
CONTINUE WORK WITH ALL STANDARDS FROM EACH CLUSTER BELOW INTRODUCED IN PREVIOUS UNITS:
Component Cluster K.CC.1-3 Know number names and the count sequence.
Component Cluster K.CC.4-5 Count to tell the number of objects.
Component Cluster K.CC.6-7 Compare numbers.
Component Cluster K.OA.1-5 Understand addition as putting together and adding to, and understand subtraction as taking apart and taking from.
Kindergarten Unit 5: Two-Dimensional Geometry (~ 4 weeks)
Unit Overview: Students learn to identify and describe shapes which they can use as a natural context for working on counting, sorting, and comparing. This unit
contains opportunities for students to construct viable arguments and critique the reasoning of others (MP 3) as they explore and discuss shapes based on attributes
and not just what they “look like.”
Guiding Question: What words are most helpful when you describe a shape?
The student will be able to: The teacher will use appropriate instructional strategies/approaches based on the needs of the student.
Component Cluster K.G Identify and describe shapes (squares, circles, triangles, rectangles, hexagons, cubes, cones, cylinders, and spheres).
K.G.1 Describe objects in the environment using names
of shapes, and describe the relative positions of these
objects using terms such as above, below, beside, in front
of, behind, and next to.
*This unit focuses only on two-dimensional shapes.
Three-dimensional shapes are explored in Unit 6.
Students locate and identify shapes in their environment. For example, a student may look at the tile pattern
arrangement on the hall floor and say, “Look! I see squares! They are next to the triangle.” At first students may
use informal names e.g., “balls,” “boxes,” “cans”. Eventually students refine their informal language by learning
mathematical concepts and vocabulary and identify, compare, and sort shapes based on geometric attributes.*
Students also use positional words (such as those italicized in the standard) to describe objects in the environment,
developing their spatial reasoning competencies. Kindergarten students need numerous experiences identifying the
location and position of actual two-and-three-dimensional objects in their classroom/school prior to describing
location and position of two-and-three-dimension representations on paper.
K.G.2 Correctly name shapes regardless of their
orientations or overall size.
Through numerous experiences exploring and discussing shapes, students begin to understand that certain attributes
define what a shape is called (number of sides, number of angles, etc.) and that other attributes do not (color, size,
orientation). As the teacher facilitates discussions about shapes (“Is it still a triangle if I turn it like this?”), children
question what they “see” and begin to focus on the geometric attributes.
Kindergarten students typically do not yet recognize triangles that are turned upside down as triangles, since they
don’t “look like” triangles. Students need ample experiences manipulating shapes and looking at shapes with
various typical and atypical orientations. Through these experiences, students will begin to move beyond what a
shape “looks like” to identifying particular geometric attributes that define a shape.
K.G.3 Identify shapes as two-dimensional (lying in a
plane, “flat”) or three dimensional (“solid”).
Students identify objects as flat (2 dimensional) or solid (3 dimensional). As the teacher embeds the vocabulary
into students’ exploration of various shapes, students use the terms two-dimensional and three-dimensional as they
discuss the properties of various shapes.
Component Cluster K.G Analyze, Compare, Create, and Compose Objects.
K.G.4 Analyze and compare two- and three-dimensional
shapes, in different sizes and orientations, using informal
language to describe their similarities, differences, parts
Students relate one shape to another as they note similarities and differences between and among 2-D and 3-D
shapes using informal language. Kindergarteners also distinguish between the most typical examples of a shape
from obvious non-examples.

Mathematics
CC= Counting and Cardinality OA= Operations and Algebraic Thinking NBT= Numbers and Operations in Base Ten
MD= Measurement and Data G= Geometry
(e.g., number of sides and vertices/“corners”) and other
attributes (e.g., having sides of equal length).
K.G.5 Model shapes in the world by building shapes from
components (e.g., sticks and clay balls) and drawing
shapes.
Students apply their understanding of geometric attributes of shapes in order to create given shapes. For example,
students may roll a clump of play-doh into a sphere or use their finger to draw a triangle in the sand table, recalling
various attributes in order to create that particular shape.
K.G.6 Compose simple shapes to form larger shapes. For
example, “Can you join these two triangles with full sides
touching to make a rectangle?”
This standard moves beyond identifying and classifying simple shapes to manipulating two or more shapes to
create a new shape. This concept begins to develop as students move, rotate, flip, and arrange puzzle pieces to
complete a puzzle. Kindergarteners use their experiences with puzzles to use simple shapes to create different
shapes.
Kindergarten Unit 6: 3-Dimensional Shapes and Numbers 10-20 (~ 4 weeks) Unit Overview: Students finish their exploration of geometry as they describe attributes, similarities, and differences between 2-D and 3-D shapes. As students
continue to work extensively to solidify combinations to 5 and beyond, numbers 10 to 20 can be parsed as “10 together with a number from 1-10.” This anchor
concept ties in with the continued extension of the counting sequence up to 90 and by 1s and 10s. Students have the opportunity to make sense of problems and
persevere in solving them (MP1) as they apply their understanding of objects and attributes as well as numbers to analyze, compare, create, and compose.
Guiding Question: How can a shape be created from different shapes?
The student will be able to: The teacher will use appropriate instructional strategies/approaches based on the needs of the student.
Component Cluster K.G Identify and describe shapes (squares, circles, triangles, rectangles, hexagons, cubes, cones, cylinders, and spheres).
K.G.3 Identify shapes as two-dimensional (lying in a
plane, “flat”) or three dimensional (“solid”).
*Two-dimensional shapes were covered in Unit 5. Three-
dimensional shapes are now explored.
Students identify objects as flat (2 dimensional) or solid (3 dimensional). As the teacher embeds the vocabulary
into students’ exploration of various shapes, students use the terms two-dimensional and three-dimensional as they
discuss the properties of various shapes.
Component Cluster K.G Analyze, Compare, Create, and Compose Objects.
K.G.4 Analyze and compare two- and three-dimensional
shapes, in different sizes and orientations, using informal
language to describe their similarities, differences, parts
(e.g., number of sides and vertices/“corners”) and other
attributes (e.g., having sides of equal length).
Students relate one shape to another as they note similarities and differences between and among 2-D and 3-D
shapes using informal language. Kindergarteners also distinguish between the most typical examples of a shape
from obvious non-examples.
K.G.5 Model shapes in the world by building shapes from
components (e.g., sticks and clay balls) and drawing
shapes.
Students apply their understanding of geometric attributes of shapes in order to create given shapes. For example,
students may roll a clump of play-doh into a sphere or use their finger to draw a triangle in the sand table, recalling
various attributes in order to create that particular shape.
K.G.6 Compose simple shapes to form larger shapes. For
example, “Can you join these two triangles with full sides
touching to make a rectangle?”
This standard moves beyond identifying and classifying simple shapes to manipulating two or more shapes to
create a new shape. This concept begins to develop as students move, rotate, flip, and arrange puzzle pieces to
complete a puzzle. Kindergarteners use their experiences with puzzles to use simple shapes to create different
shapes.
Component Cluster K.NBT Work with numbers 11–19 to gain foundations for place value.

Mathematics
CC= Counting and Cardinality OA= Operations and Algebraic Thinking NBT= Numbers and Operations in Base Ten
MD= Measurement and Data G= Geometry
K.NBT.1 Compose and decompose numbers from 11 to
19 into ten ones and some further ones, e.g., by using
objects or drawings, and record each composition or
decomposition by a drawing or equation (e.g., 18 = 10 +
8)*; understand that these numbers are composed of ten
ones and one, two, three, four, five, six, seven, eight, or
nine ones.
* Kindergarten students should see addition and
subtraction equations, and student writing of equations in
kindergarten is encouraged, but it is not required.
Students explore numbers 11-19 using representations, such as manipulatives or drawings. Rather than unitizing a
ten (recognizing that a set of 10 objects is a unit called a “ten”), which is a standard for First Grade (1.NBT.1a),
kindergarteners keep each count as a single unit as they explore a set of 10 objects and leftovers.
Example:
Teacher: “I have some chips here. Do you think they will fit on our ten frame? Why? Why Not?”
Students: Share thoughts with one another.
Teacher: “Use your ten frame to investigate.”
Students: “Look. There’s too many to fit on the ten frame. Only ten chips will fit on it.”
Teacher: “So you have some leftovers?”
Students: “Yes. I’ll put them over here next to the ten frame.”
Teacher: “So, how many do you have in all?”
Student A: “One, two, three, four, five… ten, eleven, twelve, thirteen, fourteen. I have fourteen. Ten fit on and
four didn’t.”
Student B: Pointing to the ten frame, “See them- that’s 10… 11, 12, 13, 14. There’s fourteen.”
Teacher: Use your recording sheet (or number sentence cards) to show what you found out.
Student Recording Sheets Example:

Mathematics
CC= Counting and Cardinality OA= Operations and Algebraic Thinking NBT= Numbers and Operations in Base Ten
MD= Measurement and Data G= Geometry
Kindergarten Unit 7: Weight and Place Value (~ 4 weeks)
Unit Overview: Students are introduced to concepts and vocabulary related to weight and capacity. These contexts can be used to segue into a continuation of last
unit’s focus on the idea of 10 and some more. Students continue to work on solidifying problem-solving strategies and fluency skills. This unit provides further
opportunities for looking for and making use of structure (MP 7) as students investigate the structure of place value.
Guiding Question: What is the connection between 10 and the “tricky teens”?
Component Cluster K.MD Describe and compare measureable attributes.
K.MD.1 Describe measurable attributes of objects, such
as length or weight. Describe several measurable
attributes of a single object.
Students describe measurable attributes of objects, such as length, weight, size, and color. Students often initially
hold undifferentiated views of measurable attributes, saying that one object is “bigger” than another whether it is
longer, or greater in area, or greater in volume, and so forth. Conversations about how they are comparing- one
building may be taller (greater in length) and another may have a larger base (greater in area)- help students learn to
discriminate and name these measureable attributes. As they discuss these situations and compare objects using
different attributes, they learn to distinguish, label, and describe several measureable attributes of a single object.
Thus, teachers listen for and extend conversations about things that are “big”, or “small,” as well as “long,” “tall,”
or “high,” and name, discuss, and demonstrate with gestures the attribute being discussed.
K.MD.2 Directly compare two objects with a measurable
attribute in common, to see which object has “more
of”/“less of” the attribute, and describe the difference.
For example, directly compare the heights of two children
and describe one child as taller/shorter.
Direct comparisons are made when objects are put next to each other, such as two children, two books, two pencils.
Students are not comparing objects that cannot be moved and lined up next to each other. Similar to the
development of the understanding that keeping track is important to obtain an accurate count, kindergarten students
need ample experiences with comparing objects in order to discover the importance of lining up the ends of objects
in order to have an accurate measurement.
As this concept develops, children move from the idea that “Sometimes this block is longer than this one and
sometimes it’s shorter (depending on how I lay them side by side) and that’s okay.” to the understanding that “This
block is always longer than this block (with each end lined up appropriately).” Since this understanding requires
conservation of length, a developmental milestone for young children, kindergarteners need multiple experiences
measuring a variety of items and discussing findings with one another. As students develop conservation of length,
learning and using language such as “It looks longer, but it really isn’t longer” is helpful.
K.MD.3 Classify objects into given categories; count the
numbers of objects in each category and sort the
categories by count.
(Limit category counts to be less than or equal to 10)
Students identify similarities and differences between objects (e.g., size, color, shape) and use the identified
attributes to sort a collection of objects. Once the objects are sorted, the student counts the amount in each set.
Once each set is counted, then the student is asked to sort (or group) each of the sets by the amount in each set.
Thus, like amounts are grouped together, but not necessarily ordered.
CONTINUE WORK WITH ALL STANDARDS FROM EACH CLUSTER BELOW INTRODUCED IN PREVIOUS UNITS:
Component Cluster K.CC.1-3 Know number names and the count sequence.
Component Cluster K.CC.4-5 Count to tell the number of objects.
Component Cluster K.CC.6-7 Compare numbers.
Component Cluster K.OA.1-5 Understand addition as putting together and adding to, and understand subtraction as taking apart and taking from.
Component Cluster K.NBT.1 Work with numbers 11–19 to gain foundations for place value.

Mathematics
CC= Counting and Cardinality OA= Operations and Algebraic Thinking NBT= Numbers and Operations in Base Ten
MD= Measurement and Data G= Geometry
Kindergarten Unit 8: Culminating Unit: Challenge and Application (~4 weeks)
Unit Overview: The focus of unit 8 is to provide students with engaging opportunities to apply their learning from the year. They will have time to deepen their
understandings, correct misconceptions, solidify procedural strategies, and apply their skills in real-life contexts. During this unit, students should make sense of
problems and persevere in solving them (MP1) as they employ all of their math concepts and skills from the year in meaningful contexts.
Guiding Question: How will you use the math you have learned in kindergarten to investigate and solve problems over the course of the summer?
CONTINUE WORK WITH ALL GRADE LEVEL STANDARDS.

Mathematics
CC= Counting and Cardinality OA= Operations and Algebraic Thinking NBT= Numbers and Operations in Base Ten
MD= Measurement and Data G= Geometry
Grade 1 In Grade 1, instructional time should focus on four critical areas: (1) developing understanding of addition, subtraction, and strategies for addition
and subtraction within 20; (2) developing understanding of whole number relationships and place value, including grouping in tens and ones; (3)
developing understanding of linear measurement and measuring lengths as iterating length units; and (4) reasoning about attributes of, and
composing and decomposing geometric shapes.
(1) Students develop strategies for adding and subtracting whole numbers based on their prior work with small numbers. They use a variety of
models, including discrete objects and length-based models (e.g., cubes connected to form lengths), to model add-to, take-from, put-together,
take-apart, and compare situations to develop meaning for the operations of addition and subtraction, and to develop strategies to solve
arithmetic problems with these operations. Students understand connections between counting and addition and subtraction (e.g., adding two
is the same as counting on two). They use properties of addition to add whole numbers and to create and use increasingly sophisticated
strategies based on these properties (e.g., “making tens”) to solve addition and subtraction problems within 20. By comparing a variety of
solution strategies, children build their understanding of the relationship between addition and subtraction.
(2) Students develop, discuss, and use efficient, accurate, and generalizable methods to add within 100 and subtract multiples of 10. They
compare whole numbers (at least to 100) to develop understanding of and solve problems involving their relative sizes. They think of whole
numbers between 10 and 100 in terms of tens and ones (especially recognizing the numbers 11 to 19 as composed of a ten and some ones).
Through activities that build number sense, they understand the order of the counting numbers and their relative magnitudes.
(3) Students develop an understanding of the meaning and processes of measurement, including underlying concepts such as iterating (the
mental activity of building up the length of an object with equal-sized units) and the transitivity principle for indirect measurement.1
(4) Students compose and decompose plane or solid figures (e.g., put two triangles together to make a quadrilateral) and build understanding
of part-whole relationships as well as the properties of the original and composite shapes. As they combine shapes, they recognize them from
different perspectives and orientations, describe their geometric attributes, and determine how they are alike and different, to develop the
background for measurement and for initial understandings of properties such as congruence and symmetry.
Mathematical Practices
1. Make sense of problems and persevere in solving them.
2. Reason abstractly and quantitatively.
3. Construct viable arguments and critique the reasoning of others.
4. Model with mathematics.
5. Use appropriate tools strategically.
6. Attend to precision.
7. Look for and make use of structure.
8. Look for and express regularity in repeated reasoning.
1Students should apply the principle of transitivity of measurement to make indirect comparisons, but they need not use this technical term.

Mathematics
CC= Counting and Cardinality OA= Operations and Algebraic Thinking NBT= Numbers and Operations in Base Ten
MD= Measurement and Data G= Geometry
Grade 1: Suggested Distribution of Units in Instructional Days Time Approx.
# of weeks Unit 1: Addition/Subtraction of Numbers to 10 and Fluency 12.5% ~ 4 weeks
Unit 2: Addition/Subtraction Strategies with Single Digit Sums 12.5% ~ 4 weeks
Unit 3: Place Value, Comparison, and Addition/Subtraction Strategies of Numbers to 20 12.5% ~ 4 weeks
Unit 4: Using the Number Line with Numbers to 100 and Measurement Contexts 12.5% ~ 4 weeks
Unit 5: Identify, Compose, and Partition Shapes 12.5% ~ 4 weeks
Unit 6: Addition/Subtraction of Numbers to 20 with Fluency, Story Problems, and Equations 12.5% ~ 4 weeks
Unit 7: Place Value, Comparison, Addition/Subtraction of Numbers to 100 12.5% ~ 4 weeks
Unit 8: Culminating Unit: Challenge and Application Using All Standards 12.5% ~ 4 weeks
Instructional
Focus of Unit:
Operations and
Algebraic Thinking Number Fractions
Measurement
and Data Geometry Application
Unit 1: + and - of Numbers to 10 and
Fluency12.5%
Unit 2: +/-Strategies with
Single Digit Sums 12.5%
Unit 3: P.V., Comparison, and +/- Strategies of Numbers to 20
12.5%Unit 4: Using the
Number Line with Numbers to 100
and Measurement12.5%
Unit 5: Identify, Compose, and
Partition Shapes13%
Unit 6: +/- of Numbers to 20 with
Fluency, Story Problems, and
Equations12.5%
Unit 7: Place Value, Comparison, +/-with Numbers to
10012.5%
Unit 8: Culminating Unit
12.5%
Instructional Time

Mathematics
CC= Counting and Cardinality OA= Operations and Algebraic Thinking NBT= Numbers and Operations in Base Ten
MD= Measurement and Data G= Geometry
Grade 1 Unit 1: Addition/Subtraction of Numbers to 10 and Fluency (~ 4 weeks)
Unit Overview: Work with “numbers to 10” continues to be a major stepping-stone in learning the place value system. This year starts out with
establishing counting routines and work with combinations of numbers within 10. Fluency with addition/subtraction facts, a major gateway to later
grades, also begins right away with the intention of energetically practicing the entire year. This unit provides opportunities for students to model
with mathematics (MP 4) as they use models to support their understanding and explanations of their addition and subtraction strategies.
Guiding Question: What are good strategies for solving addition and subtraction problems to 10?
The student will be able to: The teacher will use appropriate instructional strategies/approaches based on the needs of the student.
Component Cluster 1.OA Represent and solve problems involving addition and subtraction.*
*Within 10 only is addressed in Unit 1.
1.OA.1 Use addition and subtraction within 20 to solve
word problems involving situations of adding to, taking
from, putting together, taking apart, and comparing, with
unknowns in all positions, e.g., by using objects,
drawings, and equations with a symbol for the unknown
number to represent the problem.1
1 See Glossary, Table 1
First grade students extend their experiences in Kindergarten by working with numbers to 20 to solve a new type of
problem situation: Compare (See Table 1 at end of document for examples of all problem types). Compare
problems are more complex than those introduced in Kindergarten. In order to solve compare problem types, First
Graders must think about a quantity that is not physically present and must conceptualize that amount. In addition,
the language of “how many more” often becomes lost or not heard with the language of ‘who has more’. With rich
experiences that encourage students to match problems with objects and drawings can help students master these
challenges.
First Graders also extend the sophistication of the methods they used in Kindergarten (counting) to add and subtract
within this larger range. Now, First Grade students use the methods of counting on, making ten, and doubles +/- 1
or +/- 2 to solve problems.
In order for students to read and use equations to represent their thinking, they need extensive experiences with
addition and subtraction situations in order to connect the experiences with symbols (+, -, =) and equations (5 = 3 +
2). In Kindergarten, students demonstrated the understanding of how objects can be joined (addition) and separated
(subtraction) by representing addition and subtraction situations using objects, pictures and words. In First Grade,
students extend this understanding of addition and subtraction situations to use the addition symbol (+) to represent
joining situations, the subtraction symbol (-) to represent separating situations, and the equal sign (=) to represent a
relationship regarding quantity between one side of the equation and the other.
1.OA.2 Solve word problems that call for addition of
three whole numbers whose sum is less than or equal to
20, e.g., by using objects, drawings, and equations with a
symbol for the unknown number to represent the problem.
First Grade students solve multi-step word problems by adding (joining) three numbers whose sum is less than or
equal to 20, using a variety of mathematical representations (ten-frame, number line, make ten).
Component Cluster 1.OA Understand and apply properties of operations and the relationship between addition and subtraction.*
*Within 10 only is addressed in Unit 1. 1.OA.3 Apply properties of operations as strategies to add
and subtract.2 Examples: If 8 + 3 = 11 is known, then 3 +
8 = 11 is also known. (Commutative property of
addition.) To add 2 + 6 + 4, the second two numbers can
Elementary students often believe that there are hundreds of isolated addition and subtraction facts to be mastered.
However, when students understand the commutative and associative properties, they are able to use relationships
between and among numbers to solve problems. First Grade students apply properties of operations as strategies to

Mathematics
CC= Counting and Cardinality OA= Operations and Algebraic Thinking NBT= Numbers and Operations in Base Ten
MD= Measurement and Data G= Geometry
be added to make a ten, so 2 + 6 + 4 = 2 + 10 = 12.
(Associative property of addition.)
2 Students need not use formal terms for these properties.
add and subtract. Students do not use the formal terms “commutative” and “associative”. Rather, they use the
understandings of the commutative and associative property to solve problems.
Students use mathematical tools and representations (e.g., cubes, counters, number balance, number line, ten-
frames, 100 chart) to model these ideas.
1.OA.4 Understand subtraction as an unknown-addend
problem.
For example, subtract 10 – 8 by finding the number that
makes 10 when added to 8. Add and subtract within 20.
First Graders often find subtraction facts more difficult to learn than addition facts. By understanding the
relationship between addition and subtraction, First Graders are able to use various strategies to solve subtraction
problems including Think Addition, Build Up Through Ten, and Build Back Through Ten.
Component Cluster 1.OA Add and subtract within 20.*
*Within 10 only is addressed in Unit 1.
1.OA.5 Relate counting to addition and subtraction (e.g.,
by counting on 2 to add 2).
When solving addition and subtraction problems to 20, First Graders often use counting strategies, such as counting
all, counting on, and counting back, before fully developing the essential strategy of using 10 as a benchmark
number. Once students have developed counting strategies to solve addition and subtraction problems, it is very
important to move students toward strategies that focus on composing and decomposing number using ten as a
benchmark number, as discussed in 1.OA.6, particularly since counting becomes a hindrance when working with
larger numbers. By the end of First Grade, students are expected to use the strategy of 10 to solve problems.
Counting All: Students count all objects to determine the total amount.
Counting On & Counting Back: Students hold a “start number” in their head and count on/back from that number.
1.OA.6 Add and subtract within 20, demonstrating
fluency for addition and subtraction within 10. Use
strategies such as counting on; making ten (e.g., 8 + 6 = 8
+ 2 + 4 = 10 + 4 = 14); decomposing a number leading to
a ten (e.g., 13 – 4 = 13 – 3 – 1 = 10 – 1 = 9); using the
relationship between addition and subtraction (e.g.,
knowing that 8 + 4 = 12, one knows 12 – 8 = 4); and
creating equivalent but easier or known sums (e.g., adding
6 + 7 by creating the known equivalent 6 + 6 + 1 = 12 + 1
= 13).
In First Grade, students learn about and use various strategies to solve addition and subtraction problems. When
students repeatedly use strategies that make sense to them, they internalize facts and develop fluency for addition
and subtraction within 10. When students are able to demonstrate fluency within 10, they are accurate, efficient,
and flexible. First Graders then apply similar strategies for solving problems within 20, building the foundation for
fluency to 20 in Second Grade.
Component Cluster 1.OA Work with addition and subtraction equations.
1.OA.7 Understand the meaning of the equal sign, and
determine if equations involving addition and subtraction
are true or false. For example, which of the following
equations are true and which are false? 6 = 6, 7 = 8 – 1, 5
+ 2 = 2 + 5, 4 + 1 = 5 + 2.
In order to determine whether an equation is true or false, First Grade students must first understand the meaning of
the equal sign. This is developed as students in Kindergarten and First Grade solve numerous joining and
separating situations with mathematical tools, rather than symbols. Once the concepts of joining, separating, and
“the same amount/quantity as” are developed concretely, First Graders are ready to connect these experiences to
the corresponding symbols (+, -, =). Thus, students learn that the equal sign does not mean “the answer comes
next”, but that the symbol signifies an equivalent relationship that the left side ‘has the same value as’ the right side
of the equation.

Mathematics
CC= Counting and Cardinality OA= Operations and Algebraic Thinking NBT= Numbers and Operations in Base Ten
MD= Measurement and Data G= Geometry
When students understand that an equation needs to “balance”, with equal quantities on both sides of the equal
sign, they understand various representations of equations, such as:
an operation on the left side of the equal sign and the answer on the right side (5 + 8 = 13)
an operation on the right side of the equal sign and the answer on the left side (13 = 5 + 8)
numbers on both sides of the equal sign (6 = 6)
operations on both sides of the equal sign (5 + 2 = 4 + 3).
Once students understand the meaning of the equal sign, they are able to determine if an equation is true (9 = 9) or
false (9 = 8).
1.OA.8 Determine the unknown whole number in an
addition or subtraction equation relating three whole
numbers. For example, determine the unknown number
that makes the equation true in each of the equations 8 +
? = 11, 5 = _ – 3, 6 + 6 = _.
First Graders use their understanding of and strategies related to addition and subtraction as described in 1.OA.4
and 1.OA.6 to solve equations with an unknown. Rather than symbols, the unknown symbols are boxes or pictures.
Component Cluster 1.NBT Extend the counting sequence.
1.NBT.1 Count to 120, starting at any number less than
120. In this range, read and write numerals and represent
a number of objects with a written numeral.
First Grade students rote count forward to 120 by counting on from any number less than 120. First graders develop
accurate counting strategies that build on the understanding of how the numbers in the counting sequence are
related—each number is one more (or one less) than the number before (or after). In addition, first grade students
read and write numerals to represent a given amount.
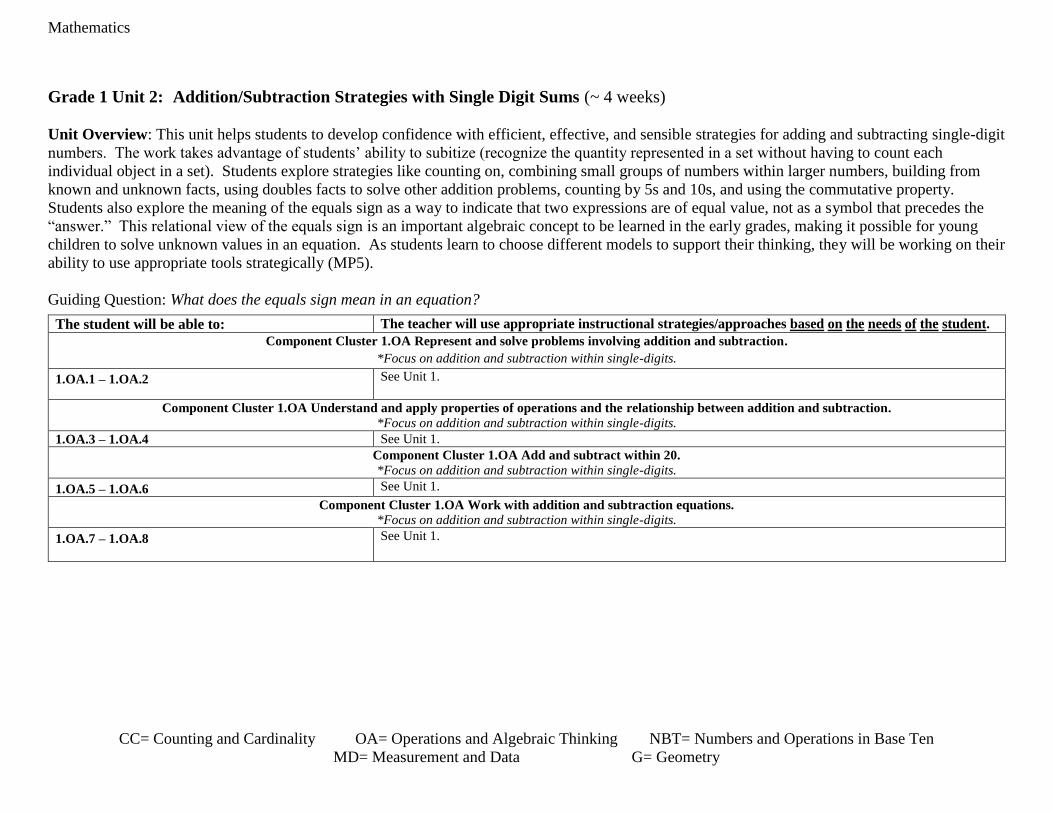
Mathematics
CC= Counting and Cardinality OA= Operations and Algebraic Thinking NBT= Numbers and Operations in Base Ten
MD= Measurement and Data G= Geometry
Grade 1 Unit 2: Addition/Subtraction Strategies with Single Digit Sums (~ 4 weeks)
Unit Overview: This unit helps students to develop confidence with efficient, effective, and sensible strategies for adding and subtracting single-digit
numbers. The work takes advantage of students’ ability to subitize (recognize the quantity represented in a set without having to count each
individual object in a set). Students explore strategies like counting on, combining small groups of numbers within larger numbers, building from
known and unknown facts, using doubles facts to solve other addition problems, counting by 5s and 10s, and using the commutative property.
Students also explore the meaning of the equals sign as a way to indicate that two expressions are of equal value, not as a symbol that precedes the
“answer.” This relational view of the equals sign is an important algebraic concept to be learned in the early grades, making it possible for young
children to solve unknown values in an equation. As students learn to choose different models to support their thinking, they will be working on their
ability to use appropriate tools strategically (MP5).
Guiding Question: What does the equals sign mean in an equation?
The student will be able to: The teacher will use appropriate instructional strategies/approaches based on the needs of the student.
Component Cluster 1.OA Represent and solve problems involving addition and subtraction.
*Focus on addition and subtraction within single-digits.
1.OA.1 – 1.OA.2 See Unit 1.
Component Cluster 1.OA Understand and apply properties of operations and the relationship between addition and subtraction.
*Focus on addition and subtraction within single-digits.
1.OA.3 – 1.OA.4 See Unit 1.
Component Cluster 1.OA Add and subtract within 20.
*Focus on addition and subtraction within single-digits.
1.OA.5 – 1.OA.6 See Unit 1.
Component Cluster 1.OA Work with addition and subtraction equations.
*Focus on addition and subtraction within single-digits.
1.OA.7 – 1.OA.8
See Unit 1.

Mathematics
CC= Counting and Cardinality OA= Operations and Algebraic Thinking NBT= Numbers and Operations in Base Ten
MD= Measurement and Data G= Geometry
Grade 1 Unit 3: Place Value, Comparison, and Addition/Subtraction Strategies of Numbers to 20 (~ 4 weeks)
Unit Guide: This unit provides time and activities to reach mastery of the key number facts and fact strategies for single-digit addition and
subtraction. It also begins the next major stepping-stone of learning to group “10 ones” as a single unit: 1 ten. Work begins slowly by using 10s and
1s to make teen numbers and beyond. This work includes work with the part-part-whole model and a focus on developing an understanding of the
difference model of subtraction. This unit provides students with the opportunity to construct viable arguments and critique the reasoning of others
(MP 3) as they articulate their solution strategies and respond to those of other students.
Guiding Question: How are addition and subtraction strategies with numbers to 20 different or similar to strategies for numbers to 10?
The student will be able to: The teacher will use appropriate instructional strategies/approaches based on the needs of the student.
Component Cluster 1.NBT Extend the counting sequence.
1.NBT.1 Count to 120, starting at any number less than
120. In this range, read and write numerals and represent
a number of objects with a written numeral.
First Grade students rote count forward to 120 by counting on from any number less than 120. First graders develop
accurate counting strategies that build on the understanding of how the numbers in the counting sequence are
related—each number is one more (or one less) than the number before (or after). In addition, first grade students
read and write numerals to represent a given amount.
Component Cluster 1.NBT Understand Place Value.
1.NBT.2 Understand that the two digits of a two-digit
number represent amounts of tens and ones. Understand
the following as special cases:
a. 10 can be thought of as a bundle of ten ones —
called a “ten.”
First Grade students are introduced to the idea that a bundle of ten ones is called “a ten”. This is known as
unitizing. When First Grade students unitize a group of ten ones as a whole unit (“a ten”), they are able to count
groups as though they were individual objects. For example, 4 trains of ten cubes each have a value of 10 and
would be counted as 40 rather than as 4. This is a monumental shift in thinking, and can often be challenging for
young children to consider a group of something as “one” when all previous experiences have been counting single
objects. This is the foundation of the place value system and requires time and rich experiences with concrete
manipulatives to develop.
A student’s ability to conserve number is an important aspect of this standard. It is not obvious to young children
that 42 cubes is the same amount as 4 tens and 2 left-overs. It is also not obvious that 42 could also be composed of
2 groups of 10 and 22 leftovers. Therefore, first graders require ample time grouping proportional objects (e.g.,
cubes, beans, beads, ten-frames) to make groups of ten, rather than using pre-grouped materials (e.g., base ten
blocks, pre-made bean sticks) that have to be “traded” or are non-proportional (e.g., money).
As children build this understanding of grouping, they move through several stages:
Counting By Ones; Counting by Groups & Singles; and Counting by Tens and Ones.
b. The numbers from 11 to 19 are composed of a ten
and one, two, three, four, five, six, seven, eight, or
nine ones.
First Grade students extend their work from Kindergarten when they composed and decomposed numbers from 11
to 19 into ten ones and some further ones. In Kindergarten, everything was thought of as individual units: “ones”.
In First Grade, students are asked to unitize those ten individual ones as a whole unit: “one ten”. Students in first
grade explore the idea that the teen numbers (11 to 19) can be expressed as one ten and some leftover ones. Ample
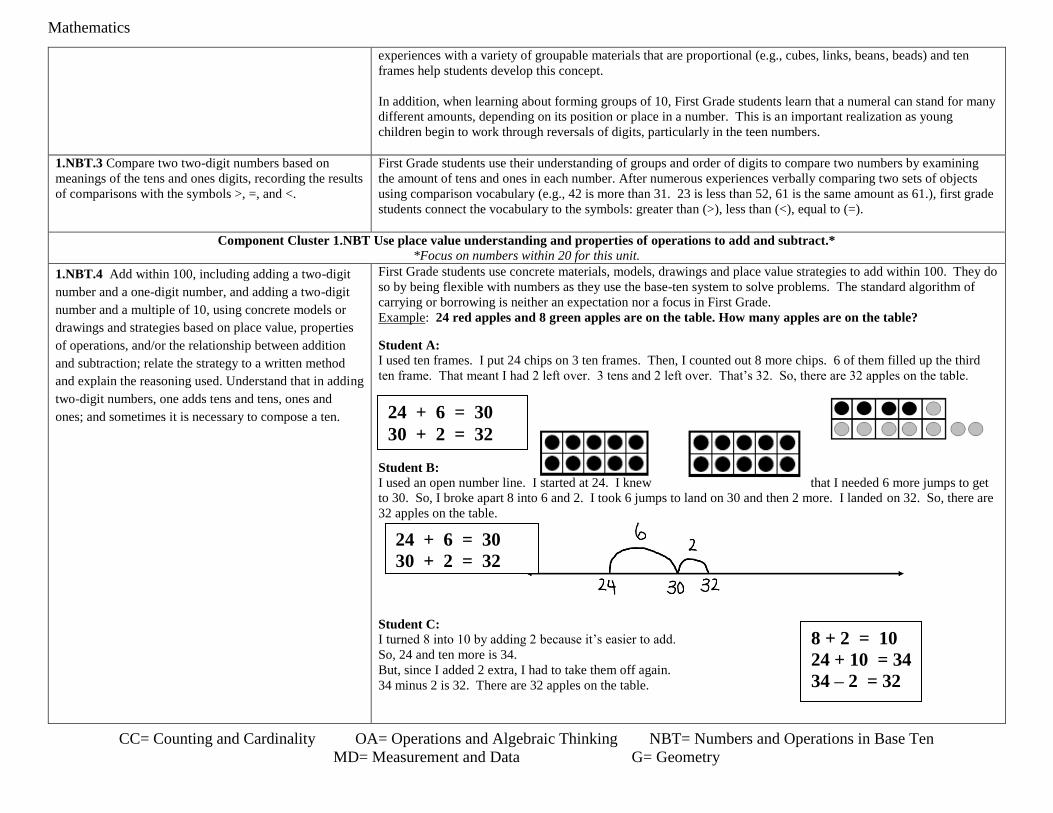
Mathematics
CC= Counting and Cardinality OA= Operations and Algebraic Thinking NBT= Numbers and Operations in Base Ten
MD= Measurement and Data G= Geometry
experiences with a variety of groupable materials that are proportional (e.g., cubes, links, beans, beads) and ten
frames help students develop this concept.
In addition, when learning about forming groups of 10, First Grade students learn that a numeral can stand for many
different amounts, depending on its position or place in a number. This is an important realization as young
children begin to work through reversals of digits, particularly in the teen numbers.
1.NBT.3 Compare two two-digit numbers based on
meanings of the tens and ones digits, recording the results
of comparisons with the symbols >, =, and <.
First Grade students use their understanding of groups and order of digits to compare two numbers by examining
the amount of tens and ones in each number. After numerous experiences verbally comparing two sets of objects
using comparison vocabulary (e.g., 42 is more than 31. 23 is less than 52, 61 is the same amount as 61.), first grade
students connect the vocabulary to the symbols: greater than (>), less than (<), equal to (=).
Component Cluster 1.NBT Use place value understanding and properties of operations to add and subtract.*
*Focus on numbers within 20 for this unit.
1.NBT.4 Add within 100, including adding a two-digit
number and a one-digit number, and adding a two-digit
number and a multiple of 10, using concrete models or
drawings and strategies based on place value, properties
of operations, and/or the relationship between addition
and subtraction; relate the strategy to a written method
and explain the reasoning used. Understand that in adding
two-digit numbers, one adds tens and tens, ones and
ones; and sometimes it is necessary to compose a ten.
First Grade students use concrete materials, models, drawings and place value strategies to add within 100. They do
so by being flexible with numbers as they use the base-ten system to solve problems. The standard algorithm of
carrying or borrowing is neither an expectation nor a focus in First Grade.
Example: 24 red apples and 8 green apples are on the table. How many apples are on the table?
Student A:
I used ten frames. I put 24 chips on 3 ten frames. Then, I counted out 8 more chips. 6 of them filled up the third
ten frame. That meant I had 2 left over. 3 tens and 2 left over. That’s 32. So, there are 32 apples on the table.
Student B:
I used an open number line. I started at 24. I knew that I needed 6 more jumps to get
to 30. So, I broke apart 8 into 6 and 2. I took 6 jumps to land on 30 and then 2 more. I landed on 32. So, there are
32 apples on the table.
Student C:
I turned 8 into 10 by adding 2 because it’s easier to add.
So, 24 and ten more is 34.
But, since I added 2 extra, I had to take them off again.
34 minus 2 is 32. There are 32 apples on the table.
24 + 6 = 30
30 + 2 = 32
24 + 6 = 30
30 + 2 = 32
8 + 2 = 10
24 + 10 = 34
34 – 2 = 32

Mathematics
CC= Counting and Cardinality OA= Operations and Algebraic Thinking NBT= Numbers and Operations in Base Ten
MD= Measurement and Data G= Geometry
Example: 63 apples are in the basket. Mary put 20 more apples in the basket. How many apples are in the
basket?
Student A:
I used ten frames. I picked out 6 filled ten frames. That’s 60. I got the ten frame with 3 on it. That’s 63. Then, I
picked one more filled ten frame for part of the 20 that Mary put in. That made 73. Then, I got one more filled ten
frame to make the rest of the 20 apples from Mary. That’s 83. So, there are 83 apples in the basket.
Student B:
I used a hundreds chart. I started at 63 and jumped down one row to 73. That means I moved 10 spaces. Then, I
jumped down one more row (that’s another 10 spaces) and landed on 83. So, there are 83 apples in the basket.
Student C:
I knew that 10 more than 63 is 73. And 10 more than 73 is 83. So, there are 83 apples in the basket.
63 + 10 = 73 73 + 10 = 83
63 + 10 = 73 73 + 10 = 83
63 + 10 = 73 73 + 10 = 83

Mathematics
CC= Counting and Cardinality OA= Operations and Algebraic Thinking NBT= Numbers and Operations in Base Ten
MD= Measurement and Data G= Geometry
Component Cluster 1.OA Represent and solve problems involving addition and subtraction.
*Focus on numbers within 20 for this unit.
1.OA.1 – 1.OA.2 See Unit 1.
Component Cluster 1.OA Understand and apply properties of operations and the relationship between addition and subtraction.
1.OA.3 – 1.OA.4 See Unit 1.
Component Cluster 1.OA Add and subtract within 20.
1.OA.5 – 1.OA.6 See Unit 1.
Component Cluster 1.OA Work with addition and subtraction equations.
1.OA.7 – 1.OA.8 See Unit 1.

Mathematics
CC= Counting and Cardinality OA= Operations and Algebraic Thinking NBT= Numbers and Operations in Base Ten
MD= Measurement and Data G= Geometry
Grade 1 Unit 4: Using the Number Line with Numbers to 100 and Measurement Contexts (~ 4 weeks) Unit Overview: The primary concern of this unit is to help students develop a solid footing in counting, addition, and subtraction within the range of
0-120—conceptually and procedurally. The number line can serve as a key model for representing numbers and for adding and subtracting them
using multiples of 1, 5, and 10. Students can also connect the number line tool with real-life length measurement activities. Students will need to
work on attending to precision (MP 6) in this unit focused on using the number line to represent numbers, to solve addition and subtraction problems,
and to compare and order measurement data.
Guiding Question: After you collect, measure, organize, and display data, how can we use the information to make sense of the world around us?
The student will be able to: The teacher will use appropriate instructional strategies/approaches based on the needs of the student.
Component Cluster 1.NBT Extend the counting sequence.
1.NBT.1 Count to 120, starting at any number less than
120. In this range, read and write numerals and represent
a number of objects with a written numeral.
See Unit 3.
Component Cluster 1.NBT Understand Place Value.
1.NBT.2 Understand that the two digits of a two-digit
number represent amounts of tens and ones. Understand
the following as special cases:
a. 10 can be thought of as a bundle of ten ones —
called a “ten.”
See Unit 3.
b. The numbers from 11 to 19 are composed of a
ten and one, two, three, four, five, six, seven,
eight, or nine ones.
See Unit 3.
1.NBT.3 Compare two two-digit numbers based on
meanings of the tens and ones digits, recording the results
of comparisons with the symbols >, =, and <.
See Unit 3.
Component Cluster 1.NBT Use place value understanding and properties of operations to add and subtract.
1.NBT.4 Add within 100, including adding a two-digit
number and a one-digit number, and adding a two-digit
number and a multiple of 10, using concrete models or
drawings and strategies based on place value, properties
of operations, and/or the relationship between addition
and subtraction; relate the strategy to a written method
See Unit 3.

Mathematics
CC= Counting and Cardinality OA= Operations and Algebraic Thinking NBT= Numbers and Operations in Base Ten
MD= Measurement and Data G= Geometry
and explain the reasoning used. Understand that in adding
two-digit numbers, one adds tens and tens, ones and ones;
and sometimes it is necessary to compose a ten.
1.NBT.5 Given a two-digit number, mentally find 10
more or 10 less than the number, without having to count;
explain the reasoning used.
First Graders build on their counting by tens work in Kindergarten by mentally adding ten more and ten less than
any number less than 100. First graders are not expected to compute differences of two-digit numbers other than
multiples of ten. Ample experiences with ten frames and the number line provide students with opportunities to
think about groups of ten, moving them beyond simply rote counting by tens on and off the decade. Such
representations lead to solving such problems mentally.
1.NBT.6 Subtract multiples of 10 in the range 10-90 from
multiples of 10 in the range 10-90 (positive or zero
differences), using concrete models or drawings and
strategies based on place value, properties of operations,
and/or the relationship between addition and subtraction;
relate the strategy to a written method and explain the
reasoning used.
First Grade students use concrete models, drawings and place value strategies to subtract multiples of 10 from
decade numbers (e.g., 30, 40, 50). They often use similar strategies as discussed in 1.OA.4.
Component Cluster 1.MD Measure lengths indirectly and by iterating length units.
1.MD.1 Order three objects by length; compare the
lengths of two objects indirectly by using a third object.
First Grade students continue to use direct comparison to compare lengths. Direct comparison means that students
compare the amount of an attribute in two objects without measurement. Sometimes, a third object can be used as
an intermediary, allowing indirect comparison. Another important set of skills and understandings is ordering a set
of objects by length. Such sequencing requires multiple comparisons (no more than 6 objects). Students need to
understand that each object in a seriation is larger than those that come before it, and shorter than those that come
after.
1.MD.2 Express the length of an object as a whole
number of length units, by laying multiple copies of a
shorter object (the length unit) end to end; understand that
the length measurement of an object is the number of
same-size length units that span it with no gaps or
overlaps. Limit to contexts where the object being
measured is spanned by a whole number of length units
with no gaps or overlaps.
First Graders use objects to measure items to help students focus on the attribute being measured. Objects also
lend itself to future discussions regarding the need for a standard unit.
First Grade students use multiple copies of one object to measure the length of a larger object. They learn to lay
physical units such as centimeter or inch manipulatives end-to-end and count them to measure a length. Through
numerous experiences and careful questioning by the teacher, students will recognize the importance of careful
measuring so that there are not any gaps or overlaps in order to get an accurate measurement. This concept is a
foundational building block for the concept of area in 3rd Grade.
When students use different sized units to measure the same object, they learn that the sizes of the units must be
considered, rather than relying solely on the amount of objects counted. In addition, understanding that the results
of measurement and direct comparison have the same results encourages children to use measurement strategies.
Component Cluster 1.MD Represent and interpret data.

Mathematics
CC= Counting and Cardinality OA= Operations and Algebraic Thinking NBT= Numbers and Operations in Base Ten
MD= Measurement and Data G= Geometry
1.MD.4 Organize, represent, and interpret data with up to
three categories; ask and answer questions about the total
number of data points, how many in each category, and
how many more or less are in one category than in
another.
First Grade students collect and use categorical data (e.g., eye color, shoe size, age) to answer a question. The data
collected are often organized in a chart or table. Once the data are collected, First Graders interpret the data to
determine the answer to the question posed. They also describe the data noting particular aspects such as the total
number of answers, which category had the most/least responses, and interesting differences/similarities between
the categories. As the teacher provides numerous opportunities for students to create questions, determine up to 3
categories of possible responses, collect data, organize data, and interpret the results, First Graders build a solid
foundation for future data representations (picture and bar graphs) in Second Grade.
Component Cluster 1.OA Represent and solve problems involving addition and subtraction.
1.OA.1 – 1.OA.2 See Unit 1.
Component Cluster 1.OA Understand and apply properties of operations and the relationship between addition and subtraction.
1.OA.3 – 1.OA.4 See Unit 1.
Component Cluster 1.OA Add and subtract within 20.
1.OA.5 – 1.OA.6 See Unit 1.
Component Cluster 1.OA Work with addition and subtraction equations.
1.OA.7 – 1.OA.8
See Unit 1.

Mathematics
CC= Counting and Cardinality OA= Operations and Algebraic Thinking NBT= Numbers and Operations in Base Ten
MD= Measurement and Data G= Geometry
Grade 1 Unit 5: Identify, Compose, and Partition Shapes (~ 4 weeks)
Unit Overview: In this geometry unit students will identify, describe, construct, draw, compare, compose, and sort two-dimensional and three-dimensional
shapes. They will also learn about fractions in the context of partitioning two-dimensional shapes. As students work with comparing, sorting, composing and
decomposing shapes, they have an opportunity to attend to precision (MP 6) with the language they use to describe their explorations.
Guiding Question: What are the most precise words we can use to describe the objects around us?
The student will be able to: The teacher will use appropriate instructional strategies/approaches based on the needs of the student.
Component Cluster 1.G Reason with shapes and their attributes.
1.G.1 Distinguish between defining attributes (e.g.,
triangles are closed and three-sided) versus non-defining
attributes (e.g., color, orientation, overall size) ; build and
draw shapes to possess defining attributes.
First Grade students use their beginning knowledge of defining and non-defining attributes of shapes to identify,
name, build and draw shapes (including triangles, squares, rectangles, and trapezoids). They understand that
defining attributes are always-present features that classify a particular object (e.g., number of sides, angles, etc.).
They also understand that non-defining attributes are features that may be present, but do not identify what the
shape is called (e.g., color, size, orientation, etc.).
1.G.2 Compose two-dimensional shapes (rectangles,
squares, trapezoids, triangles, half-circles, and quarter-
circles) or three-dimensional shapes (cubes, right
rectangular prisms, right circular cones, and right circular
cylinders) to create a composite shape, and compose new
shapes from the composite shape.1
1 Students do not need to learn formal names such as
“right rectangular prism.”
As first graders create composite shapes, a figure made up of two or more geometric shapes, they begin to see how
shapes fit together to create different shapes. They also begin to notice shapes within an already existing shape.
They may use such tools as pattern blocks, tangrams, attribute blocks, straws, twist ties, or virtual shapes to
compose different shapes.
First graders learn to perceive a combination of shapes as a single new shape (e.g., recognizing that two isosceles
triangles can be combined to make a rhombus, and simultaneously seeing the rhombus and the two triangles).
Thus, they develop competencies that include:
Solving shape puzzles
Constructing designs with shapes
Creating and maintaining a shape as a unit
1.G.3 Partition circles and rectangles into two and four
equal shares, describe the shares using the words halves,
fourths, and quarters, and use the phrases half of, fourth
of, and quarter of. Describe the whole as two of, or four
of the shares. Understand for these examples that
decomposing into more equal shares creates smaller
shares.
First Graders begin to partition regions into equal shares using a context (e.g., cookies, pies, pizza). This is a
foundational building block of fractions, which will be extended in future grades. Through ample experiences with
multiple representations, students use the words, halves, fourths, and quarters, and the phrases half of, fourth of,
and quarter of to describe their thinking and solutions. Working with the “the whole”, students understand that “the
whole” is composed of two halves, or four fourths or four quarters.
Component Cluster 1.MD Represent and interpret data.
1.MD.4 Organize, represent, and interpret data with up to
three categories; ask and answer questions about the total
number of data points, how many in each category, and
how many more or less are in one category than in
another.
See Unit 3.

Mathematics
CC= Counting and Cardinality OA= Operations and Algebraic Thinking NBT= Numbers and Operations in Base Ten
MD= Measurement and Data G= Geometry
Grade 1 Unit 6: Addition/Subtraction of Numbers to 20 with Fluency, Story Problems, and Equations (~ 4 weeks)
Unit Overview: Students will work with strategies for addition and subtraction of numbers to 20 with a focus on solving story problems of all types.
In the process, they will learn how to write and solve equations that involve unknowns in all positions and to determine whether addition and
subtraction equations are true or false. A major emphasis is on solidifying the relationship between addition and subtraction in order to support a
strong understanding of subtraction through the lens of addition. Students will have the opportunity to look for and make use of structure (MP 7)
within our number system.
Guiding Question: How does addition help us to solve subtraction problems?
The student will be able to: The teacher will use appropriate instructional strategies/approaches based on the needs of the student.
Component Cluster 1.OA Represent and solve problems involving addition and subtraction.
*Focus on numbers within 20 for this unit.
1.OA.1-2 See Unit 1.
Component Cluster 1.OA Understand and apply properties of operations and the relationship between addition and subtraction.
1.OA.3-4 See Unit 1.
Component Cluster 1.OA Add and subtract within 20.
1.OA.6 Add and subtract within 20, demonstrating
fluency for addition and subtraction within 10. Use
strategies such as counting on; making ten (e.g., 8 + 6 = 8
+ 2 + 4 = 10 + 4 = 14); decomposing a number leading to
a ten (e.g., 13 – 4 = 13 – 3 – 1 = 10 – 1 = 9); using the
relationship between addition and subtraction (e.g.,
knowing that 8 + 4 = 12, one knows 12 – 8 = 4); and
creating equivalent but easier or known sums (e.g., adding
6 + 7 by creating the known equivalent 6 + 6 + 1 = 12 + 1
= 13).
In First Grade, students learn about and use various strategies to solve addition and subtraction problems. When
students repeatedly use strategies that make sense to them, they internalize facts and develop fluency for addition
and subtraction within 10. When students are able to demonstrate fluency within 10, they are accurate, efficient,
and flexible. First Graders then apply similar strategies for solving problems within 20, building the foundation for
fluency to 20 in Second Grade.
Component Cluster 1.OA Work with addition and subtraction equations.
1.OA.7 Understand the meaning of the equal sign, and
determine if equations involving addition and subtraction
are true or false. For example, which of the following
equations are true and which are false? 6 = 6, 7 = 8 – 1, 5
+ 2 = 2 + 5, 4 + 1 = 5 + 2.
In order to determine whether an equation is true or false, First Grade students must first understand the meaning of
the equal sign. This is developed as students in Kindergarten and First Grade solve numerous joining and
separating situations with mathematical tools, rather than symbols. Once the concepts of joining, separating, and
“the same amount/quantity as” are developed concretely, First Graders are ready to connect these experiences to
the corresponding symbols (+, -, =). Thus, students learn that the equal sign does not mean “the answer comes
next”, but that the symbol signifies an equivalent relationship that the left side ‘has the same value as’ the right side
of the equation.

Mathematics
CC= Counting and Cardinality OA= Operations and Algebraic Thinking NBT= Numbers and Operations in Base Ten
MD= Measurement and Data G= Geometry
When students understand that an equation needs to “balance”, with equal quantities on both sides of the equal
sign, they understand various representations of equations, such as:
an operation on the left side of the equal sign and the answer on the right side (5 + 8 = 13)
an operation on the right side of the equal sign and the answer on the left side (13 = 5 + 8)
numbers on both sides of the equal sign (6 = 6)
operations on both sides of the equal sign (5 + 2 = 4 + 3).
Once students understand the meaning of the equal sign, they are able to determine if an equation is true (9 = 9) or
false (9 = 8).
1.OA.8 Determine the unknown whole number in an
addition or subtraction equation relating three whole
numbers. For example, determine the unknown number
that makes the equation true in each of the equations 8 +
? = 11, 5 = _ – 3, 6 + 6 = _.
First Graders use their understanding of and strategies related to addition and subtraction as described in 1.OA.4
and 1.OA.6 to solve equations with an unknown. Rather than symbols, the unknown symbols are boxes or pictures.

Mathematics
CC= Counting and Cardinality OA= Operations and Algebraic Thinking NBT= Numbers and Operations in Base Ten
MD= Measurement and Data G= Geometry
Grade 1 Unit 7: Place Value, Comparison, Addition/Subtraction of Numbers to 100 (~ 4 weeks)
Unit Overview: The focus of unit 7 is place value. During this unit, students continue to develop deep understanding of numbers to 120 as they
estimate, count, compare, add, and subtract two-digit quantities using familiar models (sticks/bundles, number line, etc.). Students will have the
opportunity to look for and make use of structure (MP 7) as they apply their understanding of place value to help them develop strategies for addition
and subtraction with larger numbers.
Guiding Question: How are strategies for solving addition and subtraction problems with numbers to 20 similar to or different than solving problems
within 100?
The student will be able to: The teacher will use appropriate instructional strategies/approaches based on the needs of the student.
Component Cluster 1.NBT Extend the counting sequence.
1.NBT.1 Count to 120, starting at any number less than 120. In this range, read and write
numerals and represent a number of objects with a written numeral.
See Unit 3.
Component Cluster 1.NBT Understand place value.
1.NBT.2 Understand that the two digits of a two-digit number represent amounts of tens and
ones. Understand the following as special cases:
a. 10 can be thought of as a bundle of ten ones — called a
“ten.”
b. The numbers 10, 20, 30, 40, 50, 60, 70, 80, 90 refer to one, two, three, four, five, six,
seven, eight, or nine tens (and 0 ones).
See Unit 3.
1.NBT.3 Compare two two-digit numbers based on meanings of the tens and ones digits,
recording the results of comparisons with the symbols >, =, and <.
See Unit 3.
Component Cluster 1.NBT Use place value understanding and properties of operations to add and subtract.
1.NBT.4 Add within 100, including adding a two-digit number and a one-digit number, and
adding a two-digit number and a multiple of 10, using concrete models or drawings and
strategies based on place value, properties of operations, and/or the relationship between
addition and subtraction; relate the strategy to a written method and explain the reasoning
used. Understand that in adding two-digit numbers, one adds tens and tens, ones and ones;
and sometimes it is necessary to compose a ten.
See Unit 3.
1.NBT.5 Given a two-digit number, mentally find 10 more or 10 less than the number,
without having to count; explain the reasoning used.
See Unit 4.
1.NBT.6 Subtract multiples of 10 in the range 10-90 from multiples of 10 in the range 10-90
(positive or zero differences), using concrete models or drawings and strategies based on
place value, properties of operations, and/or the relationship between addition and
subtraction; relate the strategy to a written method and explain the reasoning used.
See Unit 4.

Mathematics
CC= Counting and Cardinality OA= Operations and Algebraic Thinking NBT= Numbers and Operations in Base Ten
MD= Measurement and Data G= Geometry
Grade 1 Unit 8: Culminating Unit: Challenge and Application (~4 weeks)
Unit Overview: The focus of unit 8 is to provide students with engaging opportunities to apply their learning from the year. They will have time to
deepen their understandings, correct misconceptions, solidify procedural strategies, and apply their skills in real-life contexts. During this unit,
students should make sense of problems and persevere in solving them (MP1) as they employ all of their math concepts and skills from the year in
meaningful contexts.
Guiding Question: How will you use the math you have learned in 1st grade to investigate and solve problems over the course of the summer?
CONTINUE WORK WITH ALL GRADE LEVEL STANDARDS.

Mathematics
OA= Operations and Algebraic Thinking NBT= Numbers and Operations in Base Ten MD= Measurement and Data G= Geometry
Grade 2
In Grade 2, instructional time should focus on four critical areas: (1) extending understanding of base-ten notation; (2) building fluency with addition
and subtraction; (3) using standard units of measure; and (4) describing and analyzing shapes.
(1) Students extend their understanding of the base-ten system. This includes ideas of counting in fives, tens, and multiples of hundreds, tens,
and ones, as well as number relationships involving these units, including comparing. Students understand multi-digit numbers (up to 1000)
written in base-ten notation, recognizing that the digits in each place represent amounts of thousands, hundreds, tens, or ones (e.g., 853 is 8
hundreds + 5 tens + 3 ones).
(2) Students use their understanding of addition to develop fluency with addition and subtraction within 100. They solve problems within
1000 by applying their understanding of models for addition and subtraction, and they develop, discuss, and use efficient, accurate, and
generalizable methods to compute sums and differences of whole numbers in base-ten notation, using their understanding of place value and
the properties of operations. They select and accurately apply methods that are appropriate for the context and the numbers involved to
mentally calculate sums and differences for numbers with only tens or only hundreds.
(3) Students recognize the need for standard units of measure (centimeter and inch) and they use rulers and other measurement tools with the
understanding that linear measure involves an iteration of units. They recognize that the smaller the unit, the more iterations they need to
cover a given length.
(4) Students describe and analyze shapes by examining their sides and angles. Students investigate, describe, and reason about decomposing
and combining shapes to make other shapes. Through building, drawing, and analyzing two- and three-dimensional shapes, students develop a
foundation for understanding area, volume, congruence, similarity, and symmetry in later grades.
Mathematical Practices
1. Make sense of problems and persevere in solving them.
2. Reason abstractly and quantitatively.
3. Construct viable arguments and critique the reasoning of others.
4. Model with mathematics.
5. Use appropriate tools strategically.
6. Attend to precision.
7. Look for and make use of structure.
8. Look for and express regularity in repeated reasoning.

Mathematics
OA= Operations and Algebraic Thinking NBT= Numbers and Operations in Base Ten MD= Measurement and Data G= Geometry
Grade 2: Suggested Distribution of Units in Instructional Days Time Approx. # of
weeks
Unit 1: Fluency with Sums and Differences to 20 12.5% ~ 4 weeks
Unit 2: Place Value, Addition and Subtraction with Measurement Concepts 12.5% ~ 4 weeks
Unit 3: Addition and Subtraction within 100 12.5% ~ 4 weeks
Unit 4: Measurement 12.5% ~ 4 weeks
Unit 5: Place Value to 1,000 12.5% ~ 4 weeks
Unit 6: Geometry- Reasoning about Arrays, Shapes, and Fractions of Shapes 12.5% ~ 4 weeks
Unit 7: Addition and Subtraction of Numbers to 1,000 with Problem-Solving and Measurement 12.5% ~ 4 weeks
Unit 8: Culminating Unit: Challenge and Application Using All Standards 12.5% ~ 4 weeks
Instructional
Focus of Unit:
Operations and
Algebraic Thinking Number Fractions
Measurement
and Data Geometry Application
Unit 1: Fluency with Sums and
Differences to 2012.5%
Unit 2: P.V., +/- with Measurement
Concepts12.5%
Unit 3: +/- within 100
12.5%
Unit 4: Measurement
12.5%Unit 5: Place Value
to 1,00013%
Unit 6: Geometry: Arrays, Shapes, and Fractions of Shapes
12.5%
Unit 7: +/- of Numbers to 1,000
with Problem-solving and
Measurement12.5%
Unit 8: Culminating Unit
12.5%
Instructional Time

Mathematics
OA= Operations and Algebraic Thinking NBT= Numbers and Operations in Base Ten MD= Measurement and Data G= Geometry
Grade 2 Unit 1: Fluency with Sums and Differences to 20 (~4 weeks)
Unit Overview: Students arrive in grade 2 having an extensive background working with numbers to 10. Unit 1 establishes a motivating, differentiated fluency
program in the first few weeks that will provide each student with enough practice to achieve mastery of the required fluencies (i.e., adding and subtracting within
20 and within 100) by the end of the year. Students learn to represent and solve problems using addition and subtraction: a practice that will also continue
throughout the year. Students look for and make use of structure (MP 7) as they develop strategies for fluency with sums and differences to 20.
Guiding Question: What are good strategies to use when adding and subtracting numbers within 20?
The student will be able to: The teacher will use appropriate instructional strategies/approaches based on the needs of the student.
Component Cluster 2.OA Represent and solve problems involving addition and subtraction.
2.OA.1 Use addition and subtraction within 100 to solve
one- and two-step word problems involving situations of
adding to, taking from, putting together, taking apart, and
comparing, with unknowns in all positions, e.g., by using
drawings and equations with a symbol for the unknown
number to represent the problem.1
1 See Glossary, Table 1.
Second Grade students extend their work with addition and subtraction word problems in two major ways. First,
they represent and solve word problems within 100, building upon their previous work to 20. In addition, they
represent and solve one and two-step word problems of all three types (Result Unknown, Change Unknown, Start
Unknown). Please see Table 1 at end of document for examples of all problem types. One-step word problems
use one operation. Two-step word problems use two operations which may include the same operation or opposite
operations.
Two-Step Problems: Because Second Graders are still developing proficiency with the most difficult subtypes
(shaded in white in Table 1 at end of the glossary): Add To/Start Unknown; Take From/Start Unknown;
Compare/Bigger Unknown; and Compare/Smaller Unknown, two-step problems do not involve these sub-types
(Common Core Standards Writing Team, May 2011). Furthermore, most two-step problems should focus on
single-digit addends since the primary focus of the standard is the problem-type.
As second grade students solve one- and two-step problems they use manipulatives such as snap cubes, place value
materials (groupable and pre-grouped), ten frames, etc.; create drawings of manipulatives to show their thinking; or
use number lines to solve and describe their strategies. They then relate their drawings and materials to equations.
By solving a variety of addition and subtraction word problems, second grade students determine the unknown in
all positions (Result unknown, Change unknown, and Start unknown). Rather than a letter (“n”), boxes or pictures
are used to represent the unknown number. See Glossary, Table 1 for examples (found at end of document).
Second Graders use a range of methods, often mastering more complex strategies such as making tens and doubles
and near doubles for problems involving addition and subtraction within 20. Moving beyond counting and
counting-on, second grade students apply their understanding of place value to solve problems.
Component Cluster 2.OA Add and subtract within 20.
*From this point forward, fluency practice with addition and subtraction to 20 is part of the students’ on-going experience.
2.OA.2 Fluently add and subtract within 20 using mental
strategies.2 By end of Grade 2, know from memory all
sums of two one-digit numbers.
2See standard 1.OA.6 for a list of mental strategies.
Building upon their work in First Grade, Second Graders use various addition and subtraction strategies in order to
fluently add and subtract within 20:

Mathematics
OA= Operations and Algebraic Thinking NBT= Numbers and Operations in Base Ten MD= Measurement and Data G= Geometry
1.OA.6 Mental Strategies
Counting on
Making ten (e.g., 8 + 6 = 8 + 2 + 4 = 10 + 4 = 14)
Decomposing a number leading to a ten (e.g., 13 – 4 = 13 – 3 – 1 = 10 – 1 = 9)
Using the relationship between addition and subtraction (e.g., knowing that 8 + 4 = 12, one knows
12 – 8 = 4)
Creating equivalent but easier or known sums (e.g., adding 6 + 7 by creating the known equivalent 6
+ 6 + 1 = 12, 12 + 1 = 13
Second Graders internalize facts and develop fluency by repeatedly using strategies that make sense to them. When
students are able to demonstrate fluency they are accurate, efficient, and flexible. Students must have efficient
strategies in order to know sums from memory.
Research indicates that teachers can best support students’ memory of the sums of two one-digit numbers through
varied experiences including making 10, breaking numbers apart, and working on mental strategies. These
strategies replace the use of repetitive timed tests in which students try to memorize operations as if there were not
any relationships among the various facts. When teachers teach facts for automaticity, rather than memorization,
they encourage students to think about the relationships among the facts. (Fosnot & Dolk, 2001)
Component Cluster 2.OA Work with equal groups of objects to gain foundations for multiplication.
2.OA.3 Determine whether a group of objects (up to 20)
has an odd or even number of members, e.g., by pairing
objects or counting them by 2s; write an equation to
express an even number as a sum of two equal addends.
Second graders apply their work with doubles to the concept of odd and even numbers. Students should have ample
experiences exploring the concept that if a number can be decomposed (broken apart) into two equal addends or
doubles addition facts (e.g., 10 = 5 +5), then that number (10 in this case) is an even number. Students should
explore this concept with concrete objects (e.g., counters, cubes, etc.) before moving towards pictorial
representations such as circles or arrays.
The focus of this standard is placed on the conceptual understanding of even and odd numbers. An even number is
an amount that can be made of two equal parts with no leftovers. An odd number is one that is not even or cannot
be made of two equal parts. The number endings of 0, 2, 4, 6, and 8 are only an interesting and useful pattern or
observation and should not be used as the definition of an even number. (Van de Walle & Lovin, 2006, p. 292)
Component Cluster 2.MD Represent and interpret data.
2.MD.10 Draw a picture graph and a bar graph (with
single-unit scale) to represent a data set with up to four
categories. Solve simple put-together, take-apart, and
compare problems3 using information presented in a bar
graph. 3See Glossary, Table 1.
In Second Grade, students pose a question, determine up to 4 categories of possible responses, collect data,
represent data on a picture graph or bar graph, and interpret the results. This is an extension from first grade when
students organized, represented, and interpreted data with up to three categories. They are able to use the graph
selected to note particular aspects of the data collected, including the total number of responses, which category had
the most/least responses, and interesting differences/similarities between the four categories. They then solve
simple one-step problems using the information from the graph.

Mathematics
OA= Operations and Algebraic Thinking NBT= Numbers and Operations in Base Ten MD= Measurement and Data G= Geometry
Grade 2 Unit 2: Place Value, Addition and Subtraction with Measurement Concepts (~4 weeks)
Unit Overview: In Unit 2, students learn to measure and estimate using non-standard units for length and solve measurement situations involving addition and
subtraction of length. A major objective is for students to explore base-ten concepts in the context of measurement. As they count, total, and compare
measurement units, they are supported in thinking about and applying base ten concepts. This unit provides the opportunity for modeling with mathematics (MP4)
as students seek to use numbers and measurement concepts to solve real-life problems.
Guiding Question: How do measurement tools help you to show your math thinking?
The student will be able to: The teacher will use appropriate instructional strategies/approaches based on the needs of the student.
Component Cluster 2.MD Measure and estimate lengths in standard units.
2.MD.4 Measure to determine how much longer one
object is than another, expressing the length difference in
terms of a standard length unit.
Second Grade students determine the difference in length between two objects by using the same tool and unit to
measure both objects. Students choose two objects to measure, identify an appropriate tool and unit, measure both
objects, and then determine the differences in lengths.
Component Cluster 2.MD Relate addition and subtraction to length.
2.MD.6 Represent whole numbers as lengths from 0 on a
number line diagram with equally spaced points
corresponding to the numbers 0, 1, 2, ..., and represent
whole-number sums and differences within 100 on a
number line diagram.
Building upon their experiences with open number lines, Second Grade students create number lines with evenly
spaced points corresponding to the numbers to solve addition and subtraction problems to 100. They recognize the
similarities between a number line and a ruler.
Component Cluster 2.NBT Understand place value.
2.NBT.1 Understand that the three digits of a three-digit
number represent amounts of hundreds, tens, and ones;
e.g., 706 equals 7 hundreds, 0 tens, and 6 ones.
Understand the following as special cases:
(See 2.NBT.1a & b)
Second Grade students extend their base-ten understanding to hundreds as they view 10 tens as a unit called a
“hundred”. They use manipulative materials and pictorial representations to help make a connection between the
written three-digit numbers and hundreds, tens, and ones.
As in First Grade, Second Graders’ understanding about hundreds also moves through several stages: Counting By
Ones; Counting by Groups & Singles; and Counting by Hundreds, Tens and Ones.
Counting By Ones: At first, even though Second Graders will have grouped objects into hundreds, tens and left-
overs, they rely on counting all of the individual cubes by ones to determine the final amount. It is seen as the only
way to determine how many.
Counting By Groups and Singles: While students are able to group objects into collections of hundreds, tens and
ones and now tell how many groups of hundreds, tens and left-overs there are, they still rely on counting by ones to
determine the final amount. They are unable to use the groups and left-overs to determine how many.
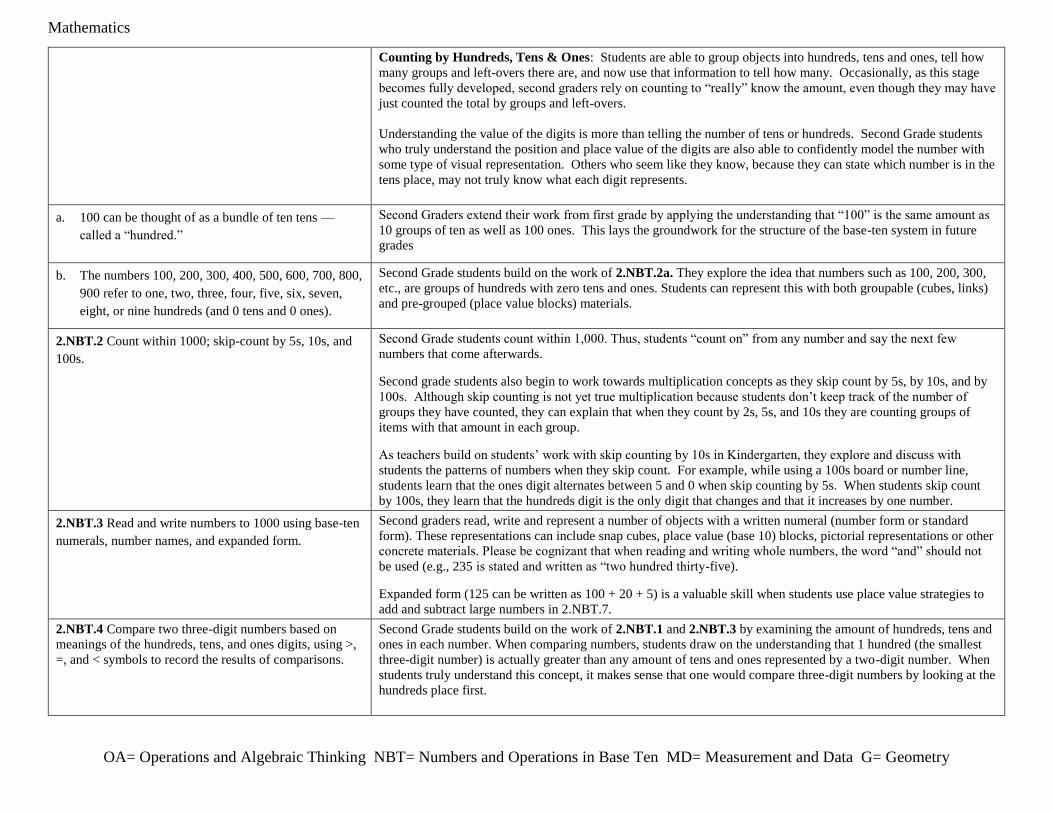
Mathematics
OA= Operations and Algebraic Thinking NBT= Numbers and Operations in Base Ten MD= Measurement and Data G= Geometry
Counting by Hundreds, Tens & Ones: Students are able to group objects into hundreds, tens and ones, tell how
many groups and left-overs there are, and now use that information to tell how many. Occasionally, as this stage
becomes fully developed, second graders rely on counting to “really” know the amount, even though they may have
just counted the total by groups and left-overs.
Understanding the value of the digits is more than telling the number of tens or hundreds. Second Grade students
who truly understand the position and place value of the digits are also able to confidently model the number with
some type of visual representation. Others who seem like they know, because they can state which number is in the
tens place, may not truly know what each digit represents.
a. 100 can be thought of as a bundle of ten tens —
called a “hundred.”
Second Graders extend their work from first grade by applying the understanding that “100” is the same amount as
10 groups of ten as well as 100 ones. This lays the groundwork for the structure of the base-ten system in future
grades
b. The numbers 100, 200, 300, 400, 500, 600, 700, 800,
900 refer to one, two, three, four, five, six, seven,
eight, or nine hundreds (and 0 tens and 0 ones).
Second Grade students build on the work of 2.NBT.2a. They explore the idea that numbers such as 100, 200, 300,
etc., are groups of hundreds with zero tens and ones. Students can represent this with both groupable (cubes, links)
and pre-grouped (place value blocks) materials.
2.NBT.2 Count within 1000; skip-count by 5s, 10s, and
100s.
Second Grade students count within 1,000. Thus, students “count on” from any number and say the next few
numbers that come afterwards.
Second grade students also begin to work towards multiplication concepts as they skip count by 5s, by 10s, and by
100s. Although skip counting is not yet true multiplication because students don’t keep track of the number of
groups they have counted, they can explain that when they count by 2s, 5s, and 10s they are counting groups of
items with that amount in each group. As teachers build on students’ work with skip counting by 10s in Kindergarten, they explore and discuss with
students the patterns of numbers when they skip count. For example, while using a 100s board or number line,
students learn that the ones digit alternates between 5 and 0 when skip counting by 5s. When students skip count
by 100s, they learn that the hundreds digit is the only digit that changes and that it increases by one number.
2.NBT.3 Read and write numbers to 1000 using base-ten
numerals, number names, and expanded form.
Second graders read, write and represent a number of objects with a written numeral (number form or standard
form). These representations can include snap cubes, place value (base 10) blocks, pictorial representations or other
concrete materials. Please be cognizant that when reading and writing whole numbers, the word “and” should not
be used (e.g., 235 is stated and written as “two hundred thirty-five).
Expanded form (125 can be written as 100 + 20 + 5) is a valuable skill when students use place value strategies to
add and subtract large numbers in 2.NBT.7.
2.NBT.4 Compare two three-digit numbers based on
meanings of the hundreds, tens, and ones digits, using >,
=, and < symbols to record the results of comparisons.
Second Grade students build on the work of 2.NBT.1 and 2.NBT.3 by examining the amount of hundreds, tens and
ones in each number. When comparing numbers, students draw on the understanding that 1 hundred (the smallest
three-digit number) is actually greater than any amount of tens and ones represented by a two-digit number. When
students truly understand this concept, it makes sense that one would compare three-digit numbers by looking at the
hundreds place first.

Mathematics
OA= Operations and Algebraic Thinking NBT= Numbers and Operations in Base Ten MD= Measurement and Data G= Geometry
Students should have ample experiences communicating their comparisons in words before using symbols.
Students were introduced to the symbols greater than (>), less than (<) and equal to (=) in First Grade and continue
to use them in Second Grade with numbers within 1,000.
While students may have the skills to order more than 2 numbers, this Standard focuses on comparing two numbers
and using reasoning about place value to support the use of the various symbols.
Component Cluster 2.NBT Use place value understanding and properties of operations to add and subtract.
2.NBT.5 Fluently add and subtract within 100 using
strategies based on place value, properties of operations,
and/or the relationship between addition and subtraction.
There are various strategies that Second Grade students understand and use when adding and subtracting within 100
(such as those listed in the standard). The standard algorithm of carrying or borrowing is neither an expectation nor
a focus in Second Grade. Students use multiple strategies for addition and subtraction in Grades K-3. By the end of
Third Grade students use a range of algorithms based on place value, properties of operations, and/or the
relationship between addition and subtraction to fluently add and subtract within 1000. Students are expected to
fluently add and subtract multi-digit whole numbers using the standard algorithm by the end of Grade 4.

Mathematics
OA= Operations and Algebraic Thinking NBT= Numbers and Operations in Base Ten MD= Measurement and Data G= Geometry
Grade 2 Unit 3: Addition and Subtraction within 100 (~4 weeks)
Unit Overview: All arithmetic algorithms are manipulations of place value units: ones, tens, hundreds, etc. In Unit 3 students extend their understanding of place
value first by using the number line and then moving to a more standard base-ten structure. Students should be given the opportunity to apply these concepts
using real-life data. As students solve challenging place value problems, they will have the opportunity to model with mathematics (MP 4) to show their thinking.
Guiding Question: How does place value relate to addition and subtraction strategies?
The student will be able to: The teacher will use appropriate instructional strategies/approaches based on the needs of the student.
Component Cluster 2.NBT Understand place value.
2.NBT.1 Understand that the three digits of a three-digit
number represent amounts of hundreds, tens, and ones;
e.g., 706 equals 7 hundreds, 0 tens, and 6 ones.
Understand the following as special cases:
(See 2.NBT.1a & b)
See Unit 2.
a. 100 can be thought of as a bundle of ten tens —
called a “hundred.”
b. The numbers 100, 200, 300, 400, 500, 600, 700, 800,
900 refer to one, two, three, four, five, six, seven,
eight, or nine hundreds (and 0 tens and 0 ones).
2.NBT.2 Count within 1000; skip-count by 5s, 10s, and
100s.
See Unit 2.
Component Cluster 2.NBT Use place value understanding and properties of operations to add and subtract.
2.NBT.5 Fluently add and subtract within 100 using
strategies based on place value, properties of operations,
and/or the relationship between addition and subtraction.
See Unit 2.
2.NBT.6 Add up to four two-digit numbers using
strategies based on place value and properties of
operations.
Second Grade students add a string of two-digit numbers (up to four numbers) by applying place value strategies
and properties of operations.
2.NBT.9 Explain why addition and subtraction strategies
work, using place value and the properties of operations.*
*Explanations may be supported by drawings or objects.
Second graders explain why addition or subtraction strategies work as they apply their knowledge of place value
and the properties of operations in their explanation. They may use drawings or objects to support their
explanation.
Once students have had an opportunity to solve a problem, the teacher provides time for students to discuss their
strategies and why they did or didn’t work.
Component Cluster 2.MD Relate addition and subtraction to length.

Mathematics
OA= Operations and Algebraic Thinking NBT= Numbers and Operations in Base Ten MD= Measurement and Data G= Geometry
2.MD.6 Represent whole numbers as lengths from 0 on a
number line diagram with equally spaced points
corresponding to the numbers 0, 1, 2, ..., and represent
whole-number sums and differences within 100 on a
number line diagram.
Building upon their experiences with open number lines, Second Grade students create number lines with evenly
spaced points corresponding to the numbers to solve addition and subtraction problems to 100. They recognize the
similarities between a number line and a ruler.
Component Cluster 2.MD Represent and interpret data.
2.MD.10 Draw a picture graph and a bar graph (with
single-unit scale) to represent a data set with up to four
categories. Solve simple put-together, take-apart, and
compare problems4 using information presented in a bar
graph. 4 See Glossary, Table 1.
See Unit 1.

Mathematics
OA= Operations and Algebraic Thinking NBT= Numbers and Operations in Base Ten MD= Measurement and Data G= Geometry
Grade 2 Unit 4: Length Measurement (~4 weeks)
Unit Overview: In Unit 2, students learn to measure and estimate using standard units for length and to solve measurement word problems involving addition and
subtraction of length. A major objective is for students to use measurement tools with the understanding that the smaller a unit, the more iterations are necessary to
cover a given length. Students will have the opportunity to use appropriate tools strategically (MP5) as they investigate how measurements change depending on
the unit.
Guiding Question: How does using a different unit change our measurement?
The student will be able to: The teacher will use appropriate instructional strategies/approaches based on the needs of the student.
Component Cluster 2.MD Measure and estimate lengths in standard units.
2.MD.1 Measure the length of an object by selecting and
using appropriate tools such as rulers, yardsticks,
meter sticks, and measuring tapes.
Second Graders build upon their non-standard measurement experiences in First Grade by measuring in standard
units for the first time. Using both customary (inches and feet) and metric (centimeters and meters) units,
Second Graders select an attribute to be measured (e.g., length of classroom), choose an appropriate unit
of measurement (e.g., yardstick), and determine the number of units (e.g., yards). As teachers provide rich
tasks that ask students to perform real measurements, these foundational understandings of measurement
are developed:
Understand that larger units (e.g., yard) can be subdivided into equivalent units (e.g., inches) (partition).
Understand that the same object or many objects of the same size such as paper clips can be repeatedly used
to determine the length of an object (iteration).
Understand the relationship between the size of a unit and the number of units needed (compensatory
principal). Thus, the smaller the unit, the more units it will take to measure the selected attribute.
By the end of Second Grade, students will have also learned specific measurements as it relates to feet, yards and
meters:
There are 12 inches in a foot.
There are 3 feet in a yard.
There are 100 centimeters in a meter.
2.MD.2 Measure the length of an object twice, using
length units of different lengths for the two
measurements; describe how the two
measurements relate to the size of the unit
chosen.
Second Grade students measure an object using two units of different lengths. This experience helps students
realize that the unit used is as important as the attribute being measured. This is a difficult concept for
young children and will require numerous experiences for students to predict, measure, and discuss
outcomes.
2.MD.3 Estimate lengths using units of inches, feet,
centimeters, and meters.
Second Grade students estimate the lengths of objects using inches, feet, centimeters, and meters prior to
measuring. Estimation helps the students focus on the attribute being measured and the measuring process.
As students estimate, the student has to consider the size of the unit- helping them to become more
familiar with the unit size. In addition, estimation also creates a problem to be solved rather than a task to
be completed. Once a student has made an estimate, the student then measures the object and reflects on
the accuracy of the estimate made and considers this information for the next measurement.

Mathematics
OA= Operations and Algebraic Thinking NBT= Numbers and Operations in Base Ten MD= Measurement and Data G= Geometry
2.MD.4 Measure to determine how much longer one
object is than another, expressing the length
difference in terms of a standard length unit.
Second Grade students determine the difference in length between two objects by using the same tool and unit to
measure both objects. Students choose two objects to measure, identify an appropriate tool and unit,
measure both objects, and then determine the differences in lengths.
Component Cluster 2.MD Relate addition and subtraction to length.
2.MD.5 Use addition and subtraction within 100 to solve
word problems involving lengths that are given in the
same units, e.g., by using drawings (such as drawings of
rulers) and equations with a symbol for the unknown
number to represent the problem.
Second Grade students apply the concept of length to solve addition and subtraction word problems with numbers
within 100. Students should use the same unit of measurement in these problems. Equations may vary depending
on students’ interpretation of the task.
2.MD.6 Represent whole numbers as lengths from 0 on a
number line diagram with equally spaced points
corresponding to the numbers 0, 1, 2, ..., and represent
whole-number sums and differences within 100 on a
number line diagram.
Building upon their experiences with open number lines, Second Grade students create number lines with evenly
spaced points corresponding to the numbers to solve addition and subtraction problems to 100. They recognize the
similarities between a number line and a ruler.

Mathematics
OA= Operations and Algebraic Thinking NBT= Numbers and Operations in Base Ten MD= Measurement and Data G= Geometry
Grade 2 Unit 5: Place Value to 1,000 (~4 weeks)
Unit Overview: In Unit 5, students continue to work with place value models (number line, skip-counting, sticks/bundles, and money) to deepen their
understanding of our base-ten system through 1,000. It also challenges them to practice adding and subtracting in multiples of 10 and 100 both on and off the
decade. Students will have many opportunities in this unit to reason abstractly and quantitatively (MP 2).
Guiding Question: How does grouping objects into sets of 10s or 100s help you to think about large numbers up to 1,000?
The student will be able to: The teacher will use appropriate instructional strategies/approaches based on the needs of the student.
Component Cluster 2.NBT Understand place value.
2.NBT.1 Understand that the three digits of a three-digit
number represent amounts of hundreds, tens, and ones;
e.g., 706 equals 7 hundreds, 0 tens, and 6 ones. Understand
the following as special cases:
(See 2.NBT.1a & b)
See Unit 2.
a. 100 can be thought of as a bundle of ten tens — called
a “hundred.”
See Unit 2.
b. The numbers 100, 200, 300, 400, 500, 600, 700, 800,
900 refer to one, two, three, four, five, six, seven,
eight, or nine hundreds (and 0 tens and 0 ones).
See Unit 2.
2.NBT.2 Count within 1000; skip-count by 5s, 10s, and
100s.
See Unit 2.
2.NBT.3 Read and write numbers to 1000 using base-ten
numerals, number names, and expanded form. See Unit 2.
2.NBT.4 Compare two three-digit numbers based on
meanings of the hundreds, tens, and ones digits, using >, =,
and < symbols to record the results of comparisons.
See Unit 2.
Component Cluster 2.NBT Use place value understanding and properties of operations to add and subtract.
2.NBT.5 Fluently add and subtract within 100 using
strategies based on place value, properties of operations,
and/or the relationship between addition and subtraction.
See Unit 2.
2.NBT.6 Add up to four two-digit numbers using
strategies based on place value and properties of
operations.
Second Grade students add a string of two-digit numbers (up to four numbers) by applying place value strategies and
properties of operations.
2.NBT.7 Add and subtract within 1000, using concrete
models or drawings and strategies based on place value,
Second graders extend the work from 2.NBT. to two 3-digit numbers. Students should have ample experiences using
concrete materials and pictorial representations to support their work.

Mathematics
OA= Operations and Algebraic Thinking NBT= Numbers and Operations in Base Ten MD= Measurement and Data G= Geometry
properties of operations, and/or the relationship between
addition and subtraction; relate the strategy to a written
method. Understand that in adding or subtracting three-
digit numbers, one adds or subtracts hundreds and
hundreds, tens and tens, ones and ones; and sometimes it is
necessary to compose or decompose tens or hundreds.
This standard also references composing and decomposing a ten. This work should include strategies such as making
a 10, making a 100, breaking apart a 10, or creating an easier problem. The standard algorithm of carrying or
borrowing is not an expectation in Second Grade. Students are not expected to add and subtract whole numbers
using a standard algorithm until the end of Fourth Grade.
2.NBT.8 Mentally add 10 or 100 to a given number 100–
900, and mentally subtract 10 or 100 from a given number
100–900.
Second Grade students mentally add or subtract either 10 or 100 to any number between 100 and 900. As teachers
provide ample experiences for students to work with pre-grouped objects and facilitate discussion, second graders
realize that when one adds or subtracts 10 or 100 that only the tens place or the digit in the hundreds place changes
by 1. As the teacher facilitates opportunities for patterns to emerge and be discussed, students notice the patterns and
connect the digit change with the amount changed.
Opportunities to solve problems in which students cross hundreds are also provided once students have become
comfortable adding and subtracting within the same hundred.
This standard focuses only on adding and subtracting 10 or 100. Multiples of 10 or multiples of 100 can be explored;
however, the focus of this standard is to ensure that students are proficient with adding and subtracting 10 and 100
mentally.
2.NBT.9 Explain why addition and subtraction strategies
work, using place value and the properties of operations.*
*Explanations may be supported by drawings or objects.
Second graders explain why addition or subtraction strategies work as they apply their knowledge of place value and
the properties of operations in their explanation. They may use drawings or objects to support their explanation.
Once students have had an opportunity to solve a problem, the teacher provides time for students to discuss their
strategies and why they did or didn’t work.
Component Cluster 2.MD Work with time and money.
2.MD.8 Solve word problems involving dollar bills,
quarters, dimes, nickels, and pennies, using $ and ¢
symbols appropriately.
Example: If you have 2 dimes and 3 pennies, how
many cents do you have?
In Second Grade, students solve word problems involving either dollars or cents. Since students have not
been introduced to decimals, problems focus on whole dollar amounts or cents.
This is the first time money is introduced formally as a standard. Therefore, students will need numerous
experiences with coin recognition and values of coins before using coins to solve problems. Once
students are solid with coin recognition and values, they can then begin using the values coins to count
sets of coins, compare two sets of coins, make and recognize equivalent collections of coins (same
amount but different arrangements), select coins for a given amount, and make change.
Solving problems with money can be a challenge for young children because it builds on prerequisite
number and place value skills and concepts. Many times money is introduced before students have the
necessary number sense to work with money successfully.
For these values to make sense, students must have an understanding of
5, 10, and 25. More than that, they need to be able to think of these
quantities without seeing countable objects… A child whose number
concepts remain tied to counts of objects [one object is one count] is not

Mathematics
OA= Operations and Algebraic Thinking NBT= Numbers and Operations in Base Ten MD= Measurement and Data G= Geometry
going to be able to understand the value of coins. Van de Walle &
Lovin, p. 150, 2006
Just as students learn that a number (38) can be represented different ways (3 tens and 8 ones; 2 tens and
18 ones) and still remain the same amount (38), students can apply this understanding to money. For
example, 25 cents can look like a quarter, two dimes and a nickel, and it can look like 25 pennies, and
still all remain 25 cents. This concept of equivalent worth takes time and requires numerous
opportunities to create different sets of coins, count sets of coins, and recognize the “purchase power” of
coins (a nickel can buy the same things a 5 pennies).
As teachers provide students with sufficient opportunities to explore coin values (25 cents) and actual
coins (2 dimes, 1 nickel), teachers will help guide students over time to learn how to mentally give each
coin in a set a value, place the random set of coins in order, and use mental math, adding on to find
differences, and skip counting to determine the final amount.

Mathematics
OA= Operations and Algebraic Thinking NBT= Numbers and Operations in Base Ten MD= Measurement and Data G= Geometry
Grade 2 Unit 6: Geometry- Reasoning about Arrays, Shapes, and Fractions of Shapes (~4 weeks)
Unit Overview: In Unit 6, shapes provide an introductory context for a number of important concepts learned in later grades. Through building, drawing, and
analyzing two- and three-dimensional shapes, students develop a foundation for understanding area, volume, congruence, similarity, and symmetry in later grades.
Students also explore area within arrays in order to build the foundation for multiplication and division. Finally, students investigate, describe, and reason about
the composition and decomposition of shapes to form other shapes leading to an understanding of fractions as equal parts. As students examine similarities
between shapes, they will need to look for and express regularity in repeated reasoning (MP 8).
Guiding Question: How does examining and describing the parts of an object help us to describe the whole?
The student will be able to: The teacher will use appropriate instructional strategies/approaches based on the needs of the student.
Component Cluster 2.G Reason with shapes and their attributes.
2.G.1 Recognize and draw shapes having specified
attributes, such as a given number of angles or a given
number of equal faces.* Identify triangles, quadrilaterals,
pentagons, hexagons, and cubes.
*Sizes are compared directly or visually, not compared by
measuring.
Second Grade students identify (recognize and name) shapes and draw shapes based on a given set of attributes.
These include triangles, quadrilaterals (squares, rectangles, and trapezoids), pentagons, hexagons and cubes.
2.G.2 Partition a rectangle into rows and columns of
same-size squares and count to find the total number of
them.
Second graders partition a rectangle into squares (or square-like regions) and then determine the total number of
squares. This work connects to the standard 2.OA.4 where students are arranging objects in an array of rows and
columns.
2.G.3 Partition circles and rectangles into two, three, or
four equal shares, describe the shares using the words
halves, thirds, half of, a third of, etc., and describe the
whole as two halves, three thirds, four fourths. Recognize
that equal shares of identical wholes need not have the
same shape.
Second Grade students partition circles and rectangles into 2, 3 or 4 equal shares (regions). Students should be
given ample experiences to explore this concept with paper strips and pictorial representations. Students should
also work with the vocabulary terms halves, thirds, half of, third of, and fourth (or quarter) of. While students are
working on this standard, teachers should help them to make the connection that a “whole” is composed of two
halves, three thirds, or four fourths.
This standard also addresses the idea that equal shares of identical wholes may not have the same shape.
It is important for students to understand that fractional parts may not be symmetrical. The only criteria for
equivalent fractions is that the area is equal.
Component Cluster 2.OA Work with equal groups of objects to gain foundations for multiplication.
2.OA.3 Determine whether a group of objects (up to 20)
has an odd or even number of members, e.g., by pairing
objects or counting them by 2s; write an equation to
express an even number as a sum of two equal addends.
Second graders apply their work with doubles to the concept of odd and even numbers. Students should have ample
experiences exploring the concept that if a number can be decomposed (broken apart) into two equal addends or
doubles addition facts (e.g., 10 = 5 +5), then that number (10 in this case) is an even number. Students should
explore this concept with concrete objects (e.g., counters, cubes, etc.) before moving towards pictorial
representations such as circles or arrays.
Mathematics
OA= Operations and Algebraic Thinking NBT= Numbers and Operations in Base Ten MD= Measurement and Data G= Geometry
The focus of this standard is placed on the conceptual understanding of even and odd numbers. An even number is
an amount that can be made of two equal parts with no leftovers. An odd number is one that is not even or cannot
be made of two equal parts. The number endings of 0, 2, 4, 6, and 8 are only an interesting and useful pattern or
observation and should not be used as the definition of an even number. (Van de Walle & Lovin, 2006, p. 292)
2.OA.4 Use addition to find the total number of objects
arranged in rectangular arrays with up to 5 rows and up to
5 columns; write an equation to express the total as a sum
of equal addends.
Second graders use rectangular arrays to work with repeated addition, a building block for multiplication in third
grade. A rectangular array is any arrangement of things in rows and columns, such as a rectangle of square tiles.
Students explore this concept with concrete objects (e.g., counters, bears, square tiles, etc.) as well as pictorial
representations on grid paper or other drawings. Due to the commutative property of multiplication, students can
add either the rows or the columns and still arrive at the same solution.

Mathematics
OA= Operations and Algebraic Thinking NBT= Numbers and Operations in Base Ten MD= Measurement and Data G= Geometry
Grade 2 Unit 7: Addition and Subtraction of Numbers to 1,000 with Problem-Solving and Measurement (~4 weeks)
Unit Overview: In Unit 7, students investigate the metric system making connections to our place value system. This work leads naturally back into a focus on
developing efficient strategies for addition and subtraction of numbers up to 1000. This work deepens their understanding of base-ten, place value, and properties
of operations. It also challenges them to apply their knowledge to one-step and two-step word problems. During this unit, students also continue to develop one of
the required fluencies of the grade: addition and subtraction within 100. Students will have many opportunities in this unit to make sense of problems and
persevere in solving them (MP 1).
Guiding Question: How does place value relate to addition and subtraction strategies?
The student will be able to: The teacher will use appropriate instructional strategies/approaches based on the needs of the student.
Component Cluster 2.OA Represent and solve problems involving addition and subtraction.*
*Story problems focus primarily on the positions of result and change unknown.
2.OA.1 Use addition and subtraction within 100 to solve
one- and two-step word problems involving situations of
adding to, taking from, putting together, taking apart, and
comparing, with unknowns in all positions, e.g., by using
drawings and equations with a symbol for the unknown
number to represent the problem.1
1 See Glossary, Table 1.
See Unit 1.
Component Cluster 2.NBT Use place value understanding and properties of operations to add and subtract.
2.NBT.7 Add and subtract within 1000, using concrete
models or drawings and strategies based on place value,
properties of operations, and/or the relationship between
addition and subtraction; relate the strategy to a written
method. Understand that in adding or subtracting three-
digit numbers, one adds or subtracts hundreds and
hundreds, tens and tens, ones and ones; and sometimes it
is necessary to compose or decompose tens or hundreds.
See Unit 5.
2.NBT.9 Explain why addition and subtraction strategies
work, using place value and the properties of operations.*
*Explanations may be supported by drawings or objects.
See Unit 5.
The student will be able to: The teacher will use appropriate instructional strategies/approaches based on the needs of the student.
Component Cluster 2.MD Measure and estimate lengths in standard units.*
*Focus on metric units.
2.MD.1 Measure the length of an object by selecting and
using appropriate tools such as rulers, yardsticks, meter
sticks, and measuring tapes.
Second Graders build upon their non-standard measurement experiences in First Grade by measuring in standard
units for the first time. Using both customary (inches and feet) and metric (centimeters and meters) units, Second
Graders select an attribute to be measured (e.g., length of classroom), choose an appropriate unit of measurement

Mathematics
OA= Operations and Algebraic Thinking NBT= Numbers and Operations in Base Ten MD= Measurement and Data G= Geometry
(e.g., yardstick), and determine the number of units (e.g., yards). As teachers provide rich tasks that ask students to
perform real measurements, these foundational understandings of measurement are developed:
Understand that larger units (e.g., yard) can be subdivided into equivalent units (e.g., inches) (partition).
Understand that the same object or many objects of the same size such as paper clips can be repeatedly used
to determine the length of an object (iteration).
Understand the relationship between the size of a unit and the number of units needed (compensatory
principal). Thus, the smaller the unit, the more units it will take to measure the selected attribute.
By the end of Second Grade, students will have also learned specific measurements as it relates to feet, yards and
meters:
There are 12 inches in a foot.
There are 3 feet in a yard.
There are 100 centimeters in a meter.
2.MD.2 Measure the length of an object twice, using
length units of different lengths for the two
measurements; describe how the two measurements relate
to the size of the unit chosen.
Second Grade students measure an object using two units of different lengths. This experience helps students
realize that the unit used is as important as the attribute being measured. This is a difficult concept for young
children and will require numerous experiences for students to predict, measure, and discuss outcomes.
2.MD.3 Estimate lengths using units of inches, feet,
centimeters, and meters.
Second Grade students estimate the lengths of objects using inches, feet, centimeters, and meters prior to
measuring. Estimation helps the students focus on the attribute being measured and the measuring process. As
students estimate, the student has to consider the size of the unit- helping them to become more familiar with the
unit size. In addition, estimation also creates a problem to be solved rather than a task to be completed. Once a
student has made an estimate, the student then measures the object and reflects on the accuracy of the estimate
made and considers this information for the next measurement.
2.MD.4 Measure to determine how much longer one
object is than another, expressing the length difference in
terms of a standard length unit.
Second Grade students determine the difference in length between two objects by using the same tool and unit to
measure both objects. Students choose two objects to measure, identify an appropriate tool and unit, measure both
objects, and then determine the differences in lengths.
Component Cluster 2.MD Relate addition and subtraction to length.
2.MD.5 Use addition and subtraction within 100 to solve
word problems involving lengths that are given in the
same units, e.g., by using drawings (such as drawings of
rulers) and equations with a symbol for the unknown
number to represent the problem.
See Unit 4.
2.MD.6 Represent whole numbers as lengths from 0 on a
number line diagram with equally spaced points
corresponding to the numbers 0, 1, 2, ..., and represent
whole-number sums and differences within 100 on a
number line diagram.
See Unit 4.

Mathematics
OA= Operations and Algebraic Thinking NBT= Numbers and Operations in Base Ten MD= Measurement and Data G= Geometry
Component Cluster 2.MD Work with time and money.
2.MD.8 Solve word problems involving dollar bills,
quarters, dimes, nickels, and pennies, using $ and ¢
symbols appropriately.
Example: If you have 2 dimes and 3 pennies, how
many cents do you have?
See Unit 5.

Mathematics
OA= Operations and Algebraic Thinking NBT= Numbers and Operations in Base Ten MD= Measurement and Data G= Geometry
Grade 2 Unit 8: Culminating Unit: Challenge and Application (~4 weeks)
Unit Overview: The focus of unit 8 is to provide students with engaging opportunities to apply their learning from the year. They will have time to
deepen their understandings, correct misconceptions, solidify procedural strategies, and apply their skills in real-life contexts. During this unit,
students should make sense of problems and persevere in solving them (MP1) as they employ all of their math concepts and skills from the year in
meaningful contexts.
Guiding Question: How will you use the math you have learned in 2nd grade to investigate and solve problems over the course of the summer?

Mathematics
OA = Operations and Algebraic Thinking NBT= Numbers and Operations in Base Ten NF= Numbers and Operations – Fractions
MD= Measurement and Data G= Geometry
Grade 3 In Grade 3, instructional time should focus on four critical areas: (1) developing understanding of multiplication and division and strategies for
multiplication and division within 100; (2) developing understanding of fractions, especially unit fractions (fractions with numerator 1); (3)
developing understanding of the structure of rectangular arrays and of area; and (4) describing and analyzing two-dimensional shapes.
(1) Students develop an understanding of the meanings of multiplication and division of whole numbers through activities and problems involving equal-
sized groups, arrays, and area models; multiplication is finding an unknown product, and division is finding an unknown factor in these situations. For
equal-sized group situations, division can require finding the unknown number of groups or the unknown group size. Students use properties of operations
to calculate products of whole numbers, using increasingly sophisticated strategies based on these properties to solve multiplication and division problems
involving single-digit factors. By comparing a variety of solution strategies, students learn the relationship between multiplication and division.
(2) Students develop an understanding of fractions, beginning with unit fractions. Students view fractions in general as being built out of unit fractions, and
they use fractions along with visual fraction models to represent parts of a whole. Students understand that the size of a fractional part is relative to the size
of the whole. For example, 1/2 of the paint in a small bucket could be less paint than 1/3 of the paint in a larger bucket, but 1/3 of a ribbon is longer than
1/5 of the same ribbon because when the ribbon is divided into 3 equal parts, the parts are longer than when the ribbon is divided into 5 equal parts.
Students are able to use fractions to represent numbers equal to, less than, and greater than one. They solve problems that involve comparing fractions by
using visual fraction models and strategies based on noticing equal numerators or denominators.
(3) Students recognize area as an attribute of two-dimensional regions. They measure the area of a shape by finding the total number of same size units of
area required to cover the shape without gaps or overlaps, a square with sides of unit length being the standard unit for measuring area. Students
understand that rectangular arrays can be decomposed into identical rows or into identical columns. By decomposing rectangles into rectangular arrays of
squares, students connect area to multiplication, and justify using multiplication to determine the area of a rectangle.
(4) Students describe, analyze, and compare properties of two-dimensional shapes. They compare and classify shapes by their sides and angles, and
connect these with definitions of shapes. Students also relate their fraction work to geometry by expressing the area of part of a shape as a unit fraction of
the whole.
Mathematical Practices (MP)
1. Make sense of problems and persevere in solving them.
2. Reason abstractly and quantitatively.
3. Construct viable arguments and critique the reasoning of others.
4. Model with mathematics.
5. Use appropriate tools strategically.
6. Attend to precision.
7. Look for and make use of structure.
8. Look for and express regularity in repeated reasoning.

Mathematics
OA = Operations and Algebraic Thinking NBT= Numbers and Operations in Base Ten NF= Numbers and Operations – Fractions
MD= Measurement and Data G= Geometry
Grade 3: Suggested Distribution of Units in Instructional Days Time Approx.
# of weeks
Unit 1: Addition and Subtraction Strategies and Problem Solving 12.5% ~ 4 weeks
Unit 2: Introduction to Multiplication 12.5% ~ 4 weeks
Unit 3: Problem-solving with Multi-digit Addition and Subtraction 12.5% ~ 4 weeks
Unit 4: Measurement and Fractions 12.5% ~ 4 weeks
Unit 5: Multiplication and Division with Contexts 12.5% ~ 4 weeks
Unit 6: Measuring and Classifying Shapes 12.5% ~ 4 weeks
Unit 7: Extending Multiplication and Fractions 12.5% ~ 4 weeks
Unit 8: Culminating Unit: Challenge and Application 12.5% ~ 4 weeks
Instructional
Focus of Unit:
Operations and
Algebraic Thinking Number Fractions
Measurement
and Data Geometry Application
Unit 1: +/-Strategies and
Problem Solving 12.5%
Unit 2: Intro to Multiplication
12.5%
Unit 3: Problem-solving with
Multi-digit +/ -12.5%
Unit 4: Measurement and Fractions
12.5%
Unit 5: Multiplication
and division with Contexts
Unit 6: Measuring and
Classifying Shapes12.5%
Unit 7: Extending Multiplication and Fractions
12.5%
Unit 8: Culminating Unit
12.5%
Instructional Time

Mathematics
OA = Operations and Algebraic Thinking NBT= Numbers and Operations in Base Ten NF= Numbers and Operations – Fractions
MD= Measurement and Data G= Geometry
Grade 3 Unit 1: Addition and Subtraction Strategies and Problem-Solving (~4 weeks)
Unit Overview: The goal of this unit is to ensure that all third graders have a solid foundation in number relationships, the operations, useful math models, and
strategies for solving story problems. While laying this groundwork, students are simultaneously preparing for more complex work later in the year including
algebraic thinking as well as the formal addition and subtraction algorithms. Students should be encouraged to pay attention to what it means to make sense of
problems and persevere in solving them as a third grade student (MP 1).
Guiding Question: How can you prove if your answer is reasonable?
The student will be able to: The teacher will use appropriate instructional strategies/approaches based on the needs of the student.
Component Cluster 3.NBT Use place value understanding and properties of operations to perform multi-digit arithmetic.*
*Focus on two-digit numbers for this unit.
3.NBT.2 Fluently add and subtract within 1000 using
strategies and algorithms based on place value, properties
of operations, and/or the relationship between addition
and subtraction.
1 A range of algorithms may be used.
This standard refers to fluently, which means accuracy, efficiency (using a reasonable amount of steps and time),
and flexibility (using strategies such as the distributive property). The word algorithm refers to a procedure or a
series of steps. There are other algorithms other than the standard algorithm. Third grade students should have
experiences beyond the standard algorithm.
Problems should include both vertical and horizontal forms, including opportunities for students to apply the
commutative and associative properties. Students explain their thinking and show their work by using strategies
and algorithms, and verify that their answer is reasonable.
Computation algorithm. A set of predefined steps applicable to a class of problems that gives the correct result in
every case when the steps are carried out correctly.
Computation strategy. Purposeful manipulations that may be chosen for specific problems, may not have a fixed
order, and may be aimed at converting one problem into another.
(Progressions for the CCSSM; Number and Operation in Base Ten, CCSS Writing Team, April 2011, page 2)
Component Cluster 3.OA Solve problems involving the four operations, and identify and explain patterns in arithmetic. *Focus on addition and subtraction for this unit.
3.OA.8 Solve two-step word problems using the four
operations. Represent these problems using equations
with a letter standing for the unknown quantity. Assess
the reasonableness of answers using mental computation
and estimation strategies including rounding.*
*This standard is limited to problems posed with whole
numbers and having whole-number answers; students
should know how to perform operations in the
conventional order when there are no parentheses to
specify a particular order.
Students in third grade begin the step to formal algebraic language by using a letter for the unknown quantity in
expressions or equations for one and two-step problems. But the symbols of arithmetic, x or . or * for multiplication
and ÷ or / for division, continue to be used in Grades 3, 4, and 5.

Mathematics
OA = Operations and Algebraic Thinking NBT= Numbers and Operations in Base Ten NF= Numbers and Operations – Fractions
MD= Measurement and Data G= Geometry
3.OA.9 Identify arithmetic patterns (including patterns in
the addition table or multiplication table), and explain
them using properties of operations.
For example, observe that 4 times a number is always
even, and explain why 4 times a number can be
decomposed into two equal addends.
This standard calls for students to examine arithmetic patterns involving both addition and multiplication.
Arithmetic patterns are patterns that change by the same rate, such as adding the same number. For example, the
series 2, 4, 6, 8, 10 is an arithmetic pattern that increases by 2 between each term.
This standards also mentions identifying patterns related to the properties of operations.
Examples:
Even numbers are always divisible by 2. Even numbers can always be decomposed into 2 equal addends
(14 = 7 + 7).
Multiples of even numbers (2, 4, 6, and 8) are always even numbers.
On a multiplication chart, the products in each row and column increase by the same amount (skip counting).
On an addition chart, the sums in each row and column increase by the same amount.
Students need ample opportunities to observe and identify important numerical patterns related to operations. They
should build on their previous experiences with properties related to addition and subtraction. Students investigate
addition and multiplication tables in search of patterns and explain why these patterns make sense mathematically.
Example:
Any sum of two even numbers is even.
Any sum of two odd numbers is even.
Any sum of an even number and an odd number is odd.
The multiples of 4, 6, 8, and 10 are all even because they can all be decomposed into two equal groups.
The doubles (2 addends the same) in an addition table fall on a diagonal while the doubles (multiples of 2) in a
multiplication table fall on horizontal and vertical lines.
The multiples of any number fall on a horizontal and a vertical line due to the commutative property.
All the multiples of 5 end in a 0 or 5 while all the multiples of 10 end with 0. Every other multiple of 5 is a
multiple of 10.
Students also investigate a hundreds chart in search of addition and subtraction patterns. They record and organize
all the different possible sums of a number and explain why the pattern makes sense.

Mathematics
OA = Operations and Algebraic Thinking NBT= Numbers and Operations in Base Ten NF= Numbers and Operations – Fractions
MD= Measurement and Data G= Geometry
Grade 3 Unit 2: Introduction to Multiplication (~4 weeks)
Unit Overview: This unit builds upon the foundation of multiplicative thinking with units started in grade 2. Students concentrate on the meaning of multiplication
through immersion in a wide variety of multiplicative contexts (including scaled graphs) that support their understanding of all meanings of multiplication and
encourage the use of multiple models including equal groups, arrays, number lines, and ratio tables. Students should be supported in tracking strategies related to
properties and particular sets of factors. Students should look for and express regularity in repeated reasoning (MP 8) as they notice patterns in multiplication.
Guiding Question: What are the different ways that you can you show multiplication?
The student will be able to: The teacher will use appropriate instructional strategies/approaches based on the needs of the student.
Component Cluster 3.OA Represent and solve problems involving multiplication and division.
*Focus on multiplication only in this unit.
3.OA.1 Interpret products of whole numbers, e.g.,
interpret 5 × 7 as the total number of objects in 5 groups
of 7 objects each.
For example, describe a context in which a total number
of objects can be expressed as 5 × 7.
This standard interprets products of whole numbers. Students recognize multiplication as a means to determine the
total number of objects when there are a specific number of groups with the same number of objects in each group or
of an equal amount of objects were added or collected numerous times.. Multiplication requires students to think in
terms of groups of things rather than individual things. Students learn that the multiplication symbol ‘x’ means
“groups of” and problems such as 5 x 7 refer to 5 groups of 7.
3.OA.3 Use multiplication and division within 100 to
solve word problems in situations involving equal
groups, arrays, and measurement quantities, e.g., by
using drawings and equations with a symbol for the
unknown number to represent the problem.*
*See Table 2 at the end of this document.
This standard references various problem solving context and strategies that students are expected to use while
solving word problems involving multiplication & division. Students should use a variety of representations for
creating and solving one-step word problems, such as: If you divide 4 packs of 9 brownies among 6 people, how
many cookies does each person receive? (4 x 9 = 36, 36 ÷ 6 = 6).
Glossary page 89, Table 2 (table also included at the end of this document for your convenience) gives examples of a
variety of problem solving contexts, in which students need to find the product, the group size, or the number of
groups. Students should be given ample experiences to explore all of the different problem structures.
Examples of multiplication:
There are 24 desks in the classroom. If the teacher puts 6 desks in each row, how many rows are there?
This task can be solved by drawing an array by putting 6 desks in each row. This is an array model
This task can also be solved by drawing pictures of equal groups.
4 groups of 6 equals 24 objects

Mathematics
OA = Operations and Algebraic Thinking NBT= Numbers and Operations in Base Ten NF= Numbers and Operations – Fractions
MD= Measurement and Data G= Geometry
A student can also reason through the problem mentally or verbally, “I know 6 and 6 are 12. 12 and 12 are 24.
Therefore, there are 4 groups of 6 giving a total of 24 desks in the classroom.”
A number line could also be used to show equal jumps.
Students in third grade should use a variety of pictures, such as stars, boxes, flowers to represent unknown numbers
(variables). Letters are also introduced to represent unknowns in third grade.
Examples of Division:
There are some students at recess. The teacher divides the class into 4 lines with 6 students in each line. Write a
division equation for this story and determine how many students are in the class ( ÷ 4 = 6. There are 24 students
in the class).
Determining the number of objects in each share (partition model of division, where the size of the groups is
unknown):
Example:
The bag has 92 hair clips, and Laura and her three friends want to share them equally. How many hair clips will each
person receive?
Determining the number of shares (measurement division, where the number of groups is unknown)
Example:
Max the monkey loves bananas. Molly, his trainer, has 24 bananas. If she gives Max 4 bananas each day, how many
days will the bananas last?

Mathematics
OA = Operations and Algebraic Thinking NBT= Numbers and Operations in Base Ten NF= Numbers and Operations – Fractions
MD= Measurement and Data G= Geometry
Starting Day 1 Day 2 Day 3 Day 4 Day 5 Day 6
24 24 – 4 = 20 20 – 4 = 16 16 – 4 = 12 12 – 4 = 8 8 – 4 = 4 4 – 4 = 0
Solution: The bananas will last for 6 days.
3.OA.4 Determine the unknown whole number in a
multiplication or division equation relating three whole
numbers. For example, determine the unknown number
that makes the equation true in each of the equations 8
× ? = 48, 5 = _ ÷ 3, 6 × 6 = ?
This standard refers to Table 2 (table included at the end of this document for your convenience) and equations for
the different types of multiplication and division problem structures. The easiest problem structure includes
Unknown Product (3 x 5 = ? or 15 ÷ 3 = 5). The more difficult problem structures include Group Size Unknown (3 x
? = 15 or 15 ÷ 3 = 5) or Number of Groups Unknown (? x 5 = 15, 15 ÷ 5 = 3). The focus of 3.OA.4 extend beyond
the traditional notion of fact families, by having students explore the inverse relationship of multiplication and
division.
Students extend work from earlier grades with their understanding of the meaning of the equal sign as “the same
amount as” to interpret an equation with an unknown.
Component Cluster 3.OA Understand properties of multiplication and the relationship between multiplication and division.
*Focus on multiplication only in this unit.
3.OA.5 Apply properties of operations as strategies to
multiply and divide.2 Examples: If 6 × 4 = 24 is known,
then 4 × 6 = 24 is also known. (Commutative property
of multiplication.) 3 × 5 × 2 can be found by 3 × 5 = 15,
then 15 × 2 = 30, or by 5 × 2 = 10, then 3 × 10 = 30.
(Associative property of multiplication.) Knowing that 8
× 5 = 40 and 8 × 2 = 16, one can find 8 × 7 as 8 × (5 +
2) = (8 × 5) + (8 × 2) = 40 + 16 = 56. (Distributive
property.)
2 Students need not use formal terms for these
properties.
This standard references properties (rules about how numbers work) of multiplication. This extends past previous
expectations, in which students were asked to identify properties. While students DO NOT need to not use the formal
terms of these properties, student must understand that properties are rules about how numbers work, and they need
to be flexibly and fluently applying each of them in various situations. Students represent expressions using various
objects, pictures, words and symbols in order to develop their understanding of properties. They multiply by 1 and 0
and divide by 1. They change the order of numbers to determine that the order of numbers does not make a
difference in multiplication (but does make a difference in division). Given three factors, they investigate changing
the order of how they multiply the numbers to determine that changing the order does not change the product. They
also decompose numbers to build fluency with multiplication.
Component Cluster 3.OA Multiply and divide within 100.
*Focus on multiplication only in this unit.
3.OA.7 Fluently multiply and divide within 100, using
strategies such as the relationship between
multiplication and division (e.g., knowing that 8 × 5 =
40, one knows 40 ÷ 5 = 8) or properties of operations.
By the end of Grade 3, know from memory all products
of two one-digit numbers.
This standard uses the word fluently, which means accuracy, efficiency (using a reasonable amount of steps and
time), and flexibility (using strategies such as the distributive property). “Know from memory” should not focus only
on timed tests and repetitive practice, but ample experiences working with manipulatives, pictures, arrays, word
problems, and numbers to internalize the basic facts (up to 9 x 9 by the end of unit 3, but with a focus on 2, 3, 4, 5,
and 10 only for this unit).
By studying patterns and relationships in multiplication facts and relating multiplication and division, students build
a foundation for fluency with multiplication and division facts. Students demonstrate fluency with multiplication
facts through 10 and the related division facts. Multiplying and dividing fluently refers to knowledge of procedures,
knowledge of when and how to use them appropriately, and skill in performing them flexibly, accurately, and
efficiently.

Mathematics
OA = Operations and Algebraic Thinking NBT= Numbers and Operations in Base Ten NF= Numbers and Operations – Fractions
MD= Measurement and Data G= Geometry
Strategies students may use to attain fluency include:
Multiplication by zeros and ones
Doubles (2s facts), Doubling twice (4s), Doubling three times (8s)
Tens facts (relating to place value, 5 x 10 is 5 tens or 50)
Five facts (half of tens)
Skip counting (counting groups of __ and knowing how many groups have been counted)
Square numbers (ex: 3 x 3)
Nines (10 groups less one group, e.g., 9 x 3 is 10 groups of 3 minus one group of 3)
Decomposing into known facts (6 x 7 is 6 x 6 plus one more group of 6)
Turn-around facts (Commutative Property)
Fact families (Ex: 6 x 4 = 24; 24 ÷ 6 = 4; 24 ÷ 4 = 6; 4 x 6 = 24)
Missing factors
Students should have exposure to multiplication and division problems presented in both vertical and horizontal
forms.
Note that mastering this material, and reaching fluency in single-digit multiplications and related divisions with
understanding, may be quite time consuming because there are no general strategies for multiplying or dividing all
single-digit numbers as there are for addition and subtraction. Instead, there are many patterns and strategies
dependent upon specific numbers. So it is imperative that extra time and support be provided if needed.
(Progressions for the CCSSM; Operations and Algebraic Thinking, CCSS Writing Team, May 2011, page 22)
All of the understandings of multiplication and division situations (See Glossary, Table 2. (page 89 in CCSS)
Table included at the end of this document for your convenience), of the levels of representation and solving, and of
patterns need to culminate by the end of Grade 3 in fluent multiplying and dividing of all single-digit numbers and
10. Such fluency may be reached by becoming fluent for each number (e.g., the 2s, the 5s, etc.) and then extending
the fluency to several, then all numbers mixed together. Organizing practice so that it focuses most heavily on
understood but not yet fluent products and unknown factors can speed learning. To achieve this by the end of Grade
3, students must begin working toward fluency for the easy numbers as early as possible. Because an unknown factor
(a division) can be found from the related multiplication, the emphasis at the end of the year is on knowing from
memory all products of two one-digit numbers. As should be clear from the foregoing, this isn’t a matter of instilling
facts divorced from their meanings, but rather the outcome of a carefully designed learning process that heavily
involves the interplay of practice and reasoning. All of the work on how different numbers fit with the base-ten
numbers culminates in these “just know” products and is necessary for learning products. Fluent dividing for all
single-digit numbers, which will combine just knows, knowing from a multiplication, patterns, and best strategy, is
also part of this vital standard. (Progressions for the CCSSM; Operations and Algebraic Thinking, CCSS Writing
Team, May 2011, page 27)
Component Cluster 3.OA Solve problems involving the four operations, and identify and explain patterns in arithmetic.
3.OA.8 Solve two-step word problems using the four
operations. Represent these problems using equations
with a letter standing for the unknown quantity. Assess
Students in third grade begin the step to formal algebraic language by using a letter for the unknown quantity in
expressions or equations for one and two-step problems. But the symbols of arithmetic, x or . or * for multiplication
and ÷ or / for division, continue to be used in Grades 3, 4, and 5. (Progressions for the CCSSM; Operations and
Algebraic Thinking, CCSS Writing Team, May 2011, page 27)

Mathematics
OA = Operations and Algebraic Thinking NBT= Numbers and Operations in Base Ten NF= Numbers and Operations – Fractions
MD= Measurement and Data G= Geometry
the reasonableness of answers using mental computation
and estimation strategies including rounding.*
*This standard is limited to problems posed with whole
numbers and having whole-number answers; students
should know how to perform operations in the
conventional order when there are no parentheses to
specify a particular order.
This standard refers to two-step word problems using the four operations. The size of the numbers should be limited
to related 3rd grade standards (e.g., 3.OA.7 and 3.NBT.2). Adding and subtracting numbers should include numbers
within 1,000, and multiplying and dividing numbers should include single-digit factors and products less than 100.
This standard calls for students to represent problems using equations with a letter to represent unknown quantities.
Example:
Mike runs 2 miles a day. His goal is to run 25 miles. After 5 days, how many miles does Mike have left to run in
order to meet his goal? Write an equation and find the solution (2 x 5 + m = 25).
This standard refers to estimation strategies, including using compatible numbers (numbers that sum to 10, 50, or
100) or rounding. The focus in this standard is to have students use and discuss various strategies. Students should
estimate during problem solving, and then revisit their estimate to check for reasonableness.
Example:
Here are some typical estimation strategies for the problem:
On a vacation, your family travels 267 miles on the first day, 194 miles on the second day and 34 miles on the third
day. How many total miles did they travel?
Student 1
I first thought about 267
and 34. I noticed that
their sum is about 300.
Then I knew that 194 is
close to 200. When I put
300 and 200 together, I
get 500.
Student 2
I first thought about 194. It is really
close to 200. I also have 2 hundreds
in 267. That gives me a total of 4
hundreds. Then I have 67 in 267
and the 34. When I put 67 and 34
together that is really close to 100.
When I add that hundred to the 4
hundreds that I already had, I end
up with 500.
Student 3
I rounded 267 to 300. I
rounded 194 to 200. I
rounded 34 to 30. When
I added 300, 200 and 30,
I know my answer will
be about 530.
The assessment of estimation strategies should only have one reasonable answer (500 or 530), or a range (between
500 and 550). Problems should be structured so that all acceptable estimation strategies will arrive at a reasonable
answer.

Mathematics
OA = Operations and Algebraic Thinking NBT= Numbers and Operations in Base Ten NF= Numbers and Operations – Fractions
MD= Measurement and Data G= Geometry
(Progressions for the CCSSM; Operations and Algebraic Thinking, CCSS Writing Team, May 2011, page 28)
In the diagram above, Carla’s bands are shown using 4 equal-sized bars that represent 4x8 or 32 bands. Agustin’s
bands are directly below showing that the number that August in has plus 15 = 32. The diagram can also be drawn
like this:
8
8
8
8
15
?
3.OA.9 Identify arithmetic patterns (including patterns
in the addition table or multiplication table), and explain
them using properties of operations.
For example, observe that 4 times a number is always
even, and explain why 4 times a number can be
decomposed into two equal addends.
This standard calls for students to examine arithmetic patterns involving both addition and multiplication. Arithmetic
patterns are patterns that change by the same rate, such as adding the same number. For example, the series 2, 4, 6, 8,
10 is an arithmetic pattern that increases by 2 between each term.
This standards also mentions identifying patterns related to the properties of operations.
Examples:
Even numbers are always divisible by 2. Even numbers can always be decomposed into 2 equal addends
(14 = 7 + 7).

Mathematics
OA = Operations and Algebraic Thinking NBT= Numbers and Operations in Base Ten NF= Numbers and Operations – Fractions
MD= Measurement and Data G= Geometry
Multiples of even numbers (2, 4, 6, and 8) are always even numbers.
On a multiplication chart, the products in each row and column increase by the same amount (skip counting).
On an addition chart, the sums in each row and column increase by the same amount.
Students need ample opportunities to observe and identify important numerical patterns related to operations. They
should build on their previous experiences with properties related to addition and subtraction. Students investigate
addition and multiplication tables in search of patterns and explain why these patterns make sense mathematically.
Example:
Any sum of two even numbers is even.
Any sum of two odd numbers is even.
Any sum of an even number and an odd number is odd.
The multiples of 4, 6, 8, and 10 are all even because they can all be decomposed into two equal groups.
The doubles (2 addends the same) in an addition table fall on a diagonal while the doubles (multiples of 2) in a
multiplication table fall on horizontal and vertical lines.
The multiples of any number fall on a horizontal and a vertical line due to the commutative property.
All the multiples of 5 end in a 0 or 5 while all the multiples of 10 end with 0. Every other multiple of 5 is a
multiple of 10.
Students also investigate a hundreds chart in search of addition and subtraction patterns. They record and organize all
the different possible sums of a number and explain why the pattern makes sense.
Component Cluster 3.MD Represent and interpret data.
3.MD.3 Draw a scaled picture graph and a scaled bar
graph to represent a data set with several categories.
Solve one- and two-step “how many more” and “how
many less” problems using information presented in
scaled bar graphs.
For example, draw a bar graph in which each square in
the bar graph might represent 5 pets.
Students should have opportunities reading and solving problems using scaled graphs before being asked to draw
one. Work with scaled graphs builds on students’ understanding of multiplication and division.
The following graphs provided below all use five as the scale interval, but students should experience different
intervals to further develop their understanding of scale graphs and number facts.
While exploring data concepts, students should Pose a question, Collect data, Analyze data, and Interpret data
(PCAI). Students should be graphing data that is relevant to their lives
Example:
Pose a question: Student should come up with a question. What is the typical genre read in our class?
Collect and organize data: student survey
Pictographs: Scaled pictographs include symbols that represent multiple units. Below is an example of a pictograph
with symbols that represent multiple units. Graphs should include a title, categories, category label, key, and data.
How many more books did Juan read than Nancy?

Mathematics
OA = Operations and Algebraic Thinking NBT= Numbers and Operations in Base Ten NF= Numbers and Operations – Fractions
MD= Measurement and Data G= Geometry
Single Bar Graphs: Students use both horizontal and vertical bar graphs. Bar graphs include a title, scale, scale label,
categories, category label, and data.
Analyze and Interpret data.

Mathematics
OA = Operations and Algebraic Thinking NBT= Numbers and Operations in Base Ten NF= Numbers and Operations – Fractions
MD= Measurement and Data G= Geometry
Grade 3 Unit 3: Problem-solving with Multi-digit Addition and Subtraction (~4 weeks)
Unit Overview: This unit has students work with place value, rounding, and multi-digit addition and subtraction as they work toward the 3rd grade fluency goal of
addition and subtraction within 1000. Rounding is introduced as a strategy for estimating and checking computation results. Students must attend to precision
(MP 6) as they explore use of the standard addition and subtraction algorithms.
Guiding Question: How can you tell if your answer is reasonable after you add or subtract?
The student will be able to: The teacher will use appropriate instructional strategies/approaches based on the needs of the student.
Component Cluster 3.NBT Use place value understanding and properties of operations to perform multi-digit arithmetic.*
*A range of algorithms may be used.
3.NBT.1 Use place value understanding to round whole
numbers to the nearest 10 or 100.
This standard refers to place value understanding, which extends beyond an algorithm or memorized procedure for
rounding. The expectation is that students have a deep understanding of place value and number sense and can
explain and reason about the answers they get when they round. Students should have numerous experiences using
a number line and a hundreds chart as tools to support their work with rounding.
3.NBT.2 Fluently add and subtract within 1000 using
strategies and algorithms based on place value, properties
of operations, and/or the relationship between addition
and subtraction.
1 A range of algorithms may be used.
This standard refers to fluently, which means accuracy, efficiency (using a reasonable amount of steps and time),
and flexibility (using strategies such as the distributive property). The word algorithm refers to a procedure or a
series of steps. There are other algorithms other than the standard algorithm. Third grade students should have
experiences beyond the standard algorithm.
Problems should include both vertical and horizontal forms, including opportunities for students to apply the
commutative and associative properties. Students explain their thinking and show their work by using strategies
and algorithms, and verify that their answer is reasonable.
Computation algorithm. A set of predefined steps applicable to a class of problems that gives the correct result in
every case when the steps are carried out correctly.
Computation strategy. Purposeful manipulations that may be chosen for specific problems, may not have a fixed
order, and may be aimed at converting one problem into another.
(Progressions for the CCSSM; Number and Operation in Base Ten, CCSS Writing Team, April 2011, page 2)
Component Cluster 3.OA Solve problems involving the four operations, and identify and explain patterns in arithmetic.
3.OA.8 Solve two-step word problems using the four
operations. Represent these problems using equations
with a letter standing for the unknown quantity. Assess
the reasonableness of answers using mental computation
and estimation strategies including rounding.*
See Unit 2.

Mathematics
OA = Operations and Algebraic Thinking NBT= Numbers and Operations in Base Ten NF= Numbers and Operations – Fractions
MD= Measurement and Data G= Geometry
Grade 3 Unit 4: Measurement and Fractions (~4 weeks)
Unit Overview: This unit introduces new measurement and fraction concepts and skills. Students should be introduced to telling time to the minute; elapsed time;
and estimating, measuring, and comparing masses and liquid volumes. Students should also have the opportunity to explore fractions through the work of
building, comparing, and investigating the relationships among unit fractions and common fractions. Measurement and fractions can be tied together in a real life
application through the collection and analysis of measurement data with fractions. Students must attend to precision (MP 6) in their measurement solutions.
Guiding Question: Why is it important to include units when you measure?
The student will be able to: The teacher will use appropriate instructional strategies/approaches based on the needs of the student.
Component Cluster 3.MD Solve problems involving measurement and estimation of intervals of time, liquid volumes, and masses of objects.
3.MD.1 Tell and write time to the nearest minute and
measure time intervals in minutes. Solve word problems
involving addition and subtraction of time intervals in
minutes, e.g., by representing the problem on a number
line diagram.
This standard calls for students to solve elapsed time, including word problems. Students could use cck models or
number lines to solve. On the number line, students should be given the opportunities to determine the intervals and
size of jumps on their number line. Students could use pre-determined number lines (intervals every 5 or 15
minutes) or open number lines (intervals determined by students).
3.MD.2 Measure and estimate liquid volumes and
masses of objects using standard units of grams (g),
kilograms (kg), and liters (l).1 Add, subtract, multiply, or
divide to solve one-step word problems involving masses
or volumes that are given in the same units, e.g., by using
drawings (such as a beaker with a measurement scale) to
represent the problem.2
1 Excludes compound units such as 𝑐𝑚3 and finding the
geometric volume of a container. 2 Excludes multiplicative comparison problems
(problems involving notions of “times as much”; see
Glossary, Table 2 at end of document).
This standard asks for students to reason about the units of mass and volume using units g, kg, and L. Students need
multiple opportunities weighing classroom objects and filling containers to help them develop a basic understanding
of the size and weight of a liter, a gram, and a kilogram. Milliliters may also be used to show amounts that are less
than a liter emphasizing the relationship between smaller units to larger units in the same system. Word problems
should only be one-step and include the same units.
Students are not expected to do conversions between units, but reason as they estimate, using benchmarks to
measure weight and capacity.
Foundational understandings to help with measure concepts:
- Understand that larger units can be subdivided into equivalent units (partition).
- Understand that the same unit can be repeated to determine the measure (iteration).
- Understand the relationship between the size of a unit and the number of units needed (compensatory
principal).
Before learning to measure attributes, children need to recognize them, distinguishing them from other attributes.
That is, the attribute to be measured has to “stand out” for the student and be discriminated from the undifferentiated
sense of amount that young children often have, labeling greater lengths, areas, volumes, and so forth, as “big” or
“bigger.”
These standards do not differentiate between weight and mass. Technically, mass is the amount of matter in an
object. Weight is the force exerted on the body by gravity. On the earth’s surface, the distinction is not important (on
the moon, an object would have the same mass, would weigh less due to the lower gravity).
(Progressions for the CCSSM, Geometric Measurement, CCSS Writing Team, June 2012, page 2)
Component Cluster 3.MD Represent and interpret data.

Mathematics
OA = Operations and Algebraic Thinking NBT= Numbers and Operations in Base Ten NF= Numbers and Operations – Fractions
MD= Measurement and Data G= Geometry
3.MD.4 Generate measurement data by measuring
lengths using rulers marked with halves and fourths of an
inch. Show the data by making a line plot, where the
horizontal scale is marked off in appropriate units—
whole numbers, halves, or quarters.
Students in second grade measured length in whole units using both metric and U.S. customary systems. It’s
important to review with students how to read and use a standard ruler including details about halves and quarter
marks on the ruler. Students should connect their understanding of fractions to measuring to one-half and one-
quarter inch. Third graders need many opportunities measuring the length of various objects in their environment.
This standard provides a context for students to work with fractions by measuring objects to a quarter of an inch.
Example:
Measure objects in your desk to the nearest ½ or ¼ of an inch, display data collected on a line plot. How many
objects measured ¼? ½? etc…
In Grade 3, students are beginning to learn fraction concepts (3.NF). They understand fraction equivalence in simple
cases, and they use visual fraction models to represent and order fractions. Grade 3 students also measure lengths
using rulers marked with halves and fourths of an inch. They use their developing knowledge of fractions and
number lines to extend their work from the previous grade by working with measurement data involving fractional
measurement values.
For example, every student in the class might measure the height of a bamboo shoot growing in the classroom,
leading to a data set shown in a table.
To make a line plot from the data in a table, the student can determine the greatest and least values in the data, say:
13 ½ inches and 14 ¾ inches. The student can draw a segment of a number line diagram that includes these
extremes, with tick marks indicating specific values on the measurement scale. This is just like part of the scale on a
ruler. Having drawn the number line diagram, the student can proceed through the data set recording each
observation by drawing a symbol, such as a dot, above the proper tick mark. As with Grade 2 line plots, if a
particular data value appears many times in the data set, dots will “pile up” above that value. There is no need to sort
the observations, or to do any counting of them, before producing the line plot. Students can pose questions about
data presented in line plots, such as how many students obtained measurements larger than 14 ¼ inches.
The student will be able to: The teacher will use appropriate instructional strategies/approaches based on the needs of the student.
Component Cluster 3.NF Develop understanding of fractions as numbers.
3.NF.1 Understand a fraction 1/b as the quantity formed
by 1 part when a whole is partitioned into b equal parts;
This standard refers to the sharing of a whole being partitioned. Fraction models in third grade include only area
(parts of a whole) models (circles, rectangles, squares) and number lines. Set models (parts of a group) are not
addressed in Third Grade.

Mathematics
OA = Operations and Algebraic Thinking NBT= Numbers and Operations in Base Ten NF= Numbers and Operations – Fractions
MD= Measurement and Data G= Geometry
understand a fraction a/b as the quantity formed by a
parts of size 1/b.
In 3.NF.1 students start with unit fractions (fractions with numerator 1), which are formed by partitioning a whole
into equal parts and reasoning about one part of the whole, e.g., if a whole is partitioned into 4 equal parts then each
part is ¼ of the whole, and 4 copies of that part make the whole. Next, students build fractions from unit fractions,
seeing the numerator 3 of ¾ as saying that ¾ is the quantity you get by putting 3 of the ¼’s together. There is no
need to introduce “improper fractions" initially.
(Progressions for the CCSSM; Number and Operation – Fractions, CCSS Writing Team, August 2011, page 2)
Some important concepts related to developing understanding of fractions include:
Understand fractional parts must be equal-sized.
Example Non-example
These are thirds These are NOT thirds
The number of equal parts tells how many make a whole.
As the number of equal pieces in the whole increases, the size of the fractional pieces decreases.
The size of the fractional part is relative to the whole.
o One-half of a small pizza is relatively smaller than one-half of a large pizza.
When a whole is cut into equal parts, the denominator represents the number of equal parts.
The numerator of a fraction is the count of the number of equal parts.
o ¾ means that there are 3 one-fourths.
o Students can count one fourth, two fourths, three fourths.
Students express fractions as fair sharing or, parts of a whole. They use various contexts (candy bars, fruit, and
cakes) and a variety of models (circles, squares, rectangles, fraction bars, and number lines) to develop
understanding of fractions and represent fractions. Students need many opportunities to solve word problems that
require them to create and reason about fair share.

Mathematics
OA = Operations and Algebraic Thinking NBT= Numbers and Operations in Base Ten NF= Numbers and Operations – Fractions
MD= Measurement and Data G= Geometry
Initially, students can use an intuitive notion of “same size and same shape” (congruence) to explain why the parts
are equal, e.g., when they divide a square into four equal squares or four equal rectangles.
Students come to understand a more precise meaning for “equal parts” as “parts with equal measurements.” For
example, when a ruler is partitioned into halves or quarters of an inch, they see that each subdivision has the same
length. In area models they reason about the area of a shaded region to decide what fraction of the whole it
represents.
(Progressions for the CCSSM, Number and Operation – Fractions, CCSS Writing Team, August 2011, page 3)
3.NF.2 Understand a fraction as a number on the number
line; represent fractions on a number line diagram.
a. Represent a fraction 1/b on a number line diagram
by defining the interval from 0 to 1 as the whole and
partitioning it into b equal parts. Recognize that each
part has size 1/b and that the endpoint of the part
based at 0 locates the number 1/b on the number
line.
b. Represent a fraction a/b on a number line diagram
by marking off a lengths 1/b from 0. Recognize that
the resulting interval has size a/b and that its
endpoint locates the number a/b on the number line.
The number line diagram is the first time students work with a number line for numbers that are between whole
numbers (e.g., that ½ is between 0 and 1). Students need ample experiences folding linear models (e.g., string,
sentence strips) to help them reason about and justify the location of fractions, such that ½ lies exactly halfway
between 0 and 1.
In the number line diagram below, the space between 0 and 1 is divided (partitioned) into 4 equal regions. The
distance from 0 to the first segment is 1 of the 4 segments from 0 to 1 or ¼ (3.NF.2a). Similarly, the distance from 0
to the third segment is 3 segments that are each one-fourth long. Therefore, the distance of 3 segments from 0 is the
fraction ¾ (3.NF.2b).

Mathematics
OA = Operations and Algebraic Thinking NBT= Numbers and Operations in Base Ten NF= Numbers and Operations – Fractions
MD= Measurement and Data G= Geometry
(Progressions for the CCSSM, Number and Operation – Fractions, CCSS Writing Team, August 2011, page 3)
3.NF.3 Explain equivalence of fractions in special cases,
and compare fractions by reasoning about their size.
a. Understand two fractions as equivalent (equal) if
they are the same size, or the same point on a
number line.
b. Recognize and generate simple equivalent fractions,
e.g., 1/2 = 2/4, 4/6 = 2/3). Explain why the fractions
are equivalent, e.g., by using a visual fraction model.
An important concept when comparing fractions is to look at the size of the parts and the number of the parts. For
example, is smaller than because when 1 whole is cut into 8 pieces, the pieces are much smaller than when 1
whole is cut into 2 pieces.
3.NF.3a and 3.NF.3b These standards call for students to use visual fraction models (area models) and number lines
to explore the idea of equivalent fractions. Students should only explore equivalent fractions using models, rather
than using algorithms or procedures.
c. Express whole numbers as fractions, and recognize
fractions that are equivalent to whole numbers.
Examples: Express 3 in the form 3 = 3/1; recognize
that 6/1 = 6; locate 4/4 and 1 at the same point of a
number line diagram.
This standard includes writing whole numbers as fractions. The concept relates to fractions as division problems,
where the fraction 3/1 is 3 wholes divided into one group. This standard is the building block for later work where
students divide a set of objects into a specific number of groups. Students must understand the meaning of a/1.
d. Compare two fractions with the same numerator or
the same denominator by reasoning about their size.
Recognize that comparisons are valid only when the
two fractions refer to the same whole. Record the
results of comparisons with the symbols >, =, or <,
and justify the conclusions, e.g., by using a visual
fraction model.
This standard involves comparing fractions with or without visual fraction models including number lines.
Experiences should encourage students to reason about the size of pieces, the fact that 1/3 of a cake is larger than ¼
of the same cake. Since the same cake (the whole) is split into equal pieces, thirds are larger than fourths.
In this standard, students should also reason that comparisons are only valid if the wholes are identical. For example,
½ of a large pizza is a different amount than ½ of a small pizza. Students should be given opportunities to discuss
and reason about which ½ is larger.
Previously, in second grade, students compared lengths using a standard measurement unit. In third grade they build
on this idea to compare fractions with the same denominator. They see that for fractions that have the same
denominator, the underlying unit fractions are the same size, so the fraction with the greater numerator is greater
because it is made of more unit fractions. For example, segment from 0 to ¾ is shorter than the segment from 0 to
5/4 because it measures 3 units of ¼ as opposed to 5 units of ¼, therefore ¾ < 5/4.
Students also see that for unit fractions, the one with the larger denominator is smaller, by reasoning, for example,
that in order for more (identical) pieces to make the same whole, the pieces must be smaller. From this they reason
1
8
1
2

Mathematics
OA = Operations and Algebraic Thinking NBT= Numbers and Operations in Base Ten NF= Numbers and Operations – Fractions
MD= Measurement and Data G= Geometry
that for fractions that have the same numerator, the fraction with the smaller denominator is greater. For example,
2/5 > 2/7, because 1/7 < 1/5, so 2 lengths of 1/7 is less than 2 lengths of 1/5.
As with equivalence of fractions, it is important in comparing fractions to make sure that each fraction refers to the
same whole.
(Progressions for the CCSSM, Number and Operation – Fractions, CCSS Writing Team, August 2011, page 4)
(Progressions for the CCSSM, Number and Operation – Fractions, CCSS Writing Team, August 2011, page 4)
Component Cluster 3.G Reason with shapes and their attributes.
3.G.2 Partition shapes into parts with equal areas.
Express the area of each part as a unit fraction of the
whole.
For example, partition a shape into 4 parts with equal
area, and describe the area of each part as 1/4 of the
area of the shape.
In third grade students start to develop the idea of a fraction more formally, building on the idea of partitioning a
whole into equal parts. The whole can be a shape such as a circle or rectangle. In Grade 4, this is extended to
include wholes that are collections of objects.
This standard also builds on students’ work with fractions and area. Students are responsible for partitioning shapes
into halves, thirds, fourths, sixths and eighths.
Given a shape, students partition it into equal parts, recognizing that these parts all have the same area. They
identify the fractional name of each part and are able to partition a shape into parts with equal areas in several
different ways.

Mathematics
OA = Operations and Algebraic Thinking NBT= Numbers and Operations in Base Ten NF= Numbers and Operations – Fractions
MD= Measurement and Data G= Geometry

Mathematics
OA = Operations and Algebraic Thinking NBT= Numbers and Operations in Base Ten NF= Numbers and Operations – Fractions
MD= Measurement and Data G= Geometry
Grade 3 Unit 5: Multiplication and Division with Contexts (~4 weeks)
Unit Overview: In Unit 5, students develop an understanding of the relationship between multiplication and division. This concept can be supported through the
use of arrays, real life contexts, and fact families. Both interpretations of division—sharing and grouping—should be investigated. As students increase their
familiarity with the array as a means for representing multiplicative relationships, the meaningful real life context of finding area can be explored and developed.
Students have the opportunity to look for and express regularity in repeated reasoning (MP8) as they make connections between multiplication, addition, division,
and area concepts. Guiding Question: How are addition and multiplication related to finding the area of a shape?
The student will be able to: The teacher will use appropriate instructional strategies/approaches based on the needs of the student.
Component Cluster 3.OA Represent and solve problems involving multiplication and division.
3.OA.1 Interpret products of whole numbers, e.g.,
interpret 5 × 7 as the total number of objects in 5 groups
of 7 objects each.
For example, describe a context in which a total number
of objects can be expressed as 5 × 7.
See Unit 2.
3.OA.2 Interpret whole-number quotients of whole
numbers, e.g., interpret 56 ÷ 8 as the number of objects in
each share when 56 objects are partitioned equally into 8
shares, or as a number of shares when 56 objects are
partitioned into equal shares of 8 objects each.
For example, describe a context in which a number
of shares or a number of groups can be expressed as 56 ÷
8.
See Unit 2.
3.OA.3 Use multiplication and division within 100 to
solve word problems in situations involving equal groups,
arrays, and measurement quantities, e.g., by using
drawings and equations with a symbol for the unknown
number to represent the problem.*
*See Table at the end of this document.
See Unit 2.
3.OA.4 Determine the unknown whole number in a
multiplication or division equation relating three whole
numbers. For example, determine the unknown number
that makes the equation true in each of the equations 8 ×
? = 48, 5 = _ ÷ 3, 6 × 6 = ?
See Unit 2.

Mathematics
OA = Operations and Algebraic Thinking NBT= Numbers and Operations in Base Ten NF= Numbers and Operations – Fractions
MD= Measurement and Data G= Geometry
Component Cluster 3.OA Understand properties of multiplication and the relationship between multiplication and division.
3.OA.5 Apply properties of operations as strategies to
multiply and divide.2 Examples: If 6 × 4 = 24 is known,
then 4 × 6 = 24 is also known. (Commutative property of
multiplication.) 3 × 5 × 2 can be found by 3 × 5 = 15,
then 15 × 2 = 30, or by 5 × 2 = 10, then 3 × 10 = 30.
(Associative property of multiplication.) Knowing that 8
× 5 = 40 and 8 × 2 = 16, one can find 8 × 7 as 8 × (5 +
2) = (8 × 5) + (8 × 2) = 40 + 16 = 56. (Distributive
property.)
2 Students need not use formal terms for these properties.
See Unit 2.
3.OA.6 Understand division as an unknown-factor
problem.
For example, find 32 ÷ 8 by finding the number that
makes 32 when multiplied by 8.
This standard refers the table at the end of the document and the various problem structures. Since multiplication
and division are inverse operations, students are expected to solve problems and explain their processes of solving
division problems that can also be represented as unknown factor multiplication problems.
Component Cluster 3.OA Multiply and divide within 100.* * From this point forward, fluency practice with multiplication and division facts is part of the students’ on-going experience.
3.OA.7 Fluently multiply and divide within 100, using
strategies such as the relationship between multiplication
and division (e.g., knowing that 8 × 5 = 40, one knows 40
÷ 5 = 8) or properties of operations. By the end of Grade
3, know from memory all products of two one-digit
numbers.
See Unit 2.
Component Cluster 3.OA Solve problems involving the four operations, and identify and explain patterns in arithmetic.* * This standard (as well as OA.3) continues being practiced throughout the remainder of the school year.
3.OA.8 Solve two-step word problems using the four
operations. Represent these problems using equations
with a letter standing for the unknown quantity. Assess
the reasonableness of answers using mental computation
and estimation strategies including rounding.*
*This standard is limited to problems posed with whole
numbers and having whole-number answers; students
should know how to perform operations in the
See Unit 2.

Mathematics
OA = Operations and Algebraic Thinking NBT= Numbers and Operations in Base Ten NF= Numbers and Operations – Fractions
MD= Measurement and Data G= Geometry
conventional order when there are no parentheses to
specify a particular order.
Component Cluster 3.MD Geometric measurement: understand concepts of area and relate area to multiplication and to addition.
3.MD.5 Recognize area as an attribute of plane figures
and understand concepts of area measurement.
a. A square with side length 1 unit, called “a unit
square,” is said to have “one square unit” of area, and
can be used to measure area.
A plane figure which can be covered without gaps or
overlaps by n unit squares is said to have an area of n
square units.
These standards call for students to explore the concept of covering a region with “unit squares,” which could
include square tiles or shading on grid or graph paper. Based on students’ development, they should have ample
experiences filling a region with square tiles before transitioning to pictorial representations on graph paper.
5 one unit
3.MD.6 Measure areas by counting unit squares (square
cm, square m, square in, square ft, and improvised units).
Students should be counting the square units to find the area could be done in metric, customary, or non-standard
square units. Using different sized graph paper, students can explore the areas measured in square centimeters and
square inches.
3.MD.7 Relate area to the operations of multiplication
and addition.
a. Find the area of a rectangle with whole-number side
lengths by tiling it, and show that the area is the same as
would be found by multiplying the side lengths.
Students can learn how to multiply length measurements to find the area of a rectangular region. But, in order that
they make sense of these quantities, they must first learn to interpret measurement of rectangular regions as a
multiplicative relationship of the number of square units in a row and the number of rows. This relies on the
development of spatial structuring. To build from spatial structuring to understanding the number of area-units as
the product of number of units in a row and number of rows, students might draw rectangular arrays of squares and
learn to determine the number of squares in each row with increasingly sophisticated strategies, such as skip-
counting the number in each row and eventually multiplying the number in each row by the number of rows. They
learn to partition a rectangle into identical squares by anticipating the final structure and forming the array by
drawing line segments to form rows and columns. They use skip counting and multiplication to determine the
number of squares in the array.
Many activities that involve seeing and making arrays of squares to form a rectangle might be needed to build
robust conceptions of a rectangular area structured into squares.
4
5 one square unit 5 one square unit 5 one square unit 5 one square unit

Mathematics
OA = Operations and Algebraic Thinking NBT= Numbers and Operations in Base Ten NF= Numbers and Operations – Fractions
MD= Measurement and Data G= Geometry
Students should understand and explain why multiplying the side lengths of a rectangle yields the same
measurement of area as counting the number of tiles (with the same unit length) that fill the rectangle’s interior For
example, students might explain that one length tells how many unit squares in a row and the other length tells how
many rows there are.
(Progressions for the CCSSM, Geometric Measurement, CCSS Writing Team, June 2012, page 17)
b. Multiply side lengths to find areas of rectangles with
whole-number side lengths in the context of solving real
world and mathematical problems, and represent whole-
number products as rectangular areas in mathematical
reasoning.
Students should solve real world and mathematical problems.
Students might solve problems such as finding all the rectangular regions with whole-number side lengths that have
an area of 12 area-units, doing this for larger rectangles (e.g., enclosing 24, 48, 72 area-units), making sketches
rather than drawing each square. Students learn to justify their belief they have found all possible solutions.
(Progressions for the CCSSM, Geometric Measurement, CCSS Writing Team, June 2012, page 18)

Mathematics
OA = Operations and Algebraic Thinking NBT= Numbers and Operations in Base Ten NF= Numbers and Operations – Fractions
MD= Measurement and Data G= Geometry
Grade 3 Unit 6: Measuring and Classifying Shapes (~4 weeks)
Unit Overview: In Unit 6, students develop increasingly precise ways to describe, classify, and make generalizations about two-dimensional shapes, particularly
quadrilaterals. Through this work, they build an understanding of how shape attributes function to form larger categories of shapes. Connections from this
geometry focus can be made to fraction and measurement concepts (area and perimeter). This unit provides students with the opportunity to attend to precision
(MP6) as they use appropriate vocabulary for shape attributes and measurement contexts.
Guiding Question: Why can a shape have more than one name?
The student will be able to: The teacher will use appropriate instructional strategies/approaches based on the needs of the student.
Component Cluster 3.G Reason with shapes and their attributes.
3.G.1 Understand that shapes in different categories (e.g.,
rhombuses, rectangles, and others) may share attributes
(e.g., having four sides), and that the shared attributes can
define a larger category (e.g., quadrilaterals). Recognize
rhombuses, rectangles, and squares as examples of
quadrilaterals, and draw examples of quadrilaterals that
do not belong to any of these subcategories.
In second grade, students identify and draw triangles, quadrilaterals, pentagons, and hexagons. Third graders build
on this experience and further investigate quadrilaterals (technology may be used during this exploration). Students
recognize shapes that are and are not quadrilaterals by examining the properties of the geometric figures. They
conceptualize that a quadrilateral must be a closed figure with four straight sides and begin to notice characteristics
of the angles and the relationship between opposite sides. Students should be encouraged to provide details and use
proper vocabulary when describing the properties of quadrilaterals. They sort geometric figures (see examples
below) and identify squares, rectangles, and rhombuses as quadrilaterals.
3.G.2 Partition shapes into parts with equal areas.
Express the area of each part as a unit fraction of the
whole.
For example, partition a shape into 4 parts with equal
area, and describe the area of each part as 1/4 of the
area of the shape.
In third grade students start to develop the idea of a fraction more formally, building on the idea of partitioning a
whole into equal parts. The whole can be a shape such as a circle or rectangle. In Grade 4, this is extended to
include wholes that are collections of objects.
This standard also builds on students’ work with fractions and area. Students are responsible for partitioning shapes
into halves, thirds, fourths, sixths and eighths.
Given a shape, students partition it into equal parts, recognizing that these parts all have the same area. They
identify the fractional name of each part and are able to partition a shape into parts with equal areas in several
different ways.

Mathematics
OA = Operations and Algebraic Thinking NBT= Numbers and Operations in Base Ten NF= Numbers and Operations – Fractions
MD= Measurement and Data G= Geometry
Component Cluster 3.MD Geometric measurement: understand concepts of area and relate area to multiplication and to addition.
3.MD.5 Recognize area as an attribute of plane figures
and understand concepts of area measurement.
b. A square with side length 1 unit, called “a unit
square,” is said to have “one square unit” of area,
and can be used to measure area.
c. A plane figure which can be covered without gaps
or overlaps by n unit squares is said to have an area
of n square units.
These standards call for students to explore the concept of covering a region with “unit squares,” which could
include square tiles or shading on grid or graph paper. Based on students’ development, they should have ample
experiences filling a region with square tiles before transitioning to pictorial representations on graph paper.
5 one unit
3.MD.6 Measure areas by counting unit squares (square
cm, square m, square in, square ft, and improvised units).
Students should be counting the square units to find the area could be done in metric, customary, or non-standard
square units. Using different sized graph paper, students can explore the areas measured in square centimeters and
square inches.
3.MD.7 Relate area to the operations of multiplication
and addition.
a. Find the area of a rectangle with whole-number side
lengths by tiling it, and show that the area is the same as
would be found by multiplying the side lengths.
Students can learn how to multiply length measurements to find the area of a rectangular region. But, in order that
they make sense of these quantities, they must first learn to interpret measurement of rectangular regions as a
multiplicative relationship of the number of square units in a row and the number of rows. This relies on the
development of spatial structuring. To build from spatial structuring to understanding the number of area-units as
the product of number of units in a row and number of rows, students might draw rectangular arrays of squares and
learn to determine the number of squares in each row with increasingly sophisticated strategies, such as skip-
counting the number in each row and eventually multiplying the number in each row by the number of rows. They
learn to partition a rectangle into identical squares by anticipating the final structure and forming the array by
drawing line segments to form rows and columns. They use skip counting and multiplication to determine the
number of squares in the array.
Many activities that involve seeing and making arrays of squares to form a rectangle might be needed to build
robust conceptions of a rectangular area structured into squares.
4
5 one square unit 5 one square unit 5 one square unit 5 one square unit

Mathematics
OA = Operations and Algebraic Thinking NBT= Numbers and Operations in Base Ten NF= Numbers and Operations – Fractions
MD= Measurement and Data G= Geometry
Students should understand and explain why multiplying the side lengths of a rectangle yields the same
measurement of area as counting the number of tiles (with the same unit length) that fill the rectangle’s interior For
example, students might explain that one length tells how many unit squares in a row and the other length tells how
many rows there are.
(Progressions for the CCSSM, Geometric Measurement, CCSS Writing Team, June 2012, page 17)
b. Multiply side lengths to find areas of rectangles with
whole-number side lengths in the context of solving real
world and mathematical problems, and represent whole-
number products as rectangular areas in mathematical
reasoning.
Students should solve real world and mathematical problems.
Students might solve problems such as finding all the rectangular regions with whole-number side lengths that have
an area of 12 area-units, doing this for larger rectangles (e.g., enclosing 24, 48, 72 area-units), making sketches
rather than drawing each square. Students learn to justify their belief they have found all possible solutions.
(Progressions for the CCSSM, Geometric Measurement, CCSS Writing Team, June 2012, page 18)
d. Recognize area as additive. Find areas of rectilinear
figures by decomposing them into non-overlapping
rectangles and adding the areas of the non-overlapping
parts, applying this technique to solve real world
problems.
This standard uses the word rectilinear. A rectilinear figure is a polygon that has all right angles.
How could this figure be
decomposed to help find the area?

Mathematics
OA = Operations and Algebraic Thinking NBT= Numbers and Operations in Base Ten NF= Numbers and Operations – Fractions
MD= Measurement and Data G= Geometry
This portion
of the decomposed figure is
a 4 x 2.
This portion
of the decomposed figure is 2 x
2.
4 x 2 = 8 and 2 x 2 = 4
So 8 + 4 = 12
Therefore the total area of this figure is 12 square units
Component Cluster 3.MD Geometric measurement: recognize perimeter as an attribute of plane figures and distinguish between linear and area measures.
3.MD.8 Solve real world and mathematical problems
involving perimeters of polygons, including finding the
perimeter given the side lengths, finding an unknown side
length, and exhibiting rectangles with the same perimeter
and different areas or with the same area and different
perimeters.
Students develop an understanding of the concept of perimeter through various experiences, such as walking around
the perimeter of a room, using rubber bands to represent the perimeter of a plane figure on a geoboard, or tracing
around a shape on an interactive whiteboard. They find the perimeter of objects; use addition to find perimeters; and
recognize the patterns that exist when finding the sum of the lengths and widths of rectangles.
Students should also strategically use tools, such as geoboards, tiles, and graph paper to find all the possible
rectangles that have a given perimeter (e.g., find the rectangles with a perimeter of 14 cm.) They record all the
possibilities using dot or graph paper, compile the possibilities into an organized list or a table, and determine
whether they have all the possible rectangles. Following this experience, students can reason about connections
between their representations, side lengths, and the perimeter of the rectangles.
A perimeter is the boundary of a two-dimensional shape. For a polygon, the length of the perimeter is the sum of
the lengths of the sides. Initially, it is useful to have sides marked with unit length marks, allowing students to count
the unit lengths. Later, the lengths of the sides can be labeled with numerals. As with all length tasks, students need
to count the length-units and not the end-points. Next, students learn to mark off unit lengths with a ruler and label
the length of each side of the polygon. For rectangles, parallelograms, and regular polygons, students can discuss
and justify faster ways to find the perimeter length than just adding all of the lengths.
Rectangles and parallelograms have opposite sides of equal length, so students can double the lengths of adjacent
sides and add those numbers or add lengths of two adjacent sides and double that number. A regular polygon has all
sides of equal length, so its perimeter length is the product of one side length and the number of sides.
Perimeter problems for rectangles and parallelograms often give only the lengths of two adjacent sides or only show
numbers for these sides in a drawing of the shape. The common error is to add just those two numbers. Having
students first label the lengths of the other two sides as a reminder is helpful. Students then find unknown side
lengths in more difficult “missing measurements” problems and other types of perimeter problems.

Mathematics
OA = Operations and Algebraic Thinking NBT= Numbers and Operations in Base Ten NF= Numbers and Operations – Fractions
MD= Measurement and Data G= Geometry
(Progressions for the CCSSM, Geometric Measurement, CCSS Writing Team, June 2012, page 16)
With strong and distinct concepts of both perimeter and area established, students can work on problems to
differentiate their measures. For example, they can find and sketch rectangles with the same perimeter and different
areas or with the same area and different perimeters and justify their claims. Differentiating perimeter from area is
facilitated by having students draw congruent rectangles and measure, mark off, and label the unit lengths all
around the perimeter on one rectangle, then do the same on the other rectangle but also draw the square units. This
enables students to see the units involved in length and area and find patterns in finding the lengths and areas of
non-square and square rectangles. Students can continue to describe and show the units involved in perimeter and
area after they no longer need these. (Progressions for the CCSSM, Geometric Measurement, CCSS Writing Team,
June 2012, page 18)

Mathematics
OA = Operations and Algebraic Thinking NBT= Numbers and Operations in Base Ten NF= Numbers and Operations – Fractions
MD= Measurement and Data G= Geometry
Grade 3 Unit 7: Extending Multiplication and Fractions (~4 weeks)
Unit Overview: The year rounds out with opportunities to solidify, apply, and extend skills and concepts developed through the course of the year. Students work
with multiplication beyond the basic facts as they analyze properties of multiplication in the context of larger numbers and problem-solving. Students should also
have the opportunity to revisit their work with fractions as parts of a whole and distances along a number line through application in other contexts including
rulers, area models, and data collection. Students will have many opportunities to make sense of problems and persevere in solving them (MP 1) as they put their
new skills and understandings to use.
Guiding Question: What strategies do mathematicians use to see if their answers to challenging problems make sense?
The student will be able to: The teacher will use appropriate instructional strategies/approaches based on the needs of the student.
Component Cluster 3.OA Represent and solve problems involving multiplication and division.
3.OA.1 Interpret products of whole numbers, e.g.,
interpret 5 × 7 as the total number of objects in 5 groups
of 7 objects each.
For example, describe a context in which a total number
of objects can be expressed as 5 × 7.
See Unit 2.
3.OA.2 Interpret whole-number quotients of whole
numbers, e.g., interpret 56 ÷ 8 as the number of objects in
each share when 56 objects are partitioned equally into 8
shares, or as a number of shares when 56 objects are
partitioned into equal shares of 8 objects each.
For example, describe a context in which a number
of shares or a number of groups can be expressed as 56
÷ 8.
See Unit 2.
3.OA.3 Use multiplication and division within 100 to
solve word problems in situations involving equal
groups, arrays, and measurement quantities, e.g., by
using drawings and equations with a symbol for the
unknown number to represent the problem.
See Unit 2.
Component Cluster 3.OA Understand properties of multiplication and the relationship between multiplication and division.
3.OA.5 Apply properties of operations as strategies to
multiply and divide.2 Examples: If 6 × 4 = 24 is known,
then 4 × 6 = 24 is also known. (Commutative property of
multiplication.) 3 × 5 × 2 can be found by 3 × 5 = 15,
then 15 × 2 = 30, or by 5 × 2 = 10, then 3 × 10 = 30.
See Unit 2.

Mathematics
OA = Operations and Algebraic Thinking NBT= Numbers and Operations in Base Ten NF= Numbers and Operations – Fractions
MD= Measurement and Data G= Geometry
(Associative property of multiplication.) Knowing that 8
× 5 = 40 and 8 × 2 = 16, one can find 8 × 7 as 8 × (5 +
2) = (8 × 5) + (8 × 2) = 40 + 16 = 56. (Distributive
property.)
2 Students need not use formal terms for these properties.
Component Cluster 3.OA Multiply and divide within 100.
3.OA.7 Fluently multiply and divide within 100, using
strategies such as the relationship between multiplication
and division (e.g., knowing that 8 × 5 = 40, one knows 40
÷ 5 = 8) or properties of operations. By the end of Grade
3, know from memory all products of two one-digit
numbers.
See Unit 2.
Component Cluster 3.OA Solve problems involving the four operations, and identify and explain patterns in arithmetic.
3.OA.8 Solve two-step word problems using the four
operations. Represent these problems using equations
with a letter standing for the unknown quantity. Assess
the reasonableness of answers using mental computation
and estimation strategies including rounding.*
*This standard is limited to problems posed with whole
numbers and having whole-number answers; students
should know how to perform operations in the
conventional order when there are no parentheses to
specify a particular order.
See Unit 2.
Component Cluster 3.MD Geometric measurement: understand concepts of area and relate area to multiplication and to addition.
3.MD.7 Relate area to the operations of multiplication
and addition.
a. Find the area of a rectangle with whole-number side
lengths by tiling it, and show that the area is the same as
would be found by multiplying the side lengths.
See Unit 6.
b. Multiply side lengths to find areas of rectangles with
whole-number side lengths in the context of solving real
world and mathematical problems, and represent whole-
number products as rectangular areas in mathematical
reasoning.
See Unit 6.
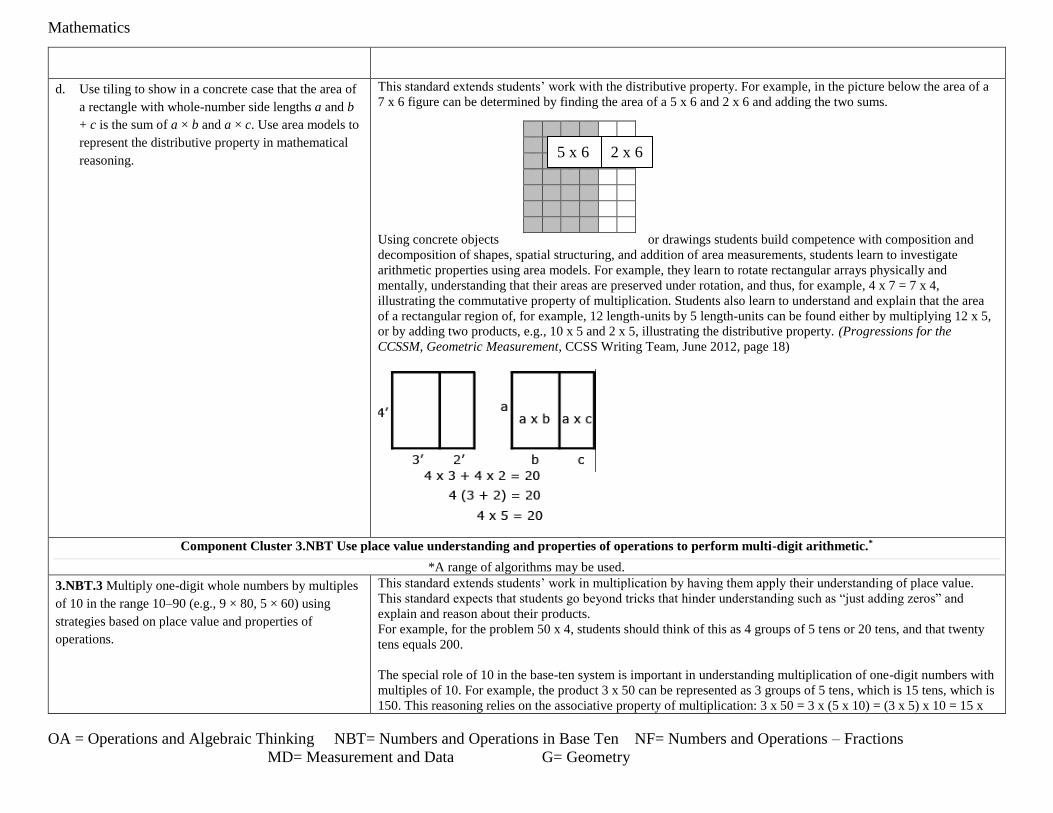
Mathematics
OA = Operations and Algebraic Thinking NBT= Numbers and Operations in Base Ten NF= Numbers and Operations – Fractions
MD= Measurement and Data G= Geometry
d. Use tiling to show in a concrete case that the area of
a rectangle with whole-number side lengths a and b
+ c is the sum of a × b and a × c. Use area models to
represent the distributive property in mathematical
reasoning.
This standard extends students’ work with the distributive property. For example, in the picture below the area of a
7 x 6 figure can be determined by finding the area of a 5 x 6 and 2 x 6 and adding the two sums.
Using concrete objects or drawings students build competence with composition and
decomposition of shapes, spatial structuring, and addition of area measurements, students learn to investigate
arithmetic properties using area models. For example, they learn to rotate rectangular arrays physically and
mentally, understanding that their areas are preserved under rotation, and thus, for example, 4 x 7 = 7 x 4,
illustrating the commutative property of multiplication. Students also learn to understand and explain that the area
of a rectangular region of, for example, 12 length-units by 5 length-units can be found either by multiplying 12 x 5,
or by adding two products, e.g., 10 x 5 and 2 x 5, illustrating the distributive property. (Progressions for the
CCSSM, Geometric Measurement, CCSS Writing Team, June 2012, page 18)
Component Cluster 3.NBT Use place value understanding and properties of operations to perform multi-digit arithmetic.*
*A range of algorithms may be used.
3.NBT.3 Multiply one-digit whole numbers by multiples
of 10 in the range 10–90 (e.g., 9 × 80, 5 × 60) using
strategies based on place value and properties of
operations.
This standard extends students’ work in multiplication by having them apply their understanding of place value.
This standard expects that students go beyond tricks that hinder understanding such as “just adding zeros” and
explain and reason about their products.
For example, for the problem 50 x 4, students should think of this as 4 groups of 5 tens or 20 tens, and that twenty
tens equals 200.
The special role of 10 in the base-ten system is important in understanding multiplication of one-digit numbers with
multiples of 10. For example, the product 3 x 50 can be represented as 3 groups of 5 tens, which is 15 tens, which is
150. This reasoning relies on the associative property of multiplication: 3 x 50 = 3 x (5 x 10) = (3 x 5) x 10 = 15 x
2 x 6 5 x 6

Mathematics
OA = Operations and Algebraic Thinking NBT= Numbers and Operations in Base Ten NF= Numbers and Operations – Fractions
MD= Measurement and Data G= Geometry
10 = 150. It is an example of how to explain an instance of a calculation pattern for these products: calculate the
product of the non-zero digits, and then shift the product one place to the left to make the result ten times as large •
(Progressions for the CCSSM; Number and Operation in Base Ten, CCSS Writing Team, April 2011, page 11)
Component Cluster 3.NF Develop understanding of fractions as numbers.
3.NF.1 Understand a fraction 1/b as the quantity formed
by 1 part when a whole is partitioned into b equal parts;
understand a fraction a/b as the quantity formed by a
parts of size 1/b.
See Unit 4.
3.NF.2 Understand a fraction as a number on the number
line; represent fractions on a number line diagram.
c. Represent a fraction 1/b on a number line diagram by
defining the interval from 0 to 1 as the whole and
partitioning it into b equal parts. Recognize that each
part has size 1/b and that the endpoint of the part
based at 0 locates the number 1/b on the number line.
See Unit 4.

Mathematics
OA = Operations and Algebraic Thinking NBT= Numbers and Operations in Base Ten NF= Numbers and Operations – Fractions
MD= Measurement and Data G= Geometry
d. Represent a fraction a/b on a number line diagram by
marking off a lengths 1/b from 0. Recognize that the
resulting interval has size a/b and that its endpoint
locates the number a/b on the number line.
3.NF.3 Explain equivalence of fractions in special cases,
and compare fractions by reasoning about their size.
a. Understand two fractions as equivalent (equal) if
they are the same size, or the same point on a
number line.
b. Recognize and generate simple equivalent fractions,
e.g., 1/2 = 2/4, 4/6 = 2/3). Explain why the fractions
are equivalent, e.g., by using a visual fraction model.
See Unit 4.
c. Express whole numbers as fractions, and recognize
fractions that are equivalent to whole numbers.
Examples: Express 3 in the form 3 = 3/1; recognize
that 6/1 = 6; locate 4/4 and 1 at the same point of a
number line diagram.
See Unit 4.
d. Compare two fractions with the same numerator or
the same denominator by reasoning about their size.
Recognize that comparisons are valid only when the
two fractions refer to the same whole. Record the
results of comparisons with the symbols >, =, or <,
and justify the conclusions, e.g., by using a visual
fraction model.
See Unit 4.
Component Cluster 3.G Reason with shapes and their attributes.
3.G.2 Partition shapes into parts with equal areas.
Express the area of each part as a unit fraction of the
whole.
For example, partition a shape into 4 parts with equal
area, and describe the area of each part as 1/4 of the
area of the shape.
See Unit 4.

Mathematics
OA = Operations and Algebraic Thinking NBT= Numbers and Operations in Base Ten NF= Numbers and Operations – Fractions
MD= Measurement and Data G= Geometry
Grade 3 Unit 8: Culminating Unit: Challenge and Application (~4 weeks)
Unit Overview: The focus of unit 8 is to provide students with engaging opportunities to apply their learning from the year. They will have time to
deepen their understandings, correct misconceptions, solidify procedural strategies, and apply their skills in real-life contexts. During this unit,
students should make sense of problems and persevere in solving them (MP1) as they employ all of their math concepts and skills from the year in
meaningful contexts.
Guiding Question: How will you use the math you have learned in 3rd grade to investigate and solve problems over the course of the summer?
CONTINUE WORK WITH ALL GRADE LEVEL STANDARDS.

Mathematics
OA = Operations and Algebraic Thinking NBT= Numbers and Operations in Base Ten NF= Numbers and Operations – Fractions
MD= Measurement and Data G= Geometry
Grade 4 In Grade 4, instructional time should focus on three critical areas: (1) developing understanding and fluency with multi-digit multiplication, and
developing understanding of dividing to find quotients involving multi-digit dividends; (2) developing an understanding of fraction equivalence,
addition and subtraction of fractions with like denominators, and multiplication of fractions by whole numbers; (3) understanding that geometric
figures can be analyzed and classified based on their properties, such as having parallel sides, perpendicular sides, particular angle measures, and
symmetry.
(1) Students generalize their understanding of place value to 1,000,000, understanding the relative sizes of numbers in each place. They apply
their understanding of models for multiplication (equal-sized groups, arrays, area models), place value, and properties of operations, in
particular the distributive property, as they develop, discuss, and use efficient, accurate, and generalizable methods to compute products of
multi-digit whole numbers. Depending on the numbers and the context, they select and accurately apply appropriate methods to estimate or
mentally calculate products. They develop fluency with efficient procedures for multiplying whole numbers; understand and explain why the
procedures work based on place value and properties of operations; and use them to solve problems. Students apply their understanding of
models for division, place value, properties of operations, and the relationship of division to multiplication as they develop, discuss, and use
efficient, accurate, and generalizable procedures to find quotients involving multi-digit dividends. They select and accurately apply
appropriate methods to estimate and mentally calculate quotients, and interpret remainders based upon the context.
(2) Students develop understanding of fraction equivalence and operations with fractions. They recognize that two different fractions can be
equal (e.g., 15/9 = 5/3), and they develop methods for generating and recognizing equivalent fractions. Students extend previous
understandings about how fractions are built from unit fractions, composing fractions from unit fractions, decomposing fractions into unit
fractions, and using the meaning of fractions and the meaning of multiplication to multiply a fraction by a whole number.
(3) Students describe, analyze, compare, and classify two-dimensional shapes. Through building, drawing, and analyzing two-dimensional
shapes, students deepen their understanding of properties of two-dimensional objects and the use of them to solve problems involving
symmetry.
Mathematical Practices
1. Make sense of problems and persevere in solving them.
2. Reason abstractly and quantitatively.
3. Construct viable arguments and critique the reasoning of others.
4. Model with mathematics.
5. Use appropriate tools strategically.
6. Attend to precision.
7. Look for and make use of structure.
8. Look for and express regularity in repeated reasoning.
Grade 4: Suggested Distribution of Units in Instructional Days Time Approx.

Mathematics
OA = Operations and Algebraic Thinking NBT= Numbers and Operations in Base Ten NF= Numbers and Operations – Fractions
MD= Measurement and Data G= Geometry
# of Weeks
Unit 1: Multiplicative Thinking 12.5% ~ 4 weeks
Unit 2: Multi-Digit Multiplication and Early Division 12.5% ~ 4 weeks
Unit 3: Decimals and Fractions 12.5% ~ 4 weeks
Unit 4: Addition and Subtraction of Length, Weight, and Capacity 12.5% ~ 4 weeks
Unit 5: Two-dimensional Shape Exploration 12.5% ~ 4 weeks
Unit 6: Extending Multiplication and Division 12.5% ~ 4 Weeks
Unit 7: Patterns and More Challenging Problems 12.5% ~ 4 Weeks
Unit 8: Culminating Unit: Challenge and Application 12.5% ~ 4 Weeks
Instructional
Focus of Unit:
Operations and
Algebraic Thinking Number Fractions
Measurement
and Data Geometry Application
Grade 4 Unit 1: Multiplicative Thinking (~ 4 weeks)
Unit 1: Mutliplicative
Thinking12.5%
Unit 2: Multi-Digit Multiplication and
Early Division12.5%
Unit 3: Decimals and Fractions
12.5%
Unit 4: +/- with Lengths, Width,
and Capacity12.5%
Unit 5: Two-Dimensional
Shape Exploration
12.5%
Unit 6: Extending Multiplication and
Division12.5%
Unit 7: Patterns and More
Challenging Problems
12.5%
Unit 8: Culminating
Application Unit12.5%
Instructional Time

Mathematics
OA = Operations and Algebraic Thinking NBT= Numbers and Operations in Base Ten NF= Numbers and Operations – Fractions
MD= Measurement and Data G= Geometry
Unit Overview: Unit 1 begins the year with a review of third grade multiplication and division concepts, models, and strategies and then extends this work into
new 4th grade learning. This unit should reintroduce the use of number lines, arrays, and ratio tables as important models for working with multiplication and
division. The unit expands on these models into work with factors and multiples, prime and composites, and multiplicative comparisons. The multiplicative
comparison problems can use the real life context of measurement especially as it relates to the metric units for length, mass, and liquid volume. Students will
need to use appropriate tools strategically (MP 5) as they make sense of problems and persevere in solving them (MP 1).
Guiding Question: How can you use a model to solve a real-world problem quickly and to prove your reasoning?
The student will be able to: The teacher will use appropriate instructional strategies/approaches based on the needs of the student.
Component Cluster 4.OA Use the four operations with whole numbers to solve problems.
4.OA.1 Interpret a multiplication equation as a
comparison, e.g., interpret 35 = 5 × 7 as a statement that
35 is 5 times as many as 7 and 7 times as many as 5.
Represent verbal statements of multiplicative
comparisons as multiplication equations.
A multiplicative comparison is a situation in which one quantity is multiplied by a specified number to get another
quantity (e.g., “a is n times as much as b”). Students should be able to identify and verbalize which quantity is
being multiplied and which number tells how many times. Students should be given opportunities to write and
identify equations and statements for multiplicative comparisons.
4.OA.2 Multiply or divide to solve word problems
involving multiplicative comparison, e.g., by using
drawings and equations with a symbol for the unknown
number to represent the problem, distinguishing
multiplicative comparison from additive comparison.*
* See Glossary, Table 2.
This standard calls for students to translate comparative situations into equations with an unknown and solve.
Students need many opportunities to solve contextual problems. Refer to Glossary, Table 2. In an additive
comparison, the underlying question is what amount would be added to one quantity in order to result in the other.
In a multiplicative comparison, the underlying question is what factor would multiply one quantity in order to result
in the other. The focus in this standard is to have students use and discuss various strategies. It refers to estimation
strategies, including using compatible numbers (numbers that sum to 10 or 100) or rounding. Problems should be
structured so that all acceptable estimation strategies will arrive at a reasonable answer. Students need many
opportunities solving multistep story problems using all four operations.
4.OA.3 Solve multistep word problems posed with
whole numbers and having whole number answers using
the four operations, including problems in which
remainders must be interpreted. Represent these
problems using equations with a letter standing for the
unknown quantity. Assess the reasonableness of answers
using mental computation and estimation strategies
including rounding.
The focus in this standard is to have students use and discuss various strategies. It refers to estimation strategies,
including using compatible numbers (numbers that sum to 10 or 100) or rounding. Problems should be structured so
that all acceptable estimation strategies will arrive at a reasonable answer. Students need many opportunities
solving multistep story problems using all four operations.
Component Cluster 4.OA Gain familiarity with factors and multiples.
4.OA.4 Find all factor pairs for a whole number in the
range 1–100. Recognize that a whole number is a
multiple of each of its factors. Determine whether a given
whole number in the range 1–100 is a multiple of a given
one-digit number. Determine whether a given whole
number in the range 1–100 is prime or composite.
This standard requires students to demonstrate understanding of factors and multiples of whole numbers. This
standard also refers to prime and composite numbers. Prime numbers have exactly two factors, the number one and
their own number. For example, the number 17 has the factors of 1 and 17. Composite numbers have more than two
factors. For example, 8 has the factors 1, 2, 4, and 8.
A common misconception is that the number 1 is prime, when in fact; it is neither prime nor composite. Another
common misconception is that all prime numbers are odd numbers. This is not true, since the number 2 has only 2
factors, 1 and 2, and is also an even number.
Prime vs. Composite:

Mathematics
OA = Operations and Algebraic Thinking NBT= Numbers and Operations in Base Ten NF= Numbers and Operations – Fractions
MD= Measurement and Data G= Geometry
A prime number is a number greater than 1 that has only 2 factors, 1 and itself. Composite numbers have more than
2 factors.
Students investigate whether numbers are prime or composite by
building rectangles (arrays) with the given area and finding which numbers have more than two
rectangles (e.g. 7 can be made into only 2 rectangles, 1 x 7 and 7 x 1, therefore it is a prime number)
finding factors of the number
Students should understand the process of finding factor pairs so they can do this for any number 1 -100,
Example:
Factor pairs for 96: 1 and 96, 2 and 48, 3 and 32, 4 and 24, 6 and 16, 8 and 12.
Multiples can be thought of as the result of skip counting by each of the factors. When skip counting, students
should be able to identify the number of factors counted e.g., 5, 10, 15, 20 (there are 4 fives in 20).
To determine if a number between 1-100 is a multiple of a given one-digit number, some helpful hints include the
following:
all even numbers are multiples of 2
all even numbers that can be halved twice (with a whole number result) are multiples of 4
all numbers ending in 0 or 5 are multiples of 5
Component Cluster 4.MD Solve problems involving measurement and conversion of measurements from a larger unit to a smaller unit.*
*The focus of this unit is on the metric system.
4.MD.1 Know relative sizes of measurement units within
one system of units including km, m, cm; kg, g; lb, oz.; l,
ml; hr, min, sec. Within a single system of measurement,
express measurements in a larger unit in terms of a
smaller unit. Record measurement equivalents in a two-
column table.
For example, know that 1 ft is 12 times as long as 1 in.
Express the length of a 4 ft snake as 48 in. Generate a
conversion table for feet and inches listing the number
pairs (1, 12), (2, 24), (3, 36), ...
The units of measure that have not been addressed in prior years are cups, pints, quarts, gallons, pounds, ounces,
kilometers, millimeter, milliliters, and seconds. Students’ prior experiences were limited to measuring length, mass
(metric and customary systems), liquid volume (metric only), and elapsed time. Students did not convert
measurements.
Students develop benchmarks and mental images about a meter (e.g., about the height of a tall chair) and a
kilometer (e.g., the length of 10 football fields including the end zones, or the distance a person might walk in about
12 minutes), and they also understand that “kilo” means a thousand, so 3000 m is equivalent to 3 km. Expressing
larger measurements in smaller units within the metric system is an opportunity to reinforce notions of place value.
There are prefixes for multiples of the basic unit (meter or gram), although only a few (kilo-, centi-, and milli-) are
in common use. Tables such as the one below are an opportunity to develop or reinforce place value concepts and
skills in measurement activities. Relating units within the metric system is another opportunity to think about place
value. For example, students might make a table that shows measurements of the same lengths in centimeters and
meters. Relating units within the traditional system provides an opportunity to engage in mathematical practices,
especially “look for and make use of structure” and “look for and express regularity in repeated reasoning” For
example, students might make a table that shows measurements of the same lengths in feet and inches.
(Progressions for the CCSSM, Geometric Measurement, CCSS Writing Team, June 2012, page20)
Grade 4 Unit 2: Multidigit Multiplication and Early Division (~4 weeks)

Mathematics
OA = Operations and Algebraic Thinking NBT= Numbers and Operations in Base Ten NF= Numbers and Operations – Fractions
MD= Measurement and Data G= Geometry
Unit Overview: Throughout this unit, students will continue to build their understanding and skills related to multiplication and division. Students will likely
progress through the following stages: from concrete (arrays with base ten pieces) to representational (sketches) to the beginnings of abstract representation (ratio
tables, partial products, etc.). Emphasis should be placed on making generalizations about the effects of multiplying by 10, 100, and 1,000. Students should also
have a variety of opportunities to solve multiplication and division problems that require them to make meaning of the stories especially as it relates to remainders.
Students will need to use appropriate tools strategically (MP 5) as they make sense of problems and persevere in solving them (MP 1).
Guiding Question: How can you use a model to solve a story problem and to prove your reasoning?
The student will be able to: The teacher will use appropriate instructional strategies/approaches based on the needs of the student.
Component Cluster 4.OA Use the four operations with whole numbers to solve problems.
4.OA.3 Solve multistep word problems posed with whole
numbers and having whole number answers using the four
operations, including problems in which remainders must
be interpreted. Represent these problems using equations
with a letter standing for the unknown quantity. Assess
the reasonableness of answers using mental computation
and estimation strategies including rounding.
See Unit 1.
Component Cluster 4.NBT Generalize place value understanding for multi-digit whole numbers.
4.NBT.1 Recognize that in a multi-digit whole number, a
digit in one place represents ten times what it represents
in the place to its right. For example, recognize that 700 ÷
70 = 10 by applying concepts of place value and division.
This standard calls for students to extend their understanding of place value related to multiplying and dividing by
multiples of 10. In this standard, students should reason about the magnitude of digits in a number. Students should
be given opportunities to reason and analyze the relationships of numbers that they are working with.
Component Cluster 4.NBT Use place value understanding and properties of operations to perform multi-digit arithmetic.
4.NBT.5 Multiply a whole number of up to four digits by
a one-digit whole number, and multiply two two-digit
numbers, using strategies based on place value and the
properties of operations. Illustrate and explain the
calculation by using equations, rectangular arrays, and/or
area models.
Students who develop flexibility in breaking numbers apart have a better understanding of the importance of place
value and the distributive property in multi-digit multiplication. Students use base ten blocks, area models,
partitioning, compensation strategies, etc. when multiplying whole numbers and use words and diagrams to explain
their thinking. They use the terms factor and product when communicating their reasoning. Multiple strategies
enable students to develop fluency with multiplication and transfer that understanding to division. Use of the
standard algorithm for multiplication is an expectation in the 5th grade.
Another part of understanding general base-ten methods for multi-digit multiplication is understanding the role
played by the distributive property. This allows numbers to be decomposed into base-ten units, products of the
units to be computed, and then combined. By decomposing the factors into like base-ten units and applying the
distributive property, multiplication computations are reduced to single-digit multiplications and products of
numbers with multiples of 10, of 100, and of 1000. Students can connect diagrams of areas or arrays to numerical
work to develop understanding of general base-ten multiplication methods. Computing products of two two-digit
numbers requires using the distributive property several times when the factors are decomposed into base-ten units.
4.NBT.6 Find whole-number quotients and remainders
with up to four-digit dividends and one-digit divisors,
using strategies based on place value, the properties of
operations, and/or the relationship between multiplication
In fourth grade, students build on their third grade work with division within 100. Students need opportunities to
develop their understandings by using problems in and out of context.
General methods for computing quotients of multi-digit numbers and one-digit numbers rely on the same
understandings as for multiplication, but cast in terms of division. One component is quotients of multiples of 10,
100, or 1000 and one-digit numbers. For example, 42 ÷ 6 is related to 420 ÷ 6 and 4200 ÷ 6. Students can draw on

Mathematics
OA = Operations and Algebraic Thinking NBT= Numbers and Operations in Base Ten NF= Numbers and Operations – Fractions
MD= Measurement and Data G= Geometry
and division. Illustrate and explain the calculation by
using equations, rectangular arrays, and/or area models.
their work with multiplication and they can also reason that 4200 ÷ 6 means partitioning 42 hundreds into 6 equal
groups, so there are 7 hundreds in each group. Another component of understanding general methods for multi-
digit division computation is the idea of decomposing the dividend into like base-ten units and finding the quotient
unit by unit, starting with the largest unit and continuing on to smaller units. As with multiplication, this relies on
the distributive property. This can be viewed as finding the side length of a rectangle (the divisor is the length of
the other side) or as allocating objects (the divisor is the number of groups).
Multi-digit division requires working with remainders. In preparation for working with remainders, students can
compute sums of a product and a number, such as 4 x 8 + 3. In multi-digit division, students will need to find the
greatest multiple less than a given number. For example, when dividing by 6, the greatest multiple of
6 less than 50 is 6 x 8 = 48. Students can think of these “greatest multiples” in terms of putting objects into groups.
For example, when 50 objects are shared among 6 groups, the largest whole number of objects that can be put in
each group is 8, and 2 objects are left over. (Or when 50 objects are allocated into groups of 6, the largest whole
number of groups that can be made is 8, and 2 objects are left over.) The equation 6 x 8 + 2 = 50 (or 8 x 6 + 2 = 50)
corresponds with this situation.
Cases involving 0 in division may require special attention.
(Progressions for the CCSSM; Number and Operation in Base Ten, CCSS Writing Team, April 2011, page 14)
This standard calls for students to explore division through various strategies.
Component Cluster 4.MD Solve problems involving measurement and conversion of measurements from a larger unit to a smaller unit.
4.MD.3 Apply the area and perimeter formulas for
rectangles in real world and mathematical problems.
For example, find the width of a rectangular room given
the area of the flooring and the length, by viewing the
area formula as a multiplication equation with an
unknown factor.
Based on work in third grade students learn to consider perimeter and area of rectangles. In fourth grade, from
multiplication, spatially structuring arrays, and area, they abstract the formula for the area of a rectangle A = l x w
Students generate and discuss advantages and disadvantages of various formulas for the perimeter length of a
rectangle that is l units by w units (P = 2l + 2w, P = 2(l + w), P = l + w + l + w) .
Giving verbal summaries of these formulas is also helpful. Specific numerical instances of other formulas or mental
calculations for the perimeter of a rectangle can be seen as examples of the properties of operations, e.g., 2l + 2w =
2(l + w) illustrates the distributive property.
Perimeter problems often give only one length and one width, thus remembering the basic formula can help to
prevent the usual error of only adding one length and one width.
Such abstraction and use of formulas underscores the importance of distinguishing between area and perimeter in
Grade 3 and maintaining the distinction in Grade 4 and later grades, where rectangle perimeter and area problems
may get more complex and problem solving can benefit from knowing or being able to rapidly remind oneself of
how to find an area or perimeter. By repeatedly reasoning about how to calculate areas and perimeters of
rectangles, students can come to see area and perimeter formulas as summaries of all such calculations.
(Progressions for the CCSSM, Geometric Measurement, CCSS Writing Team, June 2012, page 21)
Students learn to apply these understandings and formulas to the solution of real-world and mathematical problems.
Students should be challenged to solve multistep problems.
In fourth grade and beyond, the mental visual images for perimeter and area from third grade can support students
in problem solving with these concepts. “Apply the formula” does not mean write down a memorized formula and
put in known values because in fourth grade students do not evaluate expressions (they begin this type of work in
Grade 6). In fourth grade, working with perimeter and area of rectangles is still grounded in specific visualizations
and numbers.
Grade 4 Unit 3: Decimals and Fractions (~4 weeks)

Mathematics
OA = Operations and Algebraic Thinking NBT= Numbers and Operations in Base Ten NF= Numbers and Operations – Fractions
MD= Measurement and Data G= Geometry
Unit Overview: Unit 3 centers on equivalent fractions, basic operations with fractions, and the relationship of decimals and fractions. Students should explore a
variety of models and tools including fraction strips, egg cartons, geoboards, number lines, and base ten pieces. They will develop their ability to model, read,
write, compare, order, compose, and decompose fractions and decimals and to apply this knowledge to solve problems. As students do basic fraction and decimal
work, they gradually come to understand both as numbers. Students have the opportunity to look for and make use of structure (MP 7) as they make connections
between fractions and our extended place value system. Students should also be given many opportunities to construct viable arguments and critique the reasoning
of others (MP 3) as they employ effective fraction models to explain their reasoning.
Guiding Question: What are good strategies and models for comparing and solving problems with fractions?
The student will be able to: The teacher will use appropriate instructional strategies/approaches based on the needs of the student.
Component Cluster 4.NF Extend understanding of fraction equivalence and ordering.
4.NF.1 Explain why a fraction a/b is equivalent to a
fraction (n × a)/(n × b) by using visual fraction models,
with attention to how the number and size of the parts
differ even though the two fractions themselves are the
same size. Use this principle to recognize and generate
equivalent fractions.
This standard refers to visual fraction models. This includes area models, number lines or it could be a
collection/set model. This standard extends the work in third grade by using additional denominators. (5, 10, 12
and 100)
This standard addresses equivalent fractions by examining the idea that equivalent fractions can be created by
multiplying both the numerator and denominator by the same number or by dividing a shaded region into various
parts. Students should begin to notice connections between the models and fractions in the way both the parts and
wholes are counted and begin to generate a rule for writing equivalent fractions.
4.NF.2 Compare two fractions with different numerators
and different denominators, e.g., by creating common
denominators or numerators, or by comparing to a
benchmark fraction such as 1/2. Recognize that
comparisons are valid only when the two fractions refer
to the same whole. Record the results of comparisons
with symbols >, =, or <, and justify the conclusions, e.g.,
by using a visual fraction model.
This standard calls students to compare fractions by creating visual fraction models or finding common
denominators or numerators. Students’ experiences should focus on visual fraction models rather than algorithms.
When tested, models may or may not be included. Students should learn to draw fraction models to help them
compare. Students must also recognize that they must consider the size of the whole when comparing fractions. In
fifth grade students who have learned about fraction multiplication can see equivalence as “multiplying by 1":
However, although a useful mnemonic device, this does not constitute a valid argument at fourth grade, since
students have not yet learned fraction multiplication.
Component Cluster 4.NF Build fractions from unit fractions by applying and extending previous understandings of operations on whole numbers.
4.NF.3 Understand a fraction a/b with a > 1 as a sum of
fractions 1/b.
a. Understand addition and subtraction of fractions as
joining and separating parts referring to the same
whole.
b. Decompose a fraction into a sum of fractions with the
same denominator in more than one way, recording
each decomposition by an equation. Justify
A fraction with a numerator of one is called a unit fraction. When students investigate fractions other than unit
fractions, such as 2/3, they should be able to join (compose) or separate (decompose) the fractions of the same
whole.
Students need multiple opportunities to work with mixed numbers and be able to decompose them in more than one
way. Students may use visual models to help develop this understanding. Students should justify their breaking
apart (decomposing) of fractions using visual fraction models. The concept of turning mixed numbers into improper
fractions needs to be emphasized using visual fraction models. Similarly, converting an improper fraction to a
mixed number is a matter of decomposing the fraction into a sum of a whole number and a number less than 1.
Students can draw on their knowledge from third grade of whole numbers as fractions.

Mathematics
OA = Operations and Algebraic Thinking NBT= Numbers and Operations in Base Ten NF= Numbers and Operations – Fractions
MD= Measurement and Data G= Geometry
decompositions, e.g., by using a visual fraction
model.
Examples: 3/8 = 1/8 + 1/8 + 1/8 ; 3/8 = 1/8 + 2/8 ;
2 1/8 = 1 + 1 + 1/8 = 8/8 + 8/8 + 1/8.
c. Add and subtract mixed numbers with like
denominators, e.g., by replacing each mixed number
with an equivalent fraction, and/or by using
properties of operations and the relationship between
addition and subtraction.
d. Solve word problems involving addition and
subtraction of fractions referring to the same whole
and having like denominators, e.g., by using visual
fraction models and equations to represent the
problem.
A separate algorithm for mixed numbers in addition and subtraction is not necessary. Students will tend to add or
subtract the whole numbers first and then work with the fractions using the same strategies they have applied to
problems that contained only fractions. Mixed numbers are introduced for the first time in Fourth Grade. Students
should have ample experiences of adding and subtracting mixed numbers where they work with mixed numbers or
convert mixed numbers so that the numerator is equal to or greater than the denominator. Converting a mixed
number to a fraction should not be viewed as a separate technique to be learned by rote, but simply as a case of
fraction addition.
4.NF.4 Apply and extend previous understandings of
multiplication to multiply a fraction by a whole number.
a. Understand a fraction a/b as a multiple of 1/b.
For example, use a visual fraction model to represent
5/4 as the product 5 × (1/4), recording the
conclusion by the equation 5/4 = 5 × (1/4).
b. Understand a multiple of a/b as a multiple of 1/b, and
use this understanding to multiply a fraction by a
whole number.
For example, use a visual fraction model to express 3
× (2/5) as 6 × (1/5), recognizing this product as 6/5.
(In general, n × (a/b) = (n × a)/b.)
c. Solve word problems involving multiplication of a
fraction by a whole number, e.g., by using visual
fraction models and equations to represent the
problem.
For example, if each person at a party will eat 3/8 of
a pound of roast beef, and there will be 5 people at
the party, how many pounds of roast beef will be
needed? Between what two whole numbers does your
answer lie?
This standard builds on students’ work of adding fractions and extending that work into multiplication. Students
should use the number line and area model. Students should see a fraction as the numerator times the unit fraction
with the same denominator.
This standard extended the idea of multiplication as repeated addition. For example, 3 x (2/5) = 2/5 + 2/5 + 2/5 =
6/5 = 6 x (1/5). Students are expected to use and create visual fraction models to multiply a whole number by a
fraction. The same thinking, based on the analogy between fractions and whole numbers, allows students to give
meaning to the product of whole number and a fraction.
When introducing this standard, make sure student use visual fraction models to solve word problems related to
multiplying a whole number by a fraction.
Component Cluster 4.NF Understand decimal notation for fractions, and compare decimal fractions.
4.NF.5 Express a fraction with denominator 10 as an
equivalent fraction with denominator 100, and use this
This standard continues the work of equivalent fractions by having students change fractions with a 10 in the
denominator into equivalent fractions that have a 100 in the denominator. In order to prepare for work with

Mathematics
OA = Operations and Algebraic Thinking NBT= Numbers and Operations in Base Ten NF= Numbers and Operations – Fractions
MD= Measurement and Data G= Geometry
technique to add two fractions with respective
denominators 10 and 100.*
For example, express 3/10 as 30/100, and add 3/10 +
4/100 = 34/100.
* Students who can generate equivalent fractions can
develop strategies for adding fractions with unlike
denominators in general. But addition and subtraction
with unlike denominators in general is not a requirement
at this grade.
decimals (4.NF.6 and 4.NF.7), experiences that allow students to shade decimal grids (10x10 grids) can support this
work. Student experiences should focus on working with grids rather than algorithms.
Students can also use base ten blocks and other place value models to explore the relationship between fractions
with denominators of 10 and denominators of 100.
Students in fourth grade work with fractions having denominators 10 and 100. Because it involves partitioning into
10 equal parts and treating the parts as numbers called one tenth and one hundredth, work with these fractions can
be used as preparation to extend the base-ten system to non-whole numbers. This work in fourth grade lays the
foundation for performing operations with decimal numbers in fifth grade.
4.NF.6 Use decimal notation for fractions with
denominators 10 or 100. For example, rewrite 0.62 as
62/100; describe a length as 0.62 meters; locate 0.62 on
a number line diagram.
Decimals are introduced for the first time. Students should have ample opportunities to explore and reason about
the idea that a number can be represented as both a fraction and a decimal.
Students make connections between fractions with denominators of 10 and 100 and the place value chart. By
reading fraction names, students say 32/100 as thirty-two hundredths and rewrite this as 0.32 or represent it on a
place value model as shown below.
Hundreds Tens Ones Tenths Hundredths
3 2
Students use the representations explored in 4.NF.5 to understand 32/100 can be expanded to 3/10 and 2/100.
Students represent values such as 0.32 or 32/100 on a number line. 32/100 is more than 30/100 (or 3/10) and less
than 40/100 (or 4/10). It is closer to 30/100 so it would be placed on the number line near that value.
4.NF.7 Compare two decimals to hundredths by
reasoning about their size. Recognize that comparisons
are valid only when the two decimals refer to the same
whole. Record the results of comparisons with the
symbols >, =, or <, and justify the conclusions, e.g., by
using a visual model.
Students should reason that comparisons are only valid when they refer to the same whole. Visual models include
area models, decimal grids, decimal circles, number lines, and meter sticks.
Grade 4 Unit 4: Addition and Subtraction of Length, Weight, and Capacity (~4 weeks)

Mathematics
OA = Operations and Algebraic Thinking NBT= Numbers and Operations in Base Ten NF= Numbers and Operations – Fractions
MD= Measurement and Data G= Geometry
Unit Overview: In this unit, students investigate the standard addition and subtraction algorithms, compare them to other strategies, and make generalizations
about which work best in different types of problems. Measurement problems again act as the “glue” that binds knowledge of the algorithms, mental math, place
value, and real-world applications together into a coherent whole. Measurement problems should cover length and distance, liquid volume, time, mass, and weight
including conversions of measurements into smaller units within the same system. This unit provides opportunities for looking for and expressing regularity in
repeated reasoning (MP8) as students explain calculations and understand how algorithms for addition and subtraction work. This unit of application of concepts
will also require students to model with mathematics (MP 4) as they look for the mathematics represented in real-life measurement situations and to attend to
precision (MP 6).
Guiding Question: How can changing a unit improve a measurement in a real-world problem?
The student will be able to: The teacher will use appropriate instructional strategies/approaches based on the needs of the student.
Component Cluster 4.OA Use the four operations with whole numbers to solve problems.
4.OA.3 Solve multistep word problems posed with whole
numbers and having whole number answers using the four
operations, including problems in which remainders must
be interpreted. Represent these problems using equations
with a letter standing for the unknown quantity. Assess
the reasonableness of answers using mental computation
and estimation strategies including rounding.
See Unit 1.
Component Cluster 4.NBT Generalize place value understanding for multi-digit whole numbers.
4.NBT.1 Recognize that in a multi-digit whole number, a
digit in one place represents ten times what it represents
in the place to its right. For example, recognize that 700 ÷
70 = 10 by applying concepts of place value and division.
See Unit 2.
4.NBT.2 Read and write multi-digit whole numbers using
base-ten numerals, number names, and expanded form.
Compare two multidigit numbers based on meanings of
the digits in each place, using >, =, and < symbols to
record the results of comparisons.
This standard refers to various ways to write numbers. Students should have flexibility with the different number
forms. Traditional expanded form is 285 = 200 + 80 + 5. Written form or number name is two hundred eighty-five.
However, students should have opportunities to explore the idea that 285 could also be 28 tens plus 5 ones or 1
hundred, 18 tens, and 5 ones. To read numerals between 1,000 and 1,000,000, students need to understand the role
of commas. Students should also be able to compare two multi-digit whole numbers using appropriate symbols.
4.NBT.3 Use place value understanding to round multi-
digit whole numbers to any place.
This standard refers to place value understanding, which extends beyond an algorithm or procedure for rounding.
The expectation is that students have a deep understanding of place value and number sense and can explain and
reason about the answers they get when they round. Students should have numerous experiences using a number
line and a hundreds chart as tools to support their work with rounding.
Component Cluster 4.NBT Use place value understanding and properties of operations to perform multi-digit arithmetic.
4.NBT.4 Fluently add and subtract multi-digit whole
numbers using the standard algorithm.
Students build on their understanding of addition and subtraction, their use of place value and their flexibility with
multiple strategies to make sense of the standard algorithm. They continue to use place value in describing and
justifying the processes they use to add and subtract.
Mathematics
OA = Operations and Algebraic Thinking NBT= Numbers and Operations in Base Ten NF= Numbers and Operations – Fractions
MD= Measurement and Data G= Geometry
This standard refers to fluency, which means accuracy, efficiency (using a reasonable amount of steps and time),
and flexibility (using a variety strategies such as the distributive property). This is the first grade level in which
students are expected to be proficient at using the standard algorithm to add and subtract. However, other
previously learned strategies are still appropriate for students to use. Students should know that it is
mathematically possible to subtract a larger number from a smaller number but that their work with whole numbers
does not allow this as the difference would result in a negative number.
Component Cluster 4.MD Solve problems involving measurement and conversion of measurements from a larger unit to a smaller unit.
4.MD.1 Know relative sizes of measurement units within
one system of units including km, m, cm; kg, g; lb, oz.; l,
ml; hr, min, sec. Within a single system of measurement,
express measurements in a larger unit in terms of a
smaller unit. Record measurement equivalents in a two-
column table.
For example, know that 1 ft is 12 times as long as 1 in.
Express the length of a 4 ft snake as 48 in. Generate a
conversion table for feet and inches listing the number
pairs (1, 12), (2, 24), (3, 36), ...
See Unit 1.
4.MD.2 Use the four operations to solve word problems
involving distances, intervals of time, liquid volumes,
masses of objects, and money, including problems
involving simple fractions or decimals, and problems that
require expressing measurements given in a larger unit in
terms of a smaller unit. Represent measurement quantities
using diagrams such as number line diagrams that feature
a measurement scale.
This standard includes multi-step word problems related to expressing measurements from a larger unit
in terms of a smaller unit (e.g., feet to inches, meters to centimeter, and dollars to cents). Students should
have ample opportunities to use number line diagrams to solve word problems.
Grade 4 Unit 5: Two-Dimensional Shape Exploration (~4 weeks)
Unit Overview: Unit 6 focuses both on building, drawing, and analyzing two-dimensional shapes in the context of both geometry and measurement. Students will
develop an understanding of the concepts of angles, angle measure, and parallel and perpendicular lines in order to then sort and classify angles and a wide variety

Mathematics
OA = Operations and Algebraic Thinking NBT= Numbers and Operations in Base Ten NF= Numbers and Operations – Fractions
MD= Measurement and Data G= Geometry
of polygons. These concepts will then be intertwined with work making generalizations about the area and perimeter formula for rectangles as well as solving
unknown angle problems using letters and equations. Geometry is the key that unlocks algebra for students because it is visual. The x clearly stands for a specific
number. For example, if a student wanted to, he or she could place a protractor down on that angle and measure it to find x, but doing so destroys the joy of
solving the puzzle and deducing the answer for themselves. Students have a real opportunity here to use appropriate tools strategically (MP 5) both as they apply
the perimeter and area formulas and also as they first explore the uses of a protractor and determine whether or not they need it to solve angle measurement
problems.
Guiding Question: When you inspect and describe a shape, what are useful attributes to notice
The student will be able to: The teacher will use appropriate instructional strategies/approaches based on the needs of the student.
Component Cluster 4.MD Solve problems involving measurement and conversion of measurements from a larger unit to a smaller unit.
4.MD.3 Apply the area and perimeter formulas for
rectangles in real world and mathematical problems.
For example, find the width of a rectangular room given
the area of the flooring and the length, by viewing the
area formula as a multiplication equation with an
unknown factor.
Based on work in third grade students learn to consider perimeter and area of rectangles. In fourth grade, from
multiplication, spatially structuring arrays, and area, they abstract the formula for the area of a rectangle A = l x w
Students generate and discuss advantages and disadvantages of various formulas for the perimeter length of a
rectangle that is l units by w units (P = 2l + 2w, P = 2(l + w), P = l + w + l + w) .
Giving verbal summaries of these formulas is also helpful. Specific numerical instances of other formulas or mental
calculations for the perimeter of a rectangle can be seen as examples of the properties of operations, e.g., 2l + 2w =
2(l + w) illustrates the distributive property.
Perimeter problems often give only one length and one width, thus remembering the basic formula can help to
prevent the usual error of only adding one length and one width.
Such abstraction and use of formulas underscores the importance of distinguishing between area and perimeter in
Grade 3 and maintaining the distinction in Grade 4 and later grades, where rectangle perimeter and area problems
may get more complex and problem solving can benefit from knowing or being able to rapidly remind oneself of
how to find an area or perimeter. By repeatedly reasoning about how to calculate areas and perimeters of rectangles,
students can come to see area and perimeter formulas as summaries of all such calculations. (Progressions for the
CCSSM, Geometric Measurement, CCSS Writing Team, June 2012, page 21)
Students learn to apply these understandings and formulas to the solution of real-world and mathematical problems.
Students should be challenged to solve multistep problems.
In four th grade and beyond, the mental visual images for perimeter and area from third grade can support students
in problem solving with these concepts. “Apply the formula” does not mean write down a memorized formula and
put in known values because in fourth grade students do not evaluate expressions (they begin this type of work in
Grade 6). In fourth grade, working with perimeter and area of rectangles is still grounded in specific visualizations
and numbers.
Component Cluster 4.MD Geometric Measurement: understand concepts of angle and measure angles.
4.MD.5 Recognize angles as geometric shapes that are
formed wherever two rays share a common endpoint, and
understand concepts of angle measurement:
a. An angle is measured with reference to a circle with
its center at the common endpoint of the rays, by
considering the fraction of the circular arc between
This standard brings up a connection between angles and circular measurement (360 degrees).
Angle measure is a “turning point” in the study of geometry. Students often find angles and angle measure to be
difficult concepts to learn, but that learning allows them to engage in interesting and important mathematics.

Mathematics
OA = Operations and Algebraic Thinking NBT= Numbers and Operations in Base Ten NF= Numbers and Operations – Fractions
MD= Measurement and Data G= Geometry
the points where the two rays intersect the circle. An
angle that turns through 1/360 of a circle is called a
“one-degree angle,” and can be used to measure
angles.
b. An angle that turns through n one-degree angles is
said to have an angle measure of n degrees.
This standard calls for students to explore an angle as a series of “one-degree turns.”
4.MD.6 Measure angles in whole-number degrees using a
protractor. Sketch angles of specified measure.
Before students begin measuring angles with protractors, they need to have some experiences with benchmark
angles. They transfer their understanding that a 360º rotation about a point makes a complete circle to recognize and
sketch angles that measure approximately 90º and 180º. They extend this understanding and recognize and sketch
angles that measure approximately 45º and 30º. They use appropriate terminology (acute, right, and obtuse) to
describe angles and rays (perpendicular). Students should then measure angles and sketch angles. As with other
concepts students need varied examples and explicit discussions to avoid learning limited ideas about measuring
angles (e.g., misconceptions that a right angle is an angle that points to the right, or two right angles represented
with different orientations are not equal in measure).
4.MD.7 Recognize angle measure as additive. When an
angle is decomposed into non-overlapping parts, the
angle measure of the whole is the sum of the angle
measures of the parts. Solve addition and subtraction
problems to find unknown angles on a diagram in real
world and mathematical problems, e.g., by using an
equation with a symbol for the unknown angle measure.
This standard addresses the idea of decomposing (breaking apart) an angle into smaller parts. Students can develop
more accurate and useful angle and angle measure concepts if presented with angles in a variety of situations. They
learn to find the common features of superficially different situations such as turns in navigation, slopes, bends,
corners, and openings. With guidance, they learn to represent an angle in any of these contexts as two rays, even
when both rays are not explicitly represented in the context.
Component Cluster 4.G Draw and identify lines and angles, and classify shapes by properties of their lines and angles.
4.G.1 Draw points, lines, line segments, rays, angles
(right, acute, obtuse), and perpendicular and parallel
lines. Identify these in two-dimensional figures.
This standard asks students to draw two-dimensional geometric objects and to also identify them in two-
dimensional figures. This is the first time that students are exposed to rays, angles, and perpendicular and parallel
lines. Examples of points, line segments, lines, angles, parallelism, and perpendicularity can be seen daily. Students
may not easily identify lines and rays because they are more abstract.
Student should be able to use side length to classify triangles as equilateral, equiangular, isosceles, or scalene; and
can use angle size to classify them as acute, right, or obtuse. They then learn to cross-classify. Students also learn
to apply these concepts in varied contexts. Analyzing the shapes in order to construct them requires students to
explicitly formulate their ideas about the shapes.
4.G.2 Classify two-dimensional figures based on the
presence or absence of parallel or perpendicular lines, or
the presence or absence of angles of a specified size.
Recognize right triangles as a category, and identify right
triangles.
Two-dimensional figures may be classified using different characteristics such as, parallel or perpendicular lines or
by angle measurement. This standard calls for students to sort objects based on parallelism, perpendicularity and
angle types.
Fourth grade students have built a firm foundation of several shape categories, these categories can be the raw
material for thinking about the relationships between classes. Students should classify shapes by attributes and
drawing shapes that fit specific categories.
Example: students can form larger, categories, such as the class of all shapes with four sides, or quadrilaterals, and
recognize that it includes other categories, such as squares, rectangles, rhombuses, parallelograms, and trapezoids.
They also recognize that there are quadrilaterals that are not in any of those subcategories.

Mathematics
OA = Operations and Algebraic Thinking NBT= Numbers and Operations in Base Ten NF= Numbers and Operations – Fractions
MD= Measurement and Data G= Geometry
4.G.3 Recognize a line of symmetry for a two-
dimensional figure as a line across the figure such that the
figure can be folded along the line into matching parts.
Identify line-symmetric figures and draw lines of
symmetry.
Students need experiences with figures which are symmetrical and non-symmetrical. Figures include both regular
and non-regular polygons. Folding cut-out figures will help students determine whether a figure has one or more
lines of symmetry. This standard only includes line symmetry not rotational symmetry.
Grade 4 Unit 6: Extending Multiplication and Division (~4 weeks)
Unit Overview: This unit builds off of the multiplication and division skills and concepts developed in Unit 2. As students solidify their multi-digit multiplication
skills and place value understanding, they begin to apply these concepts to multi-digit division. When working on division, students should solve challenging
problems including fraction and area problems that involve customary measurements (inches and feet, etc.) and the interpretation of other real-life data. Students
will be challenged to make sense of problems and persevere in solving them (MP 1) as they apply previous learning to more challenging contexts.

Mathematics
OA = Operations and Algebraic Thinking NBT= Numbers and Operations in Base Ten NF= Numbers and Operations – Fractions
MD= Measurement and Data G= Geometry
Guiding Question: How can you prove the relationship of multidigit multiplication and division?
The student will be able to: The teacher will use appropriate instructional strategies/approaches based on the needs of the student.
Component Cluster 4.OA Use the four operations with whole numbers to solve problems.
4.OA.3 Solve multistep word problems posed with whole
numbers and having whole number answers using the four
operations, including problems in which remainders must
be interpreted. Represent these problems using equations
with a letter standing for the unknown quantity. Assess
the reasonableness of answers using mental computation
and estimation strategies including rounding.
See Unit 1.
Component Cluster 4.NBT Use place value understanding and properties of operations to perform multi-digit arithmetic..
4.NBT.5 Multiply a whole number of up to four digits by
a one-digit whole number, and multiply two two-digit
numbers, using strategies based on place value and the
properties of operations. Illustrate and explain the
calculation by using equations, rectangular arrays, and/or
area models.
See Unit 2.
4.NBT.6 Find whole-number quotients and remainders
with up to four-digit dividends and one-digit divisors,
using strategies based on place value, the properties of
operations, and/or the relationship between multiplication
and division. Illustrate and explain the calculation by
using equations, rectangular arrays, and/or area models.
See Unit 2.
Component Cluster 4.MD Solve problems involving measurement and conversion of measurements from a larger unit to a smaller unit.
4.MD.3 Apply the area and perimeter formulas for
rectangles in real world and mathematical problems.
For example, find the width of a rectangular room given
the area of the flooring and the length, by viewing the
area formula as a multiplication equation with an
unknown factor.
See Unit 2.
Component Cluster 4.MD Represent and interpret data.
4.MD.4 Make a line plot to display a data set of
measurements in fractions of a unit (1/2, 1/4, 1/8). Solve
problems involving addition and subtraction of fractions
by using information presented in line plots.
This standard provides a context for students to work with fractions by measuring objects to an eighth of an inch.
Students are making a line plot of this data and then adding and subtracting fractions based on data in the line plot.

Mathematics
OA = Operations and Algebraic Thinking NBT= Numbers and Operations in Base Ten NF= Numbers and Operations – Fractions
MD= Measurement and Data G= Geometry
For example, from a line plot find and interpret the
difference in length between the longest and shortest
specimens in an insect collection.
Grade 4 Unit 7: Patterns and More Challenging Problems (~4 weeks)
Unit Overview: The year ends with both a review and extension of ideas learned throughout the year. Students will apply algebraic thinking to create general
rules to describe shape and number sequences. They will also continue to work on representing multi-step story problems with equations and variables. Finally,
students will have the opportunity to extend their multiplication strategies to larger numbers and to explore the standard algorithm as a potentially useful strategy

Mathematics
OA = Operations and Algebraic Thinking NBT= Numbers and Operations in Base Ten NF= Numbers and Operations – Fractions
MD= Measurement and Data G= Geometry
in solving some problems. Students will be challenged to make sense of problems and persevere in solving them (MP 1) as they apply previous learning to more
challenging contexts.
Guiding Question: What is the connection between the array model and multi-digit multiplication?
The student will be able to: The teacher will use appropriate instructional strategies/approaches based on the needs of the student.
Component Cluster 4.OA Use the four operations with whole numbers to solve problems.
4.OA.2 Multiply or divide to solve word problems
involving multiplicative comparison, e.g., by using
drawings and equations with a symbol for the unknown
number to represent the problem, distinguishing
multiplicative comparison from additive comparison.*
* See Glossary, Table 2.
See Unit 1.
4.OA.3 Solve multistep word problems posed with whole
numbers and having whole number answers using the four
operations, including problems in which remainders must
be interpreted. Represent these problems using equations
with a letter standing for the unknown quantity. Assess
the reasonableness of answers using mental computation
and estimation strategies including rounding.
See Unit 1.
Component Cluster 4.OA Generate and analyze patterns.
4.OA.5 Generate a number or shape pattern that follows a
given rule. Identify apparent features of the pattern that
were not explicit in the rule itself. For example, given the
rule “Add 3” and the starting number 1, generate terms
in the resulting sequence and observe that the terms
appear to alternate between odd and even numbers.
Explain informally why the numbers will continue to
alternate in this way.
Patterns involving numbers or symbols either repeat or grow. Students need multiple opportunities creating and
extending number and shape patterns. Numerical patterns allow students to reinforce facts and develop fluency
with operations.
Patterns and rules are related. A pattern is a sequence that repeats the same process over and over. A rule dictates
what that process will look like. Students investigate different patterns to find rules, identify features in the
patterns, and justify the reason for those features.
After students have identified rules and features from patterns, they need to generate a numerical or shape pattern
from a given rule.
This standard calls for students to describe features of an arithmetic number pattern or shape pattern by identifying
the rule, and features that are not explicit in the rule. A t-chart is a tool to help students see number patterns.
This standard begins with a small focus on reasoning about a number or shape pattern, connecting a rule for a given
pattern with its sequence of numbers or shapes. Patterns that consist of repeated sequences of shapes or growing
sequences of designs can be appropriate for the grade. For example, students could examine a sequence of dot
designs in which each design has 4 more dots than the previous one and they could reason about how the dots are
organized in the design to determine the total number of dots in the 100th design. In examining numerical
sequences, fourth graders can explore rules of repeatedly adding the same whole number or repeatedly multiplying
by the same whole number. Properties of repeating patterns of shapes can be explored with division. For example,

Mathematics
OA = Operations and Algebraic Thinking NBT= Numbers and Operations in Base Ten NF= Numbers and Operations – Fractions
MD= Measurement and Data G= Geometry
to determine the 100th shape in a pattern that consists of repetitions of the sequence “square, circle, triangle,” the
fact that when we divide 100 by 3 the whole number quotient is 33 with remainder 1 tells us that after 33 full
repeats, the 99th shape will be a triangle (the last shape in the repeating pattern), so the 100th shape is the first
shape in the pattern, which is a square. Notice that the Standards do not require students to infer or guess the
underlying rule for a pattern, but rather ask them to generate a pattern from a given rule and identify features of the
given pattern. (Progressions for the CCSSM; Operations and Algebraic Thinking , CCSS Writing Team, May
2011, page 31)
Component Cluster 4.NBT Use place value understanding and properties of operations to perform multi-digit arithmetic.
4.NBT.5 Multiply a whole number of up to four digits by
a one-digit whole number, and multiply two two-digit
numbers, using strategies based on place value and the
properties of operations. Illustrate and explain the
calculation by using equations, rectangular arrays, and/or
area models.
See Unit 2.
Component Cluster 4.MD Solve problems involving measurement and conversion of measurements from a larger unit to a smaller unit.
4.MD.1 Know relative sizes of measurement units within
one system of units including km, m, cm; kg, g; lb, oz.; l,
ml; hr, min, sec. Within a single system of measurement,
express measurements in a larger unit in terms of a
smaller unit. Record measurement equivalents in a two-
column table.
For example, know that 1 ft is 12 times as long as 1 in.
Express the length of a 4 ft snake as 48 in. Generate a
conversion table for feet and inches listing the number
pairs (1, 12), (2, 24), (3, 36), ...
See Unit 1.
4.MD.2 Use the four operations to solve word problems
involving distances, intervals of time, liquid volumes,
masses of objects, and money, including problems
involving simple fractions or decimals, and problems that
require expressing measurements given in a larger unit in
terms of a smaller unit. Represent measurement quantities
using diagrams such as number line diagrams that feature
a measurement scale.
This standard includes multi-step word problems related to expressing measurements from a larger unit
in terms of a smaller unit (e.g., feet to inches, meters to centimeter, and dollars to cents). Students should
have ample opportunities to use number line diagrams to solve word problems.

Mathematics
OA = Operations and Algebraic Thinking NBT= Numbers and Operations in Base Ten NF= Numbers and Operations – Fractions
MD= Measurement and Data G= Geometry
Grade 4 Unit 8: Culminating Unit: Challenge and Application (~4 weeks)
Unit Overview: The focus of unit 8 is to provide students with engaging opportunities to apply their learning from the year. They will have time to
deepen their understandings, correct misconceptions, solidify procedural strategies, and apply their skills in real-life contexts. During this unit,
students should make sense of problems and persevere in solving them (MP1) as they employ all of their math concepts and skills from the year in
meaningful contexts.
Guiding Question: How will you use the math you have learned in 4th grade to investigate and solve problems over the course of the summer?
CONTINUE WORK WITH ALL GRADE LEVEL STANDARDS.

Mathematics
OA = Operations and Algebraic Thinking NBT= Numbers and Operations in Base Ten NF= Numbers and Operations – Fractions
MD= Measurement and Data G= Geometry
Grade 5 In Grade 5, instructional time should focus on three critical areas: (1) developing fluency with addition and subtraction of fractions, and developing
understanding of the multiplication of fractions and of division of fractions in limited cases (unit fractions divided by whole numbers and whole
numbers divided by unit fractions); (2) extending division to 2-digit divisors, integrating decimal fractions into the place value system and
developing understanding of operations with decimals to hundredths, and developing fluency with whole number and decimal operations; and (3)
developing understanding of volume.
(1) Students apply their understanding of fractions and fraction models to represent the addition and subtraction of fractions with unlike
denominators as equivalent calculations with like denominators. They develop fluency in calculating sums and differences of fractions, and
make reasonable estimates of them. Students also use the meaning of fractions, of multiplication and division, and the relationship between
multiplication and division to understand and explain why the procedures for multiplying and dividing fractions make sense. (Note: this is
limited to the case of dividing unit fractions by whole numbers and whole numbers by unit fractions.)
(2) Students develop understanding of why division procedures work based on the meaning of base-ten numerals and properties of operations.
They finalize fluency with multi-digit addition, subtraction, multiplication, and division. They apply their understandings of models for
decimals, decimal notation, and properties of operations to add and subtract decimals to hundredths. They develop fluency in these
computations, and make reasonable estimates of their results. Students use the relationship between decimals and fractions, as well as the
relationship between finite decimals and whole numbers (i.e., a finite decimal multiplied by an appropriate power of 10 is a whole number), to
understand and explain why the procedures for multiplying and dividing finite decimals make sense. They compute products and quotients of
decimals to hundredths efficiently and accurately.
(3) Students recognize volume as an attribute of three-dimensional space. They understand that volume can be measured by finding the total
number of same-size units of volume required to fill the space without gaps or overlaps. They understand that a 1-unit by 1-unit by 1-unit
cube is the standard unit for measuring volume. They select appropriate units, strategies, and tools for solving problems that involve
estimating and measuring volume. They decompose three-dimensional shapes and find volumes of right rectangular prisms by viewing them
as decomposed into layers of arrays of cubes. They measure necessary attributes of shapes in order to determine volumes to solve real world
and mathematical problems.
Mathematical Practices
1. Make sense of problems and persevere in solving them.
2. Reason abstractly and quantitatively.
3. Construct viable arguments and critique the reasoning of others.
4. Model with mathematics.
5. Use appropriate tools strategically.
6. Attend to precision.
7. Look for and make use of structure.
8. Look for and express regularity in repeated reasoning.

Mathematics
OA = Operations and Algebraic Thinking NBT= Numbers and Operations in Base Ten NF= Numbers and Operations – Fractions
MD= Measurement and Data G= Geometry
Grade 5: Suggested Distribution of Units in Instructional Days Time Approx.
# of weeks
Unit 1: Developing Concepts and Contexts for Multiplication and Division 12.5% ~ 4 Weeks
Unit 2: Addition and Subtraction of Fractions with Fraction Concepts 12.5% ~ 4 Weeks
Unit 3: Whole Number and Decimal Place Value 12.5% ~ 4 Weeks
Unit 4: Multiplication and Division of Whole Numbers and Decimals 12.5% ~ 4 Weeks
Unit 5: Multiplication and Division of Fractions 12.5% ~ 4 Weeks
Unit 6: Graphing, Geometry and Volume 12.5% ~ 4 Weeks
Unit 7: Division and Decimals 12.5% ~4 weeks
Unit 8: Culminating Unit: Challenge and Application 12.5% ~4 weeks
Instructional
Focus of Unit:
Operations and
Algebraic Thinking Number Fractions
Measurement
and Data Geometry Application
Unit 1: Concepts and Contexts for
Mult. and Div.12.5%
Unit 2: +/- of Fractions
12.5%
Unit 3: Whole Number and Decimal P.V.
12.5%Unit 4: Mult and Div of
Whole Num. and Decimals
12.5%
Unit 5: Multiplication
and Div. of Fractions
12.5%
Unit 6: Graphing, Geo,
and Volume12.5%
Unit 7: Div and Decimals
12.5%
Unit 8: Culminating
Unit12.5%
Instructional Time

Mathematics
OA = Operations and Algebraic Thinking NBT= Numbers and Operations in Base Ten NF= Numbers and Operations – Fractions
MD= Measurement and Data G= Geometry
Grade 5 Unit 1: Developing Concepts and Contexts for Multiplication and Division (~ 4 weeks)
Unit Overview: Students come to 5th grade with a foundational understanding of a host of skills and concepts related to multiplication. This unit reviews,
solidifies, and expands those skills through explorations of the associative and commutative properties, uses of parentheses in expressions, the concept of volume,
multi-digit multiplication models and strategies, and the relationship between multiplication and division. This unit provides students with the opportunity to look
for and make use of structure (MP 7) as they explore and explain the concept of multiplication.
Guiding Question: How does the relationship between multiplication and division help to solve problems mentally?
The student will be able to: The teacher will use appropriate instructional strategies/approaches based on the needs of the student.
Component Cluster 5.OA Write and interpret numerical expressions.
5.OA.1 Use parentheses, brackets, or braces in
numerical expressions, and evaluate expressions
with these symbols.
The order of operations is introduced in third grade and is continued in fourth. This standard calls for
students to evaluate expressions with parentheses ( ), brackets [ ] and braces { }. In upper levels of
mathematics, evaluate means to substitute for a variable and simplify the expression. However at this
level students are to only simplify the expressions because there are no variables.
This standard builds on the expectations of third grade where students are expected to start learning the
conventional order. Students need experiences with multiple expressions that use grouping symbols
throughout the year to develop understanding of when and how to use parentheses, brackets, and braces.
First, students use these symbols with whole numbers. Then the symbols can be used as students add,
subtract, multiply and divide decimals and fractions.
To further develop students’ understanding of grouping symbols and facility with operations, students
place grouping symbols in equations to make the equations true or they compare expressions that are
grouped differently.
In fifth grade students begin working more formally with expressions. They write expressions to express
a calculation, e.g., writing 2 x (8 + 7) to express the calculation “add 8 and 7, then multiply by 2.” They
also evaluate and interpret expressions, e.g., using their conceptual understanding of multiplication to
interpret 3 x (18932 x 921) as being three times as large as 18932 + 921, without having to calculate the
indicated sum or product. Thus, students in Grade 5 begin to think about numerical expressions in ways
that prefigure their later work with variable expressions (e.g., three times an unknown length is 3 . L). In
Grade 5, this work should be viewed as exploratory rather than for attaining mastery; for example,
expressions should not contain nested grouping symbols, and they should be no more complex than the
expressions one finds in an application of the associative or distributive property, e.g., (8 + 27) + 2 or (6
x 30) (6 x 7). Note however that the numbers in expressions need not always be whole numbers.
5.OA.2 Write simple expressions that record
calculations with numbers, and interpret numerical
expressions without evaluating them.
This standard refers to expressions. Expressions are a series of numbers and symbols (+, -, x, ÷) without
an equals sign. Equations result when two expressions are set equal to each other (2 + 3 = 4 + 1).
This standard calls for students to verbally describe the relationship between expressions without
actually calculating them. This standard calls for students to apply their reasoning of the four operations
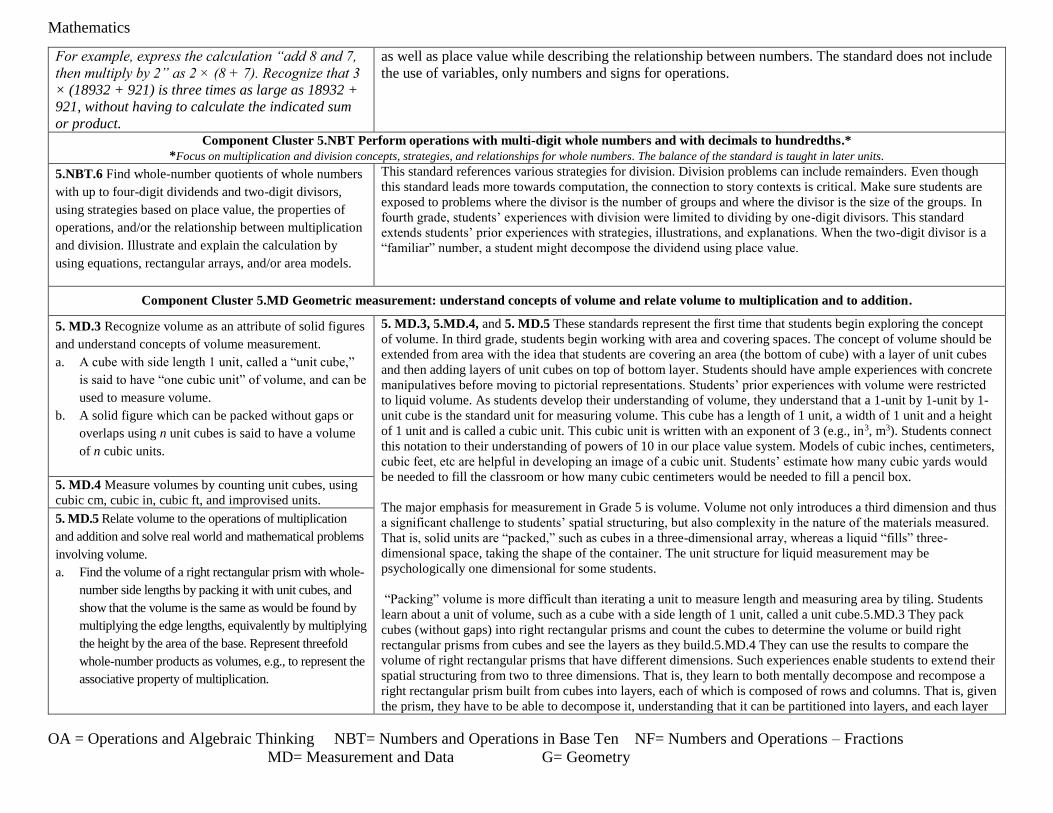
Mathematics
OA = Operations and Algebraic Thinking NBT= Numbers and Operations in Base Ten NF= Numbers and Operations – Fractions
MD= Measurement and Data G= Geometry
For example, express the calculation “add 8 and 7,
then multiply by 2” as 2 × (8 + 7). Recognize that 3
× (18932 + 921) is three times as large as 18932 +
921, without having to calculate the indicated sum
or product.
as well as place value while describing the relationship between numbers. The standard does not include
the use of variables, only numbers and signs for operations.
Component Cluster 5.NBT Perform operations with multi-digit whole numbers and with decimals to hundredths.*
*Focus on multiplication and division concepts, strategies, and relationships for whole numbers. The balance of the standard is taught in later units.
5.NBT.6 Find whole-number quotients of whole numbers
with up to four-digit dividends and two-digit divisors,
using strategies based on place value, the properties of
operations, and/or the relationship between multiplication
and division. Illustrate and explain the calculation by
using equations, rectangular arrays, and/or area models.
This standard references various strategies for division. Division problems can include remainders. Even though
this standard leads more towards computation, the connection to story contexts is critical. Make sure students are
exposed to problems where the divisor is the number of groups and where the divisor is the size of the groups. In
fourth grade, students’ experiences with division were limited to dividing by one-digit divisors. This standard
extends students’ prior experiences with strategies, illustrations, and explanations. When the two-digit divisor is a
“familiar” number, a student might decompose the dividend using place value.
Component Cluster 5.MD Geometric measurement: understand concepts of volume and relate volume to multiplication and to addition.
5. MD.3 Recognize volume as an attribute of solid figures
and understand concepts of volume measurement.
a. A cube with side length 1 unit, called a “unit cube,”
is said to have “one cubic unit” of volume, and can be
used to measure volume.
b. A solid figure which can be packed without gaps or
overlaps using n unit cubes is said to have a volume
of n cubic units.
5. MD.3, 5.MD.4, and 5. MD.5 These standards represent the first time that students begin exploring the concept
of volume. In third grade, students begin working with area and covering spaces. The concept of volume should be
extended from area with the idea that students are covering an area (the bottom of cube) with a layer of unit cubes
and then adding layers of unit cubes on top of bottom layer. Students should have ample experiences with concrete
manipulatives before moving to pictorial representations. Students’ prior experiences with volume were restricted
to liquid volume. As students develop their understanding of volume, they understand that a 1-unit by 1-unit by 1-
unit cube is the standard unit for measuring volume. This cube has a length of 1 unit, a width of 1 unit and a height
of 1 unit and is called a cubic unit. This cubic unit is written with an exponent of 3 (e.g., in3, m3). Students connect
this notation to their understanding of powers of 10 in our place value system. Models of cubic inches, centimeters,
cubic feet, etc are helpful in developing an image of a cubic unit. Students’ estimate how many cubic yards would
be needed to fill the classroom or how many cubic centimeters would be needed to fill a pencil box.
The major emphasis for measurement in Grade 5 is volume. Volume not only introduces a third dimension and thus
a significant challenge to students’ spatial structuring, but also complexity in the nature of the materials measured.
That is, solid units are “packed,” such as cubes in a three-dimensional array, whereas a liquid “fills” three-
dimensional space, taking the shape of the container. The unit structure for liquid measurement may be
psychologically one dimensional for some students.
“Packing” volume is more difficult than iterating a unit to measure length and measuring area by tiling. Students
learn about a unit of volume, such as a cube with a side length of 1 unit, called a unit cube.5.MD.3 They pack
cubes (without gaps) into right rectangular prisms and count the cubes to determine the volume or build right
rectangular prisms from cubes and see the layers as they build.5.MD.4 They can use the results to compare the
volume of right rectangular prisms that have different dimensions. Such experiences enable students to extend their
spatial structuring from two to three dimensions. That is, they learn to both mentally decompose and recompose a
right rectangular prism built from cubes into layers, each of which is composed of rows and columns. That is, given
the prism, they have to be able to decompose it, understanding that it can be partitioned into layers, and each layer
5. MD.4 Measure volumes by counting unit cubes, using
cubic cm, cubic in, cubic ft, and improvised units.
5. MD.5 Relate volume to the operations of multiplication
and addition and solve real world and mathematical problems
involving volume.
a. Find the volume of a right rectangular prism with whole-
number side lengths by packing it with unit cubes, and
show that the volume is the same as would be found by
multiplying the edge lengths, equivalently by multiplying
the height by the area of the base. Represent threefold
whole-number products as volumes, e.g., to represent the
associative property of multiplication.

Mathematics
OA = Operations and Algebraic Thinking NBT= Numbers and Operations in Base Ten NF= Numbers and Operations – Fractions
MD= Measurement and Data G= Geometry
partitioned into rows, and each row into cubes. They also have to be able to compose such as structure,
multiplicatively, back into higher units. That is, they eventually learn to conceptualize a layer as a unit that itself is
composed of units of units—rows, each row composed of individual cubes—and they iterate that structure. Thus,
they might predict the number of cubes that will be needed to fill a box given the net of the box.
Another complexity of volume is the connection between “packing” and “filling.” Often, for example, students will
respond that a box can be filled with 24 centimeter cubes, or build a structure of 24 cubes, and still think of the 24
as individual, often discrete, not necessarily units of volume. They may, for example, not respond confidently and
correctly when asked to fill a graduated cylinder marked in cubic centimeters with the amount of liquid that would
fill the box. That is, they have not yet connected their ideas about filling volume with those concerning packing
volume. Students learn to move between these conceptions, e.g., using the same container, both filling (from a
graduated cylinder marked in ml or cc) and packing (with cubes that are each 1 cm3). Comparing and discussing the
volume-units and what they represent can help students learn a general, complete, and interconnected
conceptualization of volume as filling three-dimensional space.
Students then learn to determine the volumes of several right rectangular prisms, using cubic centimeters, cubic
inches, and cubic feet. With guidance, they learn to increasingly apply multiplicative reasoning to determine
volumes, looking for and making use of structure. That is, they understand that multiplying the length times the
width of a right rectangular prism can be viewed as determining how many cubes would be in each layer if the
prism were packed with or built up from unit cubes.5.MD.5a They also learn that the height of the prism tells how
many layers would fit in the prism. That is, they understand that volume is a derived attribute that, once a length
unit is specified, can be computed as the product of three length measurements or as the product of one area and
one length measurement.

Mathematics
OA = Operations and Algebraic Thinking NBT= Numbers and Operations in Base Ten NF= Numbers and Operations – Fractions
MD= Measurement and Data G= Geometry
Grade 5 Unit 2: Addition and Subtraction of Fractions with Fraction Concepts (~ 4 weeks)
Unit Overview: In this unit, students add and subtract fractions with unlike denominators using a variety of strategies to find common denominators. Students
should have experience with a variety of models, such as clocks, money, area, and number lines, and a variety of real-life contexts as they solidify their fraction
understanding and develop explicit skills related to finding common denominators, greatest common factors, and least common multiples as they solve and
simplify fraction problems. Students will have the opportunity to select tools appropriately (MP 5) as they choose a fraction model to help them reason about
specific problems.
Guiding Question: What visual models and strategies help to make sense of fraction problems and prove your answers to others?
The student will be able to: The teacher will use appropriate instructional strategies/approaches based on the needs of the student.
Component Cluster 5.NF Use equivalent fractions as a strategy to add and subtract fractions.
5.NF.1 Add and subtract fractions with unlike
denominators (including mixed numbers) by replacing
given fractions with equivalent fractions in such a way as
to produce an equivalent sum or difference of fractions
with like denominators.
For example, 2/3 + 5/4 = 8/12 + 15/12 = 23/12. (In
general, a/b + c/d = (ad + bc)/bd.)
This standard builds on the work in fourth grade where students add fractions with like denominators. In fifth grade, the
example provided in the standard 2/3 + ¾ has students find a common denominator by finding the product of both
denominators. This process should come after students have used visual fraction models (area models, number lines, etc.)
to build understanding before moving into the standard algorithm described in the standard The use of these visual fraction
models allows students to use reasonableness to find a common denominator prior to using the algorithm.
Students should apply their understanding of equivalent fractions and their ability to rewrite fractions in an
equivalent form to find common denominators. They should know that multiplying the denominators will always
give a common denominator but may not result in the smallest denominator.
Fifth grade students will need to express both fractions in terms of a new denominator with adding unlike
denominators. It is not necessary to find a least common denominator to calculate sums of fractions, and in fact the
effort of finding a least common denominator is a distraction from understanding adding fractions.
5.NF.2 Solve word problems involving addition and
subtraction of fractions referring to the same whole,
including cases of unlike denominators, e.g., by using
visual fraction models or equations to represent the
problem. Use benchmark fractions and number sense of
fractions to estimate mentally and assess the
reasonableness of answers. For example, recognize an
incorrect result 2/5 + 1/2 = 3/7, by observing that 3/7 <
1/2.
This standard refers to number sense, which means students’ understanding of fractions as numbers that lie
between whole numbers on a number line. Number sense in fractions also includes moving between decimals and
fractions to find equivalents, also being able to use reasoning such as 7/8 is greater than ¾ because 7/8 is missing
only 1/8 and ¾ is missing ¼ so 7/8 is closer to a whole Also, students should use benchmark fractions to estimate
and examine the reasonableness of their answers. Example here such as 5/8 is greater than 6/10 because 5/8 is 1/8
larger than ½(4/8) and 6/10 is only 1/10 larger than ½ (5/10)
Students make sense of fractional quantities when solving word problems, estimating answers mentally to see if
they make sense. Estimation skills include identifying when estimation is appropriate, determining the level of
accuracy needed, selecting the appropriate method of estimation, and verifying solutions or determining the
reasonableness of situations using various estimation strategies. Estimation strategies for calculations with fractions
extend from students’ work with whole number operations and can be supported through the use of physical
models.
Component Cluster 5.NF Apply and extend previous understandings of multiplication and division to multiply and divide fractions.* *Instruction of this standard continues in later units.

Mathematics
OA = Operations and Algebraic Thinking NBT= Numbers and Operations in Base Ten NF= Numbers and Operations – Fractions
MD= Measurement and Data G= Geometry
5.NF.3 Interpret a fraction as division of the numerator by
the denominator (a/b = a ÷ b). Solve word problems
involving division of whole numbers leading to answers
in the form of fractions or mixed numbers, e.g., by using
visual fraction models or equations to represent the
problem.
For example, interpret 3/4 as the result of dividing 3 by 4,
noting that 3/4 multiplied by 4 equals 3, and that when 3
wholes are shared equally among 4 people each person
has a share of size 3/4. If 9 people want to share a 50-
pound sack of rice equally by weight, how many pounds
of rice should each person get? Between what two whole
numbers does your answer lie?
Fifth grade student should connect fractions with division, understanding that 5 ÷ 3 = 5/3
Students should explain this by working with their understanding of division as equal sharing.
Students should also create story contexts to represent problems involving division of whole numbers.
This standard calls for students to extend their work of partitioning a number line from third and fourth grade.
Students need ample experiences to explore the concept that a fraction is a way to represent the division of two
quantities.
Students are expected to demonstrate their understanding using concrete materials, drawing models, and explaining
their thinking when working with fractions in multiple contexts. They read 3/5 as “three fifths” and after many
experiences with sharing problems, learn that 3/5 can also be interpreted as “3 divided by 5.”
Component Cluster 5.NF Apply and extend previous understandings of multiplication and division to multiply and divide fractions. *Instruction of this standard continues in later units.
5.NF.4 Apply and extend previous understandings of
multiplication to multiply a fraction or whole number by a
fraction.
a. Interpret the product (a/b) × q as a parts of a partition
of q into b equal parts; equivalently, as the result of a
sequence of operations a × q ÷ b.
For example, use a visual fraction model to show
(2/3) × 4 = 8/3, and create a story context for this
equation. Do the same with (2/3) × (4/5) = 8/15. (In
general, (a/b) × (c/d) = ac/bd.)
Students need to develop a fundamental understanding that the multiplication of a fraction by a whole number
could be represented as repeated addition of a unit fraction (e.g., 2 x (1/4) = 1/4 + ¼
This standard extends student’s work of multiplication from earlier grades. In fourth grade, students worked with
recognizing that a fraction such as 3/5 actually could be represented as 3 pieces that are each one-fifth (3 x (1/5)).
This standard references both the multiplication of a fraction by a whole number and the multiplication of two
fractions. Visual fraction models (area models, tape diagrams, number lines) should be used and created by
students during their work with this standard.

Mathematics
OA = Operations and Algebraic Thinking NBT= Numbers and Operations in Base Ten NF= Numbers and Operations – Fractions
MD= Measurement and Data G= Geometry
Grade 5 Unit 3: Whole Number and Decimal Place Value (~ 4 weeks)
Unit Overview: In this unit, students study skills and concepts related to place value, from reading, writing, and comparing decimals to rounding and examining
decimal patterns of multiplying and dividing numbers by 10. Students use their place value understanding to convert within a measurement system, and they use
both whole number strategies and place value understanding to add and subtract decimals to hundredths. This unit provides students with the opportunity to look
for and make use of structure (MP 7) as they explore and explain the expanding number system.
Guiding Question: How does changing the place of a number change its value?
The student will be able to: The teacher will use appropriate instructional strategies/approaches based on the needs of the student.
Component Cluster 5.NBT Understand the place value system.
5.NBT.1 Recognize that in a multi-digit number, a digit in
one place represents 10 times as much as it represents in
the place to its right and 1/10 of what it represents in the
place to its left.
Students extend their understanding of the base-ten system to the relationship between adjacent places, how
numbers compare, and how numbers round for decimals to thousandths. This standard calls for students to reason
about the magnitude of numbers. Students should work with the idea that the tens place is ten times as much as the
ones place, and the ones place is 1/10th the size of the tens place.
In fourth grade, students examined the relationships of the digits in numbers for whole numbers only. This standard
extends this understanding to the relationship of decimal fractions. Students use base ten blocks, pictures of base
ten blocks, and interactive images of base ten blocks to manipulate and investigate the place value relationships.
They use their understanding of unit fractions to compare decimal places and fractional language to describe those
comparisons.
Before considering the relationship of decimal fractions, students express their understanding that in multi-digit
whole numbers, a digit in one place represents 10 times what it represents in the place to its right and 1/10 of what
it represents in the place to its left.
5.NBT.2 Explain patterns in the number of zeros of the
product when multiplying a number by powers of 10, and
explain patterns in the placement of the decimal point
when a decimal is multiplied or divided by a power of 10.
Use whole-number exponents to denote powers of 10.
New at Grade 5 is the use of whole number exponents to denote powers of 10. Students understand why
multiplying by a power of 10 shifts the digits of a whole number or decimal that many places to the left. Patterns in
the number of 0s in products of a whole numbers and a power of 10 and the location of the decimal point in
products of decimals with powers of 10 can be explained in terms of place value. Because students have developed
their understandings of and computations with decimals in terms of multiples rather than powers, connecting the
terminology of multiples with that of powers affords connections between understanding of multiplication and
exponentiation. (Progressions for the CCSSM, Number and Operation in Base Ten, CCSS Writing Team, April
2011, page 16)3
5+
5
10=
6
10+
5
10=
11
10
This standard includes multiplying by multiples of 10 and powers of 10, including 102 which is 10 x 10=100, and
103 which is 10 x 10 x 10=1,000. Students should have experiences working with connecting the pattern of the
number of zeros in the product when you multiply by powers of 10. Students need to be provided with
opportunities to explore this concept and come to this understanding; this should not just be taught procedurally.
5.NBT.3 Read, write, and compare decimals to
thousandths.
a. Read and write decimals to thousandths using base-
ten numerals, number names, and expanded form,
This standard references expanded form of decimals with fractions included. Students should build on their work
from Fourth Grade, where they worked with both decimals and fractions interchangeably. Expanded form is
included to build upon work in 5.NBT.2 and deepen students’ understanding of place value.
Students build on the understanding they developed in fourth grade to read, write, and compare decimals to
thousandths. They connect their prior experiences with using decimal notation for fractions and addition of
fractions with denominators of 10 and 100. They use concrete models and number lines to extend this

Mathematics
OA = Operations and Algebraic Thinking NBT= Numbers and Operations in Base Ten NF= Numbers and Operations – Fractions
MD= Measurement and Data G= Geometry
e.g., 347.392 = 3 × 100 + 4 × 10 + 7 × 1 + 3 × (1/10)
+ 9 x (1/100) + 2 x (1/1000)
b. Compare two decimals to thousandths based on
meanings of the digits in each place, using >, =, and
< symbols to record the results of comparisons.
understanding to decimals to the thousandths. Models may include base ten blocks, place value charts, grids,
pictures, drawings, manipulatives, technology-based, etc. They read decimals using fractional language and write
decimals in fractional form, as well as in expanded notation. This investigation leads them to understanding
equivalence of decimals (0.8 = 0.80 = 0.800).
Comparing decimals builds on work from fourth grade. Students need to understand the size of decimal numbers
and relate them to common benchmarks such as 0, 0.5 (0.50 and 0.500), and 1. Comparing tenths to tenths,
hundredths to hundredths, and thousandths to thousandths is simplified if students use their understanding of
fractions to compare decimals.
5.NBT.4 Use place value understanding to round
decimals to any place.
This standard refers to rounding. Students should go beyond simply applying an algorithm or procedure for
rounding. The expectation is that students have a deep understanding of place value and number sense and can
explain and reason about the answers they get when they round. Students should have numerous experiences using
a number line to support their work with rounding. Students should use benchmark numbers to support this work.
Benchmarks are convenient numbers for comparing and rounding numbers. 0., 0.5, 1, 1.5 are examples of
benchmark numbers.
Component Cluster 5.NBT Perform operations with multi-digit whole numbers and with decimals to hundredths.*
*Focus on decimal addition and subtraction.
5.NBT.7 Add, subtract, multiply, and divide decimals to
hundredths, using concrete models or drawings and
strategies based on place value, properties of operations,
and/or the relationship between addition and subtraction;
relate the strategy to a written method and explain the
reasoning used.
This standard builds on the work from fourth grade where students are introduced to decimals and compare them.
In fifth grade, students begin adding, subtracting, multiplying and dividing decimals. This work should focus on
concrete models and pictorial representations, rather than relying solely on the algorithm. The use of symbolic
notations involves having students record the answers to computations (2.25 x 3= 6.75), but this work should not be
done without models or pictures. This standard includes students’ reasoning and explanations of how they use
models, pictures, and strategies.
This standard requires students to extend the models and strategies they developed for whole numbers in grades 1-4
to decimal values. Before students are asked to give exact answers, they should estimate answers based on their
understanding of operations and the value of the numbers.
Students should be able to express that when they add decimals they add tenths to tenths and hundredths to
hundredths. So, when they are adding in a vertical format (numbers beneath each other), it is important that they
write numbers with the same place value beneath each other. This understanding can be reinforced by connecting
addition of decimals to their understanding of addition of fractions. Adding fractions with denominators of 10 and
100 is a standard in fourth grade.
Component Cluster 5.MD Convert like measurement units within a given measurement system.* *The focus of this unit is on the metric system to reinforce place value.
5.MD.1 Convert among different-sized standard
measurement units within a given measurement system
(e.g., convert 5 cm to 0.05 m), and use these conversions
in solving multi-step, real world problems.
This standard calls for students to convert measurements within the same system of measurement in the context of
multi-step, real-world problems. Both customary and standard measurement systems are included; students worked
with both metric and customary units of length in second grade. In third grade, students work with metric units of
mass and liquid volume. In fourth grade, students work with both systems and begin conversions within systems in
length, mass and volume.
Students should explore how the base-ten system supports conversions within the metric system.

Mathematics
OA = Operations and Algebraic Thinking NBT= Numbers and Operations in Base Ten NF= Numbers and Operations – Fractions
MD= Measurement and Data G= Geometry
Grade 5 Unit 4: Multiplication and Division of Whole Numbers and Decimals (~ 4 weeks)
Unit Overview: This unit builds on the previous work around multiplication and division strategies in order to learn the standard multiplication algorithm and a
version of the long division algorithm. Throughout the work toward fluency with the operations, students should have the opportunity to make meaningful
connections based on the relationship between multiplication and division and the relationships between fractions, decimals, and whole numbers in order to
develop strong number sense, estimation, and mental math skills. Learning the multiplication and division algorithms provides students with an opportunity to
reason abstractly and quantitatively (MP 2) as they utilize familiar models in conjunction with new faster algorithms in order to make sense of their problem-
solving (MP 1).
Guiding Question: What are the connections between the division and multiplication models from 4th grade and the new faster strategies of 5th grade?
The student will be able to: The teacher will use appropriate instructional strategies/approaches based on the needs of the student.
Component Cluster 5.NBT Perform operations with multi-digit whole numbers and with decimals to hundredths.
5.NBT.5 Fluently multiply multi-digit whole numbers
using the standard algorithm.
This standard refers to fluency which means accuracy (correct answer), efficiency (a reasonable amount of steps), and
flexibility (using strategies such as the distributive property or breaking numbers apart also using strategies according to the
numbers in the problem, 26 x 4 may lend itself to (25 x 4 ) + 4 where as another problem might lend itself to making an
equivalent problem 32 x 4 = 64 x 2)). This standard builds upon students’ work with multiplying numbers in third and
fourth grade. In fourth grade, students developed understanding of multiplication through using various strategies. While
the standard algorithm is mentioned, alternative strategies are also appropriate to help students develop conceptual
understanding. The size of the numbers should NOT exceed a three-digit factor by a two-digit factor.
5.NBT.6 Find whole-number quotients of whole numbers
with up to four-digit dividends and two-digit divisors,
using strategies based on place value, the properties of
operations, and/or the relationship between multiplication
and division. Illustrate and explain the calculation by
using equations, rectangular arrays, and/or area models.
This standard references various strategies for division. Division problems can include remainders. Even though
this standard leads more towards computation, the connection to story contexts is critical. Make sure students are
exposed to problems where the divisor is the number of groups and where the divisor is the size of the groups. In
fourth grade, students’ experiences with division were limited to dividing by one-digit divisors. This standard
extends students’ prior experiences with strategies, illustrations, and explanations. When the two-digit divisor is a
“familiar” number, a student might decompose the dividend using place value.
5.NBT.7 Add, subtract, multiply, and divide decimals to
hundredths, using concrete models or drawings and
strategies based on place value, properties of operations,
and/or the relationship between addition and subtraction;
relate the strategy to a written method and explain the
reasoning used.*
*This work will be continued in a later unit.
This standard builds on the work from fourth grade where students are introduced to decimals and compare them.
In fifth grade, students begin adding, subtracting, multiplying and dividing decimals. This work should focus on
concrete models and pictorial representations, rather than relying solely on the algorithm. The use of symbolic
notations involves having students record the answers to computations (2.25 x 3= 6.75), but this work should not be
done without models or pictures. This standard includes students’ reasoning and explanations of how they use
models, pictures, and strategies.
This standard requires students to extend the models and strategies they developed for whole numbers in grades 1-4
to decimal values. Before students are asked to give exact answers, they should estimate answers based on their
understanding of operations and the value of the numbers.
Students should be able to express that when they add decimals they add tenths to tenths and hundredths to
hundredths. So, when they are adding in a vertical format (numbers beneath each other), it is important that they
write numbers with the same place value beneath each other. This understanding can be reinforced by connecting
addition of decimals to their understanding of addition of fractions. Adding fractions with denominators of 10 and
100 is a standard in fourth grade.

Mathematics
OA = Operations and Algebraic Thinking NBT= Numbers and Operations in Base Ten NF= Numbers and Operations – Fractions
MD= Measurement and Data G= Geometry
Grade 5 Unit 5: Multiplication and Division of Fractions (~ 4 weeks)
Unit Overview: In Unit 5, students will extend their understanding of multiplication and division to working with fractions. Connections can be made to
foundational work from 4th grade related to whole number-by-fraction multiplication. Story problems and models, such as the rectangular array, should be used to
continue this work as students explore solving fraction-by-fraction multiplication problems as well as division of whole numbers by unit fractions and unit
fractions by whole numbers. Students have an opportunity to employ looking for and extending regularity in repeated reasoning (MP 8) as they look to make
generalizations about strategies for solving these problems.
Guiding Question: When do you use the context of a story problem during the solution process?
The student will be able to: The teacher will use appropriate instructional strategies/approaches based on the needs of the student.
Component Cluster 5.NF Apply and extend previous understandings of multiplication and division to multiply and divide fractions.
5.NF.4 Apply and extend previous understandings of
multiplication to multiply a fraction or whole number by a
fraction.
a. Interpret the product (a/b) × q as a parts of a
partition of q into b equal parts; equivalently, as
the result of a sequence of operations a × q ÷ b.
For example, use a visual fraction model to show (2/3)
× 4 = 8/3, and create a story context for this equation.
Do the same with (2/3) × (4/5) = 8/15. (In general,
(a/b) × (c/d) = ac/bd.)
b. Find the area of a rectangle with fractional side
lengths by tiling it with unit squares of the
appropriate unit fraction side lengths, and show
that the area is the same as would be found by
multiplying the side lengths. Multiply fractional
side lengths to find areas of rectangles, and
represent fraction products as rectangular areas.
Students need to develop a fundamental understanding that the multiplication of a fraction by a whole number could
be represented as repeated addition of a unit fraction (e.g., 2 x (1/4) = 1/4 + ¼
This standard extends student’s work of multiplication from earlier grades. In fourth grade, students worked with
recognizing that a fraction such as 3/5 actually could be represented as 3 pieces that are each one-fifth (3 x (1/5)).
This standard references both the multiplication of a fraction by a whole number and the multiplication of two
fractions. Visual fraction models (area models, tape diagrams, number lines) should be used and created by students
during their work with this standard.
This standard extends students’ work with area. In third grade students determine the area of rectangles and
composite rectangles. In fourth grade students continue this work. The fifth grade standard calls students to continue
the process of covering (with tiles). Grids can be used to support this work.

Mathematics
OA = Operations and Algebraic Thinking NBT= Numbers and Operations in Base Ten NF= Numbers and Operations – Fractions
MD= Measurement and Data G= Geometry
5.NF.5 Interpret multiplication as scaling (resizing), by:
a. Comparing the size of a product to the size of one
factor on the basis of the size of the other factor,
without performing the indicated multiplication.
b. Explaining why multiplying a given number by a
fraction greater than 1 results in a product greater than
the given number (recognizing multiplication by
whole numbers greater than 1 as a familiar case);
explaining why multiplying a given number by a
fraction less than 1 results in a product smaller than
the given number; and relating the principle of fraction
equivalence a/b = (n × a)/(n × b) to the effect of
multiplying a/b by 1.
This standard calls for students to examine the magnitude of products in terms of the relationship between two types
of problems. This extends the work with 5.OA.1.
This standard asks students to examine how numbers change when we multiply by fractions. Students should have
ample opportunities to examine both cases in the standard: a) when multiplying by a fraction greater than 1, the
number increases and b) when multiplying by a fraction less the one, the number decreases. This standard should be
explored and discussed while students are working with 5.NF.4, and should not be taught in isolation.
5.NF.6 Solve real world problems involving multiplication
of fractions and mixed numbers, e.g., by using visual
fraction models or equations to represent the problem.
This standard builds on all of the work done in this cluster. Students should be given ample opportunities to use
various strategies to solve word problems involving the multiplication of a fraction by a mixed number. This
standard could include fraction by a fraction, fraction by a mixed number or mixed number by a mixed number.
5.NF.7 Apply and extend previous understandings of
division to divide unit fractions by whole numbers and
whole numbers by unit fractions.1
a. Interpret division of a unit fraction by a non-zero
whole number, and compute such quotients.
For example, create a story context for (1/3) ÷ 4, and
use a visual fraction model to show the quotient. Use
the relationship between multiplication and division to
explain that (1/3) ÷ 4 = 1/12 because (1/12) × 4 =
1/3.
b. Interpret division of a whole number by a unit
fraction, and compute such quotients. For example,
create a story context for 4 ÷ (1/5), and use a visual
fraction model to show the quotient. Use the
relationship between multiplication and division to
explain that 4 ÷ (1/5) = 20 because 20 × (1/5) = 4.
5.NF.7 is the first time that students are dividing with fractions. In fourth grade students divided whole numbers, and
multiplied a whole number by a fraction. The concept unit fraction is a fraction that has a one in the numerator. For
example, the fraction 3/5 is 3 copies of the unit fraction 1/5. 1/5 + 1/5 + 1/5 = 3/5 = 1/5 x 3 or 3 x 1/5
Example:
Knowing the number of groups/shares and finding how many/much in each group/share
Four students sitting at a table were given 1/3 of a pan of brownies to share. How much of a pan will each student get
if they share the pan of brownies equally?
The diagram shows the 1/3 pan divided into 4 equal shares with each share equaling 1/12 of the pan.

Mathematics
OA = Operations and Algebraic Thinking NBT= Numbers and Operations in Base Ten NF= Numbers and Operations – Fractions
MD= Measurement and Data G= Geometry
c. Solve real world problems involving division of unit
fractions by non-zero whole numbers and division of
whole numbers by unit fractions, e.g., by using visual
fraction models and equations to represent the
problem.
For example, how much chocolate will each person
get if 3 people share ½ lb of chocolate equally? How
many 1/3-cup servings are 2 cups of raisins?
1 Students able to multiply fractions in general can develop
strategies to divide fractions in general, by reasoning about
the relationship between multiplication and division. But
division of a fraction by a fraction is not a requirement at
this grade.
5.NF.7a This standard asks students to work with story contexts where a unit fraction is divided by a non-zero whole
number. Students should use various fraction models and reasoning about fractions.
Student 1: Expression 1/ 8 ÷ 3
0 3/24 8/24 16/24 24/24
1/8
5.NF.7b This standard calls for students to create story contexts and visual fraction models for division situations
where a whole number is being divided by a unit fraction.
Example:
Create a story context for 5 ÷ 1/6. Find your answer and then draw a picture to prove your answer and use multiplication
to reason about whether your answer makes sense. How many 1/6 are there in 5?
Student :
The bowl holds 5 Liters of water. If we use a scoop that holds 1/6 of a Liter, how many scoops will we need in order to
fill the entire bowl?
I created 5 boxes. Each box represents 1 Liter of water. I then divided each box into sixths to represent the size of the
scoop. My answer is the number of small boxes, which is 30. That makes sense since 6 x 5 = 30.
1 = 1/6 + 1/6 + 1/6 + 1/6 + 1/6 a whole has 6/6 so five wholes would be 6/6 + 6/6 + 6/6 + 6/6 + 6/6 =30/6

Mathematics
OA = Operations and Algebraic Thinking NBT= Numbers and Operations in Base Ten NF= Numbers and Operations – Fractions
MD= Measurement and Data G= Geometry
Grade 5 Unit 6: Graphing, Geometry, and Volume (~ 4 weeks)
Unit Overview: In this unit, students explore several new geometric concepts including coordinate graphing and the use of hierarchies to classify two-dimensional
shapes by their properties. Students also review volume and begin to use standard formulas (V = l x w x h and V = b x h) to find volumes of prisms. Students must
attend to precision (MP 6) as they analyze their answers for accuracy and use specific vocabulary for measurement and geometry situations.
Guiding Question: How are numerical expressions, real-world situations, tables, and graphs all connected?
The student will be able to: The teacher will use appropriate instructional strategies/approaches based on the needs of the student.
Component Cluster 5.OA Analyze patterns and relationships.
5.OA.3 Generate two numerical patterns using two given
rules. Identify apparent relationships between corresponding
terms. Form ordered pairs consisting of corresponding terms
from the two patterns, and graph the ordered pairs on a
coordinate plane.
For example, given the rule “Add 3” and the starting
number 0, and given the rule “Add 6” and the starting
number 0, generate terms in the resulting sequences, and
observe that the terms in one sequence are twice the
corresponding terms in the other sequence. Explain
informally why this is so.
This standard extends the work from Fourth Grade, where students generate numerical patterns when they are given
one rule. In Fifth Grade, students are given two rules and generate two numerical patterns. The graphs that are
created should be line graphs to represent the pattern. This is a linear function which is why we get the straight
lines. The Days are the independent variable, Fish are the dependent variables, and the constant rate is what the rule
identifies in the table.
Example:
Describe the pattern:
Since Terri catches 4 fish each day, and Sam catches 2 fish, the amount of Terri’s fish is always greater. Terri’s fish
is also always twice as much as Sam’s fish. Today, both Sam and Terri have no fish. They both go fishing each day.
Sam catches 2 fish each day. Terri catches 4 fish each day. How many fish do they have after each of the five days?
Make a graph of the number of fish.
Plot the points on a coordinate plane and make a line graph, and then interpret the graph.
Student:
My graph shows that Terri always has more fish than Sam. Terri’s fish increases at a higher rate since she catches 4
fish every day. Sam only catches 2 fish every day, so his number of fish increases at a smaller rate than Terri.
Important to note as well that the lines become increasingly further apart. Identify apparent relationships between
corresponding terms. Additional relationships: The two lines will never intersect; there will not be a day in which
Make a chart (table) to represent the number of fish that Sam and Terri catch.
Days Sam’s Total
Number of Fish
Terri’s Total
Number of Fish
0 0 0
1 2 4
2 4 8
3 6 12
4 8 16
5 10 20

Mathematics
OA = Operations and Algebraic Thinking NBT= Numbers and Operations in Base Ten NF= Numbers and Operations – Fractions
MD= Measurement and Data G= Geometry
boys have the same total of fish, explain the relationship between the number of days that has passed and the
number of fish a boy has (2n or 4n, n being the number of days).
Example:
Use the rule “add 3” to write a sequence of numbers. Starting with a 0, students write 0, 3, 6, 9, 12, . . .
Use the rule “add 6” to write a sequence of numbers. Starting with 0, students write 0, 6, 12, 18, 24, . . .
After comparing these two sequences, the students notice that each term in the second sequence is twice the
corresponding terms of the first sequence. One way they justify this is by describing the patterns of the terms. Their
justification may include some mathematical notation (See example below). A student may explain that both
sequences start with zero and to generate each term of the second sequence he/she added 6, which is twice as much
as was added to produce the terms in the first sequence. Students may also use the distributive property to describe
the relationship between the two numerical patterns by reasoning that 6 + 6 + 6 = 2 (3 + 3 + 3).
0, +3 3, +3 6, +3 9, +312, . . .
0, +6 6, +6 12, +618, +6 24, . . .
Once students can describe that the second sequence of numbers is twice the corresponding terms of the first
sequence, the terms can be written in ordered pairs and then graphed on a coordinate grid. They should recognize
that each point on the graph represents two quantities in which the second quantity is twice the first quantity.

Mathematics
OA = Operations and Algebraic Thinking NBT= Numbers and Operations in Base Ten NF= Numbers and Operations – Fractions
MD= Measurement and Data G= Geometry
Ordered pairs
Component Cluster 5.G Graph points on the coordinate plane to solve real-world and mathematical problems.
5.G.1 Use a pair of perpendicular number lines, called
axes, to define a coordinate system, with the intersection
of the lines (the origin) arranged to coincide with the 0
on each line and a given point in the plane located by
using an ordered pair of numbers, called its coordinates.
Understand that the first number indicates how far to
travel from the origin in the direction of one axis, and the
second number indicates how far to travel in the direction
of the second axis, with the convention that the names of
the two axes and the coordinates correspond (e.g., x-axis
and x-coordinate, y-axis and y-coordinate).
5.G.1 and 5.G.2 These standards deal with only the first quadrant (positive numbers) in the coordinate plane.
Although students can often “locate a point,” these understandings are beyond simple skills. For example, initially,
students often fail to distinguish between two different ways of viewing the point (2, 3), say, as instructions: “right
2, up 3”; and as the point defined by being a distance 2 from the y-axis and a distance 3 from the x-axis. In these two
descriptions the 2 is first associated with the x-axis, then with the y-axis.
5.G.2 Represent real world and mathematical problems
by graphing points in the first quadrant of the coordinate
plane, and interpret coordinate values of points in the
context of the situation.
This standard references real-world and mathematical problems, including the traveling from one point to another and
identifying the coordinates of missing points in geometric figures, such as squares, rectangles, and parallelograms.
Component Cluster 5.G Classify two-dimensional figures into categories based on their properties
5.G.3 Understand that attributes belonging to a category
of two-dimensional figures also belong to all
subcategories of that category. For example, all
rectangles have four right angles and squares are
rectangles, so all squares have four right angles.
This standard calls for students to reason about the attributes (properties) of shapes. Student should have
experiences discussing the property of shapes and reasoning.
The notion of congruence (“same size and same shape”) may be part of classroom conversation but the concepts of
congruence and similarity do not appear until middle school.
5.G.4 Classify two-dimensional figures in a hierarchy
based on properties.
This standard builds on what was done in 4th grade.
Figures from previous grades: polygon, rhombus/rhombi, rectangle, square, triangle, quadrilateral, pentagon,
hexagon, cube, trapezoid, half/quarter circle, circle, kite, parallelograms
(0, 0) (3, 6) (6, 12) (9, 18) (12, 24)

Mathematics
OA = Operations and Algebraic Thinking NBT= Numbers and Operations in Base Ten NF= Numbers and Operations – Fractions
MD= Measurement and Data G= Geometry
A kite is a quadrilateral whose four sides can be grouped into two pairs of equal-length sides that are beside
(adjacent to) each other.
Student should be able to reason about the attributes of shapes by examining: What are ways to classify triangles?
Why can’t trapezoids and kites be classified as parallelograms? Which quadrilaterals have opposite angles
congruent and why is this true of certain quadrilaterals?, and How many lines of symmetry does a regular polygon
have?
Component Cluster 5.MD Represent and interpret data
5. MD.2 Make a line plot to display a data set of
measurements in fractions of a unit (1/2, 1/4, 1/8). Use
operations on fractions for this grade to solve problems
involving information presented in line plots.
For example, given different measurements of liquid in
identical beakers, find the amount of liquid each beaker
would contain if the total amount in all the beakers were
redistributed equally.
This standard provides a context for students to work with fractions by measuring objects to one-eighth of a unit.
This includes length, mass, and liquid volume. Students are making a line plot of this data and then adding and
subtracting fractions based on data in the line plot.
Example:
Students measured objects in their desk to the
nearest ½, ¼, or 1/8 of an inch then displayed data
collected on a line plot. How many object measured
¼? ½? If you put all the objects together end to end
what would be the total length of all the objects?
Component Cluster 5.MD Geometric measurement: understand concepts of volume and relate volume to multiplication and to addition.

Mathematics
OA = Operations and Algebraic Thinking NBT= Numbers and Operations in Base Ten NF= Numbers and Operations – Fractions
MD= Measurement and Data G= Geometry
5. MD.3 Recognize volume as an attribute of solid
figures and understand concepts of volume measurement.
a. A cube with side length 1 unit, called a “unit
cube,” is said to have “one cubic unit” of
volume, and can be used to measure volume.
b. A solid figure which can be packed without
gaps or overlaps using n unit cubes is said to
have a volume of n cubic units.
5. MD.3, 5.MD.4, and 5. MD.5 These standards represent the first time that students begin exploring the concept of
volume. In third grade, students begin working with area and covering spaces. The concept of volume should be
extended from area with the idea that students are covering an area (the bottom of cube) with a layer of unit cubes
and then adding layers of unit cubes on top of bottom layer. Students should have ample experiences with concrete
manipulatives before moving to pictorial representations. Students’ prior experiences with volume were restricted to
liquid volume. As students develop their understanding of volume, they understand that a 1-unit by 1-unit by 1-unit
cube is the standard unit for measuring volume. This cube has a length of 1 unit, a width of 1 unit and a height of 1
unit and is called a cubic unit. This cubic unit is written with an exponent of 3 (e.g., in3, m3). Students connect this
notation to their understanding of powers of 10 in our place value system. Models of cubic inches, centimeters,
cubic feet, etc are helpful in developing an image of a cubic unit. Students’ estimate how many cubic yards would
be needed to fill the classroom or how many cubic centimeters would be needed to fill a pencil box.
The major emphasis for measurement in Grade 5 is volume. Volume not only introduces a third dimension and thus
a significant challenge to students’ spatial structuring, but also complexity in the nature of the materials measured.
That is, solid units are “packed,” such as cubes in a three-dimensional array, whereas a liquid “fills” three-
dimensional space, taking the shape of the container. The unit structure for liquid measurement may be
psychologically one dimensional for some students.
“Packing” volume is more difficult than iterating a unit to measure length and measuring area by tiling. Students
learn about a unit of volume, such as a cube with a side length of 1 unit, called a unit cube.5.MD.3 They pack cubes
(without gaps) into right rectangular prisms and count the cubes to determine the volume or build right rectangular
prisms from cubes and see the layers as they build.5.MD.4 They can use the results to compare the volume of right
rectangular prisms that have different dimensions. Such experiences enable students to extend their spatial
structuring from two to three dimensions. That is, they learn to both mentally decompose and recompose a right
rectangular prism built from cubes into layers, each of which is composed of rows and columns. That is, given the
prism, they have to be able to decompose it, understanding that it can be partitioned into layers, and each layer
partitioned into rows, and each row into cubes. They also have to be able to compose such as structure,
multiplicatively, back into higher units. That is, they eventually learn to conceptualize a layer as a unit that itself is
composed of units of units—rows, each row composed of individual cubes—and they iterate that structure. Thus,
they might predict the number of cubes that will be needed to fill a box given the net of the box.
Another complexity of volume is the connection between “packing” and “filling.” Often, for example, students will
respond that a box can be filled with 24 centimeter cubes, or build a structure of 24 cubes, and still think of the 24 as
individual, often discrete, not necessarily units of volume. They may, for example, not respond confidently and
correctly when asked to fill a graduated cylinder marked in cubic centimeters with the amount of liquid that would
fill the box. That is, they have not yet connected their ideas about filling volume with those concerning packing
volume. Students learn to move between these conceptions, e.g., using the same container, both filling (from a
graduated cylinder marked in ml or cc) and packing (with cubes that are each 1 cm3). Comparing and discussing the
volume-units and what they represent can help students learn a general, complete, and interconnected
conceptualization of volume as filling three-dimensional space.
Students then learn to determine the volumes of several right rectangular prisms, using cubic centimeters, cubic
inches, and cubic feet. With guidance, they learn to increasingly apply multiplicative reasoning to determine
volumes, looking for and making use of structure. That is, they understand that multiplying the length times the

Mathematics
OA = Operations and Algebraic Thinking NBT= Numbers and Operations in Base Ten NF= Numbers and Operations – Fractions
MD= Measurement and Data G= Geometry
5. MD.4 Measure volumes by counting unit cubes, using
cubic cm, cubic in, cubic ft, and improvised units.
width of a right rectangular prism can be viewed as determining how many cubes would be in each layer if the
prism were packed with or built up from unit cubes.5.MD.5a They also learn that the height of the prism tells how
many layers would fit in the prism. That is, they understand that volume is a derived attribute that, once a length
unit is specified, can be computed as the product of three length measurements or as the product of one area and one
length measurement.
Then, students can learn the formulas V =l x w x h and V = B x h for right rectangular prisms as efficient methods
for computing volume, maintaining the connection between these methods and their previous work with computing
the number of unit cubes that pack a right rectangular prism.5.MD.5b They use these competencies to find the
volumes of right rectangular prisms with edges whose lengths are whole numbers and solve real-world and
mathematical problems involving such prisms.
Students also recognize that volume is additive and they find the total volume of solid figures composed of two
right rectangular prisms.5.MD.5c For example, students might design a science station for the ocean floor that is
composed of several rooms that are right rectangular prisms and that meet a set criterion specifying the total volume
of the station. They draw their station and justify how their design meets the criterion.
5. MD.5a & b These standards involve finding the volume of right rectangular prisms.Students should have
experiences to describe and reason about why the formula is true. Specifically, that they are covering the bottom of
a right rectangular prism (length x width) with multiple layers (height). Therefore, the formula (length x width x
height) is an extension of the formula for the area of a rectangle.
5.MD.5c This standard calls for students to extend their work with the area of composite figures into the context of
volume. Students should be given concrete experiences of breaking apart (decomposing) 3-dimensional figures into
right rectangular prisms in order to find the volume of the entire 3-dimensional figure.
5. MD.5 Relate volume to the operations of multiplication
and addition and solve real world and mathematical
problems involving volume.
a. Find the volume of a right rectangular prism with
whole-number side lengths by packing it with unit
cubes, and show that the volume is the same as
would be found by multiplying the edge lengths,
equivalently by multiplying the height by the area
of the base. Represent threefold whole-number
products as volumes, e.g., to represent the
associative property of multiplication.
b. Apply the formulas V = l × w × h and V = b × h for
rectangular prisms to find volumes of right
rectangular prisms with whole-number edge
lengths in the context of solving real world and
mathematical problems.
c. Recognize volume as additive. Find volumes of
solid figures composed of two non-overlapping
right rectangular prisms by adding the volumes
of the non-overlapping parts, applying this
technique to solve real world problems.
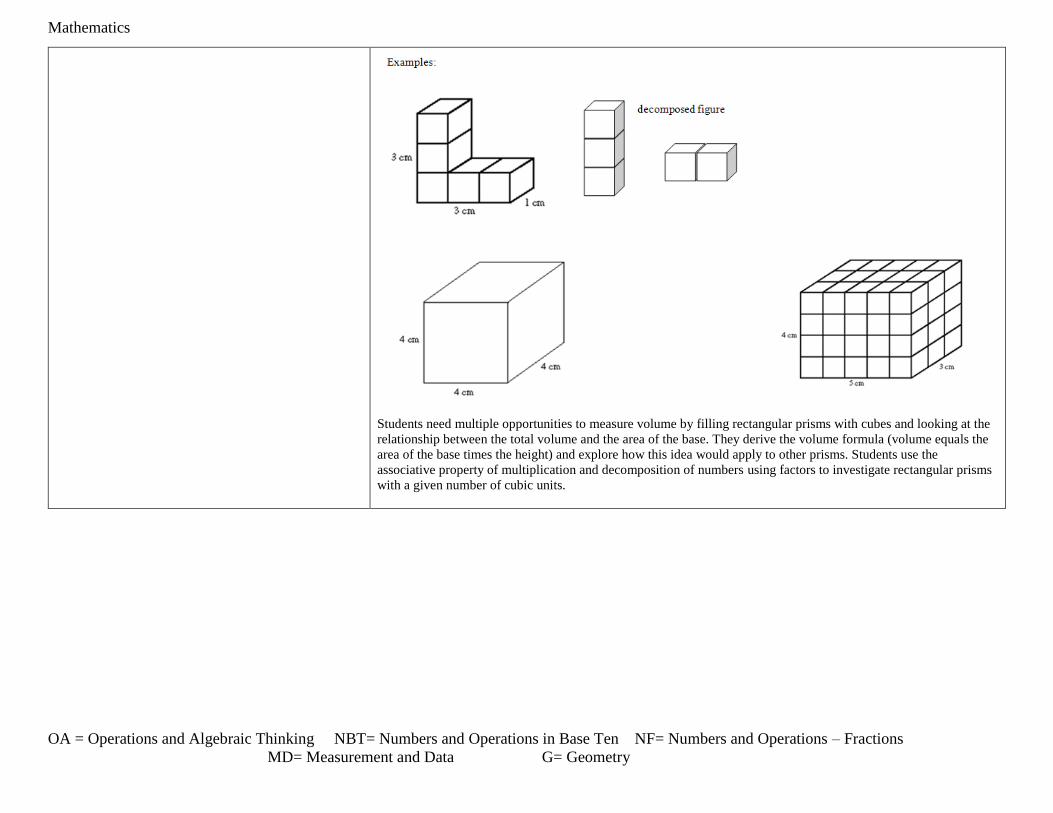
Mathematics
OA = Operations and Algebraic Thinking NBT= Numbers and Operations in Base Ten NF= Numbers and Operations – Fractions
MD= Measurement and Data G= Geometry
Students need multiple opportunities to measure volume by filling rectangular prisms with cubes and looking at the
relationship between the total volume and the area of the base. They derive the volume formula (volume equals the
area of the base times the height) and explore how this idea would apply to other prisms. Students use the
associative property of multiplication and decomposition of numbers using factors to investigate rectangular prisms
with a given number of cubic units.

Mathematics
OA = Operations and Algebraic Thinking NBT= Numbers and Operations in Base Ten NF= Numbers and Operations – Fractions
MD= Measurement and Data G= Geometry
Grade 5 Unit 7: Division and Decimals (~ 4 weeks)
Unit Overview: In this unit, students continue to investigate and master their understanding of and skills related to division. They should have the opportunity to
practice using finding partial quotients as they divide 3- and 4-digit dividends by 2-digit divisors, to explore the difference between sharing and grouping
interpretations of division, the skills and concepts related to dividing unit fractions with whole numbers, and situations requiring decisions about how to handle
remainders. Students should also continue to explore their decimal understanding as they work with the effects of multiplying and dividing by powers of ten as
well as multiplying and dividing decimal numbers.
Guiding Question: What visual models and strategies help to make sense of fraction and decimal problems and prove your answers to others?
The student will be able to: The teacher will use appropriate instructional strategies/approaches based on the needs of the student.
Component Cluster 5.NBT Understand the place value system.
5.NBT.1 Recognize that in a multi-digit number, a digit
in one place represents 10 times as much as it represents
in the place to its right and 1/10 of what it represents in
the place to its left.
Students extend their understanding of the base-ten system to the relationship between adjacent places, how
numbers compare, and how numbers round for decimals to thousandths. This standard calls for students to reason
about the magnitude of numbers. Students should work with the idea that the tens place is ten times as much as the
ones place, and the ones place is 1/10th the size of the tens place.
In fourth grade, students examined the relationships of the digits in numbers for whole numbers only. This standard
extends this understanding to the relationship of decimal fractions. Students use base ten blocks, pictures of base ten
blocks, and interactive images of base ten blocks to manipulate and investigate the place value relationships. They
use their understanding of unit fractions to compare decimal places and fractional language to describe those
comparisons.
Before considering the relationship of decimal fractions, students express their understanding that in multi-digit
whole numbers, a digit in one place represents 10 times what it represents in the place to its right and 1/10 of what it
represents in the place to its left.
5.NBT.2 Explain patterns in the number of zeros of the
product when multiplying a number by powers of 10,
and explain patterns in the placement of the decimal
point when a decimal is multiplied or divided by a power
of 10. Use whole-number exponents to denote powers of
10.
New at Grade 5 is the use of whole number exponents to denote powers of 10. Students understand why multiplying
by a power of 10 shifts the digits of a whole number or decimal that many places to the left. Patterns in the number
of 0s in products of a whole numbers and a power of 10 and the location of the decimal point in products of
decimals with powers of 10 can be explained in terms of place value. Because students have developed their
understandings of and computations with decimals in terms of multiples rather than powers, connecting the
terminology of multiples with that of powers affords connections between understanding of multiplication and
exponentiation. (Progressions for the CCSSM, Number and Operation in Base Ten, CCSS Writing Team, April
2011, page 16)3
5+
5
10=
6
10+
5
10=
11
10
This standard includes multiplying by multiples of 10 and powers of 10, including 102 which is 10 x 10=100, and
103 which is 10 x 10 x 10=1,000. Students should have experiences working with connecting the pattern of the
number of zeros in the product when you multiply by powers of 10. Students need to be provided with opportunities
to explore this concept and come to this understanding; this should not just be taught procedurally.
Component Cluster 5.NBT Perform operations with multi-digit whole numbers and with decimals to hundredths.

Mathematics
OA = Operations and Algebraic Thinking NBT= Numbers and Operations in Base Ten NF= Numbers and Operations – Fractions
MD= Measurement and Data G= Geometry
5.NBT.6 Find whole-number quotients of whole
numbers with up to four-digit dividends and two-digit
divisors, using strategies based on place value, the
properties of operations, and/or the relationship between
multiplication and division. Illustrate and explain the
calculation by using equations, rectangular arrays, and/or
area models.
This standard references various strategies for division. Division problems can include remainders. Even though this
standard leads more towards computation, the connection to story contexts is critical. Make sure students are
exposed to problems where the divisor is the number of groups and where the divisor is the size of the groups. In
fourth grade, students’ experiences with division were limited to dividing by one-digit divisors. This standard
extends students’ prior experiences with strategies, illustrations, and explanations. When the two-digit divisor is a
“familiar” number, a student might decompose the dividend using place value.
5.NBT.7 Add, subtract, multiply, and divide decimals to
hundredths, using concrete models or drawings and
strategies based on place value, properties of operations,
and/or the relationship between addition and subtraction;
relate the strategy to a written method and explain the
reasoning used.
This standard builds on the work from fourth grade where students are introduced to decimals and compare them. In
fifth grade, students begin adding, subtracting, multiplying and dividing decimals. This work should focus on
concrete models and pictorial representations, rather than relying solely on the algorithm. The use of symbolic
notations involves having students record the answers to computations (2.25 x 3= 6.75), but this work should not be
done without models or pictures. This standard includes students’ reasoning and explanations of how they use
models, pictures, and strategies.
This standard requires students to extend the models and strategies they developed for whole numbers in grades 1-4
to decimal values. Before students are asked to give exact answers, they should estimate answers based on their
understanding of operations and the value of the numbers.
Students should be able to express that when they add decimals they add tenths to tenths and hundredths to
hundredths. So, when they are adding in a vertical format (numbers beneath each other), it is important that they
write numbers with the same place value beneath each other. This understanding can be reinforced by connecting
addition of decimals to their understanding of addition of fractions. Adding fractions with denominators of 10 and
100 is a standard in fourth grade.
Component Cluster 5.NF Apply and extend previous understandings of multiplication and division to multiply and divide fractions.* *Instruction of this standard continues in later units.
5.NF.3 Interpret a fraction as division of the numerator
by the denominator (a/b = a ÷ b). Solve word problems
involving division of whole numbers leading to answers
in the form of fractions or mixed numbers, e.g., by using
visual fraction models or equations to represent the
problem.
For example, interpret 3/4 as the result of dividing 3 by
4, noting that 3/4 multiplied by 4 equals 3, and that when
3 wholes are shared equally among 4 people each person
has a share of size 3/4. If 9 people want to share a 50-
pound sack of rice equally by weight, how many pounds
of rice should each person get? Between what two whole
numbers does your answer lie?
Fifth grade student should connect fractions with division, understanding that 5 ÷ 3 = 5/3
Students should explain this by working with their understanding of division as equal sharing.
Students should also create story contexts to represent problems involving division of whole numbers.
This standard calls for students to extend their work of partitioning a number line from third and fourth grade.
Students need ample experiences to explore the concept that a fraction is a way to represent the division of two
quantities.
Students are expected to demonstrate their understanding using concrete materials, drawing models, and explaining
their thinking when working with fractions in multiple contexts. They read 3/5 as “three fifths” and after many
experiences with sharing problems, learn that 3/5 can also be interpreted as “3 divided by 5.”
Component Cluster 5.NF Apply and extend previous understandings of multiplication and division to multiply and divide fractions. *Instruction of this standard continues in later units.

Mathematics
OA = Operations and Algebraic Thinking NBT= Numbers and Operations in Base Ten NF= Numbers and Operations – Fractions
MD= Measurement and Data G= Geometry
5.NF.4 Apply and extend previous understandings of
multiplication to multiply a fraction or whole number by
a fraction.
a. Interpret the product (a/b) × q as a parts of a
partition of q into b equal parts; equivalently, as
the result of a sequence of operations a × q ÷ b.
For example, use a visual fraction model to show
(2/3) × 4 = 8/3, and create a story context for this
equation. Do the same with (2/3) × (4/5) = 8/15. (In
general, (a/b) × (c/d) = ac/bd.)
Students need to develop a fundamental understanding that the multiplication of a fraction by a whole number could
be represented as repeated addition of a unit fraction (e.g., 2 x (1/4) = 1/4 + ¼
This standard extends student’s work of multiplication from earlier grades. In fourth grade, students worked with
recognizing that a fraction such as 3/5 actually could be represented as 3 pieces that are each one-fifth (3 x (1/5)).
This standard references both the multiplication of a fraction by a whole number and the multiplication of two
fractions. Visual fraction models (area models, tape diagrams, number lines) should be used and created by students
during their work with this standard.
5.NF.7 Apply and extend previous understandings of
division to divide unit fractions by whole numbers and
whole numbers by unit fractions.1
d. Interpret division of a unit fraction by a non-zero
whole number, and compute such quotients.
For example, create a story context for (1/3) ÷ 4,
and use a visual fraction model to show the quotient.
Use the relationship between multiplication and
division to explain that (1/3) ÷ 4 = 1/12 because
(1/12) × 4 = 1/3.
e. Interpret division of a whole number by a unit
fraction, and compute such quotients. For example,
create a story context for 4 ÷ (1/5), and use a visual
fraction model to show the quotient. Use the
relationship between multiplication and division to
explain that 4 ÷ (1/5) = 20 because 20 × (1/5) = 4.
f. Solve real world problems involving division of unit
fractions by non-zero whole numbers and division of
whole numbers by unit fractions, e.g., by using
visual fraction models and equations to represent the
problem.
For example, how much chocolate will each person
get if 3 people share ½ lb of chocolate equally?
How many 1/3-cup servings are 2 cups of raisins?
5.NF.7 is the first time that students are dividing with fractions. In fourth grade students divided whole numbers,
and multiplied a whole number by a fraction. The concept unit fraction is a fraction that has a one in the numerator.
For example, the fraction 3/5 is 3 copies of the unit fraction 1/5. 1/5 + 1/5 + 1/5 = 3/5 = 1/5 x 3 or 3 x 1/5
Example:
Knowing the number of groups/shares and finding how many/much in each group/share
Four students sitting at a table were given 1/3 of a pan of brownies to share. How much of a pan will each student
get if they share the pan of brownies equally?
The diagram shows the 1/3 pan divided into 4 equal shares with each share equaling 1/12 of the pan.
5.NF.7a This standard asks students to work with story contexts where a unit fraction is divided by a non-zero
whole number. Students should use various fraction models and reasoning about fractions.
Student 1: Expression 1/ 8 ÷ 3
0 3/24 8/24 16/24 24/24
1/8

Mathematics
OA = Operations and Algebraic Thinking NBT= Numbers and Operations in Base Ten NF= Numbers and Operations – Fractions
MD= Measurement and Data G= Geometry
1 Students able to multiply fractions in general can
develop strategies to divide fractions in general, by
reasoning about the relationship between multiplication
and division. But division of a fraction by a fraction is
not a requirement at this grade.
5.NF.7b This standard calls for students to create story contexts and visual fraction models for division situations
where a whole number is being divided by a unit fraction.
Example:
Create a story context for 5 ÷ 1/6. Find your answer and then draw a picture to prove your answer and use
multiplication to reason about whether your answer makes sense. How many 1/6 are there in 5?
Student :
The bowl holds 5 Liters of water. If we use a scoop that holds 1/6 of a Liter, how many scoops will we need in
order to fill the entire bowl?
I created 5 boxes. Each box represents 1 Liter of water. I then divided each box into sixths to represent the size of
the scoop. My answer is the number of small boxes, which is 30. That makes sense since 6 x 5 = 30.
1 = 1/6 + 1/6 + 1/6 + 1/6 + 1/6 a whole has 6/6 so five wholes would be 6/6 + 6/6 + 6/6 + 6/6 + 6/6 =30/6

Mathematics
OA = Operations and Algebraic Thinking NBT= Numbers and Operations in Base Ten NF= Numbers and Operations – Fractions
MD= Measurement and Data G= Geometry
Grade 5 Unit 8: Culminating Unit: Challenge and Application (~4 weeks)
Unit Overview: The focus of unit 8 is to provide students with engaging opportunities to apply their learning from the year. They will have time to
deepen their understandings, correct misconceptions, solidify procedural strategies, and apply their skills in real-life contexts. During this unit,
students should make sense of problems and persevere in solving them (MP1) as they employ all of their math concepts and skills from the year in
meaningful contexts.
Guiding Question: How will you use the math you have learned in 5th grade to investigate and solve problems over the course of the summer?
CONTINUE WORK WITH ALL GRADE LEVEL STANDARDS.

Mathematics
RP = Ratios and Proportional Reasoning NS= The Number System EE= Expressions and Equations G= Geometry SP= Statistics and Probability
Grade 6
In Grade 6, instructional time should focus on four critical areas: (1) connecting ratio and rate to whole number multiplication and division and using
concepts of ratio and rate to solve problems; (2) completing understanding of division of fractions and extending the notion of number to the system
of rational numbers, which includes negative numbers; (3) writing, interpreting, and using expressions and equations; and (4) developing
understanding of statistical thinking.
(1) Students use reasoning about multiplication and division to solve ratio and rate problems about quantities. By viewing equivalent ratios
and rates as deriving from, and extending, pairs of rows (or columns) in the multiplication table, and by analyzing simple drawings that
indicate the relative size of quantities, students connect their understanding of multiplication and division with ratios and rates. Thus students
expand the scope of problems for which they can use multiplication and division to solve problems, and they connect ratios and fractions.
Students solve a wide variety of problems involving ratios and rates.
(2) Students use the meaning of fractions, the meanings of multiplication and division, and the relationship between multiplication and
division to understand and explain why the procedures for dividing fractions make sense. Students use these operations to solve problems.
Students extend their previous understandings of number and the ordering of numbers to the full system of rational numbers, which includes
negative rational numbers, and in particular negative integers. They reason about the order and absolute value of rational numbers and about
the location of points in all four quadrants of the coordinate plane.
(3) Students understand the use of variables in mathematical expressions. They write expressions and equations that correspond to given
situations, evaluate expressions, and use expressions and formulas to solve problems. Students understand that expressions in different forms
can be equivalent, and they use the properties of operations to rewrite expressions in equivalent forms. Students know that the solutions of an
equation are the values of the variables that make the equation true. Students use properties of operations and the idea of maintaining the
equality of both sides of an equation to solve simple one-step equations. Students construct and analyze tables, such as tables of quantities that
are in equivalent ratios, and they use equations (such as 3x = y) to describe relationships between quantities.
(4) Building on and reinforcing their understanding of number, students begin to develop their ability to think statistically. Students recognize
that a data distribution may not have a definite center and that different ways to measure center yield different values. The median measures
center in the sense that it is roughly the middle value. The mean measures center in the sense that it is the value that each data point would
take on if the total of the data values were redistributed equally, and also in the sense that it is a balance point. Students recognize that a
measure of variability (interquartile range or mean absolute deviation) can also be useful for summarizing data because two very different sets
of data can have the same mean and median yet be distinguished by their variability. Students learn to describe and summarize numerical data
sets, identifying clusters, peaks, gaps, and symmetry, considering the context in which the data were collected.
Students in Grade 6 also build on their work with area in elementary school by reasoning about relationships among shapes to determine area,
surface area, and volume. They find areas of right triangles, other triangles, and special quadrilaterals by decomposing these shapes,
rearranging or removing pieces, and relating the shapes to rectangles. Using these methods, students discuss, develop, and justify formulas for
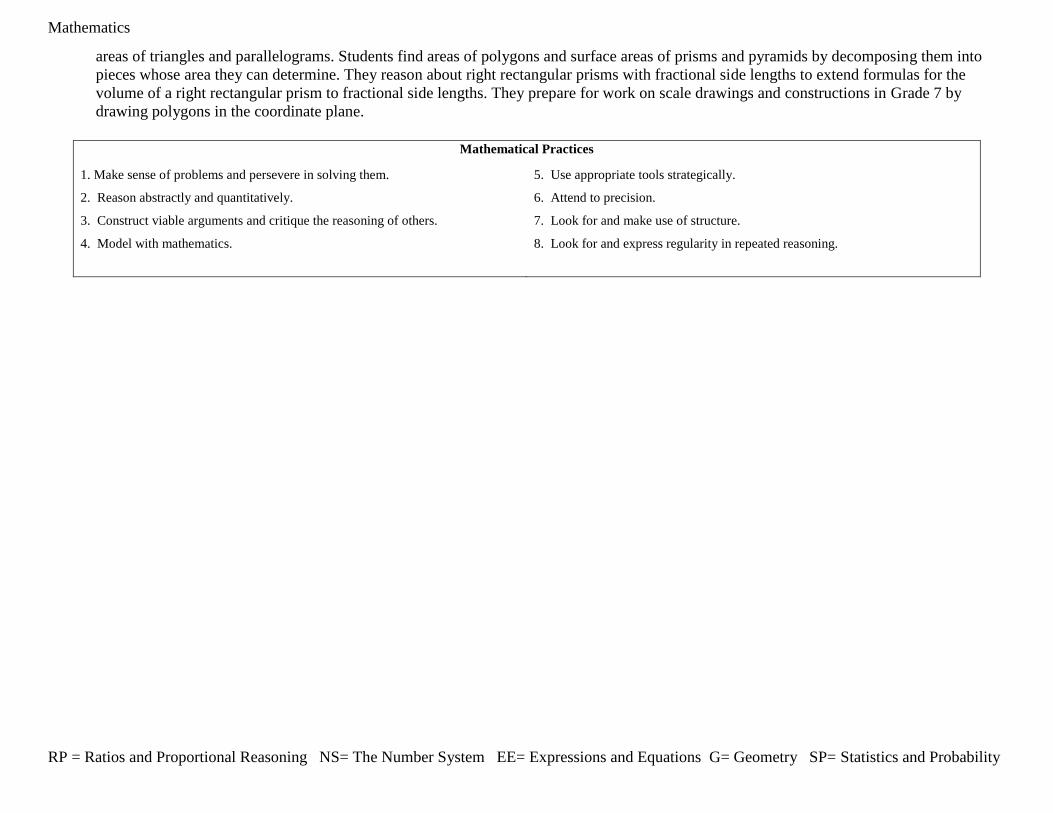
Mathematics
RP = Ratios and Proportional Reasoning NS= The Number System EE= Expressions and Equations G= Geometry SP= Statistics and Probability
areas of triangles and parallelograms. Students find areas of polygons and surface areas of prisms and pyramids by decomposing them into
pieces whose area they can determine. They reason about right rectangular prisms with fractional side lengths to extend formulas for the
volume of a right rectangular prism to fractional side lengths. They prepare for work on scale drawings and constructions in Grade 7 by
drawing polygons in the coordinate plane.
Mathematical Practices
1. Make sense of problems and persevere in solving them.
2. Reason abstractly and quantitatively.
3. Construct viable arguments and critique the reasoning of others.
4. Model with mathematics.
5. Use appropriate tools strategically.
6. Attend to precision.
7. Look for and make use of structure.
8. Look for and express regularity in repeated reasoning.

Mathematics
RP = Ratios and Proportional Reasoning NS= The Number System EE= Expressions and Equations G= Geometry SP= Statistics and Probability
Grade 6: Suggested Distribution of Units in Instructional Weeks Time Approximate
# of Weeks
Unit 1: Factors, Multiples, and Expressions 10 % ~ 4 weeks
Unit 2: Ratios and Rational Numbers 14 % ~ 5 weeks
Unit 3: Operations with Fractions 17 % ~ 6 weeks
Unit 4: Geometry 14 % ~ 5 weeks
Unit 5: Operations Including Decimals and Percents 14 % ~ 5 weeks
Unit 6: Expressions and Equations 17 % ~ 6 Weeks
Unit 7: Introduction to Statistics 14 % ~ 5 Weeks
Instructional
Focus of Unit: Ratios and Proportional Reasoning Number System Expressions and Equations/ Functions Geometry Statistics and Probability
Unit 1: Factors, Multiples and Expressions
10%
Unit 2: Ratios and Rational Numbers
14%
Unit 3: Operations with Fractions
17%
Unit 4: Geometry14%
Unit 5: Operations including Decimals
and Percents14%
Unit 6: Expressions and Equations
17%
Unit 7: Introduction to
Statistics14%
Instructional Time

Mathematics
RP = Ratios and Proportional Reasoning NS= The Number System EE= Expressions and Equations G= Geometry SP= Statistics and Probability
Grade 6 Unit 1: Factors, Multiples, and Expressions (~ 4 weeks)
Unit Overview: In this unit students develop an understanding of properties of whole numbers including factors, multiples, divisors, products, prime and
composite numbers, common factors and multiples, the Distributive Property, Order of Operations, and exponents. Students will extend their numerical
understanding of these foundational concepts to algebraic expressions and equations later in the year. This unit is particularly important in establishing year-long
norms for constructing viable arguments and critiquing the reasoning of others (MP 3) as they use properties of numbers to solve problems and justify their
responses to classmates.
Guiding Question: In what ways are the properties of operations, including the Distributive Property and the Order of Operations, important in solving problems?
The student will be able to: The teacher will use appropriate instructional strategies/approaches based on the needs of the student.
Component Cluster 6.NS Compute fluently with multi-digit numbers and find common factors and multiples.
6.NS.4 Find the greatest common factor of two whole
numbers less than or equal to 100 and the least common
multiple of two whole numbers less than or equal to 12.
Use the distributive property to express a sum of two
whole numbers 1–100 with a common factor as a multiple
of a sum of two whole numbers with no common factor.
For example, express 36 + 8 as 4 (9 + 2).
In elementary school, students identified primes, composites and factor pairs (4.OA.4). In 6th grade students will
find the greatest common factor of two whole numbers less than or equal to 100. Students also understand that the
greatest common factor of two prime numbers is 1.
Students find the least common multiple of two whole numbers less than or equal to 12. For example, least
common multiple can be found by listing multiples or using prime factorization.
Component Cluster 6.EE Apply and extend previous understanding of arithmetic to algebraic expressions.
6.EE.1 Write and evaluate numerical expressions
involving whole-number exponents.
Students demonstrate the meaning of exponents to write and evaluate numerical expressions with whole number
exponents. The base can be a whole number, positive decimal or a positive fraction (i.e. 5 can be written •
• • • which has the same value as ). Students recognize that an expression with a variable represents
the same mathematics (i.e. x5 can be written as x • x • x • x • x) and write algebraic expressions from verbal
expressions.
Order of operations is introduced throughout elementary grades, including the use of grouping symbols, ( ), { },
and [ ] in 5th grade. Order of operations with exponents is the focus in 6th grade.
6.EE.2 Write, read, and evaluate expressions in which
letters stand for numbers.
a. Write expressions that record operations with
numbers and with letters standing for numbers. For
example, express the calculation “Subtract y from 5”
as 5 – y.
Students write expressions from verbal descriptions using letters and numbers, understanding order is important in
writing subtraction and division problems. Students understand that the expression “5 times any number, n” could
be represented with 5n and that a number and letter written together means to multiply. All rational numbers may
be used in writing expressions when operations are not expected. Students use appropriate mathematical language
to write verbal expressions from algebraic expressions. It is important for students to read algebraic expressions in
a manner that reinforces that the variable represents a number.
Example Set 1:
Students read algebraic expressions:
r + 21 as “some number plus 21” as well as “r plus 21”
1
2
1
2
1
2
1
2
1
2
1
2
1
32

Mathematics
RP = Ratios and Proportional Reasoning NS= The Number System EE= Expressions and Equations G= Geometry SP= Statistics and Probability
n 6 as “some number times 6” as well as “n times 6”
𝑠
6 and s ÷ 6 as “as some number divided by 6” as well as “s divided by 6”
Example Set 2:
Students write algebraic expressions:
7 less than 3 times a number
Solution: 3x – 7
3 times the sum of a number and 5
Solution: 3 (x + 5)
7 less than the product of 2 and a number
Solution: 2x – 7
Twice the difference between a number and 5
Solution: 2(z – 5)
The quotient of the sum of x plus 4 and 2
Solution: x + 4
2
Students can describe expressions such as 3 (2 + 6) as the product of two factors: 3 and (2 + 6). The quantity
(2 + 6) is viewed as one factor consisting of two terms.
Terms are the parts of a sum. When the term is an explicit number, it is called a constant. When the term is a
product of a number and a variable, the number is called the coefficient of the variable.
Students should identify the parts of an algebraic expression including variables, coefficients, constants, and the
names of operations (sum, difference, product, and quotient). Variables are letters that represent numbers. There
are various possibilities for the number they can represent.
Consider the following expression:
x2 + 5y + 3x + 6
The variables are x and y.
There are 4 terms, x2, 5y, 3x, and 6.
There are 3 variable terms, x2, 5y, 3x. They have coefficients of 1, 5, and 3 respectively. The coefficient of x2 is 1,
since x2 = 1x2. The term 5y represent 5y’s or 5 y.
There is one constant term, 6.
The expression represents a sum of all four terms.
b. Identify parts of an expression using mathematical
terms (sum, term, product, factor, quotient,
coefficient); view one or more parts of an expression
as a single entity. For example, describe the
expression 2 (8 + 7) as a product of two factors; view
(8 + 7) as both a single entity and a sum of two
terms.

Mathematics
RP = Ratios and Proportional Reasoning NS= The Number System EE= Expressions and Equations G= Geometry SP= Statistics and Probability
c. Evaluate expressions at specific values of their
variables. Include expressions that arise from
formulas used in real-world problems. Perform
arithmetic operations, including those involving
whole- number exponents, in the conventional order
when there are no parentheses to specify a particular
order (Order of Operations). For example, use the
formulas V = s3 and A = 6 s2 to find the volume and
surface area of a cube with sides of length s = ½.
Students evaluate algebraic expressions, using order of operations as needed. Problems require students to
understand that multiplication is understood when numbers and variables are written together and to use the order
of operations to evaluate.
In 5th grade students worked with the grouping symbols ( ), [ ], and { }. Students understand that the fraction bar
can also serve as a grouping symbol (treats numerator operations as one group and denominator operations as
another group) as well as a division symbol.
Given a context and the formula arising from the context, students could write an expression and then evaluate for
any number.
6.EE.3 Apply the properties of operations to generate
equivalent expressions. For example, apply the
distributive property to the expression 3 (2 + x) to
produce the equivalent expression 6 + 3x; apply the
distributive property to the expression 24x + 18y to
produce the equivalent expression 6 (4x + 3y); apply
properties of operations to y + y + y to produce the
equivalent expression 3y.
Students use the distributive property to write equivalent expressions. Using their understanding of area models,
students illustrate the distributive property with variables.
Properties are introduced throughout elementary grades (3.OA.5); however, there has not been an emphasis on
recognizing and naming the property. In 6th grade, students are able to use the properties and identify by name as
used when justifying solution methods.
When given an expression representing area, students need to find the factors.
6.EE.4 Identify when two expressions are equivalent.
(i.e., when the two expressions name the same number
regardless of which value is substituted into them). For
example, the expressions y + y + y and 3y are equivalent
because they name the same number regardless of which
number y stands for.
Students demonstrate an understanding of like terms as quantities being added or subtracted with the same
variables and exponents. For example, 3x + 4x are like terms and can be combined as 7x; however, 3x + 4x2 are
not like terms since the exponents with the x are not the same.
This concept can be illustrated by substituting in a value for x. For example, 9x – 3x = 6x not 6. Choosing a value
for x, such as 2, can prove non-equivalence.
Students can also generate equivalent expressions using the associative, commutative, and distributive properties.
They can prove that the expressions are equivalent by simplifying each expression into the same form.

Mathematics
RP = Ratios and Proportional Reasoning NS= The Number System EE= Expressions and Equations G= Geometry SP= Statistics and Probability
Grade 6 Unit 2: Ratios and Rational Numbers (~ 5 weeks)
Unit Overview: The first major theme of Unit 2 is to understand rational numbers as points on the number line and to extend previous understandings of numbers
to the system of rational numbers, which now include negative numbers. They use the number line to order numbers, including fractions and decimals, and to
understand the absolute value of a number. The second major focus of Unit 2 is a study of the concepts and language of ratios and unit rates. Students will use
proportional reasoning with rate tables to study equivalent ratios. Students can look for and make use of structure (MP 7) as they extend the number system and
investigate the proportional relationships.
Guiding Question: How are value and absolute value similar and different when you look at rational numbers on a number line?
The student will be able to: The teacher will use appropriate instructional strategies/approaches based on the needs of the student.
Component Cluster 6.RP Understand ratio concepts and use ratio reasoning to solve problems.
6.RP.1 Understand the concept of a ratio and use ratio
language to describe a ratio relationship between two
quantities. For example, “The ratio of wings to beaks in
the bird house at the zoo was 2:1, because for every 2
wings there was 1 beak.” “For every vote candidate A
received, candidate C received nearly three votes.”
A ratio is the comparison of two quantities or measures. The comparison can be part-to-whole (ratio of guppies to
all fish in an aquarium) or part-to-part (ratio of guppies to goldfish). Students should be able to identify and
describe any ratio using “For every _____, there are _____.”
NOTE: Ratios are often expressed in fraction notation, although ratios and fractions do not have identical
meaning. For example, ratios are often used to make “part-part” comparisons but fractions are not.
6.RP.2 Understand the concept of a unit rate a/b
associated with a ratio a:b with b = ̸0, and use rate
language in the context of a ratio relationship. For
example, “This recipe has a ratio of 3 cups of flour to 4
cups of sugar, so there is ¾ cup of flour for each cup of
sugar.” “We paid $75 for 15 hamburgers, which is a rate
of $5 per hamburger.”
A unit rate expresses a ratio as part-to-one, comparing a quantity in terms of one unit of another quantity. Common
unit rates are cost per item or distance per time.
Students are able to name the amount of either quantity in terms of the other quantity. Students will begin to notice
that related unit rates (i.e. miles / hour and hours / mile) are reciprocals. At this level, students should use
reasoning to find these unit rates instead of an algorithm or rule.
In 6th grade, students are not expected to work with unit rates expressed as complex fractions. Both the numerator
and denominator of the original ratio will be whole numbers.
6.RP.3 Use ratio and rate reasoning to solve real-world
and mathematical problems, e.g., by reasoning about
tables of equivalent ratios, tape diagrams, double number
line diagrams, or equations.
a. Make tables of equivalent ratios relating quantities
with whole- number measurements, find missing
values in the tables, and plot the pairs of values on
the coordinate plane. Use tables to compare ratios.
Ratios and rates can be used in ratio tables and graphs to solve problems. Previously, students have used additive
reasoning in tables to solve problems. To begin the shift to proportional reasoning, students need to begin using
multiplicative reasoning. Scaling up or down with multiplication maintains the equivalence. To aid in the
development of proportional reasoning the cross-product algorithm is not expected at this level. When working
with ratio tables and graphs, whole number measurements are the expectation for this standard.
Students use tables to compare ratios. Writing equations is foundational for work in 7th grade. The numbers in the
table can be expressed as ordered pairs (number of books, cost) and plotted on a coordinate plane.
b. Solve unit rate problems including those involving
unit pricing and constant speed. For example, if it
took 7 hours to mow 4 lawns, then at that rate, how
many lawns could be mowed in 35 hours? At what
rate were lawns being mowed?
Students recognize the use of ratios, unit rate and multiplication in solving problems, which could allow for the use
of fractions and decimals.
c. Find a percent of a quantity as a rate per 100 (e.g.,
30% of a quantity means 30/100 times the quantity);
solve problems involving finding the whole, given a
part and the percent.
This is the students’ first introduction to percents. Percentages are a rate per 100. Models, such as percent bars or
10 x 10 grids should be used to model percents.
Students use ratios to identify percents. Students use percentages to find the part when given the percent, by
recognizing that the whole is being divided into 100 parts and then taking a part of them (the percent). Students
also determine the whole amount, given a part and the percent.

Mathematics
RP = Ratios and Proportional Reasoning NS= The Number System EE= Expressions and Equations G= Geometry SP= Statistics and Probability
Component Cluster 6.NS Compute fluently with multi-digit numbers and find common factors and multiples.
6.NS.4 Find the greatest common factor of two whole
numbers less than or equal to 100 and the least common
multiple of two whole numbers less than or equal to 12.
Use the distributive property to express a sum of two
whole numbers 1–100 with a common factor as a multiple
of a sum of two whole numbers with no common factor.
For example, express 36 + 8 as 4 (9 + 2).
See Unit 1.
Component Cluster 6.NS Apply and extend previous understandings of numbers to the system of rational numbers.
6.NS.5 Understand that positive and negative numbers
are used together to describe quantities having opposite
directions or values (e.g., temperature above/below zero,
elevation above/below sea level, credits/debits,
positive/negative electric charge); use positive and
negative numbers to represent quantities in real-world
contexts, explaining the meaning of 0 in each situation.
Students use rational numbers (fractions, decimals, and integers) to represent real-world contexts and understand
the meaning of 0 in each situation.
6.NS.6 Understand a rational number as a point on the
number line. Extend number line diagrams and coordinate
axes familiar from previous grades to represent points on
the line and in the plane with negative number
coordinates.
a. Recognize opposite signs of numbers as indicating
locations on opposite sides of 0 on the number line;
recognize that the opposite of the opposite of a number is
the number itself, e.g., – (–3) = 3, and that 0 is its own
opposite
c. Find and position integers and other rational numbers
on a horizontal or vertical number line diagram; find and
position pairs of integers and other rational numbers on a
coordinate plane.
In elementary school, students worked with positive fractions, decimals and whole numbers on the number line and
in quadrant 1 of the coordinate plane. In 6th grade, students extend the number line to represent all rational
numbers and recognize that number lines may be either horizontal or vertical (i.e. thermometer) which facilitates
the movement from number lines to coordinate grids. Students recognize that a number and its opposite are
equidistance from zero (reflections about the zero). The opposite sign (–) shifts the number to the opposite side of
0. For example, – 4 could be read as “the opposite of 4” which would be negative 4. In the example,
– (–6.4) would be read as “the opposite of the opposite of 6.4” which would be 6.4. Zero is its own opposite.
6.NS.7 Understand ordering and absolute value of rational
numbers.
a. Interpret statements of inequality as statements about
the relative position of two numbers on a number
line. For example, interpret –3 > –7 as a statement
that –3 is located to the right of –7 on a number line
oriented from left to right.
Students use inequalities to express the relationship between two rational numbers, understanding that the value of
numbers is smaller moving to the left on a number line.
Common models to represent and compare integers include number line models, temperature models and the profit-
loss model. On a number line model, the number is represented by an arrow drawn from zero to the location of the
number on the number line; the absolute value is the length of this arrow. The number line can also be viewed as a
thermometer where each point of on the number line is a specific temperature. In the profit-loss model, a positive
number corresponds to profit and the negative number corresponds to a loss. Each of these models is useful for
examining values but can also be used in later grades when students begin to perform operations on integers.
Operations with integers are not the expectation at this level.

Mathematics
RP = Ratios and Proportional Reasoning NS= The Number System EE= Expressions and Equations G= Geometry SP= Statistics and Probability
In working with number line models, students internalize the order of the numbers; larger numbers on the right
(horizontal) or top (vertical) of the number line and smaller numbers to the left (horizontal) or bottom (vertical) of
the number line. They use the order to correctly locate integers and other rational numbers on the number line. By
placing two numbers on the same number line, they are able to write inequalities and make statements about the
relationships between two numbers.
Students recognize the distance from zero as the absolute value or magnitude of a rational number. Students need
multiple experiences to understand the relationships between numbers, absolute value, and statements about order.
b. Write, interpret, and explain statements of order for
rational numbers in real-world contexts. For
example, write –3oC > –7oC to express the fact that –
3oC is warmer than –7oC.
Students write statements using < or > to compare rational numbers in context. However, explanations should
reference the context rather than “less than” or “greater than”.
Although 6.NS.7a is limited to two numbers, this part of the standard expands the ordering of rational numbers to
more than two numbers in context.
c. Understand the absolute value of a rational number as
its distance from 0 on the number line; interpret
absolute as magnitude for a positive or negative
quantity in a real-world situation. For example, for
an account balance of –30 dollars, write |–30| = 30
to describe the size of the debt in dollars.
Students understand absolute value as the distance from zero and recognize the symbols | | as representing absolute
value. In real-world contexts, the absolute value can be used to describe size or magnitude. For example, for an
ocean depth of 900 feet, write | –900| = 900 to describe the distance below sea level.
d. Distinguish comparisons of absolute value from
statements about order. For example, recognize that
an account balance less than –30 dollars represents
a debt greater than 30 dollars.
When working with positive numbers, the absolute value (distance from zero) of the number and the value of the
number is the same; therefore, ordering is not problematic. However, negative numbers have a distinction that
students need to understand. As the negative number increases (moves to the left on a number line), the value of
the number decreases. For example, –24 is less than –14 because –24 is located to the left of –14 on the number
line. However, absolute value is the distance from zero. In terms of absolute value (or distance) the absolute value
of –24 is greater than the absolute value of –14. For negative numbers, as the absolute value increases, the value of
the negative number decreases.

Mathematics
RP = Ratios and Proportional Reasoning NS= The Number System EE= Expressions and Equations G= Geometry SP= Statistics and Probability
Grade 6 Unit 3: Operations with Fractions (~ 6 weeks)
Unit Overview: Students begin to work on important sixth grade fluencies in arithmetic operations in Unit 3. Students learned in Grade 5 to add and subtract
fractions and to divide whole numbers by unit fractions and unit fractions by whole numbers. Now, they solidify those skills and concepts and apply and extend
their understanding of multiplication and division to divide fractions by fractions. The meaning of this operation is connected to real‐world problems as students
are asked to create and solve fraction division word problems. Students must attend to precision (MP 6) and make sense of problems and persevere in solving them
(MP 1) as they solve a variety of challenging problems that utilize many of their previously learned and newly acquired arithmetic skills.
Guiding Question: What are good strategies for making sense of fraction problems with all four operations?
The student will be able to: The teacher will use appropriate instructional strategies/approaches based on the needs of the student.
Component Cluster 6.NS Apply and extend previous understands of multiplication and division to divide fractions by fractions.
6.NS.1 Interpret and compute quotients of fractions, and
solve word problems involving division of fractions by
fractions, e.g., by using visual fraction models and
equations to represent the problem. For example, create a
story context for (2/3) ÷ (3/4) and use a visual fraction
model to show the quotient; use the relationship between
multiplication and division to explain that (2/3) ÷ (3/4) =
8/9 because 3/4 of 8/9 is 2/3. (In general, (a/b) ÷ (c/d) =
ad/bc.) How much chocolate will each person get if 3
people share 1/2 lb of chocolate equally? How many 3/4-
cup servings are in 2/3 of a cup of yogurt? How wide is a
rectangular strip of land with length 3/4 mi and area 1/2
square mi
In 5th grade students divided whole numbers by unit fractions and divided unit fractions by whole numbers.
Students continue to develop this concept by using visual models and equations to divide whole numbers by
fractions and fractions by fractions to solve word problems. Students develop an understanding of the relationship
between multiplication and division.
Component Cluster 6.NS Compute fluently with multi-digit numbers and find common factors and multiples.
6.NS.3 Fluently add, subtract, multiply, and divide multi-
digit decimals using the standard algorithm for each
operation.*
*This fluency standard begins in this module and is developed
throughout the remainder of the year.
Procedural fluency is defined by the Common Core as “skill in carrying out procedures flexibly, accurately,
efficiently and appropriately”. In 4th and 5th grades, students added and subtracted decimals. Multiplication and
division of decimals were introduced in 5th grade (decimals to the hundredth place). At the elementary level, these
operations were based on concrete models or drawings and strategies based on place value, properties of
operations, and/or the relationship between addition and subtraction. In 6th grade, students become fluent in the use
of the standard algorithms of each of these operations.
The use of estimation strategies supports student understanding of decimal operations.
6.NS.4 Find the greatest common factor of two whole
numbers less than or equal to 100 and the least common
multiple of two whole numbers less than or equal to 12.
Use the distributive property to express a sum of two
whole numbers 1–100 with a common factor as a multiple
of a sum of two whole numbers with no common factor.
For example, express 36 + 8 as 4 (9 + 2).
See Unit 1.

Mathematics
RP = Ratios and Proportional Reasoning NS= The Number System EE= Expressions and Equations G= Geometry SP= Statistics and Probability
Component Cluster 6.NS Apply and extend previous understandings of numbers to the system of rational numbers.
6.NS.6 Understand a rational number as a point on the
number line. Extend number line diagrams and coordinate
axes familiar from previous grades to represent points on
the line and in the plane with negative number
coordinates.
See Unit 2.
Component Cluster 6.EE Apply and extend previous understandings of arithmetic to algebraic expressions.
6.EE.2 Write, read, and evaluate expressions in which
letters stand for numbers.
a. Write expressions that record operations with
numbers and with letters standing for numbers. For
example, express the calculation “Subtract y from 5”
as 5 – y.
See Unit 1.
b. Identify parts of an expression using mathematical
terms (sum, term, product, factor, quotient,
coefficient); view one or more parts of an expression
as a single entity. For example, describe the
expression 2 (8 + 7) as a product of two factors; view
(8 + 7) as both a single entity and a sum of two
terms.
See Unit 1.
c. Evaluate expressions at specific values of their
variables. Include expressions that arise from
formulas used in real-world problems. Perform
arithmetic operations, including those involving
whole- number exponents, in the conventional order
when there are no parentheses to specify a particular
order (Order of Operations). For example, use the
formulas V = s3 and A = 6 s2 to find the volume and
surface area of a cube with sides of length s = ½.
See Unit 1.
Component Cluster 6.EE Reason about and solve one-variable equations and inequalities.
6.EE.6 Use variables to represent numbers and write
expressions when solving a real-world or mathematical
problem; understand that a variable can represent an
unknown number, or, depending on the purpose at hand,
any number in a specified set.
Students write expressions to represent various real-world situations. Given a contextual situation, students define
variables and write an expression to represent the situation.
No solving is expected with this standard; however, 6.EE.2c does address the evaluating of the expressions.

Mathematics
RP = Ratios and Proportional Reasoning NS= The Number System EE= Expressions and Equations G= Geometry SP= Statistics and Probability
Students understand the inverse relationships that can exist between two variables. For example, if Sally has 3
times as many bracelets as Jane, then Jane has the amount of Sally. If S represents the number of bracelets Sally
has, the s or represents the amount Jane has.
Connecting writing expressions with story problems and/or drawing pictures will give students a context for this
work. It is important for students to read algebraic expressions in a manner that reinforces that the variable
represents a number.
6.EE.7 Solve real-world and mathematical problems by
writing and solving equations of the form x + p = q and
px = q for cases in which p, q and x are all nonnegative
rational numbers.
Students have used algebraic expressions to generate answers given values for the variable. This understanding is
now expanded to equations where the value of the variable is unknown but the outcome is known. For example, in
the expression, x + 4, any value can be substituted for the x to generate a numerical answer; however, in the
equation x + 4 = 6, there is only one value that can be used to get a 6. Problems should be in context when possible
and use only one variable.
Students write equations from real-world problems and then use inverse operations to solve one-step equations
based on real-world situations. Equations may include fractions and decimals with non-negative solutions.
Students recognize that dividing by 6 and multiplying by produces the same result. For example, = 9 and
x = 9 will produce the same result. Beginning experiences in solving equations require students to understand
the meaning of the equation and the solution in the context of the problem.
1
3
1
3
s
3
1
6
x
6
1
6

Mathematics
RP = Ratios and Proportional Reasoning NS= The Number System EE= Expressions and Equations G= Geometry SP= Statistics and Probability
Grade 6 Unit 4: Geometry (~ 5 weeks)
Unit Overview: Unit 4 provides an opportunity to practice previously learned material in the context of geometry; students apply their newly acquired capabilities
with expressions and equations to solve for unknowns in area, surface area, and volume problems.
Unit 4 is an opportunity to deepen student understanding of perimeter, area, and volume by applying and extending these concepts to develop formulas for finding
the area of triangles, area of other two-dimensional figures, and volume of right rectangular prisms with fractional edge lengths. Students will solidify these
concepts through explorations of the effect of one measurement on another. Students also begin to graph points and draw lines and polygons in all four quadrants,
a concept that continues throughout and is used into high school and beyond. Students will need to model with mathematics (MP 4) and attend to precision (MP 6)
as they work to solve the real-life and mathematical situations posed in the unit.
Guiding Question: How and when do you use the real-life context of a measurement problem when you are solving it?
The student will be able to: The teacher will use appropriate instructional strategies/approaches based on the needs of the student.
Component Cluster 6.NS Apply and extend previous understandings of numbers to the system of rational numbers.
6.NS.8 Solve real-world and mathematical problems by
graphing points in all four quadrants of the coordinate
plane. Include use of coordinates and absolute value to
find distances between points with the same first
coordinate or the same second coordinate.
Students find the distance between points when ordered pairs have the same x-coordinate (vertical) or same y-
coordinate (horizontal). Coordinates can be in two quadrants and include rational numbers.
Students graph coordinates for polygons and find missing vertices based on properties of triangles and
quadrilaterals.
Component Cluster 6.G Solve real-world and mathematical problems involving area, surface area, and volume.
6.G.1 Find the area of right triangles, other triangles,
special quadrilaterals, and polygons by composing into
rectangles or decomposing into triangles and other
shapes; apply these techniques in the context of solving
real-world and mathematical problems.
Students continue to understand that area is the number of squares needed to cover a plane figure. Students should
know the formulas for rectangles and triangles. “Knowing the formula” does not mean memorization of the
formula. To “know” means to have an understanding of why the formula works and how the formula relates to the
measure (area) and the figure. This understanding should be for all students.
Finding the area of triangles is introduced in relationship to the area of rectangles – a rectangle can be decomposed
into two congruent triangles. Therefore, the area of the triangle is ½ the area of the rectangle. The area of a
rectangle can be found by multiplying base x height; therefore, the area of the triangle is ½ bh or (b x h)/2.
The following site helps students to discover the area formula of triangles.
http://illuminations.nctm.org/LessonDetail.aspx?ID=L577
Students decompose shapes into rectangles and triangles to determine the area. For example, a trapezoid can be
decomposed into triangles and rectangles (see figures below). Using the trapezoid’s dimensions, the area of the
individual triangle(s) and rectangle can be found and then added together. Special quadrilaterals include rectangles,
squares, parallelograms, trapezoids, rhombi, and kites.

Mathematics
RP = Ratios and Proportional Reasoning NS= The Number System EE= Expressions and Equations G= Geometry SP= Statistics and Probability
Note: Students recognize the marks on the isosceles trapezoid indicating the two sides have equal measure.
6.G.2 Find the volume of a right rectangular prism with
fractional edge lengths by packing it with unit cubes of
the appropriate unit fraction edge lengths, and show that
the volume is the same as would be found by multiplying
the edge lengths of the prism. Apply the formulas V = l w
h and V = b h to find volumes of right rectangular prisms
with fractional edge lengths in the context of solving real-
world and mathematical problems.
In fifth grade, students calculated the volume of right rectangular prisms (boxes) using whole number edges. The
use of models was emphasized as students worked to derive the formula V = Bh (5.MD.3, 5.MD.4, 5.MD.5)
The unit cube was 1 x 1 x 1.
In sixth grade, the unit cube will have fractional edge lengths. (i.e. ½ • ½ • ½ ) Students find the volume of the right
rectangular prism with these unit cubes.
Students can explore the connection between filling a box with unit cubes and the volume formula using interactive
applets such as the Cubes Tool on NCTM’s Illuminations (http://illuminations.nctm.org/ActivityDetail.aspx?ID=6).
In addition to filling boxes, students can draw diagrams to represent fractional side lengths, connecting with
multiplication of fractions. This process is similar to composing and decomposing two-dimensional shapes.
6.G.3 Draw polygons in the coordinate plane given
coordinates for the vertices; use coordinates to find the
length of a side joining points with the same first
coordinate or the same second coordinate. Apply these
techniques in the context of solving real-world and
mathematical problems.
Students are given the coordinates of polygons to draw in the coordinate plane. If both x-coordinates are the same
(2, -1) and (2, 4), then students recognize that a vertical line has been created and the distance between these
coordinates is the distance between -1 and 4, or 5. If both the y-coordinates are the same (-5, 4) and (2, 4), then
students recognize that a horizontal line has been created and the distance between these coordinates is the distance
between -5 and 2, or 7. Using this understanding, students solve real-world and mathematical problems, including
finding the area and perimeter of geometric figures drawn on a coordinate plane.
This standard can be taught in conjunction with 6.G.1 to help students develop the formula for the triangle by using
the squares of the coordinate grid. Given a triangle, students can make the corresponding square or rectangle and
realize the triangle is ½.
6.G.4 Represent three-dimensional figures using nets
made up of rectangles and triangles, and use the nets to
find the surface area of these figures. Apply these
techniques in the context of solving real-world and
mathematical problems.
A net is a two-dimensional representation of a three-dimensional figure. Students represent three-dimensional
figures whose nets are composed of rectangles and triangles. Students recognize that parallel lines on a net are
congruent. Using the dimensions of the individual faces, students calculate the area of each rectangle and/or
triangle and add these sums together to find the surface area of the figure.
Students construct models and nets of three-dimensional figures, describing them by the number of edges, vertices,
and faces. Solids include rectangular and triangular prisms. Students are expected to use the net to calculate the
surface area.
Students can create nets of 3D figures with specified dimensions using the Dynamic Paper Tool on NCTM’s
Illuminations (http://illuminations.nctm.org/ActivityDetail.aspx?ID=205).
Students also describe the types of faces needed to create a three-dimensional figure. Students make and test
conjectures by determining what is needed to create a specific three-dimensional figure.
Right trapezoid Isosceles trapezoid

Mathematics
RP = Ratios and Proportional Reasoning NS= The Number System EE= Expressions and Equations G= Geometry SP= Statistics and Probability
Component Cluster 6.EE Apply and extend previous understanding of arithmetic to algebraic expressions.
*The EE topics are explored in this unit in the context of geometry.
6.EE.2 Write, read, and evaluate expressions in which
letters stand for numbers.
a. Write expressions that record operations with numbers
and with letters standing for numbers. For example,
express the calculation “Subtract y from 5” as 5 – y.
See Unit 1.
c. Evaluate expressions at specific values of their
variables. Include expressions that arise from formulas
used in real-world problems. Perform arithmetic
operations, including those involving whole- number
exponents, in the conventional order when there are no
parentheses to specify a particular order (Order of
Operations). For example, use the formulas V = s3 and A
= 6 s2 to find the volume and surface area of a cube with
sides of length s = ½.
6.EE.3 Apply the properties of operations to generate
equivalent expressions. For example, apply the
distributive property to the expression 3 (2 + x) to
produce the equivalent expression 6 + 3x; apply the
distributive property to the expression 24x + 18y to
produce the equivalent expression 6 (4x + 3y); apply
properties of operations to y + y + y to produce the
equivalent expression 3y.
See Unit 1.
6.EE.4 Identify when two expressions are equivalent
(i.e., when the two expressions name the same number
regardless of which value is substituted into them). For
example, the expressions y + y + y and 3y are equivalent
because they name the same number regardless of which
number y stands for.
See Unit 1.
Component Cluster 6.EE Reason about and solve one-variable equations and inequalities.
6.EE.6 Use variables to represent numbers and write
expressions when solving a real-world or mathematical
problem; understand that a variable can represent an
unknown number, or, depending on the purpose at hand,
any number in a specified set.
See Unit 3.

Mathematics
RP = Ratios and Proportional Reasoning NS= The Number System EE= Expressions and Equations G= Geometry SP= Statistics and Probability
Component Cluster 6.EE Represent and analyze quantitative relationships between dependent and independent variables.
6.EE.9 Use variables to represent two quantities in a
real-world problem that change in relationship to one
another; write an equation to express one quantity,
thought of as the dependent variable, in terms of the other
quantity, thought of as the independent variable. Analyze
the relationship between the dependent and independent
variables using graphs and tables, and relate these to the
equation. For example, in a problem involving motion at
constant speed, list and graph ordered pairs of distances
and times, and write the equation d = 65t to represent the
relationship between distance and time.
The purpose of this standard is for students to understand the relationship between two variables, which begins with
the distinction between dependent and independent variables. The independent variable is the variable that can be
changed; the dependent variable is the variable that is affected by the change in the independent variable. Students
recognize that the independent variable is graphed on the x-axis; the dependent variable is graphed on the y-axis.
Students recognize that not all data should be graphed with a line. Data that is discrete would be graphed with
coordinates only. Discrete data is data that would not be represented with fractional parts such as people, tents,
records, etc. For example, a graph illustrating the cost per person would be graphed with points since part of a
person would not be considered. A line is drawn when both variables could be represented with fractional parts.
Students are expected to recognize and explain the impact on the dependent variable when the independent variable
changes (As the x variable increases, how does the y variable change?) Relationships should be proportional with
the line passing through the origin. Additionally, students should be able to write an equation from a word problem
and understand how the coefficient of the dependent variable is related to the graph and /or a table of values.
Students can use many forms to represent relationships between quantities. Multiple representations include
describing the relationship using language, a table, an equation, or a graph. Translating between multiple
representations helps students understand that each form represents the same relationship and provides a different
perspective.

Mathematics
RP = Ratios and Proportional Reasoning NS= The Number System EE= Expressions and Equations G= Geometry SP= Statistics and Probability
Grade 6 Unit 5: Operations Including Decimals and Percents (~ 5 weeks)
Unit Overview: Students proceed with their work on important sixth grade fluencies in arithmetic operations in Unit 5. Students continue (from fifth grade) to
develop algorithms and build fluency with adding, subtracting, multiplying, and dividing multi-digit decimal numbers using the standard algorithms. Students will
also identify which operations will be helpful to solve problems and continue their exploration of percents. As students develop algorithms, they will need to look
for and express regularity in repeated reasoning (MP8) and continue to attend to precision (MP 6) in order to be accurate problem-solvers.
Guiding Question: What are good strategies for checking if an answer to a decimal problem with any of the four operations is reasonable?
The student will be able to: The teacher will use appropriate instructional strategies/approaches based on the needs of the student.
Component Cluster 6.NS Compute fluently with multi-digit numbers and find common factors and multiples.
6.NS.2 Fluently divide multi-digit numbers using the
standard algorithm.
In the elementary grades, students were introduced to division through concrete models and various strategies to
develop an understanding of this mathematical operation (limited to 4-digit numbers divided by 2-digit numbers).
In 6th grade, students become fluent in the use of the standard division algorithm, continuing to use their
understanding of place value to describe what they are doing. Place value has been a major emphasis in the
elementary standards. This standard is the end of this progression to address students’ understanding of place
value.
6.NS.3 Fluently add, subtract, multiply, and divide multi-
digit decimals using the standard algorithm for each
operation.
Procedural fluency is defined by the Common Core as “skill in carrying out procedures flexibly, accurately,
efficiently and appropriately”. In 4th and 5th grades, students added and subtracted decimals. Multiplication and
division of decimals were introduced in 5th grade (decimals to the hundredth place). At the elementary level, these
operations were based on concrete models or drawings and strategies based on place value, properties of
operations, and/or the relationship between addition and subtraction. In 6th grade, students become fluent in the use
of the standard algorithms of each of these operations.
The use of estimation strategies supports student understanding of decimal operations.
Component Cluster 6.RP Understand ratio concepts and use ratio reasoning to solve problems.
6.RP.1 Understand the concept of a ratio and use ratio
language to describe a ratio relationship between two
quantities. For example, “The ratio of wings to beaks in
the bird house at the zoo was 2:1, because for every 2
wings there was 1 beak.” “For every vote candidate A
received, candidate C received nearly three votes.”
See Unit 2.
6.RP.2 Understand the concept of a unit rate a/b
associated with a ratio a:b with b = ̸0, and use rate
language in the context of a ratio relationship. For
example, “This recipe has a ratio of 3 cups of flour to 4
cups of sugar, so there is ¾ cup of flour for each cup of
sugar.” “We paid $75 for 15 hamburgers, which is a rate
of $5 per hamburger.”1
1 Expectations for unit rates in this grade are limited to
non-complex fractions.
See Unit 2.

Mathematics
RP = Ratios and Proportional Reasoning NS= The Number System EE= Expressions and Equations G= Geometry SP= Statistics and Probability
6.RP.3 Use ratio and rate reasoning to solve real-world
and mathematical problems, e.g., by reasoning about
tables of equivalent ratios, tape diagrams, double number
line diagrams, or equations.
c. Find a percent of a quantity as a rate per 100 (e.g., 30%
of a quantity means 30/100 times the quantity); solve
problems involving finding the whole, given a part and
the percent.
See Unit 2
Component Cluster 6.EE Apply and extend previous understanding of arithmetic to algebraic expressions.
6.EE.2 Write, read, and evaluate expressions in which
letters stand for numbers.
See Unit 1.
6.EE.3 Apply the properties of operations to generate
equivalent expressions. For example, apply the
distributive property to the expression 3 (2 + x) to
produce the equivalent expression 6 + 3x; apply the
distributive property to the expression 24x + 18y to
produce the equivalent expression 6 (4x + 3y); apply
properties of operations to y + y + y to produce the
equivalent expression 3y.
See Unit 1.

Mathematics
RP = Ratios and Proportional Reasoning NS= The Number System EE= Expressions and Equations G= Geometry SP= Statistics and Probability
Grade 6 Unit 6: Expressions and Equations (~ 6 weeks)
Unit Overview: With their sense of number expanded to include fractions, decimals, percents, and negative numbers, students begin their formal study of
algebraic expressions and equations. The unit begins with a focus on identifying variables and relationships in problem situations and describing patterns of change
in words, data tables, and graphs. Later, students learn to connect these situations to expressions and equations. Students also learn equivalent expressions by
continuously relating algebraic expressions back to arithmetic and the properties of arithmetic (commutative, associative, and distributive). They write, interpret,
and use expressions and equations as they reason about and solve one‐variable equations and inequalities and analyze quantitative relationships between two
variables. As students do this work of continually relating the algebra back to their previous arithmetic understanding, they move between reasoning abstractly and
quantitatively (MP 2) in order to construct viable arguments and critique the reasoning of others (MP 3).
Guiding Question: How can the relationships between variables be represented and analyzed with tables, graphs, and equations?
The student will be able to: The teacher will use appropriate instructional strategies/approaches based on the needs of the student.
Component Cluster 6.EE Apply and extend previous understanding of arithmetic to algebraic expressions.
6.EE.2 Write, read, and evaluate expressions in which
letters stand for numbers.
See Unit 1.
6.EE.3 Apply the properties of operations to generate
equivalent expressions. For example, apply the
distributive property to the expression 3 (2 + x) to
produce the equivalent expression 6 + 3x; apply the
distributive property to the expression 24x + 18y to
produce the equivalent expression 6 (4x + 3y); apply
properties of operations to y + y + y to produce the
equivalent expression 3y.
See Unit 1.
6.EE.4 Identify when two expressions are equivalent (i.e.,
when the two expressions name the same number
regardless of which value is substituted into them). For
example, the expressions y + y + y and 3y are equivalent
because they name the same number regardless of which
number y stands for.
See Unit 4.
Component Cluster 6.EE Reason about and solve one-variable equations and inequalities.
6.EE.5 Understand solving an equation or inequality as a
process of answering a question: which values from a
specified set, if any, make the equation or inequality true?
Use substitution to determine whether a given number in
a specified set makes an equation or inequality true.
In elementary grades, students explored the concept of equality. In 6th grade, students explore equations as
expressions being set equal to a specific value. The solution is the value of the variable that will make the equation
or inequality true. Students use various processes to identify the value(s) that when substituted for the variable will
make the equation true: Reasoning, Use knowledge of fact families to write related equations, Use knowledge of
inverse operations, Scale model, and Bar model.
6.EE.6 Use variables to represent numbers and write
expressions when solving a real-world or mathematical
problem; understand that a variable can represent an
unknown number, or, depending on the purpose at hand,
any number in a specified set.
See Unit 3.

Mathematics
RP = Ratios and Proportional Reasoning NS= The Number System EE= Expressions and Equations G= Geometry SP= Statistics and Probability
6.EE.7 Solve real-world and mathematical problems by
writing and solving equations of the form x + p = q and
px = q for cases in which p, q and x are all nonnegative
rational numbers.
Students have used algebraic expressions to generate answers given values for the variable. This understanding is
now expanded to equations where the value of the variable is unknown but the outcome is known. For example, in
the expression, x + 4, any value can be substituted for the x to generate a numerical answer; however, in the
equation x + 4 = 6, there is only one value that can be used to get a 6. Problems should be in context when possible
and use only one variable.
Students write equations from real-world problems and then use inverse operations to solve one-step equations
based on real-world situations. Equations may include fractions and decimals with non-negative solutions.
Students recognize that dividing by 6 and multiplying by produces the same result. For example, = 9 and
x = 9 will produce the same result. Beginning experiences in solving equations require students to understand
the meaning of the equation and the solution in the context of the problem.
6.EE.8 Write an inequality of the form x > c or x < c to
represent a constraint or condition in a real-world or
mathematical problem. Recognize that inequalities of the
form x > c or x < c have infinitely many solutions;
represent solutions of such inequalities on number line
diagrams.
Many real-world situations are represented by inequalities. Students write inequalities to represent real-world and
mathematical situations. Students use the number line to represent inequalities from various contextual and
mathematical situations.
A number line diagram is drawn with an open circle when an inequality contains a < or > symbol to show solutions
that are less than or greater than the number but not equal to the number. The circle is shaded, as in the example
above, when the number is to be included. Students recognize that possible values can include fractions and
decimals, which are represented on the number line by shading. Shading is extended through the arrow on a
number line to show that an inequality has an infinite number of solutions.
Component Cluster 6.EE Represent and analyze quantitative relationships between dependent and independent variables.
6.EE.9 Use variables to represent two quantities in a real-
world problem that change in relationship to one another;
write an equation to express one quantity, thought of as
the dependent variable, in terms of the other quantity,
thought of as the independent variable. Analyze the
relationship between the dependent and independent
variables using graphs and tables, and relate these to the
equation. For example, in a problem involving motion at
constant speed, list and graph ordered pairs of distances
and times, and write the equation d = 65t to represent the
relationship between distance and time.
See Unit 4.
Component Cluster 6.NS Apply and extend previous understandings of numbers to the system of rational numbers.
6.NS.6 Understand a rational number as a point on the
number line. Extend number line diagrams and coordinate
axes familiar from previous grades to represent points on
the line and in the plane with negative number
coordinates.
See Unit 4.
1
6
x
6
1
6

Mathematics
RP = Ratios and Proportional Reasoning NS= The Number System EE= Expressions and Equations G= Geometry SP= Statistics and Probability
b. Understand signs of numbers in ordered pairs as
indicating locations in quadrants of the coordinate plane;
recognize that when two ordered pairs differ only by
signs, the locations of the points are related by reflections
across one or both axes.
c. Find and position integers and other rational numbers
on a horizontal or vertical number line diagram; find and
position pairs of integers and other rational numbers on a
coordinate plane.
Students worked with Quadrant I in elementary school. As the x-axis and y-axis are extending to include negatives,
students begin to with the Cartesian Coordinate system. Students recognize the point where the x-axis and y-axis
intersect as the origin. Students identify the four quadrants and are able to identify the quadrant for an ordered pair
based on the signs of the coordinates. For example, students recognize that in Quadrant II, the signs of all ordered
pairs would be (–, +).
Students understand the relationship between two ordered pairs differing only by signs as reflections across one or
both axes. For example, in the ordered pairs (-2, 4) and (-2, -4), the y-coordinates differ only by signs, which
represents a reflection across the x-axis. A change is the x-coordinates from (-2, 4) to (2, 4), represents a reflection
across the y-axis. When the signs of both coordinates change, [(2, -4) changes to (-2, 4)], the ordered pair has been
reflected across both axes.
6.NS.8 Solve real-world and mathematical problems by
graphing points in all four quadrants of the coordinate
plane. Include use of coordinates and absolute value to
find distances between points with the same first
coordinate or the same second coordinate.
See Unit 4.
Component Cluster 6.RP Understand ratio concepts and use ratio reasoning to solve problems.
6.RP.2 Understand the concept of a unit rate a/b
associated with a ratio a:b with b = ̸0, and use rate
language in the context of a ratio relationship. For
example, “This recipe has a ratio of 3 cups of flour to 4
cups of sugar, so there is ¾ cup of flour for each cup of
sugar.” “We paid $75 for 15 hamburgers, which is a rate
of $5 per hamburger.”
See Unit 2.
6.RP.3 Use ratio and rate reasoning to solve real-world
and mathematical problems, e.g., by reasoning about
tables of equivalent ratios, tape diagrams, double number
line diagrams, or equations.
a. Make tables of equivalent ratios relating quantities with
whole- number measurements, find missing values in the
tables, and plot the pairs of values on the coordinate
plane. Use tables to compare ratios.
See Unit 2.
b. Solve unit rate problems including those involving unit
pricing and constant speed. For example, if it took 7 hours
to mow 4 lawns, then at that rate, how many lawns could
be mowed in 35 hours? At what rate were lawns being
mowed?
See Unit 2.

Mathematics
RP = Ratios and Proportional Reasoning NS= The Number System EE= Expressions and Equations G= Geometry SP= Statistics and Probability
d. Use ratio reasoning to convert measurement units;
manipulate and transform units appropriately when
multiplying or dividing quantities.
A ratio can be used to compare measures of two different types, such as inches per foot, milliliters per liter and
centimeters per inch. Students recognize that a conversion factor is a fraction equal to 1 since the numerator and
denominator describe the same quantity. For example, 12 inches is a conversion factor since the numerator and 1
foot denominator equal the same amount. Since the ratio is equivalent to 1, the identity property of multiplication
allows an amount to be multiplied by the ratio. Also, the value of the ratio can also be expressed as 1 foot allowing
for the conversion ratios to be expressed in a format so that units will “cancel”. 12 inches Students use ratios as
conversion factors and the identity property for multiplication to convert ratio units.

Mathematics
RP = Ratios and Proportional Reasoning NS= The Number System EE= Expressions and Equations G= Geometry SP= Statistics and Probability
Grade 6 Unit 7: Introduction to Statistics (~ 5 weeks)
Unit Overview: In Unit 7, students develop an understanding of statistical variability and apply that understanding as they summarize, describe, and display
distributions. In particular, careful attention is given to measures of center and variability. Students will need to use appropriate tools strategically (MP 5) as they
select appropriate measures of center and variability.
Guiding Question: What tools best help you to analyze data?
The student will be able to: The teacher will use appropriate instructional strategies/approaches based on the needs of the student.
Component Cluster 6.SP Develop understanding of statistical variability.
6.SP.1 Recognize a statistical question as one that
anticipates variability in the data related to the question
and accounts for it in the answers. For example, “How
old am I?” is not a statistical question, but “How old are
the students in my school?” is a statistical question
because one anticipates variability in students’ ages.
Statistics are numerical data relating to a group of individuals; statistics is also the name for the science of
collecting, analyzing and interpreting such data. A statistical question anticipates an answer that varies from one
individual to the next and is written to account for the variability in the data. Data are the numbers produced in
response to a statistical question. Data are frequently collected from surveys or other sources (i.e. documents).
Students differentiate between statistical questions and those that are not. A statistical question is one that collects
information that addresses differences in a population. The question is framed so that the responses will allow for
the differences. For example, the question, “How tall am I?” is not a statistical question because there is only one
response; however, the question, “How tall are the students in my class?” is a statistical question since the
responses anticipates variability by providing a variety of possible anticipated responses that have numerical
answers. Questions can result in a narrow or wide range of numerical values.
6.SP.2 Understand that a set of data collected to answer a
statistical question has a distribution, which can be
described by its center, spread, and overall shape.
The distribution is the arrangement of the values of a data set. Distribution can be described using center (median
or mean), and spread. Data collected can be represented on graphs, which will show the shape of the distribution of
the data. Students examine the distribution of a data set and discuss the center, spread and overall shape with dot
plots, histograms and box plots.
NOTE: Mode as a measure of center and range as a measure of variability are not addressed in the CCSS and as
such are not a focus of instruction. These concepts can be introduced during instruction as needed.
6.SP.3 Recognize that a measure of center for a numerical
data set summarizes all of its values with a single number,
while a measure of variation describes how its values
vary with a single number.
Data sets contain many numerical values that can be summarized by one number such as a measure of center. The
measure of center gives a numerical value to represent the center of the data (i.e. midpoint of an ordered list or the
balancing point). Another characteristic of a data set is the variability (or spread) of the values. Measures of
variability are used to describe this characteristic.

Mathematics
RP = Ratios and Proportional Reasoning NS= The Number System EE= Expressions and Equations G= Geometry SP= Statistics and Probability
Component Cluster 6.SP Summarize and describe distributions.
6.SP.4 Display numerical data in plots on a number line,
including dot plots, histograms, and box plots.
Students display data graphically using number lines. Dot plots, histograms and box plots are three graphs to be
used. Students are expected to determine the appropriate graph as well as read data from graphs generated by
others.
Dot plots are simple plots on a number line where each dot represents a piece of data in the data set. Dot plots are
suitable for small to moderate size data sets and are useful for highlighting the distribution of the data including
clusters, gaps, and outliers.
A histogram shows the distribution of continuous data using intervals on the number line. The height of each bar
represents the number of data values in that interval. In most real data sets, there is a large amount of data and many
numbers will be unique. A graph (such as a dot plot) that shows how many ones, how many twos, etc. would not be
meaningful; however, a histogram can be used. Students group the data into convenient ranges and use these
intervals to generate a frequency table and histogram. Note that changing the size of the bin changes the appearance
of the graph and the conclusions may vary from it.
A box plot shows the distribution of values in a data set by dividing the set into quartiles. It can be graphed either
vertically or horizontally. The box plot is constructed from the five-number summary (minimum, lower quartile,
median, upper quartile, and maximum). These values give a summary of the shape of a distribution. Students
understand that the size of the box or whiskers represents the middle 50% of the data.
Students can use applets to create data displays. Examples of applets include the Box Plot Tool and Histogram Tool
on NCTM’s Illuminations.
Box Plot Tool - http://illuminations.nctm.org/ActivityDetail.aspx?ID=77
Histogram Tool -- http://illuminations.nctm.org/ActivityDetail.aspx?ID=78
6.SP.5 Summarize numerical data sets in relation to their
context, such as by:
a. Reporting the number of observations.
b. Describing the nature of the attribute under
investigation, including how it was measured and its
units of measurement.
c. Giving quantitative measures of center (median
and/or mean) and variability (interquartile range
and/or mean absolute deviation), as well as
describing any overall pattern and any striking
deviations from the overall pattern with reference to
the context in which the data were gathered.
d. Relating the choice of measures of center and
variability to the shape of the data distribution and
the context in which the data were gathered.
Students summarize numerical data by providing background information about the attribute being measured,
methods and unit of measurement, the context of data collection activities (addressing random sampling), the
number of observations, and summary statistics. Summary statistics include quantitative measures of center
(median and median) and variability (interquartile range and mean absolute deviation) including extreme values
(minimum and maximum), mean, median, mode, range, and quartiles.
Students record the number of observations. Using histograms, students determine the number of values between
specified intervals. Given a box plot and the total number of data values, students identify the number of data
points that are represented by the box. Reporting of the number of observations must consider the attribute of the
data sets, including units (when applicable).
Measures of Center
Given a set of data values, students summarize the measure of center with the median or mean. The median is the
value in the middle of an ordered list of data. The value means that 50% of the data is greater than or equal to it
and that 50% of the data is less than or equal to it.

Mathematics
RP = Ratios and Proportional Reasoning NS= The Number System EE= Expressions and Equations G= Geometry SP= Statistics and Probability
The mean is the arithmetic average; the sum of the values in a data set divided by how many values there are in the
data set. The mean measures center in the sense that it is the value that each data point would take on if the total of
the data values were redistributed equally, and also in the sense that it is a balance point.
Students develop these understandings of what the mean represents by redistributing data sets to be level or fair
(equal distribution) and by observing that the total distance of the data values above the mean is equal to the total
distance of the data values below the mean (balancing point).
Students use the concept of mean to solve problems. Given a data set represented in a frequency table, students
calculate the mean. Students find a missing value in a data set to produce a specific average.
Measures of Variability
Measures of variability/variation can be described using the interquartile range or the Mean Absolute Deviation.
The interquartile range (IQR) describes the variability between the middle 50% of a data set. It is found by
subtracting the lower quartile from the upper quartile. It represents the length of the box in a box plot and is not
affected by outliers.
Students find the IQR from a data set by finding the upper and lower quartiles and taking the difference or from
reading a box plot.
Mean Absolute Deviation (MAD) describes the variability of the data set by determining the absolute deviation (the
distance) of each data piece from the mean and then finding the average of these deviations.
Both the interquartile range and the Mean Absolute Deviation are represented by a single numerical value. Higher
values represent a greater variability in the data.
Students understand how the measures of center and measures of variability are represented by graphical displays.
Students describe the context of the data, using the shape of the data and are able to use this information to
determine an appropriate measure of center and measure of variability. The measure of center that a student
chooses to describe a data set will depend upon the shape of the data distribution and context of data collection. The
mode is the value in the data set that occurs most frequently. The mode is the least frequently used as a measure of
center because data sets may not have a mode, may have more than one mode, or the mode may not be descriptive
of the data set. The mean is a very common measure of center computed by adding all the numbers in the set and
dividing by the number of values. The mean can be affected greatly by a few data points that are very low or very
high. In this case, the median or middle value of the data set might be more descriptive. In data sets that are
symmetrically distributed, the mean and median will be very close to the same. In data sets that are skewed, the
mean and median will be different, with the median frequently providing a better overall description of the data set.
Component Cluster 6.RP Understand ratio concepts and use ratio reasoning to solve problems.
6.RP.3 Use ratio and rate reasoning to solve real-world
and mathematical problems, e.g., by reasoning about
tables of equivalent ratios, tape diagrams, double number
line diagrams, or equations.
a. Make tables of equivalent ratios relating quantities with
whole- number measurements, find missing values in the
See Unit 2.

Mathematics
RP = Ratios and Proportional Reasoning NS= The Number System EE= Expressions and Equations G= Geometry SP= Statistics and Probability
tables, and plot the pairs of values on the coordinate
plane. Use tables to compare ratios.
Component Cluster 6.NS Apply and extend previous understandings of numbers to the system of rational numbers.
6.NS.6 Understand a rational number as a point on the
number line. Extend number line diagrams and coordinate
axes familiar from previous grades to represent points on
the line and in the plane with negative number
coordinates.
See Unit 2.
6.NS.7 Understand ordering and absolute value of
rational numbers.
See Unit 2.

Mathematics
RP = Ratios and Proportional Reasoning NS= The Number System EE= Expressions and Equations G= Geometry SP= Statistics and Probability
Grade 7 In Grade 7, instructional time should focus on four critical areas: (1) developing understanding of and applying proportional relationships; (2) developing
understanding of operations with rational numbers and working with expressions and linear equations; (3) solving problems involving scale drawings and informal
geometric constructions, and working with two- and three-dimensional shapes to solve problems involving area, surface area, and volume; and (4) drawing
inferences about populations based on samples.
(1) Students extend their understanding of ratios and develop understanding of proportionality to solve single- and multi-step problems. Students use their
understanding of ratios and proportionality to solve a wide variety of percent problems, including those involving discounts, interest, taxes, tips, and
percent increase or decrease. Students solve problems about scale drawings by relating corresponding lengths between the objects or by using the fact that
relationships of lengths within an object are preserved in similar objects. Students graph proportional relationships and understand the unit rate informally
as a measure of the steepness of the related line, called the slope. They distinguish proportional relationships from other relationships.
(2) Students develop a unified understanding of number, recognizing fractions, decimals (that have a finite or a repeating decimal representation), and
percents as different representations of rational numbers. Students extend addition, subtraction, multiplication, and division to all rational numbers,
maintaining the properties of operations and the relationships between addition and subtraction, and multiplication and division. By applying these
properties, and by viewing negative numbers in terms of everyday contexts (e.g., amounts owed or temperatures below zero), students explain and
interpret the rules for adding, subtracting, multiplying, and dividing with negative numbers. They use the arithmetic of rational numbers as they formulate
expressions and equations in one variable and use these equations to solve problems.
(3) Students continue their work with area from Grade 6, solving problems involving the area and circumference of a circle and surface area of three-
dimensional objects. In preparation for work on congruence and similarity in Grade 8 they reason about relationships among two-dimensional figures
using scale drawings and informal geometric constructions, and they gain familiarity with the relationships between angles formed by intersecting lines.
Students work with three-dimensional figures, relating them to two-dimensional figures by examining cross-sections. They solve real-world and
mathematical problems involving area, surface area, and volume of two- and three-dimensional objects composed of triangles, quadrilaterals, polygons,
cubes and right prisms.
(4) Students build on their previous work with single data distributions to compare two data distributions and address questions about differences between
populations. They begin informal work with random sampling to generate data sets and learn about the importance of representative samples for drawing
inferences.
Standards for Mathematical Practice
1. Make sense of problems and persevere in solving them.
2. Reason abstractly and quantitatively.
3. Construct viable arguments and critique the reasoning of others.
4. Model with mathematics.
5. Use appropriate tools strategically.
6. Attend to precision.
7. Look for and make use of structure.
8. Look for and express regularity in repeated reasoning.

Mathematics
RP = Ratios and Proportional Reasoning NS= The Number System EE= Expressions and Equations G= Geometry SP= Statistics and Probability
Grade 7: Suggested Distribution of Units in Instructional Weeks Time Approximate
# of Weeks
Unit 1: Rational Numbers 17% ~ 6 weeks
Unit 2: Expressions and Equations 11 % ~ 4 weeks
Unit 3: Two-Dimensional Geometry 14 % ~ 5 weeks
Unit 4: Ratios in Geometry 14 % ~ 5 weeks
Unit 5: Ratios, Rates, Percents and Proportions 14 % ~ 5 weeks
Unit 6: Probability 8 % ~ 3 Weeks
Unit 7: Three-Dimensional Geometry 8 % ~ 3 Weeks
Unit 8: Statistics 14 % ~ 5 Weeks
Instructional
Focus of Unit: Ratios and Proportional Reasoning Number System Expressions and Equations/ Functions Geometry Statistics and Probability
Unit 1: Rational Numbers
17%
Unit 2: Expressions and Equations
11%
Unit 3: Two-Dimensional
Geometry14%
Unit 4: Ratios in Geometry
14%
Unit 5: Ratios, Rates, Percents and Proportions
14%
Unit 6: Probability8%
Unit 7: Three-Dimensional
Geometry8%
Unit 8: Statistics14%
Instructional Time

Mathematics
RP = Ratios and Proportional Reasoning NS= The Number System EE= Expressions and Equations G= Geometry SP= Statistics and Probability
Grade 7 Unit 1: Rational Numbers (~ 6 weeks)
Unit Overview: In Unit 1, students continue to build an understanding of the number line from their work in Grade 6. They learn to add, subtract, multiply, and
divide rational numbers in the context of mathematical and real-life situations. They extend their understanding of expression and equations to include rational
numbers. This unit provides opportunities for students to apply the mathematical practice standards, specifically looking for and making use of structure.
Guiding Question: How does computation with positive whole numbers compare to computing with rational numbers?
The student will be able to: The teacher will use appropriate instructional strategies/approaches based on the needs of the student.
Component Cluster 7.NS Apply and extend previous understandings of operations with fractions to add, subtract, multiply, and divide rational numbers.
7.NS.1 Apply and extend previous understandings of
addition and subtraction to add and subtract rational
numbers; represent addition and subtraction on a
horizontal or vertical number line diagram.
a. Describe situations in which opposite quantities
combine to make 0. For example, a hydrogen atom has 0
charge because its two constituents are oppositely
charged.
b. Understand p + q as the number located a distance |q|
from p, in the positive or negative direction depending on
whether q is positive or negative. Show that a number and
its opposite have a sum of 0 (are additive inverses).
Interpret sums of rational numbers by describing real-
world contexts.
c. Understand subtraction of rational numbers as adding
the additive inverse, p – q = p + (–q). Show that the
distance between two rational numbers on the
number line is the absolute value of their difference, and
apply this principle in real world contexts.
d. Apply properties of operations as strategies to add and
subtract rational numbers.
Students add and subtract rational numbers. Visual representations may be helpful as students begin this work; they
become less necessary as students become more fluent with these operations. The expectation of the CCSS is to
build on student understanding of number lines developed in 6th grade.
In 6th grade, students found the distance of horizontal and vertical segments on the coordinate plane. In 7 th grade,
students build on this understanding to recognize subtraction is finding the distance between two numbers on a
number line.
7.NS.2 Apply and extend previous understandings of
multiplication and division and of fractions to multiply
and divide rational numbers.
a. Understand that multiplication is extended from
fractions to rational numbers by requiring that operations
continue to satisfy the properties of operations,
particularly the distributive property, leading to products
such as (– 1)(–1) = 1 and the rules for multiplying signed
Students understand that multiplication and division of integers is an extension of multiplication and division of
whole numbers. Students recognize that when division of rational numbers is represented with a fraction bar, each
number can have a negative sign.
Using long division from elementary school, students understand the difference between terminating and repeating
decimals. This understanding is foundational for the work with rational and irrational numbers in
8th grade. Identify which fractions will terminate (the denominator of the fraction in reduced form only has factors
of 2 and/or 5)

Mathematics
RP = Ratios and Proportional Reasoning NS= The Number System EE= Expressions and Equations G= Geometry SP= Statistics and Probability
numbers. Interpret products of rational numbers by
describing real-world contexts.
b. Understand that integers can be divided, provided that
the divisor is not zero, and every quotient of integers
(with non-zero divisor) is a rational number. If p and q are
integers, then –(p/q) = (–p)/q = p/(–
q). Interpret quotients of rational numbers by describing
real-world contexts.
c. Apply properties of operations as strategies to multiply
and divide rational numbers.
d. Convert a rational number to a decimal using long
division; know that the decimal form of a rational number
terminates in 0s or eventually repeats.
7.NS.3 Solve real-world and mathematical problems
involving the four operations with rational numbers. *
*Computations with rational numbers extend the rules for
manipulating fractions to complex fractions.
Students use order of operations from 6th grade to write and solve problem with all rational numbers. Students
apply properties of operations and work with rational numbers (integers and positive / negative fractions and
decimals) to solve real world and mathematical problems.
Component Cluster 7.EE Solve real-life and mathematical problems using numerical and algebraic expressions and equations.
7.EE.3 Solve multi-step real-life and mathematical
problems posed with positive and negative rational
numbers in any form (whole numbers, fractions, and
decimals), using tools strategically. Apply properties of
operations to calculate with numbers in any form; convert
between forms as appropriate; and assess the
reasonableness of answers using mental computation and
estimation strategies. For example: If a woman making
$25 an hour gets a 10% raise, she will make an additional
1/10 of her salary an hour, or $2.50, for a new salary of
$27.50. If you want to place a towel bar 9 3/4 inches long
in the center of a door that is 27 ½ inches wide, you will
need to place the bar about 9 inches from each edge; this
estimate can be used as a check on the exact computation.
Students solve contextual problems and mathematical problems using rational numbers. Students convert between
fractions, decimals, and percents as needed to solve the problem. Students use estimation to justify the
reasonableness of answers.
Estimation strategies for calculations with fractions and decimals extend from students’ work with whole number
operations. Estimation strategies include, but are not limited to:
• front-end estimation with adjusting (using the highest place value and estimating from the front end making
adjustments to the estimate by taking into account the remaining amounts),
• clustering around an average (when the values are close together an average value is selected and
multiplied by the number of values to determine an estimate),
• rounding and adjusting (students round down or round up and then adjust their estimate depending on how much
the rounding affected the original values),
• using friendly or compatible numbers such as factors (students seek to fit numbers together - i.e., rounding to
factors and grouping numbers together that have round sums like 100 or 1000), and
• using benchmark numbers that are easy to compute (students select close whole numbers for fractions or decimals
to determine an estimate).

Mathematics
RP = Ratios and Proportional Reasoning NS= The Number System EE= Expressions and Equations G= Geometry SP= Statistics and Probability
7.EE.4 Use variables to represent quantities in a real-
world or mathematical problem, and construct simple
equations and inequalities to solve problems by reasoning
about the quantities.
b. Solve word problems leading to inequalities of the form
px + q > r or px + q < r, where p, q, and r are specific
rational numbers. Graph the solution set of the inequality
and interpret it in the context of the problem. For
example: As a salesperson, you are paid $50 per week
plus $3 per sale. This week you want your pay to be at
least $100. Write an inequality for the number of sales
you need to make, and describe the solutions.
Students write an equation or inequality to model the situation. Students explain how they determined whether to
write an equation or inequality and the properties of the real number system that you used to find a solution. In
contextual problems, students define the variable and use appropriate units.
Students solve and graph inequalities and make sense of the inequality in context. Inequalities may have negative
coefficients. Problems can be used to find a maximum or minimum value when in context.

Mathematics
RP = Ratios and Proportional Reasoning NS= The Number System EE= Expressions and Equations G= Geometry SP= Statistics and Probability
Grade 7 Unit 2: Expressions and Equations (~ 4 weeks)
Unit Overview: Unit 2 consolidates and expands students’ previous work with generating equivalent expressions and solving equations. Students solve real life
and mathematical problems using numerical and algebraic expressions, equations and inequalities. Unit 2 provides the opportunity for students to apply
mathematical practice standards to solving real life math problems connecting them to the algebraic representations they are using to solve the problems.
Guiding Question: How does reflecting on the real-life context of the initial math problem help to make sense of the mathematics?
The student will be able to: The teacher will use appropriate instructional strategies/approaches based on the needs of the student.
Component Cluster 7.EE Use properties of operations to generate equivalent expressions.
7.EE.1 Apply properties of operations as strategies to
add, subtract, factor, and expand linear expressions with
rational coefficients.
This is a continuation of work from 6th grade using properties of operations and combining like terms. Students
apply properties of operations and work with rational numbers to write equivalent expressions.
7.EE.2 Understand that rewriting an expression in
different forms in a problem context can shed light on the
problem and how the quantities in it are related. For
example, a + 0.05a = 1.05a means that “increase by 5%”
is the same as “multiply by 1.05.”
Students understand the reason for rewriting an expression in terms of a contextual situation. For example, students
understand that a 20% discount is the same as finding 80% of the cost, c (0.80c).
Component Cluster 7.EE Solve real-life and mathematical problems using numerical and algebraic expressions and equations.
*Cluster embedded throughout the year.
7.EE.3 Solve multi-step real-life and mathematical
problems posed with positive and negative rational
numbers in any form (whole numbers, fractions, and
decimals), using tools strategically. Apply properties of
operations to calculate with numbers in any form; convert
between forms as appropriate; and assess the
reasonableness of answers using mental computation and
estimation strategies. For example: If a woman making
$25 an hour gets a 10% raise, she will make an additional
1/10 of her salary an hour, or $2.50, for a new salary of
$27.50. If you want to place a towel bar 9 3/4 inches long
in the center of a door that is 27 ½ inches wide, you will
need to place the bar about 9 inches from each edge; this
estimate can be used as a check on the exact
computation.*
* Problems in this module take on any form but percent,
which is included in Unit 5.
See Unit 1.
7.EE.4 Use variables to represent quantities in a real-
world or mathematical problem, and construct simple
equations and inequalities to solve problems by reasoning
about the quantities.
7.EE.4a and b Students write an equation or inequality to model the situation. Students explain how they
determined whether to write an equation or inequality and the properties of the real number system that you used to
find a solution. In contextual problems, students define the variable and use appropriate units.
7.EE.4a
Students solve multi-step equations derived from word problems. Students use the arithmetic from the problem to
generalize an algebraic solution.

Mathematics
RP = Ratios and Proportional Reasoning NS= The Number System EE= Expressions and Equations G= Geometry SP= Statistics and Probability
a. Solve word problems leading to equations of the form
px + q = r and p(x + q) = r, where p, q, and r are specific
rational numbers. Solve equations of these forms fluently.
Compare an algebraic solution to an arithmetic solution,
identifying the sequence of the operations used in each
approach.
For example, the perimeter of a rectangle is 54 cm. Its
length is 6 cm. What is its width?
b. Solve word problems leading to inequalities of the form
px + q > r or px + q < r, where p, q, and r are specific
rational numbers. Graph the solution set of the inequality
and interpret it in the context of the problem. For
example: As a salesperson, you are paid $50 per week
plus $3 per sale. This week you want your pay to be at
least $100. Write an inequality for the number of sales
you need to make, and describe the solutions.
7.EE.4b Students solve and graph inequalities and make sense of the inequality in context Problems can be used to find a
maximum or minimum value when in context.

Mathematics
RP = Ratios and Proportional Reasoning NS= The Number System EE= Expressions and Equations G= Geometry SP= Statistics and Probability
Grade 7 Unit 3: Two-Dimensional Geometry (~ 5 weeks)
Unit Overview: Unit 3 begins with students drawing, constructing, describing, and analyzing geometrical figures. There is a focus on polygons and on the edge
and angle relationships of regular and irregular polygons. Students will also calculate area and circumference of circles. This unit provides the opportunity for
students to apply mathematical practice standards as they solve geometric problems using appropriate tools and formulas.
Guiding Question: When should I use estimation, freehand drawing, or special tools to measure and construct angles and polygons?
The student will be able to: The teacher will use appropriate instructional strategies/approaches based on the needs of the student.
Component Cluster 7.G Draw, construct, and describe geometrical figures and describe the relationships between them.
7.G.2 Draw (freehand, with ruler and protractor, and with
technology) geometric shapes with given conditions.
Focus on constructing triangles from three measures of
angles or sides, noticing when the conditions determine a
unique triangle, more than one triangle, or no triangle.
Students draw geometric shapes with given parameters. Parameters could include parallel lines, angles,
perpendicular lines, line segments, etc.
Students understand the characteristics of angles and side lengths that create a unique triangle, more than one
triangle or no triangle. Through exploration, students recognize that the sum of the angles of any triangle will be
180°.
Component Cluster 7.G Solve real-life and mathematical problems involving angle measure, area, surface area, and volume.
7.G.4 Know the formulas for the area and circumference
of a circle and use them to solve problems; give an
informal derivation of the relationship between the
circumference and area of a circle.
Students understand the relationship between radius and diameter. Students also understand the ratio of
circumference to diameter can be expressed as pi. Building on these understandings, students generate the formulas
for circumference and area.
The illustration shows the relationship between the circumference and area. If a circle is cut into wedges and laid
out as shown, a parallelogram results. Half of an end wedge can be moved to the other end a rectangle results. The
height of the rectangle is the same as the radius of the circle. The base length is the circumference (2Πr). The area
of the rectangle (and therefore the circle) is found by the following calculations:
A rect = Base x Height
Area = 1/2 (2Πr) x r
Area = Πr x r
Area = Πr2
Area = Base x Height
Area = 1/2 (2Πr) x r
Area = Πr x r
Area = Πr2

Mathematics
RP = Ratios and Proportional Reasoning NS= The Number System EE= Expressions and Equations G= Geometry SP= Statistics and Probability
http://mathworld.wolfram.com/Circle.html
Students solve problems (mathematical and real-world) involving circles or semi-circles.
Note: Because pi is an irrational number that neither repeats nor terminates, the measurements are approximate
when 3.14 is used in place of 𝜋.
Students build on their understanding of area from 6th grade to find the area of left-over materials when circles are
cut from squares and triangles or when squares and triangles are cut from circles.
7.G.5 Use facts about supplementary, complementary,
vertical, and adjacent angles in a multi-step problem to
write and solve simple equations for an unknown angle in
a figure.
Students use understandings of angles and deductive reasoning to write and solve equations.
Component Cluster 7.EE Use properties of operations to generate equivalent expressions.
7.EE.1 Apply properties of operations as strategies to
add, subtract, factor, and expand linear expressions with
rational coefficients.
See Unit 2.
7.EE.2 Understand that rewriting an expression in
different forms in a problem context can shed light on the
problem and how the quantities in it are related. For
example, a + 0.05a = 1.05a means that “increase by
5%” is the same as “multiply by 1.05.”
Students understand the reason for rewriting an expression in terms of a contextual situation. For example, students
understand that a 20% discount is the same as finding 80% of the cost, c (0.80c). (Also addressed in Unit 1)
Component Cluster 7.EE Solve real-life and mathematical problems using numerical and algebraic expressions and equations.*
*Cluster embedded throughout the year.
7.EE.4 Use variables to represent quantities in a real-
world or mathematical problem, and construct simple
equations and inequalities to solve problems by reasoning
about the quantities.
Students write an equation or inequality to model the situation. Students explain how they determined whether to
write an equation or inequality and the properties of the real number system that you used to find a solution. In
contextual problems, students define the variable and use appropriate units.
Component Cluster 7.NS Apply and extend previous understandings of operations with fractions to add, subtract, multiply, and divide rational numbers.
7.NS.3 Solve real-world and mathematical problems
involving the four operations with rational numbers. *
*Computations with rational numbers extend the rules for
manipulating fractions to complex fractions.
See Unit 1.

Mathematics
RP = Ratios and Proportional Reasoning NS= The Number System EE= Expressions and Equations G= Geometry SP= Statistics and Probability
Grade 7 Unit 4: Ratios in Geometry (~ 5 weeks)
Unit Overview: In Unit 4, students build an understanding of the multiplicative quality of ratios and proportional relationships through the context of geometry.
In this context, students will investigate how to recognize, represent, and test for proportional relationships and reason about scaling in geometric situations.
Students have the opportunity to apply the mathematical practice standards as they solve real-world and mathematical problems.
Guiding Question: In what ways can we use proportional relationships to help us solve problems in the everyday world?
The student will be able to: The teacher will use appropriate instructional strategies/approaches based on the needs of the student.
Component Cluster 7.RP Analyze proportional relationships and use them to solve real-world and mathematical problems.
7.RP.2 Recognize and represent proportional
relationships between quantities.
a. Decide whether two quantities are in a proportional
relationship, e.g., by testing for equivalent ratios in a table
or graphing on a coordinate plane and observing whether
the graph is a straight line through the origin.
b. Identify the constant of proportionality (unit rate) in
tables, graphs, equations, diagrams, and verbal
descriptions of proportional relationships.
Students’ understanding of the multiplicative reasoning used with proportions continues from 6th grade. Students
determine if two quantities are in a proportional relationship from a table. Fractions and decimals could be used
with this standard.
Note: This standard focuses on the representations of proportions. Solving proportions is addressed in 7.SP.3.
Students graph relationships to determine if two quantities are in a proportional relationship and to interpret the
ordered pairs. If the amounts from a table are graphed, the pairs will form a straight line through the origin,
indicating that these pairs are in a proportional relationship. The y-coordinate when x = 1 will be the unit rate. The
constant of proportionality is the unit rate. Students identify this amount from tables, graphs, equations and verbal
descriptions of proportional relationships.
7.RP.3 Use proportional relationships to solve multistep
ratio and percent problems.
In 6th grade, students used ratio tables and unit rates to solve problems. Students expand their understanding of
proportional reasoning to solve problems that can be appropriately and efficiently solved with cross-multiplication.
Students understand the mathematical foundation for cross-multiplication.
Students should be able to explain or show their work using a representation (numbers, words, pictures, physical
objects, or equations) and verify that their answer is reasonable. Students use models to identify the parts of the
problem and how the values are related.
Component Cluster 7.EE Solve real-life and mathematical problems using numerical and algebraic expressions and equations.
7.EE.3 Solve multi-step real-life and mathematical
problems posed with positive and negative rational
numbers in any form (whole numbers, fractions, and
decimals), using tools strategically. Apply properties of
operations to calculate with numbers in any form; convert
between forms as appropriate; and assess the
reasonableness of answers using mental computation and
estimation strategies. For example: If a woman making
$25 an hour gets a 10% raise, she will make an additional
1/10 of her salary an hour, or $2.50, for a new salary of
$27.50. If you want to place a towel bar 9 3/4 inches long
in the center of a door that is 27 ½ inches wide, you will
need to place the bar about 9 inches from each edge; this
estimate can be used as a check on the exact computation.
See Unit 1.

Mathematics
RP = Ratios and Proportional Reasoning NS= The Number System EE= Expressions and Equations G= Geometry SP= Statistics and Probability
7.EE.4 Use variables to represent quantities in a real-
world or mathematical problem, and construct simple
equations and inequalities to solve problems by reasoning
about the quantities.
See Unit 1.
Component Cluster 7.G Draw, construct, and describe geometrical figures and describe the relationships between them.
7.G.1 Solve problems involving scale drawings of
geometric figures, including computing actual lengths and
areas from a scale drawing and reproducing a scale
drawing at a different scale.
Students determine the dimensions of figures when given a scale and identify the impact of a scale on actual length
(one-dimension) and area (two-dimensions). Students identify the scale factor given two figures. Using a given
scale drawing, students reproduce the drawing at a different scale. Students understand that the lengths will change
by a factor equal to the product of the magnitude of the two size transformations.
Component Cluster 7.G Draw, construct, and describe geometrical figures and describe the relationships between them.
7.G.2 Draw (freehand, with ruler and protractor, and with
technology) geometric shapes with given conditions.
Focus on constructing triangles from three measures of
angles or sides, noticing when the conditions determine a
unique triangle, more than one triangle, or no triangle.
Students draw geometric shapes with given parameters. Parameters could include parallel lines, angles,
perpendicular lines, line segments, etc.
Component Cluster 7.G Solve real-life and mathematical problems involving angle measure, area, surface area, and volume.
7.G.6 Solve real-world and mathematical problems
involving area, volume and surface area of two and three-
dimensional objects composed of triangles, quadrilaterals,
polygons, cubes, and right prisms.
*Three dimensional objects are addressed in future units
of study.
Students continue work from 5th and 6th grade to work with area, volume and surface area of two-dimensional and
three-dimensional objects. (composite shapes).
“Know the formula” does not mean memorization of the formula. To “know” means to have an understanding of
why the formula works and how the formula relates to the measure (area and volume) and the figure. This
understanding should be for all students.
Students solve for missing dimensions, given the area.

Mathematics
RP = Ratios and Proportional Reasoning NS= The Number System EE= Expressions and Equations G= Geometry SP= Statistics and Probability
Grade 7 Unit 5: Ratios, Rates, Percents, and Proportions (~ 5 weeks)
Unit Overview: Unit 5 parallels Unit 4’s coverage of ratio and proportion but this time with a concentration on numerical contexts, including percent. Problems in
this unit include simple interest, tax, markups and markdowns, gratuities and commissions, fees, percent increase and decrease, and percent error. This unit
provides students with the opportunity to continue applying mathematical practice standards as they make intelligent comparisons of quantitative information in
real-life situations.
Guiding Question: How do you reason through proportional situations and recognize when such reasoning is appropriate in real-world situations?
The student will be able to: The teacher will use appropriate instructional strategies/approaches based on the needs of the student.
Component Cluster 7.RP Analyze proportional relationships and use them to solve real-world and mathematical problems.
7.RP.1 Compute unit rates associated with ratios of
fractions, including ratios of lengths, areas and other
quantities measured in like or different units. For
example, if a person walks 1/2 mile in each 1/4 hour,
compute the unit rate as the complex fraction 1/2/1/4
miles per hour, equivalently 2 miles per hour.
Students continue to work with unit rates from 6th grade; however, the comparison now includes fractions
compared to fractions. The comparison can be with like or different units. Fractions may be less than or greater
than one.
7.RP.2 Recognize and represent proportional
relationships between quantities.
a. Decide whether two quantities are in a proportional
relationship, e.g., by testing for equivalent ratios in a table
or graphing on a coordinate plane and observing whether
the graph is a straight line through the origin.
b. Identify the constant of proportionality (unit rate) in
tables, graphs, equations, diagrams, and verbal
descriptions of proportional relationships.
c. Represent proportional relationships by equations. For
example, if total cost t is proportional to the number n of
items purchased at a constant price p, the relationship
between the total cost and the number of items can be
expressed as t = pn.
d. Explain what a point (x, y) on the graph of a
proportional relationship means in terms of the situation,
with special attention to the points (0, 0) and (1, r) where
r is the unit rate.
Students’ understanding of the multiplicative reasoning used with proportions continues from 6th grade. Students
determine if two quantities are in a proportional relationship from a table. Fractions and decimals could be used
with this standard.
Note: This standard focuses on the representations of proportions. Solving proportions is addressed in 7.SP.3.
Students graph relationships to determine if two quantities are in a proportional relationship and to interpret the
ordered pairs. If the amounts from a table are graphed, the pairs will form a straight line through the origin,
indicating that these pairs are in a proportional relationship. The y-coordinate when x = 1 will be the unit rate. The
constant of proportionality is the unit rate. Students identify this amount from tables, graphs, equations and verbal
descriptions of proportional relationships.
Students write equations from context and identify the coefficient as the unit rate which is also the constant of
proportionality.
A common error is to reverse the position of the variables when writing equations. Students may find it useful to
use variables specifically related to the quantities rather than using x and y. Constructing verbal models can also be
helpful. A student might describe the situation as “the number of packs of gum times the cost for each pack is the
total cost in dollars”. They can use this verbal model to construct the equation. Students can check their equation by
substituting values and comparing their results to the table. The checking process helps student revise and recheck
their model as necessary.
7.RP.3 Use proportional relationships to solve multistep
ratio and percent problems. Examples: simple interest,
tax, markups and markdowns, gratuities and
commissions, fees, percent increase and decrease, percent
error
In 6th grade, students used ratio tables and unit rates to solve problems. Students expand their understanding of
proportional reasoning to solve problems that can be appropriately and efficiently solved with cross-multiplication.
Students understand the mathematical foundation for cross-multiplication.
Finding the percent error is the process of expressing the size of the error (or deviation) between two
measurements. To calculate the percent error, students determine the absolute deviation (positive difference)

Mathematics
RP = Ratios and Proportional Reasoning NS= The Number System EE= Expressions and Equations G= Geometry SP= Statistics and Probability
between an actual measurement and the accepted value and then divide by the accepted value. Multiplying by 100
will give the percent error. (Note the similarity between percent error and percent of increase or decrease)
% error = | estimated value - actual value | x 100 %
actual value
The use of proportional relationships is also extended to solve percent problems involving sales tax, markups and
markdowns simple interest (I = prt, where I = interest, p = principal, r = rate, and t = time (in years)), gratuities and
commissions, fees, percent increase and decrease, and percent error.
Students should be able to explain or show their work using a representation (numbers, words, pictures, physical
objects, or equations) and verify that their answer is reasonable. Students use models to identify the parts of the
problem and how the values are related. For percent increase and decrease, students identify the starting value,
determine the difference, and compare the difference in the two values to the starting value.
Component Cluster 7.EE Solve real-life and mathematical problems using numerical and algebraic expressions and equations.
7.EE.3 Solve multi-step real-life and mathematical
problems posed with positive and negative rational
numbers in any form (whole numbers, fractions, and
decimals), using tools strategically. Apply properties of
operations to calculate with numbers in any form; convert
between forms as appropriate; and assess the
reasonableness of answers using mental computation and
estimation strategies. For example: If a woman making
$25 an hour gets a 10% raise, she will make an additional
1/10 of her salary an hour, or $2.50, for a new salary of
$27.50. If you want to place a towel bar 9 3/4 inches long
in the center of a door that is 27 ½ inches wide, you will
need to place the bar about 9 inches from each edge; this
estimate can be used as a check on the exact computation.
See Unit 1.
7.EE.4 Use variables to represent quantities in a real-
world or mathematical problem, and construct simple
equations and inequalities to solve problems by reasoning
about the quantities.
a. Solve word problems leading to equations of the form
px + q = r and p(x + q) = r, where p, q, and r are specific
rational numbers. Solve equations of these forms fluently.
Compare an algebraic solution to an arithmetic solution,
identifying the sequence of the operations used in each
approach.
For example, the perimeter of a rectangle is 54 cm. Its
length is 6 cm. What is its width?
Students write an equation or inequality to model the situation. Students explain how they determined whether to
write an equation or inequality and the properties of the real number system that you used to find a solution. In
contextual problems, students define the variable and use appropriate units.
Students solve and graph inequalities and make sense of the inequality in context. Inequalities may have negative
coefficients. Problems can be used to find a maximum or minimum value when in context.

Mathematics
RP = Ratios and Proportional Reasoning NS= The Number System EE= Expressions and Equations G= Geometry SP= Statistics and Probability
Grade 7 Unit 6: Probability (~ 3 weeks)
Unit Overview: In Unit 6, through the study of chance processes, students learn to develop, use and evaluate probability models. This unit requires active use of
students’ understanding of fractions and ratios. Students will have the opportunity to construct viable arguments and critique the reasoning of others (MP3) as they
use math to reason about real-life events.
Guiding question: In what ways can probability help you make decisions?
The student will be able to: The teacher will use appropriate instructional strategies/approaches based on the needs of the student.
Component Cluster 7.SP Investigate chance processes and develop, use, and evaluate probability models.
7.SP.5 Understand that the probability of a chance event
is a number between 0 and 1 that expresses the likelihood
of the event occurring. Larger numbers indicate greater
likelihood. A probability near 0 indicates an unlikely
event, a probability around 1/2 indicates an event that is
neither unlikely nor likely, and a probability near
1indicates a likely event.
This is the students’ first formal introduction to probability. Students recognize that the probability of any single
event can be can be expressed in terms such as impossible, unlikely, likely, or certain or as a number between 0 and
1, inclusive, as illustrated on the number line below.
The closer the fraction is to 1, the greater the probability the event will occur. Larger numbers indicate greater
likelihood. For example, if someone has 10 oranges and 3 apples, you have a greater likelihood of selecting an
orange at random. Students also recognize that the sum of all possible outcomes is 1.
7.SP.6 Approximate the probability of a chance event by
collecting data on the chance process that produces it and
observing its long-run relative frequency, and predict the
approximate relative frequency given the probability. For
example, when rolling a number cube 600 times, predict
that a 3 or 6 would be rolled roughly 200 times, but
probably not exactly 200 times.
Students collect data from a probability experiment, recognizing that as the number of trials increase, the
experimental probability approaches the theoretical probability. The focus of this standard is relative frequency --
The relative frequency is the observed number of successful events for a finite sample of trials. Relative frequency
is the observed proportion of successful event, expressed as the value calculated by dividing the number of times an
event occurs by the total number of times an experiment is carried out.
Students can collect data using physical objects or graphing calculator or web-based simulations. Students can
perform experiments multiple times, pool data with other groups, or increase the number of trials in a simulation to
look at the long-run relative frequencies. Students try the experiment and compare their predictions to the
experimental outcomes to continue to explore and refine conjectures about theoretical probability.
7.SP.7 Develop a probability model and use it to find
probabilities of events. Compare probabilities from a
model to observed frequencies; if the agreement is not
good, explain possible sources of the discrepancy.
a. Develop a uniform probability model by assigning
equal probability to all outcomes, and use the model to
determine probabilities of events. For example, if a
student is selected at random from a class, find the
probability that Jane will be selected and the probability
that a girl will be selected.
Probabilities are useful for predicting what will happen over the long run. Using theoretical probability, students
predict frequencies of outcomes. Students recognize an appropriate design to conduct an experiment with simple
probability events, understanding that the experimental data give realistic estimates of the probability of an event
but are affected by sample size.
Students need multiple opportunities to perform probability experiments and compare these results to theoretical
probabilities. Critical components of the experiment process are making predictions about the outcomes by
applying the principles of theoretical probability, comparing the predictions to the outcomes of the experiments,
and replicating the experiment to compare results. Experiments can be replicated by the same group or by
compiling class data. Experiments can be conducted using various random generation devices including, but not
limited to, bag pulls, spinners, number cubes, coin toss, and colored chips. Students can collect data using physical

Mathematics
RP = Ratios and Proportional Reasoning NS= The Number System EE= Expressions and Equations G= Geometry SP= Statistics and Probability
b. Develop a probability model (which may not be
uniform) by observing frequencies in data generated from
a chance process. For example, find the approximate
probability that a spinning penny will land heads up or
that a tossed paper cup will land open-end down. Do the
outcomes for the spinning penny appear to be equally
likely based on the observed frequencies?
objects or graphing calculator or web-based simulations. Students can also develop models for geometric
probability (i.e. a target).
7.SP.8 Find probabilities of compound events using
organized lists, tables, tree diagrams, and simulation.
a. Understand that, just as with simple events, the
probability of a compound event is the fraction of
outcomes in the sample space for which the compound
event occurs.
b. Represent for compound events using methods such as
organized lists, tables and tree diagrams.
For an event described in everyday language (e.g.,
“rolling double sixes”), identify the outcomes in the
sample space which compose the event.
c. Design and use a simulation to generate frequencies for
compound events. For example,
use random digits as a simulation tool to approximate the
answer to the question: If 40% of donors
have type A blood, what is the probability that it will take
at least 4 donors to find one with type A blood?
Students use tree diagrams, frequency tables, and organized lists, and simulations to determine the probability of
compound events.
Component Cluster 7.EE Solve real-life and mathematical problems using numerical and algebraic expressions and equations.
7.EE.3 Solve multi-step real-life and mathematical
problems posed with positive and negative rational
numbers in any form (whole numbers, fractions, and
decimals), using tools strategically. Apply properties of
operations to calculate with numbers in any form; convert
between forms as appropriate; and assess the
reasonableness of answers using mental computation and
estimation strategies. For example: If a woman making
$25 an hour gets a 10% raise, she will make an
additional 1/10 of her salary an hour, or $2.50, for a new
salary of $27.50. If you want to place a towel bar 9 3/4
inches long in the center of a door that is 27 ½ inches
wide, you will need to place the bar about 9 inches from
each edge; this estimate can be used as a check on the
exact computation.
See Unit 1.

Mathematics
RP = Ratios and Proportional Reasoning NS= The Number System EE= Expressions and Equations G= Geometry SP= Statistics and Probability
Component Cluster 7.RP Analyze proportional relationships and use them to solve real-world and mathematical problems.
7.RP.2 Recognize and represent proportional
relationships between quantities.
a. Decide whether two quantities are in a proportional
relationship, e.g., by testing for equivalent ratios in a table
or graphing on a coordinate plane and observing whether
the graph is a straight line through the origin.
See Unit 4.
7.RP.3 Use proportional relationships to solve multistep
ratio and percent problems. Examples: simple interest,
tax, markups and markdowns, gratuities and
commissions, fees, percent increase and decrease,
percent error
See Unit 4.

Mathematics
RP = Ratios and Proportional Reasoning NS= The Number System EE= Expressions and Equations G= Geometry SP= Statistics and Probability
Grade 7 Unit 7: Three-Dimensional Geometry (~ 3 weeks)
Unit Overview: Unit 7 returns to geometry with students drawing, constructing, analyzing, and measuring geometrical figures with a focus on three-dimensional
objects. They focus on volume and surface area of common objects referencing area and circumference of circles. Students will revisit and extend important ideas
related to proportionality. This unit provides the opportunity for students to apply mathematical practice standards requiring them to reason abstractly and
quantitatively as they develop meaning and algorithms for volume and surface area.
Guiding Question: How do the dimensions and structure of a three-dimensional figure contribute to the components of a formula?
The student will be able to: The teacher will use appropriate instructional strategies/approaches based on the needs of the student.
Component Cluster 7.G Draw, construct, and describe geometrical figures and describe the relationships between them.
7.G.1 Solve problems involving scale drawings of
geometric figures, including computing actual lengths
and areas from a scale drawing and reproducing a scale
drawing at a different scale.
Students determine the dimensions of figures when given a scale and identify the impact of a scale on actual length
(one-dimension) and area (two-dimensions). Students identify the scale factor given two figures. Using a given
scale drawing, students reproduce the drawing at a different scale. Students understand that the lengths will change
by a factor equal to the product of the magnitude of the two size transformations.
Component Cluster 7.G Draw, construct, and describe geometrical figures and describe the relationships between them.
7.G.3 Describe the two-dimensional figures that result
from slicing three-dimensional figures, as in plane
sections of right rectangular prisms and right rectangular
pyramids.
Students need to describe the resulting face shape from cuts made parallel and perpendicular to the bases of right
rectangular prisms and pyramids. Cuts made parallel will take the shape of the base; cuts made perpendicular will
take the shape of the lateral (side) face. Cuts made at an angle through the right rectangular prism will produce a
parallelogram;
If the pyramid is cut with a plane (green) parallel to the base, the intersection of the pyramid and the plane is a
square cross section (red).
If the pyramid is cut with a plane (green) passing through the top vertex and perpendicular to the base, the
intersection of the pyramid and the plane is a triangular cross section (red).

Mathematics
RP = Ratios and Proportional Reasoning NS= The Number System EE= Expressions and Equations G= Geometry SP= Statistics and Probability
If the pyramid is cut with a plane (green) perpendicular to the base, but not through the top vertex, the intersection
of the pyramid and the plane is a trapezoidal cross section (red).
http://intermath.coe.uga.edu/dictnary/descript.asp?termID=95
Component Cluster 7.G Solve real-life and mathematical problems involving angle measure, area, surface area, and volume.
7.G.6 Solve real-world and mathematical problems
involving area, volume and surface area of two and three-
dimensional objects composed of triangles, quadrilaterals,
polygons, cubes, and right prisms.
Students continue work from 5th and 6th grade to work with area, volume and surface area of two-dimensional and
three-dimensional objects. (composite shapes) Students will not work with cylinders, as circles are not polygons. At
this level, students determine the dimensions of the figures given the area or volume.
“Know the formula” does not mean memorization of the formula. To “know” means to have an understanding of
why the formula works and how the formula relates to the measure (area and volume) and the figure. This
understanding should be for all students.
Surface area formulas are not the expectation with this standard. Building on work with nets in the 6th grade,
students should recognize that finding the area of each face of a three-dimensional figure and adding the areas will
give the surface area. No nets will be given at this level; however, students could create nets to aid in surface area
calculations. Students understanding of volume can be supported by focusing on the area of base times the height
to calculate volume. Students solve for missing dimensions, given the area or volume.
Component Cluster 7.NS Apply and extend previous understandings of operations with fractions to add, subtract, multiply, and divide rational numbers.
7.NS.3 Solve real-world and mathematical problems
involving the four operations with rational numbers.
*Computations with rational numbers extend the rules for
manipulating fractions to complex fractions.
See Unit 1.
Component Cluster 7.RP Analyze proportional relationships and use them to solve real-world and mathematical problems.

Mathematics
RP = Ratios and Proportional Reasoning NS= The Number System EE= Expressions and Equations G= Geometry SP= Statistics and Probability
7.RP.2 Recognize and represent proportional
relationships between quantities.
See Unit 4.
Component Cluster 7.EE Use properties of operations to generate equivalent expressions.
7.EE.1 Apply properties of operations as strategies to
add, subtract, factor, and expand linear expressions with
rational coefficients.
See Unit 2.
7.EE.2 Understand that rewriting an expression in
different forms in a problem context can shed light on the
problem and how the quantities in it are related. For
example, a + 0.05a = 1.05a means that “increase by
5%” is the same as “multiply by 1.05.”
See Unit 2.

Mathematics
RP = Ratios and Proportional Reasoning NS= The Number System EE= Expressions and Equations G= Geometry SP= Statistics and Probability
Grade 7 Unit 8: Statistics (~ 5 weeks)
Unit Overview: In Unit 8, students learn to draw inferences about populations based on random samples. Students will organize data using tables, dot plots, line
plots, bar graphs, histograms, and box-and-whisker plots. Students will explore measures of center and measures of spread. This unit provides an opportunity for
students to attend to precision (MP6) as they think critically about the required accuracy of results.
Guiding question: How can samples help when comparing two or more populations?
The student will be able to: The teacher will use appropriate instructional strategies/approaches based on the needs of the student.
Component Cluster 7.SP Use random sampling to draw inferences about a population.
7.SP.1 Understand that statistics can be used to gain
information about a population by examining a sample of
the population; generalizations about a population from a
sample are valid only if the sample is representative of
that population. Understand that random sampling tends
to produce representative samples and support valid
inferences.
Students recognize that it is difficult to gather statistics on an entire population. Instead a random sample can be
representative of the total population and will generate valid predictions. Students use this information to draw
inferences from data. A random sample must be used in conjunction with the population to get accuracy. For
example, a random sample of elementary students cannot be used to give a survey about the prom.
7.SP.2 Use data from a random sample to draw inferences
about a population with an unknown characteristic of
interest. Generate multiple samples (or simulated
samples) of the same size to gauge the variation in
estimates or predictions. For example, estimate the mean
word length in a book by randomly sampling words from
the book; predict the winner of a school election based on
randomly sampled survey data. Gauge how far off the
estimate or prediction might be.
Students collect and use multiple samples of data to make generalizations about a population. Issues of variation in
the samples should be addressed.
Component Cluster 7.SP Draw informal comparative inferences about two populations.
7.SP.3 Informally assess the degree of visual overlap of
two numerical data distributions with similar variabilities,
measuring the difference between the centers by
expressing it as a multiple of a measure of variability. For
example, the mean height of players on the basketball
team is 10 cm greater than the mean height of players on
the soccer team, about twice the variability (mean
absolute deviation) on either team; on a dot plot, the
separation between the two distributions of heights is
noticeable.
This is the students’ first experience with comparing two data sets. Students build on their understanding of graphs,
mean, median, Mean Absolute Deviation (MAD) and interquartile range from 6th grade. Students understand that
1. a full understanding of the data requires consideration of the measures of variability as well as mean or median,
2. variability is responsible for the overlap of two data sets and that an increase in variability can increase the
overlap, and
3. median is paired with the interquartile range and mean is paired with the mean absolute deviation.
The mean absolute deviation (MAD) is calculated by taking the mean of the absolute deviations for each data point.
The difference between each data point and the mean is recorded in the second column of the table. The difference
between each data point and the mean is recorded in the second column of the table. The absolute deviation,
absolute value of the deviation, is recorded in the third column. The absolute deviations are summed and divided by
the number of data points in the set.
7.SP.4 Use measures of center and measures of variability
for numerical data from random samples to draw informal
comparative inferences about two populations. For
example, decide whether the words in a chapter of a
seventh-grade science book are generally longer than the
words in a chapter of a fourth-grade science book.
Students compare two sets of data using measures of center (mean and median) and variability MAD and IQR).
Showing the two graphs vertically rather than side by side helps students make comparisons.

Mathematics
RP = Ratios and Proportional Reasoning NS= The Number System EE= Expressions and Equations G= Geometry SP= Statistics and Probability
Grade 7 Accelerated In Grade 7, instructional time should focus on four critical areas: (1) developing understanding of and applying proportional relationships; (2) developing
understanding of operations with rational numbers and working with expressions and linear equations; (3) solving problems involving scale drawings and
informal geometric constructions, and working with two- and three-dimensional shapes to solve problems involving area, surface area, and volume; and (4)
drawing inferences about populations based on samples.
(1) Students extend their understanding of ratios and develop understanding of proportionality to solve single- and multi-step problems. Students use their
understanding of ratios and proportionality to solve a wide variety of percent problems, including those involving discounts, interest, taxes, tips, and
percent increase or decrease. Students solve problems about scale drawings by relating corresponding lengths between the objects or by using the fact that
relationships of lengths within an object are preserved in similar objects. Students graph proportional relationships and understand the unit rate informally
as a measure of the steepness of the related line, called the slope. They distinguish proportional relationships from other relationships.
(2) Students develop a unified understanding of number, recognizing fractions, decimals (that have a finite or a repeating decimal representation), and
percents as different representations of rational numbers. Students extend addition, subtraction, multiplication, and division to all rational numbers,
maintaining the properties of operations and the relationships between addition and subtraction, and multiplication and division. By applying these
properties, and by viewing negative numbers in terms of everyday contexts (e.g., amounts owed or temperatures below zero), students explain and
interpret the rules for adding, subtracting, multiplying, and dividing with negative numbers. They use the arithmetic of rational numbers as they formulate
expressions and equations in one variable and use these equations to solve problems.
(3) Students continue their work with area from Grade 6, solving problems involving the area and circumference of a circle and surface area of three-
dimensional objects. In preparation for work on congruence and similarity in Grade 8 they reason about relationships among two-dimensional figures
using scale drawings and informal geometric constructions, and they gain familiarity with the relationships between angles formed by intersecting lines.
Students work with three-dimensional figures, relating them to two-dimensional figures by examining cross-sections. They solve real-world and
mathematical problems involving area, surface area, and volume of two- and three-dimensional objects composed of triangles, quadrilaterals, polygons,
cubes and right prisms.
(4) Students build on their previous work with single data distributions to compare two data distributions and address questions about differences between
populations. They begin informal work with random sampling to generate data sets and learn about the importance of representative samples for drawing
inferences.
Standards for Mathematical Practice
1. Make sense of problems and persevere in solving them.
2. Reason abstractly and quantitatively.
3. Construct viable arguments and critique the reasoning of others.
4. Model with mathematics.
5. Use appropriate tools strategically.
6. Attend to precision.
7. Look for and make use of structure.
8. Look for and express regularity in repeated reasoning.

Mathematics
RP = Ratios and Proportional Reasoning NS= The Number System EE= Expressions and Equations G= Geometry SP= Statistics and Probability
Grade 7 Accelerated: Suggested Distribution of Units in Instructional Weeks Time Approximate
# of Weeks
Unit 1: Rational Numbers 11 % ~ 4 weeks
Unit 2: The Number System and Properties of Exponents 8 % ~ 3 weeks
Unit 3: Expressions and Equations 15 % ~ 5 weeks
Unit 4: Two-Dimensional Geometry 11 % ~ 4 weeks
Unit 5: Ratios in Geometry 14 % ~ 5 weeks
Unit 6: Ratios, Rates, Percents and Proportions 14 % ~ 5 weeks
Unit 7: Probability 8 % ~ 3 weeks
Unit 8: Three-Dimensional Geometry 8 % ~ 3 weeks
Unit 9: Statistics 11 % ~ 4 weeks
Instructional
Focus of Unit: Ratios and Proportional Reasoning Number System Expressions and Equations/ Functions Geometry Statistics and Probability
Unit 1: Rational Numbers
11%
Unit 2: The Number System and
Properties of Exponents
8%
Unit 3: Expressions and Equations
15%
Unit 4: Two-Dimensional
Geometry11%
Unit 5: Ratios in Geometry
14%
Unit 6: Ratios, Rates, Percents and Proportions
14%
Unit 7: Probability8%
Unit 8: Three-Dimensional
Geometry8%
Unit 9: Statistics11%
Instructional Time
Mathematics
RP = Ratios and Proportional Reasoning NS= The Number System EE= Expressions and Equations G= Geometry SP= Statistics and Probability
Grade 7 Accelerated Unit 1: Rational Numbers (~ 4 weeks)
Unit Overview: Students continue to build an understanding of the number line in Unit 1 from their work in Grade 6. They learn to add, subtract, multiply, and
divide rational numbers. Unit 1 includes rational numbers as they appear in expressions and equations—work that is continued in Unit 2. This unit provides
opportunities for students to look for and make use of structure (MP7) as they apply their previous understandings of addition and subtraction to rational numbers.
Guiding Question: How is addition and subtraction with only positive numbers from elementary school both different as well as similar to addition and subtraction with rational
numbers?
The student will be able to: The teacher will use appropriate instructional strategies/approaches based on the needs of the student.
Component Cluster 7.NS Apply and extend previous understandings of operations with fractions to add, subtract, multiply, and divide rational numbers.
7.NS.1 Apply and extend previous understandings of
addition and subtraction to add and subtract rational
numbers; represent addition and subtraction on a
horizontal or vertical number line diagram.
a. Describe situations in which opposite quantities
combine to make 0. For example, a hydrogen atom has 0
charge because its two constituents are oppositely
charged.
b. Understand p + q as the number located a distance |q|
from p, in the positive or negative direction depending on
whether q is positive or negative. Show that a number and
its opposite have a sum of 0 (are additive inverses).
Interpret sums of rational numbers by describing real-
world contexts.
c. Understand subtraction of rational numbers as adding
the additive inverse, p – q = p + (–q). Show that the
distance between two rational numbers on the
number line is the absolute value of their difference, and
apply this principle in real world contexts.
d. Apply properties of operations as strategies to add and
subtract rational numbers.
Students add and subtract rational numbers. Visual representations may be helpful as students begin this work; they
become less necessary as students become more fluent with these operations. The expectation of the CCSS is to
build on student understanding of number lines developed in 6th grade.
In 6th grade, students found the distance of horizontal and vertical segments on the coordinate plane. In 7th grade,
students build on this understanding to recognize subtraction is finding the distance between two numbers on a
number line.
7.NS.2 Apply and extend previous understandings of
multiplication and division and of fractions to multiply
and divide rational numbers.
a. Understand that multiplication is extended from
fractions to rational numbers by requiring that operations
continue to satisfy the properties of operations,
particularly the distributive property, leading to products
such as (– 1)(–1) = 1 and the rules for multiplying signed
Students understand that multiplication and division of integers is an extension of multiplication and division of
whole numbers. Students recognize that when division of rational numbers is represented with a fraction bar, each
number can have a negative sign.
Using long division from elementary school, students understand the difference between terminating and repeating
decimals. This understanding is foundational for the work with rational and irrational numbers in
8th grade. Identify which fractions will terminate (the denominator of the fraction in reduced form only has factors
of 2 and/or 5)

Mathematics
RP = Ratios and Proportional Reasoning NS= The Number System EE= Expressions and Equations G= Geometry SP= Statistics and Probability
numbers. Interpret products of rational numbers by
describing real-world contexts.
b. Understand that integers can be divided, provided that
the divisor is not zero, and every quotient of integers
(with non-zero divisor) is a rational number. If p and q are
integers, then –(p/q) = (–p)/q = p/(–
q). Interpret quotients of rational numbers by describing
real-world contexts.
c. Apply properties of operations as strategies to multiply
and divide rational numbers.
d. Convert a rational number to a decimal using long
division; know that the decimal form of a rational number
terminates in 0s or eventually repeats.
7.NS.3 Solve real-world and mathematical problems
involving the four operations with rational numbers.1
1Computations with rational numbers extend the rules for
manipulating fractions to complex fractions.*
*Computations with rational numbers extend the rules for
manipulating fractions to complex fractions.
Students use order of operations from 6th grade to write and solve problem with all rational numbers. Students
apply properties of operations and work with rational numbers (integers and positive / negative fractions and
decimals) to solve real world and mathematical problems.
Component Cluster 7.EE Solve real-life and mathematical problems using numerical and algebraic expressions and equations.*
*The balance of this cluster is taught in Unit 2.
7.EE.3 Solve multi-step real-life and mathematical
problems posed with positive and negative rational
numbers in any form (whole numbers, fractions, and
decimals), using tools strategically. Apply properties of
operations to calculate with numbers in any form; convert
between forms as appropriate; and assess the
reasonableness of answers using mental computation and
estimation strategies. For example: If a woman making
$25 an hour gets a 10% raise, she will make an additional
1/10 of her salary an hour, or $2.50, for a new salary of
$27.50. If you want to place a towel bar 9 3/4 inches long
in the center of a door that is 27 ½ inches wide, you will
need to place the bar about 9 inches from each edge; this
estimate can be used as a check on the exact computation.
Students solve contextual problems and mathematical problems using rational numbers. Students convert between
fractions, decimals, and percents as needed to solve the problem. Students use estimation to justify the
reasonableness of answers.
Estimation strategies for calculations with fractions and decimals extend from students’ work with whole number
operations. Estimation strategies include, but are not limited to:
• front-end estimation with adjusting (using the highest place value and estimating from the front end making
adjustments to the estimate by taking into account the remaining amounts),
• clustering around an average (when the values are close together an average value is selected and
multiplied by the number of values to determine an estimate),
• rounding and adjusting (students round down or round up and then adjust their estimate depending on how much
the rounding affected the original values),
• using friendly or compatible numbers such as factors (students seek to fit numbers together - i.e., rounding to
factors and grouping numbers together that have round sums like 100 or 1000), and
• using benchmark numbers that are easy to compute (students select close whole numbers for fractions or decimals
to determine an estimate).
7.EE.4 Use variables to represent quantities in a real-
world or mathematical problem, and construct simple
equations and inequalities to solve problems by reasoning
about the quantities.*
7.EE.4a and b Students write an equation or inequality to model the situation. Students explain how they
determined whether to write an equation or inequality and the properties of the real number system that you used to
find a solution. In contextual problems, students define the variable and use appropriate units.
7.EE.4a

Mathematics
RP = Ratios and Proportional Reasoning NS= The Number System EE= Expressions and Equations G= Geometry SP= Statistics and Probability
a. Solve word problems leading to equations of the form
px + q = r and p(x + q) = r, where p, q, and r are specific
rational numbers. Solve equations of these forms fluently.
Compare an algebraic solution to an arithmetic solution,
identifying the sequence of the operations used in each
approach.
For example, the perimeter of a rectangle is 54 cm. Its
length is 6 cm. What is its width?
*In this unit the equations include negative rational
numbers.
Students solve multi-step equations derived from word problems. Students use the arithmetic from the problem to
generalize an algebraic solution.

Mathematics
RP = Ratios and Proportional Reasoning NS= The Number System EE= Expressions and Equations G= Geometry SP= Statistics and Probability
Grade 7 Accelerated Unit 2: The Number System and Properties of Exponents (~ 3 weeks) Unit Overview: In Unit 2, students extend the properties of exponents to integer exponents. They use the number line model to support their
understanding of the rational numbers and the number system. The number system is revisited throughout the year. This unit provides opportunities
for students to look for and make use of reasoning (MP 7) as they extend their understanding of the properties of exponents to integer exponents.
Guiding Question: What is the connection between exponents and scientific notation?
The student will be able to: The teacher will use appropriate instructional strategies/approaches based on the needs of the student.
Component Cluster 8.EE Work with radicals and integer exponents.
8.EE.1 Know and apply the properties of integer
exponents to generate equivalent numerical expressions.
For example, 32 × 3–5 = 3–3 = 1/33 = 1/27.
In 6th grade, students wrote and evaluated simple numerical expressions with whole number exponents
(i.e. 53 = 5 • 5 • 5 = 125).
Integer (positive and negative) exponents are further developed to generate equivalent numerical expressions when
multiplying, dividing or raising a power to a power. Using numerical bases and the laws of exponents, students
generate equivalent expressions.
Students understand:
• Bases must be the same before exponents can be added, subtracted or multiplied.
• Exponents are subtracted when like bases are being divided
• A number raised to the zero (0) power is equal to one.
• Negative exponents occur when there are more factors in the denominator. These exponents can be expressed as a
positive if left in the denominator.
• Exponents are added when like bases are being multiplied
• Exponents are multiplied when an exponents is raised to an exponent
• Several properties may be used to simplify an expression
8.EE.3 Use numbers expressed in the form of a single
digit times an integer power of 10 to estimate very large
or very small quantities, and to express how many times
as much one is than the other. For example, estimate the
population of the United States as 3 × 10⁸ and the
population of the world as 7 × 10⁹, and determine that the
world population is more than 20 times larger.
Students use scientific notation to express very large or very small numbers. Students compare and interpret
scientific notation quantities in the context of the situation, recognizing that if the exponent increases by one, the
value increases 10 times. Likewise, if the exponent decreases by one, the value decreases 10 times.
Students solve problems using addition, subtraction or multiplication, expressing the answer in scientific notation.
8.EE.4 Perform operations with numbers expressed in
scientific notation, including problems where both
decimal and scientific notation are used. Use scientific
notation and choose units of appropriate size for
measurements of very large or very small quantities (e.g.,
use millimeters per year for seafloor spreading). Interpret
scientific notation that has been generated by technology.
Students understand scientific notation as generated on various calculators or other technology. Students enter
scientific notation using E or EE (scientific notation), * (multiplication), and ^ (exponent) symbols. Students use
laws of exponents to multiply or divide numbers written in scientific notation, writing the product or quotient in
proper scientific notation. Students understand the magnitude of the number being expressed in scientific notation
and choose an appropriate corresponding unit.
Component Cluster 8.NS Know that there are numbers that are not rational, and approximate them by rational numbers.

Mathematics
RP = Ratios and Proportional Reasoning NS= The Number System EE= Expressions and Equations G= Geometry SP= Statistics and Probability
8.NS.1 Know that numbers that are not rational are called
irrational. Understand informally that every number has a
decimal expansion; for rational numbers show that the
decimal expansion repeats eventually, and convert a
decimal expansion which repeats eventually into a
rational number.
Students understand that Real numbers are either rational or irrational. They distinguish between rational and
irrational numbers, recognizing that any number that can be expressed as a fraction is a rational number. The
diagram below illustrates the relationship between the subgroups of the real number system.
Students recognize that the decimal equivalent of a fraction will either terminate or repeat. Fractions that terminate
will have denominators containing only prime factors of 2 and/or 5. This understanding builds on work in 7th grade
when students used long division to distinguish between repeating and terminating decimals. Students convert
repeating decimals into their fraction equivalent using patterns or algebraic reasoning.
8.NS.2 Use rational approximations of irrational numbers
to compare the size of irrational numbers, locate them
approximately on a number line diagram, and estimate the
value of expressions (e.g., √2). For example, by
truncating the decimal expansion of √2, show that √2 is
between 1 and 2, then between 1.4 and 1.5, and explain
how to continue on to get better approximations.
Students locate rational and irrational numbers on the number line. Students compare and order rational and
irrational numbers. Students also recognize that square roots may be negative and written as -√28. Additionally,
students understand that the value of a square root can be approximated between integers and that non-perfect
square roots are irrational.
Grade 7 Accelerated Unit 3: Expressions and Equations (~ 5 weeks)

Mathematics
RP = Ratios and Proportional Reasoning NS= The Number System EE= Expressions and Equations G= Geometry SP= Statistics and Probability
Unit Overview: Unit 2 consolidates and expands students’ previous work with generating equivalent expressions and solving equations. Students solve real life
and mathematical problems using numerical and algebraic expressions and equations. Their work with expressions and equations is applied to finding unknown
angles and problems involving area, volume, and surface area, formulas learned in 6th grade. This unit provides the opportunity for students to reason abstractly
and quantitatively (MP2) as they move back and forth between the context of real life math problems and the algebraic representations they are using to solve the
problems.
Guiding Question: How does reflecting on the real-life context/initial math problem help to make sense of a problem?
The student will be able to: The teacher will use appropriate instructional strategies/approaches based on the needs of the student.
Component Cluster 7.EE Use properties of operations to generate equivalent expressions.
7.EE.1 Apply properties of operations as strategies to
add, subtract, factor, and expand linear expressions with
rational coefficients.
This is a continuation of work from 6th grade using properties of operations (table 3, pg. 90) and combining like
terms. Students apply properties of operations and work with rational numbers (integers and positive / negative
fractions and decimals) to write equivalent expressions.
7.EE.2 Understand that rewriting an expression in
different forms in a problem context can shed light on the
problem and how the quantities in it are related. For
example, a + 0.05a = 1.05a means that “increase by 5%”
is the same as “multiply by 1.05.”
Students understand the reason for rewriting an expression in terms of a contextual situation. For example, students
understand that a 20% discount is the same as finding 80% of the cost, c (0.80c).
Component Cluster 7.EE Solve real-life and mathematical problems using numerical and algebraic expressions and equations.
7.EE.3 Solve multi-step real-life and mathematical
problems posed with positive and negative rational
numbers in any form (whole numbers, fractions, and
decimals), using tools strategically. Apply properties of
operations to calculate with numbers in any form; convert
between forms as appropriate; and assess the
reasonableness of answers using mental computation and
estimation strategies. For example: If a woman making
$25 an hour gets a 10% raise, she will make an additional
1/10 of her salary an hour, or $2.50, for a new salary of
$27.50. If you want to place a towel bar 9 3/4 inches long
in the center of a door that is 27 ½ inches wide, you will
need to place the bar about 9 inches from each edge; this
estimate can be used as a check on the exact
computation.*
* Problems in this module take on any form but percent,
which is included in Unit 4.
See Unit 1.
7.EE.4 Use variables to represent quantities in a real-
world or mathematical problem, and construct simple
equations and inequalities to solve problems by reasoning
about the quantities.
See Unit 1.

Mathematics
RP = Ratios and Proportional Reasoning NS= The Number System EE= Expressions and Equations G= Geometry SP= Statistics and Probability
a. Solve word problems leading to equations of the form
px + q = r and p(x + q) = r, where p, q, and r are specific
rational numbers. Solve equations of these forms fluently.
Compare an algebraic solution to an arithmetic solution,
identifying the sequence of the operations used in each
approach.
For example, the perimeter of a rectangle is 54 cm. Its
length is 6 cm. What is its width?
b. Solve word problems leading to inequalities of the form
px + q > r or px + q < r, where p, q, and r are specific
rational numbers. Graph the solution set of the inequality
and interpret it in the context of the problem. For
example: As a salesperson, you are paid $50 per week
plus $3 per sale. This week you want your pay to be at
least $100. Write an inequality for the number of sales
you need to make, and describe the solutions.

Mathematics
RP = Ratios and Proportional Reasoning NS= The Number System EE= Expressions and Equations G= Geometry SP= Statistics and Probability
Grade 7 Accelerated Unit 4: Two-Dimensional Geometry (~ 4 weeks)
Unit Overview: Unit 3 begins with students drawing, constructing, describing, and analyzing geometrical figures. There is a focus on polygons and on the edge
and angle relationships of regular and irregular polygons. Students will also calculate area and circumference of circles. This unit provides the opportunity for
students to apply mathematical practice standards as they solve geometric problems using appropriate tools and formulas.
Guiding Question: When should I use estimation, freehand drawing, or special tools to measure and construct angles and polygons?
The student will be able to: The teacher will use appropriate instructional strategies/approaches based on the needs of the student.
Component Cluster 7.G Draw, construct, and describe geometrical figures and describe the relationships between them.
7.G.2 Draw (freehand, with ruler and protractor, and with
technology) geometric shapes with given conditions.
Focus on constructing triangles from three measures of
angles or sides, noticing when the conditions determine a
unique triangle, more than one triangle, or no triangle.
Students draw geometric shapes with given parameters. Parameters could include parallel lines, angles,
perpendicular lines, line segments, etc.
Students understand the characteristics of angles and side lengths that create a unique triangle, more than one
triangle or no triangle. Through exploration, students recognize that the sum of the angles of any triangle will be
180°.
Component Cluster 7.G Solve real-life and mathematical problems involving angle measure, area, surface area, and volume.
7.G.4 Know the formulas for the area and circumference
of a circle and use them to solve problems; give an
informal derivation of the relationship between the
circumference and area of a circle.
Students understand the relationship between radius and diameter. Students also understand the ratio of
circumference to diameter can be expressed as pi. Building on these understandings, students generate the formulas
for circumference and area.
The illustration shows the relationship between the circumference and area. If a circle is cut into wedges and laid
out as shown, a parallelogram results. Half of an end wedge can be moved to the other end a rectangle results. The
height of the rectangle is the same as the radius of the circle. The base length is the circumference (2Πr). The area
of the rectangle (and therefore the circle) is found by the following calculations:
A rect = Base x Height
Area = 1/2 (2Πr) x r
Area = Πr x r
Area = Πr2
Area = Base x Height
Area = 1/2 (2Πr) x r
Area = Πr x r
Area = Πr2
http://mathworld.wolfram.com/Circle.html
Students solve problems (mathematical and real-world) involving circles or semi-circles.

Mathematics
RP = Ratios and Proportional Reasoning NS= The Number System EE= Expressions and Equations G= Geometry SP= Statistics and Probability
Note: Because pi is an irrational number that neither repeats nor terminates, the measurements are approximate
when 3.14 is used in place of Π.
Students build on their understanding of area from 6th grade to find the area of left-over materials when circles are
cut from squares and triangles or when squares and triangles are cut from circles.
7.G.5 Use facts about supplementary, complementary,
vertical, and adjacent angles in a multi-step problem to
write and solve simple equations for an unknown angle in
a figure.
Students use understandings of angles and deductive reasoning to write and solve equations.
Component Cluster 7.EE Use properties of operations to generate equivalent expressions.
7.EE.1 Apply properties of operations as strategies to
add, subtract, factor, and expand linear expressions with
rational coefficients.
See Unit 3.
7.EE.2 Understand that rewriting an expression in
different forms in a problem context can shed light on the
problem and how the quantities in it are related. For
example, a + 0.05a = 1.05a means that “increase by
5%” is the same as “multiply by 1.05.”
See Unit 3.
Component Cluster 7.EE Solve real-life and mathematical problems using numerical and algebraic expressions and equations.*
*Cluster embedded throughout the year.
7.EE.4 Use variables to represent quantities in a real-
world or mathematical problem, and construct simple
equations and inequalities to solve problems by reasoning
about the quantities.
Students write an equation or inequality to model the situation. Students explain how they determined whether to
write an equation or inequality and the properties of the real number system that you used to find a solution. In
contextual problems, students define the variable and use appropriate units.
Component Cluster 7.NS Apply and extend previous understandings of operations with fractions to add, subtract, multiply, and divide rational numbers.
7.NS.3 Solve real-world and mathematical problems
involving the four operations with rational numbers.1
1Computations with rational numbers extend the rules for
manipulating fractions to complex fractions.*
*Computations with rational numbers extend the rules for
manipulating fractions to complex fractions.
See Unit 1.

Mathematics
RP = Ratios and Proportional Reasoning NS= The Number System EE= Expressions and Equations G= Geometry SP= Statistics and Probability
Grade 7 Accelerated Unit 5: Ratios in Geometry (~ 5 weeks)
Unit Overview: In Unit 4, students build an understanding of the multiplicative quality of ratios and proportional relationships through the context of geometry.
In this context, students will investigate how to recognize, represent, and test for proportional relationships. Students have the opportunity to apply the
mathematical practice standards as they solve real-world and mathematical problems.
Guiding Question: In what ways can we use proportional relationships to help us solve problems in the everyday world?
The student will be able to: The teacher will use appropriate instructional strategies/approaches based on the needs of the student.
Component Cluster 7.RP Analyze proportional relationships and use them to solve real-world and mathematical problems.
7.RP.2 Recognize and represent proportional
relationships between quantities.
a. Decide whether two quantities are in a proportional
relationship, e.g., by testing for equivalent ratios in a table
or graphing on a coordinate plane and observing whether
the graph is a straight line through the origin.
b. Identify the constant of proportionality (unit rate) in
tables, graphs, equations, diagrams, and verbal
descriptions of proportional relationships.
Students’ understanding of the multiplicative reasoning used with proportions continues from 6th grade. Students
determine if two quantities are in a proportional relationship from a table. Fractions and decimals could be used
with this standard.
Note: This standard focuses on the representations of proportions. Solving proportions is addressed in 7.SP.3.
Students graph relationships to determine if two quantities are in a proportional relationship and to interpret the
ordered pairs. If the amounts from a table are graphed, the pairs will form a straight line through the origin,
indicating that these pairs are in a proportional relationship. The y-coordinate when x = 1 will be the unit rate. The
constant of proportionality is the unit rate. Students identify this amount from tables, graphs, equations and verbal
descriptions of proportional relationships.
7.RP.3 Use proportional relationships to solve multistep
ratio and percent problems.
In 6th grade, students used ratio tables and unit rates to solve problems. Students expand their understanding of
proportional reasoning to solve problems that can be appropriately and efficiently solved with cross-multiplication.
Students understand the mathematical foundation for cross-multiplication.
Students should be able to explain or show their work using a representation (numbers, words, pictures, physical
objects, or equations) and verify that their answer is reasonable. Students use models to identify the parts of the
problem and how the values are related.
Component Cluster 7.EE Solve real-life and mathematical problems using numerical and algebraic expressions and equations.
7.EE.3 Solve multi-step real-life and mathematical
problems posed with positive and negative rational
numbers in any form (whole numbers, fractions, and
decimals), using tools strategically. Apply properties of
operations to calculate with numbers in any form; convert
between forms as appropriate; and assess the
reasonableness of answers using mental computation and
estimation strategies. For example: If a woman making
$25 an hour gets a 10% raise, she will make an additional
1/10 of her salary an hour, or $2.50, for a new salary of
$27.50. If you want to place a towel bar 9 3/4 inches long
in the center of a door that is 27 ½ inches wide, you will
need to place the bar about 9 inches from each edge; this
estimate can be used as a check on the exact computation.
See Unit 1.

Mathematics
RP = Ratios and Proportional Reasoning NS= The Number System EE= Expressions and Equations G= Geometry SP= Statistics and Probability
7.EE.4 Use variables to represent quantities in a real-
world or mathematical problem, and construct simple
equations and inequalities to solve problems by reasoning
about the quantities.
See Unit 1.
Component Cluster 7.G Draw, construct, and describe geometrical figures and describe the relationships between them.
7.G.1 Solve problems involving scale drawings of
geometric figures, including computing actual lengths and
areas from a scale drawing and reproducing a scale
drawing at a different scale.
Students determine the dimensions of figures when given a scale and identify the impact of a scale on actual length
(one-dimension) and area (two-dimensions). Students identify the scale factor given two figures. Using a given
scale drawing, students reproduce the drawing at a different scale. Students understand that the lengths will change
by a factor equal to the product of the magnitude of the two size transformations.
Component Cluster 7.G Draw, construct, and describe geometrical figures and describe the relationships between them.
7.G.2 Draw (freehand, with ruler and protractor, and with
technology) geometric shapes with given conditions.
Focus on constructing triangles from three measures of
angles or sides, noticing when the conditions determine a
unique triangle, more than one triangle, or no triangle.
See Unit 4.
Component Cluster 7.G Solve real-life and mathematical problems involving angle measure, area, surface area, and volume.
7.G.6 Solve real-world and mathematical problems
involving area, volume and surface area of two and three-
dimensional objects composed of triangles, quadrilaterals,
polygons, cubes, and right prisms.
*Three dimensional objects are addressed in future units
of study.
Students continue work from 5th and 6th grade to work with area, volume and surface area of two-dimensional and
three-dimensional objects. (composite shapes).
“Know the formula” does not mean memorization of the formula. To “know” means to have an understanding of
why the formula works and how the formula relates to the measure (area and volume) and the figure. This
understanding should be for all students.
Students solve for missing dimensions, given the area.
Mathematics
RP = Ratios and Proportional Reasoning NS= The Number System EE= Expressions and Equations G= Geometry SP= Statistics and Probability
Grade 7 Accelerated Unit 6: Ratios, Rates, Percents, and Proportions (~ 5 weeks)
Unit Overview: Unit 5 parallels Unit 4’s coverage of ratio and proportion but this time with a concentration on numerical contexts, including percent. Problems in
this unit include simple interest, tax, markups and markdowns, gratuities and commissions, fees, percent increase and decrease, and percent error. This unit
provides students with the opportunity to continue applying mathematical practice standards as they make intelligent comparisons of quantitative information in
real-life situations.
Guiding Question: How do you reason through proportional situations and recognize when such reasoning is appropriate in real-world situations?
The student will be able to: The teacher will use appropriate instructional strategies/approaches based on the needs of the student.
Component Cluster 7.RP Analyze proportional relationships and use them to solve real-world and mathematical problems.
7.RP.1 Compute unit rates associated with ratios of
fractions, including ratios of lengths, areas and other
quantities measured in like or different units. For
example, if a person walks 1/2 mile in each 1/4 hour,
compute the unit rate as the complex fraction 1/2/1/4
miles per hour, equivalently 2 miles per hour.
Students continue to work with unit rates from 6th grade; however, the comparison now includes fractions
compared to fractions. The comparison can be with like or different units. Fractions may be less than or greater
than one.
7.RP.2 Recognize and represent proportional
relationships between quantities.
a. Decide whether two quantities are in a proportional
relationship, e.g., by testing for equivalent ratios in a table
or graphing on a coordinate plane and observing whether
the graph is a straight line through the origin.
b. Identify the constant of proportionality (unit rate) in
tables, graphs, equations, diagrams, and verbal
descriptions of proportional relationships.
c. Represent proportional relationships by equations. For
example, if total cost t is proportional to the number n of
items purchased at a constant price p, the relationship
between the total cost and the number of items can be
expressed as t = pn.
d. Explain what a point (x, y) on the graph of a
proportional relationship means in terms of the situation,
with special attention to the points (0, 0) and (1, r) where
r is the unit rate.
Students’ understanding of the multiplicative reasoning used with proportions continues from 6 th grade. Students
determine if two quantities are in a proportional relationship from a table. Fractions and decimals could be used
with this standard.
Note: This standard focuses on the representations of proportions. Solving proportions is addressed in 7.SP.3.
Students graph relationships to determine if two quantities are in a proportional relationship and to interpret the
ordered pairs. If the amounts from a table are graphed, the pairs will form a straight line through the origin,
indicating that these pairs are in a proportional relationship. The y-coordinate when x = 1 will be the unit rate. The
constant of proportionality is the unit rate. Students identify this amount from tables, graphs, equations and verbal
descriptions of proportional relationships.
Students write equations from context and identify the coefficient as the unit rate which is also the constant of
proportionality.
A common error is to reverse the position of the variables when writing equations. Students may find it useful to
use variables specifically related to the quantities rather than using x and y. Constructing verbal models can also be
helpful. A student might describe the situation as “the number of packs of gum times the cost for each pack is the
total cost in dollars”. They can use this verbal model to construct the equation. Students can check their equation by
substituting values and comparing their results to the table. The checking process helps student revise and recheck
their model as necessary.
7.RP.3 Use proportional relationships to solve multistep
ratio and percent problems. Examples: simple interest,
tax, markups and markdowns, gratuities and
commissions, fees, percent increase and decrease, percent
error
In 6th grade, students used ratio tables and unit rates to solve problems. Students expand their understanding of
proportional reasoning to solve problems that can be appropriately and efficiently solved with cross-multiplication.
Students understand the mathematical foundation for cross-multiplication.
Finding the percent error is the process of expressing the size of the error (or deviation) between two
measurements. To calculate the percent error, students determine the absolute deviation (positive difference)

Mathematics
RP = Ratios and Proportional Reasoning NS= The Number System EE= Expressions and Equations G= Geometry SP= Statistics and Probability
between an actual measurement and the accepted value and then divide by the accepted value. Multiplying by 100
will give the percent error. (Note the similarity between percent error and percent of increase or decrease)
% error = | estimated value - actual value | x 100 %
actual value
The use of proportional relationships is also extended to solve percent problems involving sales tax, markups and
markdowns simple interest (I = prt, where I = interest, p = principal, r = rate, and t = time (in years)), gratuities and
commissions, fees, percent increase and decrease, and percent error.
Students should be able to explain or show their work using a representation (numbers, words, pictures, physical
objects, or equations) and verify that their answer is reasonable. Students use models to identify the parts of the
problem and how the values are related. For percent increase and decrease, students identify the starting value,
determine the difference, and compare the difference in the two values to the starting value.
Component Cluster 7.EE Solve real-life and mathematical problems using numerical and algebraic expressions and equations.
7.EE.3 Solve multi-step real-life and mathematical
problems posed with positive and negative rational
numbers in any form (whole numbers, fractions, and
decimals), using tools strategically. Apply properties of
operations to calculate with numbers in any form; convert
between forms as appropriate; and assess the
reasonableness of answers using mental computation and
estimation strategies. For example: If a woman making
$25 an hour gets a 10% raise, she will make an additional
1/10 of her salary an hour, or $2.50, for a new salary of
$27.50. If you want to place a towel bar 9 3/4 inches long
in the center of a door that is 27 ½ inches wide, you will
need to place the bar about 9 inches from each edge; this
estimate can be used as a check on the exact computation.
See Unit 1.
7.EE.4 Use variables to represent quantities in a real-
world or mathematical problem, and construct simple
equations and inequalities to solve problems by reasoning
about the quantities.
Students write an equation or inequality to model the situation. Students explain how they determined whether to
write an equation or inequality and the properties of the real number system that you used to find a solution. In
contextual problems, students define the variable and use appropriate units.
Students solve and graph inequalities and make sense of the inequality in context. Inequalities may have negative
coefficients. Problems can be used to find a maximum or minimum value when in context.

Mathematics
RP = Ratios and Proportional Reasoning NS= The Number System EE= Expressions and Equations G= Geometry SP= Statistics and Probability
Grade 7 Accelerated Unit 7: Probability (~ 3 weeks)
Unit Overview: In Unit 6, through the study of chance processes, students learn to develop, use and evaluate probability models. This unit requires active use of
students’ understanding of fractions and ratios. Students will have the opportunity to construct viable arguments and critique the reasoning of others (MP3) as they
use math to reason about real-life events.
Guiding question: In what ways can probability help you make decisions?
The student will be able to: The teacher will use appropriate instructional strategies/approaches based on the needs of the student.
Component Cluster 7.SP Investigate chance processes and develop, use, and evaluate probability models.
7.SP.5 Understand that the probability of a chance event
is a number between 0 and 1 that expresses the likelihood
of the event occurring. Larger numbers indicate greater
likelihood. A probability near 0 indicates an unlikely
event, a probability around 1/2 indicates an event that is
neither unlikely nor likely, and a probability near
1indicates a likely event.
This is the students’ first formal introduction to probability. Students recognize that the probability of any single
event can be can be expressed in terms such as impossible, unlikely, likely, or certain or as a number between 0 and
1, inclusive, as illustrated on the number line below.
The closer the fraction is to 1, the greater the probability the event will occur. Larger numbers indicate greater
likelihood. For example, if someone has 10 oranges and 3 apples, you have a greater likelihood of selecting an
orange at random. Students also recognize that the sum of all possible outcomes is 1.
7.SP.6 Approximate the probability of a chance event by
collecting data on the chance process that produces it and
observing its long-run relative frequency, and predict the
approximate relative frequency given the probability. For
example, when rolling a number cube 600 times, predict
that a 3 or 6 would be rolled roughly 200 times, but
probably not exactly 200 times.
Students collect data from a probability experiment, recognizing that as the number of trials increase, the
experimental probability approaches the theoretical probability. The focus of this standard is relative frequency --
The relative frequency is the observed number of successful events for a finite sample of trials. Relative frequency
is the observed proportion of successful event, expressed as the value calculated by dividing the number of times an
event occurs by the total number of times an experiment is carried out.
Students can collect data using physical objects or graphing calculator or web-based simulations. Students can
perform experiments multiple times, pool data with other groups, or increase the number of trials in a simulation to
look at the long-run relative frequencies. Students try the experiment and compare their predictions to the
experimental outcomes to continue to explore and refine conjectures about theoretical probability.
7.SP.7 Develop a probability model and use it to find
probabilities of events. Compare probabilities from a
model to observed frequencies; if the agreement is not
good, explain possible sources of the discrepancy.
a. Develop a uniform probability model by assigning
equal probability to all outcomes, and use the model to
determine probabilities of events. For example, if a
student is selected at random from a class, find the
probability that Jane will be selected and the probability
that a girl will be selected.
Probabilities are useful for predicting what will happen over the long run. Using theoretical probability, students
predict frequencies of outcomes. Students recognize an appropriate design to conduct an experiment with simple
probability events, understanding that the experimental data give realistic estimates of the probability of an event
but are affected by sample size.
Students need multiple opportunities to perform probability experiments and compare these results to theoretical
probabilities. Critical components of the experiment process are making predictions about the outcomes by
applying the principles of theoretical probability, comparing the predictions to the outcomes of the experiments,
and replicating the experiment to compare results. Experiments can be replicated by the same group or by
compiling class data. Experiments can be conducted using various random generation devices including, but not
limited to, bag pulls, spinners, number cubes, coin toss, and colored chips. Students can collect data using physical

Mathematics
RP = Ratios and Proportional Reasoning NS= The Number System EE= Expressions and Equations G= Geometry SP= Statistics and Probability
b. Develop a probability model (which may not be
uniform) by observing frequencies in data generated from
a chance process. For example, find the approximate
probability that a spinning penny will land heads up or
that a tossed paper cup will land open-end down. Do the
outcomes for the spinning penny appear to be equally
likely based on the observed frequencies?
objects or graphing calculator or web-based simulations. Students can also develop models for geometric
probability (i.e. a target).
7.SP.8 Find probabilities of compound events using
organized lists, tables, tree diagrams, and simulation.
a. Understand that, just as with simple events, the
probability of a compound event is the fraction of
outcomes in the sample space for which the compound
event occurs.
b. Represent for compound events using methods such as
organized lists, tables and tree diagrams.
For an event described in everyday language (e.g.,
“rolling double sixes”), identify the outcomes in the
sample space which compose the event.
c. Design and use a simulation to generate frequencies for
compound events. For example,
use random digits as a simulation tool to approximate the
answer to the question: If 40% of donors
have type A blood, what is the probability that it will take
at least 4 donors to find one with type A blood?
Students use tree diagrams, frequency tables, and organized lists, and simulations to determine the probability of
compound events.
Component Cluster 7.EE Solve real-life and mathematical problems using numerical and algebraic expressions and equations.
7.EE.3 Solve multi-step real-life and mathematical
problems posed with positive and negative rational
numbers in any form (whole numbers, fractions, and
decimals), using tools strategically. Apply properties of
operations to calculate with numbers in any form; convert
between forms as appropriate; and assess the
reasonableness of answers using mental computation and
estimation strategies. For example: If a woman making
$25 an hour gets a 10% raise, she will make an
additional 1/10 of her salary an hour, or $2.50, for a new
salary of $27.50. If you want to place a towel bar 9 3/4
inches long in the center of a door that is 27 ½ inches
wide, you will need to place the bar about 9 inches from
each edge; this estimate can be used as a check on the
exact computation.
Students solve contextual problems and mathematical problems using rational numbers. Students convert between
fractions, decimals, and percents as needed to solve the problem. Students use estimation to justify the
reasonableness of answers.
Estimation strategies for calculations with fractions and decimals extend from students’ work with whole number
operations. Estimation strategies include, but are not limited to:
• front-end estimation with adjusting (using the highest place value and estimating from the front end making
adjustments to the estimate by taking into account the remaining amounts),
• clustering around an average (when the values are close together an average value is selected and
multiplied by the number of values to determine an estimate),
• rounding and adjusting (students round down or round up and then adjust their estimate depending on how much
the rounding affected the original values),
• using friendly or compatible numbers such as factors (students seek to fit numbers together - i.e., rounding to
factors and grouping numbers together that have round sums like 100 or 1000), and
• using benchmark numbers that are easy to compute (students select close whole numbers for fractions or decimals
to determine an estimate).

Mathematics
RP = Ratios and Proportional Reasoning NS= The Number System EE= Expressions and Equations G= Geometry SP= Statistics and Probability
Component Cluster 7.RP Analyze proportional relationships and use them to solve real-world and mathematical problems.
7.RP.2 Recognize and represent proportional
relationships between quantities.
a. Decide whether two quantities are in a proportional
relationship, e.g., by testing for equivalent ratios in a table
or graphing on a coordinate plane and observing whether
the graph is a straight line through the origin.
b. Identify the constant of proportionality (unit rate) in
tables, graphs, equations, diagrams, and verbal
descriptions of proportional relationships.
See Unit 5.
7.RP.3 Use proportional relationships to solve multistep
ratio and percent problems. Examples: simple interest,
tax, markups and markdowns, gratuities and
commissions, fees, percent increase and decrease,
percent error
See Unit 5.

Mathematics
RP = Ratios and Proportional Reasoning NS= The Number System EE= Expressions and Equations G= Geometry SP= Statistics and Probability
Grade 7 Accelerated Unit 8: Three-Dimensional Geometry (~ 3 weeks)
Unit Overview: Unit 7 returns to geometry with students drawing, constructing, analyzing, and measuring geometrical figures again with a focus on three-
dimensional objects. They focus on volume and surface area of common objects referencing area and circumference of circles. Students will revisit and extend
important ideas related to proportionality. This unit provides the opportunity for students to apply mathematical practice standards requiring them to reason
abstractly and quantitatively as they develop meaning and algorithms for volume and surface area.
Guiding Question: How do the dimensions and structure of a three-dimensional figure contribute to the components of a formula?
The student will be able to: The teacher will use appropriate instructional strategies/approaches based on the needs of the student.
Component Cluster 7.G Draw, construct, and describe geometrical figures and describe the relationships between them.
7.G.1 Solve problems involving scale drawings of
geometric figures, including computing actual lengths
and areas from a scale drawing and reproducing a scale
drawing at a different scale.
Students determine the dimensions of figures when given a scale and identify the impact of a scale on actual length
(one-dimension) and area (two-dimensions). Students identify the scale factor given two figures. Using a given
scale drawing, students reproduce the drawing at a different scale. Students understand that the lengths will change
by a factor equal to the product of the magnitude of the two size transformations.
Component Cluster 7.G Draw, construct, and describe geometrical figures and describe the relationships between them.
7.G.3 Describe the two-dimensional figures that result
from slicing three-dimensional figures, as in plane
sections of right rectangular prisms and right rectangular
pyramids.
Students need to describe the resulting face shape from cuts made parallel and perpendicular to the bases of right
rectangular prisms and pyramids. Cuts made parallel will take the shape of the base; cuts made perpendicular will
take the shape of the lateral (side) face. Cuts made at an angle through the right rectangular prism will produce a
parallelogram;
If the pyramid is cut with a plane (green) parallel to the base, the intersection of the pyramid and the plane is a
square cross section (red).
If the pyramid is cut with a plane (green) passing through the top vertex and perpendicular to the base, the
intersection of the pyramid and the plane is a triangular cross section (red).

Mathematics
RP = Ratios and Proportional Reasoning NS= The Number System EE= Expressions and Equations G= Geometry SP= Statistics and Probability
If the pyramid is cut with a plane (green) perpendicular to the base, but not through the top vertex, the intersection
of the pyramid and the plane is a trapezoidal cross section (red).
http://intermath.coe.uga.edu/dictnary/descript.asp?termID=95
Component Cluster 7.G Solve real-life and mathematical problems involving angle measure, area, surface area, and volume.
7.G.6 Solve real-world and mathematical problems
involving area, volume and surface area of two and three-
dimensional objects composed of triangles, quadrilaterals,
polygons, cubes, and right prisms.
Students continue work from 5th and 6th grade to work with area, volume and surface area of two-dimensional and
three-dimensional objects. (composite shapes) Students will not work with cylinders, as circles are not polygons. At
this level, students determine the dimensions of the figures given the area or volume.
“Know the formula” does not mean memorization of the formula. To “know” means to have an understanding of
why the formula works and how the formula relates to the measure (area and volume) and the figure. This
understanding should be for all students.
Surface area formulas are not the expectation with this standard. Building on work with nets in the 6th grade,
students should recognize that finding the area of each face of a three-dimensional figure and adding the areas will
give the surface area. No nets will be given at this level; however, students could create nets to aid in surface area
calculations. Students understanding of volume can be supported by focusing on the area of base times the height
to calculate volume. Students solve for missing dimensions, given the area or volume.
Component Cluster 7.NS Apply and extend previous understandings of operations with fractions to add, subtract, multiply, and divide rational numbers.
7.NS.3 Solve real-world and mathematical problems
involving the four operations with rational numbers.1
1Computations with rational numbers extend the rules for
manipulating fractions to complex fractions.
See Unit 1.
Component Cluster 7.RP Analyze proportional relationships and use them to solve real-world and mathematical problems.

Mathematics
RP = Ratios and Proportional Reasoning NS= The Number System EE= Expressions and Equations G= Geometry SP= Statistics and Probability
7.RP.2 Recognize and represent proportional
relationships between quantities.
See Unit 5.
Component Cluster 7.EE Use properties of operations to generate equivalent expressions.
7.EE.1 Apply properties of operations as strategies to
add, subtract, factor, and expand linear expressions with
rational coefficients.
See Unit 3.
7.EE.2 Understand that rewriting an expression in
different forms in a problem context can shed light on the
problem and how the quantities in it are related. For
example, a + 0.05a = 1.05a means that “increase by
5%” is the same as “multiply by 1.05.”
See Unit 3.

Mathematics
RP = Ratios and Proportional Reasoning NS= The Number System EE= Expressions and Equations G= Geometry SP= Statistics and Probability
Grade 7 Accelerated Unit 9: Statistics (~ 4 weeks)
Unit Overview: In Unit 8, students learn to draw inferences about populations based on random samples. Students will organize data using tables, dot plots, line
plots, bar graphs, histograms, and box-and-whisker plots. Students will explore measures of center and measures of spread. This unit provides an opportunity for
students to attend to precision (MP6) as they think critically about the required accuracy of results.
Guiding question: How can samples help when comparing two or more populations?
The student will be able to: The teacher will use appropriate instructional strategies/approaches based on the needs of the student.
Component Cluster 7.SP Use random sampling to draw inferences about a population.
7.SP.1 Understand that statistics can be used to gain
information about a population by examining a sample of
the population; generalizations about a population from a
sample are valid only if the sample is representative of
that population. Understand that random sampling tends
to produce representative samples and support valid
inferences.
Students recognize that it is difficult to gather statistics on an entire population. Instead a random sample can be
representative of the total population and will generate valid predictions. Students use this information to draw
inferences from data. A random sample must be used in conjunction with the population to get accuracy. For
example, a random sample of elementary students cannot be used to give a survey about the prom.
7.SP.2 Use data from a random sample to draw inferences
about a population with an unknown characteristic of
interest. Generate multiple samples (or simulated
samples) of the same size to gauge the variation in
estimates or predictions. For example, estimate the mean
word length in a book by randomly sampling words from
the book; predict the winner of a school election based on
randomly sampled survey data. Gauge how far off the
estimate or prediction might be.
Students collect and use multiple samples of data to make generalizations about a population. Issues of variation in
the samples should be addressed.
Component Cluster 7.SP Draw informal comparative inferences about two populations.
7.SP.3 Informally assess the degree of visual overlap of
two numerical data distributions with similar variabilities,
measuring the difference between the centers by
expressing it as a multiple of a measure of variability. For
example, the mean height of players on the basketball
team is 10 cm greater than the mean height of players on
the soccer team, about twice the variability (mean
absolute deviation) on either team; on a dot plot, the
separation between the two distributions of heights is
noticeable.
This is the students’ first experience with comparing two data sets. Students build on their understanding of graphs,
mean, median, Mean Absolute Deviation (MAD) and interquartile range from 6th grade. Students understand that
1. a full understanding of the data requires consideration of the measures of variability as well as mean or median,
2. variability is responsible for the overlap of two data sets and that an increase in variability can increase the
overlap, and
3. median is paired with the interquartile range and mean is paired with the mean absolute deviation.
The mean absolute deviation (MAD) is calculated by taking the mean of the absolute deviations for each data point.
The difference between each data point and the mean is recorded in the second column of the table. The difference
between each data point and the mean is recorded in the second column of the table. The absolute deviation,
absolute value of the deviation, is recorded in the third column. The absolute deviations are summed and divided by
the number of data points in the set.
7.SP.4 Use measures of center and measures of variability
for numerical data from random samples to draw informal
Students compare two sets of data using measures of center (mean and median) and variability MAD and IQR).
Showing the two graphs vertically rather than side by side helps students make comparisons.

Mathematics
RP = Ratios and Proportional Reasoning NS= The Number System EE= Expressions and Equations G= Geometry SP= Statistics and Probability
comparative inferences about two populations. For
example, decide whether the words in a chapter of a
seventh-grade science book are generally longer than the
words in a chapter of a fourth-grade science book.

Mathematics
RP = Ratios and Proportional Reasoning NS= The Number System EE= Expressions and Equations G= Geometry SP= Statistics and Probability
Grade 8 In Grade 8, instructional time should focus on three critical areas: (1) formulating and reasoning about expressions and equations, including modeling
an association in bivariate data with a linear equation, and solving linear equations and systems of linear equations; (2) grasping the concept of a
function and using functions to describe quantitative relationships; (3) analyzing two- and three-dimensional space and figures using distance, angle,
similarity, and congruence, and understanding and applying the Pythagorean Theorem.
(1) Students use linear equations and systems of linear equations to represent, analyze, and solve a variety of problems. Students recognize
equations for proportions (y/x = m or y = mx) as special linear equations (y = mx + b), understanding that the constant of proportionality (m) is
the slope, and the graphs are lines through the origin. They understand that the slope (m) of a line is a constant rate of change, so that if the
input or x-coordinate changes by an amount A, the output or y-coordinate changes by the amount m·A. Students also use a linear equation to
describe the association between two quantities in bivariate data (such as arm span vs. height for students in a classroom). At this grade,
fitting the model, and assessing its fit to the data are done informally. Interpreting the model in the context of the data requires students to
express a relationship between the two quantities in question and to interpret components of the relationship (such as slope and y-intercept) in
terms of the situation.
Students strategically choose and efficiently implement procedures to solve linear equations in one variable, understanding that when they use
the properties of equality and the concept of logical equivalence, they maintain the solutions of the original equation. Students solve systems
of two linear equations in two variables and relate the systems to pairs of lines in the plane; these intersect, are parallel, or are the same line.
Students use linear equations, systems of linear equations, linear functions, and their understanding of slope of a line to analyze situations and
solve problems.
(2) Students grasp the concept of a function as a rule that assigns to each input exactly one output. They understand that functions describe
situations where one quantity determines another. They can translate among representations and partial representations of functions (noting
that tabular and graphical representations may be partial representations), and they describe how aspects of the function are reflected in the
different representations.
(3) Students use ideas about distance and angles, how they behave under translations, rotations, reflections, and dilations, and ideas about
congruence and similarity to describe and analyze two-dimensional figures and to solve problems. Students show that the sum of the angles in
a triangle is the angle formed by a straight line, and that various configurations of lines give rise to similar triangles because of the angles
created when a transversal cuts parallel lines. Students understand the statement of the Pythagorean Theorem and its converse, and can
explain why the Pythagorean Theorem holds, for example, by decomposing a square in two different ways. They apply the Pythagorean
Theorem to find distances between points on the coordinate plane, to find lengths, and to analyze polygons. Students complete their work on
volume by solving problems involving cones, cylinders, and spheres. Mathematical Practices
1. Make sense of problems and persevere in solving them.
2. Reason abstractly and quantitatively.
3. Construct viable arguments and critique the reasoning of others.
4. Model with mathematics.
5. Use appropriate tools strategically.
6. Attend to precision.
7. Look for and make use of structure.
8. Look for and express regularity in repeated reasoning.

Mathematics
RP = Ratios and Proportional Reasoning NS= The Number System EE= Expressions and Equations G= Geometry SP= Statistics and Probability
Grade 8: Suggested Distribution of Units in Instructional Weeks Time Approximate
# of Weeks
Unit 1: Linear Equations and Functions 10 % ~ 4 weeks
Unit 2: Pythagorean Theorem and the Number System 17 % ~ 6 weeks
Unit 3: Congruence and Similarity 14 % ~ 5 weeks
Unit 4: Linear Models and Variability 14 % ~ 5 weeks
Unit 5: Modeling with Equations 14 % ~ 5 weeks
Unit 6: Systems of Equations 17 % ~ 6 weeks
Unit 7: Exponents 14 % ~ 5 Weeks
Instructional
Focus of Unit: Ratios and Proportional Reasoning Number System Expressions and Equations/ Functions Geometry Statistics and Probability
Unit 1: Linear Equations and
Functions10%
Unit 2: Pythagorean Theorem and the Number System
17%
Unit 3: Congruence and Similiarity
14%
Unit 4: Linear Models and Variability
14%
Unit 5: Modeling with Equations
14%
Unit 6: Systems of Equations
17%
Unit 7: Exponents
14%
Instructional Time

Mathematics
RP = Ratios and Proportional Reasoning NS= The Number System EE= Expressions and Equations G= Geometry SP= Statistics and Probability
Grade 8 Unit 1: Linear Equations and Functions (~ 4 weeks)
Unit Overview: In Unit 1, students extend their understanding of proportional relationships to linear relationships and develop the understanding that
the constant of proportionality (m) is the slope. Students learn to recognize linear relationships by the constant rate of change between two variables
in a verbal context, table, graph, and equation. The slope and y-intercept of the graph of a linear relationship are formalized in this unit. This unit
provides the opportunity for students to reason abstractly and quantitatively (MP2) as they move back and forth between the context of real life math
problems and the algebraic representations they are using to solve the problems. Guiding Question: How does reflecting on the real-life context of the initial math problem help to make sense of the mathematics?
The student will be able to: The teacher will use appropriate instructional strategies/approaches based on the needs of the student.
Component Cluster 8.EE Understand the connections between proportional relationships, lines, and linear equations.
8.EE.5 Graph proportional relationships, interpreting the
unit rate as the slope of the graph. Compare two different
proportional relationships represented in different ways.
For example, compare a distance-time graph to a
distance-time equation to determine which of two moving
objects has greater speed.
Students build on their work with unit rates from 6th grade and proportional relationships in 7th grade to compare
graphs, tables and equations of proportional relationships. Students identify the unit rate (or slope) in graphs, tables
and equations to compare two proportional relationships represented in different ways. Given an equation of a
proportional relationship, students draw a graph of the relationship. Students recognize that the unit rate is the
coefficient of x and that this value is also the slope of the line.
Component Cluster 8.F Define, evaluate, and compare functions.
8.F.2 Compare properties of two functions each
represented in a different way (algebraically, graphically,
numerically in tables, or by verbal descriptions). For
example, given a linear function represented by a table of
values and a linear function represented by an algebraic
expression, determine which function has the greater rate
of change.
Students compare two functions from different representations.
NOTE: Functions could be expressed in standard form. However, the intent is not to change from standard form to
slope-intercept form but to use the standard form to generate ordered pairs. Substituting a zero (0) for x and y will
generate two ordered pairs. From these ordered pairs, the slope could be determined.
8.F.3 Interpret the equation y = mx + b as defining a
linear function, whose graph is a straight line; give
examples of functions that are not linear. For example,
the function A = s² giving the area of a square as a
function of its side length is not linear because its graph
contains the points (1,1), (2,4) and (3,9), which are not on
a straight line.
Students understand that linear functions have a constant rate of change between any two points. Students use
equations, graphs and tables to categorize functions as linear or non-linear.
Component Cluster 8.F Use functions to model relationships between quantities.
8.F.4 Construct a function to model a linear relationship
between two quantities. Determine the rate of change and
initial value of the function from a description of a
relationship or from two (x, y) values, including reading
these from a table or from a graph. Interpret the rate of
change and initial value of a linear function in terms of the
situation it models, and in terms of its graph or a table of
values.
Students identify the rate of change (slope) and initial value (y-intercept) from tables, graphs, equations or verbal
descriptions to write a function (linear equation). Students understand that the equation represents the relationship
between the x-value and the y-value; what math operations are performed with the x-value to give the y-value.
Slopes could be undefined slopes or zero slopes.
Tables:
Students recognize that in a table the y-intercept is the y-value when x is equal to 0. The slope can be determined by
finding the ratio 𝑦
𝑥 between the change in two y-values and the change between the two corresponding x-values.

Mathematics
RP = Ratios and Proportional Reasoning NS= The Number System EE= Expressions and Equations G= Geometry SP= Statistics and Probability
Using graphs, students identify the y-intercept as the point where the line crosses the y-axis and the slope as the 𝑟𝑖𝑠𝑒
𝑟𝑢𝑛.
Equations:
In a linear equation the coefficient of x is the slope and the constant is the y-intercept. Students need to be given the
equations in formats other than y = mx + b, such as y = ax + b (format from graphing calculator), y = b + mx (often
the format from contextual situations), etc.
Point and Slope:
Students write equations to model lines that pass through a given point with the given slope.
Students also write equations given two ordered pairs. Note that point-slope form is not an expectation at this
level. Students use the slope and y-intercepts to write a linear function in the form y = mx +b.
Contextual Situations:
In contextual situations, the y-intercept is generally the starting value or the value in the situation when the
independent variable is 0. The slope is the rate of change that occurs in the problem. Rates of change can often
occur over years. In these situations it is helpful for the years to be “converted” to 0, 1, 2, etc. For example, the
years of 1960, 1970, and 1980 could be represented as 0 (for 1960), 10 (for 1970) and 20 (for 1980). Students
interpret the rate of change and the y-intercept in the context of the problem. Classroom discussion about one-time
fees vs. recurrent fees will help students model contextual situations.
8.F.5 Describe qualitatively the functional relationship
between two quantities by analyzing a graph, (e.g. where
the function is increasing or decreasing, linear or
nonlinear). Sketch a graph that exhibits the qualitative
features of a function that has been described verbally.
Given a verbal description of a situation, students sketch a graph to model that situation. Given a graph of a
situation, students provide a verbal description of the situation.
Grade 8 Unit 2: Pythagorean Theorem and the Number System (~ 6 weeks) Unit Overview: Students will discover and explain a proof of the Pythagorean Theorem on their own. The students will make connections between
rational and irrational numbers, and look at different ways to represent them (radicals, non-repeating decimal expansion). The Pythagorean Theorem
is also used to motivate a discussion of irrational square roots. Students have the opportunity to construct viable arguments and critique the reasoning
of others (MP3) as they justify proposed conjectures related to the Pythagorean Theorem. Guiding Question: How are deductive reasoning and informal arguments used to prove the Pythagorean Theorem?
The student will be able to: The teacher will use appropriate instructional strategies/approaches based on the needs of the student.
Component Cluster 8.EE Work with radicals and integer exponents.
8.EE.2 Use square root and cube root symbols to
represent solutions to equations of the form x² = p and x³
= p, where p is a positive rational number. Evaluate
square roots of small perfect squares and cube roots of
small perfect cubes. Know that √2 is irrational.
Students recognize perfect squares and cubes, understanding that non-perfect squares and non-perfect cubes are
irrational.
Students recognize that squaring a number and taking the square root √ of a number are inverse operations;
likewise, cubing a number and taking the cube root √3
are inverse operations.
Rational numbers would have perfect squares or perfect cubes for the numerator and denominator. In the standard,
the value of p for square root and cube root equations must be positive.
Students understand that in geometry the square root of the area is the length of the side of a square and a cube root
of the volume is the length of the side of a cube. Students use this information to solve problems, such as finding
the perimeter.
Component Cluster 8.G Understand and apply the Pythagorean Theorem.

Mathematics
RP = Ratios and Proportional Reasoning NS= The Number System EE= Expressions and Equations G= Geometry SP= Statistics and Probability
8.G.6 Explain a proof of the Pythagorean Theorem and its
converse.
Using models, students explain the Pythagorean Theorem, understanding that the sum of the squares of the legs is
equal to the square of the hypotenuse in a right triangle.
Students also understand that given three side lengths with this relationship forms a right triangle.
8.G.7 Apply the Pythagorean Theorem to determine
unknown side lengths in right triangles in real-world and
mathematical problems in two and three dimensions.
Apply the Pythagorean Theorem to determine unknown side lengths in right triangles in real-world and
mathematical problems in two and three dimensions.
Based on this work, students could then find the volume or surface area.
8.G.8 Apply the Pythagorean Theorem to find the
distance between two points in a coordinate system.
One application of the Pythagorean Theorem is finding the distance between two points on the coordinate plane.
Students build on work from 6th grade (finding vertical and horizontal distances on the coordinate plane) to
determine the lengths of the legs of the right triangle drawn connecting the points. Students understand that the line
segment between the two points is the length of the hypotenuse.
NOTE: The use of the distance formula is not an expectation.
Students find area and perimeter of two-dimensional figures on the coordinate plane, finding the distance between
each segment of the figure. (Limit one diagonal line, such as a right trapezoid or parallelogram)
Component Cluster 8.NS Know that there are numbers that are not rational, and approximate them by rational numbers.
8.NS.1 Know that numbers that are not rational are called
irrational. Understand informally that every number has a
decimal expansion; for rational numbers show that the
decimal expansion repeats eventually, and convert a
decimal expansion which repeats eventually into a
rational number.
Students understand that Real numbers are either rational or irrational. They distinguish between rational and
irrational numbers, recognizing that any number that can be expressed as a fraction is a rational number. The
diagram below illustrates the relationship between the subgroups of the real number system.
Students recognize that the decimal equivalent of a fraction will either terminate or repeat. Fractions that terminate
will have denominators containing only prime factors of 2 and/or 5. This understanding builds on work in 7th grade
when students used long division to distinguish between repeating and terminating decimals. Students convert
repeating decimals into their fraction equivalent using patterns or algebraic reasoning.
8.NS.2 Use rational approximations of irrational numbers
to compare the size of irrational numbers, locate them
approximately on a number line diagram, and estimate the
value of expressions (e.g., √2). For example, by
truncating the decimal expansion of √2, show that √2 is
between 1 and 2, then between 1.4 and 1.5, and explain
how to continue on to get better approximations.
Students locate rational and irrational numbers on the number line. Students compare and order rational and
irrational numbers. Students also recognize that square roots may be negative and written as -√28. Additionally,
students understand that the value of a square root can be approximated between integers and that non-perfect
square roots are irrational.

Mathematics
RP = Ratios and Proportional Reasoning NS= The Number System EE= Expressions and Equations G= Geometry SP= Statistics and Probability
Grade 8 Unit 3: Congruence and Similarity (~ 5 weeks)
Unit Overview: In Unit 4, students study congruence by experimenting with rotations, reflections, and translations of geometrical figures. This unit
includes an exploration using deductive reasoning and informal arguments to establish the angle sum theorem and parallel lines cut by transversals.
The experimental study of rotations, reflections, and translations at the beginning of the unit prepares students for the more complex work of
understanding the effects of dilations on geometrical figures in their study of similarity. This unit spends a significant amount of time using
appropriate tools strategically (MP5) such as rulers, protractors, tracing paper, and technology. Guiding Questions: How are congruent and similar figures represented in transformations? What is the relationship between congruent and similar figures?
The student will be able to: The teacher will use appropriate instructional strategies/approaches based on the needs of the student.
Component Cluster 8.G Understand congruence and similarity using physical models, transparencies, or geometry software.
8.G.1 Verify experimentally the properties of rotations,
reflections, and translations:
a. Lines are taken to lines, and line segments to line
segments of the same length.
b. Angles are taken to angles of the same measure.
c. Parallel lines are taken to parallel lines.
Students use compasses, protractors and rulers or technology to explore figures created from translations,
reflections and rotations. Characteristics of figures, such as lengths of line segments, angle measures and parallel
lines, are explored before the transformation (pre-image) and after the transformation (image). Students understand
that these transformations produce images of exactly the same size and shape as the pre-image and are known as
rigid transformations.
8.G.2 Understand that a two-dimensional figure is
congruent to another if the second can be obtained from
the first by a sequence of rotations, reflections and
translations; given two congruent figures, describe a
sequence that exhibits the congruence between them.
This standard is the students’ introduction to congruency. Congruent figures have the same shape and size.
Translations, reflections and rotations are examples of rigid transformations. A rigid transformation is one in which
the pre-image and the image both have exactly the same size and shape since the measures of the corresponding
angles and corresponding line segments remain equal (are congruent).
Students examine two figures to determine congruency by identifying the rigid transformation(s) that produced the
figures. Students recognize the symbol for congruency (≅) and write statements of congruency.
8.G.3 Describe the effect of translations, rotations, and
reflections on two-dimensional figures using coordinates.
Students identify resulting coordinates from translations, reflections, and rotations (90º, 180º and 270º both
clockwise and counterclockwise), recognizing the relationship between the coordinates and the transformation.
Translations
Translations move the object so that every point of the object moves in the same direction as well as the same
distance. In a translation, the translated object is congruent to its pre-image.
Reflections
A reflection is the “flipping” of an object over a line, known as the “line of reflection”. In the 8th grade, the line of
reflection will be the x-axis and the y-axis. Students recognize that when an object is reflected across the y-axis, the
reflected x-coordinate is the opposite of the pre-image x-coordinate.
Rotations
A rotation is a transformation performed by “spinning” the figure around a fixed point known as the center of
rotation. The figure may be rotated clockwise or counterclockwise up to 360º (at 8th grade, rotations will be around
the origin and a multiple of 90º). In a rotation, the rotated object is congruent to its pre-image.
Students recognize the relationship between the coordinates of the pre-image and the image. Students identify the
transformations based on the given coordinates.

Mathematics
RP = Ratios and Proportional Reasoning NS= The Number System EE= Expressions and Equations G= Geometry SP= Statistics and Probability
8.G.4 Understand that a two-dimensional figure is similar
to another if the second can be obtained from the first by a
sequence of rotations, reflections, translations, and
dilations; given two similar two-dimensional figures,
describe a sequence that exhibits the similarity between
them.
Similar figures and similarity are first introduced in the 8th grade. Students understand similar figures have
congruent angles and sides that are proportional. Similar figures are produced from dilations. Students describe the
sequence that would produce similar figures, including the scale factors. Students understand that a scale factor
greater than one will produce an enlargement in the figure, while a scale factor less than one will produce a
reduction in size.
Students need to be able to identify that triangles are similar or congruent based on given information.
8.G.5 Use informal arguments to establish facts about the
angle sum and exterior angle of triangles, about the angles
created when parallel lines are cut by a transversal, and
the angle-angle criterion for similarity of triangles. For
example, arrange three copies of the same triangle so that
the sum of the three angles appears to form a line, and
give an argument in terms of transversals why this is so.
Students use exploration and deductive reasoning to determine relationships that exist between the following:
a) angle sums and exterior angle sums of triangles, b) angles created when parallel lines are cut by a transversal,
and c) the angle-angle criterion for similarity of triangle.
Students construct various triangles and find the measures of the interior and exterior angles. Students make
conjectures about the relationship between the measure of an exterior angle and the other two angles of a triangle.
(the measure of an exterior angle of a triangle is equal to the sum of the measures of the other two interior angles)
and the sum of the exterior angles (360º). Using these relationships, students use deductive reasoning to find the
measure of missing angles.
Students construct parallel lines and a transversal to examine the relationships between the created angles. Students
recognize vertical angles, adjacent angles and supplementary angles from 7th grade and build on these relationships
to identify other pairs of congruent angles. Using these relationships, students use deductive reasoning to find the
measure of missing angles.
Students can informally conclude that the sum of the angles in a triangle is 180º (the angle-sum theorem) by
applying their understanding of lines and alternate interior angles.
Students construct various triangles having line segments of different lengths but with two corresponding congruent
angles. Comparing ratios of sides will produce a constant scale factor, meaning the triangles are similar. Students
solve problems with similar triangles.
Component Cluster 8.EE Understand the connections between proportional relationships, lines, and linear equations.
8.EE.6 Use similar triangles to explain why the slope m is
the same between any two distinct points on a non-
vertical line in the coordinate plane; derive the equation y
= mx for a line through the origin and the equation y = mx
+ b for a line intercepting the vertical axis at b..
Triangles are similar when there is a constant rate of proportionality between them. Using a graph, students
construct triangles between two points on a line and compare the sides to understand that the slope (ratio of rise to
run) is the same between any two points on a line.
Given an equation in slope-intercept form, students graph the line represented.
Students write equations in the form y = mx for lines going through the origin, recognizing that m represents the
slope of the line. Students write equations in the form y = mx + b for lines not passing through the origin,
recognizing that m represents the slope and b represents the y-intercept.

Mathematics
RP = Ratios and Proportional Reasoning NS= The Number System EE= Expressions and Equations G= Geometry SP= Statistics and Probability
Grade 8 Unit 4: Linear Models and Variability (~ 5 weeks)
Unit Overview: In Unit 4, students will build upon their prior knowledge of one-variable linear equations to review, solidify, and extend their
understanding and skill in solving equations. Students should have opportunities to compare and contrast linear and non-linear relationships. This
unit also uses the context of categorical and numerical data to develop student understanding of associations between variables using basic ideas of
correlation and two-way tables. The work in this unit requires students to model with mathematics (MP4) as they begin to use algebra to represent
the relationship between two variables using tables, graphs, equations, inequalities, and rules.
Guiding Question: How are applications of linear equations used to solve contextual problems?
The student will be able to: The teacher will use appropriate instructional strategies/approaches based on the needs of the student.
Component Cluster 8.F Define, evaluate, and compare functions.
8.F.1 Understand that a function is a rule that assigns to
each input exactly one output. The graph of a function is
the set of ordered pairs consisting of an input and the
corresponding output.*
*Function notation is not required in Grade 8.
Students understand rules that take x as input and gives y as output is a function. Functions occur when there is
exactly one y-value is associated with any x-value. Using y to represent the output we can represent this function
with the equations y = x2+ 5x + 4. Students are not expected to use the function notation f(x) at this level. Students
identify functions from equations, graphs, and tables/ordered pairs.
Graphs
Students recognize graphs such as the one below is a function using the vertical line test, showing that each x-value
has only one y-value;
whereas, graphs are not functions if there are 2 y-values for multiple x-value.
Tables or Ordered Pairs
Students read tables or look at a set of ordered pairs to determine functions and identify equations where there is
only one output (y-value) for each input (x-value).
Equations
Students recognize equations such as y = x or y = 𝑥2 + 3x + 4 as functions; whereas, equations such as 𝑥2 + 𝑦2 = 25
are not functions.
8.F.2 Compare properties of two functions each
represented in a different way (algebraically, graphically,
numerically in tables, or by verbal descriptions). For
example, given a linear function represented by a table of
values and a linear function represented by an algebraic
expression, determine which function has the greater rate
of change.
See Unit 1.

Mathematics
RP = Ratios and Proportional Reasoning NS= The Number System EE= Expressions and Equations G= Geometry SP= Statistics and Probability
8.F.3 Interpret the equation y = mx + b as defining a linear
function, whose graph is a straight line; give examples of
functions that are not linear. For example, the function A
= s² giving the area of a square as a function of its side
length is not linear because its graph contains the points
(1,1), (2,4) and (3,9), which are not on a straight line.
See Unit 1.
Component Cluster 8.F Use functions to model relationships between quantities.
8.F.4 Construct a function to model a linear relationship
between two quantities. Determine the rate of change and
initial value of the function from a description of a
relationship or from two (x, y) values, including reading
these from a table or from a graph. Interpret the rate of
change and initial value of a linear function in terms of
the situation it models, and in terms of its graph or a table
of values.
Students identify the rate of change (slope) and initial value (y-intercept) from tables, graphs, equations or verbal
descriptions to write a function (linear equation). Students understand that the equation represents the relationship
between the x-value and the y-value; what math operations are performed with the x-value to give the y-value.
Slopes could be undefined slopes or zero slopes.
Tables:
Students recognize that in a table the y-intercept is the y-value when x is equal to 0. The slope can be determined by
finding the ratio 𝑦
𝑥 between the change in two y-values and the change between the two corresponding x-values.
Using graphs, students identify the y-intercept as the point where the line crosses the y-axis and the slope as the 𝑟𝑖𝑠𝑒
𝑟𝑢𝑛.
Equations:
In a linear equation the coefficient of x is the slope and the constant is the y-intercept. Students need to be given the
equations in formats other than y = mx + b, such as y = ax + b (format from graphing calculator), y = b + mx (often
the format from contextual situations), etc.
Point and Slope:
Students write equations to model lines that pass through a given point with the given slope.
Students also write equations given two ordered pairs. Note that point-slope form is not an expectation at this
level. Students use the slope and y-intercepts to write a linear function in the form y = mx +b.
Contextual Situations:
In contextual situations, the y-intercept is generally the starting value or the value in the situation when the
independent variable is 0. The slope is the rate of change that occurs in the problem. Rates of change can often
occur over years. In these situations it is helpful for the years to be “converted” to 0, 1, 2, etc. For example, the
years of 1960, 1970, and 1980 could be represented as 0 (for 1960), 10 (for 1970) and 20 (for 1980). Students
interpret the rate of change and the y-intercept in the context of the problem. Classroom discussion about one-time
fees vs. recurrent fees will help students model contextual situations.
8.F.5 Describe qualitatively the functional relationship
between two quantities by analyzing a graph, (e.g. where
the function is increasing or decreasing, linear or
nonlinear). Sketch a graph that exhibits the qualitative
features of a function that has been described verbally.
Given a verbal description of a situation, students sketch a graph to model that situation. Given a graph of a
situation, students provide a verbal description of the situation.
Component Cluster 8.EE Understand the connections between proportional relationships, lines, and linear equations.

Mathematics
RP = Ratios and Proportional Reasoning NS= The Number System EE= Expressions and Equations G= Geometry SP= Statistics and Probability
8.EE.5 Graph proportional relationships, interpreting the
unit rate as the slope of the graph. Compare two different
proportional relationships represented in different ways.
For example, compare a distance-time graph to a distance-
time equation to determine which of two moving objects
has greater speed.
Students build on their work with unit rates from 6th grade and proportional relationships in 7th grade to compare
graphs, tables and equations of proportional relationships. Students identify the unit rate (or slope) in graphs, tables
and equations to compare two proportional relationships represented in different ways. Given an equation of a
proportional relationship, students draw a graph of the relationship. Students recognize that the unit rate is the
coefficient of x and that this value is also the slope of the line.
Component Cluster 8.EE Analyze and solve linear equations and pairs of simultaneous linear equations.
8.EE.7 Solve linear equations in one variable.
a. Give examples of linear equations in one variable
with one solution, infinitely many solutions, or no
solutions. Show which of these possibilities is the
case by successively transforming the given equation
into simpler forms, until an equivalent equation of
the form x = a, a = a, or a = b results (where a and b
are different numbers).
b. Solve linear equations with rational number
coefficients, including equations whose solutions
require expanding expressions using the distributive
property and collecting like terms.
Students solve one-variable equations including those with the variables being on both sides of the equals sign.
Students recognize that the solution to the equation is the value(s) of the variable, which make a true equality when
substituted back into the equation. Equations shall include rational numbers, distributive property and combining
like terms.
Equations have one solution when the variables do not cancel out. If each side of the equation were treated as a
linear equation and graphed, the solution of the equation represents the coordinates of the point where the two lines
would intersect.
Equations having no solution have variables that will cancel out and constants that are not equal. This means that
there is not a value that can be substituted for x that will make the sides equal. This solution means that no matter
what value is substituted for x the final result will never be equal to each other.
If each side of the equation were treated as a linear equation and graphed, the lines would be parallel.
An equation with infinitely many solutions occurs when both sides of the equation are the same. Any value of x
will produce a valid equation. If each side of the equation were treated as a linear equation and graphed, the graph
would be the same line.
Students write equations from verbal descriptions and solve.
8.EE.8 Analyze and solve pairs of simultaneous linear
equations.
a. Understand that solutions to a system of two linear
equations in two variables correspond to points of
intersection of their graphs, because points of
intersection satisfy both equations simultaneously.
b. Solve systems of two linear equations in two
variables algebraically, and estimate solutions by
graphing the equations. Solve simple cases by
inspection. For example, 3x + 2y = 5 and 3x + 2y
= 6 have no solution because 3x + 2y cannot
simultaneously be 5 and 6.
c. Solve real-world and mathematical problems
leading to two linear equations in two variables.
For example, given coordinates for two pairs of
points, determine whether the line through the first
Systems of linear equations can also have one solution, infinitely many solutions or no solutions.
Students will discover these cases as they graph systems of linear equations and solve them algebraically.
Students graph a system of two linear equations, recognizing that the ordered pair for the point of intersection is the
x-value that will generate the given y-value for both equations. Students recognize that graphed lines with one point
of intersection (different slopes) will have one solution, parallel lines (same slope, different y-intercepts) have no
solutions, and lines that are the same (same slope, same y-intercept) will have infinitely many solutions.
By making connections between algebraic and graphical solutions and the context of the system of linear equations,
students are able to make sense of their solutions. Students need opportunities to work with equations and context
that include whole number and/or decimals/fractions. Students define variables and create a system of linear
equations in two variables.
Note: Students are not expected to change linear equations written in standard form to slope-intercept form or solve
systems using elimination.

Mathematics
RP = Ratios and Proportional Reasoning NS= The Number System EE= Expressions and Equations G= Geometry SP= Statistics and Probability
pair of points intersects the line through the
second pair.
For many real world contexts, equations may be written in standard form. Students are not expected to change the
standard form to slope-intercept form. However, students may generate ordered pairs recognizing that the values of
the ordered pairs would be solutions for the equation.
Component Cluster 8.SP Investigate patterns of association in bivariate data.
8.SP.1 Construct and interpret scatter plots for bivariate
measurement data to investigate patterns of association
between two quantities. Describe patterns such as
clustering, outliers, positive or negative association, linear
association, and nonlinear association.
Bivariate data refers to two-variable data, one to be graphed on the x-axis and the other on the y-axis.
Students represent numerical data on a scatter plot, to examine relationships between variables. They analyze
scatter plots to determine if the relationship is linear (positive, negative association or no association) or nonlinear.
Students can use tools such as those at the National Center for Educational Statistics to create a graph or generate
data sets. (http://nces.ed.gov/nceskids/createagraph/default.aspx)
Data can be expressed in years. In these situations it is helpful for the years to be “converted” to 0, 1, 2, etc. For
example, the years of 1960, 1970, and 1980 could be represented as 0 (for 1960), 10 (for 1970) and 20 (for 1980).
Students recognize that points may be away from the other points (outliers) and have an effect on the linear model.
NOTE: Use of the formula to identify outliers is not expected at this level.
Students recognize that not all data will have a linear association. Some associations will be non-linear as in the
example below:
8.SP.2 Know that straight lines are widely used to model
relationships between two quantitative variables. For
scatter plots that suggest a linear association, informally
fit a straight line, and informally assess the model fit by
judging the closeness of the data points to the line.
Students understand that a straight line can represent a scatter plot with linear association. The most appropriate
linear model is the line that comes closest to most data points. The use of linear regression is not expected. If there
is a linear relationship, students draw a linear model. Given a linear model, students write an equation.
8.SP.3 Use the equation of a linear model to solve
problems in the context of bivariate measurement data,
interpreting the slope and intercept. For example, in a
linear model for a biology experiment, interpret a slope of
1.5 cm/hr as meaning that an additional hour of sunlight
each day is associated with an additional 1.5 cm in
mature plant height.
Linear models can be represented with a linear equation. Students interpret the slope and y-intercept of the line in
the context of the problem.

Mathematics
RP = Ratios and Proportional Reasoning NS= The Number System EE= Expressions and Equations G= Geometry SP= Statistics and Probability
8.SP.4 Understand that patterns of association can also be
seen in bivariate categorical data by displaying
frequencies and relative frequencies in a two-way table.
Construct and interpret a two-way table summarizing data
on two categorical variables collected from the same
subjects. Use relative frequencies calculated for rows or
columns to describe possible association between the two
variables. For example, collect data from students in your
class on whether or not they have a curfew on school
nights and whether or not they have assigned chores at
home. Is there evidence that those who have a curfew also
tend to have chores?
Students understand that a two-way table provides a way to organize data between two categorical variables. Data
for both categories needs to be collected from each subject. Students calculate the relative frequencies to describe
associations.

Mathematics
RP = Ratios and Proportional Reasoning NS= The Number System EE= Expressions and Equations G= Geometry SP= Statistics and Probability
Grade 8 Unit 5: Modeling with Equations (~ 5 weeks) Unit Overview: In Unit 5, students learn some of the traditional work of algebra including simplifying, factoring, expanding, evaluating, and solving
equations but with the additional focus on understanding what the symbolic expressions represent and how to reason about the relationships.
Students will write and interpret equivalent expressions, combine expressions to form new expressions, predict patterns of change represented by an
equation or expression, and solve equations. This unit continues the emphasis on analyzing multiple representations, such as graphic, tabular, and
symbolic, as well as thinking about the math in meaningful contexts, such as the volume of cylinders, cones, and spheres. Students will have many
opportunities to look for and make use of structure (MP7) as they analyze and manipulate expressions to solve equations. Guiding Question: What is the relationship between an equation and a graphical representation? How is this relationship used to solve an equation?
The student will be able to: The teacher will use appropriate instructional strategies/approaches based on the needs of the student.
Component Cluster 8.EE Analyze and solve linear equations and pairs of simultaneous linear equations.
8.EE.7. Solve linear equations in one variable.
a. Give examples of linear equations in one variable with
one solution, infinitely many solutions, or no solutions.
Show which of these possibilities is the case by
successively transforming the given equation into simpler
forms, until an equivalent equation of the form x = a, a =
a, or a = b results (where a and b are different numbers).
b. Solve linear equations with rational number
coefficients, including equations whose solutions require
expanding expressions using the distributive property and
collecting like terms.
See Unit 4.
Component Cluster 8.F Define, evaluate, and compare functions.
8.F.1 Understand that a function is a rule that assigns to
each input exactly one output. The graph of a function is
the set of ordered pairs consisting of an input and the
corresponding output.*
*Function notation is not required in Grade 8.
See Unit 4.
8.F.2 Compare properties of two functions each
represented in a different way (algebraically, graphically,
numerically in tables, or by verbal descriptions). For
example, given a linear function represented by a table of
values and a linear function represented by an algebraic
expression, determine which function has the greater rate
of change.
See Unit 1.
8.F.3 Interpret the equation y = mx + b as defining a linear
function, whose graph is a straight line; give examples of
functions that are not linear. For example, the function A
= s² giving the area of a square as a function of its side
See Unit 1.

Mathematics
RP = Ratios and Proportional Reasoning NS= The Number System EE= Expressions and Equations G= Geometry SP= Statistics and Probability
length is not linear because its graph contains the points
(1,1), (2,4) and (3,9), which are not on a straight line.
Component Cluster 8.F Use functions to model relationships between quantities.
8.F.4 Construct a function to model a linear relationship
between two quantities. Determine the rate of change and
initial value of the function from a description of a
relationship or from two (x, y) values, including reading
these from a table or from a graph. Interpret the rate of
change and initial value of a linear function in terms of
the situation it models, and in terms of its graph or a table
of values.
See Unit 1.
8.F.5 Describe qualitatively the functional relationship
between two quantities by analyzing a graph, (e.g. where
the function is increasing or decreasing, linear or
nonlinear). Sketch a graph that exhibits the qualitative
features of a function that has been described verbally.
See Unit 1.
Component Cluster 8.G Solve real-world and mathematical problems involving volume of cylinders, cones, and spheres.
8.G.9 Know the formulas for the volumes of cones,
cylinders and spheres and use them to solve real-world
and mathematical problems.
Students build on understandings of circles and volume from 7th grade to find the volume of cylinders, finding the
area of the base Π𝑟2 and multiplying by the number of layers (the height).
Students understand that the volume of a cylinder is 3 times the volume of a cone having the same base area and
height or that the volume of a cone is 1/3 the volume of a cylinder having the same base area and height.
𝑉 = 1
3𝜋𝑟2ℎ or 𝑉 =
𝜋𝑟2ℎ
3
A sphere can be enclosed with a cylinder, which has the same radius and height of the sphere (Note: the height of
the cylinder is twice the radius of the sphere). If the sphere is flattened, it will fill 2/3 of the cylinder. Based on this
model, students understand that the volume of a sphere is2/3 the volume of a cylinder with the same radius and
height. The height of the cylinder is the same as the diameter of the sphere or 2r. Using this information, the
formula for the volume of the sphere can be derived in the following way:
𝑉 = 𝜋𝑟2ℎ cylinder volume formula
𝑉 = 2
3𝜋𝑟2ℎ multiply by 2/3 since the volume of a sphere is 2/3 the cylinder’s volume
𝑉 = 2
3𝜋𝑟22𝑟 substitute 2r for height since 2r is the height of the sphere
𝑉 = 42
3𝜋𝑟3 simplify
Students find the volume of cylinders, cones and spheres to solve real world and mathematical problems. Answers
could also be given in terms of Pi.
“Know the formula” does not mean memorization of the formula. To “know” means to have an understanding of
why the formula works and how the formula relates to the measure (volume) and the figure. This understanding
should be for all students.
Note: At this level composite shapes will not be used and only volume will be calculated.

Mathematics
RP = Ratios and Proportional Reasoning NS= The Number System EE= Expressions and Equations G= Geometry SP= Statistics and Probability
Grade 8 Unit 6: Systems of Equations (~ 6 weeks)
Unit Overview: In Unit 6, students develop an understanding of the ways in which systems of equations can be used to model problem situations.
They develops skills in using graphic and algebraic methods to solve these systems. Close attention is paid to modeling with mathematics (MP4) as
students write equations for relationships and analyze the best way to look for appropriate solutions. Guiding Question: What strategy will be most effective in solving the system?
The student will be able to: The teacher will use appropriate instructional strategies/approaches based on the needs of the student.
Component Cluster 8.EE Analyze and solve linear equations and pairs of simultaneous linear equations.
8.EE.8 Analyze and solve pairs of simultaneous linear
equations.
a. Understand that solutions to a system of two linear
equations in two variables correspond to points of
intersection of their graphs, because points of
intersection satisfy both equations simultaneously.
b. Solve systems of two linear equations in two
variables algebraically, and estimate solutions by
graphing the equations. Solve simple cases by
inspection. For example, 3x + 2y = 5 and 3x + 2y
= 6 have no solution because 3x + 2y cannot
simultaneously be 5 and 6.
c. Solve real-world and mathematical problems
leading to two linear equations in two variables.
For example, given coordinates for two pairs of
points, determine whether the line through the first
pair of points intersects the line through the
second pair.
See Unit 4.
8.F.3 Interpret the equation y = mx + b as defining a linear
function, whose graph is a straight line; give examples of
functions that are not linear. For example, the function A
= s² giving the area of a square as a function of its side
length is not linear because its graph contains the points
(1,1), (2,4) and (3,9), which are not on a straight line.
See Unit 1.

Mathematics
RP = Ratios and Proportional Reasoning NS= The Number System EE= Expressions and Equations G= Geometry SP= Statistics and Probability
Grade 8 Unit 7: Exponents (~ 5 weeks) Unit Overview: Unit 3 interweaves concepts of exponents and functions to extend student understanding of both. Students explore linear functions
in contrast to exponential functions in the context of real-life situations. This creates opportunities to develop rules for operating and creating
equivalent expressions with exponents and with scientific notation. The unit develops students’ ability to reason abstractly and quantitatively (MP2)
as they move between tables, graphs, equations, and real-life situations.
Guiding Question: What is the connection between exponents and scientific notation?
The student will be able to: The teacher will use appropriate instructional strategies/approaches based on the needs of the student.
Component Cluster 8.F Define, evaluate, and compare functions.
8.F.1 Understand that a function is a rule that assigns to
each input exactly one output. The graph of a function is
the set of ordered pairs consisting of an input and the
corresponding output.*
*Function notation is not required in Grade 8.
See Unit 5.
8.F.2 Compare properties of two functions each
represented in a different way (algebraically, graphically,
numerically in tables, or by verbal descriptions). For
example, given a linear function represented by a table of
values and a linear function represented by an algebraic
expression, determine which function has the greater rate
of change.
See Unit 1.
8.F.3 Interpret the equation y = mx + b as defining a linear
function, whose graph is a straight line; give examples of
functions that are not linear. For example, the function A
= s² giving the area of a square as a function of its side
length is not linear because its graph contains the points
(1,1), (2,4) and (3,9), which are not on a straight line.
See Unit 1.
Component Cluster 8.F Use functions to model relationships between quantities.
8.F.4 Construct a function to model a linear relationship
between two quantities. Determine the rate of change and
initial value of the function from a description of a
relationship or from two (x, y) values, including reading
these from a table or from a graph. Interpret the rate of
change and initial value of a linear function in terms of
the situation it models, and in terms of its graph or a table
of values.
See Unit 1.
8.F.5 Describe qualitatively the functional relationship
between two quantities by analyzing a graph, (e.g. where
the function is increasing or decreasing, linear or
nonlinear). Sketch a graph that exhibits the qualitative
features of a function that has been described verbally.
See Unit 1.

Mathematics
RP = Ratios and Proportional Reasoning NS= The Number System EE= Expressions and Equations G= Geometry SP= Statistics and Probability
Component Cluster 8.EE Work with radicals and integer exponents.
8.EE.1 Know and apply the properties of integer
exponents to generate equivalent numerical expressions.
For example, 32 × 3–5 = 3–3 = 1/33 = 1/27.
In 6th grade, students wrote and evaluated simple numerical expressions with whole number exponents
(i.e. 53 = 5 • 5 • 5 = 125).
Integer (positive and negative) exponents are further developed to generate equivalent numerical expressions when
multiplying, dividing or raising a power to a power. Using numerical bases and the laws of exponents, students
generate equivalent expressions.
Students understand:
• Bases must be the same before exponents can be added, subtracted or multiplied.
• Exponents are subtracted when like bases are being divided
• A number raised to the zero (0) power is equal to one.
• Negative exponents occur when there are more factors in the denominator. These exponents can be expressed as a
positive if left in the denominator.
• Exponents are added when like bases are being multiplied
• Exponents are multiplied when an exponents is raised to an exponent
• Several properties may be used to simplify an expression
8.EE.3 Use numbers expressed in the form of a single
digit times an integer power of 10 to estimate very large
or very small quantities, and to express how many times
as much one is than the other. For example, estimate the
population of the United States as 3 × 10⁸ and the
population of the world as 7 × 10⁹, and determine that the
world population is more than 20 times larger.
Students use scientific notation to express very large or very small numbers. Students compare and interpret
scientific notation quantities in the context of the situation, recognizing that if the exponent increases by one, the
value increases 10 times. Likewise, if the exponent decreases by one, the value decreases 10 times.
Students solve problems using addition, subtraction or multiplication, expressing the answer in scientific notation.
8.EE.4 Perform operations with numbers expressed in
scientific notation, including problems where both
decimal and scientific notation are used. Use scientific
notation and choose units of appropriate size for
measurements of very large or very small quantities (e.g.,
use millimeters per year for seafloor spreading). Interpret
scientific notation that has been generated by technology.
Students understand scientific notation as generated on various calculators or other technology. Students enter
scientific notation using E or EE (scientific notation), * (multiplication), and ^ (exponent) symbols. Students use
laws of exponents to multiply or divide numbers written in scientific notation, writing the product or quotient in
proper scientific notation. Students understand the magnitude of the number being expressed in scientific notation
and choose an appropriate corresponding unit.

Mathematics
RP = Ratios and Proportional Reasoning NS= The Number System EE= Expressions and Equations G= Geometry SP= Statistics and Probability
NQ = Number and Quantity A = Algebra F = Functions M = Modeling G= Geometry S= Statistics and Probability
8th Grade Algebra I The fundamental purpose of this course is to complete, formalize and extend the mathematics that students have learned in the sixth and seventh grades. Because this accelerated
course will be completing, incorporating and building off of the totality of the middle grades standards, this is an even more ambitious version of Algebra I than has generally been
offered. The critical areas, called units, deepen and extend understanding of linear and exponential relationships by contrasting them with each other and by applying linear models
to data that exhibit a linear trend, and students engage in methods for analyzing, solving, and using quadratic functions. The Mathematical Practice Standards apply throughout each
course and, together with the content standards, prescribe that students experience mathematics as a coherent, useful, and logical subject that makes use of their ability to make sense
of problem situations.
Through the review and completion of the middle grades work, students will have learned to solve linear equations in one variable and how to apply graphical and algebraic methods
to analyze and solve systems of linear equations in two variables. Then, students analyze and explain the process of solving an equation. Students develop fluency writing, interpreting,
and translating between various forms of linear equations and inequalities, and using the different modalities to solve problems. They master the solution of linear equations and
apply related solution techniques and the laws of exponents to the creation and solution of simple exponential equations.
Students also complete their understanding of how to define, evaluate, and compare functions, and use them to model relationships between quantities. Then students will learn
function notation and develop the concepts of domain and range. They explore many examples of functions, including sequences; they interpret functions given graphically,
numerically, symbolically, and verbally, translate between representations, and understand the limitations of various representations. Students build on and informally extend their
understanding of integer exponents to consider exponential functions. They compare and contrast linear and exponential functions, distinguishing between additive and multiplicative
change. Students explore systems of equations and inequalities, and they find and interpret their solutions. They interpret arithmetic sequences as linear functions and geometric
sequences as exponential functions.
Building upon students’ prior experiences with data, students are now provided with more formal means of assessing how a model fits data. Students use regression techniques to
describe approximately linear relationships between quantities. They use graphical representations and knowledge of the context to make judgments about the appropriateness of
linear models. With linear models, they look at residuals to analyze the goodness of fit.
Students apply this new understanding of number and rules of exponents to strengthen their ability to see structure in and create quadratic and exponential expressions. They create
and solve equations, inequalities, and systems of equations involving quadratic expressions.
Students will also consider quadratic functions, comparing the key characteristics of quadratic functions to those of linear and exponential functions. They select from among these
functions to model phenomena. Students learn to anticipate the graph of a quadratic function by interpreting various forms of quadratic expressions. In particular, they identify the
real solutions of a quadratic equation as the zeros of a related quadratic function. Students expand their experience with functions to include more specialized functions—absolute
value, step, and those that are piecewise-defined.
Mathematical Practices
1. Make sense of problems and persevere in solving them.
2. Reason abstractly and quantitatively.
3. Construct viable arguments and critique the reasoning of others.
4. Model with mathematics.
5. Use appropriate tools strategically.
6. Attend to precision.
7. Look for and make use of structure.
8. Look for and express regularity in repeated reasoning.

Mathematics
RP = Ratios and Proportional Reasoning NS= The Number System EE= Expressions and Equations G= Geometry SP= Statistics and Probability
NQ = Number and Quantity A = Algebra F = Functions M = Modeling G= Geometry S= Statistics and Probability
8th Grade Algebra I: Suggested Distribution of Units in Instructional Days Time # of Weeks
Unit 0: Geometry ̴ 5 weeks
Unit 1: Patterns ̴ 3 weeks
Unit 2: Linear Equations and Inequalities ̴ 5 weeks
Unit 3: Functions ̴ 3 weeks
Unit 4: Linear Functions ̴ 5 weeks
Unit 5: Scatter Plots and Trend Lines ̴ 3 weeks
Unit 6: Systems of Equations ̴ 3 weeks
Unit 7: Introduction to Exponential Functions ̴ 3 weeks
Unit 8: Quadratic Functions and Equations ̴ 4 weeks
Performance Task ̴ 2 weeks
Unit 0: Geometry15%
Unit 1: Patterns8%
Unit 2: Linear Equations and
Inequalities15%
Unit 3: Functions8%
Unit 4: Linear Functions
15%
Unit 5: Scatter Plots and Trend
Lines9%
Unit 6: Systems of Equations
9%
Unit 7: Introduction to
Exponential Functions
9%
Unit 8: Quadratic Functions and
Equations12%
Instructional Time

Mathematics
RP = Ratios and Proportional Reasoning NS= The Number System EE= Expressions and Equations G= Geometry SP= Statistics and Probability
NQ = Number and Quantity A = Algebra F = Functions M = Modeling G= Geometry S= Statistics and Probability
8th Grade Algebra I Unit 0: Geometry (~ 3 weeks)
Unit Overview: The 8th grade year begins with a mini-geometry unit that completes the foundation for high school geometry before diving deeply
into the Algebra curriculum. Students will learn and explain a proof of the Pythagorean Theorem on their own. The Pythagorean Theorem is used to
motivate a discussion and review of irrational square roots. This is followed by an experimental study of rotations, reflections, and translations which
prepares students for the more complex later work of understanding the effects of dilations on geometrical figures in their study of similarity. They
also use informal arguments to establish ideas about angle sums, parallel lines cut by transverals, and similar triangles. Unit 0 concludes with
revisiting a proof of the Pythagorean Theorem from the perspective of similar triangles.
Guiding Questions:
How are deductive reasoning and informal arguments used to prove the Pythagorean Theorem?
How are congruent figures represented in transformations? How are congruent triangles used to determine relationships that exist in triangles and parallel lines?
How are similar figures represented in transformations and what is the relationship between congruent and similar figures?
The student will be able to: The teacher will use appropriate instructional strategies/approaches based on the needs of the student.
Component Cluster 8.G Understand congruence and similarity using physical models, transparencies, or geometry software.
8.G.1 Verify experimentally the properties of rotations,
reflections, and translations:
d. Lines are taken to lines, and line segments to line
segments of the same length.
e. Angles are taken to angles of the same measure.
f. Parallel lines are taken to parallel lines.
Students use compasses, protractors and rulers or technology to explore figures created from translations,
reflections and rotations. Characteristics of figures, such as lengths of line segments, angle measures and parallel
lines, are explored before the transformation (pre-image) and after the transformation (image). Students understand
that these transformations produce images of exactly the same size and shape as the pre-image and are known as
rigid transformations.
8.G.2 Understand that a two-dimensional figure is
congruent to another if the second can be obtained from
the first by a sequence of rotations, reflections and
translations; given two congruent figures, describe a
sequence that exhibits the congruence between them.
This standard is the students’ introduction to congruency. Congruent figures have the same shape and size.
Translations, reflections and rotations are examples of rigid transformations. A rigid transformation is one in which
the pre-image and the image both have exactly the same size and shape since the measures of the corresponding
angles and corresponding line segments remain equal (are congruent).
Students examine two figures to determine congruency by identifying the rigid transformation(s) that produced the
figures. Students recognize the symbol for congruency (≅) and write statements of congruency.
8.G.3 Describe the effect of translations, rotations, and
reflections on two-dimensional figures using coordinates.
Students identify resulting coordinates from translations, reflections, and rotations (90º, 180º and 270º both
clockwise and counterclockwise), recognizing the relationship between the coordinates and the transformation.
Translations
Translations move the object so that every point of the object moves in the same direction as well as the same
distance. In a translation, the translated object is congruent to its pre-image.
Reflections
A reflection is the “flipping” of an object over a line, known as the “line of reflection”. In the 8th grade, the line of
reflection will be the x-axis and the y-axis. Students recognize that when an object is reflected across the y-axis, the
reflected x-coordinate is the opposite of the pre-image x-coordinate.
Rotations

Mathematics
RP = Ratios and Proportional Reasoning NS= The Number System EE= Expressions and Equations G= Geometry SP= Statistics and Probability
NQ = Number and Quantity A = Algebra F = Functions M = Modeling G= Geometry S= Statistics and Probability
A rotation is a transformation performed by “spinning” the figure around a fixed point known as the center of
rotation. The figure may be rotated clockwise or counterclockwise up to 360º (at 8th grade, rotations will be around
the origin and a multiple of 90º). In a rotation, the rotated object is congruent to its pre-image.
Students recognize the relationship between the coordinates of the pre-image and the image. Students identify the
transformations based on the given coordinates.
Component Cluster 8.G Understand congruence and similarity using physical models, transparencies, or geometry software.
8.G.3 Describe the effect of dilations on two-dimensional
figures using coordinates.
Students identify resulting coordinates from translations, reflections, and rotations (90º, 180º and 270º both
clockwise and counterclockwise), recognizing the relationship between the coordinates and the transformation.
Dilations
A dilation is a non-rigid transformation that moves each point along a ray which starts from a fixed center, and
multiplies distances from this center by a common scale factor. Dilations enlarge (scale factors greater than one) or
reduce (scale factors less than one) the size of a figure by the scale factor. In 8th grade, dilations will be from the
origin. The dilated figure is similar to its pre-image.
Students recognize the relationship between the coordinates of the pre-image, the image and the scale factor for a
dilation from the origin. Using the coordinates, students are able to identify the scale factor (image/pre-image).
Students identify the transformation based on given coordinates.
8.G.4 Understand that a two-dimensional figure is similar
to another if the second can be obtained from the first by a
sequence of rotations, reflections, translations, and
dilations; given two similar two-dimensional figures,
describe a sequence that exhibits the similarity between
them.
Similar figures and similarity are first introduced in the 8th grade. Students understand similar figures have
congruent angles and sides that are proportional. Similar figures are produced from dilations. Students describe the
sequence that would produce similar figures, including the scale factors. Students understand that a scale factor
greater than one will produce an enlargement in the figure, while a scale factor less than one will produce a
reduction in size.
Students need to be able to identify that triangles are similar or congruent based on given information.
8.G.5 Use informal arguments to establish facts about the
angle sum and exterior angle of triangles, about the angles
created when parallel lines are cut by a transversal, and
the angle-angle criterion for similarity of triangles. For
example, arrange three copies of the same triangle so that
the sum of the three angles appears to form a line, and
give an argument in terms of transversals why this is so.
Students use exploration and deductive reasoning to determine relationships that exist between the following:
a) angle sums and exterior angle sums of triangles, b) angles created when parallel lines are cut by a transversal,
and c) the angle-angle criterion for similarity of triangle.
Students construct various triangles and find the measures of the interior and exterior angles. Students make
conjectures about the relationship between the measure of an exterior angle and the other two angles of a triangle.
(the measure of an exterior angle of a triangle is equal to the sum of the measures of the other two interior angles)
and the sum of the exterior angles (360º). Using these relationships, students use deductive reasoning to find the
measure of missing angles.
Students construct parallel lines and a transversal to examine the relationships between the created angles. Students
recognize vertical angles, adjacent angles and supplementary angles from 7th grade and build on these relationships
to identify other pairs of congruent angles. Using these relationships, students use deductive reasoning to find the
measure of missing angles.
Students can informally conclude that the sum of the angles in a triangle is 180º (the angle-sum theorem) by
applying their understanding of lines and alternate interior angles.
Students construct various triangles having line segments of different lengths but with two corresponding congruent
angles. Comparing ratios of sides will produce a constant scale factor, meaning the triangles are similar. Students
solve problems with similar triangles.

Mathematics
RP = Ratios and Proportional Reasoning NS= The Number System EE= Expressions and Equations G= Geometry SP= Statistics and Probability
NQ = Number and Quantity A = Algebra F = Functions M = Modeling G= Geometry S= Statistics and Probability
Component Cluster 8.G Understand and apply the Pythagorean Theorem.
8.G.6 Explain a proof of the Pythagorean Theorem and its
converse.
Using models, students explain the Pythagorean Theorem, understanding that the sum of the squares of the legs is
equal to the square of the hypotenuse in a right triangle.
Students also understand that given three side lengths with this relationship forms a right triangle.
8.G.7 Apply the Pythagorean Theorem to determine
unknown side lengths in right triangles in real-world and
mathematical problems in two and three dimensions.
Apply the Pythagorean Theorem to determine unknown side lengths in right triangles in real-world and
mathematical problems in two and three dimensions.
Based on this work, students could then find the volume or surface area.
8.G.8 Apply the Pythagorean Theorem to find the
distance between two points in a coordinate system.
One application of the Pythagorean Theorem is finding the distance between two points on the coordinate plane.
Students build on work from 6th grade (finding vertical and horizontal distances on the coordinate plane) to
determine the lengths of the legs of the right triangle drawn connecting the points. Students understand that the line
segment between the two points is the length of the hypotenuse.
NOTE: The use of the distance formula is not an expectation.
Students find area and perimeter of two-dimensional figures on the coordinate plane, finding the distance between
each segment of the figure. (Limit one diagonal line, such as a right trapezoid or parallelogram)

Mathematics
RP = Ratios and Proportional Reasoning NS= The Number System EE= Expressions and Equations G= Geometry SP= Statistics and Probability
NQ = Number and Quantity A = Algebra F = Functions M = Modeling G= Geometry S= Statistics and Probability
8th Grade Algebra I Unit 1: Patterns (~ 4 weeks) Unit Overview: In Unit 1, students will have an opportunity to investigate patterns including arithmetic and geometric sequences for the purpose of
writing equations of various types.
Guiding Question: How can patterns describe real world phenomena?
The student will be able to: The teacher will use appropriate instructional strategies/approaches based on the needs of the student.
Component Cluster 9-12.F.IF Understand the concept of a function and use function notation
9-12.F.IF.3 Recognize that sequences are functions,
sometimes defined recursively, whose domain is a subset
of the integers.
Patterns are developed using tables which are then used to develop the equations.
Component Cluster 9-12.F.BF Build a function that models a relationship between two quantities 9-12.F.BF.1 Write a function that describes a relationship
between two quantities.
a. Determine an explicit expression, a recursive
process, or steps for calculation from a context.
Multiple activities build this standard using experiments and other real life situations.
9-12.F.BF.2 Write arithmetic and geometric sequences
both recursively and with an explicit formula, use them to
model situations, and translate between the two forms.
Have students think about the starting point and how to get to the next level as they begin to develop their function
equations.

Mathematics
RP = Ratios and Proportional Reasoning NS= The Number System EE= Expressions and Equations G= Geometry SP= Statistics and Probability
NQ = Number and Quantity A = Algebra F = Functions M = Modeling G= Geometry S= Statistics and Probability
8th Grade Algebra I Unit 2: Linear Equations and Inequalities (~ 5 weeks) Unit Overview: In Unit 2, students will write, simplify, evaluate and model situations with linear expressions.
Guiding Question: How can we use linear equations and inequalities to solve real world problems?
The student will be able to: The teacher will use appropriate instructional strategies/approaches based on the needs of the student.
Component Cluster 8.EE Analyze and solve linear equations and pairs of simultaneous linear equations.
8.EE.7. Solve linear equations in one variable.
c. Give examples of linear equations in one variable
with one solution, infinitely many solutions, or no
solutions. Show which of these possibilities is the
case by successively transforming the given equation
into simpler forms, until an equivalent equation of the
form x = a, a = a, or a = b results (where a and b are
different numbers).
d. Solve linear equations with rational number
coefficients, including equations whose solutions
require expanding expressions using the distributive
property and collecting like terms.
Students solve one-variable equations including those with the variables being on both sides of the equals sign.
Students recognize that the solution to the equation is the value(s) of the variable, which make a true equality when
substituted back into the equation. Equations shall include rational numbers, distributive property and combining
like terms.
Equations have one solution when the variables do not cancel out. If each side of the equation were treated as a
linear equation and graphed, the solution of the equation represents the coordinates of the point where the two lines
would intersect.
Equations having no solution have variables that will cancel out and constants that are not equal. This means that
there is not a value that can be substituted for x that will make the sides equal. This solution means that no matter
what value is substituted for x the final result will never be equal to each other.
If each side of the equation were treated as a linear equation and graphed, the lines would be parallel.
An equation with infinitely many solutions occurs when both sides of the equation are the same. Any value of x
will produce a valid equation. If each side of the equation were treated as a linear equation and graphed, the graph
would be the same line.
Students write equations from verbal descriptions and solve.
Component Cluster 9-12.A.SSE Interpret the structure of expressions
9-12.A.SSE.1 Interpret expressions that represent a
quantity in terms of its context.
a. Interpret parts of an expression, such as terms,
factors, and coefficients
b. Interpret complicated expressions by viewing
one or more of their parts as a single entity.
For example, the Fibonacci sequence is defined recursively by f(0) = f(1) = 1, f(n+1) = f(n) + f(n-1) for n > 1.
Continue to focus on the terms in the context: what is the starting point and what is the change? Repeated addition
or repeated multiplication?
Component Cluster 9-12.A.SSE Write expressions in equivalent forms to solve problems
9-12.A.SSE.3 Choose and produce an equivalent form of
an expression to reveal and explain properties of quantity
represented by the expression.
Simplifying the initial equations can make them easier to understand.
Component Cluster 9-12.A.CED Create equations that describe numbers or relationships
9-12.A.CED.1 Create equations and inequalities in one
variable and use them to solve problems.
Once the equation is developed it can be used to predict what will happen in a much larger situation or one where
the data was not given.

Mathematics
RP = Ratios and Proportional Reasoning NS= The Number System EE= Expressions and Equations G= Geometry SP= Statistics and Probability
NQ = Number and Quantity A = Algebra F = Functions M = Modeling G= Geometry S= Statistics and Probability
9-12.A.CED.4 Rearrange formulas to highlight a quantity
of interest, using the same reasoning as in solving
equations
Solving for y might allow it to be easier to graph given their graphing background in earlier grades.
Component Cluster 9-12.A.REI Understanding solving equations as a process of reasoning and explain the reasoning
9-12.A.REI.1 Explain each step in solving a simple
equation as following from the equality of numbers
asserted at the previous step, starting from the assumption
that the original equation has a solution. Construct a viable
argument to justify a solution method.
Use the addition property of equality, the multiplication property of equality, etc. and refer to them by name so
students become familiar with them.
Component Cluster 9-12.A.REI Solve equations and inequalities in one variable
9-12.A.REI.3 Solve linear equations and inequalities in
one variable, including equations with coefficients
represented by letters.
Continue to reinforce solving skills developed in earlier grades. Solving of literal equations is an extension of solving
regular equations.
Component Cluster 9-12.N-Q.1 Reason quantitatively and use units to solve problems
9-12.N-Q.1 Use units as a way to understand problems and
to guide the solution of multi-step problems; choose and
interpret units consistently in formulas.
Have students use units as a way of connecting back to the concrete of the real world context.
9-12.N-Q.2 Define appropriate quantities for the purpose
of descriptive modeling.
Students should be able to determine what variable is being represented.
9-12.N-Q.3 Choose a level of accuracy appropriate to
limitations on measurements when reporting quantities.
It helps to keep the context in mind when determining values. For example, does it make sense to have a negative
number of people? Or does zero of something make sense in number of steps?

Mathematics
RP = Ratios and Proportional Reasoning NS= The Number System EE= Expressions and Equations G= Geometry SP= Statistics and Probability
NQ = Number and Quantity A = Algebra F = Functions M = Modeling G= Geometry S= Statistics and Probability
8th Grade Algebra I Unit 3: Functions (~ 3 weeks) Unit Overview: In Unit 3, students will develop a definition for relations and, subsequently, functions and determine if relations are functions.
Multiple representations are used (tables, mappings, graphs, ordered pairs, verbal descriptions and equations).
Guiding Question: What is a function and how can it be represented?
The student will be able to: The teacher will use appropriate instructional strategies/approaches based on the needs of the student.
Component Cluster 8.F Define, evaluate, and compare functions.*
* Linear and non-linear functions are compared in this module using linear equations and area/volume formulas as examples.
8.F.1 Understand that a function is a rule that assigns to
each input exactly one output. The graph of a function is
the set of ordered pairs consisting of an input and the
corresponding output.*
*Function notation is not required in
Grade 8.
Students understand rules that take x as input and gives y as output is a function. Functions occur when there is
exactly one y-value is associated with any x-value. Using y to represent the output we can represent this function
with the equations y = x2+ 5x + 4. Students are not expected to use the function notation f(x) at this level. Students
identify functions from equations, graphs, and tables/ordered pairs.
Graphs
Students recognize graphs such as the one below is a function using the vertical line test, showing that each x-value
has only one y-value;
whereas, graphs are not functions if there are 2 y-values for multiple x-value.
Tables or Ordered Pairs
Students read tables or look at a set of ordered pairs to determine functions and identify equations where there is
only one output (y-value) for each input (x-value).
Equations
Students recognize equations such as y = x or y = 𝑥2 + 3x + 4 as functions; whereas, equations such as 𝑥2
+ 𝑦2 = 25
are not functions.
8.F.2 Compare properties of two functions each
represented in a different way (algebraically, graphically,
numerically in tables, or by verbal descriptions). For
example, given a linear function represented by a table of
values and a linear function represented by an algebraic
expression, determine which function has the greater rate
of change.
Students compare two functions from different representations.
NOTE: Functions could be expressed in standard form. However, the intent is not to change from standard form to
slope-intercept form but to use the standard form to generate ordered pairs. Substituting a zero (0) for x and y will
generate two ordered pairs. From these ordered pairs, the slope could be determined.

Mathematics
RP = Ratios and Proportional Reasoning NS= The Number System EE= Expressions and Equations G= Geometry SP= Statistics and Probability
NQ = Number and Quantity A = Algebra F = Functions M = Modeling G= Geometry S= Statistics and Probability
Component Cluster 8.F Use functions to model relationships between quantities.
8.F.5 Describe qualitatively the functional relationship
between two quantities by analyzing a graph, (e.g. where
the function is increasing or decreasing, linear or
nonlinear). Sketch a graph that exhibits the qualitative
features of a function that has been described verbally.
Given a verbal description of a situation, students sketch a graph to model that situation. Given a graph of a
situation, students provide a verbal description of the situation.
Component Cluster 9-12.A.CED Create equations that describe numbers or relationships
9-12.A.CED.2 Create equations in two or more variables
to represent relationships between quantities; graph
equations on coordinate axes with labels and scales.
The standard is an extension of those developed in earlier grades. Students should be reaching this standard more
consistently.
Component Cluster 9-12.A.REI Represent and solve equations and inequalities graphically 9-12.A.REI.10 Understand that the graph of an equation
in two variables is the set of all its solutions plotted in the
coordinate plane, often forming a curve (which could be a
line).
Context may also dictate that graphs are connected or not connected. For example, number of people cannot be
partial so the graph would consist of points. Explain how one might want to connect the points anyway to see a
“model” that could predict future trends.
Component Cluster 9-12.F.IF Understand the concept of a function and use function notation
9-12.F.IF.1 Understand that a function from one set
(called the domain) to another set (called the range)
assigns to each element of the domain exactly one
element of the range. If f is a function and x is an element
of its domain, then f(x) denotes the output of f
corresponding to the input x. The graph of f is the graph
of the equation y=f(x).
The definition of a function is key to future mathematics. This concept will continue to thread through all course
work.
9-12.F.IF.2 Use function notation, evaluate functions for
inputs in their domains, and interpret statements that use
function notation in terms of context.
F(x) notation is used and must be distinguished between f x, a common misconception. The use of words written
out “f of x” can help this misunderstanding. Also, while f is often the function name, other letters are used
depending on the context.
Component Cluster 9-12.F.IF Interpret functions that arise in applications in terms of the context
9-12.F.IF.4 For a function that models a relationship
between two quantities, interpret key features of graphs
and tables in terms of the quantities and sketch graphs
showing key features given a verbal description of the
relationship.
Connecting to the context is important.
9-12.F.IF.5 Relate the domain of a function to its graph,
and where applicable, to the quantitative relationship it
describes.
Positive domains produce graphs that are in the first quadrant for most of the examples here.
Component Cluster 9-12.F.IF Analyze functions using different representations

Mathematics
RP = Ratios and Proportional Reasoning NS= The Number System EE= Expressions and Equations G= Geometry SP= Statistics and Probability
NQ = Number and Quantity A = Algebra F = Functions M = Modeling G= Geometry S= Statistics and Probability
9-12.F.IF.7 Graph functions expressed symbolically and
show key features of the graph, by hand in simple cases
and using technology for more complicated cases.
b.Graph square root, cube root, and piece-wise
functions, including step functions and absolute
value functions.
Use of the graphing calculator and analysis to help determine an appropriate window needs to be stressed. By
hand, scale and labeling appropriately is important. (b) identifies functions that may be included in the parent
function discussion.
9-12.F.IF.9 Compare properties of two functions each
represented in a different way (algebraically, graphically,
numerically in tables, or by verbal description).
Comparison helps identify key similarities and differences between two different functions or between two
functions of the same family.

Mathematics
RP = Ratios and Proportional Reasoning NS= The Number System EE= Expressions and Equations G= Geometry SP= Statistics and Probability
NQ = Number and Quantity A = Algebra F = Functions M = Modeling G= Geometry S= Statistics and Probability
8th Grade Algebra I Unit 4: Linear Functions (~ 6 weeks) Unit Overview: In Unit 4, students thoroughly explore linear functions, deriving linear models to describe behavior, talking about rates of change,
recognizing linear relationships from tables and graphs, followed by the development of equations of lines using slope intercept and point slope form.
Guiding Question: How may linear functions help us analyze real world situations and solve practical problems?
The student will be able to: The teacher will use appropriate instructional strategies/approaches based on the needs of the student.
Component Cluster 9-12.F.IF Interpret functions that arise in applications in terms of the context
9-12.F.IF.6 Calculate and interpret the average rate of
change of a function (presented symbolically or as a table)
over a specified interval. Estimate the rate of change
from a graph.
In linear functions this average rate of change is going to connect to the slope of the function and the graph.
Component Cluster 9-12.F.IF Analyze functions using different representations 9-12.F.IF.7 Graph functions expressed symbolically and
show key features of the graph, by hand in simple cases
and using technology for more complicated cases.
a. Graph linear functions and show intercepts.
Linear functions only are emphasized in this unit.
9-12.F.IF.8 Write a function defined by an expression in
different by equivalent forms to reveal and explain
different properties of the function.
Manipulation between different forms of a linear function will be helpful in graphing different forms.
Component Cluster 9-12.F.LE Construct and compare linear, quadratic, and exponential models and solve problems
9-12.F.LE.1 Distinguish between situations that can be
modeled with linear functions and with exponential
functions.
a. Prove that linear functions grow by equal
differences over interval.
b. Recognize situations in which one quantity
changes at a constant rate per unit interval
relative to another.
This goes back to the first unit when linear and exponential functions were developed in the patterns. Linear
functions will have a common addition term while exponential functions will be repeated multiplications.
9-12.F.LE.2 Construct linear and exponential functions,
including arithmetic and geometric sequences, given a
graph, a description of a relationship, or two input-output
pairs (including reading these from a table).
Connections are made to the first unit pattern development and now identifying those functions as linear and
exponential.
Component Cluster 9-12.F.LE
9-12.F.LE.5 Interpret the parameters in a linear …
function in terms of context.
Context can help determine intercepts and slope as well as domain if there are any restrictions.

Mathematics
RP = Ratios and Proportional Reasoning NS= The Number System EE= Expressions and Equations G= Geometry SP= Statistics and Probability
NQ = Number and Quantity A = Algebra F = Functions M = Modeling G= Geometry S= Statistics and Probability
8th Grade Algebra I Unit 5: Scatter Plots and Trend Lines (~ 4 weeks) Unit Overview: In Unit 5, students will use data and regression capabilities to find the best fit line.
Guiding Question: How do we make predictions and informed decisions based on current numerical information?
The student will be able to: The teacher will use appropriate instructional strategies/approaches based on the needs of the student.
8.SP.3 Use the equation of a linear model to solve
problems in the context of bivariate measurement data,
interpreting the slope and intercept. For example, in a
linear model for a biology experiment, interpret a slope of
1.5 cm/hr as meaning that an additional hour of sunlight
each day is associated with an additional 1.5 cm in
mature plant height.
Linear models can be represented with a linear equation. Students interpret the slope and y-intercept of the line in
the context of the problem.
8.SP.4 Understand that patterns of association can also be
seen in bivariate categorical data by displaying
frequencies and relative frequencies in a two-way table.
Construct and interpret a two-way table summarizing data
on two categorical variables collected from the same
subjects. Use relative frequencies calculated for rows or
Students understand that a two-way table provides a way to organize data between two categorical variables. Data
for both categories needs to be collected from each subject. Students calculate the relative frequencies to describe
associations.
Component Cluster 8.SP Investigate patterns of association in bivariate data.
8.SP.1 Construct and interpret scatter plots for bivariate
measurement data to investigate patterns of association
between two quantities. Describe patterns such as
clustering, outliers, positive or negative association,
linear association, and nonlinear association.
Bivariate data refers to two-variable data, one to be graphed on the x-axis and the other on the y-axis.
Students represent numerical data on a scatter plot, to examine relationships between variables. They analyze
scatter plots to determine if the relationship is linear (positive, negative association or no association) or nonlinear.
Students can use tools such as those at the National Center for Educational Statistics to create a graph or generate
data sets. (http://nces.ed.gov/nceskids/createagraph/default.aspx)
Data can be expressed in years. In these situations it is helpful for the years to be “converted” to 0, 1, 2, etc. For
example, the years of 1960, 1970, and 1980 could be represented as 0 (for 1960), 10 (for 1970) and 20 (for 1980).
Students recognize that points may be away from the other points (outliers) and have an effect on the linear model.
NOTE: Use of the formula to identify outliers is not expected at this level.
Students recognize that not all data will have a linear association. Some associations will be non-linear as in the
example below:
8.SP.2 Know that straight lines are widely used to model
relationships between two quantitative variables. For
scatter plots that suggest a linear association, informally
fit a straight line, and informally assess the model fit by
judging the closeness of the data points to the line.
Students understand that a straight line can represent a scatter plot with linear association. The most appropriate
linear model is the line that comes closest to most data points. The use of linear regression is not expected. If there
is a linear relationship, students draw a linear model. Given a linear model, students write an equation.

Mathematics
RP = Ratios and Proportional Reasoning NS= The Number System EE= Expressions and Equations G= Geometry SP= Statistics and Probability
NQ = Number and Quantity A = Algebra F = Functions M = Modeling G= Geometry S= Statistics and Probability
columns to describe possible association between the two
variables. For example, collect data from students in your
class on whether or not they have a curfew on school
nights and whether or not they have assigned chores at
home. Is there evidence that those who have a curfew also
tend to have chores?
Component Cluster 9-12.S.ID Summarize, represent, and interpret data on a single count or measurement variable
9-12.S.ID 2 Use statistics appropriate to the shape of the
data distribution to compare center (median, mean) and
spread (interquartile range, standard deviation) of two or
more different data sets.
Graphing calculator statistical features are used. Analysis of how to mathematically determine outliers is
introduced.
9-12.S.ID 3 Interpret differences in shape, center, and
spread in the context of the data sets, accounting for
possible effects of extreme data points (outliers).
Component Cluster 9-12.S.ID Summarize, represent, and interpret data on two categorical and quantitative variables 9-12.S.ID 6 Represent data on two quantitative variables
on a scatter plot, and describe how the variables are
related.
a. Fit a function to the data; use functions fitted
to data to solve problems in the context of the
data.
c. Fit a linear function for a scatter plot that
suggests a linear association.
Best fit lines are done by hand and using technology.
Component Cluster 9-12.S.ID Interpret linear models
9-12.S.ID.7 Interpret the slope (rate of change) and the
intercept (constant term) of a linear model in the context
of the data.
Students may use spreadsheets or graphing calculators to create representations of data sets and create linear
models.

Mathematics
RP = Ratios and Proportional Reasoning NS= The Number System EE= Expressions and Equations G= Geometry SP= Statistics and Probability
NQ = Number and Quantity A = Algebra F = Functions M = Modeling G= Geometry S= Statistics and Probability
8th Grade Algebra I Unit 6: Systems of Linear Equations (~ 3 weeks) Unit Overview: In Unit 6, students will represent, compare and analyze two linear equations, look for common solutions and use this information to
make choices between competing situations in real world contexts.
Guiding Question: What does the number of solutions (none, one or infinite) of a system of linear equations represent? What are the advantages and disadvantages of solving a
system of linear equations graphically versus algebraically?
The student will be able to: The teacher will use appropriate instructional strategies/approaches based on the needs of the student.
Component Cluster 9-12.A.CED Create equations that describe numbers or relationships
9-12.A.CED.3 Represent constraints by equations or
inequalities, and by systems of equations and/or
inequalities, and interpret solutions as viable or nonviable
options in a modeling context.
Development of equations from context is one of the key focuses of this problem solving related unit.
Component Cluster 8.EE Analyze and solve linear equations and pairs of simultaneous linear equations.
8.EE.8. Analyze and solve pairs of simultaneous linear
equations.
a. Understand that solutions to a system of two linear
equations in two variables correspond to points of
intersection of their graphs, because points of
intersection satisfy both equations simultaneously.
b. Solve systems of two linear equations in two
variables algebraically, and estimate solutions by
graphing the equations. Solve simple cases by
inspection. For example, 3x + 2y = 5 and 3x + 2y
= 6 have no solution because 3x + 2y cannot
simultaneously be 5 and 6.
c. Solve real-world and mathematical problems
leading to two linear equations in two variables.
For example, given coordinates for two pairs of
points, determine whether the line through the first
pair of points intersects the line through the
second pair.
Systems of linear equations can also have one solution, infinitely many solutions or no solutions. Students will
discover these cases as they graph systems of linear equations and solve them algebraically.
Students graph a system of two linear equations, recognizing that the ordered pair for the point of intersection is the
x-value that will generate the given y-value for both equations. Students recognize that graphed lines with one point
of intersection (different slopes) will have one solution, parallel lines (same slope, different y-intercepts) have no
solutions, and lines that are the same (same slope, same y-intercept) will have infinitely many solutions.
By making connections between algebraic and graphical solutions and the context of the system of linear equations,
students are able to make sense of their solutions. Students need opportunities to work with equations and context
that include whole number and/or decimals/fractions. Students define variables and create a system of linear
equations in two variables.
Note: Students are not expected to change linear equations written in standard form to slope-intercept form or solve
systems using elimination.
For many real world contexts, equations may be written in standard form. Students are not expected to change the
standard form to slope-intercept form. However, students may generate ordered pairs recognizing that the values of
the ordered pairs would be solutions for the equation.
Component Cluster 9-12.A.REI Solve systems of equations 9-12.A.REI.5 Prove that, given a system of two
equations in two variables, replacing one equation by the
sum of that equation and a multiple of the other produces
a system with the same solutions.
This standard helps develop the method of elimination.
9-12.A.REI.6 Solve systems of linear equations exactly
and approximately (e.g., with graphs), focusing on pairs
of linear equations in two variables.
Graphical solutions are limited in larger scale or in decimal solutions. This leads to need for additional solution
methods.
Component Cluster 9-12.REI Represent and solve equations and inequalities graphically

Mathematics
RP = Ratios and Proportional Reasoning NS= The Number System EE= Expressions and Equations G= Geometry SP= Statistics and Probability
NQ = Number and Quantity A = Algebra F = Functions M = Modeling G= Geometry S= Statistics and Probability
9-12.A.REI.11 Explain why the x-coordinates of the
points where the graphs of the equations y= f(x) and y
=g(x) intersect are the solutions of the equation f(x) =
g(x); find the solutions approximately, e.g., using
technology to graph the functions, make tables of values,
or find successive approximations. Include cases where
f(x) and/or g(x) are linear functions.*
Graphing technology can help produce graphical and table solutions, or at least approximations of those solutions.

Mathematics
RP = Ratios and Proportional Reasoning NS= The Number System EE= Expressions and Equations G= Geometry SP= Statistics and Probability
NQ = Number and Quantity A = Algebra F = Functions M = Modeling G= Geometry S= Statistics and Probability
8th Grade Algebra I Unit 7: Introduction to Exponential Functions (~ 4 weeks) Unit Overview: In Unit 7, students will explore relationships that grow exponentially.
Guiding Question: How can exponential functions be used to model real world situations?
The student will be able to: The teacher will use appropriate instructional strategies/approaches based on the needs of the student.
Component Cluster 8.EE Work with radicals and integer exponents.
8.EE.2 Use square root and cube root symbols to
represent solutions to equations of the form x² = p and x³
= p, where p is a positive rational number. Evaluate
square roots of small perfect squares and cube roots of
small perfect cubes. Know that √2 is irrational.
Students recognize perfect squares and cubes, understanding that non-perfect squares and non-perfect cubes are
irrational.
Students recognize that squaring a number and taking the square root √ of a number are inverse operations;
likewise, cubing a number and taking the cube root √3
are inverse operations.
Rational numbers would have perfect squares or perfect cubes for the numerator and denominator. In the standard,
the value of p for square root and cube root equations must be positive.
Students understand that in geometry the square root of the area is the length of the side of a square and a cube root
of the volume is the length of the side of a cube. Students use this information to solve problems, such as finding
the perimeter.
Component Cluster 9-12.N.RN Extend the properties of exponents to rational numbers
9-12.N.RN.1 Explain how the definition of the meaning
of rational exponents follows from extending the
properties of integer exponents to those values, allowing
for a notation of radicals in terms of rational exponents.
Properties of exponents are developed in earlier grades and extended to rational exponents in this unit.
9-12.N.RN.2 Rewrite expression involving radicals and
rational exponents using the properties of exponents. 3 23
2
bb
Component Cluster 9-12.A.SSE Interpret the structure of expressions
9-12.A.SSE.1b Interpret complicated expressions by
viewing one or more of their parts as a single entity.
Focus on base, exponent, root, etc.
Component Cluster 9-12.A.SSE Write expressions in equivalent forms to solve problems
9-12.A.SSE.3c Complete the square in a quadratic
expression to reveal the maximum or minimum value of
the function it defines.
Process of completing the square to solve is used in the next unit.
Component Cluster 9-12.F.IF Analyze functions using different representations
9-12.F.IF.7e Graph exponential functions, showing
intercepts and end behavior.
Graph by hand and using technology.
9-12.F.IF.8b Use the properties of exponents to interpret
expressions for exponential functions.
Component Cluster 9-12.F.BF Build a function that models a relationship between two quantities

Mathematics
RP = Ratios and Proportional Reasoning NS= The Number System EE= Expressions and Equations G= Geometry SP= Statistics and Probability
NQ = Number and Quantity A = Algebra F = Functions M = Modeling G= Geometry S= Statistics and Probability
9-12.F.BF.2 Write arithmetic and geometric sequences
both recursively and with an explicit formula, use them to
model situations, and translate between the two forms.
Connections back to the first unit on patterns make the concept clearer to students.
Component Cluster 9-12.F.LE Construct and compare linear, quadratic, and exponential models and solve problems
9-12.F.LE.1 Distinguish between situations that can be
modeled with linear functions and with exponential
functions.
a. Prove that linear functions grow by equal
differences over equal intervals, and that
exponential functions grow by equal factors over
equal intervals.
b. Recognize situations in which one quantity
changes at a constant rate per unit interval
relative to another.
c. Recognize situations in which a quantity grows
or decays by a constant percent rate per unit
interval relative to another.
Linear functions are compared and contrasted against exponential functions.
9-12.F.LE.3 Observe using graphs and tables that a
quantity increasing exponentially eventually exceeds a
quantity increasing linearly, quadratically, or (more
generally) as a polynomial function.
This may require extending the domain past any local linearity.
Component Cluster 9-12.F.LE Interpret expressions for functions in terms of the situation they model
9-12.F.LE.5 Interpret the parameters in a linear or
exponential function in terms of context.
Identify beginning, change and type of change.
Component Cluster 9-12.N.RN Extend the properties of exponents to rational numbers
9-12.N.RN.1 Explain how the definition of the meaning
of rational exponents follows from extending the
properties of integer exponents to those values, allowing
for a notation of radicals in terms of rational exponents.
9-12.N.RN.2 Rewrite expression involving radicals and
rational exponents using the properties of exponents.
Component Cluster 9-12.A.SSE Interpret the structure of expressions
9-12.A.SSE.1b Interpret complicated expressions by
viewing one or more of their parts as a single entity.
Component Cluster 9-12.A.SSE Write expressions in equivalent forms to solve problems
9-12.A.SSE.3c Complete the square in a quadratic
expression to reveal the maximum or minimum value of
the function it defines.
Component Cluster 9-12.F.IF Analyze functions using different representations
9-12.F.IF.7e Graph exponential and logarithmic
functions, showing intercepts and end behavior.

Mathematics
RP = Ratios and Proportional Reasoning NS= The Number System EE= Expressions and Equations G= Geometry SP= Statistics and Probability
NQ = Number and Quantity A = Algebra F = Functions M = Modeling G= Geometry S= Statistics and Probability
9-12.F.IF.8b Use the properties of exponents to interpret
expressions for exponential functions.
Component Cluster 9-12.F.BF Build a function that models a relationship between two quantities
9-12.F.BF.2 Write arithmetic and geometric sequences
both recursively and with an explicit formula, use them to
model situations, and translate between the two forms.
Component Cluster 9-12.F.LE Construct and compare linear, quadratic, and exponential models and solve problems
9-12.F.LE.1 Distinguish between situations that can be
modeled with linear functions and with exponential
functions.
d. Prove that linear functions grow by equal
differences over equal intervals, and that
exponential functions grow by equal factors over
equal intervals.
e. Recognize situations in which one quantity
changes at a constant rate per unit interval
relative to another.
f. Recognize situations in which a quantity grows
or decays by a constant percent rate per unit
interval relative to another.
9-12.F.LE.3 Observe using graphs and tables that a
quantity increasing exponentially eventually exceeds a
quantity increasing linearly, quadratically, or (more
generally) as a polynomial function.
Component Cluster 9-12.F.LE Interpret expressions for functions in terms of the situation they model
9-12.F.LE.5 Interpret the parameters in a linear or
exponential function in terms of context.

Mathematics
RP = Ratios and Proportional Reasoning NS= The Number System EE= Expressions and Equations G= Geometry SP= Statistics and Probability
NQ = Number and Quantity A = Algebra F = Functions M = Modeling G= Geometry S= Statistics and Probability
8th Grade Algebra I Unit 8: Quadratic Functions and Equations (~ 5 weeks) Unit Overview: In Unit 8, students will model situations with quadratic functions. They will find and interpret intercepts, maxima and minima, and
determine symmetries. Students will solve quadratic equations by factoring, completing the square and the quadratic equation.
Guiding Question: What can the zeros, intercepts, vertex, maximum, minimum and other features of a quadratic function tell you about real world relationships?
The student will be able to: The teacher will use appropriate instructional strategies/approaches based on the needs of the student.
Component Cluster 8.EE Work with radicals and integer exponents.
8.EE.2 Use square root and cube root symbols to
represent solutions to equations of the form x² = p and x³
= p, where p is a positive rational number. Evaluate
square roots of small perfect squares and cube roots of
small perfect cubes. Know that √2 is irrational.
Students recognize perfect squares and cubes, understanding that non-perfect squares and non-perfect cubes are
irrational.
Students recognize that squaring a number and taking the square root √ of a number are inverse operations;
likewise, cubing a number and taking the cube root √3
are inverse operations.
Rational numbers would have perfect squares or perfect cubes for the numerator and denominator. In the standard,
the value of p for square root and cube root equations must be positive.
Students understand that in geometry the square root of the area is the length of the side of a square and a cube root
of the volume is the length of the side of a cube. Students use this information to solve problems, such as finding
the perimeter.
Component Cluster 9-12.A.SSE Write expression in equivalent forms to solve problems
9-12.A.SSE 3 Choose and produce an equivalent form of
an expression to reveal and explain properties of the
quantity represented by the expression.
a. Factor a quadratic expression to reveal the zeros
of the function it defines.
b. Complete the square in a quadratic expression to
reveal the maximum or minimum value of the
function it defines.
Rewriting quadratic functions can help solve them in different ways.
Component Cluster 9-12.A.REI Solve equations and inequalities in one variable
9-12.A.REI.4 Solve quadratic functions in one variable.
a. Use the method of completing the square to
transform any quadratic equation in x into an
equation of the form (𝑥 − 𝑝)2 that has the same
solutions. Derive the quadratic formula from this
form. Solve quadratic equations by inspection (e.g.,
for 𝑥2 = 49), taking square roots, completing the
square, the quadratic formula and factoring, as
appropriate to the initial form of the equation.
All methods of solving are used and analyzed for when one is more appropriate than another.
Component Cluster 9-12.A.APR Perform arithmetic operations on polynomials
9-12.A.APR.1 Understand that polynomials form a
system analogous to the integers, namely, they are closed
under the operations of addition, subtraction, and
multiplication; add, subtract, and multiply polynomials.
Polynomial operations are seen as an extension of the arithmetic operations on number systems.
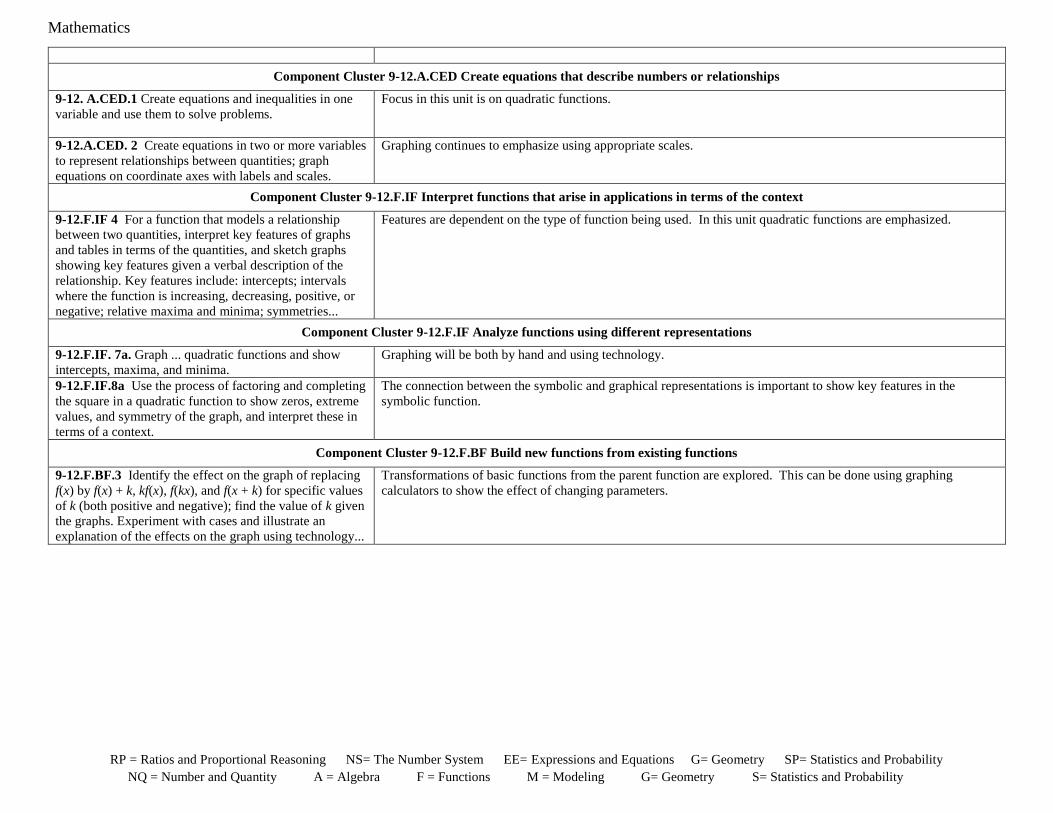
Mathematics
RP = Ratios and Proportional Reasoning NS= The Number System EE= Expressions and Equations G= Geometry SP= Statistics and Probability
NQ = Number and Quantity A = Algebra F = Functions M = Modeling G= Geometry S= Statistics and Probability
Component Cluster 9-12.A.CED Create equations that describe numbers or relationships
9-12. A.CED.1 Create equations and inequalities in one
variable and use them to solve problems.
Focus in this unit is on quadratic functions.
9-12.A.CED. 2 Create equations in two or more variables
to represent relationships between quantities; graph
equations on coordinate axes with labels and scales.
Graphing continues to emphasize using appropriate scales.
Component Cluster 9-12.F.IF Interpret functions that arise in applications in terms of the context
9-12.F.IF 4 For a function that models a relationship
between two quantities, interpret key features of graphs
and tables in terms of the quantities, and sketch graphs
showing key features given a verbal description of the
relationship. Key features include: intercepts; intervals
where the function is increasing, decreasing, positive, or
negative; relative maxima and minima; symmetries...
Features are dependent on the type of function being used. In this unit quadratic functions are emphasized.
Component Cluster 9-12.F.IF Analyze functions using different representations
9-12.F.IF. 7a. Graph ... quadratic functions and show
intercepts, maxima, and minima.
Graphing will be both by hand and using technology.
9-12.F.IF.8a Use the process of factoring and completing
the square in a quadratic function to show zeros, extreme
values, and symmetry of the graph, and interpret these in
terms of a context.
The connection between the symbolic and graphical representations is important to show key features in the
symbolic function.
Component Cluster 9-12.F.BF Build new functions from existing functions
9-12.F.BF.3 Identify the effect on the graph of replacing
f(x) by f(x) + k, kf(x), f(kx), and f(x + k) for specific values
of k (both positive and negative); find the value of k given
the graphs. Experiment with cases and illustrate an
explanation of the effects on the graph using technology...
Transformations of basic functions from the parent function are explored. This can be done using graphing
calculators to show the effect of changing parameters.

Mathematics
NQ = Number and Quantity A = Algebra F = Functions M = Modeling G= Geometry S= Statistics and Probability
Algebra 1 The fundamental purpose of this course is to formalize and extend the mathematics that students learned in the middle grades. Because it is built on the middle grades standards, this
is a more ambitious version of Algebra I than has generally been offered. The critical areas, called units, deepen and extend understanding of linear and exponential relationships by
contrasting them with each other and by applying linear models to data that exhibit a linear trend, and students engage in methods for analyzing, solving, and using quadratic
functions. The Mathematical Practice Standards apply throughout each course and, together with the content standards, prescribe that students experience mathematics as a coherent,
useful, and logical subject that makes use of their ability to make sense of problem situations.
By the end of eighth grade, students have learned to solve linear equations in one variable and have applied graphical and algebraic methods to analyze and solve systems of linear
equations in two variables. Now, students analyze and explain the process of solving an equation. Students develop fluency writing, interpreting, and translating between various
forms of linear equations and inequalities, and using them to solve problems. They master the solution of linear equations and apply related solution techniques and the laws of
exponents to the creation and solution of simple exponential equations.
In earlier grades, students define, evaluate, and compare functions, and use them to model relationships between quantities. Now students will learn function notation and develop
the concepts of domain and range. They explore many examples of functions, including sequences; they interpret functions given graphically, numerically, symbolically, and verbally,
translate between representations, and understand the limitations of various representations. Students build on and informally extend their understanding of integer exponents to
consider exponential functions. They compare and contrast linear and exponential functions, distinguishing between additive and multiplicative change. Students explore systems of
equations and inequalities, and they find and interpret their solutions. They interpret arithmetic sequences as linear functions and geometric sequences as exponential functions.
Building upon prior students’ prior experiences with data, students are now provided with more formal means of assessing how a model fits data. Students use regression techniques
to describe approximately linear relationships between quantities. They use graphical representations and knowledge of the context to make judgments about the appropriateness of
linear models. With linear models, they look at residuals to analyze the goodness of fit.
Students apply this new understanding of number and rules of exponents to strengthen their ability to see structure in and create quadratic and exponential expressions. They create
and solve equations, inequalities, and systems of equations involving quadratic expressions.
Students will also consider quadratic functions, comparing the key characteristics of quadratic functions to those of linear and exponential functions. They select from among these
functions to model phenomena. Students learn to anticipate the graph of a quadratic function by interpreting various forms of quadratic expressions. In particular, they identify the
real solutions of a quadratic equation as the zeros of a related quadratic function. Students expand their experience with functions to include more specialized functions—absolute
value, step, and those that are piecewise-defined.
Mathematical Practices
1. Make sense of problems and persevere in solving them.
2. Reason abstractly and quantitatively.
3. Construct viable arguments and critique the reasoning of others.
4. Model with mathematics.
5. Use appropriate tools strategically.
6. Attend to precision.
7. Look for and make use of structure.
8. Look for and express regularity in repeated reasoning.

Mathematics
NQ = Number and Quantity A = Algebra F = Functions M = Modeling G= Geometry S= Statistics and Probability
Algebra 1: Suggested Distribution of Units in Instructional Weeks Time # of Weeks
Unit 1: Patterns 11% ̴ 4 weeks
Unit 2: Linear Equations and Inequalities 14% ̴ 5 weeks
Unit 3: Functions 8% ̴ 3 weeks
Unit 4: Linear Functions 17% ̴ 6 weeks
Unit 5: Scatter Plots and Trend Lines 11% ̴ 4 weeks
Unit 6: Systems of Equations 8% ̴ 3 weeks
Unit 7: Introduction to Exponential Functions 11% ̴ 4 weeks
Unit 8: Quadratic Functions and Equations 15% ̴ 5 weeks
Performance Task ̴ 2 weeks
Unit 1: Patterns11%
Unit 2: Linear Equations and
Inequalities 14%
Unit 3: Functions
8%
Unit 4: Linear Functions
17%
Unit 5: Scatter Plots and Trend
Lines11%
Unit 6: Systems of Equations
8%
Unit 7: Introduction to Exponoential
Functions11%
Unit 8: Quadratic
Functions and Equations
15%
Instructional Time

Mathematics
NQ = Number and Quantity A = Algebra F = Functions M = Modeling G= Geometry S= Statistics and Probability
Algebra 1 Unit 1: Patterns (~ 4 weeks) Unit Overview: In Unit 1, students will have an opportunity to investigate patterns including arithmetic and geometric sequences for the purpose of
writing equations of various types.
Guiding Question: How can patterns describe real world phenomena?
The student will be able to: The teacher will use appropriate instructional strategies/approaches based on the needs of the student.
Component Cluster 9-12.F.IF Understand the concept of a function and use function notation
9-12.F.IF.3 Recognize that sequences are functions,
sometimes defined recursively, whose domain is a subset
of the integers.
Patterns are developed using tables which are then used to develop the equations.
Component Cluster 9-12.F.BF Build a function that models a relationship between two quantities 9-12.F.BF.1 Write a function that describes a relationship
between two quantities.
b. Determine an explicit expression, a recursive
process, or steps for calculation from a context.
Multiple activities build this standard using experiments and other real life situations.
9-12.F.BF.2 Write arithmetic and geometric sequences
both recursively and with an explicit formula, use them to
model situations, and translate between the two forms.
Have students think about the starting point and how to get to the next level as they begin to develop their function
equations.

Mathematics
NQ = Number and Quantity A = Algebra F = Functions M = Modeling G= Geometry S= Statistics and Probability
Algebra 1 Unit 2: Linear Equations and Inequalities (~ 5 weeks) Unit Overview: In Unit 2, students will write, simplify, evaluate and model situations with linear expressions.
Guiding Question: How can we use linear equations and inequalities to solve real world problems?
The student will be able to: The teacher will use appropriate instructional strategies/approaches based on the needs of the student.
Component Cluster 9-12.A.SSE Interpret the structure of expressions
9-12.A.SSE.1 Interpret expressions that represent a
quantity in terms of its context.
c. Interpret parts of an expression, such as terms,
factors, and coefficients
d. Interpret complicated expressions by viewing
one or more of their parts as a single entity.
For example, the Fibonacci sequence is defined recursively by f(0) = f(1) = 1, f(n+1) = f(n) + f(n-1) for n > 1.
Continue to focus on the terms in the context: what is the starting point and what is the change? Repeated addition
or repeated multiplication?
Component Cluster 9-12.A.SSE Write expressions in equivalent forms to solve problems
9-12.A.SSE.3 Choose and produce an equivalent form of
an expression to reveal and explain properties of quantity
represented by the expression.
Simplifying the initial equations can make them easier to understand.
Component Cluster 9-12.A.CED Create equations that describe numbers or relationships
9-12.A.CED.1 Create equations and inequalities in one
variable and use them to solve problems.
Once the equation is developed it can be used to predict what will happen in a much larger situation or one where
the data was not given.
9-12.A.CED.4 Rearrange formulas to highlight a quantity
of interest, using the same reasoning as in solving
equations
Solving for y might allow it to be easier to graph given their graphing background in earlier grades.
Component Cluster 9-12.A.REI Understanding solving equations as a process of reasoning and explain the reasoning
9-12.A.REI.1 Explain each step in solving a simple
equation as following from the equality of numbers
asserted at the previous step, starting from the assumption
that the original equation has a solution. Construct a viable
argument to justify a solution method.
Use the addition property of equality, the multiplication property of equality, etc. and refer to them by name so
students become familiar with them.
Component Cluster 9-12.A.REI Solve equations and inequalities in one variable
9-12.A.REI.3 Solve linear equations and inequalities in
one variable, including equations with coefficients
represented by letters.
Continue to reinforce solving skills developed in earlier grades. Solving of literal equations is an extension of solving
regular equations.
Component Cluster 9-12.N-Q.1 Reason quantitatively and use units to solve problems
9-12.N-Q.1 Use units as a way to understand problems and
to guide the solution of multi-step problems; choose and
interpret units consistently in formulas.
Have students use units as a way of connecting back to the concrete of the real world context.
9-12.N-Q.2 Define appropriate quantities for the purpose
of descriptive modeling.
Students should be able to determine what variable is being represented.
9-12.N-Q.3 Choose a level of accuracy appropriate to
limitations on measurements when reporting quantities.
It helps to keep the context in mind when determining values. For example, does it make sense to have a negative
number of people? Or does zero of something make sense in number of steps?

Mathematics
NQ = Number and Quantity A = Algebra F = Functions M = Modeling G= Geometry S= Statistics and Probability
Algebra 1 Unit 3: Functions (~ 3 weeks) Unit Overview: In Unit 3, students will develop a definition for relations and, subsequently, functions and determine if relations are functions.
Multiple representations are used (tables, mappings, graphs, ordered pairs, verbal descriptions and equations).
Guiding Question: What is a function and how can it be represented?
The student will be able to: The teacher will use appropriate instructional strategies/approaches based on the needs of the student.
Component Cluster 9-12.A.CED Create equations that describe numbers or relationships
9-12.A.CED.2 Create equations in two or more variables
to represent relationships between quantities; graph
equations on coordinate axes with labels and scales.
The standard is an extension of those developed in earlier grades. Students should be reaching this standard more
consistently.
Component Cluster 9-12.A.REI Represent and solve equations and inequalities graphically 9-12.A.REI.10 Understand that the graph of an equation
in two variables is the set of all its solutions plotted in the
coordinate plane, often forming a curve (which could be a
line).
Context may also dictate that graphs are connected or not connected. For example, number of people cannot be
partial so the graph would consist of points. Explain how one might want to connect the points anyway to see a
“model” that could predict future trends.
Component Cluster 9-12.F.IF Understand the concept of a function and use function notation
9-12.F.IF.1 Understand that a function from one set
(called the domain) to another set (called the range)
assigns to each element of the domain exactly one
element of the range. If f is a function and x is an element
of its domain, then f(x) denotes the output of f
corresponding to the input x. The graph of f is the graph
of the equation y=f(x).
The definition of a function is key to future mathematics. This concept will continue to thread through all course
work.
9-12.F.IF.2 Use function notation, evaluate functions for
inputs in their domains, and interpret statements that use
function notation in terms of context.
F(x) notation is used and must be distinguished between f x, a common misconception. The use of words written
out “f of x” can help this misunderstanding. Also, while f is often the function name, other letters are used
depending on the context.
Component Cluster 9-12.F.IF Interpret functions that arise in applications in terms of the context
9-12.F.IF.4 For a function that models a relationship
between two quantities, interpret key features of graphs
and tables in terms of the quantities and sketch graphs
showing key features given a verbal description of the
relationship.
Connecting to the context is important.
9-12.F.IF.5 Relate the domain of a function to its graph,
and where applicable, to the quantitative relationship it
describes.
Positive domains produce graphs that are in the first quadrant for most of the examples here.
Component Cluster 9-12.F.IF Analyze functions using different representations

Mathematics
NQ = Number and Quantity A = Algebra F = Functions M = Modeling G= Geometry S= Statistics and Probability
9-12.F.IF.7 Graph functions expressed symbolically and
show key features of the graph, by hand in simple cases
and using technology for more complicated cases.
b.Graph square root, cube root, and piece-wise
functions, including step functions and absolute
value functions.
Use of the graphing calculator and analysis to help determine an appropriate window needs to be stressed. By
hand, scale and labeling appropriately is important. (b) identifies functions that may be included in the parent
function discussion.
9-12.F.IF.9 Compare properties of two functions each
represented in a different way (algebraically, graphically,
numerically in tables, or by verbal description).
Comparison helps identify key similarities and differences between two different functions or between two
functions of the same family.

Mathematics
NQ = Number and Quantity A = Algebra F = Functions M = Modeling G= Geometry S= Statistics and Probability
Algebra 1 Unit 4: Linear Functions (~ 6 weeks) Unit Overview: In Unit 4, students thoroughly explore linear functions, deriving linear models to describe behavior, talking about rates of change,
recognizing linear relationships from tables and graphs, followed by the development of equations of lines using slope intercept and point slope form.
Guiding Question: How may linear functions help us analyze real world situations and solve practical problems?
The student will be able to: The teacher will use appropriate instructional strategies/approaches based on the needs of the student.
Component Cluster 9-12.F.IF Interpret functions that arise in applications in terms of the context
9-12.F.IF.6 Calculate and interpret the average rate of
change of a function (presented symbolically or as a table)
over a specified interval. Estimate the rate of change
from a graph.
In linear functions this average rate of change is going to connect to the slope of the function and the graph.
Component Cluster 9-12.F.IF Analyze functions using different representations 9-12.F.IF.7 Graph functions expressed symbolically and
show key features of the graph, by hand in simple cases
and using technology for more complicated cases.
b. Graph linear functions and show intercepts.
Linear functions only are emphasized in this unit.
9-12.F.IF.8 Write a function defined by an expression in
different by equivalent forms to reveal and explain
different properties of the function.
Manipulation between different forms of a linear function will be helpful in graphing different forms.
Component Cluster 9-12.F.LE Construct and compare linear, quadratic, and exponential models and solve problems
9-12.F.LE.1 Distinguish between situations that can be
modeled with linear functions and with exponential
functions.
c. Prove that linear functions grow by equal
differences over interval.
d. Recognize situations in which one quantity
changes at a constant rate per unit interval
relative to another.
This goes back to the first unit when linear and exponential functions were developed in the patterns. Linear
functions will have a common addition term while exponential functions will be repeated multiplications.
9-12.F.LE.2 Construct linear and exponential functions,
including arithmetic and geometric sequences, given a
graph, a description of a relationship, or two input-output
pairs (including reading these from a table).
Connections are made to the first unit pattern development and now identifying those functions as linear and
exponential.
Component Cluster 9-12.F.LE
9-12.F.LE.5 Interpret the parameters in a linear …
function in terms of context.
Context can help determine intercepts and slope as well as domain if there are any restrictions.

Mathematics
NQ = Number and Quantity A = Algebra F = Functions M = Modeling G= Geometry S= Statistics and Probability
Algebra 1 Unit 5: Scatter Plots and Trend Lines (~ 4 weeks) Unit Overview: In Unit 5, students will use data and regression capabilities to find the best fit line.
Guiding Question: How do we make predictions and informed decisions based on current numerical information?
The student will be able to: The teacher will use appropriate instructional strategies/approaches based on the needs of the student.
Component Cluster 9-12.S.ID Summarize, represent, and interpret data on a single count or measurement variable
9-12.S.ID 2 Use statistics appropriate to the shape of the
data distribution to compare center (median, mean) and
spread (interquartile range, standard deviation) of two or
more different data sets.
Graphing calculator statistical features are used. Analysis of how to mathematically determine outliers is
introduced.
9-12.S.ID 3 Interpret differences in shape, center, and
spread in the context of the data sets, accounting for
possible effects of extreme data points (outliers).
Component Cluster 9-12.S.ID Summarize, represent, and interpret data on two categorical and quantitative variables 9-12.S.ID 6 Represent data on two quantitative variables
on a scatter plot, and describe how the variables are
related.
a. Fit a function to the data; use functions fitted
to data to solve problems in the context of the
data.
c. Fit a linear function for a scatter plot that
suggests a linear association.
Best fit lines are done by hand and using technology.
Component Cluster 9-12.S.ID Interpret linear models
9-12.S.ID.7 Interpret the slope (rate of change) and the
intercept (constant term) of a linear model in the context
of the data.
Students may use spreadsheets or graphing calculators to create representations of data sets and create linear
models.
9-12.S.ID 8 Compute (using technology) and interpret
the correlation coefficient of a linear fit.
9-12.S.ID 9 Distinguish between correlation and
causation.

Mathematics
NQ = Number and Quantity A = Algebra F = Functions M = Modeling G= Geometry S= Statistics and Probability
Algebra 1 Unit 6: Systems of Linear Equations (~ 3 weeks) Unit Overview: In Unit 6, students will represent, compare and analyze two linear equations, look for common solutions and use this information to
make choices between competing situations in real world contexts.
Guiding Question: What does the number of solutions (none, one or infinite) of a system of linear equations represent? What are the advantages and disadvantages of solving a
system of linear equations graphically versus algebraically?
The student will be able to: The teacher will use appropriate instructional strategies/approaches based on the needs of the student.
Component Cluster 9-12.A.CED Create equations that describe numbers or relationships
9-12.A.CED.3 Represent constraints by equations or
inequalities, and by systems of equations and/or
inequalities, and interpret solutions as viable or nonviable
options in a modeling context.
Development of equations from context is one of the key focuses of this problem solving related unit.
Component Cluster 9-12.A.REI Solve systems of equations 9-12.A.REI.5 Prove that, given a system of two
equations in two variables, replacing one equation by the
sum of that equation and a multiple of the other produces
a system with the same solutions.
This standard helps develop the method of elimination.
9-12.A.REI.6 Solve systems of linear equations exactly
and approximately (e.g., with graphs), focusing on pairs
of linear equations in two variables.
Graphical solutions are limited in larger scale or in decimal solutions. This leads to need for additional solution
methods.
Component Cluster 9-12.REI Represent and solve equations and inequalities graphically
9-12.A.REI.11 Explain why the x-coordinates of the
points where the graphs of the equations y= f(x) and y
=g(x) intersect are the solutions of the equation f(x) =
g(x); find the solutions approximately, e.g., using
technology to graph the functions, make tables of values,
or find successive approximations. Include cases where
f(x) and/or g(x) are linear functions.*
Graphing technology can help produce graphical and table solutions, or at least approximations of those solutions.

Mathematics
NQ = Number and Quantity A = Algebra F = Functions M = Modeling G= Geometry S= Statistics and Probability
Algebra 1 Unit 7: Introduction to Exponential Functions (~ 4 weeks) Unit Overview: In Unit 7, students will explore relationships that grow exponentially.
Guiding Question: How can exponential functions be used to model real world situations?
The student will be able to: The teacher will use appropriate instructional strategies/approaches based on the needs of the student.
Component Cluster 9-12.N.RN Extend the properties of exponents to rational numbers
9-12.N.RN.1 Explain how the definition of the meaning
of rational exponents follows from extending the
properties of integer exponents to those values, allowing
for a notation of radicals in terms of rational exponents.
Properties of exponents are developed in earlier grades and extended to rational exponents in this unit.
9-12.N.RN.2 Rewrite expression involving radicals and
rational exponents using the properties of exponents. 3 23
2
bb
Component Cluster 9-12.A.SSE Interpret the structure of expressions
9-12.A.SSE.1b Interpret complicated expressions by
viewing one or more of their parts as a single entity.
Focus on base, exponent, root, etc.
Component Cluster 9-12.A.SSE Write expressions in equivalent forms to solve problems
9-12.A.SSE.3c Complete the square in a quadratic
expression to reveal the maximum or minimum value of
the function it defines.
Process of completing the square to solve is used in the next unit.
Component Cluster 9-12.F.IF Analyze functions using different representations
9-12.F.IF.7e Graph exponential functions, showing
intercepts and end behavior.
Graph by hand and using technology.
9-12.F.IF.8b Use the properties of exponents to interpret
expressions for exponential functions.
Component Cluster 9-12.F.BF Build a function that models a relationship between two quantities
9-12.F.BF.2 Write arithmetic and geometric sequences
both recursively and with an explicit formula, use them to
model situations, and translate between the two forms.
Connections back to the first unit on patterns make the concept clearer to students.
Component Cluster 9-12.F.LE Construct and compare linear, quadratic, and exponential models and solve problems
9-12.F.LE.1 Distinguish between situations that can be
modeled with linear functions and with exponential
functions.
g. Prove that linear functions grow by equal
differences over equal intervals, and that
exponential functions grow by equal factors over
equal intervals.
Linear functions are compared and contrasted against exponential functions.

Mathematics
NQ = Number and Quantity A = Algebra F = Functions M = Modeling G= Geometry S= Statistics and Probability
h. Recognize situations in which one quantity
changes at a constant rate per unit interval
relative to another.
i. Recognize situations in which a quantity grows
or decays by a constant percent rate per unit
interval relative to another.
9-12.F.LE.3 Observe using graphs and tables that a
quantity increasing exponentially eventually exceeds a
quantity increasing linearly, quadratically, or (more
generally) as a polynomial function.
This may require extending the domain past any local linearity.
Component Cluster 9-12.F.LE Interpret expressions for functions in terms of the situation they model
9-12.F.LE.5 Interpret the parameters in a linear or
exponential function in terms of context.
Identify beginning, change and type of change.

Mathematics
NQ = Number and Quantity A = Algebra F = Functions M = Modeling G= Geometry S= Statistics and Probability
Algebra 1 Unit 8: Quadratic Functions and Equations (~ 5 weeks) Unit Overview: In Unit 8, students will model situations with quadratic functions. They will find and interpret intercepts, maxima and minima, and
determine symmetries. Students will solve quadratic equations by factoring, completing the square and the quadratic equation.
Guiding Question: What can the zeros, intercepts, vertex, maximum, minimum and other features of a quadratic function tell you about real world relationships?
The student will be able to: The teacher will use appropriate instructional strategies/approaches based on the needs of the student.
Component Cluster 9-12.A.SSE Write expression in equivalent forms to solve problems
9-12.A.SSE 3 Choose and produce an equivalent form of
an expression to reveal and explain properties of the
quantity represented by the expression.
c. Factor a quadratic expression to reveal the zeros
of the function it defines.
d. Complete the square in a quadratic expression to
reveal the maximum or minimum value of the
function it defines.
Rewriting quadratic functions can help solve them in different ways.
Component Cluster 9-12.A.REI Solve equations and inequalities in one variable
9-12.A.REI.4 Solve quadratic functions in one variable.
b. Use the method of completing the square to
transform any quadratic equation in x into an
equation of the form (𝑥 − 𝑝)2 that has the same
solutions. Derive the quadratic formula from this
form. Solve quadratic equations by inspection (e.g.,
for 𝑥2 = 49), taking square roots, completing the
square, the quadratic formula and factoring, as
appropriate to the initial form of the equation.
All methods of solving are used and analyzed for when one is more appropriate than another.
Component Cluster 9-12.A.APR Perform arithmetic operations on polynomials
9-12.A.APR.1 Understand that polynomials form a
system analogous to the integers, namely, they are closed
under the operations of addition, subtraction, and
multiplication; add, subtract, and multiply polynomials.
Polynomial operations are seen as an extension of the arithmetic operations on number systems.
Component Cluster 9-12.A.CED Create equations that describe numbers or relationships
9-12. A.CED.1 Create equations and inequalities in one
variable and use them to solve problems.
Focus in this unit is on quadratic functions.
9-12.A.CED. 2 Create equations in two or more variables
to represent relationships between quantities; graph
equations on coordinate axes with labels and scales.
Graphing continues to emphasize using appropriate scales.
Component Cluster 9-12.F.IF Interpret functions that arise in applications in terms of the context

Mathematics
NQ = Number and Quantity A = Algebra F = Functions M = Modeling G= Geometry S= Statistics and Probability
9-12.F.IF 4 For a function that models a relationship
between two quantities, interpret key features of graphs
and tables in terms of the quantities, and sketch graphs
showing key features given a verbal description of the
relationship. Key features include: intercepts; intervals
where the function is increasing, decreasing, positive, or
negative; relative maxima and minima; symmetries...
Features are dependent on the type of function being used. In this unit quadratic functions are emphasized.
Component Cluster 9-12.F.IF Analyze functions using different representations
9-12.F.IF. 7a. Graph ... quadratic functions and show
intercepts, maxima, and minima.
Graphing will be both by hand and using technology.
9-12.F.IF.8a Use the process of factoring and completing
the square in a quadratic function to show zeros, extreme
values, and symmetry of the graph, and interpret these in
terms of a context.
The connection between the symbolic and graphical representations is important to show key features in the
symbolic function.
Component Cluster 9-12.F.BF Build new functions from existing functions
9-12.F.BF.3 Identify the effect on the graph of replacing
f(x) by f(x) + k, kf(x), f(kx), and f(x + k) for specific values
of k (both positive and negative); find the value of k given
the graphs. Experiment with cases and illustrate an
explanation of the effects on the graph using technology...
Transformations of basic functions from the parent function are explored. This can be done using graphing
calculators to show the effect of changing parameters.

Mathematics
NQ = Number and Quantity A = Algebra F = Functions M = Modeling G= Geometry S= Statistics and Probability
Geometry Geometry is devoted primarily to plane Euclidean geometry, studied both synthetically (without coordinates) and analytically (with coordinates).
During high school, students begin to formalize their geometry experiences from elementary and middle school, using more precise definitions and
developing careful proofs.
The concepts of congruence, similarity, and symmetry can be understood from the perspective of geometric transformation. Fundamental are the
rigid motions: translations, rotations, reflections, and combinations of these.
Three dimensional geometry is analyzed using two dimensional cross sections to inform new formulas for volume and surface area.
Circles are analyzed and properties developed, including an analytical approach to developing the equation for a circle.
Two geometric figures are defined to be congruent if there is a sequence of rigid motions that carries one onto the other. For triangles, congruence
means the equality of all corresponding pairs of sides and all corresponding pairs of angles. Once these triangle congruence criteria (ASA, SAS, and
SSS) are established using rigid motions, they can be used to prove theorems about triangles, quadrilaterals, and other geometric figures.
Similarity transformations (rigid motions followed by dilations) define similarity in the same way that rigid motions define congruence, thereby
formalizing the similarity ideas of "same shape" and "scale factor”. These transformations lead to the criterion for triangle similarity that two pairs of
corresponding angles are congruent. The definitions of sine, cosine, and tangent for acute angles are founded on right triangles and similarity, and,
with the Pythagorean Theorem, are fundamental in many real-world and theoretical situations.
Analytic geometry connects algebra and geometry, resulting in powerful methods of analysis and problem solving. Geometric shapes can be
described by equations, making algebraic manipulation into a tool for geometric understanding, modeling, and proof.
Dynamic geometry environments provide students with experimental and modeling tools that allow them to investigate geometric phenomena.
Probability is expanded upon, developing ways to describe the probability in independent or conditional events.
Mathematical Practices
1. Make sense of problems and persevere in solving them.
2. Reason abstractly and quantitatively.
3. Construct viable arguments and critique the reasoning of others.
4. Model with mathematics.
5. Use appropriate tools strategically.
6. Attend to precision.
7. Look for and make use of structure.
8. Look for and express regularity in repeated reasoning.

Mathematics
NQ = Number and Quantity A = Algebra F = Functions M = Modeling G= Geometry S= Statistics and Probability
Geometry: Suggested Distribution of Units in Instructional Weeks Time # of Weeks
Unit 1: Transformations and the Coordinate Plane 16% ~ 5 weeks
Unit 2: Congruence, Proof and Constructions 19% ~ 6 weeks
Unit 3: Three Dimensional Geometry 16% ~ 5 weeks
Unit 4: Similarity, Proof and Trigonometry 19% ~ 6 weeks
Unit 5: Circles and Other Conic Sections 16% ~ 5 weeks
Unit 6: Applications of Probability 13% ~ 4 weeks
Unit 1: Transformations
and the Coordinate
Plane11%
Unit 2: Congruence,
Proof and Constructions
14%
Unit 3: Three Dimensional
Geometry14%
Unit 4: Similarity, Proof
and Trigonometry
22%
Unit 5: Circles and Other Conic
Sections8%
Unit 6: Applications of
Probability11%
Instructional Time

Mathematics
NQ = Number and Quantity A = Algebra F = Functions M = Modeling G= Geometry S= Statistics and Probability
Geometry Unit 1: Transformations and the Coordinate Plane (~ 5 weeks) Unit Overview: In Unit 1, students will experiment with different transformations to build knowledge of geometric terms and set the foundation for
similarity and congruence development later.
Guiding Questions: How can transformations describe geometric events in the real world?
The student will be able to: The teacher will use appropriate instructional strategies/approaches based on the needs of the student.
Component Cluster 9-12.G.CO Experiment with transformations in the plane
9-12.G.CO.1 Know precise definitions of angle, circle,
perpendicular line, parallel line, and line segment, based on
the undefined notions of point, line, distance along a line, and
distance around a circular arc.
Build on student experience with rigid motion from earlier grades. Point out the basis of rigid motions in geometric
concepts, e.g., translations move points a specified distance along a line parallel to a specified line; rotations move
objects along a circular arc with a specified center through a specified angle.
Students may use geometry software and/or manipulatives to model transformations and demonstrate a sequence of
transformations that will carry a given figure onto another. 9-12.G.CO.2 Represent transformations in the plane using,
e.g., transparencies and geometry software; describe
transformations as functions that take points in the plane as
inputs and give other points as outputs. Compare
transformations that preserve distance and angle to those that
do not (e.g., translations versus horizontal stretch).
9-12.G.CO.3 Given a rectangle, parallelogram, trapezoid, or
regular polygon, describe the rotations and reflections that
carry it onto itself.
9-12.G.CO.4 Develop definitions of rotations, reflections,
and translations in terms of angles, circles, perpendicular
lines, parallel lines, and line segments.
9-12.G.CO.5 Given a geometric figure and a rotation,
reflection, or translation, draw the transformed figure using,
e.g., graph paper, tracing paper, or geometry software.
Specify a sequence of transformations that will carry a given
figure onto another.
Component Cluster 9-12.G.GPE Use coordinates to prove simple geometric theorems algebraically
9-12.G.GPE.4 Use coordinates to prove simple geometric
theorems algebraically. For example, prove or disprove that a
figure defined by four given points in the coordinate plane is
a rectangle; prove or disprove that the point (1, √3) lies on
the circle centered at the origin and containing the point (0,2).
Students may use geometric simulation software to model figures and prove simple geometric theorems.
Example: Use slope and distance formula to verify the polygon formed by connecting the points (-3,-2), (5,3), (9,9),
(1,4) is a parallelogram.
9-12.G.GPE.5 Prove the slope criteria for parallel and
perpendicular lines and use them to solve geometric problems
(e.g., find the equation of a line parallel or perpendicular to a
given line that passes through a given point).
Lines can be horizontal, vertical or neither.
Students may use a variety of different methods to construct a parallel or perpendicular line to a given line and
calculate the slopes to compare the relationships.
Relate work on parallel lines to work in Algebra 1 involving systems of equations having no solutions or infinitely
many solutions.

Mathematics
NQ = Number and Quantity A = Algebra F = Functions M = Modeling G= Geometry S= Statistics and Probability
9-12.G.GPE.6 Find the point on a directed line segment
between two given points that partitions the segment in a
given ratio.
Students may use geometric simulation software to model figures or line segments.
Example: given A(3,2) and B(6,11)
- Find the point that divides the line segment AB two thirds of the way from A to B. The point two-thirds of
the way from A to B has x-coordinate two-thirds of the way from 3 to 6 and y coordinate two-thirds of the
way from 2 to 11. So, (5,8) is the point that is two-thirds from point A to point B.
- Find the midpoint of line segment AB.
9-12.G.GPE.7 Use coordinates to compute perimeters of
polygons and areas of triangles and rectangles, e.g., using the
distance formula.
Practice with the distance formula and its connection with the Pythagorean theorem.
Students may use geometric simulation software to model figures.

Mathematics
NQ = Number and Quantity A = Algebra F = Functions M = Modeling G= Geometry S= Statistics and Probability
Geometry Unit 2: Congruence, Proof and Constructions (~ 6 weeks) Unit Overview: In Unit 2, students will use transformations to establish congruence related to parallel lines, theorems about triangles, and between
two triangles (SSS, ASA, SAS, AAS).
Guiding Question: How can transformations describe congruence?
The student will be able to: The teacher will use appropriate instructional strategies/approaches based on the needs of the student.
Component Cluster 9-12.G.CO Understanding congruence in terms of rigid motion
9-12.G.CO.6 Use geometric descriptions of rigid motions to
transform figures and to predict the effect of a given rigid
motion on a given figure; given two figures, use the definition
of congruence in terms of rigid motions to decide if they are
congruent.
Rigid motions are at the foundation of the definition of congruence. Students reason from the basic properties of
rigid motions (that they preserve distance and angle), which are assumed without proof. Rigid motions and their
assumed properties can be used to establish the usual triangle congruence criteria, which can then be used to prove
other theorems.
9-12.G.CO.7 Use the definition of congruence in terms of
rigid motions to show that two triangles are congruent if and
only if corresponding pairs of sides and corresponding pairs
of angles are congruent.
9-12.G.CO.8 Explain how the criteria for triangle congruence
(ASA, SAS, and SSS) follow from the definitions of
congruence in terms of rigid motion.
Component Cluster 9-12.G.CO Prove geometric theorems
9-12.G.CO.9 Prove theorems about lines and angles.
Theorems include: vertical angles are congruent; when a
transversal crosses parallel lines, alternate interior angles are
congruent and corresponding angles are congruent; points on
a perpendicular bisector of a line segment are equidistant
from the segment’s endpoints.
Encourage multiple ways of writing proofs, such as in narrative paragraphs, using flow diagrams, in two-column
format, and using diagrams without words. Students should be encouraged to focus on the validity of the underlying
reasoning while exploring a variety of formats for expressing that reasoning.
9-12.G.CO.10 Prove theorems about triangles. Theorems
include: measures of interior angles of a triangle sum to
180°; base angles of isosceles triangles are congruent; the
segment joining midpoints of two sides of a triangle is
parallel to the third side and half the length; the medians of a
triangle meet at a point.
9-12.G.CO.11 Prove theorems about parallelograms.
Theorems include: opposite sides are congruent, opposite
angles are congruent, the diagonals of a parallelogram bisect
each other, and conversely, rectangles are parallelograms with
congruent diagonals.
Component Cluster 9-12.G.CO Make geometric constructions
9-12.G.CO.12 Make formal geometric constructions with a
variety of tools and methods (compass and straightedge,
string, reflective devices, paper folding, dynamic geometric
software, etc.). Copying a segment; copying an angle;
Build on prior student experience with simple constructions. Emphasize the ability to formalize and explain how
these constructions result in the desired objects.
Students may use geometric software to make geometric constructions.
Mathematics
NQ = Number and Quantity A = Algebra F = Functions M = Modeling G= Geometry S= Statistics and Probability
bisecting a segment; bisecting an angle; constructing
perpendicular lines, including the perpendicular bisector of a
line segment; and constructing a line parallel to a given line
through a point not on the line.

Mathematics
NQ = Number and Quantity A = Algebra F = Functions M = Modeling G= Geometry S= Statistics and Probability
Geometry Unit 3: Three Dimensional Geometry (~ 5 weeks) Unit Overview: In Unit 3, students will build on prior knowledge of two dimensional shapes and apply volumes to real world problems.
Guiding Question: How can properties of two dimensional figures inform our understanding of three dimensional figures?
The student will be able to: The teacher will use appropriate instructional strategies/approaches based on the needs of the student.
Component Cluster 9-12.G.GMD Explain volume formulas and use them to solve problems.
9-12.G.GMD.1 Given an informal argument for the formulas
for the circumference of a circle, area of a circle, volume of a
cylinder, pyramid and cone.
Cavalieri’s principle is if two solids have the same height and the same cross-sectional area at every level, then they
have the same volume.
9-12.G.GMD.3 Use volume formulas for cylinders,
pyramids, cones, and spheres to solve problems.
Missing measures can include but are not limited to slant height, altitude, height, diagonal of a prism, edge length,
and radius.
Component Cluster 9-12.G.GMD Visualize relationships between two-dimensional and three-dimensional objects
9-12.G.GMD.4 Identify the shapes of two-dimensional cross-
sections of three-dimensional objects, and identify three-
dimensional objects generated by rotations of two-
dimensional objects
Students may use geometric simulation software to model figures and create cross sectional views.
Example: Identify the shape of the vertical, horizontal, and other cross sections of a cylinder.
Component Cluster 9-12.G.MG Apply geometric concepts in modeling situations
9-12.G.MG.1 Use geometric shapes, their measures, and their
properties to describe objects (e.g., modeling a tree trunk or a
human torso as a cylinder).
Students may use simulation software and modeling software to explore which model best describes a set of data or
situation.
9-12.G.MG.2 Apply concepts of density based on area and
volume in modeling situations (e.g., persons per square mile,
BTU’s per cubic foot).

Mathematics
NQ = Number and Quantity A = Algebra F = Functions M = Modeling G= Geometry S= Statistics and Probability
Geometry Unit 4: Similarity, Proof and Trigonometry (~ 6 weeks) Unit Overview: In Unit 4, students will take their knowledge of transformations and develop an understanding of similarity. The similarity will
then be used to define trigonometric ratios and other properties.
Guiding Question: How can transformations describe similarity in the real world?
The student will be able to: The teacher will use appropriate instructional strategies/approaches based on the needs of the student.
Component Cluster 9-12.G.SRT Understand similarity in terms of similarity transformations
9-12.G.SRT.1 Verify experimentally the properties of
dilations given by a center and a scale factor:
a. A dilation takes a line not passing through the center
of the dilation to a parallel line, and leaves a line
passing through the center unchanged.
b. The dilation of a line segment is longer or shorter in
the ratio given by the scale factor.
A dilation is a transformation that moves each point along the ray through the point emanating from a fixed center,
and multiplies distances from the center by a common scale factor.
Students may use geometric simulation software to model transformations. Students may observe patterns and verify
experimentally the properties of dilations.
9-12.G.SRT.2 Given two figures, use the definition of
similarity in terms of similarity transformations to decide if
they are similar; explain using similarity transformations the
meaning of similarity for triangles as the equality of all
corresponding pairs of angles and the proportionality of all
corresponding pairs of sides.
A similarity transformation is a rigid motion followed by a dilation.
Students may use geometric simulation software to model transformations and demonstrate a sequence of
transformations to show congruence or similarity of figures.
9-12.G.SRT.3 Use the properties of similarity
transformations to establish the AA criterion for two triangles
to be similar.
Component Cluster 9-12.G.SRT Prove theorems involving similarity
9-12.G.SRT.4 Prove theorems about triangles. Theorems
include: a line parallel to one side of a triangle divides the
other two proportionally, and conversely; the Pythagorean
theorem proved using triangle similarity.
Students may use geometric simulation software to model transformations and demonstrate a sequence of
transformations to show congruence or similarity of figures.
9-12.G.SRT.5 Use congruence and similarity criteria for
triangles to solve problems and to prove relationships in
geometric figures.
Similarity postulates include SSS, SAS, and AA.
Congruence postulates include SSS, SAS, ASA, AAS, and HL.
Students may use geometric simulation software to model transformations and demonstrate a sequence of
transformations to show congruence or similarity of figures.
Component Cluster 9-12.G.SRT Define trigonometric ratios and solve problems involving right triangles
9-12.G.SRT.6 Understand that by similarity, side ratios in
right triangles are properties of the angles in the triangle,
leading to definitions of trigonometric ratios for acute angles.
Students may use applets to explore the range of values of the trigonometric ratios as ɵ ranges from 0 to 90 degrees.
9-12.G.SRT.7 Explain and use the relationship between the
sine and cosine of complementary angles.
Geometric simulation software, applets, and graphing calculators can be used to explore the relationship between sine
and cosine.
9-12.G.SRT.8 Use trigonometric ratios and the Pythagorean
Theorem to solve right triangles in applied problems. Students may use graphing calculators or programs, tables, spreadsheets, or computer algebra systems to
solve right triangle problems.

Mathematics
NQ = Number and Quantity A = Algebra F = Functions M = Modeling G= Geometry S= Statistics and Probability
Example: find the height of a tree to the nearest tenth if the angle of elevation of the sun is 28° and the
shadow of the tree is 50 ft.
Component Cluster 9-12.G.MG Apply geometric concepts in modeling situations
9-12.G.MG.3 Apply geometric methods to solve design
problems (e.g., designing an object or structure to satisfy
physical constraints or minimize cost; working with
typographic grid systems based on ratios).
Focus on situations well modeled by trigonometric ratios for acute angles.

Mathematics
NQ = Number and Quantity A = Algebra F = Functions M = Modeling G= Geometry S= Statistics and Probability
Geometry Unit 5: Circles and Other Conic Sections (~ 5 weeks) Unit Overview: In Unit 5, students will develop a thorough understanding of circles and their properties. This will include an analytic geometry
approach writing the equation of circles.
Guiding Question: How can a circle be modeled analytically?
The student will be able to: The teacher will use appropriate instructional strategies/approaches based on the needs of the student.
Component Cluster 9-12.G.C Understand and apply theorems about circles
9-12.G.C.1 Prove that all circles are similar. Students may use geometric simulation software to model transformations and demonstrate a sequence of
transformations to show congruence or similarity of figures.
9-12.G.C.2 Identify and describe relationships among
inscribed angles, radii, and chords. Include the relationship
between central, inscribed, and circumscribed angles;
inscribed angles on a diameter are right angles; the radius of a
circle is perpendicular to the tangent where the radius
intersects the circle.
Examples:
Given the circle with radius of 10 and chord length of 12, find the distance from the chord to the center of the circle.
Find the unknown length (tangent length given radius and secant)
9-12.G.C.3 Construct the inscribed and circumscribed circles
of a triangle, and prove properties of angles for a quadrilateral
inscribed in a circle.
Students may use geometric simulation software to make geometric constructions.
Component Cluster 9-12.G.C Find arc lengths and areas of sectors of circles
9-12.G.C.5 Derive using similarity the fact that the length of
the arc intercepted by an angle is proportional to the radius,
and define the radian measure of the angle as the constant of
proportionality; derive the formula for the area of a sector.
Emphasis the similarity of all circles. Use this as a basis for introducing radian as a unit of measure. It is not
intended that it be applied to the development of circular trigonometry in this course.
Component Cluster 9-12.G.GPE Translate between the geometric description and the equation for a conic section
9-12.G.GPE.1 Derive the equation of a circle of given center
and radius using the Pythagorean Theorem; complete the
square to find the center and radius of a circle given by an
equation.
Students may use geometric simulation software to explore the connection between circles and the Pythagorean
Theorem.
Examples:
- Write an equation for a circle with a radius of 2 units and center at (1,3)
- Write an equation for a circle given that the endpoints of the diameter are (-2,7) and (4,-8)
- Find the center and radius of the circle 012444 22 yxyx
9-12.G.GPE.2 Derive the equation of a parabola given a
focus and directrix.
Students may use geometric simulation software to explore parabolas.
Example: Write and graph an equation for a parabola with focus (2,3) and directrix y=1. Component Cluster 9-12.G.GPE Use coordinates to prove simple geometric theorems algebraically
9-12.G.GPE.4 Use coordinates to prove simple geometric
theorems algebraically. For example, prove or disprove that a
Include simple proofs involving circles. Students may use geometric simulation software to model figures and prove
simple geometric theorems.

Mathematics
NQ = Number and Quantity A = Algebra F = Functions M = Modeling G= Geometry S= Statistics and Probability
figure defined by four given points in the coordinate plane is
a rectangle; prove or disprove that the point (1, √3) lies on
the circle centered at the origin and containing the point (0,2).
Example:
Prove the diameter is twice the radius.

Mathematics
NQ = Number and Quantity A = Algebra F = Functions M = Modeling G= Geometry S= Statistics and Probability
Geometry Unit 6: Applications of Probability (~ 4 weeks) Unit Overview: In Unit 6, students will take their understanding of simple probabilities and expand that to include conditional probabilities and
dependent relationships.
Guiding Question: How can probability be used to make decisions?
The student will be able to: The teacher will use appropriate instructional strategies/approaches based on the needs of the student.
Component Cluster 9-12.S.CP Understand independence and conditional probability and use them to interpret data
9-12.S.CP.1 Describe events as subsets of a sample space (the
set of outcomes) using characteristics (or categories) of the
outcomes, or as unions, intersections, or complements of
other events (“or”, “and”, “not”).
Intersection: The intersection of two sets A and B is the set of elements that are common to both set A and set B. It is
denoted by A ∩ B and is read ‘A intersection B’.
A ∩ B in the diagram is {1, 5}
this means: BOTH/AND
Union: The union of two sets A and B is the set of elements, which are in A or in B or in both. It is
denoted by A ∪ B and is read ‘A union B’.
A ∪ B in the diagram is {1, 2, 3, 4, 5, 7}
this means: EITHER/OR/ANY
could be both
Complement: The complement of the set A ∪B is the set of elements that are members of the universal set U but are
not in A ∪B. It is denoted by (A ∪ B )’
(A ∪ B )’ in the diagram is {8}
9-12.S.CP.2 Understand that two events A and B are
independent if the probability of A and B occurring together
is the product of their probabilities, and use this
characterization to determine if they are independent.
U
B A
7 5
4 3
2 1
8

Mathematics
NQ = Number and Quantity A = Algebra F = Functions M = Modeling G= Geometry S= Statistics and Probability
9-12.S.CP.3 Understand the conditional probability of A
given B as P(A and B)/P(B), and interpret independence of A
and B as saying the conditional probability of A given B is
the same as the probability of A, and the conditional
probability of B given A is the same as the probability of B.
9-12.S.CP.4 Construct and interpret two-way frequency
tables of data when two categories are associated with each
object being classified. Use the two-way table as a sample
space to decide if events are independent and to approximate
conditional probabilities. For example, collect data from a
random sample of students in your school on their favorite
subject among math, science, and English. Estimate the
probability that a randomly selected student from your school
will favor science given that the student is in tenth grade. Do
the same for other subjects.
Students may use spreadsheets, graphing calculators, and simulations to create frequency tables and conduct analyses
to determine if events are independent or determine approximate conditional probabilities.
9-12.S.CP.5 Recognize and explain the concepts of
conditional probability and independence in everyday
language and everyday situations. For example, compare the
chance of having lung cancer if you are a smoker with the
chance being a smoker if you have lung cancer.
Examples:
What is the probability of drawing a heart from a standard deck of cards on a second draw, given that a heart
was drawn on the first draw and not replaced? Are these events independent or dependent?
At Johnson Middle School, the probability that a student takes computer science and French is 0.062. The
probability that a student takes computer science is 0.43. What is the probability that a student takes French
given that the student is taking computer science?
Component Cluster 9-12.S.CP Use the rules of probability to compute probabilities of compound events in a uniform probability model
9-12.S.CP.6 Find the conditional probability of A given B as
the fraction of B’s outcomes that also belong to A, and
interpret the answer in terms of the model.
Students could use graphing calculators, simulations, or applets to model probability experiments and interpret
outcomes.
9-12.S.CP.7 Apply the Addition Rule, P(A or B) = P(A) +
P(B) = P(A and B), and interpret the answer in terms of the
model.
Students could use graphing calculators, simulations, or applets to model probability experiments and interpret
outcomes.

Mathematics
NQ = Number and Quantity A = Algebra F = Functions M = Modeling G= Geometry S= Statistics and Probability
Algebra 2 In Algebra 2, building on their work with linear, quadratic, and exponential functions, students extend their repertoire of functions to include
polynomial, rational, and radical functions. Students work closely with the expressions that define the functions, and continue to expand and hone
their abilities to model situations and to solve equations. The Mathematical Practice Standards apply throughout the course and, together with the
content standards, prescribe that students experience mathematics as a coherent, useful, and logical subject that makes use of their ability to make
sense of problem situations.
Students develop the structural similarities between the system of polynomials and the system of integers. Students draw on analogies between
polynomial arithmetic and base-ten computation, focusing on properties of operations, particularly the distributive property. Students connect
multiplication of polynomials with multiplication of multi-digit integers, and division of polynomials with long division of integers. Students identify
zeros of polynomials, including complex zeros of quadratic polynomials, and make connections between zeros of polynomials and solutions of
polynomial equations
Building on their previous work with functions, and on their work with trigonometric ratios and circles in Geometry, students now use the coordinate
plane to extend trigonometry to model periodic phenomena.
Students synthesize and generalize what they have learned about a variety of function families. They extend their work with exponential functions to
include solving exponential equations with logarithms. They explore the effects of transformations on graphs of diverse functions, including
functions arising in an application, in order to abstract the general principle that transformations on a graph always have the same effect regardless of
the type of the underlying function. They identify appropriate types of functions to model a situation, they adjust parameters to improve the model,
and they compare models by analyzing appropriateness of fit and making judgments about the domain over which a model is a good fit. The narrative
discussion and diagram of the modeling cycle should be considered when knowledge of functions, statistics, and geometry is applied in a modeling
context.
Students see how the visual displays and summary statistics they learned in earlier grades relate to different types of data and to probability
distributions. They identify different ways of collecting data— including sample surveys, experiments, and simulations—and the role that
randomness and careful design play in the conclusions that can be drawn.
Mathematical Practices
1. Make sense of problems and persevere in solving them.
2. Reason abstractly and quantitatively.
3. Construct viable arguments and critique the reasoning of others.
4. Model with mathematics.
5. Use appropriate tools strategically.
6. Attend to precision.
7. Look for and make use of structure.
8. Look for and express regularity in repeated reasoning.

Mathematics
NQ = Number and Quantity A = Algebra F = Functions M = Modeling G= Geometry S= Statistics and Probability
Algebra 2: Suggested Distribution of Units in Instructional Weeks Time # of Weeks
Unit 1: Functions and Inverses 16% ~ 5 weeks
Unit 2: Polynomial Functions 19% ~ 6 weeks
Unit 3: Rational Expressions and Functions 13% ~ 4 weeks
Unit 4: Exponential and Logarithmic Functions 19% ~ 6 weeks
Unit 5: Trigonometric Functions 16% ~ 5 weeks
Unit 6: Statistics 19% ~ 6 weeks
Unit 1: Functions and
Inverses16%
Unit 2: Polynomial Functions
19%
Unit 3: Rational Expressions and
Functions13%
Unit 4: Exponential and
Logarithmic Functions
19%
Unit 5: Trigonometric
Functions16%
Unit 6: Statistics19%
Instructional Time

Mathematics
NQ = Number and Quantity A = Algebra F = Functions M = Modeling G= Geometry S= Statistics and Probability
Algebra 2 Unit 1: Functions and Inverses (~ 5 weeks) Unit Overview: In Unit 1, students expand their work with functions from Algebra 1 to include new functions as well as previously learned
functions in more depth. New functions are created by transforming functions and by creating inverses. Domain and range continue to be identified
and used to explain real world restrictions. Functions are analyzed using multiple representations: tables, graphs, ordered pairs, equations, and
verbal descriptions.
Guiding Question: What is a function and how can it be represented?
The student will be able to: The teacher will use appropriate instructional strategies/approaches based on the needs of the student.
Component Cluster 9-12.F.IF Interpret functions that arise in applications in terms of context
9-12.F.IF.5 Relate the domain of a function to its graph
and, where applicable, to the quantitative relationship it
describes.
Students will examine all functions studied thus far with respect to domain. Restrictions will be examined as well.
Component Cluster 9-12.F.IF Analyze functions using different representations
9-12.F.IF.7 Graph functions expressed symbolically and
show key features of the graph, by hand in simple cases
and using technology for more complicated cases.
Focus on applications and how key features relate to characteristics of a situation, making selection of a particular
type of function model appropriate.
9-12.F.IF.9 Compare properties of two functions each
represented in a different way (algebraically, graphically,
numerically in tables, or by verbal description).
Component Cluster 9-12.F.BF Build a function that models a relationship between two quantities
9-12.F.BF.1 Write a function that describes a relationship
between two quantities.
c. (+) Compose functions.
Build a function that models a relationship between two quantities. Develop models for more complex or
sophisticated situations than in previous courses.
Component Cluster 9-12.F.BF Build new functions from existing functions
9-12.F.BF.3 Identify the effect on the graph of replacing
f(x) by f(x) + k, k f(x), f(kx), and f(x+k) for specific values
of k (both positive and negative); find the value of k given
the graphs. Experiment with cases and illustrate an
explanation of the effects on the graph using technology.
Build new functions from existing functions. Note the effect of multiple transformations on a single graph and the
common effect of each transformation across function types.
9-12.F.BF.4 Find inverse functions.
a. Solve an equation of the form f(x)=c for a simple
function f that has an inverse and write an
expression for the inverse.
b. (+) Verify by composition that one function is
the inverse of another.
c. (+) Read values of an inverse function from a
graph or table, given that the function has an
inverse.
Find inverses algebraically and graphically.
Component Cluster 9-12.A.CED Create equations that describe numbers or relationships

Mathematics
NQ = Number and Quantity A = Algebra F = Functions M = Modeling G= Geometry S= Statistics and Probability
9-12.A.CED.2 Create equations in two or more variables
to represent relationships between two quantities; graph
equations on coordinate axes with labels and scales.
Create equations that describe numbers or relationships. Problems should extend the functions used in Algebra 1.

Mathematics
NQ = Number and Quantity A = Algebra F = Functions M = Modeling G= Geometry S= Statistics and Probability
Algebra 2 Unit 2: Polynomial Functions (~ 6 weeks) Unit Overview: In Unit 2, students develop an understanding of the structural similarities between the system of polynomials and the system of
integers, including operations. Students identify zeros of polynomials, including complex zeros, and make connections between zeros of polynomials
and solutions of polynomial equations. Students are introduced to the complex numbers and learn to perform arithmetic operations with complex
numbers. Polynomial functions are analyzed in multiple representations and used to model real world situations.
Guiding Question: What can the characteristics of polynomial functions tell you about real world relationships?
The student will be able to: The teacher will use appropriate instructional strategies/approaches based on the needs of the student.
Component Cluster 9-12.N.CN Perform arithmetic operations with complex numbers
9-12.N.CN.1 Know there is a complex number i such
that 12 i , and every complex number has the form
a+bi where a and b are real.
Understand that there is no real solution to taking the square root of a negative number; taking the square root of a
negative number results in an imaginary number. However, when you square an imaginary number the result is a
real number. Students will examine operations in the complex number system. When dealing with powers of i,
students will focus on the four basic powers of i. For example, .,,, 3210 iiii 9-12.N.CN.2 Use the relation 12 i and the
commutative, associative, and distributive properties to
add, subtract, and multiply complex numbers.
Component Cluster 9-12.N.CN Use complex numbers in polynomial identities and equations
9-12.N.CN.7 Solve quadratic equations with real
coefficients that have complex solutions.
Limit to polynomials with real coefficients. Review methods for solving quadratic equations from Algebra 1
(graphing, factoring, completing the square, square rooting, and quadratic formula) now including complex
solutions. Note complex solutions will not show up on graph. Only real solutions can be found graphically.
9-12.N.CN.8 (+) Extend polynomial identities to the
complex numbers.
This will help convert factored forms into polynomial functions, but should be limited to only pure imaginary not
complex roots. For example: 4)2)(2( 2 xixix
9-12.N.CN.9 (+) Know the Fundamental Theorem of
Algebra; show that it is true for quadratic polynomials.
Examples:
● How many zeros does -2x2 + 3x – 8 have? Find all the zeros and explain, orally or in written format, your
answer in terms of the Fundamental Theorem of Algebra.
● How many complex zeros does the following polynomial have? How do you know?
p(x) = (x2 -3) (x2 +2)(x - 3)(2x – 1)
Component Cluster 9-12.A.REI Solve equations and inequalities in one variable
9-12.A.REI.4 Solve quadratic equations in one variable. Extend Algebra 1 solution of quadratics to include complex solutions.
9-12.A.REI.4b Solve quadratic equations by inspecting,
taking square roots, completing the square, the quadratic
formula and factoring, as appropriate to the initial form
of the equation. Recognize when the quadratic formula
give complex solutions and write them as bia for real
numbers a and b.
Component Cluster 9-12.A.CED Create equations that describe numbers or relationships
9-12.A.CED.1 Create equations in one variable and use
them to solve problems.
Equations can represent real world and mathematical problems. Include equations that arise when comparing the
values of two different functions.

Mathematics
NQ = Number and Quantity A = Algebra F = Functions M = Modeling G= Geometry S= Statistics and Probability
9-12.A.CED.2 Create equations in two or more variables
to represent relationships between quantities; graph
equations on coordinate axes with labels and scales.
Examples:
Given that the following trapezoid has area 54 cm2, set up an equation to find the length of the base, and solve
the equation.
Lava coming from the eruption of a volcano follows a parabolic path. The height h in feet of a piece of lava
t seconds after it is ejected from the volcano is given by h(t)= -t2 + 16t + 936. After how many seconds
does the lava reach its maximum height of 1000 feet?
Component Cluster 9-12.F.IF Interpret functions that arise in applications in terms of context
9-12.F.IF.4 For a function that models a relationship
between two quantities, interpret key features of graphs
and tables in terms of the quantities, and sketch graphs
showing key features given a verbal description of the
relationship.
Key features include: intercepts; intervals where the function is increasing, decreasing, positive, or negative;
relative maximums and minimums; symmetries; and end behavior.
Component Cluster 9-12.F.IF Analyze functions using different representations
9-12.F.IF.7 Graph functions expressed symbolically and
show key features of the graph, by hand in simple cases
and using technology for more complicated cases.
Build understanding of graphs by graphing by hand and graphing calculator. Note that real zeros will appear on the
graph as x-intercepts. Key features include: intercepts; intervals where the function is increasing, decreasing,
positive, or negative; relative maximums and minimums; symmetries; and end behavior.
9-12.F.IF.7c Graph polynomial functions, identifying
zeros when suitable factorizations are available, and
showing end behavior.
Component Cluster 9-12.A.SSE Interpret the structure of expressions
9-12.A.SSE.2 Use the structure of an expression to
identify ways to rewrite it. For example, recognize
44 yx as a difference of two squares that can be factored as ))(( 2222 yxyx .
Component Cluster 9-12.A.APR Perform arithmetic operations on polynomials
9-12.A.APR.1 Understand that polynomials form a
system analogous to the integers, namely, they are closed
under the operations of addition, subtraction, and
multiplication; add, subtract, and multiply polynomials.
Extend beyond the quadratic polynomials found in Algebra 1.
Component Cluster 9-12.A.APR Understand the relationship between the zeros and factors of polynomials
9-12.A.APR.2 Know and apply the Remainder
Theorem: For a polynomial p(x) and a number a, the
remainder on division by x-a is p(a), so p(a)=0 if and
only if (x-a) is a factor of p(x).
Show that when you evaluate the function at the root then the result is zero. Students may be introduced to
synthetic division here. Build on the student’s understanding of integer division to develop polynomial division and
an understanding of remainders and factors.
9-12.A.APR.3 Identify zeros of polynomials when
suitable factorizations are available, and use the zeros to
construct a rough graph of the function defined by the
polynomial.
Make connections between factors, zeros and constructing graphs. Note how zeros of multiplicity will be graphed.

Mathematics
NQ = Number and Quantity A = Algebra F = Functions M = Modeling G= Geometry S= Statistics and Probability
Component Cluster 9-12.A.APR Use polynomial identities to solve problems
9-12.A.APR.4 Prove polynomial identities and use them
to describe numerical relationships
Be able to recognize different forms of polynomials and rewrite them to factor, solve or graph.

Mathematics
NQ = Number and Quantity A = Algebra F = Functions M = Modeling G= Geometry S= Statistics and Probability
Algebra 2 Unit 3: Rational Expressions and Functions (~ 4 weeks) Unit Overview: In Unit 3, students take their understanding of rational numbers and extend to rational expressions. Rational numbers extend the
arithmetic of integers by allowing division by all numbers except 0. Similarly, rational expressions extend the arithmetic of polynomials by allowing
division of polynomials except the zero polynomial. Graphical representations are explored and critical pieces, like asymptotes, identified to get a
clearer understanding of the functions’ properties.
Guiding Question: What can the properties of rational functions tell you about the real world relationships they describe?
The student will be able to: The teacher will use appropriate instructional strategies/approaches based on the needs of the student.
Component Cluster 9-12.A.REI Understand solving equations as a process of reasoning and explain the reasoning
9-12.A.REI.2 Solve simple rational equations in one
variable, and give examples showing how extraneous
solutions may arise.
Note that potential solutions must be checked in the original equation to make sure that these values do not cause
the expression to become undefined; such extraneous solutions must be rejected.
Component Cluster 9-12.A.SSE Interpret the structure of expressions
9-12.A.SSE.1 Interpret expressions that represent a
quantity in terms of its context.
Students should understand the vocabulary for the parts that make up the whole expression and be able to identify
those parts and interpret their meaning in terms of a context. For example, use rational expressions to represent
Average Speed as (Total Distance) / (Total Time), based on d = r x t.
9-12.A.SSE.1b Interpret complicated expressions by
viewing one or more of their parts as a single entity.
Show how complex fractions can be viewed as division, a/b.
Component Cluster 9-12.A.APR Rewrite rational expressions
9-12.A.APR.6 Rewrite simple rational expressions in
different forms; write a(x)/b(x) in the form q(x) +
r(x)/b(x), where a(x), b(x), q(x), and r(x) are polynomials
with degree of r(x) less than the degree of b(x), using
inspection, long division, or, for more complicated
examples, a computer algebra system.
The polynomial q(x) is called the quotient and the polynomial r(x) is called the remainder.
Example: Find the quotient and remainder for the rational expression 𝑥3−3𝑥2+𝑥−6
𝑥2+2 and use them to write the
expression in a different form.
9-12.A.APR.7(+) Understand that rational expressions
form a system analogous to the rational numbers, closed
under addition, subtraction, multiplication, and division
by a nonzero rational expression; add, subtract, multiply,
and divide rational expressions.
Show how students’ prior knowledge of working with fractions applies to performing operations (+, -, x, /) with
rational expressions.
Example: Express 1
𝑥2+1−
1
𝑥2−1 in the form 𝑎(𝑥)/𝑏(𝑥), where a(x) and b(x) are polynomials.
Component Cluster 9-12.A.CED Create equations that describe numbers or relationships
9-12.A.CED.1 Create equations in one variable and use
them to solve problems.
Equations can represent real world and mathematical problems. Include equations that arise when comparing the
values of two different functions.
9-12.A.CED.3 Represent constraints by equations, and
by systems of equations, and interpret solutions as viable
or non-viable options in a modeling context.
Consider issues such as where a solution of 0 or a negative number may not be appropriate in the real-life context.
Component Cluster 9-12.F.IF Analyze functions using different representations

Mathematics
NQ = Number and Quantity A = Algebra F = Functions M = Modeling G= Geometry S= Statistics and Probability
9-12.F.IF.7 Graph functions expressed symbolically and
show key features of the graph, by hand in simple cases
and using technology for more complicated cases.
Students should be very familiar with the parent graph x
y1
and be able to graph it by hand, showing key
features.
Students may use graphing calculators to graph more difficult rational functions. When using the graphing
calculator, point out how the table may show an error where the function is undefined and how that corresponds to
the asymptotes or holes that exist in the function.
9-12.F.IF.7d(+) Graph rational functions, identifying
zeros and asymptotes when suitable factorizations are
available, and showing end behavior.
Find vertical and horizontal asymptotes. Show how factoring is used in determining features of rational functions,
such as zeros and multiple vertical asymptotes.

Mathematics
Algebra 2 Unit 4: Exponential and Logarithmic Functions (~ 6 weeks) Unit Overview: In Unit 4, students extend their basic understanding of exponential growth functions to gain a deeper understanding of the function
and all its properties. Students will use more precise graphical representations to better define the relationships. Then students will utilize inverse
relationships to develop the logarithmic function and explore its properties. Both exponential and logarithmic functions are used to model real world
relationships and solve real world problems.
Guiding Question: How do exponential and logarithmic functions explain real world relationships?
The student will be able to: The teacher will use appropriate instructional strategies/approaches based on the needs of the student.
Component Cluster 9-12.F.IF Interpret functions that arise in applications in terms of the context
9-12.F.IF.4 For a function that models a relationship
between two quantities, interpret key features of graphs
and tables in terms of the quantities, and sketch graphs
showing key features given a verbal description of the
relationship.
Key features include: intercepts; intervals where the function is increasing, decreasing, positive, or negative;
symmetries; asymptotes; and end behavior.
Component Cluster 9-12.F.IF Analyze functions using different representations
9-12.F.IF.7 Graph functions expressed symbolically and
show key features of the graph, by hand in simple cases
and using technology for more complicated cases.
Focus on applications and how key features relate to characteristics of a situation, making selection of a particular
type of function model appropriate.
9-12.F.IF.7e Graph exponential and logarithmic
functions, showing intercepts and end behavior. Note that for exponential functions in the form
xbay , the y-intercept is ),0( a and if 1b , the function is
increasing, whereas if 10 b , the function is decreasing. For xy blog , the x-intercept is )0,1( .
9-12.F.IF.8 Write a function defined by an expression in
different but equivalent forms to reveal and explain
different properties of the function.
Show how to go from exponential to logarithmic form and from logarithmic to exponential form. For example:
xyby b
x log
9-12.F.IF.8b Use the properties of exponents to interpret
expressions for exponential functions.
For example, identify percent rate of change in functions such as 10/12 )2.1(,)02.1(,)97.0(,)02.1( tttt yyyy and classify them as representing exponential growth or
decay.
Component Cluster 9-12.F.BF Build a function that models a relationship between two quantities
9-12.F.BF.1 Write a function that describes a
relationship between two quantities.
For example, build a function that models appreciation/depreciation, radioactive decay or population growth.
9-12.F.BF.1b Combine standard function types using
arithmetic operations.
Can be demonstrated with the properties of logs. Models of growth and decay that include constant functions are
also included, combining the log or exponential with a constant function.
Component Cluster 9-12.F.BF Build new functions from existing functions
9-12.F.BF.3 Identify the effect on the graph of replacing
f(x) by f(x)+k, kf(x), f(kx), and f(x+k) for specific values
of k (both positive and negative); find the value of k given
the graphs.
Show transformations of the parent function depending on the model criteria. Include vertical and horizontal shifts,
reflections, compressions and stretches.

Mathematics
9-12.F.BF.5(+) Understand the inverse relationship
between exponents and logarithms and use this
relationship to solve problems involving logarithms and
exponents.
For example: xby and xy blog are inverses. Note the usefulness of the inverse properties: xb
xb log
and xb x
b log .
Component Cluster 9-12.F.LE Construct and compare linear, quadratic, and exponential models and solve problems
9-12.F.LE.4 For exponential models, express as a
logarithm the solution to dabct where a, c, and d are
numbers and the base b is 2, 10, or e; evaluate the
logarithm using technology.
Show how to use logarithms to solve exponential equations.
Note that when evaluating logarithms on a graphing calculator, log uses base 10 and ln uses base e.
Component Cluster 9-12.A.SSE Interpret the structure of expressions
9-12.A.SSE.1 Interpret expressions that represent a
quantity in terms of its context.
Show how exponential and logarithmic expressions can model real-life situations.
9-12.A.SSE.1b Interpret complicated expressions by
viewing one or more of their parts as a single entity. For example, show how the principle
yx bb can be used to understand more complicated problems such as
523 2 xxx bb .
Component Cluster 9-12.A.SSE Write expression in equivalent forms to solve problems
9-12.A.SSE.4 Derive the formula for the sum of a finite
geometric series (when the common ratio is not 1), and
use the formula to solve problems.
For example, calculate mortgage payments.
Component Cluster 9-12.A.CED Create equations that describe numbers or relationships
9-12.A.CED.1 Create equations in one variable and use
them to solve problems. Include equations arising from
exponential functions.
Equations can represent real world and mathematical problems. Include equations that arise when comparing the
values of two different functions.
9-12.A.CED.2 Create equations in two or more variables
to represent relationships between quantities; graph
equations on coordinate axes with labels and scales.
Create equations that describe numbers or relationships.
Show the connection between the numeric and graphic representations.
Emphasize the importance of using appropriate labels and scales.
Component Cluster 9-12.A.REI Represent and solve equations and inequalities graphically
9-12.A.REI.11 Explain why the x-coordinates of the
points where the graphs of the equations y = f(x) and y =
g(x) intersect are the solutions of the equation f(x)=g(x);
find the solutions approximately.
Solve systems of equations graphically, using the intersect feature on the graphing calculator.
Algebra 2 Unit 5: Trigonometric Functions (~ 5 weeks)

Mathematics
Unit Overview: In Unit 5, students build on their knowledge of trigonometry in right triangles to extend to the trigonometric functions based on a
unit circle. Students explore the basic trigonometric functions, including their graphs, to gain a better understanding of them.
Guiding Question: What can the properties of trigonometric functions tell you about the real world relationships they describe?
The student will be able to: The teacher will use appropriate instructional strategies/approaches based on the needs of the student.
Component Cluster 9-12.F.IF Interpret functions that arise in applications in terms of context
9-12.F.IF.4 For a function that models a relationship
between two quantities, interpret key features of graphs
and tables in terms of the quantities, and sketch graphs
showing key features given a verbal description of the
relationship.
Key features include: intercepts; intervals where the function is increasing, decreasing, positive, or negative;
relative maximums and minimums; symmetries; end behavior; and periodicity.
9-12.F.IF.7 Graph functions expressed symbolically and
show key features of the graph, by hand in simple cases
and using technology for more complicated cases.
9-12.F.IF.7e Graph trigonometric functions, showing
period, midline, and amplitude.
Component Cluster 9-12.F.BF Build new functions from existing functions
9-12.F.BF.3 Identify the effect on the graph of replacing
f(x) by f(x)+k, kf(x), f(kx), and f(x+k) for specific values
of k (both positive and negative); find the value of k given
the graphs.
Experiment with cases and illustrate an explanation of the effects on the graph using technology. Note the common
effect of transformations across function types.
Component Cluster 9-12.F.TF Extend the domain of trigonometric functions using the unit circle
9-12.F.TF.1 Understand radian measure of an angle as
the length of the arc on the unit circle subtended by the
angle.
Consider relating it to a special case of r
s where s is the arc length and r = 1 for the unit circle.
9-12.F.TF.2 Explain how the unit circle in the coordinate
plane enables the extension of trigonometric functions to
all real numbers, interpreted as radian measures of angles
traversed counterclockwise around the unit circle.
Note that every coordinate on the circle (x,y) represents )sin,(cos .
9-12.F.TF.3(+) Use special triangles to determine
geometrically the values of sine, cosine, tangent for π/3,
π/4, and π/6, and use the unit circle to express the values
of sine, cosine, and tangent for π-x, π+x, and 2π-x in
terms of their values for x, where x is any real number.
Visual representations of the unit circle, with reflections and rotations, can prove helpful in demonstrating the
angles outside of quadrant I.
Component Cluster 9-12.F.TF Model periodic phenomena with trigonometric functions
9-12.F.TF.5 Choose trigonometric functions to model
periodic phenomena with specified amplitude, frequency,
and midline.
Show how trigonometric functions can model real life situations (for example: tides, sunrise, temperature change).
Students should be able to interpret what amplitude, frequency and midline mean in context.
Component Cluster 9-12.F.TF Prove and apply trigonometric identities
9-12.F.TF.8 Prove the Pythagorean identity (sin A)² +
(cos A)² = 1 and use it to calculate trigonometric ratios.
Use to find additional trigonometric ratios when one ratio is given.
Algebra 2 Unit 6: Statistics (~ 6 weeks)

Mathematics
Unit Overview: In working with statistics, students will understand all the essential processes involved in dealing with data: collecting, organizing,
representing, analyzing, making predictions/conclusions. Calculations of measures of central tendency and dispersion are used to analyze data.
Inferences and conclusions will help interpret real world situations.
Guiding Question: How can statistics be used to understand real world phenomena and help us draw appropriate conclusions?
The student will be able to: The teacher will use appropriate instructional strategies/approaches based on the needs of the student.
Component Cluster 9-12.S.ID Summarize, represent, and interpret data on a single count or measurement variable
9-12.S.ID.4 Use the mean and standard deviation of a
data set to fit it to a normal distribution and to estimate
population percentages. Recognize that there are data sets
for which such a procedure is not appropriate. Use
calculators, spreadsheets, and tables to estimate areas
under the normal curve.
Note that the Normal Distribution is also referred to as the Bell Curve. Show how Measures of Central Tendency,
Measures of Dispersion, and percentiles are represented and can be interpreted in a Normal Distribution. Point out
that a special characteristic of a normal distribution is that mean = median = mode.
While students may have heard of the normal distribution, it is unlikely that they will have prior experience using it
to make specific estimates. Build on students’ understanding of data distributions to help them see how the normal
distribution uses area to make estimates of frequencies (which can be expressed as probabilities).
Emphasize that only some data are well described by a normal distribution (i.e., not all data are normally
distributed). Use percentiles, standard deviation, and the empirical rule to verify if a data distribution is normal.
Component Cluster 9-12.S.IC Understand and evaluate random processes underlying statistical experiments
9-12.S.IC.1 Understand statistics as a process for making
inferences about population parameters based on a
random sample from that population.
Use simulated results to informally compare a hypothesized value of a population parameter to the collected sample
statistic. Judge the likelihood of obtaining a sample statistic using simulations and/or probability models.
9-12.S.IC.2 Decide if a specified model is consistent
with results from a given data-generating process.
Include comparing theoretical and empirical results to evaluate the effectiveness of a treatment.
Component Cluster 9-12.S.IC Make inferences and justify conclusions from sample surveys, experiments, and observational studies
9-12.S.IC.3 Recognize the purposes of and differences
among sample surveys, experiments, and observational
studies; explain how randomization relates to each.
In earlier grades, students are introduced to different ways of collecting data and use graphical displays and
summary statistics to make comparisons. These ideas are revisited with a focus on how the way in which data are
collected determines the scope and nature of the conclusions that can be drawn from that data. The concept of
causation should be stressed.
9-12.S.IC.4 Use data from a sample survey to estimate a
population mean or proportion; develop a margin of error
through the use of simulation models from random
sampling.
The concept of statistical significance is developed informally through simulation as meaning a result that is
unlikely to have occurred solely as a result of random selection in sampling or random assignment in an
experiment.
Focus on the variability of results from experiments—that is, focus on statistics as a way of dealing with, not
eliminating, inherent randomness. 9-12.S.IC.5 Use data from a randomized experiment to
compare two treatments; use simulations to decide if
differences between two parameters are significant.
9-12.S.IC.6 Evaluate reports based on data. Demonstrate how to both write a report as well as critique a report already written. Investigate how data could be
used to present a misleading conclusion, for example using the mean to summarize a set of data that is skewed or
contains outliers. Emphasis should be placed on discussion of the shape, center, and spread of quantitative data or
proportion of each category in categorical data.

Mathematics
Glossary
Addition and subtraction within 5, 10, 20, 100, or 1000. Addition or subtraction of two whole numbers with whole number answers, and with sum or minuend in the range 0-5, 0-10, 0-20, or 0-100,
respectively. Example: 8 + 2 = 10 is an addition within 10, 14 – 5 = 9 is a subtraction within 20, and 55 – 18 = 37 is a subtraction within 100.
Additive inverses. Two numbers whose sum is 0 are additive inverses of one another. Example: 3/4 and – 3/4 are additive inverses of one another because 3/4 + (– 3/4) = (– 3/4) + 3/4 = 0.
Associative property of addition. See Table 3 in this Glossary.
Associative property of multiplication. See Table 3 in this Glossary.
Bivariate data. Pairs of linked numerical observations. Example: a list of heights and weights for each player on a football team.
Box plot. A method of visually displaying a distribution of data values by using the median, quartiles, and extremes of the data set. A box shows the middle 50% of the data.1
Commutative property. See Table 3 in this Glossary.
Complex fraction. A fraction A/B where A and/or B are fractions (B nonzero).
Computation algorithm. A set of predefined steps applicable to a class of problems that gives the correct result in every case when the steps are carried out correctly. See also: computation strategy.
Computation strategy. Purposeful manipulations that may be chosen for specific problems, may not have a fixed order, and may be aimed at converting one problem into another. See also:
computation algorithm.
Congruent. Two plane or solid figures are congruent if one can be obtained from the other by rigid motion (a sequence of rotations, reflections, and translations).
Counting on. A strategy for finding the number of objects in a group without having to count every member of the group. For example, if a stack of books is known to have 8 books and 3 more books
are added to the top, it is not necessary to count the stack all over again. One can find the total by counting on—pointing to the top book and saying “eight,” following this with “nine, ten, eleven.
There are eleven books now.”
Dot plot. See: line plot.
Dilation. A transformation that moves each point along the ray through the point emanating from a fixed center, and multiplies distances from the center by a common scale factor.
Expanded form. A multi-digit number is expressed in expanded form when it is written as a sum of single-digit multiples of powers of ten. For example, 643 = 600 + 40 + 3.
Expected value. For a random variable, the weighted average of its possible values, with weights given by their respective probabilities.
First quartile. For a data set with median M, the first quartile is the median of the data values less than M. Example: For the data set {1, 3, 6, 7, 10, 12, 14, 15, 22, 120}, the first quartile is 6.2 See
also: median, third quartile, interquartile range.
Fraction. A number expressible in the form a/b where a is a whole number and b is a positive whole number. (The word fraction in these standards always refers to a non-negative number.) See also:
rational number.
Identity property of 0. See Table 3 in this Glossary.
Independently combined probability models. Two probability models are said to be combined independently if the probability of each ordered pair in the combined model equals the product of the
original probabilities of the two individual outcomes in the ordered pair.
Integer. A number expressible in the form a or –a for some whole number a.
Interquartile Range. A measure of variation in a set of numerical data, the interquartile range is the distance between the first and third quartiles of the data set. Example: For the data set {1, 3, 6, 7,
10, 12, 14, 15, 22, 120}, the interquartile range is 15 – 6 = 9. See also: first quartile, third quartile.
Line plot. A method of visually displaying a distribution of data values where each data value is shown as a dot or mark above a number line. Also known as a dot plot.3
Mean. A measure of center in a set of numerical data, computed by adding the values in a list and then dividing by the number of values in the list. (To be more precise, this defines the arithmetic
mean.)Example: For the data set {1, 3, 6, 7, 10, 12, 14, 15, 22, 120}, the mean is 21.
Mean absolute deviation. A measure of variation in a set of numerical data, computed by adding the distances between each data value and the mean, then dividing by the number of data values.
Example: For the data set {2, 3, 6, 7, 10, 12, 14, 15, 22, 120}, the mean absolute deviation is 20.
Median. A measure of center in a set of numerical data. The median of a list of values is the value appearing at the center of a sorted version of the list—or the mean of the two central values, if the
list contains an even number of values. Example: For the data set {2, 3, 6, 7, 10, 12, 14, 15, 22, 90}, the median is 11.
Midline. In the graph of a trigonometric function, the horizontal line halfway between its maximum and minimum values.
1Adapted from Wisconsin Department of Public Instruction, http://dpi.wi.gov/standards/mathglos.html , accessed March 2, 2010.

Mathematics
2Many different methods for computing quartiles are in use. The method defined here is sometimes called the Moore and McCabe method. See Langford, E., “Quartiles in Elementary Statistics,” Journal of
Statistics Education Volume 14, Number 3 (2006). 3Adapted from Wisconsin Department of Public Instruction, op. cit.
Multiplication and division within 100. Multiplication or division of two whole numbers with whole number answers, and with product or dividend in the range 0-100. Example: 72 ÷ 8 = 9.
Multiplicative inverses. Two numbers whose product is 1 are multiplicative inverses of one another. Example: 3/4 and 4/3 are multiplicative inverses of one another because 3/4 × 4/3 = 4/3 × 3/4 = 1
Number line diagram. A diagram of the number line used to represent numbers and support reasoning about them. In a number line diagram for measurement quantities, the interval from 0 to 1 on
the diagram represents the unit of measure for the quantity.
Percent rate of change. A rate of change expressed as a percent. Example: if a population grows from 50 to 55 in a year, it grows by 5/50 = 10% per year.
Probability distribution. The set of possible values of a random variable with a probability assigned to each.
Properties of operations. See Table 3 in this Glossary.
Properties of equality. See Table 4 in this Glossary.
Properties of inequality. See Table 5 in this Glossary.
Properties of operations. See Table 3 in this Glossary.
Probability. A number between 0 and 1 used to quantify likelihood for processes that have uncertain outcomes (such as tossing a coin, selecting a person at random from a group of people, tossing a
ball at a target, or testing for a medical condition).
Probability model. A probability model is used to assign probabilities to outcomes of a chance process by examining the nature of the process. The set of all outcomes is called the sample space, and
their probabilities sum to 1. See also: uniform probability model.
Random variable. An assignment of a numerical value to each outcome in a sample space.
Rational expression. A quotient of two polynomials with a non-zero denominator.
Rational number. A number expressible in the form a/b or – a/b for some fraction a/b. The rational numbers include the integers.
Rectilinear figure. A polygon all angles of which are right angles.
Rigid motion. A transformation of points in space consisting of a sequence of one or more translations, reflections, and/or rotations. Rigid motions are here assumed to preserve distances and angle
measures.
Repeating decimal. The decimal form of a rational number. See also: terminating decimal.
Sample space. In a probability model for a random process, a list of the individual outcomes that are to be considered.
Scatter plot. A graph in the coordinate plane representing a set of bivariate data. For example, the heights and weights of a group of people could be displayed on a scatter plot.5
Similarity transformation. A rigid motion followed by a dilation
Tape diagram. A drawing that looks like a segment of tape, used to illustrate number relationships. Also known as a strip diagram, bar model, fraction strip, or length model.
Terminating decimal. A decimal is called terminating if its repeating digit is 0.
Third quartile. For a data set with median M, the third quartile is the median of the data values greater than M. Example: For the data set {2, 3, 6, 7, 10, 12, 14, 15, 22, 120}, the third quartile is 15.
See also: median, first quartile, interquartile range.
Transitivity principle for indirect measurement. If the length of object A is greater than the length of object B, and the length of object B is greater than the length of object C, then the length of
object A is greater than the length of object C. This principle applies to measurement of other quantities as well.
Uniform probability model. A probability model which assigns equal probability to all outcomes. See also: probability model.
Vector. A quantity with magnitude and direction in the plane or in space, defined by an ordered pair or triple of real numbers.
Visual fraction model. A tape diagram, number line diagram, or area model.
Whole numbers. The numbers 0, 1, 2, 3, ….
5Adapted from Wisconsin Department of Public Instruction, op. cit.

Mathematics
Standards for Mathematical Practice
The Standards for Mathematical Practice describe varieties of expertise that mathematics educators at all levels should seek to develop in their students. These practices rest on
important “processes and proficiencies” with longstanding importance in mathematics education. The first of these are the NCTM process standards of problem solving, reasoning
and proof, communication, representation, and connections. The second are the strands of mathematical proficiency specified in the National Research Council’s report Adding It
Up: adaptive reasoning, strategic competence, conceptual understanding (comprehension of mathematical concepts, operations and relations), procedural fluency (skill in carrying
out procedures flexibly, accurately, efficiently and appropriately), and productive disposition (habitual inclination to see mathematics as sensible, useful, and worthwhile, coupled
with a belief in diligence and one’s own efficacy).
1. Make sense of problems and persevere in solving them.
Mathematically proficient students start by explaining to themselves the meaning of a problem and looking for entry points to its solution. They analyze givens, constraints,
relationships, and goals. They make conjectures about the form and meaning of the solution and plan a solution pathway rather than simply jumping into a solution attempt. They
consider analogous problems, and try special cases and simpler forms of the original problem in order to gain insight into its solution. They monitor and evaluate their progress and
change course if necessary. Older students might, depending on the context of the problem, transform algebraic expressions or change the viewing window on their graphing
calculator to get the information they need. Mathematically proficient students can explain correspondences between equations, verbal descriptions, tables, and graphs or draw
diagrams of important features and relationships, graph data, and search for regularity or trends. Younger students might rely on using concrete objects or pictures to help
conceptualize and solve a problem. Mathematically proficient students check their answers to problems using a different method, and they continually ask themselves, “Does this
make sense?” They can understand the approaches of others to solving complex problems and identify correspondences between different approaches.
2. Reason abstractly and quantitatively.
Mathematically proficient students make sense of quantities and their relationships in problem situations. They bring two complementary abilities to bear on problems involving
quantitative relationships: the ability to decontextualize—to abstract a given situation and represent it symbolically and manipulate the representing symbols as if they have a life
of their own, without necessarily attending to their referents—and the ability to contextualize, to pause as needed during the manipulation process in order to probe into the
referents for the symbols involved. Quantitative reasoning entails habits of creating a coherent representation of the problem at hand; considering the units involved; attending to
the meaning of quantities, not just how to compute them; and knowing and flexibly using different properties of operations and objects.
3. Construct viable arguments and critique the reasoning of others.
Mathematically proficient students understand and use stated assumptions, definitions, and previously established results in constructing arguments. They make conjectures and
build a logical progression of statements to explore the truth of their conjectures. They are able to analyze situations by breaking them into cases, and can recognize and use
counterexamples. They justify their conclusions, communicate them to others, and respond to the arguments of others. They reason inductively about data, making plausible
arguments that take into account the context from which the data arose. Mathematically proficient students are also able to compare the effectiveness of two plausible arguments,
distinguish correct logic or reasoning from that which is flawed, and—if there is a flaw in an argument—explain what it is. Elementary students can construct arguments using
concrete referents such as objects, drawings, diagrams, and actions. Such arguments can make sense and be correct, even though they are not generalized or made formal until later
grades. Later, students learn to determine domains to which an argument applies. Students at all grades can listen or read the arguments of others, decide whether they make sense,
and ask useful questions to clarify or improve the arguments.
4. Model with mathematics.
Mathematically proficient students can apply the mathematics they know to solve problems arising in everyday life, society, and the workplace. In early grades, this might be as
simple as writing an addition equation to describe a situation. In middle grades, a student might apply proportional reasoning to plan a school event or analyze a problem in the
community. By high school, a student might use geometry to solve a design problem or use a function to describe how one quantity of interest depends on another. Mathematically
proficient students who can apply what they know are comfortable making assumptions and approximations to simplify a complicated situation, realizing that these may need
revision later. They are able to identify important quantities in a practical situation and map their relationships using such tools as diagrams, two-way tables, graphs, flowcharts and

Mathematics
formulas. They can analyze those relationships mathematically to draw conclusions. They routinely interpret their mathematical results in the context of the situation and reflect on
whether the results make sense, possibly improving the model if it has not served its purpose.
5. Use appropriate tools strategically.
Mathematically proficient students consider the available tools when solving a mathematical problem. These tools might include pencil and paper, concrete models, a ruler, a
protractor, a calculator, a spreadsheet, a computer algebra system, a statistical package, or dynamic geometry software. Proficient students are sufficiently familiar with tools
appropriate for their grade or course to make sound decisions about when each of these tools might be helpful, recognizing both the insight to be gained and their limitations. For
example, mathematically proficient high school students analyze graphs of functions and solutions generated using a graphing calculator. They detect possible errors by
strategically using estimation and other mathematical knowledge. When making mathematical models, they know that technology can enable them to visualize the results of
varying assumptions, explore consequences, and compare predictions with data. Mathematically proficient students at various grade levels are able to identify relevant external
mathematical resources, such as digital content located on a website, and use them to pose or solve problems. They are able to use technological tools to explore and deepen their
understanding of concepts.
6. Attend to precision.
Mathematically proficient students try to communicate precisely to others. They try to use clear definitions in discussion with others and in their own reasoning. They state the
meaning of the symbols they choose, including using the equal sign consistently and appropriately. They are careful about specifying units of measure, and labeling axes to clarify
the correspondence with quantities in a problem. They calculate accurately and efficiently, express numerical answers with a degree of precision appropriate for the problem
context. In the elementary grades, students give carefully formulated explanations to each other. By the time they reach high school they have learned to examine claims and make
explicit use of definitions.
7. Look for and make use of structure.
Mathematically proficient students look closely to discern a pattern or structure. Young students, for example, might notice that three and seven more is the same amount as seven
and three more, or they may sort a collection of shapes according to how many sides the shapes have. Later, students will see 7 × 8 equals the well remembered 7 × 5 + 7 × 3, in
preparation for learning about the distributive property. In the expression x2 + 9x + 14, older students can see the 14 as 2 × 7 and the 9 as 2 + 7. They recognize the significance of
an existing line in a geometric figure and can use the strategy of drawing an auxiliary line for solving problems. They also can step back for an overview and shift perspective.
They can see complicated things, such as some algebraic expressions, as single objects or as being composed of several objects. For example, they can see 5 – 3(x – y)2 as 5 minus
a positive number times a square and use that to realize that its value cannot be more than 5 for any real numbers x and y.
8. Look for and express regularity in repeated reasoning.
Mathematically proficient students notice if calculations are repeated, and look both for general methods and for shortcuts. Upper elementary students might notice when dividing
25 by 11 that they are repeating the same calculations over and over again, and conclude they have a repeating decimal. By paying attention to the calculation of slope as they
repeatedly check whether points are on the line through (1, 2) with slope 3, middle school students might abstract the equation (y – 2)/(x – 1) = 3. Noticing the regularity in the way
terms cancel when expanding (x – 1)(x + 1), (x – 1)(x2 + x + 1), and (x – 1)(x3 + x2 + x + 1) might lead them to the general formula for the sum of a geometric series. As they work
to solve a problem, mathematically proficient students maintain oversight of the process, while attending to the details. They continually evaluate the reasonableness of their
intermediate results.

Mathematics
Table 1. Common addition and subtraction situations.6
Result Unknown Change Unknown Start Unknown
Add to
Two bunnies sat on the grass. Three more
bunnies hopped there. How many bunnies are
on the grass now?
2 + 3 = ?
Two bunnies were sitting on the grass.
Some more bunnies hopped there. Then
there were five bunnies. How many
bunnies hopped over to the first two?
2 + ? = 5
Some bunnies were sitting on the grass.
Three more bunnies hopped there. Then
there were five bunnies. How many bunnies
were on the grass before?
? + 3 = 5
Take from
Five apples were on the table. I ate two apples.
How many apples are on the table now?
5 – 2 = ?
Five apples were on the table. I ate some
apples. Then there were three apples. How
many apples did I eat?
5 – ? = 3
Some apples were on the table. I ate two
apples. Then there were three apples. How
many apples were on the table before?
? – 2 = 3
Total Unknown Addend Unknown Both Addends Unknown1
Put Together/
Take Apart2
Three red apples and two green apples are on
the table. How many apples are on the table?
3 + 2 = ?
Five apples are on the table. Three are red
and the rest are green. How many apples
are green?
3 + ? = 5, 5 – 3 = ?
Grandma has five flowers. How many can
she put in her red vase and how many in her
blue vase?
5 = 0 + 5, 5 = 5 + 0
5 = 1 + 4, 5 = 4 + 1
5 = 2 + 3, 5 = 3 + 2
Difference Unknown Bigger Unknown Smaller Unknown
Compare3
(“How many more?” version):
Lucy has two apples. Julie has five apples.
How many more apples does Julie have than
Lucy?
(“How many fewer?” version):
Lucy has two apples. Julie has five apples.
How many fewer apples does Lucy have than
Julie?
2 + ? = 5, 5 – 2 = ?
(Version with “more”):
Julie has three more apples than Lucy.
Lucy has two apples. How many apples
does Julie have?
(Version with “fewer”):
Lucy has 3 fewer apples than Julie. Lucy
has two apples. How many apples does
Julie have?
2 + 3 = ?, 3 + 2 = ?
(Version with “more”):
Julie has three more apples than Lucy. Julie
has five apples. How many apples does
Lucy have?
(Version with “fewer”):
Lucy has 3 fewer apples than Julie. Julie
has five apples. How many apples does
Lucy have?
5 – 3 = ?, ? + 3 = 5 1These take apart situations can be used to show all the decompositions of a given number. The associated equations, which have the total on the left of the equal sign, help children understand that the = sign does not always mean makes or
results in but always does mean is the same number as. 2Either addend can be unknown, so there are three variations of these problem situations. Both Addends Unknown is a productive extension of this basic situation, especially for small numbers less than or equal to 10. 3For the Bigger Unknown or Smaller Unknown situations, one version directs the correct operation (the version using more for the bigger unknown and using less for the smaller unknown). The other versions are more difficult.
6Adapted from Box 2-4 of National Research Council (2009, op. cit., pp. 32, 33).

Mathematics
Table 2. Common multiplication and division situations.7
Unknown Product
Group Size Unknown
(“How many in each group?”
Division)
Number of Groups Unknown
(“How many groups?” Division)
3 x 6 = ? 3 x ? = 18, and 18 3 = ? ? x 6 = 18, and 18 6 = ?
Equal Groups
There are 3 bags with 6 plums in each
bag. How many plums are there in all?
Measurement example. You need 3
lengths of string, each 6 inches long.
How much string will you need
altogether?
If 18 plums are shared equally into 3
bags, then how many plums will be
in each bag?
Measurement example. You have 18
inches of string, which you will cut
into 3 equal pieces. How long will
each piece of string be?
If 18 plums are to be packed 6
to a bag, then how many bags
are needed?
Measurement example. You
have 18 inches of string, which
you will cut into pieces that are
6 inches long. How many pieces
of string will you have?
Arrays,4
Area5
There are 3 rows of apples with 6
apples in each row. How many apples
are there?
Area example. What is the area
of a 3 cm by 6 cm rectangle?
If 18 apples are arranged into 3
equal rows, how many apples will
be in each row?
Area example. A rectangle has area
18 square centimeters. If one side is
3 cm long, how long is a side next to
it?
If 18 apples are arranged into
equal rows of 6 apples, how
many rows will there be?
Area example. A rectangle has
area 18 square centimeters. If
one side is 6 cm long, how long
is a side next to it?
Compare
A blue hat costs $6. A red hat costs 3
times as much as the blue hat. How
much does the red hat cost?
Measurement example. A rubber band
is 6 cm long. How long will the rubber
band be when it is stretched to be 3
times as long?
A red hat costs $18 and that is 3
times as much as a blue hat costs.
How much does a blue hat cost?
Measurement example. A rubber
band is stretched to be 18 cm long
and that is 3 times as long as it was
at first. How long was the rubber
band at first?
A red hat costs $18 and a blue hat
costs $6. How many times as much
does the red hat cost as the blue hat?
Measurement example. A rubber
band was 6 cm long at first. Now it
is stretched to be 18 cm long. How
many times as long is the rubber
band now as it was at first?
General a × b = ? a × ? = p, and p ÷ a = ? ? × b = p, and p ÷ b = ?
4The language in the array examples shows the easiest form of array problems. A harder form is to use the terms rows and columns: The apples in the grocery window are in 3 rows and 6 columns. How many apples are in
there? Both forms are valuable. 5Area involves arrays of squares that have been pushed together so that there are no gaps or overlaps, so array problems include these especially important measurement situations. 7The first examples in each cell are examples of discrete things. These are easier for students and should be given
before the measurement examples.

Mathematics
Table 3. The properties of operations. Here a, b and c stand for arbitrary numbers in a given number system. The properties of operations apply to
the rational number system, the real number system, and the complex number system.
Associative property of addition (a + b) + c = a + (b + c)
Commutative property of addition a + b = b + a
Additive identity property of 0 a + 0 = 0 + a = a
Existence of additive inverses For every a there exists –a so that a + (–a) = (–a) + a = 0.
Associative property of multiplication (a x b) x c = a x (b x c)
Commutative property of multiplication a x b = b x a
Multiplicative identity property of 1 a x 1 = 1 x a = a
Existence of multiplicative inverses For every a ≠ 0 there exists 1/a so that a x 1/a = 1/a x a = 1.
Distributive property of multiplication over addition a x (b + c) = a x b + a x c
Table 4. The properties of equality. Here a, b and c stand for arbitrary numbers in the rational, real, or complex number systems.
Reflexive property of equality a = a
Symmetric property of equality If a = b, then b = a.
Transitive property of equality If a = b and b = c, then a = c.
Addition property of equality If a = b, then a + c = b + c.
Subtraction property of equality If a = b, then a – c = b – c.
Multiplication property of equality If a = b, then a x c = b x c.
Division property of equality If a = b and c ≠ 0, then a c = b c.
Substitution property of equality If a = b, then b may be substituted for a
in any expression containing a.
Table 5. The properties of inequality. Here a, b and c stand for arbitrary numbers in the rational or real number systems.
Exactly one of the following is true: a < b, a = b, a > b.
If a > b and b > c then a > c.
If a > b, then b < a.
If a > b, then –a < –b.
If a > b, then a ± c > b ± c.
If a > b and c > 0, then a x c > b x c.
If a > b and c < 0, then a x c < b x c.
If a > b and c > 0, then a c > b c.
If a > b and c < 0, then a c < b c.

Mathematics
Sample of Works Consulted
Existing state standards documents.
Research summaries and briefs provided to the Working
Group by researchers.
National Assessment Governing Board, Mathematics
Framework for the 2009 National Assessment of
Educational Progress. U.S. Department of Education,
2008.
NAEP Validity Studies Panel, Validity Study of the NAEP
Mathematics Assessment: Grades 4 and 8. Daro et al.,
2007.
Mathematics documents from: Alberta, Canada; Belgium;
China; Chinese Taipei; Denmark; England; Finland; Hong
Kong; India; Ireland; Japan; Korea; New Zealand;
Singapore; Victoria (British Columbia).
Adding it Up: Helping Children Learn Mathematics.
National Research Council, Mathematics Learning Study
Committee, 2001.
Benchmarking for Success: Ensuring U.S. Students
Receive a World- Class Education. National Governors
Association, Council of Chief State School Officers, and
Achieve, Inc., 2008.
Crossroads in Mathematics (1995) and Beyond Crossroads
(2006). American Mathematical Association of Two-Year
Colleges (AMATYC).
Curriculum Focal Points for Prekindergarten through
Grade 8 Mathematics: A Quest for Coherence. National
Council of Teachers of Mathematics, 2006.
Focus in High School Mathematics: Reasoning and Sense
Making. National Council of Teachers of Mathematics.
Reston, VA: NCTM.
Foundations for Success: The Final Report of the National
Mathematics Advisory Panel. U.S. Department of
Education: Washington, DC, 2008.
Guidelines for Assessment and Instruction in Statistics
Education (GAISE) Report: A PreK-12 Curriculum
Framework.
How People Learn: Brain, Mind, Experience, and School.
Bransford, J.D., Brown, A.L., and Cocking, R.R., eds.
Committee on Developments in the Science of Learning,
Commission on Behavioral and Social Sciences and
Education, National Research Council, 1999.
Mathematics and Democracy, The Case for Quantitative
Literacy, Steen, L.A. (ed.). National Council on Education
and the Disciplines, 2001.
Mathematics Learning in Early Childhood: Paths Toward
Excellence and Equity. Cross, C.T., Woods, T.A., and
Schweingruber, S., eds. Committee on Early Childhood
Mathematics, National Research Council, 2009.
The Opportunity Equation: Transforming Mathematics and
Science Education for Citizenship and the Global
Economy. The Carnegie Corporation of New York and the
Institute for Advanced Study, 2009. Online:
http://www.opportunityequation.org/
Principles and Standards for School Mathematics. National
Council of Teachers of Mathematics, 2000.
The Proficiency Illusion. Cronin, J., Dahlin, M., Adkins,
D., and Kingsbury, G.G.; foreword by C.E. Finn, Jr., and
M. J. Petrilli. Thomas B. Fordham Institute, 2007.
Ready or Not: Creating a High School Diploma That
Counts. American Diploma Project, 2004.
A Research Companion to Principles and Standards for
School Mathematics. National Council of Teachers of
Mathematics, 2003.
Sizing Up State Standards 2008. American Federation of
Teachers, 2008.
A Splintered Vision: An Investigation of U.S. Science and
Mathematics Education. Schmidt, W.H., McKnight, C.C.,
Raizen, S.A., et al. U.S. National Research Center for the
Third International Mathematics and Science Study,
Michigan State University, 1997.
Stars By Which to Navigate? Scanning National and
International Education Standards in 2009. Carmichael,
S.B., Wilson. W.S, Finn, Jr., C.E., Winkler, A.M., and
Palmieri, S. Thomas B. Fordham Institute, 2009.
Askey, R., “Knowing and Teaching Elementary
Mathematics,” American Educator, Fall 1999.
Aydogan, C., Plummer, C., Kang, S. J., Bilbrey, C., Farran,
D. C., & Lipsey, M. W. (2005). An investigation of
prekindergarten curricula: Influences on classroom
characteristics and child engagement. Paper presented at
the NAEYC.
Blum, W., Galbraith, P. L., Henn, H-W. and Niss, M. (Eds)
Applications and Modeling in Mathematics Education,
ICMI Study 14. Amsterdam: Springer.
Brosterman, N. (1997). Inventing kindergarten. New York:
Harry N. Abrams.
Clements, D. H., & Sarama, J. (2009). Learning and
teaching early math: The learning trajectories approach.
New York: Routledge.
Clements, D. H., Sarama, J., & DiBiase, A.-M. (2004).
Clements, D. H., Sarama, J., & DiBiase, A.-M. (2004).
Engaging young children in mathematics: Standards for
early childhood mathematics education. Mahwah, NJ:
Lawrence Erlbaum Associates.
Cobb and Moore, “Mathematics, Statistics, and Teaching,”
Amer. Math. Monthly 104(9), pp. 801-823, 1997.
Confrey, J., “Tracing the Evolution of Mathematics
Content Standards in the United States: Looking Back and
Projecting Forward.” K12 Mathematics Curriculum
Standards conference proceedings, February 5-6, 2007.
Conley, D.T. Knowledge and Skills for University Success,
2008.
Conley, D.T. Toward a More Comprehensive Conception
of College Readiness, 2007.
Cuoco, A., Goldenberg, E. P., and Mark, J., “Habits of
Mind: An Organizing Principle for a Mathematics
Curriculum,” Journal of Mathematical Behavior, 15(4),
375-402, 1996.

Mathematics
Carpenter, T. P., Fennema, E., Franke, M. L., Levi, L., &
Empson, S. B. (1999). Children’s Mathematics:
Cognitively Guided Instruction. Portsmouth, NH:
Heinemann.
Van de Walle, J. A., Karp, K., & Bay-Williams, J. M.
(2010). Elementary and Middle School Mathematics:
Teaching Developmentally (Seventh ed.). Boston: Allyn
and Bacon.
Ginsburg, A., Leinwand, S., and Decker, K., “Informing
Grades 1-6 Standards Development: What Can Be Learned
from High-Performing Hong Kong, Korea, and
Singapore?” American Institutes for Research, 2009.
Ginsburg et al., “What the United States Can Learn From
Singapore’s World- Class Mathematics System (and what
Singapore can learn from the United States),” American
Institutes for Research, 2005.
Ginsburg et al., “Reassessing U.S. International
Mathematics Performance: New Findings from the 2003
TIMMS and PISA,” American Institutes for Research,
2005.
Ginsburg, H. P., Lee, J. S., & Stevenson- Boyd, J. (2008).
Mathematics education for young children: What it is and
how to promote it. Social Policy Report, 22(1), 1-24.
Harel, G., “What is Mathematics? A Pedagogical Answer
to a Philosophical Question,” in R. B. Gold and R. Simons
(eds.), Current Issues in the Philosophy of Mathematics
from the Perspective of Mathematicians. Mathematical
Association of America, 2008.
Henry, V. J., & Brown, R. S. (2008). First grade basic
facts: An investigation into teaching and learning of an
accelerated, high-demand memorization standard. Journal
for Research in Mathematics Education, 39, 153-183.
Howe, R., “From Arithmetic to Algebra.”
Howe, R., “Starting Off Right in Arithmetic,”
http://math.arizona.edu/~ime/2008-
09/MIME/BegArith.pdf.
Jordan, N. C., Kaplan, D., Ramineni, C., and Locuniak, M.
N., “Early math matters: kindergarten number competence
and later mathematics outcomes,” Dev. Psychol. 45, 850–
867, 2009.
Kader, G., “Means and MADS,” Mathematics Teaching in
the Middle School, 4(6), 1999, pp. 398-403.
Kilpatrick, J., Mesa, V., and Sloane, F., “U.S. Algebra
Performance in an International Context,” in Loveless (ed.),
Lessons Learned: What International Assessments Tell Us
About Math Achievement. Washington, D.C.: Brookings
Institution Press, 2007.
Leinwand, S., and Ginsburg, A., “Measuring Up: How the
Highest Performing State (Massachusetts) Compares to the
Highest Performing Country (Hong Kong) in Grade 3
Mathematics,” American Institutes for Research, 2009.
Niss, M., “Quantitative Literacy and Mathematical
Competencies,” in Quantitative Literacy: Why Numeracy
Matters for Schools and Colleges, Madison, B. L., and
Steen, L.A. (eds.), National Council on Education and the
Disciplines. Proceedings of the National Forum on
Quantitative Literacy held at the National Academy of
Sciences in Washington, D.C., December 1-2, 2001.
Pratt, C. (1948). I learn from children. New York: Simon
and Schuster.
Reys, B. (ed.), The Intended Mathematics Curriculum as
Represented in State-Level Curriculum Standards:
Consensus or Confusion? IAP-Information Age Publishing,
2006.
Sarama, J., & Clements, D. H. (2009). Early childhood
mathematics education research: Learning trajectories for
young children. New York: Routledge.
Schmidt, W., Houang, R., and Cogan, L., “A Coherent
Curriculum: The Case of Mathematics,” American
Educator, Summer 2002, p. 4.
Schmidt, W.H., and Houang, R.T., “Lack of Focus in the
Intended Mathematics Curriculum: Symptom or Cause?” in
Loveless (ed.), Lessons Learned: What International
Assessments Tell Us About Math Achievement.
Washington, D.C.: Brookings Institution Press, 2007.
Steen, L.A., “Facing Facts: Achieving Balance in High
School Mathematics.” Mathematics Teacher, Vol. 100.
Special Issue.
Wu, H., “Fractions, decimals, and rational numbers,” 2007,
http://math.berkeley. edu/~wu/ (March 19, 2008).
Wu, H., “Lecture Notes for the 2009 Pre-Algebra Institute,”
September 15, 2009.
Wu, H., “Pre-service professional development of
mathematics teachers,”
http://math.berkeley.edu/~wu/pspd2.pdf.
Massachusetts Department of Education. Progress Report
of the Mathematics Curriculum Framework Revision Panel,
Massachusetts Department of Elementary and Secondary
Education, 2009.
www.doe.mass.edu/boe/docs/0509/item5_report.pdf
ACT College Readiness Benchmarks™
ACT College Readiness Standards™
ACT National Curriculum Survey™
Adelman, C., The Toolbox Revisited: Paths to Degree
Completion From High School Through College, 2006.
Advanced Placement Calculus, Statistics and Computer
Science Course Descriptions. May 2009, May 2010.
College Board, 2008.
Aligning Postsecondary Expectations and High School
Practice: The Gap Defined (ACT: Policy Implications of
the ACT National Curriculum Survey Results 2005-2006).
Condition of Education, 2004: Indicator 30, Top 30
Postsecondary Courses, U.S. Department of Education,
2004.
Condition of Education, 2007: High School Course-Taking.
U.S. Department of Education, 2007.
Crisis at the Core: Preparing All Students for College and
Work, ACT.
Achieve, Inc., Florida Postsecondary Survey, 2008.
Golfin, Peggy, et al. CNA Corporation. Strengthening
Mathematics at the Postsecondary Level: Literature Review
and Analysis, 2005.

Mathematics
Camara, W.J., Shaw, E., and Patterson, B. (June 13, 2009).
First Year English and Math College Coursework. College
Board: New York, NY (Available from authors).
CLEP Precalculus Curriculum Survey: Summary of
Results. The College Board, 2005.
College Board Standards for College Success: Mathematics
and Statistics. College Board, 2006.
Miller, G.E., Twing, J., and Meyers, J. “Higher Education
Readiness Component (HERC) Correlation Study.” Austin,
TX: Pearson.
On Course for Success: A Close Look at Selected High
School Courses That Prepare All Students for College and
Work, ACT.
Out of Many, One: Towards Rigorous Common Core
Standards from the Ground Up. Achieve, 2008.
Ready for College and Ready for Work: Same or Different?
ACT.
Rigor at Risk: Reaffirming Quality in the High School Core
Curriculum, ACT.
The Forgotten Middle: Ensuring that All Students Are on
Target for College and Career Readiness before High
School, ACT.
Achieve, Inc., Virginia Postsecondary Survey, 2004.
ACT Job Skill Comparison Charts.
Achieve, Mathematics at Work, 2008.
The American Diploma Project Workplace Study. National
Alliance of Business Study, 2002.
Carnevale, Anthony and Desrochers, Donna. Connecting
Education Standards and Employment: Course-taking
Patterns of Young Workers, 2002.
Colorado Business Leaders’ Top Skills, 2006.
Hawai’i Career Ready Study: access to living wage careers
from high school, 2007.
States’ Career Cluster Initiative. Essential Knowledge and
Skill Statements, 2008.
ACT WorkKeys Occupational Profiles™.
Program for International Student Assessment (PISA),
2006.
Trends in International Mathematics and Science Study
(TIMSS), 2007.
International Baccalaureate, Mathematics Standard Level,
2006.
University of Cambridge International Examinations:
General Certificate of Secondary Education in
Mathematics, 2009.
EdExcel, General Certificate of Secondary Education,
Mathematics, 2009.
Blachowicz, Camille, and Fisher, Peter. “Vocabulary
Instruction.” In Handbook of Reading Research, Volume
III, edited by Michael Kamil, Peter Mosenthal, P. David
Pearson, and Rebecca Barr, pp. 503-523. Mahwah, NJ:
Lawrence Erlbaum Associates, 2000.
Gándara, Patricia, and Contreras, Frances. The Latino
Education Crisis: The Consequences of Failed Social
Policies. Cambridge, Ma: Harvard University Press, 2009.
Moschkovich, Judit N. “Supporting the Participation of
English Language Learners in Mathematical Discussions.”
For the Learning of Mathematics 19 (March 1999): 11-19.
Moschkovich, J. N. (in press). Language, culture, and
equity in secondary mathematics classrooms. To appear in
F. Lester & J. Lobato (ed.), Teaching and Learning
Mathematics: Translating Research to the Secondary
Classroom, Reston, VA: NCTM.
Moschkovich, Judit N. “Examining Mathematical
Discourse Practices,” For the Learning of Mathematics 27
(March 2007): 24-30.
Moschkovich, Judit N. “Using Two Languages when
Learning Mathematics: How Can Research Help Us
Understand Mathematics Learners Who Use Two
Languages?” Research Brief and Clip, National Council of
Teachers of Mathematics, 2009
http://www.nctm.org/uploadedFiles/Research_News_and_
Advocacy/Research/Clips_and_Briefs/Research_brief_12_
Using_2.pdf. (accessed November 25, 2009).
Moschkovich, J.N. (2007) Bilingual Mathematics Learners:
How views of language, bilingual learners, and
mathematical communication impact instruction. In Nasir,
N. and Cobb, P. (eds.), Diversity, Equity, and Access to
Mathematical Ideas. New York: Teachers College Press,
89-104.
Schleppegrell, M.J. (2007). The linguistic challenges of
mathematics teaching and learning: A research review.
Reading & Writing Quarterly, 23:139-159.
Individuals with Disabilities Education Act (IDEA), 34
CFR §300.34 (a). (2004).
Individuals with Disabilities Education Act (IDEA), 34
CFR §300.39 (b)(3). (2004).
Office of Special Education Programs, U.S. Department of
Education. “IDEA Regulations: Identification of Students
with Specific Learning Disabilities,” 2006.
Thompson, S. J., Morse, A.B., Sharpe, M., and Hall, S.,
“Accommodations Manual: How to Select, Administer and
Evaluate Use of Accommodations and Assessment for
Students with Disabilities,” 2nd Edition. Council of Chief
State School Officers, 200

Mathematics
NQ = Number and Quantity A = Algebra F = Functions M = Modeling G= Geometry S= Statistics and Probability