Embed Size (px)
Citation preview

Guidebook on Activity-Based Travel Demand Modeling for
Planners

Table of Contents
1. INTRODUCTION......................................................................................................... 1
1.1 TRIP-BASED APPROACH ............................................................................................. 1
1.2 ACTIVITY-BASED APPROACH ...................................................................................... 7
2. WHAT CHARACTERIZES THE DAILY ACTIVITY-TRAVEL PATTERN OF AN INDIVIDUAL? ......................................................................................................... 10
2.1 ACTIVITY-TRAVEL PATTERNS OF WORKERS............................................................. 11
2.2 ACTIVITY-TRAVEL PATTERNS OF NON-WORKERS.................................................... 13
3. DATA NEEDS FOR ACTIVITY-BASED TRAVEL ANALYSIS......................... 15
3.1 DATA REQUIREMENTS FOR ANALYSIS....................................................................... 15
3.1 DATA REQUIREMENTS FOR APPLICATION.................................................................. 16
4. FRAMEWORK FOR AN ACTIVITY-BASED MODELING SYSTEM.............. 17
4.1 THE GENERATION-ALLOCATION MODEL SYSTEM.................................................... 18
4.2 THE SCHEDULING MODEL SYSTEM FOR WORKERS.................................................... 20
4.2 THE SCHEDULING MODEL SYSTEM FOR NON-WORKERS............................................ 22
5. CONCLUSION ........................................................................................................... 23
APPENDIX A. COMPONENTS OF MODEL SYSTEM ........................................... 24
REFERENCES................................................................................................................ 26
ii

List of Figures
FIGURE 1. FOUR-STEP TRIP-BASED APPROACH ..................................................................... 2
FIGURE 2. TRIP SEQUENCING AND INTER-RELATIONSHIP IN ATTRIBUTES OF LINKED TRIPS... 3
FIGURE 3. TEMPORAL SUBSTITUTION OF TRIPS..................................................................... 4
FIGURE 4. SECONDARY EFFECTS OF POLICY ACTIONS........................................................... 5
FIGURE 5. RESOURE SHARING - LINKAGES AMONG TRIPS OF HOUSEHOLD MEMBERS ............ 5
FIGURE 6. DURATION AND TIMING OF ACTIVITIES AND TRIPS ............................................... 6
FIGURE 7. DIAGRAMMATIC REPRESENTATION OF WORKER ACTIVITY-TRAVEL PATTERN.... 12
FIGURE 8. DIAGRAMMATIC REPRESENTATION OF THE ACTIVITY-TRAVEL PATTERN OF NON-WORKERS ................................................................................................................... 13
FIGURE 9. OVERALL MODELING FRAMEWORK.................................................................... 18
FIGURE 10. THE GENERATION-ALLOCATION MODEL SYSTEM ............................................. 20
FIGURE 11. THE SCHEDULING MODEL SYSTEM FOR WORKERS: (A) PATTERN-LEVEL SUB-SYSTEM, (B) TOUR-LEVEL SUB-SYSTEM, AND (C) STOP-LEVEL SUB-SYSTEM ............... 21
iii

1. Introduction Since the beginning of civilization, the viability and economic success of
communities have been, to a major extent, determined by the efficiency of the
transportation infrastructure. To make informed transportation infrastructure planning
decisions, planners and engineers have to be able to forecast the response of
transportation demand to changes in the attributes of the transportation system and
changes in the attributes of the people using the transportation system. Travel demand
models are used for this purpose; specifically, travel demand models are used to predict
travel characteristics and usage of transport services under alternative socioeconomic
scenarios, and for alternative transport service and land-use configurations.
The need for realistic representations of behavior in travel demand modeling is
well acknowledged in the literature. This need is particularly acute today as emphasis
shifts from evaluating long-term investment-based capital improvement strategies to
understanding travel behavior responses to shorter-term congestion management policies
such as alternate work schedules, telecommuting, and congestion-pricing. The result has
been an increasing realization in the field that the traditional statistically-oriented trip-
based modeling approach to travel demand analysis needs to be replaced by a more
behaviorally-oriented activity-based modeling approach.
1.1 TRIP-BASED APPROACH
The conventional approach to transportation planning has involved the four-step
trip-based methodology. The trip-based approach (also known as the Urban
Transportation Modeling System or UTMS) uses individual trips as the unit of analysis
1

and usually includes four sequential steps as shown in Figure 1: trip generation, trip
distribution, mode choice, and traffic assignment.
Trip Generation(frequency)
Figure 1. Four-step trip-based approach
A fundamental conceptual problem with the trip-based approach is the use of trips
as the unit of analysis. Separate models are developed for home-based trips and non-
home based trips, without consideration of dependence among such trips. Further, the
organization (scheduling) of trips is not considered and the resulting inter-relationship in
the attributes of multiple trips is ignored in all steps of the trip-based method. Take, for
example, an individual who drives alone to work and makes a shopping stop on the way
back home from work (refer Figure 2). The Home-Work and Work-Home trips in this
scenario are not independent. So in the face of transit improvements, the trip-based
approach would over-predict a shift to transit since such a shift may not occur in reality
given that the person is constrained to making a stop on the Work-Home trip.
Mode Split(mode)
Traffic Assignment(route)
Trip Distribution(destination)
2

Drive alone
Figure 2. Trip sequencing and inter-relationship in attributes of linked trip
Another issue with the focus of the trip-based approach being the trips rathe
the activities that motivate them is the difficulty in justifying this from a beha
standpoint. It is unlikely that households will determine the number of home-based
and the number of non-home based trips separately. Rather, the needs of the house
are likely to be translated into a certain number of total activity stops by pu
followed by (or jointly with) decisions regarding how the stops are best organize
failure to recognize any trip as a part of an overall daily scheme may cause the effec
planning option to be overstated. For example, any policy that suppresses stop-m
during the evening commute could result in the generation of another stop in the ev
after returning home from work (see Figure 3). Such temporal redistribution of trip
result of policy actions cannot be captured by trip-based methodologies. The trip-
approach similarly ignores spatial linkages between the trips made by an individua
important to acknowledge that the location of a stop in a multi-stop sojourn (or to
likely to be affected by the location of other stops on the tour.
Home
Shopping
Transit Improvements
Drive alone Drive alone
3
Work
s
r than
vioral
trips
holds
rpose
d. So
t of a
aking
ening
s as a
based
l. It is
ur) is

HomeHome Work Shop
HomeHome Shop Home Work
Figure 3. Temporal substitution of trips
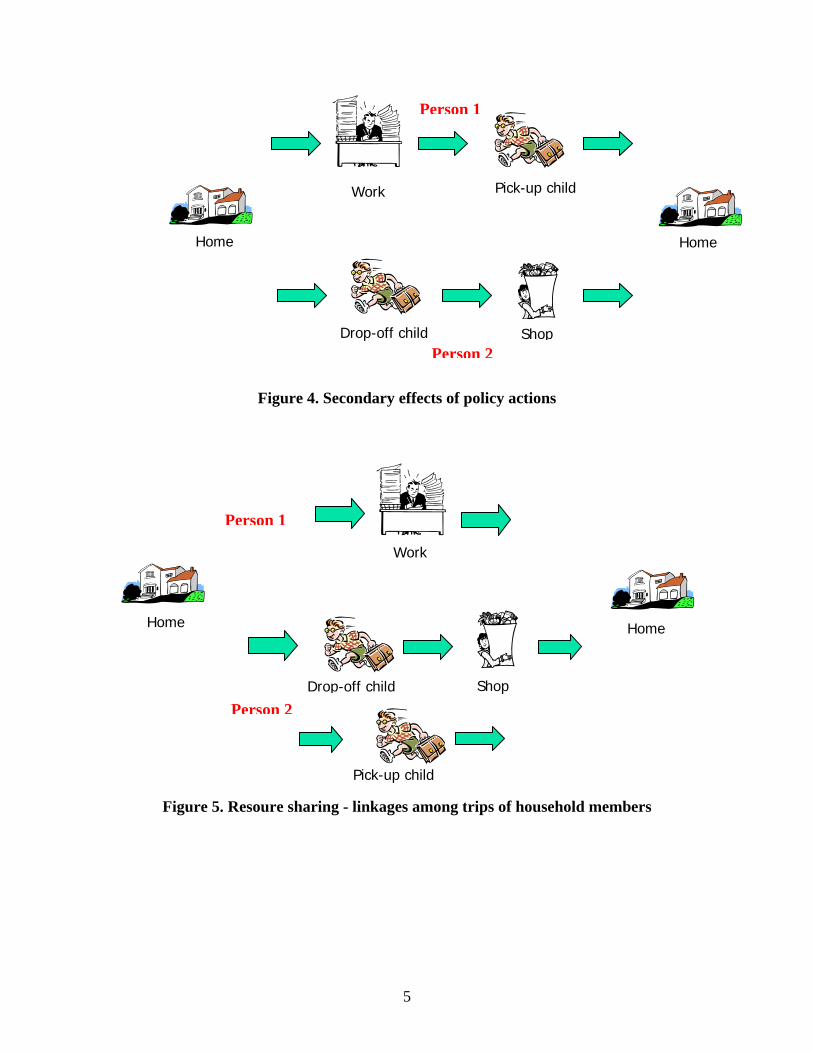
Trip-based methodologies also ignore interactions among household members,
thus failing to capture linkages among trips of household members. As a result policy
actions (for example, a congestion pricing scheme) could have unexpected secondary
effects as seen in Figure 4. Person 1 (the worker) might stop dropping the child off at
school in the mornings but now person 2 (the non-worker) takes up that chore, and in
addition to dropping the child off in the morning generates a shopping trip which might
not have occurred otherwise. Another possibility is that person 1 might be completely
absolved of both the drop-off and pick-up tasks. But now person 2 not only generates the
drop-off and shopping trips in the morning, but also a pick-up trip in the evening (see
Figure 5). Such complex results of policy actions cannot be captured by the simple and
statistical approach of trip-based methods, which essentially work at the aggregate level
and not at the more behavioral and disaggregate individual level.
4
Person 1
Pick-up child Work
Figure 4. Secondary effects of policy actions
Figure 5. Resoure sharing - linkages among trips of household members
Drop-off child Shop
Home Home
Person 2
Person 1
Work
Home Home
Shop Drop-off child
Person 2
Pick-up child
5

The duration and timing of trips are also important factors that can play a crucial
role in the effects of a policy action. These factors are not considered explicitly by the
trip-based approach in which time is simply represented as the ‘cost’ of making a trip.
Take the example of a worker who typically leaves work at 5:00PM, drives to a grocery
15 minutes away, spends about 25 minutes shopping, and then gets back home by
6:00PM. An early release from work strategy designed by the employer might be
expected to get the person off the road and back home by 5:00PM, before the peak hour
as seen in Figure 6. But the individual, now released from work by 4:00PM and finding
more time on his hands than usual, might decide to drive a longer distance to a preferred
grocery where he spends more time shopping (70 minutes as against 25 minutes) and
eventually returns home only at 6:00PM. So not only is the policy ineffective in keeping
the person off the road during the peak hour, but also the longer time spent at the grocery
has definite air quality implications.
5:15 pm 5:40 pm
Figure 6. Duration and timing of activities and trips
Cold Start
6:00 pm
Work
4:00 pm 4:15 pm
Shop
4:40 pm 5:00 pm
Shop
4:30 pm 5:40 pm
Warm StartShop
6
Home
5:00 pm
4:00 pm
6:00 pm

To summarize, the trip-based approach ignores the linkages among trips over
space, time and among different persons within a household. The key to these linkages is
the activity participation behavior. As a result the activity-based approach to demand
analysis has gained popularity and shown rapid development in the last few decades.
1.2 ACTIVITY-BASED APPROACH
The activity-based approach to travel demand analysis views travel as a derived
demand; derived from the need to pursue activities distributed in space (see Jones et al.,
1990 or Axhausen and Gärling, 1992). The approach adopts a holistic framework that
recognizes the complex interactions between activity and travel behavior. The conceptual
appeal of this approach originates from the realization that the need and desire to
participate in activities is more basic than the travel that some of these participations may
entail. By placing primary emphasis on activity participation and focusing on sequences
or patterns of activity behavior (using the whole day or longer periods of time as the unit
of analysis), such an approach can address congestion-management issues through an
examination of how people modify their activity participations (for example, will
individuals substitute more out-of-home activities for in-home activities in the evening if
they arrived early from work due to a work-schedule change?).
The shift to an activity-based paradigm has also received impetus because of the
increased information demands placed on travel models by the 1990 Clean Air Act
Amendments (CAAAs). These amendments require the inclusion of transportation
control measures (TCMs) in transportation improvement programs for MPOs in heavily
polluted non-attainment areas and, by state law, for all non-attainment areas in California.
Some TCMs, such as high occupancy vehicle (HOV) lanes and transit extensions, can be
7

represented within the existing modeling framework; however, non-capital improvement
measures such as ridesharing incentives, congestion pricing, and employer-based demand
management schemes cannot be so readily represented (Deakin et al., 1993). The ability
to model both individual activity behavior and interpersonal linkages between
individuals, a core element of activity modeling, is required for the analysis of such TCM
proposals. The CAAAs also require travel demand models to provide (for the purpose of
forecasting mobile emission levels) link flows at a high level of resolution along the time
dimension (for example, every 30 minutes or an hour as opposed to peak-period and off-
peak period link flows) and also to provide the number of new vehicle trips (i.e., cold
starts) which begin during each time period. Because of the simplistic, “individual-trip”
focus of the trip-based models; they are not well-equipped to respond to these new
requirements (see report by Cambridge Systematics, Inc., 1994). Since the activity-based
approach adopts a richer, more holistic approach with detailed representation of the
temporal dimension, it is better suited to respond to the new requirements.
Activity-based travel analysis has seen considerable progress in recent years.
Several studies have focused extensively on the participation of individuals in single
activity episodes, and on one or more accompanying characteristics of the episode such
as duration, location, or the window of time in which the episode occurs. The effect of
household interdependencies on individual activity choice is represented in these models
in the form of simple measures such as presence of working spouse, number of adults,
and household structure. Researchers have also made significant attempts to broaden the
scope of earlier studies to examine activity episode patterns; that is, multiple activity
episodes and their sequence over a particular time-span, typically a day. Some of these
8

studies focus only on activity episode scheduling and consider the generation of activity
episodes and their attributes as exogenous inputs. Other studies analyze both activity
episode generation and scheduling, yielding more comprehensive activity-travel models.
Such comprehensive models can potentially replace the conventional trip-based travel
demand models (see Guo and Bhat, 2001, for a detailed review of the state-of-the-art in
activity-based research).
Our research at the University of Texas at Austin aims to advance the state-of-the-
art in daily activity-travel modeling. It represents one of the first attempts to
comprehensively model the activity-travel patterns of workers as well as non-workers in
a household. As part of this research, a simulation software called the “Comprehensive
Econometric Micro-simulator for Daily Activity-travel Patterns” (CEMDAP) is being
developed. As the name suggests, CEMDAP is a software implementation of a system of
econometric models that represent the decision-making behavior of individuals. The
software takes as input various land-use, socio-demographic, activity system, and
transportation level-of-service attributes and provides as output the complete daily
activity-travel patterns for each individual in the household.
This guidebook presents the activity-based approach to travel demand modeling
using CEMDAP. The rest of this guidebook is organized as follows. Section 2 presents a
representation framework for the activity-travel patterns of workers and non-workers, in
the process identifying the various attributes that need to be modeled. Section 3 discusses
the data needs for the analysis and application of activity-based model systems. Section 4
presents the modeling framework implemented within CEMDAP, and section 5
concludes the document.
9

2. What characterizes the daily activity-travel pattern of an individual?
Individuals make choices about different activities to be pursued during a day.
Travel may be required to participate in these activities. The sequence of activities and
travel that a person undertakes is defined as the individual’s activity-travel pattern for the
day. The objective of this section is to completely characterize the daily activity-travel
patterns of individuals.
The activity-travel pattern of an individual is characterized based on whether
she/he participates in an out-of-home mandatory (work/school) activity on the given day.
The activity pattern of workers rests on the regularity and the fixity of the work activity.
No such obvious fixity is present in the case of non-workers (retired people and
homemakers). Recognizing this critical difference, representations are developed
separately for workers and non-workers. The activity-travel patterns of students are
characterized by the regularity of the school activity, analogous to the fixity of the work
activity of the workers. The activity-travel patterns of students can, therefore, be
represented by a framework similar to that of workers and hereafter the term ‘worker’
refers also to the school-goers. For both the worker and non-worker representations, we
consider 3 a.m. as the beginning of the day and assume that the individual is at home
during this time. The following discussion of activity-travel representations for workers
and non-workers is drawn from earlier works by Bhat and Singh (2000) and Bhat and
Misra (2000).
10

2.1 ACTIVITY-TRAVEL PATTERNS OF WORKERS
The daily pattern of workers is characterized by five different sub patterns: a) The
pattern before the work commute (referred to as Before-Work or BW pattern), which
represents the activity-travel undertaken before leaving home to work; b) The Home-
Work commute pattern (referred to as HW pattern), which represents the activity-travel
pursued during the home-to-work commute; c) The work-based pattern (referred to as
WB pattern), which includes all activity and travel undertaken from work; d) The Work-
Home commute pattern (referred to as WH pattern, which represents the activity-travel
pursued during the work-to-home commute; and e) The post home arrival pattern
(referred to as After-Work or AW pattern), which comprises the activity and travel
behavior of individuals after arriving home at the end of the work-to-home commute.
The home-to-work and work-to-home commute patterns are closely linked since the
travel mode for both these commutes will, in general, be the same, or at the very least
dependent. Within each of the BW, WB and AW patterns, there might be several tours.
A tour is a circuit that begins and ends at home for the BW and AW patterns and is a
circuit that begins and ends at work for WB pattern. Further, each tour within the BW,
WB and AW patterns may comprise several activity stops. Similarly, the HW and WH
commute patterns may also comprise several activity stops. Figure 7 provides a
diagrammatic representation of the worker activity-travel pattern in terms of the overall
pattern, the component tours and stops.
11

Home-Stay Duration
Work-Stay Duration
Home-Stay Duration
Home-Work Commute
...
3 a.m. onday d
Leave home for non-work
activities
Arrive back home
Leave for work
Arrive at work
Leave work
Before-Commute Pattern
Temporalfixity
Leave homefor non-work
activities
...
Work-based
Pattern
Post Home Arrival Pattern
Arrive back at work
Leave work
Arrive back home
Arrive back home
Temporalfixity
Home-Stay Duration
Home-Stay Duration
Work-Stay Duration
Work-Home Commute
Home-Stay Duration
Work-Stay Duration
Home-Stay Duration
Home-Work Commute
...
3 a.m. ond y d
Leave home for non-work
activities
Arrive back home
Leave for work
Arrive at work
Leave work
aBefore-
Commute Pattern
Temporalfixity
Leave homefor non-work
activities
...
Work-based
Pattern
Post Home Arrival Pattern
Arrive back at work
Leave work
Arrive back home
Arrive back home
Temporalfixity
Home-Stay Duration
Home-Stay Duration
Work-Stay Duration
Work-Home Commute
Figure 7. Diagrammatic representation of worker activity-travel pattern
The characterization of the complete workday activity-travel pattern is
accomplished by identifying a number of different attributes within the representation
discussed above. These attributes may be classified based on the level of representation
they are associated with: that is, whether they are associated with a pattern, a tour, or a
stop. Pattern-level attributes include the number of tours for the BW, WB and AW
patterns, and the home-stay duration before the HW commute pattern. Tour-level
attributes include the travel mode, number of stops, and home-stay duration before each
tour in the BW and AW patterns, work-stay duration before each tour in the WB pattern,
and the sequence of tours in each pattern. Stop-level attributes include activity type,
travel time from previous stop, location of stop, activity duration, and the sequence of the
stop in the tour.
12

2.2 ACTIVITY-TRAVEL PATTERNS OF NON-WORKERS
In the case of non-workers, the activity-travel pattern is considered as a set of out-
of-home activity episodes (or stops) of different types interspersed with in-home activity
stays. The chain of stops between two in-home activity episodes is referred to as a tour.
The pattern is represented diagrammatically in Figure 8. A non-worker's daily activity-
travel pattern is characterized again by attributes associated with the entire daily pattern,
a tour in the day, and a stop. Pattern-level attributes include whether or not the individual
makes any stops during the day, the number of stops of each activity type if the
individual leaves home during the day, and the sequencing of all episodes (both stops and
in-home episodes). The only tour-level attribute is the travel mode for the tour. Stop-
level attributes include the activity duration, travel time to stop from previous episode
(except for the first home-stay episode), and the location of out-of-home episodes (i.e.,
stops).
Morning Home-Stay Duration
3 a.m. on day d
Departure for First Stop (S1)
First Return-Home Episode
Home-Stay Duration before
2nd Tour
Departure for Third Stop (S3)
S1 S2
First Tour Activity Pattern
3 a.m. on day d+1
Last Home-Stay Duration
(M-1) th Return-Home Episode
Departure for (K-1) th Stop (SK-1)
M th Return-Home Episode
Home-Stay Duration before
Mth Tour
SK-1 SK
Mth Tour Activity Pattern
Figure 8. Diagrammatic representation of the activity-travel pattern of non-workers
13

The modeling of the activity-travel pattern of individuals entails the determination
of each of the attributes that characterize the three-level representation structure
described above. Due to the large number of attributes and the large number of possible
choice alternatives for each attribute, the joint modeling of all these attributes is
infeasible. Consequently, a modeling framework that is feasible to implement from a
practical standpoint is required. The framework adopted in CEMDAP is described in
section 4.
14
3. Data needs for activity-based travel analysis The previous section identifies the various attributes that characterize the activity-
travel patterns of individuals. Before we can take a look at the framework developed for
modeling all these attributes, it is appropriate to think about the data needs for such an
endeavor.
3.1 DATA REQUIREMENTS FOR ANALYSIS
The data required for analysis and estimation of activity-based travel demand
models can be elicited from conventional travel surveys. These surveys contain a lot of
information about the sequence of trips, time of day etc., which is not used in the four-
step process. However, in order to exploit the activity-based approach to the fullest extent
time-use survey data must be used. A time-use survey entails the collection of data
regarding all activities (in-home and out-of-home) pursued by individuals over the course
of a day (or multiple days). Travel constitutes the medium for transporting oneself
between spatially dis-located activity participations. The examination of both in-home
and out-of-home activities facilitates an understanding of how individuals substitute out-
of-home activities for in-home activities (or vice-versa) in response to changing travel
conditions. This, in turn, translates to an understanding of when trips are generated or
suppressed. As part of the time-use survey detailed household and individual socio-
demographic information must also be collected due to the disaggregate nature of the
activity-based approach.
It is important to note that administrating time-use surveys is similar to
administrating household travel surveys, except for the collection of in-home as well as
out-of-home activities. The information elicited from respondents is a little more
15
extensive in time-use surveys compared to travel surveys, but experience suggests that
the respondent burden or response rates are not significantly different between time-use
and travel surveys (see Lawton and Pas, 1996, for an extensive discussion). On the other
hand, such intensive scrutiny of data helps identify data inconsistencies which might go
unchecked in the trip-based approach (for example, there might be “gaps” in an
individual's travel diary because of non-reporting of several trips; these will be identified
during data preparation for activity analysis, but may not be identified in the trip-based
approach since it highlights individual trips and not the sequence between trips and
activities).
In addition to the survey data, the activity-based approach requires the usual land-
use and level-of-service attributes for the study-area. These together with the socio-
demographic data serve as exogenous variables to the econometric model system.
3.1 DATA REQUIREMENTS FOR APPLICATION
As opposed to the trip-based approach which requires aggregate zonal-level data,
the application of a micro-simulation based activity-travel modeling system (such as
CEMDAP) will require household and individual socio-demographic data for the entire
population of the study area. Population data of this magnitude and level of
disaggregation can be assembled in many ways. One such method is the synthetic
population generation technique. Bhat et al. (2003b) present the application of this
method to generating a synthetic population for the Dallas-Fort Worth metropolitan area
for the year 2000. In addition, the usual forecast year land-use and level-of-service
attributes will also be required.
16

4. Framework for an activity-based modeling system Computational process models (CPMs) and econometric models are the two most
common approaches adopted in the development of activity-based modeling systems.
Guo and Bhat (2001) discuss in detail several operational model systems and their
mechanisms. The model system embedded in CEMDAP adopts the econometric
modeling approach. The econometric modeling approach involves using systems of
equations to capture relationships among macroscopic indicators of activity and travel,
and to predict the probability of decision outcomes. These models explore how activity
and travel patterns are related to land use and socio-demographic characteristics of the
traveler. The main criticism of the econometric approach is that it does not explicitly
model the behavioral mechanisms underlying activity engagement and travel. This limits
the richness of the behavior theories that can be incorporated into the model system (refer
Kitamura, 1996)). Nevertheless, the family of econometric models - ranging from
discrete choice models, hazard duration models and limited-dependent variable models -
remains a powerful approach to activity-travel analysis. Its strength lies in allowing the
examination of alternative hypotheses about the causal relationships among behavioral
indicator.
The overall framework (see Figure 9) adopted in CEMDAP comprises of two
major components: the generation-allocation model system and the scheduling model
system. The purpose of the generation-allocation model system is to identify the
decisions of individuals to participate in activities, as motivated by both individual and
household needs. The scheduling system uses these decisions as input to model the
complete activity-travel pattern. Based on the distinction made between the
17

representations of worker and non-worker patterns, separate scheduling model systems
are proposed for workers and non-workers. Each of these model systems is described in
greater detail in the following subsections. Appendix A lists all the model components of
each of these model systems along with their econometric structures as prescribed in
CEMDAP. Also listed is a simple model structure that is supported for each model
component in the absence of an estimated model of the prescribed type. Refer Bhat et al.
(2002, 2003a) for further details on the conceptual and analysis frameworks.
Generation of activities in a HH
Allocation of activities in a HH
Scheduling
Figure 9. Overall modeling framework
4.1 THE GENERATION-ALLOCATION MODEL SYSTEM
The generation-allocation system models the decisions of the household adults to
participate in activities of different types during the day. As shown in Figure 10, the first
set of models in this system focus on the individual’s decision to participate in mandatory
activities such as work or school. For each employed adult in the household, the decision
Pattern-level decisions
Tour-level decisions
Stop-level decisions
Person 1 Person 2
Pattern-level decisions
Tour-level decisions
Stop-level decisions
18

to go to work is first determined. If the person decides to work (out of home) on the
given day, she or he is thereafter classified as a worker and the work-based duration and
work start-times are then determined. The decisions of students are similarly determined.
If a student decides to travel to school, she or he is treated as a worker for the remainder
of the modeling process.
The household’s decision to participate in shopping, personal business and
social/recreational activities is modeled next. This activity-generation group of models
captures the trade-offs made by a household in choosing to participate in different types
of activities for the day. If the household has only a single adult, activity allocation is
trivial. In the case of multi-adult households, the allocation of activities to individuals in
the household is modeled by the activity-allocation models, one for each activity type.
The last component in the generation-allocation model system is the ‘other’ activity
participation model, which determines the individual’s decision to participate in activities
such as eating out or pick-up/drop-off. This model is applied separately to each adult in
the household.
19

Decision to go to work
Work - based duration
Work start time
Decision to go to School
School - based duration
School start time
in the HH For each student
in the HH
HH’s decision to participate in (1) shopping (2) social/rec and (3) personal business activities
yes yes
Personal business activity allocation (If HH decides to participate in pers.
bus.. activity)
Social/recreational activity allocation(If HH decides to
participate in soc./rec. activity)
Shopping activity allocation
(If HH decides to participate in
shopping activity)
No No
Activity allocation trivial
Single - adult HH Multiple - adult HH
Individual’s decision to participate in any “other” activity
For each adult in the HH
For each worker
Figure 10. The generation-allocation model system
The application of the generation-allocation model system to a household will
yield as output the decision of each household adult to participate in different activities
such as work (only for employed persons), school (only for students), shopping,
social/recreational activities, personal business and ‘other’ activities. In addition, the
work/school start- and end-times will also be determined.
4.2 THE SCHEDULING MODEL SYSTEM FOR WORKERS
The scheduling model system for workers can be subdivided into three sequential
model systems: the pattern-level, the tour-level and the stop-level model systems. Each
of these sub-systems corresponds to one level in the daily activity-travel representation
framework.
20

The pattern-level sub-system for workers is presented in Figure 11. The attributes
of the WH commute are determined first. A model for number of stops is applied only if
the worker has decided to participate in activities other than work during the day. Next,
the HW commute is characterized. If work is the worker’s only activity for the day, the
characterization of the worker’s activity-travel pattern for the day is complete at this
point. However, if the worker has also decided to participate in other activities, the final
pattern-level model is applied to predict the worker’s decision to undertake a tour during
one or more of BW, WB and AW patterns.
WH commute mode and # stops
HW commute mode
HW commute stops
HW commute duration
during each period
WH commute mode and no stops
WH commute mode
WH commute stops
Joint mode/stops model Independent mode/stops modelWork is NOT the
only activity Work is the only activity
Work is NOT the only activity
Work is the
Modeling complete
WH commute duration
HW commute stops
decision to make a tour
WH commute stopsonly activity
Independent modelJoint model
Mode and stops
Stops
Home stay duration
before tour
Independent Model Joint Model
Location
(a) (b)
(c) Work is NOT the only activity
Work is the only activity
Work is NOT the only activity
Work is the only activity
Mode
Tour duration
Activity Type
Activity duration and travel time
Activity duration
Travel Time
Figure 11. The scheduling model system for workers: (a) pattern-level sub-system, (b) tour-level sub-system, and (c) stop-level sub-system
The modeling of the BW, WB and AW tours, if any, involves repeated
applications of the tour-level model system shown in Figure 11(b). The tour mode and
number of stops may be determined simultaneously using a joint model or sequentially
using independent models. Analogous to the modeling of tour-level attributes, stop
21

characteristics are determined by the stop-level model system (see Figure 11(c)), which is
applied for stops made during the WH and HW commutes first, followed by stops made
as a part of any other tour (BW/WB/AW). Within any tour or commute, the
characteristics of stops are determined sequentially from the first to the last stop.
4.2 THE SCHEDULING MODEL SYSTEM FOR NON-WORKERS
Analogous to the scheduling model system for workers, the scheduling model
system for non-workers can also be subdivided into three sequential sub-systems. If the
non-worker did not decide to participate in any activity during the day, there are no
scheduling decisions to be modeled, and the characterization of this person’s activity-
travel pattern is complete by noting that the person stays home all day. However, if the
non-worker decided to participate in one or more activity types for the day, the total
number of tours is determined. This is the only model in the pattern-level model system
for non-workers. The tour-level model system, identical to that for the workers (Figure
11(b)), is then applied sequentially to determine the characteristics of each of the tours.
Finally, the stop-level model system, again identical to that for the workers (Figure
11(c)), is applied sequentially to all the stops in each tour.
The conceptual framework presented above provides a “natural” way to visualize
the activity-travel generation of individuals within a household context. The generation-
allocation-scheduling approach captures inter-personal dependencies in terms of joint
activity participation and the delegation of tasks among the members of a household. It
also explicitly considers the sharing of autos in making trips.
22
5. Conclusion The activity-based approach to travel demand analysis views travel as a derived
demand; derived from the need to pursue activities distributed in space. A comprehensive
activity-based travel demand modeling system, such as the one developed at the
University of Texas at Austin (Comprehensive Econometric Micro-simulator for Daily
Activity-travel Patterns or CEMDAP), recognizes explicitly the spatial, temporal and
inter-personal constraints and inter-dependencies in activity and travel choices. It takes
into account a detailed consideration of the timing and duration of activities and travel,
and emphasizes the decision-making at the household level and the interactions among
household members. By placing primary emphasis on activity participation and focusing
on sequences or patterns of activity behavior (using the whole day or longer periods of
time as the unit of analysis), such an approach can better understand travel behavior
responses to shorter-term congestion management policies. Since the activity-based
approach adopts a richer, more holistic approach with detailed representation of the
temporal dimension, it is also better suited to respond to the new CAAAs requirements.
This guidebook presents the representation frameworks for the activity-travel
patterns of workers and non-workers, in the process identifying the various attributes that
need to be modeled. Following the representation frameworks is a brief discussion of the
data needs for the analysis and application of activity-based model systems. Finally, the
model system embedded in CEMDAP is described in detail. For more information on the
software processes and mechanisms underlying CEMDAP, and software deployment
procedures refer Bhat et al. (2003c).
23
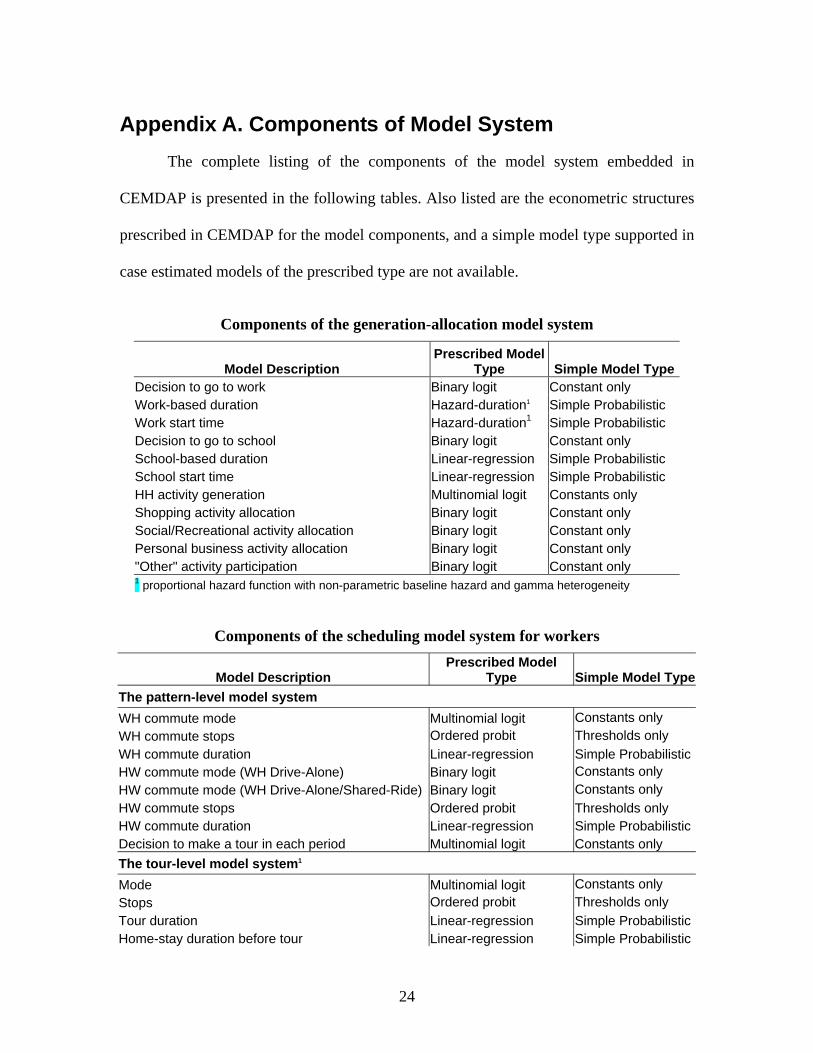
Appendix A. Components of Model System The complete listing of the components of the model system embedded in
CEMDAP is presented in the following tables. Also listed are the econometric structures
prescribed in CEMDAP for the model components, and a simple model type supported in
case estimated models of the prescribed type are not available.
Components of the generation-allocation model system
Model Description Prescribed Model
Type Simple Model TypeDecision to go to work Binary logit Constant only Work-based duration Hazard-duration1 Simple Probabilistic Work start time Hazard-duration1 Simple Probabilistic Decision to go to school Binary logit Constant only School-based duration Linear-regression Simple Probabilistic School start time Linear-regression Simple Probabilistic HH activity generation Multinomial logit Constants only Shopping activity allocation Binary logit Constant only Social/Recreational activity allocation Binary logit Constant only Personal business activity allocation Binary logit Constant only "Other" activity participation Binary logit Constant only 1 proportional hazard function with non-parametric baseline hazard and gamma heterogeneity
Components of the scheduling model system for workers
Model Description Prescribed Model
Type Simple Model TypeThe pattern-level model system WH commute mode Multinomial logit Constants only WH commute stops Ordered probit Thresholds only WH commute duration Linear-regression Simple ProbabilisticHW commute mode (WH Drive-Alone) Binary logit Constants only HW commute mode (WH Drive-Alone/Shared-Ride) Binary logit Constants only HW commute stops Ordered probit Thresholds only HW commute duration Linear-regression Simple ProbabilisticDecision to make a tour in each period Multinomial logit Constants only The tour-level model system1 Mode Multinomial logit Constants only Stops Ordered probit Thresholds only Tour duration Linear-regression Simple ProbabilisticHome-stay duration before tour Linear-regression Simple Probabilistic
24

The stop-level model system2 Activity type Multinomial logit Constants only Activity duration Linear-regression Simple ProbabilisticTravel time Linear-regression Simple ProbabilisticLocation Spatial location choice Multinomial logit 1 Separate models for each of the BW, WB and AW tours 2 Separate models for stops in each of WH and HW commutes and BW, WB, and AW tours
Components of the scheduling model system for non-workers
Model Description Prescribed Model
Type Simple Model TypeThe pattern-level model system Number of tours Ordered probit Thresholds only The tour-level model system1 Mode Multinomial logit Constants only Stops Ordered probit Ordered probit Tour duration Linear-regression Simple Probabilistic Home-stay duration before tour Linear-regression Simple Probabilistic The stop-level model system2 Activity type Multinomial logit Constants only Activity duration Linear-regression Simple Probabilistic Travel time Linear-regression Simple Probabilistic Location Spatial location choice Multinomial logit 1 Separate models for tours 1 2 3 and 4 2 Separate models for stops in each of tours 1 2 3 and 4
25
References Axhausen, K., and T. Gärling (1992). “Activity-based approaches to travel analysis:
conceptual frameworks, models and research problems,” Transport Reviews, 12,
324-341.
Bhat, C. R. and R. Misra (2000). “Nonworker activity-travel patterns: Organization of
activities”, presented at the 79th Annual Meeting of the Transportation Research
Board, Washington, D.C., January.
Bhat, C. R. and Singh, S. K. (2000). A comprehensive daily activity-travel generation model
system for workers. Transportation Research Part A, 34, 1-22.
Bhat, C.R, Srinivasan, S., and Guo, J.Y. (2002). Activity-based travel-demand modeling
for metropolitan areas in Texas: Data sources, sample formation and estimation
results. Research Report 4080-3, Center for Transportation Research, Austin,
Texas.
Bhat, C.R, Srinivasan, S., Guo, J.Y., and Sivakumar, A. (2003a). Activity-based travel-
demand modeling for metropolitan areas in Texas: A micro-simulation framework
for forecasting. Research Report 4080-4, Center for Transportation Research,
Austin, Texas.
Bhat, C.R., Zhao, H. and Sivakumar, A. (2003b). Synthetic population generation for
micro-simulation activity-based travel demand modeling systems, Technical
Document, University of Texas at Austin.
Bhat, C.R, Guo, J.Y., Srinivasan, S., and Sivakumar, A. (2003c). Activity-based travel-
demand modeling for metropolitan areas in Texas: Software-related processes and
26

mechanisms for the activity-travel pattern generation micro-simulator. Research
Report 4080-5, Center for Transportation Research, Austin, Texas.
Cambridge Systematics, Inc. (1994). Short-Term Travel Model Improvements, final
report (DOT-95-05), prepared for the U.S. Department of Transportation and U.S.
Environmental Protection Agency.
Deakin, Harvey, Skabardonis, Inc. (1993). Manual of Regional Transportation Modeling
Practice for Air Quality Analysis, The National Association of Regional Councils,
Washington, D.C.
Guo. J. Y., and Bhat, C. R. (2001) Representation and analysis plan and data needs
analysis for the activity-travel system. Research Report 4080-1, Center for
Transportation Research, Austin.
Jones, P.M., F.S. Koppelman, and J.P. Orfeuil (1990). “Activity analysis: state of the art
and future directions,” in Developments in Dynamic and Activity-Based
Approaches to Travel Analysis, Gower, Aldershot, England, 34-55.
Kitamura, R. (1996). “Applications of models of activity behavior for activity based
demand forecasting,” presented at the Activity-Based Travel Forecasting
Conference, New Orleans, Louisiana.
Lawton, T.K., and E.I. Pas (1996). Resource paper for survey methodologies workshop,
“Conference Proceedings on Household Travel Surveys: New Concepts and
Research Needs,” Transportation Research Board, National Research Council,
Washington, D.C.
27