Embed Size (px)
Citation preview

4Q | 20131Q | 20154Q | 2013As of September 30, 2013
1Q | 2015As of December 31, 2014
Guide to the Markets®Guide to the Markets®Guide to the MarketsGuide to the Markets
1

Global Market Insights Strategy Team
Americas Europe Asia
Dr. David P. Kelly, CFANew York
Stephanie H. FlandersLondon
Tai HuiHong Kong
Andrew D. GoldbergNew York
Maria Paola ToschiMilan
Geoff LewisHong Kong
Anastasia V. Amoroso, CFAHouston
Vincent JuvynsLuxembourg
Yoshinori ShigemiTokyo
James C Liu CFA Manuel Arroyo Ozores CFA Grace Tam CFAJames C. Liu, CFAChicago
Manuel Arroyo Ozores, CFAMadrid
Grace Tam, CFAHong Kong
Julio C. CallegariSão Paulo
Tilmann Galler, CFAFrankfurt
Ian HuiHong Kong
David M. Lebovitzk
David Stubbs, PhDd
Ben LukNew York London Hong Kong
Gabriela D. SantosNew York
Lucia GutierrezMadrid
Ainsley E. WoolridgeNew York
Kerry Craig, CFALondon
Hannah J. AndersonNew York
Alexander W. DrydenLondon
Abigail B. DwyerNew York
Nandini RamakrishnanLondon
2Past performance is no guarantee of comparable future results. For China and Australia distribution, please note this communication is for intended recipients only and is for wholesale clients only in Australia. For details, please refer to the full disclaimer at the end. Unless otherwise stated, all data is as of December 31, 2014 or most recently available.

Page Reference
4. S&P 500 Index at Inflection Points5. Returns and Valuations by Style6. Returns and Valuations by Sector
36. Fixed Income Yields and Returns37. Global Fixed Income38. Municipal Finance39. High Yield Bonds40. Emerging Market Debt
Equities Page 4
7. Stock Valuation Measures: S&P 500 Index8. Corporate Profits and Leverage9. Sources of Earnings per Share Growth10. Equity Performance in Bull Markets11. Interest Rates and Equities12. Deploying Corporate Cash13. Annual Returns and Intra-year Declines
41. Fixed Income Sector Returns
42. Global Equity Markets43. International Equity Earnings and Valuations44. Global Economic Growth45. Manufacturing Momentum
International Page 42
y14. Equity Correlations and Volatility15. Stock Market Since 1900
16. Economic Growth and the Composition of GDP17. Consumer Finances18. Credit Conditions
g46. Sovereign Debt Stresses47. Europe: Cyclical Headwinds and Tailwinds48. Europe: Unemployment, Inflation, and Credit Markets49. Japan: Economic Snapshot50. China: Economic and Credit Growth51. Demographics and Development52. Emerging Market Currencies
Economy Page 16
18. Credit Conditions19. Cyclical Sectors20. Residential Real Estate21. Long-term Drivers of Economic Growth22. Federal Finances23. Unemployment and Wages24. Labor Market Perspectives25 Employment and Income by Educational Attainment
52. Emerging Market Currencies53. Emerging Market Equities54. Global Equity Valuations: Developed Markets55. Global Equity Valuations: Emerging Markets
56. Asset Class Returns57 Correlations and Volatility
Asset Class Page 56
25. Employment and Income by Educational Attainment26. Inflation27. Trade and the U.S. Dollar28. Energy: Supply, Demand and Prices29. Energy Price Impacts30. Consumer Confidence and the Stock Market
57. Correlations and Volatility58. Alternative Asset Class Returns59. Fund Flows60. Yield Alternatives: Domestic and Global61. Global Real Assets62. Global Commodities63. Life Expectancy and Pension Shortfall64 Historical Returns by Holding PeriodFixed Income Page 31
3
31. Interest Rates and Inflation32. The Fed and Interest Rates33. Shape of the Yield Curve34. Global Monetary Policy35. Sources of Bond Returns
64. Historical Returns by Holding Period65. Diversification and the Average Investor66. Cash Accounts67. Corporate DB Plans and Endowments
g

S&P 500 Index at Inflection Points
2,200Index level 1,527 1,565 2,059P/E ratio (fwd ) 25 6x 15 2x 16 2x
S&P 500 Index
Dec. 31, 2014 P/E (fwd.) = 16.2x
2 059
Characteristic Mar-2000 Oct-2007 Dec-2014
Equi
ties
1,800
2,000
P/E ratio (fwd.) 25.6x 15.2x 16.2xDividend yield 1.1% 1.8% 1.9% 10-yr. Treasury 6.2% 4.7% 2.2%
Equi
ties
Mar 24 2000
2,059
Oct. 9, 2007 P/E (fwd ) = 15 2x
1,400
1,600
Mar. 24, 2000 P/E (fwd.) = 25.6x
1,527
+101%
P/E (fwd.) = 15.2x 1,565
+204%+106%
1,000
1,200
-49%
-57%+106%
'97 '98 '99 '00 '01 '02 '03 '04 '05 '06 '07 '08 '09 '10 '11 '12 '13 '14600
800 Oct. 9, 2002 P/E (fwd.) = 14.1x
777
Dec. 31, 1996 P/E (fwd.) = 16.0x
741 Mar. 9, 2009
P/E (fwd.) = 10.3x 677
4
97 98 99 00 01 02 03 04 05 06 07 08 09 10 11 12 13 14Source: Standard & Poor’s, First Call, Compustat, FactSet, J.P. Morgan Asset Management.
Dividend yield is calculated as the annualized dividend rate divided by price, as provided by Compustat. Forward Price to Earnings Ratio is a bottom-up calculation based on the most recent S&P 500 Index price, divided by consensus estimates for earnings in the next 12 months (NTM), and is provided by FactSet Market Aggregates. Returns are cumulative and based on S&P 500 Index price movement only, and do not include the reinvestment of dividends. Past performance is not indicative of future returns.
Guide to the Markets – U.S. Data are as of 12/31/14.

Returns and Valuations by Style
Value Blend Growth Value Blend Growth
4Q14 2014 Current P/E vs. 20-year avg. P/E
15.5 16.2 18.7
Value Blend Growth
e
Larg
e
5.0% 4.9% 4.8%
Larg
e
13.5% 13.7% 13.0%
Mid 6.1% 5.9% 5.8% Mid 14.7% 13.2% 11.9%Eq
uitie
s
15.5 16.2 18.7
14.0 16.1 21.0
16.4 18.6 20.0
14.2 16.5 21.9
Larg
Mid
Smal
l
9.4% 9.7% 10.1%Sm
all
4.2% 4.9% 5.6%
Since Market Low (March 2009)Since Market Peak (October 2007)Current P/E as % of 20-year avg. P/E
E.g.: Large Cap Blend stocks are fairly
16.4 18.1 20.0
14.5 17.3 21.5Smal
l
Value Blend Growth Value Blend Growth
Larg
e
42.1% 54.0% 70.1%
Larg
e
254.4% 244.2% 246.9%
d 68 5% 70 0% 69 6% d 330 1% 310 3% 292 0%
valued compared to historical average.Value Blend Growth
Larg
e
110.1% 100.6% 89.0%
Mid 68.5% 70.0% 69.6% Mid 330.1% 310.3% 292.0%
Smal
l
48.1% 57.6% 66.7%
Smal
l
266.2% 279.9% 293.3%
Mid 118.1% 112.7% 94.5%
Smal
l
113.1% 104.4% 93.3%
5
Source: Russell Investment Group, Standard & Poor’s, FactSet, J.P. Morgan Asset Management.All calculations are cumulative total return, including dividends reinvested for the stated period. Since Market Peak represents period 10/9/07 – 12/31/14, illustrating market returns since the S&P 500 Index high on 10/9/07. Since Market Low represents period 3/9/09 – 12/31/14, illustrating market returns since the S&P 500 Index low on 3/9/09. Returns are cumulative returns, not annualized. For all time periods, total return is based on Russell-style indexes with the exception of the large blend category, which is reflected by the S&P 500 Index. Past performance is not indicative of future returns. P/E ratios reflectlatest available data. Earnings estimates are as of November for Russell Indexes and as of December for Standard & Poor’s.Guide to the Markets – U.S. Data are as of 12/31/14.

Returns and Valuations by Sector
Financia
ls
Technology
Health C
areIndus
trials
Energy
Cons. Disc
r.Cons. S
taples
Teleco
m
Utilitie
s
Materia
ls
S&P 500 In
dexEq
uitie
s F T H In E C C T U M S
S&P Weight 16.6% 19.7% 14.2% 10.4% 8.4% 12.1% 9.8% 2.3% 3.2% 3.2% 100.0%Russell Growth Weight 5.3% 28.3% 14.2% 12.2% 4.5% 18.7% 10.5% 2.1% 0.1% 4.0% 100.0%
Russell Value Weight 29.9% 9.5% 13.7% 10.1% 11.3% 6.6% 7.4% 2.1% 6.4% 3.0% 100.0%
2014 15.2 20.1 25.3 9.8 -7.8 9.7 16.0 3.0 29.0 6.9 13.7
4Q14 7.2 5.2 7.5 6.8 -10.7 8.7 8.2 -4.2 13.2 -1.8 4.9
Wei
ght
%)
Since Market Peak (October 2007)
-19.6 78.6 118.7 52.4 16.9 115.8 112.3 22.5 54.0 33.5 54.0
Since Market Low (March 2009)
338.7 274.2 252.6 318.9 114.1 399.5 197.7 133.9 169.5 217.9 244.2
Beta to S&P 500 1.44 1.10 0.70 1.20 0.99 1.13 0.57 0.63 0.50 1.27 1.00 β
C l T Yi ld 0 20 0 03 0 16 0 17 0 29 0 06 0 19 0 21 0 50 0 12 0 04
Ret
urn
(
Correl to Treas. Yields 0.20 0.03 -0.16 0.17 0.29 0.06 -0.19 -0.21 -0.50 0.12 0.04 ρ
Forward P/E Ratio 13.6x 15.9x 17.2x 16.3x 16.5x 18.4x 19.1x 13.5x 17.4x 16.1x 16.2x15-yr avg. 12.7x 20.6x 17.3x 17.0x 13.6x 18.5x 18.4x 16.9x 14.0x 16.0x 16.1x
Trailing P/E Ratio 16.8x 19.3x 24.4x 17.9x 12.8x 21.0x 22.5x 10.9x 19.9x 19.1x 18.6x20-yr avg. 16.5x 26.0x 24.1x 20.3x 17.1x 19.3x 21.3x 19.8x 15.0x 19.5x 19.5x
Dividend Yield 1.8% 1.5% 1.4% 2.1% 2.9% 1.4% 2.5% 4.7% 3.5% 2.1% 1.9%
P/E
v
Source: Standard & Poor’s, Russell Investment Group, FactSet, J.P. Morgan Asset Management.All calculations are cumulative total return, not annualized, including dividends for the stated period. Since Market Peak represents period 10/9/07 – 12/31/14. Since Market Low represents period 3/9/09 – 12/31/14. Correlation to Treasury Yields are trailing 2-year monthly correlations between S&P 500 sector price returns and 10-year Treasury yield movements. Forward P/E Ratio is a bottom-up calculation based on the most recent S&P 500 Index price, divided by consensus estimates for earnings in the next 12 months (NTM), and is provided by FactSet Market Aggregates. Trailing P/E ratios are bottom-up values defined as month-end price divided by the last 12 months of available reported earnings. Historical data can change as new information becomes available. Note that P/E ratios for the S&P 500 may differ from estimates elsewhere in this book due to the use of a bottom-up calculation of constituent earnings (as
Dividend Yield 1.8% 1.5% 1.4% 2.1% 2.9% 1.4% 2.5% 4.7% 3.5% 2.1% 1.9%20-yr avg. 2.1% 0.7% 1.4% 1.7% 1.7% 0.9% 2.1% 4.2% 4.3% 2.1% 1.7% D
iv
6
Note that P/E ratios for the S&P 500 may differ from estimates elsewhere in this book due to the use of a bottom up calculation of constituent earnings (as described) rather than a top-down calculation. This methodology is used to allow proper comparison of sector level data to broad index level data. Dividend yields are bottom-up values defined as the annualized value of the most recent cash dividend as a percent of month-end price. Beta calculations are based on 10 years of monthly price returns for the S&P 500 and its sub-indices. Beta’s are calculated on a monthly frequency over the past 10-years.Past performance is not indicative of future returns.
Guide to the Markets – U.S.Data are as of 12/31/14.

Stock Valuation Measures: S&P 500 Index
U.S. Equity: Valuation Measures Historical AveragesValuation Measure Description
Latest 1-year ago
5-year avg
10-yearavg
25-year avg *Measure Description ago avg. avg. avg.
P/E Price to Earnings 16.2x 15.4x 13.5x 13.8x 15.6xCAPE Shiller's P/E 27.3 25.5 22.5 22.9 25.3Div. Yield Dividend Yield 1.9% 1.9% 2.0% 2.0% 2.1%REY Real Earnings Yield 3.7% 3.7% 4.3% 3.3% 2.3%P/B P i t B k 2 9 2 7 2 3 2 4 2 9
Equi
ties
P/B Price to Book 2.9 2.7 2.3 2.4 2.9P/CF Price to Cash Flow 11.4 10.8 9.3 9.7 11.3EY Spread EY Minus Baa Yield 1.5% 1.6% 2.2% 1.3% -0.7%
S&P 500 Earnings Yield vs. Baa Bond YieldS&P 500 Index: Forward P/E Ratio
18x
20x
22x
24x
26x
8%
10%
12%
14%
S&P 500 Earnings Yield (Inverse of fwd. P/E): 6.2%
Current: 16.2x
'90 '92 '94 '96 '98 '00 '02 '04 '06 '08 '10 '12 '148x
10x
12x
14x
16x
'90 '92 '94 '96 '98 '00 '02 '04 '06 '08 '10 '12 '142%
4%
6%
8%
Moody’s Baa Yield: 4.7%
Average: 15.6x
7
90 92 94 96 98 00 02 04 06 08 10 12 14 90 92 94 96 98 00 02 04 06 08 10 12 14Source: Standard & Poor’s, FactSet, Robert Shiller Data, FRB, J.P. Morgan Asset Management. Price to Earnings is price divided by consensus analyst estimates of earnings per share for the next 12 months. Shiller’s P/E uses trailing 10-years of inflation adjusted earnings as reported by companies. Dividend Yield is calculated as the trailing 12-month average dividend divided by price. Real Earnings Yield is defined as (trailing four quarters of reported earnings/price) - year over year core CPI inflation. Price to Book Ratio is the price divided by book value per share. Price to Cash Flow is price divided by NTM cash flow. EY Minus Baa Yield is the forward earnings yield (consensus analyst estimates of EPS over the next 12 months divided by price) minus the Moody’s Baa seasoned corporate bond yield. *P/CF is a 20-year avg. due to cash flow data availability.Guide to the Markets – U.S. Data are as of 12/31/14.

Corporate Profits and Leverage
$31
S&P 500 Earnings Per Share and PerformanceIndex level and quarterly operating earnings
Profit Margins
4Q14*: $30.50 10%
11%
S&P 500 Operating EPS % of Sales per Share**After-Tax Adj Corp Profits % of GDP
3Q14*:10.1%
$23
$27
Equi
ties
2Q07: $24.06
6%
7%
8%
9%
3Q14:8.8%
After-Tax, Adj. Corp. Profits, % of GDP
$15
$19
Total LeverageS&P 500 ratio of total debt to total equity quarterly
4%
5%
'60 '65 '70 '75 '80 '85 '90 '95 '00 '05 '10
$7
$11
160%
180%
200%
220%S&P 500, ratio of total debt to total equity, quarterly
A 162%
-$1
$3
'01 '02 '03 '04 '05 '06 '07 '08 '09 '10 '11 '12 '13 '14'96 '98 '00 '02 '04 '06 '08 '10 '12 '14
80%
100%
120%
140%4Q14: 100%
Average: 162%
8
Source: BEA, Standard & Poor’s, Compustat, J.P. Morgan Asset Management.EPS levels are based on operating earnings per share. *Most recently available data is 3Q14 as 4Q14 is a Standard & Poor’s preliminary estimate. **S&P 500 Operating EPS % of Sales per Share fell to 0% in 4Q2008 and is adjusted on the chart. Past performance is not indicative of future returns. Guide to the Markets – U.S.Data are as of 12/31/14.
96 98 00 02 04 06 08 10 12 14

Sources of Earnings per Share Growth
50%
S&P 500 Year-Over-Year EPS GrowthGrowth broken into revenue, changes in profit margin & changes in share count
Share of EPS Growth 3Q14*
20%
30%
40%
Equi
ties
QMargin 3.6%Revenue 6.3%Share count 0.1%
0%
10%
20%
-30%
-20%
-10%
-50%
-40%
3Q143Q123Q103Q083Q063Q043Q023Q003Q983Q963Q94
9
Source: Standard & Poor’s, Compustat, J.P. Morgan Asset Management.EPS levels are based on operating earnings per share. *Most recently available data is 3Q14. Past performance is not indicative of future returns. 4Q2008, 1Q2010 and 2Q2010 reflect -101%, 92% and 51% growth in operating earnings, and are adjusted on the chart. Guide to the Markets – U.S.Data are as of 12/31/14.

Equity Performance in Bull Markets
83% 84%90%% of days during bull markets the S&P 500 is at and near record highs
S&P 500 Performance and Average Valuation S&P 500 Levels Near Market HighsPrice returns to peak after crossing average real earnings yield
Returns to peak price after average valuation300%
78%
60%
70%
80%
Equi
ties 1991-2000
2002-20072009-Today
p p gReturns before markets pass average valuation
*
“Average valuation” is defined as the average real earnings yield of the S&P 0%
240%
36%
42%40%
50%
60%500 from 1963 until today
49%
83%180%
13%
33%
11%
17%20%
30%
16%
30%4%
0%
60%
120%
0%
10%
New High Within 1% Within 5%
Start of Bull MarketPercent of days during a Bull Market
spent at record highs or within a 1% or 5% range of the record high
29% 49% 73% 121% 59% 180% 101% 204%
15%
0%'66 '70 '74 '82 '87 '90 '02 '09
10
Source: Standard & Poor’s, J.P. Morgan Asset Management. Valuations are based on real earnings yield for the S&P 500 which is defined as (trailing four quarters of reported earnings/price) - year over year core CPI inflation. Period after average valuation defined by 15-day moving average passing below average real earnings yield. *As depicted on the left hand chart, the return to peak price for the current bull market is 0% as the S&P 500 has yet to cross its long run average real earnings yield. The S&P 500 would need to appreciate over 22% to reach its long-term average real earnings yield of 2.5%.Guide to the Markets – U.S. Data are as of 12/31/14
Start of Bull Market spent at record highs, or within a 1% or 5% range of the record high

Interest Rates and Equities
0.8
Correlations Between Weekly Stock Returns and Interest Rate Movements Weekly S&P 500 returns, 10-year Treasury yield, rolling 2-year correlation, May 1963 – Dec. 2014
When yields are below 5% rising
0.4
0.6
Equi
ties
Positive relationship between yield movements and stock
below 5%, rising rates are generally associated with rising stock prices
Last 12 Months1963 12 Months Ago
Graph Key
0
0.2
and stock returns
elat
ion
Coe
ffici
ent
-0.4
-0.2
Negative relationship between yield
t d
Cor
re
-0.8
-0.6
0% 2% 4% 6% 8% 10% 12% 14% 16%
movements and stock returns
10-Year Treasury Yield
11
Source: Standard & Poor’s, U.S. Treasury, FactSet, J.P. Morgan Asset Management.Returns are based on price index only and do not include dividends. Markers represent monthly 2-year correlations only. Guide to the Markets – U.S.Data are as of 12/31/14.
10 Year Treasury Yield

Deploying Corporate Cash
$1 400
$1,600
$1 700
$1,800
30%
32%
Corporate Cash as a % of Current AssetsS&P 500 companies – cash and cash equivalents, quarterly
Corporate Growth
Capital Expenditures M&A Activity $bn, nonfarm nonfinancial capex, quarterly value of deals completed
$600
$800
$1,000
$1,200
$1,400
$1,200
$1,300
$1,400
$1,500
$1,600
$1,700
Equi
ties
20%
22%
24%
26%
28%
30%
$0
$200
$400
$900
$1,000
$1,100
'00 '01 '02 '03 '04 '05 '06 '07 '08 '09 '10 '11 '12 '13 '14'00 '01 '02 '03 '04 '05 '06 '07 '08 '09 '10 '11 '12 '13 '1414%
16%
18%
Dividend Payout RatioS&P 500 companies LTM
Cash Returned to Shareholders$bn S&P 500 companies rolling 4 quarter averages
$100
$120
$140
$160
$27
$30
$33
$36
$39
40%
50%
60%S&P 500 companies, LTM $bn, S&P 500 companies, rolling 4-quarter averages
Dividends per Share
$20
$40
$60
$80
$15
$18
$21
$24
$27
'00 '01 '02 '03 '04 '05 '06 '07 '08 '09 '10 '11 '12 '13 '14'00 '01 '02 '03 '04 '05 '06 '07 '08 '09 '10 '11 '12 '13 '1420%
30%
40%
Share Buybacks
12
00 01 02 03 04 05 06 07 08 09 10 11 12 13 14Source: Standard & Poor’s, FRB, Bloomberg, FactSet, J.P. Morgan Securities, J.P. Morgan Asset Management. (Top left) Standard & Poor’s, FactSet, J.P. Morgan Asset Management. (Top right) M&A activity is the quarterly value of officially agreed transactions and capital expenditures are for nonfarm nonfinancial corporate business. (Bottom left) Standard & Poor’s, FactSet, J.P. Morgan Asset Management. (Bottom right) Standard & Poor’s, Compustat, FactSet, J.P. Morgan Asset Management.
Guide to the Markets – U.S. Data are as of 12/31/14.

Annual Returns and Intra-year Declines
3440%
S&P 500 Intra-year Declines vs. Calendar Year ReturnsDespite average intra-year drops of 14.2%, annual returns positive in 27 of 35 years*
2014
26
1517
26
1512
27 26
34
20
31
27
20
26
9
14
23
13 13
30
11
20%
30%
Equi
ties
-10
1 2
-7
47
-2
-10
9
3 4
0
-7 -8-9
-8 -8-6 -6 -5
-9
-3
-811
-8 -7 -8-10 -10
-6 -7-10%
%
10%
-13
-23
-17 -18-17
-13
-34
-20
-11
-19
-12
-17
-30-34
-14
-28
-16-19
40%
-30%
-20%
-38
-49
-60%
-50%
-40%
'80 '82 '84 '86 '88 '90 '92 '94 '96 '98 '00 '02 '04 '06 '08 '10 '12 '14
13
Source: Standard & Poor’s, FactSet, J.P. Morgan Asset Management.Returns are based on price index only and do not include dividends. Intra-year drops refers to the largest market drops from a peak to a trough during the year. For illustrative purposes only. *Returns shown are calendar year returns from 1980 to 2014.Guide to the Markets – U.S.Data are as of 12/31/14.

Equity Correlations and Volatility
70%
Large Cap StocksCorrelations Among Stocks
Sovereign Debt Crisis
Lehman B k t1987 Crash
Great Depression /World War II
Equi
ties
20%
30%
40%
50%
60% Bankruptcy
Tech Bust & 9/11
1987 CrashWorld War II
OPEC Oil Crisis
Cuban Missile Crisis
0%
10%
20%
'26 '32 '38 '44 '50 '56 '62 '68 '74 '80 '86 '92 '98 '04 '10
Volatility Measure ‘08 Peak Average Latest Daily Volatility of DJIA
Average: 26.9%Sep. 2014: 32.5%
2.0%
2.5%
3.0%
3.5%
45
60
75
90y g
DJIA (Left) 3.30% 0.71% 0.58%VIX (Right) 80.9 20.0 19.2
DJIA vol. shownin 3-month
moving average
'30 '35 '40 '45 '50 '55 '60 '65 '70 '75 '80 '85 '90 '95 '00 '05 '100.0%
0.5%
1.0%
1.5%
0
15
30
14
30 35 40 45 50 55 60 65 70 75 80 85 90 95 00 05 10Source: (Top) Empirical Research Partners LLC, Standard & Poor’s, J.P. Morgan Asset Management. Capitalization weighted correlation of top 750 stocks by market capitalization, daily returns, 1926 – Sep. 1, 2014. (Bottom) CBOE, Dow Jones, J.P. Morgan Asset Management. DJIA volatility are represented as three-month moving averages of the daily absolute percentage change in the Dow Jones Industrial Average.Charts shown for illustrative purposes only. Guide to the Markets – U.S. Data are as of 12/31/14.

Stock Market Since 1900
S&P Composite Index
Log Scale
2000 – present
1,000
300
2000 present
Equi
ties
100
40
1966 – 1974
40
101900 – 1924
1937 – 1948
'00 '10 '20 '30 '40 '50 '60 '70 '80 '90 '00 '10
15
Source: Robert Shiller, FactSet, J.P. Morgan Asset Management. Data shown in log scale to best illustrate long-term index patterns. Past performance is not indicative of future returns. Chart is for illustrative purposes only.
Guide to the Markets – U.S.
Data are as of 12/31/14.

Economic Growth and the Composition of GDP
$1810%
Real GDP Year-over-year % chg
3Q14
Components of GDP3Q14 nominal GDP, trillions USD
3.2% HousingReal GDP
my $14
$16
$18
6%
8%
3Q14YoY % chg: 2.7% 13.3% Investment Ex-housing
18.2% Gov’t SpendingAverage:
QoQ % chg: 5.0%
Real GDP
Econ
om
$8
$10
$12
2%
4%
68 2% Consumption
Average: 3.0%
$4
$6
-2%
0%
68.2% Consumption
Expansion Average:
2.3%
-$2
$0
$2
'65 '70 '75 '80 '85 '90 '95 '00 '05 '10-6%
-4%
- 2.9% Net Exports
16
65 70 75 80 85 90 95 00 05 10Source: BEA, FactSet, J.P. Morgan Asset Management.
Values may not sum to 100% due to rounding. Quarter over quarter percent changes are at an annualized rate. Average represents the annualized growth rate for the full period. Expansion average refers to the period starting in the second quarter of 2009.
Guide to the Markets – U.S.
Data are as of 12/31/14.

Consumer Finances
$100 14%
Household Debt Service RatioDebt payments as % of disposable personal income, seasonally adjusted
4Q07:13 2%
Consumer Balance Sheet3Q14, Trillions of dollars outstanding, not seasonally adjusted
Total Assets: $95.4tn 3Q-‘07 Peak: $82.1tnQ $
$80
$90
11%
12%
13%
my
1Q80: 10.6%
4Q14**:9.9%
13.2%$
Homes: 24%
1Q-‘09 Low: $67.0tn
$50
$60
$70
'80 '82 '84 '86 '88 '90 '92 '94 '96 '98 '00 '02 '04 '06 '08 '10 '12 '149%
10%
Econ
om
9.9%
Household Net WorthBillions USD not seasonally adjusted 4Q14**:
Deposits: 9%
Pension Funds: 21%
Other Tangible: 6%
$30
$40
$50 000
$60,000
$70,000
$80,000
$90,000
Billions USD, not seasonally adjusted Q$82,9072Q07:
$67,874
%
Other Non-revolving: 1%Revolving*: 6%
Auto Loans: 7%Other Liabilities: 9%
Student Debt: 9%
$0
$10
$20
'90 '92 '94 '96 '98 '00 '02 '04 '06 '08 '10 '12 '14$10,000
$20,000
$30,000
$40,000
$50,000
Total Liabilities: $14.1tnOther Financial
Assets: 39%
Mortgages: 68%
17
Source: (Left) FRB, J.P. Morgan Asset Management. Data include households and nonprofit organizations. (Right) BEA, FRB, J.P. Morgan Asset Management. *Revolving includes credit cards. **4Q14 household debt service ratio and 4Q14 household net worth are J.P. Morgan Asset Management estimates. Values may not sum to 100% due to rounding.Guide to the Markets – U.S.Data are as of 12/31/14.
90 92 94 96 98 00 02 04 06 08 10 12 14

Credit Conditions
14%
Common Equity as a % of Total Assets
2013:
All FDIC insured institutions, 1934 – 2013 12%
Residential Mortgages
Delinquency RatesAll banks, seasonally adjusted
8%
10%
12%
my
11.1%
Average: 7.7%4%
6%
8%
10%Consumer LoansResidential Mortgages
Commercial and Industrial Loans
7.0%
2 2%
4%
6%
'34 '40 '46 '52 '58 '64 '70 '76 '82 '88 '94 '00 '06 '12Econ
om
'92 '94 '96 '98 '00 '02 '04 '06 '08 '10 '12 '140%
2%
0.8%
2.2%
Loan GrowthG th i l t t di t i l b k Y Y ll dj t d
Lending Standards for Approved Mortgage LoansAverage FICO score based on origination date
10%
20%
30%Real Estate Loans Nov. 2014:
12.8%
Growth in loans outstanding at commercial banks, YoY, seasonally adjusted
720
740
760 Oct. 2014: 743
Average FICO score based on origination date
'00 '01 '02 '03 '04 '05 '06 '07 '08 '09 '10 '11 '12 '13 '14-30%
-20%
-10%
0%
Commercial and Industrial Loans
Nov. 2014:2.7%
660
680
700
'00 '01 '02 '03 '04 '05 '06 '07 '08 '09 '10 '11 '12 '13 '14
18
Source: (Top left) FDIC, J.P. Morgan Asset Management. (Top right) Federal Reserve, FactSet, J.P. Morgan Asset Management. (Bottom left): Federal Reserve, FactSet, J.P. Morgan Asset Management. (Bottom Right) McDash, J.P. Morgan Securitized Product Research, J.P. Morgan Asset Management.
All data reflect most recently available releases.
Guide to the Markets – U.S.
Data are as of 12/31/14.

Cyclical Sectors
22
24Millions, seasonally adjusted annual rateLight Vehicle Sales
46
47
Manufacturing and Trade InventoriesDays of sales, seasonally adjusted
my 14
16
18
20
22
Average: 15.3
Nov. 2014:17.1
40
4142
4344
45
Oct. 2014: 39.5
Econ
om
'96 '98 '00 '02 '04 '06 '08 '10 '12 '148
10
12
Housing StartsTh d ll dj t d l t
Real Capital Goods OrdersN d f it l d d i ft $ b ll dj t d
'96 '98 '00 '02 '04 '06 '08 '10 '12 '143738
3940
1 200
1,600
2,000
2,400Thousands, seasonally adjusted annual rate
A 1 348$60
$65
$70
$75Non-defense capital goods orders ex. aircraft, $ bn, seasonally adjusted
Nov. 2014:61.0
'96 '98 '00 '02 '04 '06 '08 '10 '12 '140
400
800
1,200
Nov. 2014:1,028
Average: 1,348
'96 '98 '00 '02 '04 '06 '08 '10 '12 '14$40
$45
$50
$55
Average: 56.8
19
96 98 00 02 04 06 08 10 12 14Source: (Top left) BEA, FactSet, J.P. Morgan Asset Management. (Top right) Census Bureau, FactSet, J.P. Morgan Asset Management. (Bottom left) Census Bureau,FactSet, J.P. Morgan Asset Management. (Bottom right) Census Bureau, FactSet, J.P. Morgan Asset Management. Capital goods orders deflated using the producer price index for capital goods with a base year of 2004.Guide to the Markets – U.S.
Data are as of 12/31/14.

Residential Real Estate
3 %
40%125
Indexed to 100, seasonally adjustedHome Prices Housing Affordability Index
Avg. mortgage payment as a % of household income
20%
25%
30%
35%
my
115
120Case Shiller 20-cityFHFA Purchase OnlyAverage Existing Home Nov. 2014:
12.1%
Average: 20.3%
10%
15%
'75 '78 '81 '84 '87 '90 '93 '96 '99 '02 '05 '08 '11 '14Econ
om
100
105
110Average: 20.3%
Home InventoriesMillions annual rate seasonally adjusted
90
95
3
3.5
4
4.5Millions, annual rate, seasonally adjusted
Nov. 2014: 2.4
'05 '06 '07 '08 '09 '10 '11 '12 '13 '1475
80
85
'94 '96 '98 '00 '02 '04 '06 '08 '10 '12 '141.5
2
2.5
3
20
05 06 07 08 09 10 11 12 13 14 94 96 98 00 02 04 06 08 10 12 14Sources: (Left) National Association of Realtors, Standard & Poor’s, FHFA, FactSet, J.P. Morgan Asset Management. (Top right) Census Bureau, J.P. Morgan Asset Management. Monthly mortgage payment assumes the prevailing 30-year fixed-rate mortgage rates and average new home prices excluding a 20% down payment. (Bottom right) Census Bureau, National Association of Realtors, J.P. Morgan Asset Management.
Guide to the Markets – U.S.
Data are as of 12/31/14.

Long-term Drivers of Economic Growth
Private nonresidential fixed investment, % of GDP16%
Gross Investment and DepreciationDepreciationGross investment spending
5%
Five year moving average of year-over-year % changeGrowth in Employment and Real Output Per Worker*
A th
8%
12%
my
p g
4%
Average growth50 yr. 10 yr. 5 yr.
Employment 1.5% 0.5% 1.1%
Real Output Per Worker 1.5% 1.1% 1.3%
GDP 3.0% 1.6% 2.4%
'90 '95 '00 '05 '100%
4%
Econ
om
Real Capital Stock GrowthNonresidential fixed assets year over year % chg
2%
3%
Real Output Per Worker
3%
4%
5%
2013: 1.6%
Nonresidential fixed assets, year-over-year % chg
1%
Employment Growth
0%
1%
2%
1990 1995 2000 2005 2010 '70 '80 '90 '00 '10-1%
0%
21
1990 1995 2000 2005 2010Source: BEA, BLS, FactSet, J.P. Morgan Asset Management.*Labor Force includes the population age 16+ working or looking for work, Real Output Per Worker is calculated as real GDP growth minus civilian employment growth. Averages are calculated as the annualized growth rate.
Guide to the Markets – U.S.
Data are as of 12/31/14.

Federal Finances
$4.0
The 2015 Federal BudgetCBO Baseline forecast, trillions USD
T t l S di $3 8t
-12%
10%
Federal Budget Surplus/Deficit% of GDP, 1990 – 2024, 2014 CBO Baseline
Forecast
$3.0
$3.5
my
Total Spending: $3.8tn
Other$550bn (15%)
Net Int.: $251bn (7%)
Borrowing:$469bn (13%)
Other: $302bn (8%)
-10%
-8%
-6%
-4%
-2%
2015: -2.6%
$2.0
$2.5
Econ
om
Defense:$608bn (16%)
Non-defense Disc.:$506bn (13%) Social Insurance:
$1,065bn (28%)'90 '95 '00 '05 '10 '15 '20 '25
0%
2%
4%
Federal Net Debt (Accumulated Deficits)% of GDP 1940 – 2024 2014 CBO Baseline end of fiscal year
$1.0
$1.5 Social Security:$887bn (24%)
Income:$1 526bn (41%)
Corp.: $389bn (10%)
80%
100%
120%% of GDP, 1940 2024, 2014 CBO Baseline, end of fiscal year
2024: 77.2%2015:
74.0%
Forecast
$0.0
$0.5
Total Government Spending Sources of Financing
Medicare & Medicaid:$948bn (25%)
$1,526bn (41%)
20%
40%
60%
'40 '48 '56 '64 '72 '80 '88 '96 '04 '12 '20
22
Total Government Spending Sources of Financing 40 48 56 64 72 80 88 96 04 12 20Source: U.S. Treasury, BEA, CBO, St. Louis Fed, J.P. Morgan Asset Management.2015 Federal Budget is based on the CBO’s August 2014 Baseline Budget Forecast. Other spending includes, but is not limited to, health insurance subsidies, income security, and federal civilian and military retirement. Note: Years shown are fiscal years (Oct. 1 through Sep. 30). 2015 numbers are CBO estimates as of August 2014.Guide to the Markets – U.S.Data are as of 12/31/14.

Unemployment and Wages
Civilian Unemployment Rate and Year-over-Year Growth in Wages of Production and Non-Supervisory Workers
12%Seasonally adjusted, percent
my
10%
12%
Oct. 2009: 10.0%
Econ
om
6%
8%
50-yr. avg.: 6.1%
4% 49-yr. avg.: 4.3%
Nov. 2014: 5.8%
Nov. 2014: 2.2%
'70 '80 '90 '00 '100%
2%
23
70 80 90 00 10Source: BLS, FactSet, J.P. Morgan Asset Management.
Guide to the Markets – U.S.
Data are as of 12/31/14.

Labor Market Perspectives
Employment – Total Private Payroll Total job gain/loss (thousands)
6008.8mm 67%
68%Labor Force Participation Rate
my -400
-200
0
200
400 jobs lost
10.9 mm jobs 64%
65%
66%
67%
Econ
om
Net Job Creation Since Feb. 2010 – Millions of Jobs
'05 '06 '07 '08 '09 '10 '11 '12 '13 '14-1,000
-800
-600 gained
'90 '92 '94 '96 '98 '00 '02 '04 '06 '08 '10 '12 '1462%
63%
Nov. 2014: 62.8%
Ratio of Unemployed to Job Openings
4
5
6
7
3.22.9
2.1 1.91 mm
2 mm
3 mm
'01 '02 '03 '04 '05 '06 '07 '08 '09 '10 '11 '12 '13 '141
2
3
4
Oct. 2014: 1.9
0.9
-0.5
-1 mm
0 mm
Info. Fin & Bus. Svcs.
Mfg. Trade & Trans.
Leisure, Hospt. &
Other Svcs.
Edu. & Health Svcs.
Mining & Construct.
Gov't
24
Source: BLS, FactSet, J.P. Morgan Asset Management.
Guide to the Markets – U.S.
Data are as of 12/31/14.

Employment and Income by Educational Attainment
18%
Unemployment Rate by Education Level
Less than High School Degree$84,852
$90,000
Average Annual Earnings by Highest Degree EarnedFull-time workers aged 18 and older, 2012, USD
14%
16%
my
Nov 2014:
Less than High School DegreeHigh School No CollegeSome CollegeCollege or Greater
$70,000
$80,000
+28K
8%
10%
12%
Econ
om
Nov. 2014:5.6%
Nov. 2014:8.5% $56,665
$50,000
$60,000
+26K
4%
6%
8%
Nov. 2014:4.9%
$30,627
$20,000
$30,000
$40,000
'92 '94 '96 '98 '00 '02 '04 '06 '08 '10 '12 '140%
2%Nov. 2014:
3.2%
$0
$10,000
,
High School Graduate Bachelor'sDegree Advanced Degree
25
High School Graduate Bachelors Degree Advanced Degree
Source: BLS, Census Bureau, FactSet, J.P. Morgan Asset Management.
Unemployment rates shown are for civilians aged 25 and older.
Guide to the Markets – U.S.
Data are as of 12/31/14.

Inflation
1 %
CPI and Core CPI% change vs. prior year, seasonally adjusted
50 A N 2014
CPI Components
Weight in CPI 12-month Change
F d & B 14 1% 3 2%
my
12%
15% 50-yr. Avg. Nov. 2014Headline CPI 4.2% 1.3%Core CPI 4.1% 1.7%Headline PCE 3.6% 1.2%Core PCE 3.5% 1.4%
Food & Bev. 14.1% 3.2%
Housing 32.3% 3.0%
Apparel 3.5% -0.3%
Transportation 5.6% 1.8%
Econ
om
6%
9%
p
Medical Care 5.8% 2.3%
Recreation 2.0% -2.8%
Edu. & Comm. 0.6% -4.0%
3%
Other 1.6% 1.5%
Headline CPI 100.0% 1.3%
Less:
'65 '70 '75 '80 '85 '90 '95 '00 '05 '10-3%
0%Energy 8.9% -4.8%
Food 14.1% 3.2%
Core CPI 77.1% 1.7%
26
Source: BLS, FactSet, J.P. Morgan Asset Management.CPI used is CPI-U and values shown are % change vs. one year ago and reflect November 2014 CPI data. CPI component weights are as of November 2014. Core CPI is defined as CPI excluding food and energy prices. The Personal Consumption Expenditure (PCE) deflator employs an evolving chain-weighted basket of consumer expenditures instead of the fixed weight basket used in CPI calculations.
Guide to the Markets – U.S. Data are as of 12/31/14.

Trade and the U.S. Dollar
-7%
Current Account Balance and Oil Imports, % of GDP
4Q05:115
U.S. Dollar IndexMonthly average of nominal trade-weighted exchange index: major currencies
F *
-6%
-5%my
4Q05:-6.2%
100
105
110Forecast*
-4%Econ
om
C t A t B l90
95
100
Mar 2009: Dec 2014**:-3%
-2%
3Q14:-2.3%
Current Account Balance
2Q08 75
80
85
Mar. 2009: 80.0
Dec. 2014 : 84.3
-1%
0%'99 '01 '03 '05 '07 '09 '11 '13 '15
Net Oil Imports
2Q08:-3.1%
3Q14:-1.0%
'96 '98 '00 '02 '04 '06 '08 '10 '12 '1465
70
75
Mar. 2008: 70.3
27
99 01 03 05 07 09 11 13 15Source: BEA, EIA, Federal Reserve, FactSet, J.P. Morgan Asset Management.
*Oil imports as a percent of GDP is an EIA forecast. **December U.S. Dollar index value is a J.P. Morgan Asset Management estimate.
Guide to the Markets – U.S.
Data are as of 12/31/14.

Energy: Supply, Demand and Prices
$140
$160
Change in Production and Consumption of Oil
2013 2014* 2015*G
Production, consumption and inventories, million barrels per dayPrice of OilBrent crude, nominal prices , USD/bbl
$60
$80
$100
$120
$140
my
2013 2014 2015Growth since
2013Production
U.S. 12.3 13.9 14.9 20.7%
OPEC 36.0 36.0 35.9 -0.3%
'86 '88 '90 '92 '94 '96 '98 '00 '02 '04 '06 '08 '10 '12 '14$0
$20
$40
Econ
om Other 41.8 42.1 41.9 0.4%
Global 90.2 92.0 92.8 2.9%
Consumption
Dec. 2014: $57.33
U.S. Natural Gas Production**Trillions of cubic feet USD EIA
20
25
30
35U.S. 19.0 19.0 19.1 0.7%
Europe 13.6 13.5 13.4 -1.9%
Japan 4.5 4.4 4.2 -6.4%
China 10.6 11.0 11.3 6.9%
Gbl. Natural Gas PricesJapan $13.86Germany $10.16U.S. $3.65
Trillions of cubic feet, USD
Shale Gas
Forecast
'95 '00 '05 '10 '15 '20 '250
5
10
15Other 42.8 43.6 44.3 3.6%
Global 90.5 91.4 92.3 2.0%
Inventory Change -0.3 0.5 0.4
Other***
28
95 00 05 10 15 20 25Source: EIA, FactSet, J.P. Morgan Asset Management. *Forecasts are from EIA Annual Energy Outlook and start in 2013. **Production numbers as of 2013. ***Other includes conventional on and offshore natural gas drilling, tight gas, and coalbed methane. Natural gas prices are $/mmbtu and are as of December 2014.
Guide to the Markets – U.S.
Data are as of 12/31/14.

Energy Price Impacts
12%
14%
8% 6% 4% 2% 0% 2% 4% 6%
Imports as a % of GDP
Percent of Income Spent on Gasoline and Motor Oil Before-tax income quintile, percent of spending, 2013
Oil Importers and ExportersNet imports as a percent of GDP, 2013
-14%
4%
6%
8%
10%
12%
-3.6%
0.9%
1.6%
-8% -6% -4% -2% 0% 2% 4% 6%
Canada
U.K.
U.S.
ped
my
-14%
0%
2%
4%
Lowest Second Third Fourth Highest
2.2%
2.4%
2.4%
Italy
France
GermanyGasoline PricesUnited States all city average USD per gallon
Dev
elop
Econ
om
3.6%
-13.6%
0.7%
Japan
Russia*
Brazil
United States all city average, USD per gallon
$3.00
$4.00
$5.00 Dec. 2014: $2.61
ng2.4%
4.8%
5.3%
China
South Africa
India'80 '90 '00 '10
$0.00
$1.00
$2.00D
evel
opin
29
80 90 00 10Source: (Top left) BEA, (Bottom Left) Department of Labor, FactSet, (Right) EIA, IMF, J.P. Morgan Asset Management.
*Russia imports as a percent of GDP was -13.6% in 2013 and is adjusted on the chart.
Guide to the Markets – U.S.
Data are as of 12/31/14.

Consumer Confidence and the Stock Market
130Consumer Sentiment Index – University of Michigan
0 8 t10% i i li iImpact on Consumer Sentiment from a…
my
110
120
Mar. 1984
Jan. 2000-2.0%
Jan. 2004+4.4%
Aug 1972
-0.8 pts+1.9+2.8-5.2
10% y-o-y rise in gasoline prices10% y-o-y rise in home prices10% y-o-y rise in the S&P 5001% y-o-y rise in the unemployment rate
Dec 2014:
Econ
om
80
90
100
Average: 84.8
+13.5%May 1977
+1.2%
Aug. 1972-6.2%
Jan. 2007-4.2%
Dec. 2014:93.6
60
70
80
Oct. 1990+29 1%
Mar. 2003+32.8% Oct. 2005
+14.2%
'72 '74 '76 '78 '80 '82 '84 '86 '88 '90 '92 '94 '96 '98 '00 '02 '04 '06 '08 '10 '12 '1440
50
Feb. 1975+22.2%
May 1980+19.2%
+29.1%
Nov. 2008+22.3%
Aug. 2011+15.4%Sentiment Cycle Low and
subsequent 12-month S&P 500 Index return
30
72 74 76 78 80 82 84 86 88 90 92 94 96 98 00 02 04 06 08 10 12 14Source: University of Michigan, FactSet, J.P. Morgan Asset Management.
Peak is defined as the highest index value before a series of lower lows, while a trough is defined as the lowest index value before a series of higher highs. Subsequent 12-month S&P 500 returns are price returns only, which excludes dividends. Impact on consumer sentiment is based on a multivariate monthly regression between 1/31/2000 – 5/31/2014.
Guide to the Markets – U.S.
Data are as of 12/31/14.
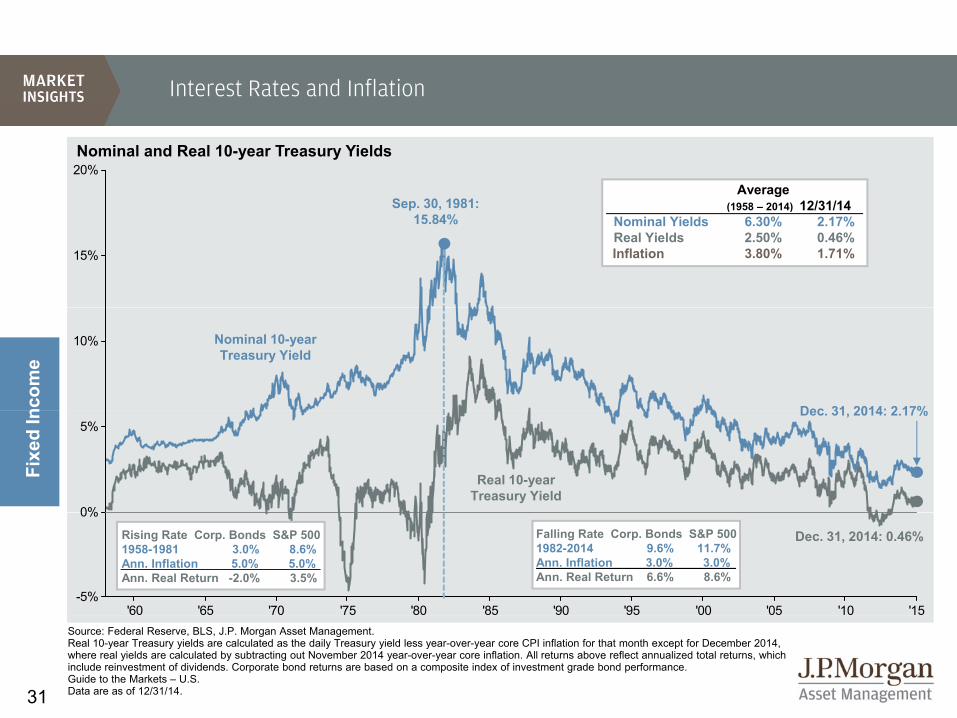
Interest Rates and Inflation
20%Nominal and Real 10-year Treasury Yields
Sep 30 1981:Average
(1958 2014) 12/31/14
15%
Sep. 30, 1981: 15.84%
(1958 – 2014) 12/31/14Nominal Yields 6.30% 2.17%Real Yields 2.50% 0.46%Inflation 3.80% 1.71%
10%
ncom
e
Dec 31 2014: 2 17%
Nominal 10-year Treasury Yield
0%
5%
Fixe
d In Dec. 31, 2014: 2.17%
Real 10-year Treasury Yield
'60 '65 '70 '75 '80 '85 '90 '95 '00 '05 '10 '15-5%
0%
Dec. 31, 2014: 0.46%Rising Rate Corp. Bonds S&P 500 1958-1981 3.0% 8.6% Ann. Inflation 5.0% 5.0% Ann. Real Return -2.0% 3.5%
Falling Rate Corp. Bonds S&P 500 1982-2014 9.6% 11.7% Ann. Inflation 3.0% 3.0% Ann. Real Return 6.6% 8.6%
31
Source: Federal Reserve, BLS, J.P. Morgan Asset Management.Real 10-year Treasury yields are calculated as the daily Treasury yield less year-over-year core CPI inflation for that month except for December 2014, where real yields are calculated by subtracting out November 2014 year-over-year core inflation. All returns above reflect annualized total returns, which include reinvestment of dividends. Corporate bond returns are based on a composite index of investment grade bond performance. Guide to the Markets – U.S.Data are as of 12/31/14.

The Fed and Interest Rates
6%
7%
Fed’s Balance Sheet: Assets$ trillions
Other
Federal Funds Rate ExpectationsFOMC and market expectations for the Fed Funds rate
$4.0
$4.5Federal Funds Rate
O C
2%
3%
4%
5%
6%U.S. TreasuriesAgency MBS
$1.5
$2.0
$2.5
$3.0
$3.5
$
FOMC Long Run Projection
FOMC Year-End EstimatesMarket Expectations
0%
1%
2%
'99 '01 '03 '05 '07 '09 '11 '13 '15 '17
ncom
e
Fed’s Balance Sheet: Liabilities$ trillions
Federal Reserve Summary of Economic Projections
$0.0
$0.5
$1.0
'04 '06 '07 '08 '09 '10 '11 '12 '13 '14
Fixe
d In
$2.5$3.0$3.5$4.0$4.5$ trillions
Excess Reserves
Required Reserves
Other Liabilities
FOMC December 2014 Forecasts* Percent
2014 2015 2016 2017 Long Run
Change in real GDP, Q4 to Q4 2.4 2.8 2.8 2.4 2.2
'05 '06 '07 '08 '09 '10 '11 '12 '13 '14$0.0$0.5$1.0$1.5$2.0
g ,
Unemployment Rate, Q4 5.8 5.3 5.1 5.1 5.4
PCE Inf lation, Q4 to Q4 1.3 1.3 1.9 1.9 2.0
Federal Funds Rate, end of year 0.13 1.13 2.50 3.63 3.75
32
Source: Federal Reserve, FactSet, J.P. Morgan Asset Management.Monetary base is defined as the total amount of a currency that is either circulated in the hands of the public or in the commercial bank deposits held in the central bank's reserves. Other liabilities of the Federal Reserve primarily consist of currency outstanding. Market expectations are the federal funds rates priced into the fed futures market. *Forecasts of 17 Federal Open Market Committee (FOMC) participants, midpoints of central tendency except for federal funds rate which is a median estimate.
Guide to the Markets – U.S.
Data are as of 12/31/14.

Shape of the Yield Curve
4 0%
4.5%
Yield CurveU.S. Treasury Yield Curve
1.5%
2.0%
2.5%
3.0%
3.5%
4.0% Dec. 31, 2013
Dec. 31, 2014
0.0%
0.5%
1.0%
0 8% 3 2%Nominal 2 Year and 10 Year U.S. Treasury Yields Treasuries Outstanding – 3Q14
By holder end of period not seasonally adjustedncom
e 3m 1y 2y 3y 7y 10y 30y5y
0.5%
0.6%
0.7%
0.8%
2.6%
2.8%
3.0%
3.2% By holder, end of period, not seasonally adjusted
Fixe
d In
Foreign officialState and local
gov'ts
Financial institutions
7%
Households6%
Other1%
Jan '14 Apr '14 Jul '14 Oct '14 Jan '150.2%
0.3%
0.4%
2.0%
2.2%
2.4%
10Y UST (RHS)2Y UST (LHS)
g32%
Federal Reserve
19%Foreign private
15%
Mutual funds9%
g7%
33
Source: Federal Reserve, FactSet, J.P. Morgan Asset Management.Guide to the Markets – U.S.Data are as of 12/31/14.
Jan 14 Apr 14 Jul 14 Oct 14 Jan 15

Global Monetary Policy
80%
Central Bank Assets – Percent of Nominal GDPJPMAM
Forecast* 1
Correlation of Government Bonds6-month rolling correlation of weekly change in USTs and German Bund yields
60%
70%
0.2
0.4
0.6
0.8
10-yr. Bonds
40%
50%
ncom
e
8%Real Policy Rates – Monthly
-0.2
0
'10 '11 '12 '13 '14
2-yr. Bonds
20%
30%
Fixe
d In
2%3%4%5%6%7%8%
E C t l B k
Bank of Japan
Emerging Markets
0%
10%
'00 '01 '02 '03 '04 '05 '06 '07 '08 '09 '10 '11 '12 '13 '14 '15-3%-2%-1%0%1%2%
'00 '01 '02 '03 '04 '05 '06 '07 '08 '09 '10 '11 '12 '13 '14
European Central Bank
U.S. Federal Reserve Developed Markets
34
00 01 02 03 04 05 06 07 08 09 10 11 12 13 14Source: J.P. Morgan Global Economics Research, FactSet, J.P. Morgan Asset Management.Real policy rates represent GDP weighted aggregates estimated by J.P. Morgan Global Economics Research. Real policy rates are short-term target interest rates set by central banks minus year-over-year inflation. *Central bank assets as percent of nominal GDP is forecasted through 2015 using J.P. Morgan Global Economics Research nominal GDP forecasts and assumptions for central bank balance sheet size based on statements released by each respective central bank and its governors. Guide to the Markets – U.S.Data are as of 12/31/14.

Sources of Bond Returns
Coupon Return2014 “C”
Total Return2014 “A + B + C”
Treasury Base Rate Return2014 “A”
Spread to Treasury Return2014 “B”
20141 3%5-yr. 1 6% 2 9% 5-yr.
20131.3%
8.2%
26.0%
10-yr.
30-yr.
1.6%
2.6%
3.4%
2.9%
10.7%
29.4%
10-yr.
30-yr.
ncom
e
4.4%
-3.3%
10-yr. Muni
U.S. HY
EM (USD)
-1.1%
4.3%
6.8%
8.7%
2.5%
10-yr. Muni
U.S. HY
EM (USD)
Fixe
d In 0.3%
3.7%
2.0%
EM (USD)
IG Corp.
U.S. MBS
-1.2%
-0.5%
0.4%
5.6%
4.2%
3.7%
4.8%
7.5%
6.1%
EM (USD)
IG Corp.
U.S. MBS
2.7%
-1.4%
20% 10% 0% 10% 20%
U.S. Agg.
FRN (BBB)
0.1%
0.1%
20% 10% 0% 10%
3.2%
1.3%
20% 10% 0% 10%
6.0%
0.1%
20% 10% 0% 10% 20% 30%
U.S. Agg.
FRN (BBB)
35
Source: Federal Reserve, Barclays, J.P. Morgan Asset Management.All returns reflect year to date returns. Treasury base, spread, and coupon returns based on Barclays and J.P. Morgan Asset Management estimates. The sum of charts A and B equate to price return for each sector. Indices used include Barclays US Treasury Bellwethers (10Y), Barclays US Aggregate, Barclays US Aggregate Credit – Corporate Investment Grade, Barclays US Aggregate Credit – Corporate High Yield, Barclays Muni 10-year Index, Barclays US MBS Index, Barclays Floating Rate Index, and Barclays Emerging Markets USD. Guide to the Markets – U.S. Data are as of 12/31/14.
-20%-10% 0% 10% 20% -20% -10% 0% 10% -20% -10% 0% 10% -20%-10% 0% 10% 20% 30%

Fixed Income Yields and Returns
Price Impact of a 1% Rise/Fall in Interest Rates*
-2.0%5 0%
0.9%2y USTU.S. Treasuries # of issues
Correlation to 10-year
Avg.Maturity 12/31/2014 9/30/2014 4Q14 2014
Yield Return
-17.8%
-8.6%
-5.7%
-4.7%
23.2%
9.5%
6.7%
5.0%
30y UST
10y UST
TIPS
5y UST 2-Year 95 0.63 2 years 0.67% 0.58% 0.17% 0.66%
5-Year 97 0.90 5 1.65% 1.78% 1.14% 2.89%
10-Year 17 1.00 10 2.17% 2.52% 3.57% 10.74%
30-Year 20 0.92 30 2.75% 3.21% 10.06% 29.38%
ncom
e
-3.9%
-3.2%
-0.1%
3.9%
3.6%
0.1%
ABS
Convertibles
Floating Rate
TIPS 35 0.58 10 0.49% 0.55% -0.03% 3.64%
Sector
Broad Market 9,054 0.85 7.7 years 2.25% 2.36% 1.79% 5.97%
MBS 410 0.80 6.5 2.60% 2.88% 1.79% 6.08%
Fixe
d In
-5 7%
-5.6%
-5.5%
-4.3%
5.5%
5.5%
3.4%
4.2%
Munis
US Aggregate
MBS
US HY Municipals 9,080 0.45 10.0 2.04% 2.13% 1.38% 8.72%
Corporates 5,212 0.45 10.7 3.11% 3.10% 1.77% 7.46%
High Yield 2,253 -0.24 6.5 6.61% 6.13% -1.00% 2.45%
Floating Rate 49 -0.21 2.7 1.61% 0.98% -1.43% 0.08%
Source: U.S. Treasury, Barclays Capital, FactSet, J.P. Morgan Asset Management. Fixed income sectors shown above are provided by Barclays Capital and are represented by –Broad Market: Barclays U.S. Aggregate; MBS: U.S. Aggregate Securitized - MBS Index; Corporate: U.S. Corporates; Municipals: Muni Bond 10-year Index; High Yield: Corporate High Yield Index; TIPS: Treasury Inflation Protection Securities (TIPS). Floating Rate: Barclays FRN (BBB); Convertibles: Barclays U.S. Convertibles Composite; ABS: Barclays ABS +
-6.7%
-5.7%7.7%
-30% -10% 10% 30%
IG Corps Convertibles 518 -0.29 -- 1.11% 1.14% 1.06% 8.17%
ABS 1,727 -0.04 4.4 2.15% 2.18% 1.27% 3.44%
36
Yield Index; TIPS: Treasury Inflation Protection Securities (TIPS). Floating Rate: Barclays FRN (BBB); Convertibles: Barclays U.S. Convertibles Composite; ABS: Barclays ABS CMBS. Treasury securities data for # of issues based on U.S. Treasury benchmarks from Barclays Capital. Yield and return information based on bellwethers for Treasury securities. Sector yields reflect yield to worst, while Treasury yields are yield to maturity. Correlations are based on 10-years of monthly returns for all sectors. Change in bond price is calculated using both duration and convexity according to the following formula: New Price = (Price + (Price * -Duration * Change in Interest Rates))+(0.5 * Price * Convexity * (Change in Interest Rates)^2). *Calculation assumes 2-year Treasury interest rate falls 0.67% to 0.00%, as interest rates can only fall to 0.00%. Chart is for illustrative purposes only. Past performance is not indicative of future results. Guide to the Markets – U.S. Data are as of 12/31/14.

Global Fixed Income
$100
Global Bond MarketUSD, trillions
12/31/89 6/30/14 EM: $14tn
Yield
Aggregates Correl to 10 year Duration 12/31/2014 9/30/2014 4Q14 2014
Return
$70
$80
$90U.S. 60.7% 36.1%Dev. ex U.S. 38.2% 49.5%EM 1.1% 14.4%
10-year
U.S. 0.83 5.6 Yrs 2.25% 2.36% 1.79% 5.97%
Gbl. ex. U.S. 0.37 7.1 1.29% 1.46% -2.61% -2.21%
Japan 0.49 8.3 0.36% 0.52% -6.38% -8.35%
$50
$60
$70
Developed ex U.S.: $50tn
ncom
e
Germany 0.25 6.0 0.58% 0.76% -1.87% -3.70%
U.K. 0.17 9.4 1.94% 2.36% 1.57% 5.82%
Italy 0.07 6.6 1.50% 1.67% -1.80% 0.84%
S i 0 10 5 8 1 17% 1 32% 1 87% 0 67%
$20
$30
$40
U.S.: $35tn
Fixe
d In Spain 0.10 5.8 1.17% 1.32% -1.87% 0.67%
Sector
Euro Corp. 0.11 4.8 1.04% 1.20% -2.73% -4.82%
Euro HY. -0.39 3.9 4.65% 4.58% -3.27% -6.02%
$0
$10
'90 '92 '94 '96 '98 '00 '02 '04 '06 '08 '10 '12 '14
EMD ($) 0.20 6.7 5.62% 5.39% -0.55% 7.43%
EMD (LCL) 0.08 4.9 6.50% 6.74% -5.71% -5.72%
EM Corp. -0.26 5.6 5.56% 5.28% 0.31% 6.74%
37
Source: Barclays Capital, BIS, FactSet, J.P. Morgan Asset Management. All returns are in USD. Fixed income sectors shown above are provided by Barclays Capital and are represented by the global aggregate for each country except where noted. EMD sectors are represented by the J.P. Morgan EMBIG Diversified Index (USD), the J.P. Morgan GBI EM Global Diversified Index (LCL), and the J.P. Morgan CEMBI Broad Diversified Index (Corp). European Corporates are represented by the Barclays Euro Aggregate Corporate Index and the Barclays Pan-European High Yield index. Sector yields reflect yield to worst. Duration is modified duration. Correlations are based on 7-years of monthly returns for the all sectors. Past performance is not indicative of future results. Guide to the Markets – U.S. Data are as of 12/31/14.

Municipal Finance
12%
9%
10%% of current expenditures
10-Year Muni Taxable Equivalent Yield
3Q14: 7.9%
Taxable equivalent Muni and Treasury yieldsState & Local Government Debt Service
10%
5%
6%
7%
8%
9%Taxable Equivalent 10-yr. Muni Yield
6%
8%
3%
4%
5%
'90 '92 '94 '96 '98 '00 '02 '04 '06 '08 '10 '12 '14
Municipal Bond Issuance*Billions USD revenue and GO issuesnc
ome
4%
Billions USD, revenue and GO issues
10-yr. Treasury Yield
Fixe
d In
$300
$400
$500
0%
2%
'90 '92 '94 '96 '98 '00 '02 '04 '06 '08 '10 '12 '14
Spread
$0
$100
$200
'96 '98 '00 '02 '04 '06 '08 '10 '12 '14
38
Source (Left chart): Barclays Capital, U.S. Treasury, FactSet, J.P. Morgan Asset Management. (Top right) BEA, J.P. Morgan Asset Management. (Bottom right) SIFMA, J.P. Morgan Asset Management.Taxable equivalent yields are calculated for the highest federal marginal tax bracket. 2014 tax rate includes the net investment income tax of 3.8%. *Excludes maturities of 13 months or less and private placements. Interest payments include interest accrued on defined benefit liabilities. 2014 issuance data is as of November 2014. Guide to the Markets – U.S.Data are as of 12/31/14.

High Yield Bonds
15%
20% Average Latest HY Spreads 5.9% 5.7%HY Defaults Rates 4.0% 1.8%
U.S. High Yield Spreads and Defaults
HY D f lt R tHY Spreads
5%
10%
15% HY Default Rates
0%'88 '90 '92 '94 '96 '98 '00 '02 '04 '06 '08 '10 '12 '14
ncom
e
Global High Yield SpreadsSpread over Treasuries
Sector WeightsOther 7%
Other 5%100%
7%
9%
Fixe
d In
p
Euro HY
EM HY T l 10%
Telecom 18% Telecom 21%Industrial 20%
Industrial 29% Industrial 24%Energy 17%
Energy 2% Energy 11%Other 17%Other 7%
40%
60%
80%
3%
5%
'12 '13 '14
EM HYU.S. HY
Consumer 28% Consumer 31%Consumer 17%
Financial 7%Financial 13%
Financial 22%
Telecom 10%
0%
20%
40%
U.S. HY Euro HY EM HY
39
Source: U.S. Treasury, J.P. Morgan, Strategic Insight, J.P. Morgan Asset Management. Default rates are defined as the par value percentage of the total market trading at or below 50% of par value and include any Chapter 11 filing, prepackaged filing or missed interest payments. Spreads indicated are benchmark yield to worst less comparable maturity Treasury yields. Yield to worst is defined as the lowest potential yield that can be received on a bond without the issuer actually defaulting and reflects the possibility of the bond being called at an unfavorable time for the holder. J.P. Morgan Domestic HY, J.P. Morgan Euro HY, and J.P. Morgan CEMBI Non-IG indexes were used for Spreads and Industry Weights. Past performance is not indicative of comparable future results. Guide to the Markets – U.S.Data are as of 12/31/14.

Emerging Market Debt
1,317Russia
USD-denominated debt, 5 years, spread to Treasuries, basis pointsEMD Indices by Region EMD Sovereign Spreads
Brazil 27% Latin America 35%
Latin America 30%80%
100%
1,089
633
628
Brazil
India
TurkeyS. Africa 9%Turkey 10%
Poland 11%
Mexico 20%
Asia 21%
Asia 39%
Europe 31%
Europe 13%
35% 30%
40%
60%
80%
628
592
428
Turkey
Indonesia
ColombiaEMD Indices by Credit Ratings
ncom
e
Other 23% Middle East & Africa 13%
Middle East & Africa 18%
Asia 21%
0%
20%
Local Sovereign USD Sovereign USD Corporate
348
181
168
Mexico
China
Philippines
5 year averageFixe
d In
Current spread
Graph Key
Investment Grade 85%
Investment Grade 65%
Investment Grade 69%60%
80%
100%
146
49
0 200 400 600 800 1,000 1,200 1,400
Hungary
PolandNon Investment
Grade 15%
Non Investment Grade 35%
Non Investment Grade 31%
0%
20%
40%
Local Sovereign USD Sovereign USD Corporate
40
Source: J.P. Morgan Global Economic Research, FactSet, J.P. Morgan Asset Management. Spreads measure the credit risk premium over comparable maturity U.S. Treasury bonds. The J.P. Morgan EMBI Global (EMBIG) Index is a USD-denominated external debt index tracking bonds issued by sovereigns and quasi-sovereigns in developing nations. The J.P. Morgan Corporate Emerging Bond Index Broad (CEMBI) is a USD-denominated external debt index tracking bonds issued by corporations in developing nations. The J.P. Morgan Government Bond Index – EM (GBI-EM) is a local currency denominated index tracking bonds issued by emerging market sovereigns. Past performance is not indicative of comparable future results. Index breakdown may not equate to 100% due to rounding. Guide to the Markets – U.S.Data are as of 12/31/14.
g g p

Fixed Income Sector Returns
2005 2006 2007 2008 2009 2010 2011 2012 2013 2014 4Q14 Cum. Ann.
EMD USD EMD LCL. EMD LCL. Treas. Gbl. HY EMD LCL. TIPS Gbl. HY Gbl. HY Muni Treas. Gbl. HY Gbl. HY
10.2% 15.2% 18.1% 13.7% 59.4% 15.7% 13.6% 19.6% 7.3% 8.7% 1.9% 115.3% 8.0%Barclays
10-yrs. '05 - '14
EMD LCL. Gbl. HY TIPS Gbl. Sov. EMD USD Gbl. HY Muni EMD USD Gbl. Corp. EMD USD Barclays Agg EMD USD EMD USD
6.3% 13.7% 11.6% 9.4% 29.8% 14.8% 12.3% 17.4% 1.8% 7.4% 1.8% 111.5% 7.8%
Gbl. HY EMD USD Gbl. Sov. MBS Gbl. Corp. EMD USD Treas. EMD LCL. Asset Alloc. MBS MBS EMD LCL. EMD LCL.
3.6% 9.9% 10.9% 8.3% 23.7% 12.2% 9.8% 16.8% -1.3% 6.1% 1.8% 90.4% 6.7%
TIPS Gbl. Corp. Treas. Barclays Agg EMD LCL. Asset Alloc. Barclays
Agg Gbl. Corp. MBS Barclays Agg Muni Asset Alloc. Asset Alloc.
2 8% 8 3% 9 0% 5 2% 22 0% 7 5% 7 8% 12 5% 1 4% 6 0% 1 4% 67 4% 5 3%2.8% 8.3% 9.0% 5.2% 22.0% 7.5% 7.8% 12.5% -1.4% 6.0% 1.4% 67.4% 5.3%
Treas. Gbl. Sov. Asset Alloc. Muni Asset Alloc. Gbl. Corp. EMD USD Asset Alloc. Barclays Agg Treas. Asset Alloc. Muni Muni
2.8% 7.3% 7.2% 1.5% 16.2% 7.0% 7.3% 8.3% -2.0% 5.1% 0.1% 64.4% 5.1%
Muni Asset Alloc. Barclays Agg Asset Alloc. TIPS Barclays
Agg Asset Alloc. TIPS Muni Asset Alloc. TIPS Gbl. Corp. Gbl. Corp.
2.7% 6.9% 7.0% -1.5% 11.4% 6.5% 6.9% 7.0% -2.2% 3.9% 0.0% 60.5% 4.8%
MBS MBS MBS TIPS M i TIPS MBS M i T TIPS Gbl C MBS MBSncom
e
MBS MBS MBS TIPS Muni TIPS MBS Muni Treas. TIPS Gbl. Corp. MBS MBS
2.6% 5.2% 6.9% -2.4% 9.9% 6.3% 6.2% 5.7% -2.7% 3.6% -0.3% 59.0% 4.7%Barclays
Agg Muni EMD USD EMD LCL. Barclays Agg Gbl. Sov. Gbl. Sov. Barclays
Agg Gbl. Sov. Gbl. Corp. EMD USD Barclays Agg
Barclays Agg
2.4% 4.7% 6.2% -5.2% 5.9% 6.1% 5.2% 4.2% -4.9% 2.5% -0.6% 58.4% 4.7%
Asset Alloc. Barclays Agg
Gbl. Corp. Gbl. Corp. MBS Treas. Gbl. Corp. MBS EMD USD Gbl. HY Gbl. HY Treas. Treas.
1 7% 4 3% 6 1% 11 2% 5 9% 5 9% 4 0% 2 6% 5 3% 0 0% 2 5% 53 5% 4 4%
Fixe
d In
1.7% 4.3% 6.1% -11.2% 5.9% 5.9% 4.0% 2.6% -5.3% 0.0% -2.5% 53.5% 4.4%
Gbl. Corp. Treas. Muni EMD USD Gbl. Sov. MBS Gbl. HY Treas. TIPS Gbl. Sov. Gbl. Sov. TIPS TIPS
-2.7% 3.1% 4.3% -12.0% 4.3% 5.4% 3.1% 2.0% -8.6% -2.8% -3.1% 53.4% 4.4%
Gbl. Sov. TIPS Gbl. HY Gbl. HY Treas. Muni EMD LCL. Gbl. Sov. EMD LCL. EMD LCL. EMD LCL. Gbl. Sov. Gbl. Sov.
-8.8% 0.4% 3.2% -26.9% -3.6% 4.0% -1.8% 1.8% -9.0% -5.7% -5.7% 30.3% 2.7%Source: Barclays Capital FactSet J P Morgan Asset Management Past performance is not indicative of future returns Fixed income sectors shown above are provided by Barclays
41
Source: Barclays Capital, FactSet, J.P. Morgan Asset Management. Past performance is not indicative of future returns. Fixed income sectors shown above are provided by Barclays Capital unless otherwise noted and are represented by Broad Market: Barclays Capital U.S. Aggregate Index; MBS: Fixed Rate MBS Index; Corporate: Gbl. Corporates; Municipals: Muni Bond 10-Year Index; Emerging Debt USD: J.P. Morgan EMBIG Diversified Index; Emerging Debt LCL: J.P. Morgan EM Global Index; Gbl. High Yield: Global Corporate High Yield Index; Treasuries: Barclays Capital; U.S. Treasury; TIPS: Barclays Capital TIPS; Gbl. Sovereigns: Global Treasury ex U.S.. The “Asset Allocation” portfolioassumes the following weights: 20% in MBS, 20% in Gbl. Corporate,15% in Municipals, 5% in Emerging Debt USD, 5% in Emerging Debt LCL, 10% in Gbl. High Yield, 15% in Treasuries, 5% in TIPS, 5% in Gbl. Sovereigns. Asset allocation portfolio assumes annual rebalancing. Guide to the Markets – U.S. Data are as of 12/31/14.

Global Equity Markets
Weights in MSCI All Country World Index% global market capitalization, float adjusted
Country / Region
4Q14 2014
Local USD Local USD
United States51%
Europe ex-U.K.16%
U.K. 7%EmergingMarkets
%
y g
Regions / Broad IndexesU.S. (S&P 500) - 4.9 - 13.7
EAFE 1.8 -3.5 6.4 -4.5
Europe ex-U K 0 2 -4 3 7 4 -5 811%
Japan7%
Can
ada
4%
Global Equity Market CorrelationsRolling 1 year correlations 30 countries
Europe ex-U.K. 0.2 -4.3 7.4 -5.8
Pacif ic ex-Japan 3.1 -1.5 5.8 -0.3
Emerging Markets 0.1 -4.4 5.6 -1.8
MSCI: Selected Countries
0.50
0.60
0.70
0.80
0.90Rolling 1-year correlations, 30 countries
onal
United Kingdom -0.4 -4.2 0.5 -5.4
France -1.7 -5.8 3.6 -9.0
Germany 4.0 -0.4 2.8 -9.8
Japan 6.7 -2.4 9.8 -3.7
0.00
0.10
0.20
0.30
0.40
'95 '97 '99 '01 '03 '05 '07 '09 '11 '13
Dec. 2014: 0.44
Inte
rnat
io China 7.0 7.2 8.3 8.3
India 1.5 -0.7 26.4 23.9
Brazil -7.5 -14.8 -2.8 -13.7
Russia -5.9 -32.8 -12.1 -45.9
42
95 97 99 01 03 05 07 09 11 13
Source: Standard & Poor’s, MSCI, FactSet, J.P. Morgan Asset Management.All return values are MSCI Gross Index (official) data. Chart is for illustrative purposes only. Past performance is not indicative of future results. Please see disclosure page for index definitions. Countries included in global correlations include Argentina, South Africa, Japan, UK, Canada, France, Germany, Italy, Australia, Austria, Brazil, China, Colombia, Denmark, Finland, Hong Kong, India, Malaysia, Mexico, Netherlands, New Zealand, Peru, Philippines, Portugal, Korea, Spain, Taiwan, Thailand, Turkey, United States. Guide to the Markets – U.S. Data as of 12/31/14.

International Equity Earnings and Valuations
18x
Forward Price to EarningsEarnings per Share
260’07/’08 Peak Current % Change
EPS for next 12-month consensus, local currency, rebased to 100 P/E ratios for next 12-month consensus EPSAverage Current
16x
220
240
gMSCI EM 217 167 -23%S&P 500 150 179 19%MSCI Europe 161 123 -24%
MSCI EM 11.3x 11.0xS&P 500 13.8x 16.2xMSCI Europe 12.0x 14.1x
12x
14x
180
200
10x
onal
120
140
160
6x
8x
'04 '05 '06 '07 '08 '09 '10 '11 '12 '13 '14
Inte
rnat
io
'05 '06 '07 '08 '09 '10 '11 '12 '13 '1480
100
43
04 05 06 07 08 09 10 11 12 13 14Source: MSCI, FactSet, J.P. Morgan Asset Management. Forward Price to Earnings Ratio is based on each index price, divided by consensus estimates for earnings per share (EPS) in the next 12 months (NTM), and is provided by FactSet Market Aggregates. Past performance is not indicative of future returns.
Guide to the Markets – U.S.
Data are as of 12/31/14.
05 06 07 08 09 10 11 12 13 14

Global Economic Growth
Year-over-year % chg. – forecasts from JPMSIEmerging Market Country Real GDP Growth
4Q13 1Q14 2Q14 3Q14 4Q14 1Q15 2Q15
Historical
3Q15
JPMSI Forecast
8%
10%
0%
2%
4%
6%
8%
Year over year % chg forecasts from JPMSIDeveloped Market Country Real GDP Growth
Hi t i l JPMSI F t
-4%
-2%
0%
Emerging Markets China India Korea Mexico South Africa Russia Brazil
onal
Year-over-year % chg. – forecasts from JPMSI
4Q13 1Q14 2Q14 3Q14 4Q14 1Q15 2Q15
Historical
3Q15
JPMSI Forecast
4%
6%
8%
10%
Inte
rnat
io
-4%
-2%
0%
2%
Developed Countries U S U K Canada Germany France Italy Japan
44
Source: J.P. Morgan Global Economic Research, J.P. Morgan Asset Management.
Forecast and aggregate data come from J.P. Morgan Global Economic Research. Historical growth data collected from FactSet Economics.
Guide to the Markets – U.S.
Data are as of 12/31/14.
Developed Countries U.S. U.K. Canada Germany France Italy Japan

Manufacturing Momentum
Global Purchasing Managers’ Index for Manufacturing
Jan'
13
Feb'
13
Mar
'13
Apr
'13
May
'13
Jun'
13
Jul'1
3
Aug
'13
Sep'
13
Oct
'13
Nov
'13
Dec
'13
Jan'
14
Feb'
14
Mar
'14
Apr
'14
May
'14
Jun'
14
Jul'1
4
Aug
'14
Sep'
14
Oct
'14
Nov
'14
Dec
'14
J F M A M J A S O N D J F M A M J A S O N D
Global 51.4 50.8 51.0 50.1 50.4 50.4 50.6 51.5 51.7 51.9 52.9 52.9 53.0 53.2 52.4 51.9 52.2 52.6 52.4 52.6 52.2 52.2 51.8 51.6U.S. 55.8 54.3 54.6 52.1 52.3 51.9 53.7 53.1 52.8 51.8 54.7 55.0 53.7 57.1 55.5 55.4 56.4 57.3 55.8 57.9 57.5 55.9 54.8 53.9Canada 50.5 51.7 49.3 50.1 53.2 52.4 52.0 52.1 54.2 55.6 55.3 53.5 51.7 52.9 53.3 52.9 52.2 53.5 54.3 54.8 53.5 55.3 55.3 53.9U.K. 51.0 48.2 50.1 50.4 51.9 52.5 54.5 58.0 57.0 56.4 57.9 57.0 56.5 56.5 55.5 57.0 56.4 56.7 54.9 52.6 51.6 53.3 53.5 52.5Euro Area 47.9 47.9 46.8 46.7 48.3 48.8 50.3 51.4 51.1 51.3 51.6 52.7 54.0 53.2 53.0 53.4 52.2 51.8 51.8 50.7 50.3 50.6 50.1 50.6Germany 49.8 50.3 49.0 48.1 49.4 48.6 50.7 51.8 51.1 51.7 52.7 54.3 56.5 54.8 53.7 54.1 52.3 52.0 52.4 51.4 49.9 51.4 49.5 51.2France 42.9 43.9 44.0 44.4 46.4 48.4 49.7 49.7 49.8 49.1 48.4 47.0 49.3 49.7 52.1 51.2 49.6 48.2 47.8 46.9 48.8 48.5 48.4 47.5Italy 47.8 45.8 44.5 45.5 47.3 49.1 50.4 51.3 50.8 50.7 51.4 53.3 53.1 52.3 52.4 54.0 53.2 52.6 51.9 49.8 50.7 49.0 49.0 47.5Spain 46.1 46.8 44.2 44.7 48.1 50.0 49.8 51.1 50.7 50.9 48.6 50.8 52.2 52.5 52.8 52.7 52.9 54.6 53.9 52.8 52.6 52.6 54.7 53.8Greece 41.7 43.0 42.1 45.0 45.3 45.4 47.0 48.7 47.5 47.3 49.2 49.6 51.2 51.3 49.7 51.1 51.0 49.4 48.7 50.1 48.4 48.8 49.1 49.4I l d 50 3 51 5 48 6 48 0 49 7 50 3 51 0 52 0 52 7 54 9 52 4 53 5 52 8 52 9 55 5 56 1 55 0 55 3 55 4 57 3 55 7 56 6 56 2 56 9
onal
Ireland 50.3 51.5 48.6 48.0 49.7 50.3 51.0 52.0 52.7 54.9 52.4 53.5 52.8 52.9 55.5 56.1 55.0 55.3 55.4 57.3 55.7 56.6 56.2 56.9Australia 40.2 45.6 44.4 36.7 43.8 49.6 42.0 46.4 51.7 53.2 47.7 47.6 46.7 48.6 47.9 44.8 49.2 48.9 50.7 47.3 46.5 49.4 50.1 -Japan 47.7 48.5 50.4 51.1 51.5 52.3 50.7 52.2 52.5 54.2 55.1 55.2 56.6 55.5 53.9 49.4 49.9 51.5 50.5 52.2 51.7 52.4 52.0 -China 52.3 50.4 51.6 50.4 49.2 48.2 47.7 50.1 50.2 50.9 50.8 50.5 49.5 48.5 48.0 48.1 49.4 50.7 51.7 50.2 50.2 50.4 50.0 49.6Indonesia 49.7 50.5 51.3 51.7 51.6 51.0 50.7 48.5 50.2 50.9 50.3 50.9 51.0 50.5 50.1 51.1 52.4 52.7 52.7 49.5 50.7 49.2 48.0 47.6Korea 49.9 50.9 52.0 52.6 51.1 49.4 47.2 47.5 49.7 50.2 50.4 50.8 50.9 49.8 50.4 50.2 49.5 48.4 49.3 50.3 48.8 48.7 49.0 49.9
Inte
rnat
io Korea 49.9 50.9 52.0 52.6 51.1 49.4 47.2 47.5 49.7 50.2 50.4 50.8 50.9 49.8 50.4 50.2 49.5 48.4 49.3 50.3 48.8 48.7 49.0 49.9Taiwan 51.5 50.2 51.2 50.7 47.1 49.5 48.6 50.0 52.0 53.0 53.4 55.2 55.5 54.7 52.7 52.3 52.4 54.0 55.8 56.1 53.3 52.0 51.4 -India 53.2 54.2 52.0 51.0 50.1 50.3 50.1 48.5 49.6 49.6 51.3 50.7 51.4 52.5 51.3 51.3 51.4 51.5 53.0 52.4 51.0 51.6 53.3 54.5Brazil 53.2 52.5 51.8 50.8 50.4 50.4 48.5 49.4 49.9 50.2 49.7 50.5 50.8 50.4 50.6 49.3 48.8 48.7 49.1 50.2 49.3 49.1 48.7 50.2Mexico 55.0 53.4 52.2 51.7 51.8 51.3 49.7 50.8 50.0 50.2 51.9 52.6 54.0 52.0 51.7 51.8 51.9 51.8 51.5 52.1 52.6 53.3 54.3 55.3Russia 52.0 52.0 50.8 50.6 50.4 51.7 49.2 49.4 49.4 51.8 49.4 48.8 48.0 48.5 48.3 48.5 48.9 49.1 51.0 51.0 50.4 50.3 51.7 48.9
45
Source: Markit, J.P. Morgan Asset Management.
Heatmap colors are based on PMI relative to the 50 level, which indicates acceleration or deceleration of the sector, for the time period shown.
Guide to the Markets – U.S.
Data are as of 12/31/14.

Sovereign Debt Stresses
China
10%Bubble size = 10-year
government bond yield
GDP Growth, Gross Debt to GDP and Borrowing Costs
Turkey
China
India
IndonesiaMalaysia
10%
5%
4%
6%
8%
2014
F)
g y
BrazilSouth Africa
Mexico
U.S.
y
Korea
France
GermanyJapanRussia
Singapore
P t l
EU
Australia
U.K.
0%
2%
4%
Gro
wth
(201
2 –
2
onal
Greece
ItalySpain
Portugal
-4%
-2%
Rea
l GD
P
Inte
rnat
io
-8%
-6%
0% 20% 40% 60% 80% 100% 120% 140% 160% 180% 200%Gross Debt-to-GDP Ratios (2013)
245%
Developed MarketsEmerging Markets
46
G oss ebt to G at os ( 0 3)Source: IMF, FactSet, Bloomberg, J.P. Morgan Economics, Barclays, J.P. Morgan Asset Management.Growth and debt data are based on the October 2014 World Economic Outlook.Borrowing costs based on local currency debt. EU overall borrowing cost based on Barclays Capital Euro-Aggregate 7-10 year treasury. South Africa’sborrowing cost is based on 7-year government bond yield due to data availability. Guide to the Markets – U.S.
Data are as of 12/31/14.

Europe: Cyclical Headwinds and Tailwinds
13.9%14%35%12/31/14
Government Fiscal DragEuropean Sovereign Funding Costs10-year benchmark bond yield % of potential GDP, reduction in structural deficits from one period to the next
10%
12%
25%
30%
Greece 9.42%Portugal 2.67%Italy 1.86%Spain 1.61%Ireland 1.24%Germany 0.53%
2010-2013
2013-2016
ore
fisca
l dra
g
6.0%
4.6%4 0%
6%
8%
20%
25% Mo
LTRO
3.5%4.0%
3.3% 3.1%2.7%
0.5%1.2% 1.1% 1.4%
0.5% 0.8%
0%
2%
4%
onal 10%
15%
OMT
ss fi
scal
dra
g-0.4% -0.1%
-2%
0%
Inte
rnat
io
'08 '09 '10 '11 '12 '130%
5%
Les
47
08 09 10 11 12 13Source: Tullett Prebon, FactSet, IMF, J.P. Morgan Asset Management. Data are based on the October 2014 World Economic Outlook. Government deficits are calculated by the IMF as the general government structural balance. The structural balance excludes the normal impact of the business cycle, providing a clearer measure of the independent impact of changes in government spending and taxation on demand in the economy.*Eurozone includes a J.P. Morgan Asset Management estimate for the 2016 structural deficit as a % of GDP. Guide to the Markets – U.S. Data are as of 12/31/14.

Europe: Unemployment, Inflation and Credit Markets
20%
10%
12%
Euro Area
Oct. 2014: 11.5%Unemployment Rates Euro Area Credit Growth
Nonfinancial Corporations
% year-over-year loan growth
5%
10%
15%
4%
6%
8%
10%
U.S.
Nov. 2014: 5.8%
Nonfinancial Corporations
Nov. 2014: -1.6%Households Nov. 2014:
-0.4%
-5%
%
'06 '07 '08 '09 '10 '11 '12 '13 '14'00 '01 '02 '03 '04 '05 '06 '07 '08 '09 '10 '11 '12 '13 '140%
2%
Europe Inflation
U.S.
Euro Area Asset-Backed Securities OutstandingYear over year % change € billions
onal
CoreEuro AreaPeriphery
Year-over-year % change € billions
2%
3%
4%
5%
€2 000
€2,500
€3,000
Inte
rnat
io
'05 '06 '07 '08 '09 '10 '11 '12 '13 '14-1%
0%
1%
2%
€1,000
€1,500
€2,000
'03 '04 '05 '06 '07 '08 '09 '10 '11 '12 '13
48
Source: Eurostat, BLS, SIFMA, ECBC, FactSet, IMF, J.P. Morgan Asset Management.(Top left) Unemployment rate levels for the U.S. and Euro Area are not directly comparable due to calculation differences. (Bottom right) Euro Area securitization outstanding includes Covered Bonds, Asset-Backed Securities, Residential Mortgage-Backed Securities, Commercial Real Estate Mortgage-Backed Securities, and Small and Medium-Sized Enterprise Asset-Backed Securities.Guide to the Markets – U.S.Data are as of 12/31/14.
03 04 05 06 07 08 09 10 11 12 13

Japan: Economic Snapshot
¥120
¥130
¥18,000
¥20,000Inflation and Japanese Government Bond Yields Year-over-year % change for inflation Japanese Yen per U.S. Dollar Nikkei 225
Japanese Yen and the Stock Market
6%
8%
¥90
¥100
¥110
¥120
¥10,000
¥12,000
¥14,000
¥16,000Owners of Japanese Gov. BondsOther Domestic 74%Bank of Japan 21%Foreign 4%
4%'05 '06 '07 '08 '09 '10 '11 '12 '13 '14
¥70
¥80
¥6,000
¥8,000
¥10,000
Government Fiscal Balance% of GDP IMF
0%
2%
onal
Nominal 10-year Yield % of GDP-12%
-10%
-8%
-6%
-4%
IMFforecast
'88 '90 '92 '94 '96 '98 '00 '02 '04 '06 '08 '10 '12 '14
-2%
Inte
rnat
io Core CPI
'90 '92 '94 '96 '98 '00 '02 '04 '06 '08 '10 '12 '14 '16 '18 '20
-2%
0%
2%
4%
49
88 90 92 94 96 98 00 02 04 06 08 10 12 14
Source: (Left) Bank of Japan, OECD, IMF, FactSet, J.P. Morgan Asset Management. (Right) FactSet, J.P. Morgan Asset Management.
Core CPI is defined as CPI excluding fresh food. Other Domestic includes banks, insurance and pensions, public pensions, and households. Values may not sum to 100% due to rounding. Government bond data is calculated from the Bank of Japan’s December 2014 flow of funds.
Guide to the Markets – U.S. Data are as of 12/31/14.
90 92 94 96 98 00 02 04 06 08 10 12 14 16 18 20

China: Economic and Credit Growth
16% 40%
China Real GDP ContributionYear-over-year % change Year-over-year % change, 3-month moving average for credit
Credit* vs. GDP Growth
12%30%
35%InvestmentConsumptionNet Exports
9.6%
9.2%
10.4%9.3%
Credit
Real GDP
GDP Deflator
4.5%
8.1%
5.5% 4.5%
3.9% 4.2%
8%
15%
20%
25%7.7% 7.7%
0.9% 0 4%
4.2%4.6% 4.5% 5.2%
4.1% 3.8%
0%
4%
5%
10%
15%
onal
-3.5%
0.4%
-0.4% -0.2% -0.3%
-4%
0%
2008 2009 2010 2011 2012 2013-5%
0%
'03 '04 '05 '06 '07 '08 '09 '10 '11 '12 '13 '14
Inte
rnat
i
50
03 04 05 06 07 08 09 10 11 12 13 14Source: National Bureau of Statistics of China, The People’s Bank of China, EM Advisors Group, FactSet, CEIC, J.P. Morgan Asset Management.Values may not sum to 100% due to rounding. *As defined by Total Social Financing: RMB bank loans, bankers acceptance bills, trust loans, entrusted loans, corporate bond financing, foreign currency loans, and non-financial equity financing. TSF data uses an assumption of outstanding credit in Dec. 2001. Guide to the Markets – U.S. Data are as of 12/31/14.

Demographics and Development
$60,000
The Impact of UrbanizationUrbanization ratios and GDP per capita (current USD), 1961 – 2013
Demographic Snapshot
Investment(% of GDP)
GDP Per Capita
Population % of Pop. under 20
$50,000 Japan
U.S.2013: $53,142 Developed
U.S. $53,101 316 mm 26% 20%
Canada 51,990 35 22 24
U.K. 39,567 64 24 14
( )
$30,000
$40,000
DP
per C
apita
South
Germany 44,999 81 18 17
France 43,000 64 24 19
Japan 38,491 127 18 21
Italy 34,715 60 19 17
$10,000
$20,000
G
China
South Korea
onal 1961: $2,935
y ,
Emerging
Korea 24,329 50 22 26
India 1,505 1,243 38 35
Brazil 11,311 198 33 18
$-
,
15% 25% 35% 45% 55% 65% 75% 85% 95%
Urbanization Ratio
India
Inte
rnat
io ,
Mexico 10,630 118 38 22
Russia 14,819 143 21 24
China 6,747 1,361 20 48
51
Urbanization RatioSource: FactSet, World Bank, United Nations, J.P. Morgan Global Economics Research, OECD, Bureau of Statistics of China, Ministry of Statistics & Programme Implementation of India, J.P. Morgan Asset Management.
GDP per capita and Investment as % of GDP in the Demographic Snapshot table are IMF estimates for 2014.
Guide to the Markets – U.S.
Data are as of 12/31/14.

Emerging Market Currencies
Russia
25%
2014 Currency PerformancePerformance of foreign currency versus USD
s
Commodity Exposure and External Vulnerability
ChileIndonesia
Russia
Colombia Depreciation (-0% to -10%)
17%
mm
odity
Exp
orte
rs
2014Currency Performance
-13.4%
-18.7%
-45.2%
Chile
Colombia
Russia
Brazil MexicoSouth Africa
( )
Depreciation (over -10%)
1%
9%
-8% -6% -4% -2% 0% 2% 4% 6% 8%
Net
Com
-9.5%
-11.1%
-11.2%
South Africa
Mexico
Brazil
ChinaIndia
Turkey-7%
onal
mod
ity Im
porte
rs
-2.4%
-4.0%
-8.1%
China
Korea
Turkey
Korea
-23%
-15%
Inte
rnat
io
Net
Com
m
Current Account SurplusCurrent Account Deficit
-1.7%
-2.0%
-50% -40% -30% -20% -10% 0% 10% 20%
Indonesia
India
52
Current Account SurplusCurrent Account DeficitSource: IMF, U.N. Commodity Trade Statistics Database, FactSet, J.P. Morgan Asset Management.Commodities defined by SITC codes 0-4. Net commodity exporters/importers plotted as a % of GDP. Current accounts as a percentage of GDP are IMF estimates for 2014.Guide to the Markets – U.S. Data are as of 12/31/14.

Emerging Market Equities
350
400
EM Earnings by RegionMSCI EM Index by RegionEPS for next 12-month consensus, local currency, rebased to 100
EuropeAfrica/Mideast
8%Latin America
ex Brazil7%
Brazil12%
150
200
250
300
350Latin AmericaAsia
Asia ex China & Korea
28%Korea16%
Europe10%
'05 '06 '07 '08 '09 '10 '11 '12 '13 '1450
100
150
MSCI EM Country Index by Sector
China19%
onal
Other
Commodities
Financials18%
15%23%
69%19% 14%
17%
9%
13% 7%21% 24% 31%
14%
60%
80%
100%
Inte
rnat
io TechConsumer
4%
24%10%
20% 15%35%
23%
23%14%
40%36%
15%
33% 17%
0%
20%
40%
Brazil Russia India China Mexico* Korea
53
Source: MSCI, FactSet, J.P. Morgan Asset Management. “Other” is comprised of Health Care, Industrials, Telecom, and Utilities sectors. *Mexican Telecom sector accounts for 17% of the country’s market capitalization. Values may not sum to 100% due to rounding. Guide to the Markets – U.S. Data are as of 12/31/14.
Brazil Russia India China Mexico Korea

Global Equity Valuations: Developed Markets
+5 Std Dev+6 Std Dev+7 Std Dev
Developed Market Countries
rage Expensive
relative to
Example
+3 Std Dev+2 Std Dev+1 Std Dev
Average-1 Std Dev-2 Std Dev3 Std D
+4 Std Dev
Dev
from
Glo
bal A
ve
Expensive relative to own
history
relative to world
Cheap relative to own history
Average
Current
Cheap-3 Std Dev-4 Std Dev-5 Std Dev
Std
D to own history Cheap relative to
world
World (ACWI)
EAFE Index
U.K. France Germany Australia Canada Japan Switzerland United States
Current Composite
Current 10-year avg.
onal
Fwd. P/E P/B P/CF Div. Yld. Fwd. P/E P/B P/CF Div. Yld.
World (ACWI) 0.71 14.8 2.1 8.7 2.5% 13.1 2.0 7.5 2.5%EAFE Index -0.48 14.2 1.6 7.5 3.2% 12.7 1.7 6.7 3.2%U.K. -0.76 13.8 1.8 7.3 3.9% 11.4 2.0 7.4 3.7%France -0.69 13.8 1.4 7.7 3.3% 11.5 1.6 5.9 3.5%
Composite Index
Inte
rnat
io Germany -0.58 12.9 1.6 7.5 2.9% 11.5 1.6 5.8 3.1%Australia -0.37 14.7 1.9 8.8 4.8% 13.5 2.2 9.2 4.3%Canada 0.46 15.5 1.9 8.6 2.8% 13.7 2.1 8.5 2.3%Japan 0.70 14.3 1.4 8.1 1.8% 16.1 1.4 6.4 1.6%Switzerland 1.36 15.7 2.5 11.3 3.2% 13.5 2.4 9.9 2.8%United States 2.68 16.4 2.8 11.0 1.9% 14.0 2.4 8.7 1.9%
54
Source: MSCI, FactSet, J.P. Morgan Asset Management.Note: Each valuation index shows an equally weighted composite of four metrics: price to forward earnings (Fwd. P/E), price to current book (P/B), price to last 12 months’ cash flow (P/CF) and price to last 12 months’ dividends. Results are then normalized using means and average variability over the last 10 years.The grey bars represent one standard deviation in variability relative to that of the MSCI All Country World Index (ACWI). See disclosures page at the end for metric definitions. Guide to the Markets – U.S.Data are as of 12/31/14.

Global Equity Valuations: Emerging Markets
+5 Std Dev+4 Std Dev
+6 Std Dev+7 Std Dev
Emerging Market Countries
erag
e Expensive relative to
world
Example
+3 Std Dev+2 Std Dev+1 Std Dev
Average-1 Std Dev-2 Std Dev-3 Std Dev
+4 Std Dev
Dev
from
Glo
bal A
ve
Expensive relative to own
history
world
Cheap relative to own history
Average
Current
Cheap
World(ACWI)
EM Index
Russia Brazil China Taiwan Korea Thailand South Africa
Indonesia Mexico India
-4 Std Dev-5 Std Dev-6 Std Dev
Std
D
y Cheap relative to
world
Current Composite
Current 10-year avg.
onal
Fwd. P/E P/B P/CF Div. Yld. Fwd. P/E P/B P/CF Div. Yld.World (ACWI) 0.71 14.8 2.1 8.7 2.5% 13.1 2.0 7.5 2.5%EM Index -1.49 11.0 1.4 5.4 2.8% 11.1 1.9 6.3 2.7%Russia -5.52 3.8 0.4 1.8 6.6% 7.3 1.3 4.4 2.2%Brazil -2.58 10.2 1.2 5.2 4.5% 10.0 1.8 5.6 3.2%China -2.35 9.4 1.4 4.0 3.2% 11.7 2.1 6.8 2.7%T i 0 54 13 2 1 9 6 9 3 0% 14 2 1 9 6 7 3 6%
Composite Index
Inte
rnat
io Taiwan -0.54 13.2 1.9 6.9 3.0% 14.2 1.9 6.7 3.6%Korea 0.09 9.6 1.0 5.8 1.3% 9.7 1.4 5.1 1.5%Thailand 0.22 13.2 2.1 9.4 3.0% 10.9 2.0 7.2 3.6%South Africa 1.41 15.7 2.6 11.0 3.0% 11.7 2.5 8.9 3.2%Indonesia 2.62 15.0 3.3 12.6 2.4% 12.8 3.5 10.3 2.7%Mexico 3.17 18.3 2.6 7.1 1.4% 14.7 2.8 7.5 1.8%India 3.90 16.7 3.0 12.2 1.5% 15.7 3.2 13.0 1.3%
55
Source: MSCI, FactSet, J.P. Morgan Asset Management.Note: Each valuation index shows an equally weighted composite of four metrics: price to forward earnings (Fwd. P/E), price to current book (P/B), price to last 12 months’ cash flow (P/CF) and price to last 12 months’ dividends. Results are then normalized using means and average variability over the last 10 years. The grey bars represent one standard deviation in variability relative to that of the MSCI All Country World Index (ACWI). See disclosures page at the end for metric definitions. See disclosures page at the end for metric definitions. Guide to the Markets – U.S.Data are as of 12/31/14.

Asset Class Returns
2005 2006 2007 2008 2009 2010 2011 2012 2013 2014 4Q14 Cum. Ann.MSCIEME
REITs MSCIEME
Ba rc la ys Agg
MSCIEME
REITs REITs REITs Russe ll 2 0 0 0
REITs REITs MSCIEME
MSCIEME
3 4 .5 % 3 5 .1% 3 9 .8 % 5 .2 % 7 9 .0 % 2 7 .9 % 8 .3 % 19 .7 % 3 8 .8 % 2 8 .0 % 12 .9 % 13 2 .0 % 8 .8 %
10-yrs. '05 - '14
Bbe rgCmdty
MSCIEME
Bbe rgCmdty
Ca sh MSCI EAFE
Russe ll 2 0 0 0
Ba rc la ys Agg
MSCIEME
S&P5 0 0
S&P5 0 0
Russe ll 2 0 0 0
REITs REITs
2 1.4 % 3 2 .6 % 16 .2 % 1.8 % 3 2 .5 % 2 6 .9 % 7 .8 % 18 .6 % 3 2 .4 % 13 .7 % 9 .7 % 12 2 .3 % 8 .3 %MSCI EAFE
MSCI EAFE
MSCI EAFE
Ma rke t Ne utra l
REITs MSCIEME
Ma rke t Ne utra l
MSCI EAFE
MSCI EAFE
Ba rc la ys Agg
S&P5 0 0
Russe ll 2 0 0 0
Russe ll 2 0 0 0
14 .0 % 2 6 .9 % 11.6 % 1.1% 2 8 .0 % 19 .2 % 4 .5 % 17 .9 % 2 3 .3 % 6 .0 % 4 .9 % 111.3 % 7 .8 %Russe ll Ma rke t Asse t Russe ll Bbe rg S&P Russe ll Asse t Asse t Asse t S&P S&PREITs Russe ll
2 0 0 0Ma rke t Ne utra l
Asse t Alloc .
Russe ll 2 0 0 0
Bbe rgCmdty
S&P5 0 0
Russe ll 2 0 0 0
Asse t Alloc .
Asse t Alloc .
Asse t Alloc .
S&P5 0 0
S&P5 0 0
12 .2 % 18 .4 % 9 .3 % - 2 4 .0 % 2 7 .2 % 16 .8 % 2 .1% 16 .3 % 15 .0 % 5 .2 % 2 .0 % 10 9 .5 % 7 .7 %Asse t Alloc .
S&P5 0 0
Asse t Alloc .
Russe ll 2 0 0 0
S&P5 0 0
S&P5 0 0
Ca sh S&P5 0 0
Ma rke t Ne utra l
Russe ll 2 0 0 0
Ba rc la ys Agg
Asse t Alloc .
Asse t Alloc .
8 .3 % 15 .8 % 7 .4 % - 3 3 .8 % 2 6 .5 % 15 .1% 0 .1% 16 .0 % 9 .3 % 4 .9 % 1.8 % 9 1.7 % 6 .7 %Ma rke t Ne utra l
Asse t Alloc .
Ba rc la ys Agg
Bbe rgCmdty
Asse t Alloc .
Asse t Alloc .
Asse t Alloc .
Asse t Alloc .
REITs Ca sh Ma rke t Ne utra l
MSCI EAFE
MSCI EAFEgg y
6 .1% 15 .2 % 7 .0 % - 3 5 .6 % 2 2 .2 % 12 .5 % - 0 .6 % 11.3 % 2 .9 % 0 .0 % 1.0 % 6 1.5 % 4 .9 %S&P5 0 0
Ma rke t Ne utra l
S&P5 0 0
S&P5 0 0
Bbe rgCmdty
MSCI EAFE
Russe ll 2 0 0 0
Ba rc la ys Agg
Ca sh Ma rke t Ne utra l
Ca sh Ba rc la ys Agg
Ba rc la ys Agg
4 .9 % 11.2 % 5 .5 % - 3 7 .0 % 18 .9 % 8 .2 % - 4 .2 % 4 .2 % 0 .0 % - 0 .5 % 0 .0 % 5 8 .4 % 4 .7 %Russe ll
2 0 0 0Ca sh Ca sh REITs Ba rc la ys
AggBa rc la ys
AggMSCI EAFE
Ma rke t Ne utra l
Ba rc la ys Agg
MSCIEME
MSCI EAFE
Ma rke t Ne utra l
Ma rke t Ne utra l
4 .6 % 4 .8 % 4 .8 % - 3 7 .7 % 5 .9 % 6 .5 % - 11.7 % 0 .9 % - 2 .0 % - 1.8 % - 3 .5 % 5 4 .0 % 4 .4 %
Ca sh Ba rc la ys Agg
Russe ll 2 0 0 0
MSCI EAFE
Ma rke t Ne utra l
Ca sh Bbe rgCmdty
Ca sh MSCIEME
MSCI EAFE
MSCIEME
Ca sh Ca sh
3 .0 % 4 .3 % - 1.6 % - 4 3 .1% 4 .1% 0 .1% - 13 .3 % 0 .1% - 2 .3 % - 4 .5 % - 4 .4 % 15 .7 % 1.5 %Ba rc la ys
AggBbe rgCmdty REITs MSCI
EME Ca sh Ma rke t Ne utra l
MSCIEME
Bbe rgCmdty
Bbe rgCmdty
Bbe rgCmdty
Bbe rgCmdty
Bbe rgCmdty
Bbe rgCmdty
2 .4 % 2 .1% - 15 .7 % - 5 3 .2 % 0 .1% - 0 .8 % - 18 .2 % - 1.1% - 9 .5 % - 17 .0 % - 12 .1% - 17 .1% - 1.9 %
setC
lass
Source: Russell, MSCI, Bloomberg, Standard & Poor’s, Credit Suisse, Barclays Capital, NAREIT, FactSet, J.P. Morgan Asset Management.
56
As g y p g g
The “Asset Allocation” portfolio assumes the following weights: 25% in the S&P 500, 10% in the Russell 2000, 15% in the MSCI EAFE, 5% in the MSCI EME, 25% in the Barclays Capital Aggregate, 5% in the Barclays 1-3m Treasury, 5% in the CS/Tremont Equity Market Neutral Index, 5% in the Bloomberg Commodity Index and 5% in the NAREIT Equity REIT Index. Balanced portfolio assumes annual rebalancing. All data represents total return for stated period. Past performance is not indicative of future returns. Data are as of 12/31/14, except for the CS/Tremont Equity Market Neutral Index, which reflects data through 11/30/14. “10-yrs” returns represent period of 12/31/04 – 12/31/14 showing both cumulative (Cum.) and annualized (Ann.) over the period. Please see disclosure page at end for index definitions. *Market Neutral returns include estimates found in disclosures. Guide to the Markets – U.S. Data are as of 12/31/14.

Correlations and Volatility
zU.S.
Large Cap EAFE EME Bonds
Corp. HY Munis Currcy. EMD Cmdty. REITs
Hedge Funds `
Eq Market
Neutral*Ann.
Volatility
U.S. Large Cap 1.00 0.88 0.78 -0.26 0.76 -0.09 -0.50 0.61 0.50 0.78 0.81 0.61 16%
EAFE 1.00 0.91 -0.17 0.78 -0.03 -0.72 0.70 0.63 0.68 0.87 0.74 20%
EME 1.00 -0.11 0.82 0.04 -0.66 0.79 0.67 0.58 0.89 0.58 25%
Bonds 1.00 -0.06 0.81 -0.08 0.26 -0.24 -0.01 -0.27 -0.18 3%
Corp. HY 1.00 0.16 -0.53 0.87 0.57 0.70 0.78 0.41 12%
Munis 1.00 -0.08 0.47 -0.17 0.06 -0.07 -0.11 4%
Currencies 1.00 -0.53 -0.66 -0.40 -0.58 -0.69 7%
EMD 1.00 0.49 0.62 0.66 0.34 8%
Commodities 1.00 0.36 0.72 0.45 21%
REITs 1.00 0.54 0.43 26%
Source: Standard & Poor’s, FRB, Barclays Capital Inc., MSCI Inc., Credit Suisse/Tremont, NCREIF, DJ UBS, J.P. Morgan Asset Management.
Indexes used – Large Cap: S&P 500 Index; Currencies: Federal Reserve Trade Weighted Dollar; EAFE: MSCI EAFE; EME: MSCI Emerging Markets; Bonds: Barclays Capital Aggregate; Corp HY: Barclays Capital Corporate High Yield; EMD: Barclays Capital Emerging Market; Cmdty.: DJ UBS C dit I d R l E t t NAREIT E it REIT I d H d F d CS/T t M lti St t I d E it M k t N t l
setC
lass
Hedge Funds 1.00 0.60 7%
Eq Market Neutral* 1.00 4%
57
DJ UBS Commodity Index; Real Estate: NAREIT Equity REIT Index; Hedge Funds: CS/Tremont Multi-Strategy Index; Equity Market Neutral: CS/Tremont Equity Market Neutral Index. *Market Neutral returns include estimates found in disclosures.
All correlation coefficients and annualized volatility calculated based on quarterly total return data for period 12/31/04 to 12/31/14.
This chart is for illustrative purposes only. Guide to the Markets – U.S.
Data are as of 12/31/14.
As

Alternative Asset Class Returns
2005 2006 2007 2008 2009 2010 2011 2012 2013 2014 4Q14Ann.
ReturnAnn.
VolatilityPriva te Equity
Re a l Esta te
Priva te Equity
Gbl. Ma c ro
MLPs MLPs MLPs Re a l Esta te
MLPs Re a l Esta te
Re a l Esta te
Priva te Equity
Re a l Esta te
10-yrs '05 - '14
q y q y q y2 8 .3 % 3 5 .6 % 19 .7 % 4 .7 % 7 6 .4 % 3 5 .9 % 13 .9 % 18 .0 % 2 7 .6 % 2 8 .7 % 12 .3 % 15 .0 % 2 5 .2 %Globa l Equity
Priva te Equity
MLPs Eq. Mkt. Ntrl.
Globa l Equity
Re a l Esta te
Priva te Equity
Globa l Equity
Globa l Equity
Globa l Equity
Gbl. Ma c ro
MLPs MLPs
17 .4 % 2 8 .7 % 12 .7 % - 3 .0 % 3 0 .0 % 2 6 .7 % 11.0 % 16 .5 % 2 6 .2 % 9 .9 % 3 .4 % 13 .8 % 18 .1%Re a l
Esta teMLPs Gbl.
Ma c roMrgr. Arb.
Re a l Esta te
Priva te Equity
Re a l Esta te
Priva te Equity
Priva te Equity
Gbl. Ma c ro
Globa l Equity
Re a l Esta te
Priva te Equity
13 .7 % 2 6 .1% 11.4 % - 6 .7 % 2 7 .6 % 2 0 .4 % 9 .4 % 14 .0 % 2 0 .8 % 6 .1% 3 .0 % 8 .0 % 10 .3 %
Distrsd. Globa l Equity
HF Agg. Re l. Va l. Re l. Va l. Re l. Va l. Mrgr. Arb.
Re l. Va l. Distrsd. Re l. Va l. Eq. Mkt. Ntrl.
G loba l Equity
Distrsd.
10 .4 % 17 .0 % 11.0 % - 17 .3 % 2 3 .0 % 12 .5 % 2 .3 % 9 .7 % 15 .1% 5 .2 % 1.1% 7 .0 % 9 .6 %
HF Agg. Distrsd. Re l. Va l. HF Agg. Distrsd. Distrsd. Re l. Va l. Distrsd. HF Agg. MLPs HF Agg. Re l. Va l. Globa l Equity
9 .1% 15 .3 % 10 .0 % - 18 .7 % 2 0 .2 % 12 .2 % 0 .8 % 8 .5 % 9 .6 % 4 .8 % - 0 .3 % 6 .4 % 9 .3 %
MLP Mrgr. Mrgr. Di t d HF A Globa l Di t d MLP R l V l HF A Mrgr. Di t d HF AMLPs Mrgr. Arb.
Mrgr. Arb.
Distrsd. HF Agg. Globa l Equity
Distrsd. MLPs Re l. Va l. HF Agg. Mrgr. Arb.
Distrsd. HF Agg.
6 .3 % 14 .6 % 8 .9 % - 2 2 .3 % 18 .6 % 11.1% 0 .0 % 4 .8 % 7 .5 % 4 .6 % - 0 .7 % 6 .1% 7 .8 %Eq. Mkt.
Ntrl.HF Agg. Globa l
EquityPriva te Equity
Priva te Equity
HF Agg. Gbl. Ma c ro
HF Agg. Eq. Mkt. Ntrl.
Eq. Mkt. Ntrl.
Re l. Va l. HF Agg. Re l. Va l.
6 .1% 13 .3 % 7 .7 % - 2 2 .4 % 13 .4 % 8 .5 % - 0 .7 % 4 .4 % 6 .4 % 3 .6 % - 0 .9 % 5 .3 % 6 .7 %Gbl.
Ma c roRe l. Va l. Distrsd. MLPs Mrgr.
Arb.Mrgr. Arb.
Eq. Mkt. Ntrl.
Eq. Mkt. Ntrl.
Mrgr. Arb.
Mrgr. Arb.
Distrsd. Mrgr. Arb.
Gbl. Ma c ro
setC
lass
6 .1% 12 .2 % 6 .8 % - 3 6 .9 % 11.9 % 4 .6 % - 1.5 % 3 .1% 5 .3 % 2 .0 % - 4 .0 % 4 .9 % 4 .6 %Mrgr. Arb.
Gbl. Ma c ro
Eq. Mkt. Ntrl.
Re a l Esta te
Gbl. Ma c ro
Gbl. Ma c ro
HF Agg. Mrgr. Arb.
Gbl. Ma c ro
Distrsd. MLPs Gbl. Ma c ro
Eq. Mkt. Ntrl.
5 .5 % 8 .2 % 5 .7 % - 3 7 .3 % 6 .9 % 3 .2 % - 2 .0 % 1.8 % 0 .1% 1.9 % - 12 .3 % 4 .4 % 3 .7 %
Re l. Va l. Eq. Mkt. Ntrl.
Re a l Esta te
Globa l Equity
Eq. Mkt. Ntrl.
Eq. Mkt. Ntrl.
Globa l Equity
Gbl. Ma c ro
Re a l Esta te
Priva te Equity
Priva te Equity
Eq. Mkt. Ntrl.
Mrgr. Arb.
5 .3 % 7 .0 % - 16 .3 % - 3 9 .2 % - 1.7 % 2 .5 % - 6 .0 % - 1.3 % - 0 .5 % - - 2 .7 % 3 .5 %
58
As Source: Standard & Poor’s, Alerian, HFRI, MSCI, Cambridge Associates, NAREIT, FactSet, J.P. Morgan Asset Management.
Hedge fund indices include distressed and restructuring (Distrsd.), relative value (Rel. Val.), global macro (Gbl. Macro), merger arbitrage (Mrger. Arb.), equity market neutral (Eq. Mkt. Ntrl.), and the aggregate (HF Agg.). Returns may fluctuate as hedge fund reporting occurs on a lag. QTD and YTD private equity data is unavailable and provided by Cambridge Associates. Real estate returns reflect the NAREIT Real Estate 50 Index and global equity returns reflect the MSCI AC World Index. Annualized volatility and returns are calculated from quarterly data between 12/31/04 and 12/31/14.Please see disclosure pages for index definitions. Guide to the Markets – U.S. Data are as of 12/31/14.

Fund Flows
Billions, USD AUM YTD 2014 2013 2012 2011 2010 2009 2008 2007 2006 2005 2004 2003 2002 2001 2000 1999
Mutual Fund Flows
Domestic Equity 6,283 (39) 19 (159) (133) (81) (28) (149) (68) (3) 17 100 120 (25) 57 258 176
World Equity 2,158 89 141 7 4 57 26 (80) 142 151 107 72 24 (4) (23) 58 11
Taxable Bond 2,942 39 (13) 256 129 221 301 22 100 44 21 0 40 125 76 (36) 7
Tax-exempt Bond 560 24 (58) 50 (12) 12 70 8 11 15 5 (15) (7) 17 12 (14) (12)
Cumulative Flows Into Global Stock & Bond FundsBillions USD includes both mutual funds and ETFs
Cumulative Flows Into U.S. Equity FundsBillions USD includes both mutual funds and ETFs
Hybrid 1,377 31 71 45 40 35 20 (26) 40 20 43 53 39 8 7 (37) (13)
Money Market 2,623 (75) 15 (0) (124) (525) (539) 637 654 245 62 (157) (263) (46) 375 159 194
$0
$400
$800
$800
$1,000
$1,200
$1,400
$1,600Billions, USD, includes both mutual funds and ETFs
Nov. ’14: $1,406 billion into bond funds and fixed income ETFs since ’07
Nov. ’14: $707 billion into t k f d d it
Institutional
Billions, USD, includes both mutual funds and ETFs
Nov. ’14: $626 billion into U.S. equity funds and ETFs by institutional investors since ‘07
-$800
-$400
$0
'07 '08 '09 '10 '11 '12 '13 '14$0
$200
$400
$600
$800
'07 '08 '09 '10 '11 '12 '13 '14setC
lass
Bonds
Stocks
stock funds and equity ETFs since ’07
RetailNov. ’14: $643 billion out of U.S. equity funds and ETFs by retail investors since ’07
59
07 08 09 10 11 12 13 14
As Source: Investment Company Institute, J.P. Morgan Asset Management.
TOP: Data includes flows through November 2014 and excludes ETFs. BOTTOM: Data includes flow through November 2014 and includes ETFs. ICI data are subject to periodic revisions. World equity flows are inclusive of emerging market, global equity and regional equity flows. Hybrid flows include asset allocation, balanced fund, flexible portfolio and mixed income flows.Guide to the Markets – U.S.Data are as of 12/31/14.

Yield Alternatives: Domestic and Global
20%
S&P 500 Total Return: Dividends vs. Capital AppreciationAverage annualized returns Capital Appreciation
Dividends
4.7% 5.4% 6.0% 5.1% 3.3% 4.2% 4.4% 2.5%1.8% 4.0%
13.9%
3.0%
13.6%
4.4%1.6%
12.6% 15.3%
2 7%
5.8%
0%
5%
10%
15%
-5.3% -2.7%
-10%
-5%
1926 - 1929 1930's 1940's 1950's 1960's 1970's 1980's 1990's 2000's 1926 to 2013
Equity Dividend Yields REIT YieldsMajor world markets annualized Major world markets annualizedMajor world markets, annualized
10-year government bond yield
10-year government bond yield
Major world markets, annualized
3.6%
5.8% 5.6%
5.0%
4.1%3.8%4%
5%
6%
7%4.6%
3.8%
3.3%2.9% 2.8%
2.5%3%
4%
5%
setC
lass
3.0% 2.9%
0%
1%
2%
3%
U.S. Canada Singapore France Australia Global U.K. Japan
2.0%
1.8%
0%
1%
2%
U.S. Australia U.K. France Canada Switzerland ACWI Japan
60
As
Source: (Top chart) Standard & Poor’s, Ibbotson, J.P. Morgan Asset Management. (Bottom right) FactSet, NAREIT, J.P. Morgan Asset Management. Dividend vs. capital appreciation returns are through 12/31/13. Yields shown are that of the appropriate FTSE NAREIT REIT index, which excludes property development companies. (Bottom left) FactSet, MSCI, J.P. Morgan Asset Management. Yields shown are that of the appropriate MSCI index. Guide to the Markets – U.S.
Data are as of 12/31/14.
g p pp

Global Real Assets
12%25%
Commercial Vacancy Rates by SectorPercent at year end
Property appreciation and Operating Income growth
Sector 2013
YoY NCREIF OECD unlevered property appreciation and NOI growthAppreciation
0%
4%
8%
20%
Sector 2013 Office 16.7%Retail 10.1%Industrial 9.5%Apartment 4.2%
Net Operating Income Growth
-8%
-4%
'10 '11 '12 '13 '1415%
Allowed Return on Equity over the Cost of DebtOECD Infrastructure
Net Operating Income Growth
8%
10%
12%
14%
16%
5%
10%
OECD Infrastructure
Electric
Nat. Gas
Utility
Recession
0%
2%
4%
6%
8%
'70 '80 '90 '00 '10setC
lass
0%
5%
'90 '92 '94 '96 '98 '00 '02 '04 '06 '08 '10 '12
Utility bond10y UST
61
70 80 90 00 10
As 90 92 94 96 98 00 02 04 06 08 10 12
Source: Reis, Inc., PREA, NCREIF, Regulatory Research Associates, Barclays Capital, FactSet, J.P. Morgan Asset Management. Vacancy rate data provided by Reis, Inc. Guide to the Markets – U.S.Data are as of 12/31/14.

Global Commodities
Commodity Prices Gold Prices$ / oz$3,000
Gold Inflation Adjusted450
Weekly index prices rebased to 100
$1,000
$1,500
$2,000
$2,500 Dec. 2014: $1,206
Gold, Inflation AdjustedGold
350
400 Precious Metals
Commodity Prices and InflationYear-over-year % chg
'75 '80 '85 '90 '95 '00 '05 '10$0
$500
250
300Industrial Metals
2%
4%
6%
8%
20%
40%
60%
80%Year-over-year % chg.
Headline CPI (Y/Y % chg.)
DJ-UBS Commodity Index (Y/Y % chg.)
100
150
200
CPI Basket
setC
lass
'96 '98 '00 '02 '04 '06 '08 '10 '12 '14-6%
-4%
-2%
0%
-60%
-40%
-20%
0%
'05 '06 '07 '08 '09 '10 '11 '12 '13 '140
50
100
Energy
LivestockGrains
CPI Basket
62
As 96 98 00 02 04 06 08 10 12 14
Source: Dow Jones/UBS, EcoWin, BLS, U.S. Department of Energy, FactSet, J.P. Morgan Asset Management. CPI adjusted gold values are calculated using monthly averages of gold spot prices divided by the CPI value for that month. CPI is rebased to 100 at the end of the chart. Returns based on nominal prices. Commodity prices represented by the appropriate Bloomberg Commodity sub-index. Guide to the Markets – U.S.
Data are as of 12/31/14.
05 06 07 08 09 10 11 12 13 14

Life Expectancy and Pension Shortfall
100% 25
Probability of Reaching Ages 80 and 90 Perceived retirement shortfall by country
MenExpected savings shortfall (years)
Savings expected to last (years)
Persons aged 65, by gender, and combined couple
69%
87%
80%20
Men
WomenCouple – at least one lives to specified age
7
10
11
58%60%
10
15 8
10
108
10
8
10
58
6
18%
28%
41%
20%
40%
108
14
911 11
9
1210 10 9 95
18%
0%
20%
80 Years 90 Years
0A
vera
ge
U.S
.
Fran
ce
Chi
na
Can
ada
Aus
tralia
U.K
.
Bra
zil
Sing
apor
e
Indi
a
UA
E
Mex
ico
setC
lass
63
80 Years 90 Years S
Source: (Left) SSA 2010 Life Tables, J.P. Morgan Asset Management. (Right) “The Future of Retirement: A new reality” study by HSBC, J.P. Morgan Asset Management. Figures represent the expected portion of retirement that will not be covered by retirement savings based on survey data. Guide to the Markets – U.S. Data as of 12/31/14.
As

Historical Returns by Holding Period
Annual total returns, 1950 – 2014Range of Stock, Bond and Blended Total Returns
Annual Avg. T t l R t
Growth of $100,000 20
60%
50/50 Portfolio 9.0% $565,743Bonds 6.2% $327,106Stocks 10.8% $833,227
Total Return over 20 years51%
43%
32%30%
40%
50%
6% 5%
32%28%
23% 21%19% 16% 17%
18%
12%14%
10%
20%
30%
Stocks
-8%
-15%
-2% -2% 1% -1% 1% 2%6%
1%5%
-20%
-10%
0%
setC
lass 50/50 Portfolio
Bonds
-37%
-40%
-30%
1-yr. 5-yr. rolling
10-yr. rolling
20-yr. rolling
64
As
Sources: Barclays Capital, FactSet, Robert Shiller, Strategas/Ibbotson, Federal Reserve, J.P. Morgan Asset Management.
Returns shown are based on calendar year returns from 1950 to 2014. Growth of $100,000 is based on annual average total returns from 1950-2014. Guide to the Markets – U.S.
Data are as of 12/31/14.
rolling rolling rolling

Diversification and the Average Investor
Equity Mkt. Neutral
Commodities
Source: Morningstar Direct, Dalbar Inc., J.P. Morgan Asset Management. (Top) Indexes and weights of the traditional portfolio are as follows: U.S. Stocks: 55% S&P 500; U.S. Bonds: 30% Barclays Capital Aggregate; I t ti l St k 15% MSCI EAFE
Traditional Portfolio More Diversified PortfolioMaximizing the Power of Diversification (1994 – 2013)
8%8%
8%
22%13%4%
26%
Commodities
REIT
S&P 500
Russell 2000
MSCI EAFE
55%
15%
30% S&P 500
MSCI EAFE
Barclays Agg.
International Stocks: 15% MSCI EAFE. Portfolio with 25% in alternatives is as follows: U.S. Stocks: 22.2% S&P 500, 8.8% Russell 2000; International Stocks: 4.4% MSCI EM, 13.2% MSCI EAFE; U.S. Bonds: 26.5% Barclays Capital Aggregate; Alternatives: 8.3% CS/Tremont Equity Market Neutral: 8.3%, DJ/UBS Commodities: 8.3% 22%
9%13% MSCI EAFE
MSCI EM
Barclays Agg.
15%y gg ,
NAREIT Equity REIT Index. Return and standard deviation calculated using Morningstar Direct.Charts are shown for illustrative purposes only. Past performance is not indicative of future returns. Diversification does not guarantee investment returns and does not li i t i k f l (B tt ) I d
Return: 8.02%Standard Deviation: 10.64%
Return: 7.95%Standard Deviation: 9.71%
20-year Annualized Returns by Asset Class (1994 – 2013)eliminate risk of loss. (Bottom) Indexes used are as follows: REITS: NAREIT Equity REIT Index, EAFE: MSCI EAFE, Oil: WTI Index, Bonds: Barclays Capital U.S. Aggregate Index, Homes: median sale price of existing single-family homes, Gold: USD/troy oz, Inflation: CPI. Average asset allocation investor return is based on an analysis by
10.3% 10.2%9.2%10%
12%
y yDalbar Inc., which utilizes the net of aggregate mutual fund sales, redemptions and exchanges each month as a measure of investor behavior. Returns are annualized (and total return where applicable) and represent the 20-year period ending 12/31/13 to match Dalbar’s most recent analysis Guide to the Markets U Sse
tCla
ss 6.1% 5.8% 5.7%
3.1%2.5% 2.4%
4%
6%
8%
65
analysis. Guide to the Markets – U.S. Data are as of 12/31/14. A
s
0%
2%
REITs Oil S&P 500 EAFE Gold Bonds Homes Average Investor
Inflation

Cash Accounts
$ BillionsWeight in
Money Supply
Money SupplyComponent
$8 000
$10,000Annual Income Generated by $100,000 Investment in a 6-mo. CD
S pp y
M2-M1 8,710 78.1%
Retail MMMFs 628 5.6%$4,000
$6,000
$8,000
2014:
2006: $5,240
Savings deposits 7,558 67.8%
Small time deposits 524 4.7%
'90 '95 '00 '05 '10 '15$0
$2,000
M2 Money Supply as a % of Nominal GDP
$130
p
Institutional MMMFs 1,788 16.0%
652 5.8% Cash in IRA & Keoght55%
60%
65%
70%3Q14: 65.0%
Average: 53 0% %
Total 11,149 100.0%
accounts
'80 '85 '90 '95 '00 '05 '10 '1540%
45%
50%
Average: 53.0%
setC
lass
66
Source: Federal Reserve, St. Louis Fed, Bankrate.com, J.P. Morgan Asset Management. All cash measures obtained from the Federal Reserve are seasonally adjusted monthly numbers. All numbers are in billions of U.S. dollars. Small-denomination time deposits are those issued in amounts of less than $100,000. All IRA and Keogh account balances at commercial banks and thrift institutions are subtracted from small time deposits. Annual income is for illustrative purposes and is calculated based on the 6-month CD yield on average during each year and $100,000 invested. IRA and Keogh account balances at money market mutual funds are subtracted from retail money funds. Past performance is not indicative of comparable future results. Guide to the Markets – U.S. Data are as of 12/31/14.
As

Corporate DB Plans and Endowments
100%
105%$2.5
Asset Allocation: Corporate DB Plans vs. Endowments
Corporate Defined Benefit PlansEndowments Funded Status (%)Trillions ($)
Defined Benefit Plans: Russell 3000 Companies
80%
85%
90%
95%
100%
$1.0
$1.5
$2.0Corporate Defined Benefit Plans
Assets ($)Liabilities ($)
38 0%
48.0%
9.0%
27.0%
Fixed Income
Equities
70%
75%
80%
$0.0
$0.5
'07 '08 '09 '10 '11 '12 '13 Q3 '14*
Pension Return Assumptions: S&P 500 companies
4.0%
38.0%
15.9%
20.1%
Private Equity
Hedge Funds
27% 29%
20%20%
34%
13%20%
30%
40%
Com
pani
es
2.0%
2.0%
7.3%
17.7%Real Estate
Private Equity
0% 1% 1% 1%
5%9%
7%10%
6%
12% 13%
3%0% 0% 0%
0%
10%
< 6% 6 to 6.5%
6.5 to 7%
7 to 7.5%
7.5 to 8%
8 to 8.5%
8.5 to 9%
9 to 9.5%
9.5 to 10%
> 10%
Return Assumption
% o
f C
setC
lass
4.0%
3.0%
3.0%
0% 10% 20% 30% 40% 50% 60%
Cash
Other
67
Return AssumptionSource: NACUBO (National Association of College and University Business Officers), Towers Watson, Compustat/FactSet, J.P. Morgan Asset Management. Asset allocation as of 2012. *Funded status for 3Q14 estimated using market returns. Endowments represents dollar-weighted average data of 842 colleges and universities. Pension Return Assumptions based on all available and reported data from S&P 500 Index companies. Pension Assets, Liabilities and Funded Status based on Russell 3000 companies reporting pension data. Return assumption bands are inclusive of upper range. All information is shown for illustrative purposes only.
Guide to the Markets – U.S. Data are as of 12/31/14.
As 0% 10% 20% 30% 40% 50% 60%

J.P. Morgan Asset Management – Index Definitions
All indexes are unmanaged and an individual cannot invest directly in an index. Index returns do not include fees or expenses. The S&P 500 Index is widely regarded as the best single gauge of the U.S. equities market. This world-renowned index includes a representative sample of 500 leading companies in leading industries of the U.S. economy. Although the S&P 500 Index focuses on the large-cap segment of the market, with approximately 75% coverage of U.S. equities, it is also an ideal proxy for the total market. An investor cannot invest directly in an index. Th S&P 400 Mid C I d i i f 400 k i h id f h d i k
The MSCI Small Cap IndicesSM target 40% of the eligible Small Cap universe within each industry group, within each country. MSCI defines the Small Cap universe as all listed securities that have a market capitalization in the range of USD200-1,500 million. The MSCI Value and Growth IndicesSM cover the full range of developed, emerging and All Country MSCI Equity indexes. As of the close of May 30, 2003, MSCI implemented an enhanced methodology for the MSCI Global Value and Growth Indices, adopting a two dimensional framework for style segmentation in which value and growth
The S&P 400 Mid Cap Index is representative of 400 stocks in the mid-range sector of the domestic stock market, representing all major industries.The Russell 3000 Index® measures the performance of the 3,000 largest U.S. companies based on total market capitalization. The Russell 1000 Index ® measures the performance of the 1,000 largest companies in the Russell 3000. The Russell 1000 Growth Index ® measures the performance of those Russell 1000 companies with higher price-to-book ratios and higher forecasted growth values. The Russell 1000 Value Index ® measures the performance of those Russell 1000 companies with lower price-t b k ti d l f t d th l
securities are categorized using different attributes - three for value and five for growth including forward-looking variables. The objective of the index design is to divide constituents of an underlying MSCI Standard Country Index into a value index and a growth index, each targeting 50% of the free-float adjusted market capitalization of the underlying country index. Country Value/Growth indices are then aggregated into regional Value/Growth indices. Prior to May 30, 2003, the indices used Price/Book Value (P/BV) ratios to divide the standard MSCI country indices into value and growth indices. All securities were classified as either "value" securities (low P/BV securities) or "growth" securities (high P/BV securities), relative to each MSCI country index.The following MSCI Total Return IndicesSM are calculated with gross dividends:This series approximates the maximum possible dividend reinvestment. The amount reinvested is the dividend distributed to individuals resident in the country of the company but does not include tax creditsto-book ratios and lower forecasted growth values.
The Russell Midcap Index ® measures the performance of the 800 smallest companies in the Russell 1000 Index. The Russell Midcap Growth Index ® measures the performance of those Russell Midcap companies with higher price-to-book ratios and higher forecasted growth values. The stocks are also members of the Russell 1000 Growth index. The Russell Midcap Value Index ® measures the performance of those Russell Midcap companies with lower price-to-book ratios and lower forecasted growth values. The stocks are also members of the Russell 1000 Value index.
distributed to individuals resident in the country of the company, but does not include tax credits.The MSCI Europe IndexSM is a free float-adjusted market capitalization index that is designed to measure developed market equity performance in Europe. As of June 2007, the MSCI Europe Index consisted of the following 16 developed market country indices: Austria, Belgium, Denmark, Finland, France, Germany, Greece, Ireland, Italy, the Netherlands, Norway, Portugal, Spain, Sweden, Switzerland and the United Kingdom. The MSCI Pacific IndexSM is a free float-adjusted market capitalization index that is designed to measure equity market performance in the Pacific region. As of June 2007, the MSCI Pacific Index consisted of the following 5 Developed Market countries: Australia, Hong Kong, Japan, New Zealand, and Singapore. Credit Suisse/Tremont Hedge Fund Index is compiled by Credit Suisse Tremont Index, LLC. It is an asset-index.
The Russell 2000 Index ® measures the performance of the 2,000 smallest companies in the Russell 3000 Index.The Russell 2000 Growth Index ® measures the performance of those Russell 2000 companies with higher price-to-book ratios and higher forecasted growth values. The Russell 2000 Value Index ® measures the performance of those Russell 2000 companies with lower price-to-book ratios and lower forecasted growth values. The Russell Top 200 Index ® measures the performance of the largest cap segment of the U.S. equity universe. It includes approximately 200 of the largest securities based on a combination of their market cap and current
g p y ,weighted hedge fund index and includes only funds, as opposed to separate accounts. The Index uses the Credit Suisse/Tremont database, which tracks over 4500 funds, and consists only of funds with a minimum of US$50 million under management, a 12-month track record, and audited financial statements. It is calculated and rebalanced on a monthly basis, and shown net of all performance fees and expenses. It is the exclusive property of Credit Suisse Tremont Index, LLC. The NCREIF Property Index is a quarterly time series composite total rate of return measure of investment performance of a very large pool of individual commercial real estate properties acquired in the private market for investment purposes only. All properties in the NPI have been acquired, at least in part, on behalf of tax-exempt institutional investors - the great majority being pension funds. As such, all properties are held in a fiduciary
i pp y g p
index membership and represents approximately 68% of the U.S. market. The MSCI® EAFE (Europe, Australia, Far East) Net Index is recognized as the pre-eminent benchmark in the United States to measure international equity performance. It comprises 21 MSCI country indexes, representing the developed markets outside of North America. The MSCI Emerging Markets IndexSM is a free float-adjusted market capitalization index that is designed to measure equity market performance in the global emerging markets. As of June 2007, the MSCI Emerging Markets Index consisted of the following 25 emerging market country indices: Argentina, Brazil, Chile, China, Colombia, Czech Republic, Egypt, Hungary, India, Indonesia, Israel, Jordan, Korea, Malaysia, Mexico, Morocco, Pakistan, Peru, Philippines, Poland, Russia, South Africa, Taiwan, Thailand, and Turkey.
environment. The NAREIT EQUITY REIT Index is designed to provide the most comprehensive assessment of overall industry performance, and includes all tax-qualified real estate investment trusts (REITs) that are listed on the NYSE, the American Stock Exchange or the NASDAQ National Market List.The Dow Jones Industrial Average measures the stock performance of 30 leading blue-chip U.S. companies.The Bloomberg Commodity Index is composed of futures contracts on physical commodities and represents twenty two separate commodities traded on U.S. exchanges, with the exception of aluminum, nickel, and zinc.
68
Pakistan, Peru, Philippines, Poland, Russia, South Africa, Taiwan, Thailand, and Turkey.The MSCI ACWI (All Country World Index) Index is a free float-adjusted market capitalization weighted index that is designed to measure the equity market performance of developed and emerging markets. As of June 2009 the MSCI ACWI consisted of 45 country indices comprising 23 developed and 22 emerging market country indices.

J.P. Morgan Asset Management – Index Definitions
Municipal Bond Index: To be included in the index, bonds must be rated investment-grade (Baa3/BBB- or higher) by at least two of the following ratings agencies: Moody's, S&P, Fitch. If only two of the three agencies rate the security, the lower rating is used to determine index eligibility. If only one of the three agencies rates a security, the rating must be investment-grade. They must have an outstanding par value of at least $7 million and be issued as part of a transaction of at least $75 million. The bonds must be fixed rate, have a dated-date after December 31, 1990, and must be at least one year from their maturity date. Remarketed issues, taxable municipal bonds, bonds with floating rates and derivatives are excluded from the benchmark
All indexes are unmanaged and an individual cannot invest directly in an index. Index returns do not include fees or expenses. The S&P GSCI Index is a composite index of commodity sector returns representing an unleveraged, long-only investment in commodity futures that is broadly diversified across the spectrum of commodities. The returns are calculated on a fully collateralized basis with full reinvestment. Individual components qualify for inclusion in the index on the basis of liquidity and are weighted by their respective world production quantities.
with floating rates, and derivatives are excluded from the benchmark.The Barclays Capital Emerging Markets Index includes USD-denominated debt from emerging markets in the following regions: Americas, Europe, Middle East, Africa, and Asia. As with other fixed income benchmarks provided by Barclays Capital, the index is rules-based, which allows for an unbiased view of the marketplace and easy replicability.The Barclays Capital MBS Index covers the mortgage-backed pass-through securities of Ginnie Mae, Fannie Mae, and Freddie Mac. Aggregate components must have a weighted average maturity of at least one year, must have $250 million par amount outstanding, and must be fixed rate mortgages.The Barclays Capital Corporate Bond Index is the Corporate component of the U.S. Credit index.
The Barclays Capital U.S. Aggregate Index represents securities that are SEC-registered, taxable, and dollar denominated. The index covers the U.S. investment grade fixed rate bond market, with index components for government and corporate securities, mortgage pass-through securities, and asset-backed securities. These major sectors are subdivided into more specific indexes that are calculated and reported on a regular basis. This U.S. Treasury Index is a component of the U.S. Government index. West Texas Intermediate (WTI) is the underlying commodity for the New York Mercantile Exchange's oil futures contracts. The Barclays Capital High Yield Index covers the universe of fixed rate, non-investment grade debt. Pay-in-kind (PIK) bonds Eurobonds and debt issues from countries designated as emerging markets (e g Argentina Brazil
The Barclays Capital TIPS Index consists of Inflation-Protection securities issued by the U.S. Treasury.The J.P. Morgan EMBI Global Index includes U.S. dollar denominated Brady bonds, Eurobonds, traded loans and local market debt instruments issued by sovereign and quasi-sovereign entities.The J.P. Morgan Domestic High Yield Index is designed to mirror the investable universe of the U.S. dollar domestic high yield corporate debt market. The CS/Tremont Equity Market Neutral Index takes both long and short positions in stocks with the aim of minimizing exposure to the systematic risk of the market (i.e., a beta of zero).The CS/Tremont Multi-Strategy Index consists of funds that allocate capital based on perceived opportunities
(PIK) bonds, Eurobonds, and debt issues from countries designated as emerging markets (e.g., Argentina, Brazil, Venezuela, etc.) are excluded, but Canadian and global bonds (SEC registered) of issuers in non-EMG countries are included. Original issue zeroes, step-up coupon structures, and 144-As are also included.The Barclays Capital 1-3 Month U.S. Treasury Bill Index includes all publicly issued zero-coupon U.S. Treasury Bills that have a remaining maturity of less than 3 months and more than 1 month, are rated investment grade, and have $250 million or more of outstanding face value. In addition, the securities must be denominated in U.S. dollars and must be fixed rate and non convertible.The Barclays Capital General Obligation Bond Index is a component of the Barclays Capital Municipal Bond Index. To be included in the index, bonds must be general obligation bonds rated investment-grade (Baa3/BBB- or higher) by at least two of the following ratings agencies: Moody's S&P Fitch If only two of the three agencies rate e CS/ e o t u t St ategy de co s s s o u ds a a oca e cap a based o pe ce ed oppo u es
among several hedge fund strategies. Strategies adopted in a multi-strategy fund may include, but are not limited to, convertible bond arbitrage, equity long/short, statistical arbitrage and merger arbitrage.The Barclays U.S. Dollar Floating Rate Note (FRN) Index provides a measure of the U.S. dollar denominated floating rate note market.*Market Neutral returns for November 2008 are estimates by J.P. Morgan Funds Market Strategy, and are based on a December 8, 2008 published estimate for November returns by CS/Tremont in which the Market Neutral returns were estimated to be +0.85% (with 69% of all CS/Tremont constituents having reported return data). Presumed to be excluded from the November return are three funds, which were later marked to $0 by CS/Tremont
higher) by at least two of the following ratings agencies: Moody s, S&P, Fitch. If only two of the three agencies rate the security, the lower rating is used to determine index eligibility. If only one of the three agencies rates a security, the rating must be investment-grade. They must have an outstanding par value of at least $7 million and be issued as part of a transaction of at least $75 million. The bonds must be fixed rate, have a dated-date after December 31, 1990, and must be at least one year from their maturity date. Remarketed issues, taxable municipal bonds, bonds with floating rates, and derivatives, are excluded from the benchmark.The Barclays Capital Revenue Bond Index is a component of the Barclays Capital Municipal Bond Index. To be included in the index, bonds must be revenue bonds rated investment-grade (Baa3/BBB- or higher) by at least two of the following ratings agencies: Moody's, S&P, Fitch. If only two of the three agencies rate the security, the lower rating is used to determine index eligibility If only one of the three agencies rates a security the rating must in connection with the Bernard Madoff scandal. J.P. Morgan Funds believes this distortion is not an accurate
representation of returns in the category. CS/Tremont later published a finalized November return of -40.56% for the month, reflecting this mark-down. CS/Tremont assumes no responsibility for these estimates.
lower rating is used to determine index eligibility. If only one of the three agencies rates a security, the rating must be investment-grade. They must have an outstanding par value of at least $7 million and be issued as part of a transaction of at least $75 million. The bonds must be fixed rate, have a dated-date after December 31, 1990, and must be at least one year from their maturity date. Remarketed issues, taxable municipal bonds, bonds with floating rates, and derivatives, are excluded from the benchmark.The Barclays High Yield Municipal Index includes bonds rated Ba1 or lower or non-rated bonds using the middle rating of Moody’s, S&P and Fitch.The Barclays Capital Taxable Municipal Bond Index is a rules-based, market-value weighted index engineered for the long-term taxable bond market. To be included in the index, bonds must be rated investment-grade (Baa3/BBB- or higher) by at least two of the following ratings agencies if all three rate the bond: Moody's S&P
69
(Baa3/BBB- or higher) by at least two of the following ratings agencies if all three rate the bond: Moody s, S&P, Fitch. If only two of the three agencies rate the security, the lower rating is used to determine index eligibility. If only one of the three agencies rates a security, the rating must be investment-grade. They must have an outstanding par value of at least $7 million and be issued as part of a transaction of at least $75 million. The bonds must be fixed rate and must be at least one year from their maturity date. Remarketed issues (unless converted to fixed rate), bonds with floating rates, and derivatives, are excluded from the benchmark.

J.P. Morgan Asset Management – Definitions, Risks & Disclosures
Bonds are subject to interest rate risks. Bond prices generally fall when interest rates rise.The price of equity securities may rise, or fall because of changes in the broad market or changes in a company’s financial condition, sometimes rapidly or unpredictably. These price movements may result from factors affecting individual companies, sectors or industries, or the securities market as a whole, such as changes in economic or political conditions. Equity securities are subject to “stock market risk” meaning that stock prices in general may decline over short or extended periods of time. S ll it li ti i ti t i ll i i k th i ti i ll t bli h d "bl hi " i
The HFRI Monthly Indices (HFRI) are equally weighted performance indexes, utilized by numerous hedge fund managers as a benchmark for their own hedge funds. The HFRI are broken down into 4 main strategies, each with multiple substrategies. All single-manager HFRI Index constituents are included in the HFRI Fund Weighted Composite, which accounts for over 2200 funds listed on the internal HFR Database.Equity Market Neutral Strategies employ sophisticated quantitative techniques of analyzing price data to ascertain information about future price movement and relationships between securities, select securities for purchase and sale Equity Market Neutral Strategies typically maintain characteristic net equity market exposure no Small-capitalization investing typically carries more risk than investing in well-established "blue-chip" companies
since smaller companies generally have a higher risk of failure. Historically, smaller companies' stock has experienced a greater degree of market volatility than the average stock.Mid-capitalization investing typically carries more risk than investing in well-established "blue-chip" companies. Historically, mid-cap companies' stock has experienced a greater degree of market volatility than the average stock.Real estate investments may be subject to a higher degree of market risk because of concentration in a specific industry, sector or geographical sector. Real estate investments may be subject to risks including, but not limited to, declines in the value of real estate, risks related to general and economic conditions, changes in the value of the underlying property owned by the trust and defaults by borrower
purchase and sale. Equity Market Neutral Strategies typically maintain characteristic net equity market exposure no greater than 10% long or short.Distressed Restructuring Strategies employ an investment process focused on corporate fixed income instruments, primarily on corporate credit instruments of companies trading at significant discounts to their value at issuance or obliged (par value) at maturity as a result of either formal bankruptcy proceeding or financial market perception of near term proceedings.Merger Arbitrage Strategies which employ an investment process primarily focused on opportunities in equity and equity related instruments of companies which are currently engaged in a corporate transaction. Global Macro Strategies trade a broad range of strategies in which the investment process is predicated on the underlying property owned by the trust and defaults by borrower.
International investing involves a greater degree of risk and increased volatility. Changes in currency exchange rates and differences in accounting and taxation policies outside the U.S. can raise or lower returns. Also, some overseas markets may not be as politically and economically stable as the United States and other nations. Investments in emerging markets can be more volatile. As mentioned above, the normal risks of investing in foreign countries are heightened when investing in emerging markets. In addition, the small size of securities markets and the low trading volume may lead to a lack of liquidity, which leads to increased volatility. Also, emerging markets may not provide adequate legal protection for private or foreign investment or private property.Investments in commodities may have greater volatility than investments in traditional securities, particularly if the instruments involve leverage The value of commodity linked derivative instruments may be affected by changes in
g g g p pmovements in underlying economic variables and the impact these have on equity, fixed income, hard currency and commodity markets.Relative Value Strategies maintain positions in which the investment thesis is predicated on realization of a valuation discrepancy in the relationship between multiple securities. The Cambridge Associates LLC U.S. Private Equity Index® is an end-to-end calculation based on data compiled from 1,052 U.S. private equity funds (buyout, growth equity, private equity energy and mezzanine funds), including fully liquidated partnerships, formed between 1986 and 2013.The Alerian MLP Index is a composite of the 50 most prominent energy Master Limited Partnerships (MLPs) that provides investors with an unbiased comprehensive benchmark for the asset classinstruments involve leverage. The value of commodity-linked derivative instruments may be affected by changes in
overall market movements, commodity index volatility, changes in interest rates, or factors affecting a particular industry or commodity, such as drought, floods, weather, livestock disease, embargoes, tariffs and international economic, political and regulatory developments. Use of leveraged commodity-linked derivatives creates an opportunity for increased return but, at the same time, creates the possibility for greater loss.Investing in alternative assets involves higher risks than traditional investments and is suitable only for sophisticated investors. Alternative investments involve greater risks than traditional investments and should not be deemed a complete investment program. They are not tax efficient and an investor should consult with his/her tax advisor prior to investing. Alternative investments have higher fees than traditional investments and they may also be highly leveraged and engage in speculative investment techniques, which can magnify the potential for
provides investors with an unbiased, comprehensive benchmark for the asset class.
g y g g g p q g y pinvestment loss or gain. The value of the investment may fall as well as rise and investors may get back less than they invested.Derivatives may be riskier than other types of investments because they may be more sensitive to changes in economic or market conditions than other types of investments and could result in losses that significantly exceed the original investment. The use of derivatives may not be successful, resulting in investment losses, and the cost of such strategies may reduce investment returns. Price to forward earnings is a measure of the price-to-earnings ratio (P/E) using forecasted earnings. Price to book value compares a stock's market value to its book value. Price to cash flow is a measure of the market's expectations of a firm's future financial health. Price to dividends is the ratio of the price of a share on a stock
h t th di id d h id i th i d f ' t ti l
70
exchange to the dividends per share paid in the previous year, used as a measure of a company's potential as an investment.There is no guarantee that the use of long and short positions will succeed in limiting an investor's exposure to domestic stock market movements, capitalization, sector swings or other risk factors. Using long and short selling strategies may have higher portfolio turnover rates. Short selling involves certain risks, including additional costs associated with covering short positions and a possibility of unlimited loss on certain short sale positions.

J.P. Morgan Asset Management – Risks & Disclosures
The Market Insights program provides comprehensive data and commentary on global markets without reference to products. Designed as a tool to help clients understand the markets and support investment decision-making, the program explores the implications of current economic data and changing market conditions. The views contained herein are not to be taken as an advice or recommendation to buy or sell any investment in any jurisdiction, nor is it a commitment from J.P. Morgan Asset Management or any of its subsidiaries to participate in any of the transactions mentioned herein. Any forecasts, figures, opinions or investment techniques and strategies set out are for information purposes only, based on certain assumptions and current market conditions and are subject to change without prior notice. All information presented herein is considered to be accurate at the time of writing, but no warranty of accuracy is given and no liability in respect of any error or omission is accepted. This material should not be relied pon b o in e al ating the merits of in esting in an sec rities or prod cts In addition the In estor sho ld make an independent assessment of the legal reg lator ta credit and acco nting and determine together ith be relied upon by you in evaluating the merits of investing in any securities or products. In addition, the Investor should make an independent assessment of the legal, regulatory, tax, credit, and accounting and determine, together with their own professional advisers if any of the investments mentioned herein are suitable to their personal goals. Investors should ensure that they obtain all available relevant information before making any investment. It should be noted that the value of investments and the income from them may fluctuate in accordance with market conditions and taxation agreements and investors may not get back the full amount invested. Both past performance and yield may not be a reliable guide to future performance. Exchange rate variations may cause the value of investments to increase or decrease. Investments in smaller companies may involve a higher degree of risk as they are usually more sensitive to market movements. Investments in emerging markets may be more volatile and therefore the risk to your capital could be greater. Further, the economic and political situations in emerging markets may be more volatile than in established economies and these may adversely influence the value of investments made.It shall be the recipient’s sole responsibility to verify his / her eligibility and to comply with all requirements under applicable legal and regulatory regimes in receiving this communication and in making any investment. All case studies shown are for illustrative purposes only and should not be relied upon as advice or interpreted as a recommendation. Results shown are not meant to be representative of actual investment results.J.P. Morgan Asset Management is the brand for the asset management business of JPMorgan Chase & Co. and its affiliates worldwide. This communication is issued by the following entities: in Brazil by Banco J.P. Morgan S.A. (Brazil) which is regulated by The Brazilian Securities and Exchange Commission (CVM) and Brazilian Central Bank (Bacen); in the United Kingdom by JPMorgan Asset Management (UK) Limited, which is authorized and regulated by the Financial Conduct Authority (FCA); in other EU jurisdictions by JPMorgan Asset Management (Europe) S.à r.l.; in Switzerland by J.P. Morgan (Suisse) SA, which is regulated by the Swiss Financial Market Supervisory Authority FINMA; in Hong Kong by JF Asset Management Limited, JPMorgan Funds (Asia) Limited or JPMorgan Asset Management Real Assets (Asia) Limited, all of which are regulated by the Securities and Futures Commission; in India by JPMorgan Asset Management India Private Limited which is regulated by the Securities & Exchange Board of India; in Singapore by JPMorgan Asset Management (Singapore) Limited or JPMorgan Asset Management Real Assets (Singapore) Pte. Ltd., both are regulated by the Monetary Authority of Singapore; in Taiwan by JPMorgan Asset Management (Taiwan) Limited or JPMorgan Funds (Taiwan) Limited, both are regulated by the Financial Supervisory Commission; in Japan by JPMorgan Asset Management (Japan) Limited which is a member of the Investment Trusts Association, Japan, the Japan Investment Advisers Association and the Japan Securities Dealers Association, and is regulated by the Financial Services Agency (registration number “Kanto Local Finance Bureau (Financial Instruments Firm) No. 330”); in Korea by JPMorgan Asset Management (Korea) Company Limited which is regulated by the egu ated by t e a c a Se ces ge cy ( eg st at o u be a to oca a ce u eau ( a c a st u e ts ) o 330 ); o ea by J o ga sset a age e t ( o ea) Co pa y ted c s egu ated by t eFinancial Services Commission (without insurance by Korea Deposit Insurance Corporation) and in Australia to wholesale clients only as defined in section 761A and 761G of the Corporations Act 2001 (Cth) by JPMorgan Asset Management (Australia) Limited (ABN 55143832080) (AFSL 376919) which is regulated by the Australian Securities and Investments Commission; in Canada by JPMorgan Asset Management (Canada) Inc.; and in the United States by J.P. Morgan Investment Management Inc., or J.P. Morgan Distribution Services , Inc., member FINRA SIPC.
EMEA Recipients: You should note that if you contact J.P. Morgan Asset Management by telephone those lines may be recorded and monitored for legal, security and training purposes. You should also take note that information and data from communications with you will be collected, stored and processed by J.P. Morgan Asset Management in accordance with the EMEA Privacy Policy which can be accessed through the following website http://www.jpmorgan.com/pages/privacy.
Brazilian recipients:
Prepared by: Andrew D. Goldberg, Anastasia V. Amoroso, James C. Liu, Gabriela D. Santos, David M. Lebovitz, Hannah J. Anderson, Abigail B. Dwyer, Ainsley E. Woolridge, and David P. Kelly.
Unless otherwise stated, all data are as of December 31, 2014 or most recently available.
Past performance is no guarantee of comparable future results.Diversification does not guarantee investment returns and does not eliminate the risk of loss.
71
Guide to the Markets – U.S.
JP-LITTLEBOOK