Embed Size (px)
Citation preview
The Bicycle Friendly States ranking is based on a comprehensive survey completed by state departments of transportation and state bicycling advocates. For
more information, visit bikeleague.org/states or contact Ken McLeod at (202)-822-1333 or [email protected].
Guide to the Bicycle Friendly State Report Card
Table of Contents
INTRODUCTION 2
WHAT’S ON THE REPORT CARD? 3
BICYCLE FRIENDLY AMERICA PARTICIPATION 3
STATE ADVOCACY GROUP(S) 3
STATE SUMMARY 3
FEEDBACK POINTS 4
COMPARISON STATES 4
BICYCLE FRIENDLY ACTIONS 5
COMPLETE STREETS 5
SAFE PASSING LAW 5
STATEWIDE BIKE PLAN 6
BICYCLE SAFETY EMPHASIS AREA 6
2% OR MORE FED FUNDS ON BIKE/PED 7
FEDERAL DATA ON BIKING 8
RIDERSHIP 8
SAFETY 8
SPENDING 9
CATEGORY SCORES 10
INFRASTRUCTURE & FUNDING 10
EDUCATION & ENCOURAGEMENT 11
LEGISLATION & ENFORCEMENT 12
POLICIES & PROGRAMS 12
EVALUATION & PLANNING 12
THE BENCHMARKING REPORT: BICYCLING AND WALKING IN THE UNITED STATES 13
The Bicycle Friendly States ranking is based on a comprehensive survey completed by state departments of transportation and state bicycling advocates. For
more information, visit bikeleague.org/states or contact Ken McLeod at (202)-822-1333 or [email protected].
Introduction The Bicycle Friendly State Report Card is intended to provide highlighted information about each state
to provide a useful comparison between states and serve as a reference for state efforts related to
bicycling.
This guide will provide background information on each of the data points on the Report Card. It is our
hope that this background will answer questions about where this data comes from and how it should
be interpreted.
It is important to note that the data on the Report Card do not necessarily reflect the totality of a
state’s efforts related to bicycling. The Report Card also does not explicitly consider factors such as
natural beauty, weather, or culture that may affect riding in a state. While the majority of data relate to
actions by a state Department of Transportation, the data is not limited to things within the control or
influence of a state Department of Transportation. Many states have efforts that do not fit within the
survey and public data used to create the Report Card.
Explanation of Ranking
The ranking for each state is based upon a weighted score based upon the state’s score in each of the
five categories listed on the Report Card. The weighted category scores are supplemented by
discretionary scoring that accounts for 10% of each state’s potential score. We include discretionary
scoring to account for erroneous survey data, states with missing data, and other factors that do not
easily fit within the survey data and public data used for the category scores.
- Infrastructure & Funding – 20%
- Education & Encouragement – 15%
- Legislation & Enforcement – 15%
- Policies & Programs – 20%
- Evaluation & Planning – 20%
- Discretionary Scoring – 10%
History of Ranking
The Bicycle Friendly State program began in 2008. The primary output of the Bicycle Friendly State
program since that time has been an annual ranking of each state according to publicly available data
and survey data completed by contacts at state Departments of Transportation or state advocacy
organizations. Data on rankings over time is available at
http://bikeleague.org/sites/default/files/Historical_ranking_chart.pdf. Report cards were introduced to
the program in 2012 and are available upon request.
The best way to explore data from the history of the program is by using the data produced in Bicycling
and Walking in the United States: A Benchmarking Report. This report has been published since 2007
and has shared a common survey with the Bicycle Friendly State program since 2012. Over five editions
it has published the raw data that is analyzed to create our Bicycle Friendly State ranking without the
editorial weighting used to create the ranking. The most recent Benchmarking Report can be explored at
bikingandwalkingbenchmarks.org.
The Bicycle Friendly States ranking is based on a comprehensive survey completed by state departments of transportation and state bicycling advocates. For
more information, visit bikeleague.org/states or contact Ken McLeod at (202)-822-1333 or [email protected].
What’s on the Report Card? Bicycle Friendly America Participation Each Report Card includes data on the participation by communities, businesses, and universities within
each state in other Bicycle Friendly America (BFA) programs. The Bicycle Friendly State program is the
only non-voluntary BFA program. All other BFA program participation depends upon participants to
complete an application.
• Bicycle Friendly Community – The Bicycle Friendly Community program is based upon a free
application that is available to all communities. Since the creation of the Bicycle Friendly
Community program in 1995 there have been over 1500 community applications processed by
League staff. There are currently 416 recognized Bicycle Friendly Communities and over 100
Honorable Mention communities in all 50 states.
• Bicycle Friendly Business – The Bicycle Friendly Business program is based upon a paid
application that is available to all communities. The application fee is based upon the size of the
organization: http://bikeleague.org/BFB_Fee_Deadline. There are currently 1,367 recognized
Bicycle Friendly Businesses in all 50 states and the District of Columbia.
• Bicycle Friendly University – The Bicycle Friendly University program is based upon a free
application that is available to all communities. The application fee for universities is a flat fee
regardless of university size. There are a variety of discounts available for certain types of
universities, including historically black colleges and universities, women’s colleges, and
community colleges: https://bicyclefriendly.secure-platform.com/a/page/university/BFUfee.
There are currently 164 recognized Bicycle Friendly Universities in 44 states and the District of
Columbia.
State Advocacy Group(s) The group(s) identified on the report card is any group that is an organizational member of the League
of American Bicyclists and has been identified as a statewide advocacy organization. Member
organizations of the League of American Bicyclists are:
• Eligible to participate in the League’s insurance program;
• Listed in the League’s Cycling in Your Area Guide;
• Eligible to have events listed in the League’s Cycling in Your Area Guide;
• Eligible for discounted registration for the National Bike Summit, held annually in Washington,
D.C.; and
• Invited to participate in Bicycle Friendly America local review processes.
Advocacy organizations identify themselves as state organizations. It is a membership type and the
League did not review mission statements or actions by our organizational members before listing them
on the report card. They are listed because they joined and/or renewed as a state advocacy
organization.
State Summary The state summary is intended to provide a narrative description of the state’s Bicycle Friendly State
ranking and how the state might improve its ranking. It should be thought of as a quick guide and

The Bicycle Friendly States ranking is based on a comprehensive survey completed by state departments of transportation and state bicycling advocates. For
more information, visit bikeleague.org/states or contact Ken McLeod at (202)-822-1333 or [email protected].
reference that helps contextualize the state’s ranking. The state summary is not intended to provide a
comprehensive overview of all the data examined to determine the state’s ranking. If a state summary
references another state, the 2017 ranking that of the referenced state is denoted by the number of its
2017 ranking in parentheses, as in Washington (#1).
Feedback Points Feedback Points are generated by each state’s answers to the Bicycle Friendly State survey as well as
input from state advocates as part of the local review process and discretionary decisions by League of
American Bicyclists staff. Most Feedback Points are generated from survey data and reflect areas where:
• a state does not have a policy, program, or law that is highly valued by the Bicycle Friendly State
ranking;
• a state has a law or policy that is considered detrimental to bicycling by the League of American
Bicyclists; or
• a state underperforms on an output metric based upon federal data.
Most Feedback Points are not customized or minimally customized to reflect underlying state practices.
The primary purpose of each Feedback Point is to clearly identify an area for improvement and suggest a
possible solution. The solution most suitable to any given state may be different than the solution
suggested by a Feedback Point.
Comparison States Two sets of comparison states are provided on the Report Card:
• The state’s ranking relative to all other states – the National (Overall) comparison, and
• The state’s ranking within the state’s region – the Regional comparison.
For purposes of the Bicycle Friendly State Report Card, states are split into four regions. Each region, and
the states contained with each region, are listed below. States are listed in alphabetical order within
their region.
Eastern Region Southern Region Midwestern Region Western Region
Connecticut Alabama Illinois Alaska
Delaware Arkansas Indiana Arizona
Maine Florida Iowa California
Maryland Georgia Kansas Colorado
Massachusetts Kentucky Michigan Hawaii
New Hampshire Louisiana Minnesota Idaho
New Jersey Mississippi Missouri Montana
New York North Carolina Nebraska Nevada
Pennsylvania South Carolina North Dakota New Mexico
Rhode Island Tennessee Ohio Oregon
Vermont Texas Oklahoma Utah
Virginia South Dakota Washington
West Virginia Wisconsin Wyoming
The Bicycle Friendly States ranking is based on a comprehensive survey completed by state departments of transportation and state bicycling advocates. For
more information, visit bikeleague.org/states or contact Ken McLeod at (202)-822-1333 or [email protected].
Bicycle Friendly Actions Each Bicycle Friendly State Report Card includes five Bicycle Friendly Actions (Actions). These Actions
reflect input metrics that are entirely within the control of a state’s Department of Transportation,
legislature, or other state agency. They are labeled as “Bicycle Friendly Actions” because the League
believes that these metrics are evidence of successful agency, legislative, or advocacy actions that set
the stage for improvements in the safety and mobility of people who bike within a state. In prior
versions of the Bicycle Friendly State program these Actions were referred to as “Signs of Success.”
On the Report Card, blue and orange checkmarks identify Bicycle Friendly Actions for each state. Blue
checkmarks identify an Action that a state has had in the past. Orange checkmarks identify states where
“New Progress in 2017” has occurred, this includes any changes and updates to an existing Action that
has occurred since 2015.
Each of the Bicycle Friendly Actions, and the way in which we determine whether a state has taken an
Action, is explained below.
Complete Streets Complete Streets, according to the National Complete Streets Coalition, are “are streets for everyone.
They are designed and operated to enable safe access for all users, including pedestrians, bicyclists,
motorists and transit riders of all ages and abilities…. By adopting a Complete Streets policy,
communities direct their transportation planners and engineers to routinely design and operate the
entire right of way to enable safe access for all users, regardless of age, ability, or mode of
transportation.”
For our Bicycle Friendly State Report Cards, the League uses data from the National Complete Streets
Coalition’s Inventory of all Complete Streets policies to determine whether a state receives the
Complete Streets Law/Policy Sign of Success. That Inventory identifies at least three ways in which
states can adopt Complete Streets – through a resolution, policy, or law. In our scoring of the Complete
Streets topic we differentiate between these methods, but for the Sign of Success any method results in
a checkmark.
Safe Passing law Safe passing laws require vehicles to pass each other at a safe distance. In most states, legislatures have
recognized that "safe distance" requires further definition, particularly for motor vehicles passing people
on bicycles. The Safe Passing Law Sign of Success recognizes states that have adopted a law that
specifically defines a safe distance for a motor vehicle passing a person on a bicycle.
There are three common ways that states have chosen to define a “safe distance” in a way recognized
by the League of American Bicyclists:
• A safe distance is defined as a specific distance in terms of feet, as in “no less than three feet;”
• A safe distance is defined as a variable distance in terms of feet, with a minimum safe distance
that may increase based upon factors such as the speed or size of a passing vehicle; and
• A safe distance is defined as “a distance sufficient to prevent contact with the person operating
the bicycle if the person were to fall into the driver’s lane of traffic.”

The Bicycle Friendly States ranking is based on a comprehensive survey completed by state departments of transportation and state bicycling advocates. For
more information, visit bikeleague.org/states or contact Ken McLeod at (202)-822-1333 or [email protected].
Some states also provide exceptions to their law that requires a minimum safe passing distance for a
motor vehicle passing a person on a bicycle. The League of American Bicyclists believes that these
exceptions undermine the educational and enforcement aspects of a Safe Passing law. In our scoring of
the Laws that Create Protections for People who Bike and Walk topic we differentiate between states
that do not provide exceptions and those that do, but for the Sign of Success any law that includes one
of the definitions above results in a checkmark.
The League of American Bicyclists has a model safe passing law for states or communities within states
that would like to adopt a strong safe passing law to protect people who bike. A list of all current safe
passing laws is available as part of our Bike Law University series.
Statewide Bike Plan According to the Federal Highway Administration, “State DOTs provide leadership regarding walking and
bicycling in many ways. For example, some State DOTs use their pedestrian and bicycle plans to describe
policies for how they will improve conditions for walking and bicycling through their transportation
investments.” While there is no one format for a statewide bicycle plan, all states can benefit from a
plan that serves as a basis for collaboration between the state DOT and local authorities, as well as the
development of state DOT built projects and institutional competencies that will improve bicycle
planning and conditions for bicycling over time.
In our scoring of the State DOT Bicycle & Pedestrian Plan topic we differentiate between plans based
upon a variety of aspects, but for the Sign of Success any plan adopted within the last 10 years results in
a checkmark.
Bicycle Safety Emphasis Area According to the Federal Highway Administration, “A Strategic Highway Safety Plan (SHSP) is a major
component and requirement of the Highway Safety Improvement Program (HSIP) (23 U.S.C. § 148). It is
a statewide-coordinated safety plan that provides a comprehensive framework for reducing highway
fatalities and serious injuries on all public roads.” In addition, “SHSP goals must be consistent with the
safety performance measures. As such, FHWA expects SHSP goals to consider reductions in serious
injuries and fatalities for all road users on all public roads. States could also adopt SHSP goals that
correspond to each of the safety performance measures, [including the] number of non-motorized
fatalities and non-motorized serious injuries.”
Each SHSP has Emphasis Areas, which identify safety topic within the state, and strategies, which
identify actions meant to address the topic identified in an Emphasis Area. This Sign of Success is based
upon Emphasis Areas and not strategies. While each state is required to set a safety performance
measure that includes non-motorized fatalities and non-motorized serious injuries, according to 23
U.S.C. 150, states are not required to identify bicyclist safety as an emphasis area.
The League of American Bicyclists is aware that some strategies include actions that we disagree with,
such as adopting mandatory all rider bicycle helmet laws, but for the Bicycle Friendly State Report Card,
our analysis is based on Emphasis Areas only. We believe this is appropriate because the Emphasis Areas

The Bicycle Friendly States ranking is based on a comprehensive survey completed by state departments of transportation and state bicycling advocates. For
more information, visit bikeleague.org/states or contact Ken McLeod at (202)-822-1333 or [email protected].
provide insight into whether bicyclist safety is a priority for the state regardless of the actions that the
state is considering as strategies to improve bicyclist safety. We disagree with actions such as mandatory
all rider bicycle helmet laws because we believe that there is compelling evidence that those actions do
not reduce the risk of bicyclist fatalities and serious injuries at the population level. We believe that a
state that has chosen bicyclist safety as a priority is likely to make the same determination over time.
For the Bicycle Safety Emphasis Sign of Success, we use State Strategic Highway Safety Plan data
provided by the FHWA’s SHSP Community of Practice. The Community of Practice maintains a database
that includes searchable Emphasis Area categories, including “Ped/Bike.” We include the results of that
search as well as a more comprehensive keyword search of all Emphasis Areas in the database. Any
state that has at least one Emphasis Area that includes the keyword “bicycle” or a derivative of “bicycle”
receives a checkmark for this Sign of Success.
2% or more Fed Funds on Bike/Ped According to the Federal Highway Administration, “pedestrian and bicycle projects are eligible for
funding through the Congestion Mitigation and Air Quality Improvement (CMAQ) Program, Surface
Transportation Program (STP), Highway Safety Improvement Program (HSIP), National Highway
Performance Program (NHPP), Federal Lands and Tribal Transportation Programs (FLTTP)) and
[Transportation Alternatives Program] TAP.” While this guidance does not reflect the conversion of TAP
to the STP Transportation Alternatives Set-Aside under the Fixing American’s Surface Transportation
(FAST) Act, it still reflects the broad eligibility for biking and walking projects provided by federal
transportation funding.
Our 2% threshold is based upon the historical funding level for the Transportation Alternatives Program,
as set in the federal transportation bill that preceded the FAST Act. While the League of American
Bicyclists would prefer more federal funding for biking and walking, this baseline is a useful shorthand
for whether or not a state Department of Transportation is making an effort to at least spend
transportation funding on bicycling and walking projects in proportion to the programmatic priorities set
by Congress.
For the 2% or more Fed Funds on Bike/Ped Sign of Success, we use data provided by FHWA’s Fiscal
Management Information System (FMIS). Our determination of spending is based upon five fiscal years
(FY2012-16) of data on obligations. An obligation is a legal commitment by the Federal government to
pay a State for the Federal share of a project’s eligible cost. It is not “spending” as a normal person
would understand it, but it is the legal commitment to transfer cash at a later date and those funds are
considered “used” as soon as they are obligated.
In our scoring of the Use of Federal Transportation Funding topic we use a formula that looks at per
capita bicycling and walking spending, bicycling and walking spending as a percentage of all federal
transportation spending, and the number of programs used for bicycling and walking projects. For this
Sign of Success, states with 2% or more of its federal spending coded as bike/ped spending results in a
checkmark.

The Bicycle Friendly States ranking is based on a comprehensive survey completed by state departments of transportation and state bicycling advocates. For
more information, visit bikeleague.org/states or contact Ken McLeod at (202)-822-1333 or [email protected].
Federal Data on Biking The Federal government collects and requires states to collect a variety of data related to bicycling, in
addition to directly funding research on bicycling and walking. The Federal Data on Biking table presents
data from three federal data sources that provide updated data on an annual basis. These data reflect
output metrics that are not entirely within the control of a state’s Department of Transportation,
legislature, or other state agency.
Ridership This figure is based upon the Census Bureau’s American Community Survey (ACS) 2015 5-year estimate.
The American Community Survey was created after the 2000 Census as an alternative to the previous “long-form” Census. Each year about 1 in 38 U.S. households receive an invitation to participate in the ACS. Data on bicycling to work comes from Question 31, which asks “How did this person usually get to work LAST WEEK? If this person, usually used more than one method of transportation during the trip, mark (X) the box of the one used for most of the distance.” Bicycle is one of 12 potential answers to that question.
According to the once-a-decade National Household Travel Survey, travel to and from work comprises about 16 percent of daily trips. The use of data only on this subset of trip types for all estimates of state bicycle ridership is problematic because it misses variations between states in the any other type of bicycling. There are also numerous other issues with ACS data.
The League uses ACS data because it is the only nationwide data set available on an annual basis that allows state-to-state comparisons. We look forward to the day when better data that allows annual state-to-state comparisons is available.
Safety This figure is based upon fatalities reported over a five-year period according to the National Highway Administration (NHTSA)’s Fatality Analysis Reporting System and the 2015 5-year ACS estimate of the number of bicycle commuters.
The League of American Bicyclists believes that providing fatality data in the context of the number of bicycle commuters is the best currently possible way to adjust for differences in rates of bicycling between states. While bicycle commuting only represents about 13% of all bicycling trips according to 2009 National Household Travel Survey data, it is the only type of bicycling that nationwide publicly available data on an annual basis.
FARS is based upon a census of fatal traffic crashes. To be included in FARS, a crash must involve a motor vehicle traveling on a public roadway and must result in the death of at least one person within 30 days of the crash. FARS data is provided to NHTSA by an agency in each state government according to a cooperative agreement which specifies that the state will take state data and code it into the standard FARS format. Since states are responsible for the underlying data, FARS is not based upon one uniform source of data, but may be based on a combination of information from police accident reports, death certificates, State coroners and medical examiners, State driver and vehicle registration records, and emergency medical services records.
The Bicycle Friendly States ranking is based on a comprehensive survey completed by state departments of transportation and state bicycling advocates. For
more information, visit bikeleague.org/states or contact Ken McLeod at (202)-822-1333 or [email protected].
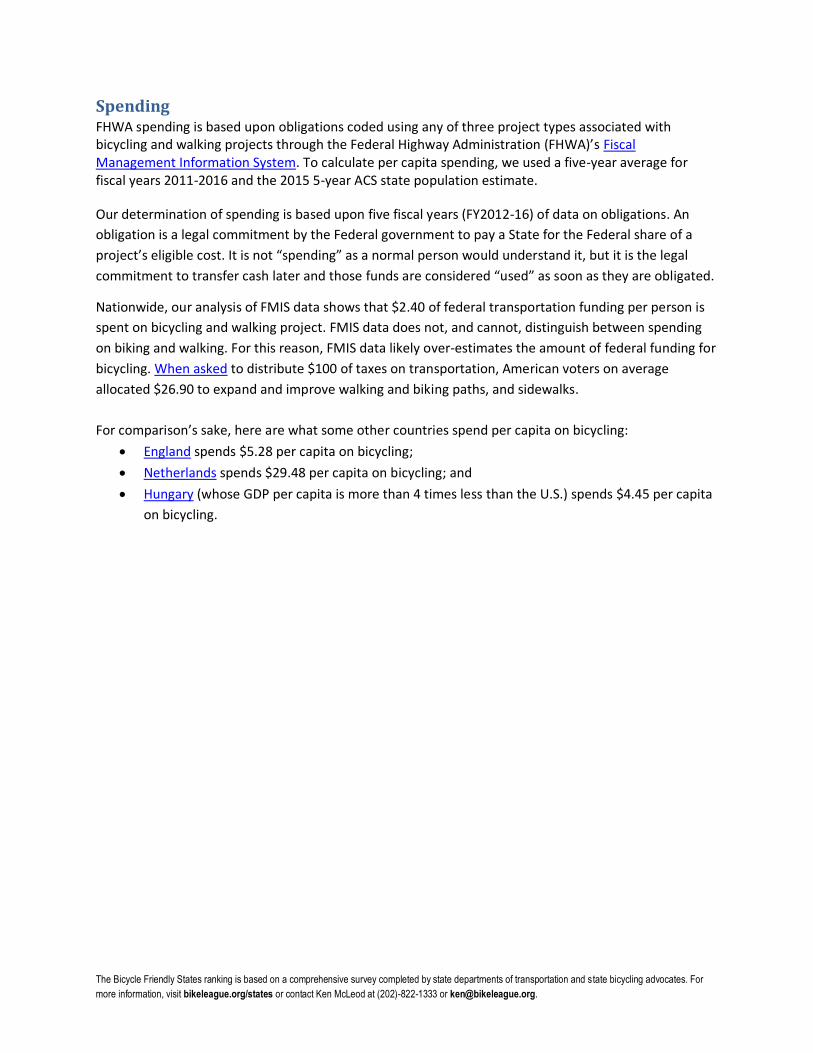
Spending FHWA spending is based upon obligations coded using any of three project types associated with bicycling and walking projects through the Federal Highway Administration (FHWA)’s Fiscal Management Information System. To calculate per capita spending, we used a five-year average for fiscal years 2011-2016 and the 2015 5-year ACS state population estimate.
Our determination of spending is based upon five fiscal years (FY2012-16) of data on obligations. An
obligation is a legal commitment by the Federal government to pay a State for the Federal share of a
project’s eligible cost. It is not “spending” as a normal person would understand it, but it is the legal
commitment to transfer cash later and those funds are considered “used” as soon as they are obligated.
Nationwide, our analysis of FMIS data shows that $2.40 of federal transportation funding per person is
spent on bicycling and walking project. FMIS data does not, and cannot, distinguish between spending
on biking and walking. For this reason, FMIS data likely over-estimates the amount of federal funding for
bicycling. When asked to distribute $100 of taxes on transportation, American voters on average
allocated $26.90 to expand and improve walking and biking paths, and sidewalks.
For comparison’s sake, here are what some other countries spend per capita on bicycling:
• England spends $5.28 per capita on bicycling;
• Netherlands spends $29.48 per capita on bicycling; and
• Hungary (whose GDP per capita is more than 4 times less than the U.S.) spends $4.45 per capita
on bicycling.

The Bicycle Friendly States ranking is based on a comprehensive survey completed by state departments of transportation and state bicycling advocates. For
more information, visit bikeleague.org/states or contact Ken McLeod at (202)-822-1333 or [email protected].
Category Scores The second page of the Bicycle Friendly State Report Card has detailed scores from each category. These
scores are provided based upon topics within each category. Each score is based upon one or more
questions in the 2017 Bicycle Friendly State survey. The entire Bicycle Friendly State survey is 84
questions long, including questions that are completed by the League of American Bicyclists using
publicly available data and reviewed by state Departments of Transportation. The full survey is available
here.
Infrastructure & Funding The Infrastructure & Funding category is intended to provide insight on the level of investment in
bicycling in each state. This includes questions about funding levels, funding programs, and the creation
of bicycle infrastructure in the state.
This category often suffers from data-related issues. In particular, there are two issues that should be
noted that may affect the comparability of states:
1. Determining the amount of state funding spent or allocated to bicycling and walking can be
very difficult. Our historical survey data shows reported state funding can vary widely from
year-to-year. Several reasons are given for why it is difficult to determine state funding for
biking and walking, with three of the most common being:
a. For states with complete streets policies, bicycling and walking infrastructure may not
be reported when it is created within a larger road project. Several states have made
the argument that the cost of documenting these projects is prohibitive.
b. States often create significant bicycling and walking facilities through Departments of
Natural Resources or other state agencies. These various agencies do not share
reporting mechanism or funding legislation, so it is difficult to aggregate funding.
c. States may or may not report the state funds used to match federal funding when they
report state funding spent on bicycling and walking. Generally a 20% match is required
for federal funding.
2. States often do not have processes in place to report on the planned and built bicycle
infrastructure on a yearly basis. Based upon comments from survey respondents, it does not
appear that most states have databases that allow easy reports on the lane miles and types of
bicycle infrastructure in a state. This may be an issue of multiple state agencies often being
involved in the creation of bicycling infrastructure.
Topic
Survey Questions
Included in Topic
Design and Existence of Infrastructure IF5-12
State Transportation Funding IF13 & IF14
Use of Federal Transportation Funding IF1-4
Planned and Recently Built Bicycle & Pedestrian Facilities IF17-20
State Transportation Funding Restrictions IF15 & IF16
The Bicycle Friendly States ranking is based on a comprehensive survey completed by state departments of transportation and state bicycling advocates. For
more information, visit bikeleague.org/states or contact Ken McLeod at (202)-822-1333 or [email protected].
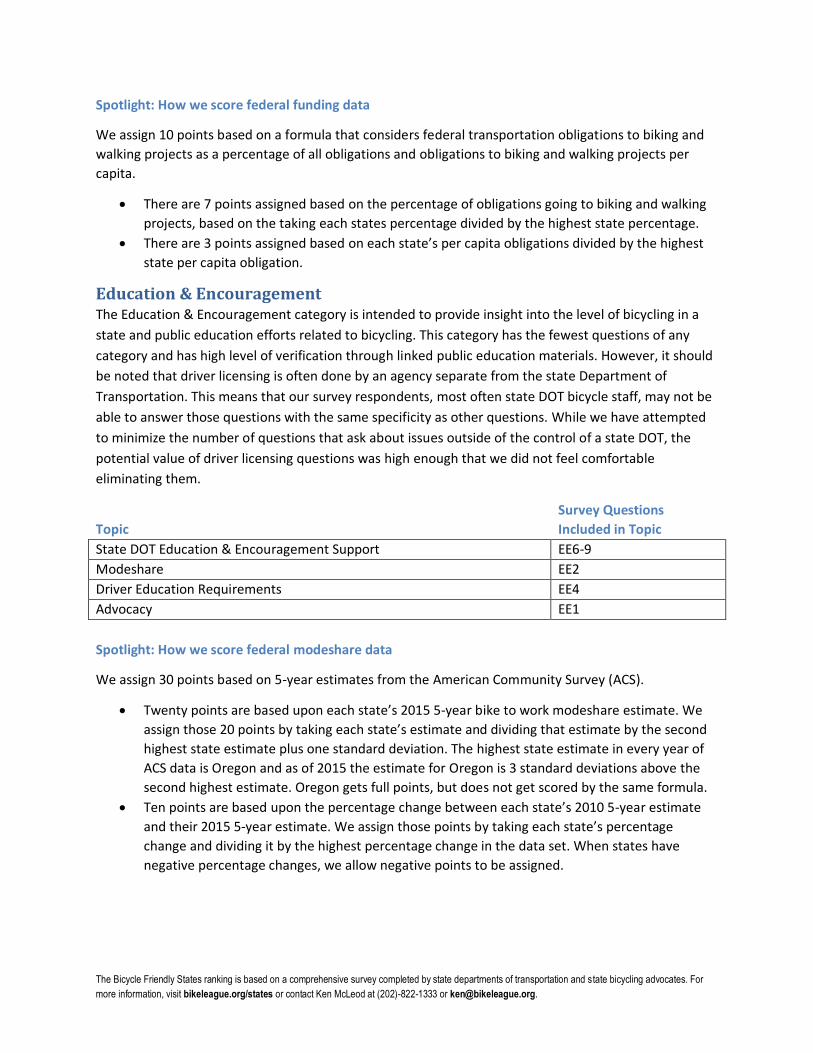
Spotlight: How we score federal funding data
We assign 10 points based on a formula that considers federal transportation obligations to biking and
walking projects as a percentage of all obligations and obligations to biking and walking projects per
capita.
• There are 7 points assigned based on the percentage of obligations going to biking and walking
projects, based on the taking each states percentage divided by the highest state percentage.
• There are 3 points assigned based on each state’s per capita obligations divided by the highest
state per capita obligation.
Education & Encouragement The Education & Encouragement category is intended to provide insight into the level of bicycling in a
state and public education efforts related to bicycling. This category has the fewest questions of any
category and has high level of verification through linked public education materials. However, it should
be noted that driver licensing is often done by an agency separate from the state Department of
Transportation. This means that our survey respondents, most often state DOT bicycle staff, may not be
able to answer those questions with the same specificity as other questions. While we have attempted
to minimize the number of questions that ask about issues outside of the control of a state DOT, the
potential value of driver licensing questions was high enough that we did not feel comfortable
eliminating them.
Topic
Survey Questions
Included in Topic
State DOT Education & Encouragement Support EE6-9
Modeshare EE2
Driver Education Requirements EE4
Advocacy EE1
Spotlight: How we score federal modeshare data
We assign 30 points based on 5-year estimates from the American Community Survey (ACS).
• Twenty points are based upon each state’s 2015 5-year bike to work modeshare estimate. We
assign those 20 points by taking each state’s estimate and dividing that estimate by the second
highest state estimate plus one standard deviation. The highest state estimate in every year of
ACS data is Oregon and as of 2015 the estimate for Oregon is 3 standard deviations above the
second highest estimate. Oregon gets full points, but does not get scored by the same formula.
• Ten points are based upon the percentage change between each state’s 2010 5-year estimate
and their 2015 5-year estimate. We assign those points by taking each state’s percentage
change and dividing it by the highest percentage change in the data set. When states have
negative percentage changes, we allow negative points to be assigned.
The Bicycle Friendly States ranking is based on a comprehensive survey completed by state departments of transportation and state bicycling advocates. For
more information, visit bikeleague.org/states or contact Ken McLeod at (202)-822-1333 or [email protected].
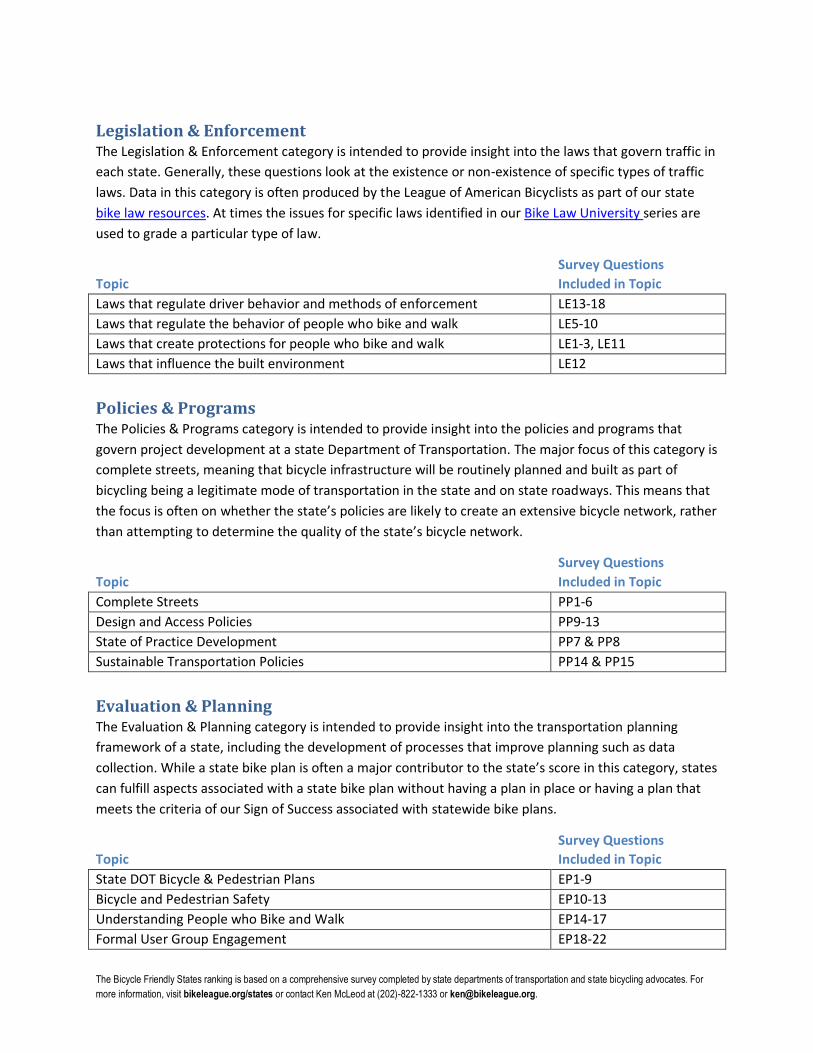
Legislation & Enforcement The Legislation & Enforcement category is intended to provide insight into the laws that govern traffic in
each state. Generally, these questions look at the existence or non-existence of specific types of traffic
laws. Data in this category is often produced by the League of American Bicyclists as part of our state
bike law resources. At times the issues for specific laws identified in our Bike Law University series are
used to grade a particular type of law.
Topic
Survey Questions
Included in Topic
Laws that regulate driver behavior and methods of enforcement LE13-18
Laws that regulate the behavior of people who bike and walk LE5-10
Laws that create protections for people who bike and walk LE1-3, LE11
Laws that influence the built environment LE12
Policies & Programs The Policies & Programs category is intended to provide insight into the policies and programs that
govern project development at a state Department of Transportation. The major focus of this category is
complete streets, meaning that bicycle infrastructure will be routinely planned and built as part of
bicycling being a legitimate mode of transportation in the state and on state roadways. This means that
the focus is often on whether the state’s policies are likely to create an extensive bicycle network, rather
than attempting to determine the quality of the state’s bicycle network.
Topic
Survey Questions
Included in Topic
Complete Streets PP1-6
Design and Access Policies PP9-13
State of Practice Development PP7 & PP8
Sustainable Transportation Policies PP14 & PP15
Evaluation & Planning The Evaluation & Planning category is intended to provide insight into the transportation planning
framework of a state, including the development of processes that improve planning such as data
collection. While a state bike plan is often a major contributor to the state’s score in this category, states
can fulfill aspects associated with a state bike plan without having a plan in place or having a plan that
meets the criteria of our Sign of Success associated with statewide bike plans.
Topic
Survey Questions
Included in Topic
State DOT Bicycle & Pedestrian Plans EP1-9
Bicycle and Pedestrian Safety EP10-13
Understanding People who Bike and Walk EP14-17
Formal User Group Engagement EP18-22
The Bicycle Friendly States ranking is based on a comprehensive survey completed by state departments of transportation and state bicycling advocates. For
more information, visit bikeleague.org/states or contact Ken McLeod at (202)-822-1333 or [email protected].
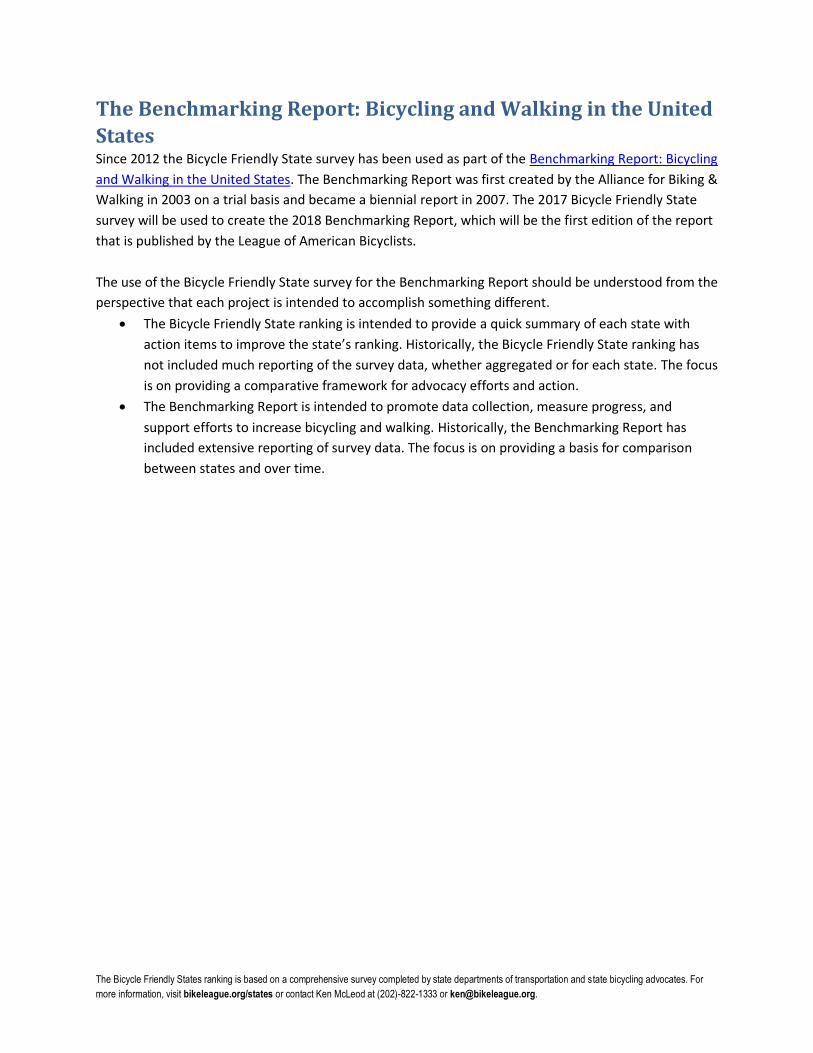
The Benchmarking Report: Bicycling and Walking in the United
States Since 2012 the Bicycle Friendly State survey has been used as part of the Benchmarking Report: Bicycling
and Walking in the United States. The Benchmarking Report was first created by the Alliance for Biking &
Walking in 2003 on a trial basis and became a biennial report in 2007. The 2017 Bicycle Friendly State
survey will be used to create the 2018 Benchmarking Report, which will be the first edition of the report
that is published by the League of American Bicyclists.
The use of the Bicycle Friendly State survey for the Benchmarking Report should be understood from the
perspective that each project is intended to accomplish something different.
• The Bicycle Friendly State ranking is intended to provide a quick summary of each state with
action items to improve the state’s ranking. Historically, the Bicycle Friendly State ranking has
not included much reporting of the survey data, whether aggregated or for each state. The focus
is on providing a comparative framework for advocacy efforts and action.
• The Benchmarking Report is intended to promote data collection, measure progress, and
support efforts to increase bicycling and walking. Historically, the Benchmarking Report has
included extensive reporting of survey data. The focus is on providing a basis for comparison
between states and over time.


![[Insert name, affiliation and date] BICYCLE FRIENDLY AMERICA PROGRAM OVERVIEW](https://img.dokumen.tips/doc/110x75/55171e5e550346fe558b583f/insert-name-affiliation-and-date-bicycle-friendly-america-program-overview.jpg)


![[Insert name, affiliation and date] CREATING A BICYCLE FRIENDLY BUSINESS](https://img.dokumen.tips/doc/110x75/56649d815503460f94a66310/insert-name-affiliation-and-date-creating-a-bicycle-friendly-business.jpg)


