Embed Size (px)
Citation preview

Guidance on measuring and maximising value for money in social transfer programmes – second edition
Toolkit and explanatory text
Philip White, Anthony Hodges and Matthew Greenslade
April 2013

Guidance on measuring and maximising VfM in social transfers
i
Table of contents
Table of contents i
List of boxes, tables and figures ii
Abbreviations iii
Introduction 1
What’s new in this edition 1
How to use this guidance 2
Why this guidance note? 2
Things to think about before you start 4
Please send your comments and requests 6
Acknowledgements 6
Part 1: Toolkit 8
Analysing programme cost (all stages) 9
Analysing programme benefits (all stages) 10
Analysing value for money (all stages) 11
Critical cost-effectiveness drivers 16
Monitoring and evaluation (M&E) 17
Financial sustainability (design stage) 18
Part 2: Explanatory text 19
1. Analysing programme cost 19
1.1 Breaking costs down into key components 19 1.2 Assessing other costs 22
2. Analysing value for money 27
2.1 Cost-efficiency 27 2.2 Cost-effectiveness 37 2.3 Cost-benefit analysis 46
3. Critical cost-effectiveness drivers 52
3.1 Form, level, duration and periodicity of transfers 52 3.2 Targeting 55 3.3 Conditionality 59 3.4 Implementation systems 60
4. Monitoring and evaluation (M&E) 63
5. Financial sustainability 65
6. VfM in labour intensive public works 67
References 71

Guidance on measuring and maximising VfM in social transfers
ii
List of boxes, tables and figures
Box 1: Transferring Cash and Assets to the Poor – NAO and PAC recommendations 4
Figure 1: Applying the 3E framework to analysing VfM in social transfers 9
Table 1: Measurement requirements and the VfM chain 11
Box 2: Start-up cost structures in three social transfer programmes 21
Box 3: Challenges of cost analysis in Ethiopia’s Productive Safety Nets Programme 23
Box 4: Evidence on costs of collecting transfers in social transfer programmes 24
Box 5: Some hard to measure social costs and benefits of transfer programmes 25
Box 6: Calculating a cost-efficiency ratio for in-kind transfers 29
Box 7: Achieving VfM in the Chars Livelihood Programme 30
Table 2: Cost-transfer ratios in three African programmes with complex targeting 31
Box 8: How cost-efficiency improves as programmes mature 32
Figure 2: Evolving TCTRs in social transfer programmes in Kenya, Mexico and Nigeria 32
Box 9: Relative cost-efficiency of cash, food and farm input transfers 33
Figure 3: Total cost-transfer ratios of cash, food & farm input transfers in Malawi & Zambia 33
Table 3: Ethiopia PSNP: cost-efficiency of food vs. cash transfers at alternative ITSH rates34
Table 4: Unit cost and cost-efficiency ratios for selected social transfer programmes 34
Figure 4: Share of administrative costs by types of intervention: median values (%) 36
Box 10: The Transfer Project 39
Box 11: Comparing the cost-effectiveness of cash transfers and subsidies 40
Figure 5: Simulated change in poverty gap resulting from the global crisis and alternative social protection measures costing 1% of GDP, in three African countries, 2009 40
Figure 6: Comparative cost of reducing the poverty gap 43
Box 12: Cost-effectiveness analysis in Ethiopia’s Productive Safety Nets Programme 45
Box 13: Two case studies of ex ante cost-benefit analysis for social transfers 48
Box 14: Local income multiplier effects of social transfers in Lesotho and Kenya 49
Table 5: Sensitivity analysis in the Nigeria Child Development Grant appraisal 50
Table 6: CBA results from evaluations and appraisals of social transfer programmes 51
Box 15: Relative costs and performance of alternative targeting methods 56
Box 16: Poverty targeting methods and poverty context 58
Box 17: A system-wide approach to assessing VfM in Bangladesh 64
Figure 7: Social assistance, social insurance and social sector spending by region, selected years 67
Figure 8: Total cost of transferring US$1 to a PWP beneficiary in Malawi and Zambia 68

Guidance on measuring and maximising VfM in social transfers
iii
Abbreviations
3Es Economy, efficiency, effectiveness
ASiST Advisory Service in Social Transfers, European Commission
BCR Benefit-cost ratio
CBA Cost-benefit analysis
CCT Conditional cash transfer
CGP Child Grants Programme, Lesotho
CLP Chars Livelihood Programme, Bangladesh
CMP Child Money Programme, Mongolia
CT-OVC Cash transfers for orphans and vulnerable children, in Kenya
CTR Cost-transfer ratio
DFID Department for International Development
EIRR Economic internal rate of return
HABP Household Asset Building Programme, Ethiopia
HSNP Hunger Safety Nets Programme, Kenya
LEAP Livelihood Empowerment against Poverty programme, Ghana
LSMS Living standards measurement survey
MGNREGS Mahatma Gandhi National Rural Employment Guarantee Scheme, India
MIS Management information system
NAO UK government National Audit Office
NPV Net present value
OAP Old age pension
PAC UK parliamentary Public Accounts Committee
PMT Proxy means test
Progresa Programa Nacional de Educación, Salud y Alimentación (National Education, Health and Nutrition Programme), conditional cash transfer programme in Mexico now known as Oportunidades
PSA Programa de Subsídios de Alimentos (Food Subsidy Programme), cash transfer programme in Mozambique
PSNP Productive Safety Net Programme, Ethiopia
PV Present value
PWP Public works programme
VfM Value for money

Guidance on measuring and maximising VfM in social transfers Part 1: Toolkit
1
Introduction
What’s new in this edition
This document is a revised edition of Guidance for DFID country offices on measuring and maximising value for money in cash transfer programmes which DFID published in October 2011. The main revisions made for this edition are as follows:
A standalone checklist has been produced to accompany this guidance. This should be printed and referred to by all involved in designing and managing social programmes, for quick reference.
Coverage has been broadened to include programmes involving transfers other than cash, although the emphasis on cash transfers is retained1.
The guidance has been tailored for a wider international audience, and we hope that it will prove useful both to government staff in low and middle income countries who are responsible for social transfers, and to their other international and national partners in social transfer financing and implementation;
This edition has been updated to take account of feedback provided on the first edition of the guidance, and priorities identified by the November 2011 UK National Audit Office (NAO) and February 2012 parliamentary Public Accounts Committee (PAC) reports on Transferring cash and assets to the poor (are summarised in Box 1 below).
New examples have been introduced based on recent experience in Ethiopia, Nigeria, Kenya, Lesotho, OPTs and Bangladesh; in all, 9 new text boxes; 3 new tables.
More detailed guidance on cost analysis is provided, including unit costs, direct and indirect costs, costs of complementary services to beneficiaries, challenges in cost analysis, more examples of private costs, hard to measure social costs and benefits, and economic and political costs.
The main guidance and the checklist include a new cost-efficiency table for checking your programme is cost efficient, allowing for age of programme and context.
An expanded section on cost-effectiveness includes new material on economic multipliers, limitations of poverty indices, and cost-effectiveness impacts of targeting.
The section on critical cost-effectiveness drivers includes additions and revisions on the political economy of targeting and exclusion error and assessing VfM in national social protection systems.
1 This note covers social transfer programmes, with an emphasis on those in which a primary form of
transfer is cash, including transfers to the poor or extreme poor, non-contributory social pensions to the elderly and disabled, child allowances and numerous hybrids and variants of these. Also covered are alternatives to cash, in particular transfers of food, productive assets and farm inputs, and vouchers. Some are conditional on beneficiaries meeting certain obligations, such as sending their children to school or to health centres, while others are unconditional. Public works programmes (PWPs) implemented as a social protection instrument involving social transfers are also discussed; these are a distinct programme type in terms of objectives and metrics, and are considered in a separate section (Section 6) in the explanatory text.

Guidance on measuring and maximising VfM in social transfers Part 1: Toolkit
2
An overview is provided of DFID’s new Guidance for evaluating social transfer programmes (Dissanayake et al., 2012).
VfM in labour intensive public works now occupies a new main section with extensive revision.
How to use this guidance
The guidance is in two linked parts:
1. Part 1 provides a toolkit which sets out key concepts and metrics for analysing value for money (VfM) in social transfer programmes. This gives an overview of the steps required, and may be enough for those managing others carrying out VfM analysis.
2. Part 2 comprises explanatory text, providing more detailed guidance on the issues, concepts and approaches used for VfM analysis of social transfers, as well as a range of examples. Part 2 is considered essential reading for those carrying out the analysis.
Throughout the Part 1 toolkit reference is made to relevant sections in Part 2, and vice versa. Such cross-references are hyperlinked to facilitate on-screen navigation between the two parts of the document and between different sections of Part 2. (With the cursor over the hyperlink text use Ctrl+Click to follow the link, and Alt+Left Arrow to return.)
Why this guidance note?
Recent years have seen increasing recourse to social transfers to help mitigate the most immediate manifestations of poverty, vulnerability and inequality in developing countries. While global social and economic crises have increased the need for social transfers, fiscal austerity has constrained social sector budgets all over the world and sharpened critical public scrutiny of donor aid spending. The need to ‘make every penny count’ in the public financing of social transfers, and to ensure that this is done in a measurable and consistent manner, has become a growing concern amongst developing country and donor governments alike.
VfM is not only about minimising costs; it is about maximising the impact of money spent to improve poor people’s lives. This means making the analysis of both costs and benefits of social transfer programmes as rigorous and comprehensive as possible, at the ex ante design and appraisal stage, during implementation, and in ex post evaluation. In the UK, recent reports from the National Audit Office and Public Accounts Committee have praised the impact of DFID-supported programmes but pointed to gaps in cost and cost effectiveness analysis.
Experience of VfM analysis for social transfer programmes is rapidly accumulating, mainly in ex ante appraisals. Yet there is still much we need to do to strengthen consistency in this area, not least in analysis of cost drivers and cost-efficiency, using benchmarks from other comparable programmes. The purpose of this note is to build on the good practice that is already out there, and to broaden and where possible standardise its application.
Some of the challenges in judging VfM for social transfers are common across sectors, in particular the need to:
allow for different contexts, including fragile and conflict affected states;
measure ‘value’ in financial, economic, social, political and environmental terms, against a range of objectives and for different actors;

Guidance on measuring and maximising VfM in social transfers Part 1: Toolkit
3
capture both direct and indirect costs and benefits, over short, medium and long timeframes;
address inevitable data deficiencies that limit the evidence base for VfM calculations, particularly when multiple partners are involved in programme funding and implementation.
To some extent these challenges are common across sectors. But with social transfer programmes we are also exploring a new area with new challenges stemming from their complex, cross-sectoral nature and impacts, and the need to make critical, evidence-based design choices on targeting, conditionality and choice of registration and payment systems, despite the data deficiencies.
With respect to DFID’s social transfer programming, several of these challenges were highlighted in the recent NAO report on Transferring Cash and Assets to the Poor (NAO 2011) and in the PAC report of the same name (PAC 2012) which examined the NAO findings. Box 1 summarises the recommendations they made for DFID action at country and headquarters levels, which are also relevant to the social transfer policies and programmes of DFID’s national and international partners.
In terms of scope, this note is intended to guide analysis of VfM in non-contributory cash and in-kind transfers. Its emphasis is primarily on initiatives to address chronic poverty and vulnerability, rather than emergency humanitarian interventions. Social transfer programmes cover a wide range of design features with regard to objectives and approaches, targeting schemes and scales of operation, conditions with which recipients must comply, levels of transfer, delivery mechanisms and links with broader social and economic policy. These scheme attributes are all important drivers of value for money and so need to be critically assessed in a VfM analysis.
It is also important for programme partners to be able to compare the costs and benefits of different forms of social transfer, and of transfers with those of alternative policies or programmes that might be implemented to achieve similar results. Comparisons between cash and other types of social transfers are particularly relevant, as cash transfers are increasingly being promoted as preferable alternatives to food distribution, particularly in situations of chronic food insecurity, and to consumer subsidies, which have in the past been the main (indirect) transfer instrument used by governments in many parts of the world to protect living standards. Vouchers represent an intermediate form of transfer, which may be value or commodity/quantity based and involve a wide range of options with regard to commodity standards, contractual arrangements for delivery, commodity supply, voucher redemption etc., all of which affect VfM. This guidance is intended to help with such comparisons, but is of necessity limited to the main design alternatives in its use of examples.
The geographical focus of the guidance is mainly on low income and lower-middle income countries in sub-Saharan Africa and South Asia, where problems of poverty, vulnerability and social marginalisation are most acute and widespread, though it uses examples from a wide range of developing countries.

Guidance on measuring and maximising VfM in social transfers Part 1: Toolkit
4
Things to think about before you start
Be proportionate in your approach
The toolkit sets out what VfM metrics are essential to measure in social transfer programmes and what are desirable but not essential, but it is up to analysts to be vigilant in ensuring that the approach they take is proportionate to level of investment and to local context. Carrying out VfM analysis and managing consultants takes resources and analysts’ time – there is an opportunity cost!
It is not possible to be prescriptive on the level of time and resources that you invest but clearly it must be enough to ensure due diligence. It is important to show that appropriate effort has been taken to keep costs of programme components down for the chosen programme (chosen to maximise value for money, not just on the basis of cost). This means through the life of the programme and through evaluation, not just at the design stage.
Sometimes it will not be necessary to measure all of the metrics set out in the toolkit, because:
Box 1: Transferring Cash and Assets to the Poor – NAO and PAC recommendations
The UK National Audit Office (NAO) and Public Accounts Committee (PAC) reports, of November 2011 and February 2012 respectively, made the following recommendations to DFID on achieving VfM in transfers of cash and assets to the poor:
At country level
Explore roles for social transfers in all priority countries where not already used;
Obtain better, more standardised data on direct and indirect costs and performance, and how they change as programmes mature, as a basis for improving VfM and comparing cost-effectiveness across programmes;
Analyse operational efficiency and adopt a more consistent approach to management information systems, especially targeting and payment metrics;
Compare poverty impacts and cost-effectiveness of different design options (e.g. trade-offs involving different payment levels, mix of components, tightness of targeting and administrative costs);
Evaluate electronic payment options, or if unfeasible how to reduce costs of manual payment;
Complete coverage in pilot areas before scaling up;
Ensure consistency between DFID objectives and indicators for internal monitoring and external evaluation, and measure baselines;
Analyse programme funding sustainability and affordability of national implementation.
At headquarters level
Identify factors driving or impeding transfers across countries, and challenge country teams not using the approach;
Clarify the level of evidence needed to support proposals for new pilot programmes, given the strength of evidence available in other countries;
Share ongoing learning from programmes which have strengthened government commitment and capacity to introduce transfers;
Identify and address generic barriers and enablers to electronic payment, and communicate practical guidance across the country network;
Learn from programmes showing that integrating transfers with other services and support improves outcomes, and use this to design and improve other transfer programmes.
NAO (2011); PAC (2012)

Guidance on measuring and maximising VfM in social transfers Part 1: Toolkit
5
Value for money analysis is being carried out by other partners. For donors, supporting governments to do this work may be better from an aid effectiveness perspective, even if the analytical work takes longer to produce because systems are under development. But even if others are doing the analysis, those managing support to programmes should retain an overview of key metrics and be in a position to monitor key trends and anomalies.
There is little genuine choice in terms of programme design. This may limit how much VfM analysis is worth doing in terms of assessing design options, although an assessment of costs and benefits will still be required if it has not already been done. An example of where choice was limited is DFID Pakistan’s flood relief cash transfers business case (DFID, 2010b).
In conflict or post conflict environments it may be that if speed is of the essence for stabilisation and data is particularly poor, then VfM analysis has to be curtailed (arguably this is part of maximising VfM if speed of response is linked to impact). But reasons for limiting VfM analysis should then be made explicit and where possible agreed with decision-makers in advance.
Plan your VfM analysis early
Unless otherwise specified, metrics listed in the toolkit should be included in both ex ante (appraisal) and ex post (evaluation) analyses of VfM, and where possible monitored during implementation.
Regular staff workloads in partner agencies will often make it necessary to hire a consultant to undertake VfM analysis. Experience suggests that consultants need at least four weeks to produce a good economic appraisal or evaluation using cost-benefit analysis. Good consultants are usually booked up well in advance, and so should be contracted as soon possible. In DFID’s case, the Poverty and Vulnerability Team in Policy Division can help suggest names, provide standard ToR templates and comment on candidate CVs. In the European Commission the Advisory Service in Social Transfers (ASiST) facility supports EC delegations in a similar way.
Ex ante VfM analysis is an integral part of choosing design options, so analysts should be engaged early in the design stage.
Whichever partner is undertaking the VfM analysis, it is important that all partners receive enough regular information to retain an overview of key information on costs and benefits (outputs, outcomes and impacts) throughout design, monitoring and evaluation, and be in a position to identify trends and anomalies and benchmark costs against other programmes. DFID was criticised by the UK National Audit Office and Public Accounts Committee for not doing this consistently in social transfer programmes it helps to fund.
Don’t expect complete data
Rarely will reliable, up-to-date data be readily available to measure all of the metrics cited in this guide, even for pilot programmes. Steps should be taken to inventory and assess relevant data from a range of internal and external sources, with a focus on reliability and method of collection, and to fill gaps where possible, starting with the essential metrics and preferably through enhancing government or other in-country systems.
Data deficiencies limit the evidence base on VfM for most social transfer programmes, particularly in the poorest countries. For example most government departments or NGOs operating transfer programmes can provide data on annual programme expenditure, but it is often unclear exactly which costs are included and which are not, or how fixed and recurrent costs, or direct and indirect costs, can be distinguished. This complicates any judgement as to how cost structure may change as the programme scales up or matures. While cost data deficiencies are in principle amenable to better accounting and transparency, a more

Guidance on measuring and maximising VfM in social transfers Part 1: Toolkit
6
intractable problem is the lack of national data on the long-term indirect benefits of social transfers. Such weaknesses have been noted in DFID’s literature review on cash transfers (DFID, 2011b).
External evidence used for benchmarking should be graded according to its reliability and robustness e.g. evidence from articles in refereed journals will in general (though not always) be more robust than from elsewhere. Evidence can be used from a variety of sources, but its reliability should always be clearly set out, as far as it can be judged.
Think about your own context Given all of the challenges of carrying out VfM analysis, this guidance does not attempt to be the last word in assessing VfM across all programmes involving social transfers. It specifies essential and desirable VfM metrics and measurement approaches while illustrating the issues that are likely to arise in applying them, including contrasting and often partial evidence, the importance of context and the sensitivity of results to assumptions.
VfM is not absolute. It must be related to a specified timescale and point in the ‘results chain’ (output-outcome-impact); it varies between different contexts and between actors who might have different objectives (stated or unstated); it includes ‘value’ in different terms (financial, economic, social, political, environmental) not all of which are quantifiable; and it is not independent of the social and political processes with which aid is engaging. Short-term VfM may be realized in efficient delivery of transfers to target groups, but this is no guarantee of VfM in achieving intended outcome or longer term impact. Programmes that deliver transfers in difficult circumstances may provide good VfM despite falling behind international VfM benchmarks. What appears to an economist to constitute good VfM, for example in reaching the extreme rural poor in a pilot district-level programme, may not do so for a government concerned with nationwide coverage and/or seeking approval from influential non-poor or vociferous urban constituencies. VfM assessments should always be contextualised.
This means that great care must be taken in attempting to benchmark VfM across different programmes and contexts. There may good reasons why costs for your programme are relatively high, for example geography, infrastructure, security and conflict factors, and the state of government and private sector capacity to deliver social transfer payments.
Please send your comments and requests
This guidance will be revised periodically to take on board issues arising as experience of analysing VfM in social transfer programmes accumulates. Feedback from users, on its strengths and its weaknesses, gaps and inaccuracies, and scope for improvement through new ideas and examples, is a key part of this process. Please send your comments to Matthew Greenslade ([email protected]) in the Poverty and Vulnerability Team, Policy and Research Division, DFID. Matthew Greenslade can also assist readers in finding documentation which is cited in this guidance but not available on DFID’s external website.
Acknowledgements
This revised edition of the guidance note was prepared by Philip White (Independent Consultant, [email protected]) and Anthony Hodges (Independent Consultant, [email protected]), under the supervision of Matthew Greenslade (DFID Poverty and Vulnerability Team, [email protected]). The authors are indebted to Thomas Allan, Neil Carey, Cornilius Chikwama, Ben Davis, Ariel Fiszbein, Ugo Gentilini, Krzysztof Hagemejer, Andy Hinsley, Alaka Holla, Stephen Kidd, Heather Kindness, Anna McCord, Michael Morris, Laura Rawlings, Natalia Winder Rossi, Nicholas Taylor, Stuart Tibbs and

Guidance on measuring and maximising VfM in social transfers Part 1: Toolkit
7
Fabio Veras, who responded to requests for comments on the final version of the first edition of the guidance and/or an earlier draft of this edition. Sincere apologies are due for those suggestions that could not be adequately incorporated into this edition due to time constraints; these will be revisited in the next edition. The authors are solely responsible for the inevitable errors and omissions that remain.

Guidance on measuring and maximising VfM in social transfers Part 1: Toolkit
8
Part 1: Toolkit This toolkit sets out 16 steps (labelled A to P) for analysing and maximising the value for money provided by social transfer programmes over their life cycle, from initial design to implementation, monitoring and evaluation.
A. Understand the 3e’s framework
VfM should be measured at all points in the results chain. VfM can best be understood in terms of the results chain, which shows how money is converted into inputs, which in turn generate activities (or ‘processes’), produce outputs (the specific, direct deliverables of a programme) and finally result in outcomes (changes in social or economic well-being) and impacts (related to the longer-term, higher level goals of programmes). VfM therefore depends critically on the validity of the causality embedded in the ‘logic’ of the results chain (or theory of change), which in turns depends on the strength of the evidence and the reasonableness of the assumptions upon which it is built, along with the degree to which the results chain is subject to exogenous risks.
VfM is thus ultimately about the relationship between the money that enters the chain (the costs) and the resulting outcomes and impact. However, VfM can be assessed at different points in the chain. There are basically three levels of VfM analysis, corresponding to the ‘3Es’ of economy, efficiency and effectiveness:
Economy relates to the price at which inputs are purchased (consultants in design phase, targeting costs, management information systems, payment mechanisms, independent evaluations). Economy in procurement is important for in-kind transfer programmes such as food distribution and school feeding, and for public works programmes, but is still significant in ‘pure’ cash transfer programmes, for example in purchasing a management information system (MIS), a delivery service or an impact evaluation.
Efficiency relates to how well inputs are converted to the output of interest, which is transfers delivered to beneficiaries. Cost-efficiency analysis spans both economy and efficiency, focussing on the relationship between the costs of a social transfer programme and the value of the transfers delivered to beneficiaries. Analysis of transfer programmes has highlighted important cost-efficiency issues, which are discussed in detail in Section 2.1
Effectiveness relates to how well outputs are converted to outcomes and impacts (e.g. reduction in poverty gap and inequality, improved nutrition, reduction in school drop-out, increased use of health services, asset accumulation by the poor, increased smallholder productivity, social cohesion). Cost-effectiveness analysis measures the cost of achieving intended programme outcomes and impacts, and can compare the costs of alternative ways of producing the same or similar benefits. Cost-benefit analysis (CBA) is wider-ranging, quantifying in monetary terms as many of the economic costs and benefits of a programme as feasible, including items for which the market does not provide a satisfactory measure of economic value.
These relationships are illustrated in Figure 1.

Guidance on measuring and maximising VfM in social transfers Part 1: Toolkit
9
Analysing programme cost (all stages)
B. Set out costs for all development partners
Please note: emboldened text is considered mandatory, non-emboldened text is recommended if possible but not mandatory.
Use the following metrics to set out programme costs. For explanation go to page 19.
Metric What to measure
Total programme coverage, by year
No. of direct recipients in each programme year (use programme coverage unit of measure, which may be households: but also provide estimate of individual beneficiaries)
Envisaged coverage post-programme/post-donor support
Total programme transfer cost, by year and overall
Total transfer costs (cash, in-kind)
- ex ante: coverage x average transfer per recipient
- during and after implementation: budget outturn on transfer spend
Total programme administrative cost, by year and overall
Total costs for all partners (government & donors)
- to include set-up, training, targeting, enrolment, delivery, management, MIS and external M&E costs, with apportionment of staff time where possible.
Other costs Private costs to transfer recipients
Cost of complementary services to recipients
Total programme (transfer, administrative, other) cost by year and overall
Sum of total transfer, administrative and other costs
% of total costs attributed to different partners
MoneyProcess
(activities)Output Outcome ImpactInputs
Economy Efficiency Effectiveness
Cost-effect iveness
Cost-efficiency
Programme budget
Set-up
Roll- outOperational
M&E
Transfers delivered to beneficiaries
E.g. increased consumption,
higher school attendance,improved
smallholder productivity
Reduced
poverty, inequality,
vulnerability
Personnel
goods & services,
equipment, transfers
MoneyProcess
(activities)Output Outcome ImpactInputs
Economy Efficiency Effectiveness
Cost-effectiveness
Cost-efficiency
Programme budget
Set-upRoll-out
OperationalM&E
Transfers delivered to beneficiaries
E.g. increased consumption,higher school attendance,
improved smallholder productivity
Reduced poverty,
inequality, vulnerability
Personnel goods & services,
equipment, transfers
Figure 1: Applying the 3E framework to analysing VfM in social transfers

Guidance on measuring and maximising VfM in social transfers Part 1: Toolkit
10
C. Break down programme administrative cost into key components
Use a table or chart to show the main components of administrative costs and how they are expected to move over time. It is helpful for comparative purposes to resolve costs into the following main categories (see further detail on page 19):
Metric What to measure
Set-up costs Costs of design, planning, training and major investments in systems
Roll-out costs Costs of targeting/retargeting and enrolment of beneficiaries
Operational costs Recurrent implementation costs, e.g. delivery of transfers
Monitoring & evaluation costs
Ongoing monitoring costs and the periodic costs of external evaluations
All costs should be covered to the extent possible, including both direct costs (those attributable entirely to the programme, and normally included in budgets and accounts) and indirect costs (costs of resources not uniquely accountable to the programme, being also used for regular non-programme activities or shared between a number of programmes, e.g. use of government staff, offices, vehicles etc., but excluding donor office costs). For examples of cost structures see Box 2 on page 21.
D. Assess ‘other’ costs where possible
It is important to collect ‘other’ cost information to judge VfM, to the extent possible. Examples are given in the table below. These ‘other’ costs should be estimated where they can’t be measured and assessed qualitatively where quantitative data are not available. See Assessing other costs on page 22, and Box 4.
Metric What to measure or assess
Total other costs per year (including non-quantifiable costs)
Costs to beneficiaries (collection of transfers, stigmatisation, opportunity costs of compliance with conditions)
Political costs (higher taxation, perceptions of ‘welfare dependency’, more popular alternatives foregone)
Other costs as appropriate (inflation, adverse labour market effects, social divisiveness, environmental costs)
Analysing programme benefits (all stages)
E. Estimate quantifiable and assess unquantifiable programme benefits
Expected benefits should be set out along the results chain as in the logframe. In a well-prepared logframe these will have specific, measurable and time-bound targets, at least at output and outcome levels, providing a sound basis for VfM analysis. Some benefits, especially at the impact level, may be less amenable to measurement and only partially attributable to the programme, but in general are just as important to assess as those which are quantifiable. Other benefits, quantifiable or otherwise, which fall beyond the scope of the
Examples of analysing cost drivers in DFID-supported programmes
Kenya: breakdown of cost drivers for the Orphans and Vulnerable Children Programme (OPM 2010, p73)
Bangladesh: analysis of costs by beneficiary type and component activity for the Chars Livelihoods Programme Phase 1 (HTSPE, 2011, p9)

Guidance on measuring and maximising VfM in social transfers Part 1: Toolkit
11
logframe should also be summarised. Use results from other programme evaluations as far as possible, setting out the robustness of evidence used, the extent to which they apply to the context, and any assumptions clearly. Types of benefit are illustrated in the table below. Further details and examples are set out in the Cost-effectiveness and Cost-benefit analysis sections in the explanatory text (pages 37 to 67). Approaches to measuring benefits of social transfer programmes are addressed only briefly in this guidance, being dealt with more thoroughly in DFID’s separate Guidance on evaluating social transfer programmes (Dissanayake et al., 2012).
Metric What to measure
Outputs (as in logframe) No. of direct transfer recipients and wider beneficiaries in each year of the programme, as in ‘Coverage’ above.
Other outputs, e.g. targeting, registration and delivery systems established, staff trained, community assets created.
Outcome (as in logframe) Quantifiable: e.g. reduced poverty gap and inequality, improved health/nutrition indicators and school attendance or achievement
Less quantifiable: enhanced labour productivity or resilience of beneficiary households
Impact (as in logframe) E.g. reduced likelihood of conflict or need for humanitarian assistance, establishment of sustainable social protection mechanisms, constitutional or legal recognition of rights to social protection.
Note: the distribution of benefits between Outcome and Impact is likely to vary between programmes, according to type and scale
Other benefits Growth and multiplier effects, social benefits (improved social status, reduced crime), political benefits (especially of more universal programmes), environmental benefits
Note: some of these may already be in programme outcome or impact.
Analysing value for money (all stages)
F. Understand the circumstances in which cost efficiency, cost effectiveness and cost benefit analysis should be carried out
Cost-efficiency, cost-effectiveness and cost-benefit analysis, along with economy, should be carried out according to the following rules:
Table 1: Measurement requirements and the VfM chain
Point in VfM chain When should it be measured?
Economy
At all stages (design, implementation and evaluation), to ensure we are minimising the different programme input costs in the different programme areas.
Efficiency
At all stages, to ensure we are not over- (or under-) spending on overall administrative costs of delivering the programme output of social transfers to households or individuals.

Guidance on measuring and maximising VfM in social transfers Part 1: Toolkit
12
Point in VfM chain When should it be measured?
Effectiveness
Cost-effectiveness analysis
At design and evaluation stages, if programme outcome or impact can be quantified but not necessarily in money terms
Cost-benefit analysis
At design and evaluation stages, if programme outcome or impact can be put in money terms
G. Do cost-efficiency analysis in all cases to establish the most cost-efficient way to deliver transfers to beneficiaries
Economy: examine procurement procedures to ensure that inputs (personnel, materials, equipment and services) of the requisite quality are being obtained at the best possible prices. Benchmark against national and international norms and identify opportunities for improvement.
Efficiency: scrutinise management organization, implementation approaches and technical design to ensure that inputs are being used to achieve envisaged outputs as efficiently as possible.
Measure cost-efficiency using the metrics below. For further explanation and for a table (Table 4) comparing cost efficiency across international programmes go to Cost-efficiency on page 27.
Metric What to measure
Cost-efficiency Total cost-transfer ratio (TCTR) (i.e. ratio of total programme cost to value of transfers) or cost-transfer ratio (CTR) (i.e. ratio of administrative costs to transfer costs)
Unit costs: cost per unit of output; cost per direct recipient (and per beneficiary) per period
Notes:
(a) Alternative measures are ratio of transfer costs to total costs (‘alpha ratio’) or ratio of administrative costs to total costs
(b) Relate to national & international benchmarks, commenting on context, programme scale/maturity and other determinants
(c) For in-kind transfers, value at point of distribution using local market prices adjusted for transaction costs; compare levels and cost-efficiency with cash alternative.
Examples of cost-efficiency analysis in DFID-supported programmes
Ethiopia’s Productive Safety Nets Programme (PSNP):
The World Bank’s IEG report on the PSNP shows cost-efficiency of wage and infrastructure transfers of public works component, compared to a public works programme in Argentina (p.27). (World Bank, 2011b)
Estimated cost-efficiency of the PSNP compared to international experience is on p.36 of the Wiseman evaluation report (Wiseman et al., 2010) and on p.133 of World Bank Programme Appraisal Document. (World Bank, 2009)
The cost-efficiency of food versus cash in the PSNP is on p.133 of the World Bank Programme Appraisal Document. (World Bank, 2009)

Guidance on measuring and maximising VfM in social transfers Part 1: Toolkit
13
H. Check cost-efficiency and unit costs against international benchmarks
Comparing cost-efficiency against international benchmarks is critical to judging value for money. But great care must be taken to interpret these benchmarks in the light of:
problems of comparability between different methods of measuring cost: are we comparing like with like?
different contexts with different challenges for delivery (e.g. conflict, geography, government capacity);
different programme objectives and designs;
the difference between pilots and national programmes;
the difference between different points on the programme cycle – because costs are generally much higher in the early years;
Are costs too low in relation to total amounts transferred, and likely to reduce performance and cost-effectiveness?
To learn more go to Using benchmarks from international evidence on page 35. For other examples of cost-efficiency benchmarks see Table 2 on page 31, Box 9 on page 33, and Table 4 on page 34.
I. Be aware of the limits of cost-efficiency analysis
The analysis is inevitably limited to administrative costs, ignoring private and social costs to beneficiaries, or adverse incentive, broader economic and political costs.
Low cost-efficiency does not necessarily mean low cost-effectiveness, and vice versa. A higher administrative cost may be necessary to improve social outcomes. Choice of programme should not be based solely on cost-efficiency criteria.
Cost-efficiency analysis faces significant data deficiencies, including a lack of information on government overhead costs.
Nevertheless, despite these limitations, cost-efficiency analysis should be done in all cases, and an effort made to address critical data gaps where possible. See Limits of cost-efficiency analysis on page 37.
J. Analyse cost-effectiveness for wider, measurable benefits
Cost-effectiveness analysis goes beyond cost-efficiency to measure costs against programme outcome and impacts (rather than just outputs). This gets to the heart of ‘value for money’, allowing rational choice between programme options based on relative cost of achieving desired social and economic results. Benefits need to be measurable, though not necessarily in money terms. See Cost-effectiveness on page 37 of Part 2 for more explanation.
Examples of cost-efficiency benchmarking in DFID-supported programmes
Uganda: economic appraisal for DFID Expanding Social Protection in Uganda programme gives international comparisons (DFID, nd. p15)
Bangladesh: Challenging the Frontiers of Poverty Reduction 1 compares administrative costs with other programmes reaching the ultra poor in Bangladesh (Sinha et al., 2008, p19).
Ethiopia: a VfM assessment of the Productive Safety Nets Programme in 2009-10 and 2010-11 calculated total cost to transfer ratios with and without costs of implementing public works, and compared cost-efficiency of cash and food transfers for different internal transport, storage and handling costs. (DFID 2012b, p.34)

Guidance on measuring and maximising VfM in social transfers Part 1: Toolkit
14
Metric What to measure
Cost-effectiveness (do where benefits can be measured)
Cost per measure of outcome or impact e.g. unit cost of a percentage point reduction in poverty gap, inequality or incidence of severe child malnutrition
Notes:. compare costs of alternative ways of achieving desired outcomes and impacts
Examples of cost-effectiveness analysis for social transfers are provided on page 43. In Guatemala, the cost to reduce the poverty gap by 1 quetzal (Qz) was estimated for a range of different programmes by comparing programme and counterfactual scenarios using household survey data. In the Republic of the Congo, national household survey data was used to simulate ex ante the cost-effectiveness of universal and poverty-targeted child allowances and universal social pensions for the elderly, in terms of the CFA franc cost of a 1 CFA franc reduction in the poverty gap. In Ethiopia, an ex post assessment of the impact of the PSNP on participants’ ‘food gap’, and on its cost of reducing national poverty gap by 1% and by 1 currency unit. Note however that poverty lines can be more or less arbitrary and subject to political influence, and it is essential to assess cost-effectiveness against programme objectives other than ‘reaching the poorest’, including synergies with broader social policy.
K. Be aware of the limits of cost-effectiveness analysis
Data requirements and analytical methods are more demanding than for cost-efficiency analysis, making it necessary to be realistic about what can confidently be measured.
Effects need to be measurable in the same units, but the multiple nature of the benefits that social transfers are expected to generate and serious deficiencies in data availability can make this very challenging.
Cost-effectiveness analysis ignores impacts that cannot be measured, such as improvements in social cohesion or self-esteem, unless a credible and measurable proxy indicator can be identified.
L. Consider cost-benefit analysis where main costs and benefits can be credibly monetized
Cost-benefit analysis (CBA) is a more complete exercise which quantifies in monetary terms as many of the economic costs and benefits of a proposal as feasible, including items for which the market does not provide a satisfactory measure of economic value. This allows the balance of incremental costs and benefits attributable to an intervention to be assessed quantitatively, and compared between alternative options. CBA is most often undertaken in the economic appraisal of new interventions. Whether cost-effectiveness analysis or full CBA is used for this purpose depends on the size of the proposed investment and the extent to which benefits can be credibly monetised.
Examples of cost-effectiveness analysis in DFID-supported programmes
Zambia: analysis of poverty reduction from targeting different population groups (Watkins, 2008 p.53)
Ethiopia: cost-effectiveness of Productive Safety Nets Programme analysed with respect to improving food sufficiency and food security, poverty headcount and gap, preservation/enhancement of household assets, risk financing, access to and enhancement of natural resources and other community assets, and ‘graduation’ (White & Ellis, 2012 p.36)
Rwanda: unconditional transfers more cost-efficient than conditional, though not necessarily more cost-effective (although no comparisons with other programmes – page 38 of Vision Umurenge Programme Annual Report 2009/10.)

Guidance on measuring and maximising VfM in social transfers Part 1: Toolkit
15
In recent examples of cost-benefit analysis for DFID-supported social transfer programmes a key issue is in the choice of how to estimate benefits. A number of different approaches have emerged – estimating the benefit of redistributing to the poor arising from an additional $1 being worth more to the poor than the non-poor (used for Ghana and Zimbabwe, see Table 6); estimating the benefits resulting from, for example, higher consumption, greater school attendance or performance and increased household investment (used for Pakistan and OPTs); or a combination of both (Nigeria, Uganda, Zambia). The present consensus is that the latter, combined approach is to be preferred to the extent that the evidence for each kind of benefit is sufficiently robust. For more on estimating redistributional benefits see paragraph 75 and Box 13 in Part 2).
Where programmes involve multiple partners, a single shared CBA will save considerable time (CBA is usually time consuming – DFID experience so far is that it takes at least four weeks of consultant time). But CBA is currently uncommon, even in the World Bank, because of gaps in the data. The view within DFID is that where possible we should put effort and resources into taking analytical work as far as we can, so long as assumptions and uncertainties in the data are clearly set out.
A number of assumptions will need to be made in simulating projected cost and benefit streams, and these will need to made for the preferred programme option, the counterfactual (‘do nothing’) option, and other main programme options for achieving desired outcomes and impacts. These need to be explicitly backed up by within-country evidence (e.g. programme evaluations, national surveys, published research) and/or international comparisons. The quality, relevance and reliability of this evidence must be assessed. In ex ante analysis, main risks to achievement of objectives should be identified, along with their estimated probability of occurrence, their impact on the balance of costs and benefits, and proposed mitigation measures. To account for the inevitable uncertainty surrounding the assumptions made, undertake a sensitivity analysis to test the effect of varying main assumptions, including the discount rate used. If units of benefit can be monetised but their quantity cannot be estimated, consider a break-even analysis (how many units of benefit would the intervention have to generate before the value of the benefits outweighs the costs?) and assess how likely it is that break-even will be reached. Finally, the discount rate used should be that most commonly accepted across all comparable programmes in the country concerned. For ex ante appraisals, it is worthwhile having cost-benefit analyses peer reviewed before submission to the formal approval process.
For further discussion on CBA for social transfers, see Cost-benefit analysis on page 46 of Part 2. For detailed guidance on CBA, refer to the HM Treasury Green Book and DFID’s ‘How To’ Note on Economic Appraisal. Table 6 on page 51 of Part 2 shows results of CBA analysis from a range of international studies and DFID economic appraisals and evaluations.

Guidance on measuring and maximising VfM in social transfers Part 1: Toolkit
16
Metric What to measure
Cost-benefit analysis (do where main costs and benefits can be credibly monetised)
Incremental economic cost and benefit streams over a full time horizon (e.g. 20 or 30 years) for the preferred (ex ante) or actual (ex post) programme design option compared with the counterfactual case, and other main options (ex ante)
Net present value and benefit-cost ratio using established country discount rate, and (optionally) economic internal rate of return
Sensitivity to changes in key assumptions (including discount rate) to reflect uncertainty.
Proportion of costs attributable to different partners financing the programme.
Break-even analysis (do where units of benefits can be monetised but their quantity cannot be estimated)
Break-even point: benefits required to outweigh costs, and likelihood of achievement
M. Be aware of the limits of cost-benefit analysis
CBA can be time-consuming and expensive.
It relies heavily on the credibility of assumptions and inferences from other contexts.
It is open to manipulation and “optimism bias”, especially when wrongly used to justify an investment decision already taken.
Critical cost-effectiveness drivers
N. Show that you have considered the critical cost-effectiveness drivers for the programme
Whether and how to target
Transfer levels
Whether to use conditionality
Which systems to use for programme implementation.
Use the metrics in the table below. ‘Must do’ metrics are in bold italics.
Metric What to measure
Targeting efficiency
Target method and cost, inclusion & exclusion error, benefit incidence.
(See Targeting on page 55)
Targeting approach and its cost as % of total cost.
% of recipients not in target group
% of target group not receiving transfers
% of total transfers reaching target group(s)
Frequency of retargeting and rate of graduation
Transfer levels
(See Cost-efficiency – evidence and Table 2 on page 31, Box 8 on page 32, and transfer level in relation to targeting on page 57)
Nominal level(s) of transfer per direct recipient per month at scheme inception
- in current cash terms
- as % of current poverty line and minimum wage
Arrangements for periodic review of levels (ex ante)
Changes in nominal levels over time (ex post)
Changes in real levels over time with respect to consumer price index and food prices (ex post)

Guidance on measuring and maximising VfM in social transfers Part 1: Toolkit
17
Conditionality and its own
cost-effectiveness (see Conditionality on page 59; and Fiszbein & Schady, 2008)
Public costs of monitoring conditions and private costs of compliance
Recipients’ additional use of services specified in conditions, and cost of supplying additional services
Implementation systems: registration, enrolment, identification, payments, grievance/appeals system, financial management and fiduciary risk.
(See Implementation systems on page 60, DFID’s ‘How To’ note on Managing fiduciary risk, and DFIDs Guidance on evaluating social transfer programmes pp.8-16).
Costs of registration, enrolment, recipient identification and payments.
Regularity of payments to recipients:
- frequency: no. of payments per year
- timeliness: average actual deviation from scheduled payment date (ex post)
Grievance/appeals procedures, actual frequency of use, including by those excluded, and outcomes;
Integrity of financial management systems and control over fiduciary risk
These metrics will inform judgements about key aspects of design which affect VfM, e.g.:
Is there adequate political and institutional leadership and support behind the proposed implementation strategy and systems at central and local levels, and a capacity to learn and adapt?
Is there a more cost-effective approach to targeting to achieve scheme objectives, or do those objectives need revisiting? In a context of widespread severe poverty, does it make sense to invest in methods for trying to target the poorest 10%, and is there a realistic chance of these being effective? Has an appropriate balance been struck between targeting costs and targeting precision?
Are transfer levels adequate to achieve objectives? Has an appropriate balance been struck between breadth of coverage and transfer levels?
If conditionality is applied, how far are changes in service uptake due to the conditions as opposed to the transfers or other scheme benefits? Does conditionality justify the additional costs of monitoring and compliance?
What scope is there to improve the efficiency and reliability of implementation systems through use of ICT applications, in a MIS that makes links with other programmes?
What further scope is there to enhance efficiency and impacts through financially inclusive payment systems?
Are fiduciary risks adequately catered for? Are there effective arrangements for appeals and complaints?
Monitoring and evaluation (M&E)
O. Build a framework for M&E into programme design, based on the logframe
All the VfM metrics above should be measured throughout the programme life cycle in order to ensure that VfM standards are upheld as implementation proceeds. Programme design should include an M&E framework which can efficiently collect information on indicators at each level of the logframe and test the validity of the assumptions underpinning the results chain, provide timely information for adjusting programme design and process as required during implementation, and inform lesson-learning both during and after the programme. A good M&E system will be flexible to incorporate changes in programme design or implementation context, operational in its links with MIS tools and with strategic

Guidance on measuring and maximising VfM in social transfers Part 1: Toolkit
18
and management decision-making, client-focussed to accommodate client feedback and complaints, cost-efficient in selection of indicators and data collection, intelligible to its target audiences and accountable for its results and findings.
Indicators should be chosen with an eye to VfM within the M&E process itself, focussing on the minimum dataset required to meet operational, strategic and advocacy information needs, and no more. Too many indicators and too much data will obscure key messages, delay the release of findings and slow down the learning process.
As a complement to this guidance, DFID has prepared a separate Guidance on evaluating social transfer programmes (Dissanayake et al., 2012). This covers the why, when, who, what and how of social transfers evaluation, including key issues relating to evaluation questions, planning and management, design and methods, matching approach to the evidence base, use of monitoring data, the role of stakeholders and communicating findings. It also provides a collection of 10 extended African case studies.
For more detail on M&E go to Monitoring and evaluation (M&E) on page 63 of Part 2.
Financial sustainability (design stage)
P. Is the programme likely to be sustained after donor support ends?
A critical question for most donor-supported social transfers, to be considered mainly at the design stage, is the likelihood of programmes being extended or scaled up beyond the period of that support under government financing and management. This may be determined by the government’s fiscal room for manoeuvre, but is also a reflection of its ideological stance and political and planning priorities. These issues are explored in more detail in Financial sustainability on page 65 of Part 2.
Metric What to measure
Sustainability analysis (do where long run impact depends on government adoption/scale-up of programme, which will the vast majority of cases)
Government costs during and after programme in cash terms and as % of recurrent government expenditure and of GDP
Other indicators of fiscal space, e.g. GDP and tax revenue growth, fiscal balance, aid dependence
What evidence is there of government commitment to funding programme extension/scale up post-donor support?

Guidance on measuring and maximising VfM in social transfers Part 2: Explanatory text
19
Part 2: Explanatory text
1. Analysing programme cost
1. We need to understand the main drivers of costs, set out programme costs in a clear manner, break costs down into key components appropriate to social transfers, assess costs other than those relating to administration and the transfers themselves, and make sure we get the desired quantity and quality of outcomes at the cheapest possible price. Go to toolkit page 9 to see how to present programme costs.
1.1 Breaking costs down into key components
2. Costs should be broken down into programme components and analysed over time, as shown in the toolkit page 10. At a minimum, the cost of the transfers themselves must be distinguished from other, administrative costs. To understand better the cost structure of social transfer programmes, it is helpful to disaggregate administrative costs by four broad types: set-up costs, roll-out costs, operational costs, and monitoring and evaluation (M&E). In practice, cost structures vary considerably between programmes, as illustrated by the three contrasting examples in Box 2. Some main determining factors are the following:
In principle, set-up costs, which include design, planning and major investments (such as the establishment of an MIS – see Section 3.4), are fixed costs that should be concentrated mainly at the start of a programme. Set-up costs will be higher where the programme design is complex (e.g. due to multiple objectives or a multilevel targeting system) requiring greater administrative capacity and often significant external technical assistance and training input; or where the existing ICT infrastructure on which to base an MIS is inadequate.
Roll-out costs, which include the identification (targeting) and enrolment of beneficiaries, are also concentrated during the periods of programme launch and expansion, but are not strictly one-off where an established programme is enrolling new beneficiaries or if periodic retargeting is required. Roll-out costs can be expected to be higher where there is a complex set of targeting criteria, requiring intensively supervised selection procedures involving community committees and/or proxy means tests, and periodic retargeting (Section 3.2); or where there is no effective identification system for registration of beneficiaries (Section 3.4).
Recurrent operational costs notably include the costs of delivering transfers to beneficiaries (and in CCTs the costs of monitoring conditionality). These are the long-term running costs of the programme and should become the dominant component of administrative costs as a programme scales up and reaches maturity. Operational costs are likely to be inflated by complex requirements for monitoring compliance with conditions (Section 3.3), and where there is a lack of a financial infrastructure (e.g. post offices or banks) that can handle payments securely and at reasonable cost and to which the target population has effective access; they benefit from economies of scale with respect to both numbers of beneficiaries and level of transfers (Section 3.4).
Finally, M&E costs include both an element of ongoing monitoring costs and the periodic costs of evaluations. Major process and impact evaluations can be a substantial cost component, and it is useful to distinguish between those that feed into implementation during the life of the programme, and external evaluations that are designed to inform decisions about a follow-on programme or similar programmes in general. The first type

Guidance on measuring and maximising VfM in social transfers Part 2: Explanatory text
20
should be included as a programme cost, whereas the second should arguably be counted as a public intellectual good and excluded from the programme VfM assessment (Caldes et al., 2004). M&E costs will be higher where existing government reporting systems on activities and expenditure are inadequate and/or there are significant fiduciary risks, and where there is a lack of recent data on national poverty from household income and expenditure surveys, and on the living conditions of intended target groups, to provide an effective baseline for impact evaluation purposes (Section 4).
3. As Box 2 shows, the overall level of administrative costs relative to the volume of transfers achieved is likely to be higher during the start-up phase of a programme, for small pilots that require intensive supervision and M&E (often involving significant technical assistance inputs) and are not yet benefiting from economies of scale, and for transfers linked to complementary activities such as health and education services or public works.
4. In ongoing programmes for which the host government already has a well-established and effective method of breaking down costs which differs from the above, it may well be best to fit in with current practice so that the analysis is more readily accessible to an in-country audience. This was found to be the case in a recent VfM assessment of the large and complex PSNP in Ethiopia, where established cost headings were:
Transfers (wages on public works or direct support, as either cash or food)
Administration (contract staff & services, equipment & materials, travel, M&E etc)
Capital costs (costs of implementing public works programmes)
Contingency (to allow for additional coverage following shocks)
Institutional support (for regional and federal management and capacity-building)
5. The PSNP case raises the question of how to deal with costs that do not fit easily into either ‘transfers’ or ‘administration’ categories as defined above. The ‘capital costs’ of implementing public works programmes, discussed further in Section 6, could conceivably be seen as supporting the targeting and conditionality arrangements that belong under roll-out and/or operational costs, but they would more commonly be characterised as complementary development activities to build community assets. A number of other social transfer programmes include complementary services to recipients and their communities, such as health and nutrition extension, veterinary support or WASH infrastructure, as exemplified by the Chars Livelihood Programme in Bangladesh. The costs associated with these activities, where they comprise a significant proportion of total costs, are best identified as a separate category for VfM analysis if it is possible to do so.
Direct and indirect programme costs
6. The need to include in VfM analysis ALL administrative as well as transfer costs, year by year, must be emphasised. How easy this is to do depends largely on whether they are direct or indirect costs:

Guidance on measuring and maximising VfM in social transfers Part 2: Explanatory text
21
Box 2: Start-up cost structures in three social transfer programmes
The Cash Transfers for Orphans and Vulnerable Children programme (CT-OVC) Kenya example below follows the expected pattern of costs for a new programme. The OPM evaluation, from which the CT-OVC figures are drawn, covered only the 7 pilot districts assisted by donors. The main costs in 2006/07 were those associated with setting up the programme and identifying and enrolling the first cohort of beneficiaries – indeed no actual transfers were made in that year. As the programme matured, set-up costs declined almost to zero by 2008/09, while roll-out for this pilot phase of the programme was already complete by 2007/08. Expansion to the rest of Kenya’s districts would require further roll-out costs. Operational costs, including UNICEF’s management fee on DFID funds (about 10 percent of all non-transfer costs), expanded roughly in proportion with the volume of transfers, which grew to their 2008/09 level based on roll-out activities in the previous year.
Administrative costs during the start-up of Progresa/Oportunidades in Mexico in 1997-2000 showed a similar evolution, in that set-up and roll-out costs gradually gave way to operational costs as the programme grew, falling from 71% to 15% of administrative costs between Years 1 and 4. Surprisingly, set-up costs appear insignificant at only 6% of administrative costs in Year 1, suggesting incomplete attribution of all such costs to the programme. More strikingly, overall administrative costs comprise a much smaller proportion of total costs in all years compared with the Kenya example, reflecting economies of scale resulting from Progresa’s more rapid scale-up and much larger size (see Box 8).
The example of Ghana’s Livelihoods Empowerment Against Poverty (LEAP) programme illustrates the extent to which actual cost structure (bottom right) can deviate from that which was planned. Planned costs for the five year pilot phase (2008-12) conform to the expected pattern for a pilot roll-out, with relatively high set-up costs and a small volume of transfers in the first year, but diminishing set-up costs thereafter while roll-out and operational out costs increase in approximate proportion to transfer costs as the programme expands. Actual implementation, however, was beset by staff capacity constraints and financing and delivery delays, so that by the end of 2010 only a fraction of the budgeted amounts had been spent, and the proportion of administrative costs in total expenditure was approaching half.
0
1000
2000
3000
4000
5000
6000
2006/07 2007/08 2008/09
US$'000sCT-OVC Pilot, Kenya
Transfers
M&E
Operational costs
Roll-out
Set-up
Source: OPM, 2010
0
100
200
300
400
500
600
700
800
900
1997 1998 1999 2000
US$ mProgresa, Mexico
Transfers
M&E
Operational costs
Roll-out
Set-up
Source: Caldes et al., 2004
0
5000
10000
15000
20000
25000
30000
2008 2009 2010 2011 2012
US$'000sLEAP, Ghana (planned)
Transfers
M&E
Operational costs
Roll-out
Set-up
Source: MESW, 2008
0
500
1000
1500
2000
2500
3000
3500
4000
2007 2008 2009 2010
US$'000sLEAP, Ghana (actual)
Transfers
M&E
Operational costs
Roll-out
Set-up
Source: estimated from MESW accounts, 2007-10. Includes 2007 'pre-pilot'. Operational costs include activities related to complementary services.

Guidance on measuring and maximising VfM in social transfers Part 2: Explanatory text
22
Direct costs are those attributable entirely to the programme. They are normally relatively straightforward to measure as they will appear in programme budgets and accounts. They should include government direct costs (e.g. for procurement and distribution of programme resources) as well as management costs of implementing agencies (UN agencies, NGOs, service providers etc.) that are built into ad hoc contracts with programme funders. The main difficulty arises when cost information for such contracts is deemed too commercially sensitive to be shared with the VfM analyst. Such lack of transparency may apply both to domestic and international procurement of goods and services, whether by governments, donors or implementing agencies, and tends to be more of a challenge when programmes involve in-kind transfers such as food, as is illustrated for Ethiopia’s PSNP in Box 3.
Indirect costs are those not directly accountable to the programme, being costs of resources that are also used for regular non-programme activities or shared between a number of programmes. There is often uncertainty about what to include or exclude, and, more often than not, difficulty obtaining precise or accurate data. It is recommended that an attempt is made to include costs of government staff at different levels according to their respective full payroll costs multiplied by the approximate proportion of full time that they spend on programme administration, along with any non-staff indirect government costs (vehicles, offices, utilities etc) on a similar pro-rata basis based on departmental budget outturn. On the other hand, indirect staff & non-staff costs of DFID and other donor offices at country and headquarters level should be treated as external to the programme and excluded, as is advised in DFID’s overall guidance on economic appraisal (DFID, 2009).
7. Some of the more challenging aspects of cost estimation mentioned above and in Box 3 may require working with in-country partners over an extended period of time in order to build relations of trust, obtain necessary approvals and gather or extract relevant data. For this reason, it may not be realistic to expect short-term VfM consultants, with only a few days fieldwork at their disposal, to complete the cost analysis from scratch without some preparatory work having been done in advance. Some of the barriers to effective monitoring and ex post analysis of actual costs for individual programmes, especially those centred on food transfers, result from the opacity of reporting procedures of international implementing agencies, and will need to be addressed by DFID and other donors at headquarters level.
1.2 Assessing other costs
8. Programme costs include various private, social and other costs that go beyond programme inputs – these should be measured if they can be and estimated if not. Much of the analysis of the cost-efficiency and cost-effectiveness of social transfers, including cost-benefit analysis, focuses narrowly on programme administrative costs. Programme managers and funders are naturally concerned about controlling their own programme costs. However, there are many other potential types of costs that need to be taken into account when designing, implementing or evaluating social transfer programmes. (See toolkit page 10)
9. Van de Walle (1998) identifies three broad types of costs associated with social transfers: programme administrative costs; costs that arise from incentive effects or behavioural responses; and ‘costs that result from the ramifications of political economy’. The latter include both political costs and economic costs such as adverse market effects. Coady et al (2003) add private costs (the transaction costs and opportunity costs of programme recipients or prospective recipients) and social costs such as the stigmatization of recipients.
10. Private costs. It is especially important to minimise the costs borne by programme recipients, which may be substantial if targeting processes, enrolment procedures, payment mechanisms or conditionality requirements are burdensome, distant or time-consuming. Some of these costs, such as those for transport or obtaining documents needed to enrol in

Guidance on measuring and maximising VfM in social transfers Part 2: Explanatory text
23
a programme, are direct costs, while others (time spent and income foregone) are opportunity costs. Where feasible, an attempt should be made to estimate average costs that programme recipients incur as a result of their participation, and include these as a separate cost category for VfM analysis. Box 4 provides examples of the travel and time costs borne by recipients in registering for and collecting payments and complying with scheme conditionality.
11. Use of electronic payment systems can significantly reduce these private costs. In South Africa and Namibia, for example, recipients of social grants can choose between alternative delivery routes involving mobile ATMs, post-offices and banks, and have control over when and where to collect payments. This replaces distribution via government offices at predetermined times and places, involving high travel costs and long queues.
Box 3: Challenges of cost analysis in Ethiopia’s Productive Safety Nets Programme
In 2012, DFID commissioned a VfM assessment of the PSNP in preparation for a decision on the level of contribution to be made to PSNP funding over the remainder of Phase 2 (2010-14). The assessment was tasked with disaggregating the analysis with respect to the four main PSNP regions in Ethiopia, different forms of transfer (cash, food and a mix of both), and different modes of implementation (via government or NGO channels). It was also hoped that a VfM comparison could be made between PSNP and the emergency humanitarian programmes that PSNP was designed to replace for Ethiopia’s 7-8 million chronically food insecure households.
Despite the wealth of detail available in regular financial and implementation reports issued by the Government of Ethiopia (GoE) for this very large programme, the assessment encountered significant challenges in the estimation of cost structures for PSNP food transfers for cost-efficiency calculations.
Consolidated expenditure summaries, disaggregated by region and budget component, were available in quarterly Interim Financial Reports (IFRs), covering cash transfers and aggregate national costs of GoE-provided food transfers. Actual aggregate amounts of food distributed to clients from all sources were specified in the PSNP Annual Implementation Reports. However, a significant proportion of PSNP food transfers involved commodities contributed in kind by USAID and WFP. USAID-contributed food transfers were implemented via NGO partners rather than GoE, and did not feature in GoE financial reports. Unlike GoE, USAID and WFP delivered a high value food basket including vegetable oil and pulses as well as cereals, linked to a range of complementary support activities.
Disaggregated data on actual procurement and associated internal transport, storage and handling (ITSH) costs for PSNP and emergency food operations were generally lacking in published reports, and proved impossible to extract from either GoE or in-country partner agencies in the time available to the team. This is explicable partly in terms of reporting systems not being designed for this purpose, but also results from reluctance to divulge cost information embedded in contracts with commodity suppliers, trucking agents and international and national NGO service providers. Interviews with WFP Addis Ababa and a special request to USAID Washington yielded some helpful summary information, but large gaps remained with respect to both GoE and other channels for food transfers.
Consequently, the analysis used an estimate of likely average annual procurement and ITSH costs, applied uniformly across the country despite inevitably large regional differences in trucking costs from main storage sites. Although there was little doubt that cash transfers were cheaper to implement than food transfers, it was impossible with any precision to determine by how much. Neither was it possible to compare costs of PSNP implementation via GoE or NGO service providers, or PSNP costs with those of emergency humanitarian programmes. What could be demonstrated, however, was how different ITSH rates for the past two years of PSNP2 could have influenced the relative cost-efficiency of cash and food transfers, as shown in Table 3 in the next section.
Source: White & Ellis, 2012

Guidance on measuring and maximising VfM in social transfers Part 2: Explanatory text
24
12. Public works programmes (PWPs) are a special case, as they require a labour contribution from participants, which has an opportunity cost in terms of the time spent and income lost from other activities which may be displaced by participation in the programme. As we shall see below (Section 6), analysis of the cost-efficiency and cost-effectiveness of PWPs needs to distinguish between the gross wages paid to programme participants and their net wages after taking into account income foregone.
13. Social costs could include heightened social tension or the stigmatisation of beneficiaries. There has been particular concern that in low-income environments where almost all households are poor and there are only minor differences in income and
Box 4: Evidence on costs of collecting transfers in social transfer programmes
In Ethiopia’s Productive Safety Nets Programme, 84% of recipients surveyed in 2008 and 2010 reported incurring no costs in collecting payments, with an average cost for all recipients of less than a day’s wage. However, these travel costs were low because, outside of Southern Nations, Nationalities and Peoples’ Region, 93 percent of recipients walked to payment sites, with a typical round trip of 25 – 32 km. Although in principle no recipient should be more than three hours away from a payment site, for many the journey meant an overnight stay, sleeping in the open to save money. Some recipients (between 1% and 4% in most regions) also reported being harassed and/or robbed while on the journey. (Berhane et al., 2011:81)
The impact evaluation of Kenya’s donor-funded pilot Cash Transfer Programme for Orphans and Vulnerable Children (CT-OVC) assessed the time spent on collecting transfers, paid every two months through the Post Office, and the cost of transport. It found that costs were particularly high for beneficiaries in Garissa district, with its more dispersed population and weaker infrastructure than the other six districts covered by the programme. While 57% of current recipients outside Garissa walked to the payment site, spending on average 2.3 hours on a return trip, in Garissa only 2% lived within walking distance. A much larger proportion in Garissa had to rely on motorised transport, spending on average 19.2 hours on a return trip and incurring much higher travel costs. Some 83% of Garissa recipients had to spend at least one night away from home to collect payments. The programme provided 1,000 Kenya shillings (Ksh) compensation for travel costs in Garissa. However, the impact evaluation found that this was not enough to cover the average costs of almost Ksh 1,500 spent by Garissa participants on transportation, accommodation and food for each 2-monthly payment cycle, to collect a transfer of Ksh 3,000. (Ward et al, 2010)
A wider sector review of 22 social transfer programmes in Kenya showed that opportunity costs incurred by programme recipients due solely to their time spent registering for and collecting transfers could be substantial. Simulations using a ‘shadow wage rate’ based on prevailing rural wage rates and best- and worst-case assumptions about rural under-employment suggested that opportunity costs might range between 2.5% and 16% of the value of transfers. (Government of Kenya, 2012:94)
An analysis of Mongolia’s Child Money Programme (CMP) found that transaction costs to apply for child allowances could be onerous or even prohibitive for those without the necessary documents, especially if they lived in rural areas and needed to obtain new identity documents or change their residence registration. Focus group participants in a rural area in Dundgovi aimag (province) put the cost at 40-55% of the annual child allowance to replace a lost identity card, including travel costs to the aimag centre and the payment of a penalty. According to household survey data, transaction costs for receipt of child allowances were also substantial, especially for rural dwellers far from soum (local government) centres where payments were made. Their monthly round-trip journey to collect the benefit averaged 4.3 hours in summer and 4.9 hours in winter, compared with 1 hour for those living in the capital, Ulaanbaatar. Their total journey cost was more than a third of the value of the monthly benefit per child, and over six times higher than for those living in Ulaanbaatar. (Hodges et al, 2007)
In Mexico’s Progresa Programme, recipients’ incurred private costs both in collecting cash payments and in complying with scheme conditionality. The cost of travel to collect payments was put at 1.9% of the value of transfers, or 1.2% accounting for trips that would have been made anyway. Travel costs for additional journeys to clinics and schools attributable to conditions amounted to 1.8% and 1.5% of transfer value respectively. Overall, accounting for the proportions of recipients to whom these conditions applied, private travel costs (excluding opportunity costs) were equivalent to as much as 27% of Progresa’s total administrative costs. (Coady, 2000:29)

Guidance on measuring and maximising VfM in social transfers Part 2: Explanatory text
25
consumption expenditure across deciles, even small transfers could be socially divisive if they are targeted only to the bottom one or two deciles. Ellis (2009) has drawn attention to the risk that transfers could lead to beneficiary households jumping up two or three deciles, ‘leapfrogging’ non-beneficiaries and undermining social cohesion in rural communities. Although the evidence is quite limited, the impact evaluation of the Mchinji social cash transfer scheme in Malawi (Miller et al, 2008) reported that the transfer amount (an average US$4 per capita compared with an inter-decile difference of about US$1.50 per capita) was enough to shift beneficiary households from the first, poorest quintile to above average consumption expenditure in the targeted communities. As a result, 38% of beneficiary households said that the transfers increased jealousy and 22% that they increased conflict. The potential for such effects was also found in a 2012 survey of recipient and community perspectives on the Palestinian National Cash Transfer Programme, as detailed in Box 5.
14. Such socially divisive effects appear to be particularly prevalent when it comes to targeting. As seen in these last two cases as well as in targeting of the Ghana LEAP programme (Korboe et al. 2010:45-47), manipulation by local élites of ‘community-based’ targeting procedures causes understandable resentment. Supposedly more objective proxy means tests (PMTs) were perceived by communities in Ghana as an unaccountable ‘black box’ process undertaken by some far-off computer, more resembling a lottery than a reflection of actual need. Similar perceptions of PMTs among non-beneficiaries in Mexico, Nicaragua, Indonesia and Lebanon led to tensions, unrest and even conflict (Kidd & Wylde, 2011:29). VfM issues in targeting are discussed in more detail in Section 3.2 below.
Box 5: Some hard to measure social costs and benefits of transfer programmes
A 2012 survey of recipient and community level perspectives on the Palestinian National Cash Transfer Programme (PNCTP) in the West Bank provides a picture of the diverse social costs and benefits that may result from transfers at different levels of society. Such costs and benefits are difficult to measure but should nevertheless be explicitly incorporated into VfM assessments and investment decisions.
Individual level
Benefits: Transfers can be used to meet own priorities; better access to child-care and loans; greater economic independence and educational and job-seeking opportunities for women; greater psychological security.
Costs: Can displace investment in the care economy; provides only temporary relief from deprivation; may increase feeling of dependence due to lack of an exit strategy.
Intra-household level
Benefits: Reduced familial tensions and violence; women’s status in household boosted; consumption smoothing effects; better awareness of complementary family services.
Costs: Transfers may be forcibly appropriated for substance abuse; may entrench negative power relations; may cause loss of extended family support.
Community level
Benefits: Better information sharing among recipients, including about complementary assistance.
Costs: Exclusion errors resulting from clientelistic and patriarchal institutions that influence community-based targeting; social divisions between beneficiaries and non-beneficiaries; social stigma sometimes attached to transfers.
State-citizen level
Benefits: Promotes sense among beneficiaries of entitlement to social assistance from the state.
Costs: Palestinian Authority receives little credit for programme, missing opportunity to strengthen state-citizen relations.
Source: adapted from Jones & Shaheen (2012, Table 8)

Guidance on measuring and maximising VfM in social transfers Part 2: Explanatory text
26
15. Stigmatization of beneficiaries may occur if local cultures attach shame to the receipt of transfers or to particular eligibility criteria, such as AIDS. An example of this is provided by the low take-up of the ‘solidarity cards’ that provide free access for the ‘indigent’ to primary health care in Madagascar. Fear of the stigma associated with the status of indigent, which is strong in Malagasy culture, has made even the poorest of the poor reticent about accepting and using the solidarity cards, particularly in rural areas where communities are close-knit. As a result, the exclusion error is very high and even the modest target of 1% coverage of the population has not been met (Poncin and Le Mentec, 2009). On the other hand, entitlement to a regular cash transfer which is not exclusively reserved for the indigent can have the opposite effect of enhancing recipients’ social status, as has been observed for social pensions in South Africa, Namibia and Lesotho. Arguably, social relations deserve more attention in design and evaluation of social transfer programmes than they have so far received. (Devereux, 2001; Croome, Nyanguru and Molisana, 2007; MacAuslan and Riemenschneider, 2011).
16. Economic costs could in principle arise when cash transfers have inflationary effects, although there is little international evidence for this at national level or where markets are reasonably well integrated. Where local markets are functioning poorly or are entirely cut off from wider markets due to lack of transport infrastructure or conflict, the infusion of cash can raise prices in local markets, eroding the value of the transfers among other negative effects, so that food or asset transfers may be more efficient and more effective. This is why the use of cash transfers in the response to humanitarian crises in particular is normally subject to prior analysis of local market conditions (Harvey, 2007). It is more usual, however, for cash transfers to bring economic benefits rather than costs. These may include enabling households to invest in productive assets and increase their productivity (and in the long term by investing in human capital development); or stimulating local markets through multiplier effects. Cash transfers also usually avoid the negative market effects of food transfers, which can depress farmgate prices and reduce incentives to domestic farmers to increase food production.
17. Adverse incentive costs occur when programme design features encourage dependency or diminish participation in productive economic activity. Such effects are most likely to be created by programmes that have a fixed income ceiling for eligibility, verified by a means test, which may provide an incentive to reduce earned income in order to qualify. However, the evidence for such effects is extremely limited, especially in developing countries where transfers are much less generous than in developed countries and where verified means tests are usually impossible to implement (see Grosh et al., 2009:34-37, for more detailed discussion). On the contrary, positive impacts on labour market participation have been documented for Progresa, in South Africa’s Old Age Pension Child Support Grant, and Namibia’s Basic Income Grant Pilot (Skoufias & di Maro, 2006; Samson et al., 2004; Namibia BIG Coalition, 2008).
18. Finally, political costs may arise if programmes, or certain features such as their eligibility criteria, are not widely accepted. There is very little evidence, however, of political costs resulting from the implementation of social transfer programmes, even if there may be political opposition (mainly from policymakers and élites) to launch and fund them. Once the programmes are in place, there are more likely to be political costs in ending or curtailing them. In Mauritius, the imposition of a means test on the universal non-contributory old-age pension in 2004 led to electoral defeat and the rapid reinstatement of its universality by the new government. However, these costs may be limited if programme beneficiaries are poor populations with little or no political voice, as is the case in many low income developing countries. In Ghana, the government has been advised by development partners to end universal subsidies on fuel and utilities to create fiscal space to expand more poverty-oriented programmes such as LEAP cash transfers, especially in the poorer rural north of the country, but remains wary of the political cost of angering their more vocal and influential urban constituents who benefit most from the subsidies. In Nigeria, a federal government

Guidance on measuring and maximising VfM in social transfers Part 2: Explanatory text
27
initiative to curb fuel subsidies in favour of more equitable social spending was partially reversed in the face of widespread rioting in 2012. On the other hand, some state governors in northern Nigeria, notably Jigawa State, clearly see the political opportunities that social transfer programmes represent.
19. More generally, transfer programmes that are narrowly targeted to the poor are less likely to benefit from broad political support than more universal ones, and may even end up with worse outcomes for the poor when that support withers (World Bank, 1990:92; Mkandawire, 2005:13; Fiszbein & Schady, 2009:60). As Kidd et al. point out, the higher budgets devoted to universal old age benefits in Nepal reflects the stronger political support they enjoy in that country compared with the poverty-targeted pensions in neighbouring India and Bangladesh.
20. With the partial exception of private and economic costs, many of these wider costs – and the corresponding benefits of minimising them – are difficult or impossible to quantify in the same way as administrative and transfer costs. Nevertheless no VfM analysis is complete without a careful assessment of how they qualify the interpretation of the quantitative VfM metrics described in this Section.
2. Analysing value for money
21. VfM should be measured at ALL points in the VfM chain to minimise costs and maximise benefits. We should focus on all of the different points of the VfM chain, in programme design and implementation, as set out in Table 1 on page 11 of the toolkit, and discussed in more detail in subsequent sections, though there will be a choice to make on how to analyse programme effectiveness.
2.1 Cost-efficiency
22. Cost-efficiency analysis focuses on the relationship between programme administrative costs and programme outputs, which for social transfers is taken to be the amount of transfers delivered to beneficiaries. At this level of analysis, it is not necessary to try to measure private or other non-administrative programme costs or any other outputs, and by definition, the social outcomes or impact of programmes are not taken into account. Nevertheless, these broader costs and benefits should be considered in interpreting findings, since high administrative cost-efficiency may in practice mask shortcomings in the transfer programme that negatively affect performance. This is particularly important in the short to medium term if a programme is measuring cost-efficiency and not yet actual cost-effectiveness (if too early to see or measure impact). As Grosh et al. (2008:390) remark:
To maximize the level of transfers reaching beneficiaries, the obvious desire is to minimize administrative costs. At the same time, delivering cash or in-kind transfers is like any production process: to reach the intended beneficiaries with the desired transfer of service, programs have to finance a set of critical functions, such as receiving and processing applications, dealing with appeals, processing payments, undertaking monitoring and evaluation, and exercising oversight over how program resources are used. Programs that allocate insufficient resources to perform these functions tend to perform poorly.
23. Despite the necessarily limited scope of the analysis, it is useful to examine the cost-efficiency of social transfer programmes, as low cost-efficiency may reflect low economy (poor procurement) or basic design flaws that inflate costs. Likewise high cost-efficiency can reflect costs which are too low and having a negative effect on outcomes/impact. Inevitably the bottom line question asked by programme managers and funders is ‘what is a reasonable level of administrative costs?’ Behind the numbers, however, lie issues to do with the nature, scale and maturity of programmes, and the relative generosity of transfers, as well as design and implementation issues.

Guidance on measuring and maximising VfM in social transfers Part 2: Explanatory text
28
Methods and measures
24. It is useful first to review the different measures used to express cost-efficiency in social transfers. These are all expressed as ratios and are permutations of the same basic concept. Transfer programme costs have two components: the value of the transfers and administrative costs. Cost-efficiency is therefore sometimes expressed as a ratio between transfers and total costs, or vice-versa.
The total cost-transfer ratio (TCTR), as it is referred to in this guidance, is the total dollar cost, including transfers, of delivering one dollar’s worth of transfer to a beneficiary. If, for example, a programme costing a total of US$ 40 million delivers US$ 32 million in transfers to beneficiaries and spends US$ 8 million on administrative costs, the TCTR is 40/32 or 1.25. The more TCTR exceeds unity, the less cost-efficient the programme is.
Sometimes the reciprocal of the TCTR is used, known as the alpha ratio (α). This is the ratio of the value of transfers to total (administrative and transfer) costs, or 0.8 in this example. Cost-efficiency declines as α falls below unity.
Alternatively, cost-efficiency is measured as a ratio between administrative costs and either total costs or transfer costs. In the first case, the ratio of administrative costs to total costs is 1 – α, i.e. 0.2 or 20% for our example. In the second case, the cost-transfer ratio (CTR) is the ratio of administrative costs to transfers, i.e. the administrative cost of making a one-unit transfer to a beneficiary. In our example, the CTR is 0.25.
Unit cost is another useful metric closely related to the above. At the output (cost-efficiency) level, this may refer to the total programme cost per registered direct recipient (e.g. per household, pension recipient or mother of young children) or per wider beneficiary (e.g. per member of recipient household) per time period, or to the total cost per package of support delivered (which may be in cash or in kind) per period. Equivalent administrative costs per recipient or package may also be used.
25. The advantage of the TCTR metric is that it is not only easy to interpret conceptually, but, unlike CTR, it also allows both the cost of transfers to programmes and their value to recipients (expressed in money terms) to be taken into account in calculating a cost-efficiency ratio. In the case of cash transfers these would normally be treated as the same, though they may diverge from the perspective of foreign donors when costs are mediated via changing exchange rates. However, in-kind transfers pose the problem of whether they should be valued at procurement cost or at their value to recipients, for example using prevailing local market prices, since the two may differ substantially. For reasons explained in Box 6, there is much to be said for the latter approach if a reasonable estimation of average market value to recipients at the point of distribution can be made, since this can help guide decisions as to the most appropriate form of transfer (cash or food, for example) under prevailing market and logistical conditions. Such a calculation can also take into account private transaction costs on the value side of the comparison: for example, the more remote recipients are from food markets, the more value they will attach to food transfers delivered locally rather than cash, even when food prices in those markets are relatively low, and especially when they would otherwise have to travel long distances to collect cash.

Guidance on measuring and maximising VfM in social transfers Part 2: Explanatory text
29
26. It is worth noting that most calculations of these ratios interpret transfers to mean the total value of transfers paid, irrespective of whether they have been paid to the ‘right’ people. In other words, there is no consideration of inclusion error. A case might be made that transfers made to those who in theory are ineligible constitutes ‘leakage’ (the inclusion error is sometimes called the leakage rate) and that therefore these transfers are not part of the output that should be included in these ratios. Whether or not such an adjustment needs to be made at the level of cost-efficiency depends partly on how programme outputs are expressed in the logframe. In most cases, these will be specified in terms of such parameters as numbers of recipients identified and registered for transfers, number of transfers made per month, systems established for targeting, registration and delivery, and management capacities developed. How effective the targeting system turns out to be may well not feature as an output indicator, and so would not then influence the calculation of cost- efficiency.
27. Even if inclusion error is included as an indicator at output level, the problem of how to incorporate it into cost-efficiency remains: to what extent should transfers made to needy people falling just outside the targeting criteria, for example the poor in a programme targeted towards the extreme poor, be discounted in a cost-efficiency calculation? And how would cost-efficiency take exclusion error into account? In this guidance, it is considered preferable to incorporate targeting performance into outcome and impact metrics for cost-effectiveness assessment, rather than at the cost-efficiency level. For more details see Section 3.2 Targeting on page 55.
28. Box 7 provides an overview of efforts to achieve and measure VfM in the Chars Livelihood Programme (CLP) in Bangladesh, and describes the process involved in a recent exercise to assess CLP’s unit costs for two categories of beneficiary household. Findings on unit costs for this and other social transfer programmes appear in Table 4 below.
Box 6: Calculating a cost-efficiency ratio for in-kind transfers
“For cost-efficiency ratios to be calculated for physical transfers (for example, food or inputs), these need to be valued somehow. For example, the value of a food transfer to beneficiaries is often taken to be the procurement cost of the food incurred by the delivery agency. However, this has the flaw that as procurement costs rise, the apparent efficiency of the transfer rises (if US$10 procurement cost of transfers doubles to US$20, with delivery costs remaining the same at US$2, then the cost-efficiency ratio defined above falls from US$1.20 to US$1.10). An evidently better method is to value a food transfer at the market price of food faced by the beneficiary, and compare this with total costs of providing the transfer including procurement, delivery, targeting and all other implementation costs.
“This valuation of physical transfers at market prices (and, by extension, the valuation of cash by what it can buy) makes cost-efficiency ratios comparable across different transfer types, but also permits the analysis to go beyond cost-efficiency towards cost-effectiveness. For example, a cash transfer becomes less cost-effective when food prices are rising (since this reduces the amount of food the cash transfer can buy) and vice versa when food prices are falling. This approach to analysis can inform decisions about whether cash or food is most appropriate to transfer, especially when combined with examination of the simultaneous effect of food or cash transfers on local food markets, whereby in poorly integrated markets transfers could add impetus to price movements and so intensify cost-effectiveness differences between cash and food.”
Ellis, Devereux & White, 2009:87

Guidance on measuring and maximising VfM in social transfers Part 2: Explanatory text
30
Box 7: Achieving VfM in the Chars Livelihood Programme
The DFID- and AusAid-supported Chars Livelihood Programme (CLP) aims to improve the livelihoods, income and food security of one million extremely poor people living on island chars in north-west Bangladesh. The chars are riverine islands created and destroyed by erosion and deposition of silt. Many chars are partially or completely submerged during the annual floods and may exist for a few years or several decades, making the area a very precarious place to live. The char economy is predominantly agricultural, relying on the floods to sustain fertility. Extremely poor char dwellers risk illness, floods, erosion and seasonal hunger. Most have no capital and few skills with which to diversify livelihoods, and little or no access to services such as healthcare, education or microfinance.
CLP objectives: under CLP Phase 2 (2010-2016), alongside broad interventions e.g. in healthcare and market development, 67,000 poorest (‘core’) households receive a support package aiming to:
improve social and economic assets through transfer of a productive asset of the household’s choice, worth up to Tk15,500 (about £120) – most choose cattle – and training to enable them to generate a sustainable income from the asset, build awareness of civil rights and laws, improve social cohesion and enhance knowledge of health, hygiene and disaster preparedness;
reduce environmental and economic risk: core activities include raising households on plinths above known flood levels, and providing access to clean water and sanitary latrines to reduce disease, family and asset maintenance grants, emergency grants and seasonal employment;
increase access to markets and services through training local health workers and livestock service providers, helping households establish small businesses, creating markets that work for the poor, establishing community savings and loans groups, and building service partnerships.
Steps taken by CLP to achieve VfM include recent studies of cost-efficiencies of CLP implementing organisations (IMOs) (2011), data requirements for VfM (2011) and VfM unit costs and strategy (2012), as well as publication of a VfM Brief. Implementation measures include the following:
economy: closely observed procurement guidelines; 6-monthly procurement plans; rigorous IMO selection & contract management procedures; competitive tendering; IMO procurements, invoice & asset tracking; register of price reductions & cost savings achieved; internal & external audit;
efficiency: linked financial and output reporting; project design modifications to broaden output coverage at given cost; unit cost analysis for key components and outputs; cost efficiency analysis comparing value of transfers and services with administration cost; independent verification of outputs; customer satisfaction & ad hoc affidavit surveys;
effectiveness: socio-economic, food security, nutrition and empowerment indicators monitored through independent data collection; attribution via rolling baselines; review of graduation criteria; panel data from CLP1 compared with rolling baselines.
Analysis of CLP unit costs per household in 2012 aimed to shed light on how much is spent on delivering CLP activities to each core and non-core household, and how much it costs to improve the livelihood, income and food security of each household that CLP targets. Key steps were:
1. Allocating costs to core and non-households at different levels. This started with the most direct (‘Tier 1’) operational support activities, some reserved for core households only, others requiring estimation of core/non-core shares. ‘Tier 2’ costs were staff and other costs shared across activities within each operational component, allocated according to the aggregate Tier 1 core/non-core cost distribution for each component. ‘Tier 3’ costs related to non-operational components (e.g. IMO management, M&E), allocated according to the aggregate Tier 1 and 2 core/non-core cost distribution across all operational components. Finally, ‘Tier 4’ costs of the CLP Management Agency were split in the same way as Tier 3 costs.
2. Determining numbers of core and non-core households: unit costs were calculated for core households at three levels: numbers enrolled; numbers completing the 18-month cycle of CLP support; and numbers are deemed to have graduated from CLP. For non-core households, numbers were taken as all those with access to at least some CLP activities, the core/non-core ratio assumed to remain constant at 1:3 as CLP expands into new districts.
3. Selection of periods over which to assess unit costs: periods selected for the analysis were actual cumulative Phase 2 unit costs to October 2012 (the most recent financial reporting period), and projected unit costs for the whole of Phase 2 based on current targets.
Source: CLP briefs and reports (http://www.clp-bangladesh.org/)

Guidance on measuring and maximising VfM in social transfers Part 2: Explanatory text
31
Evidence
29. Where available, the data on these measures show wide variations between programmes and countries, and between different years for the same programmes. As noted above, these differences reflect not only differences in programme objectives, design and implementation, but also declining unit costs and a shifting structure of costs as programmes develop beyond pilots to scale up and reach ‘maturity’. Differences in these cost-efficiency measures also reflect differences in transfer levels, which automatically affect all the ratios mentioned above. If two programmes have identical non-transfer costs but the transfer level is twice as high in one as the other, then the first will be twice as cost-efficient as the second.
30. Looking at the evidence, the Lesotho old age pension (OAP) appears to be one of the most cost-efficient programmes in low-income Africa, with a TCTR (ratio of total costs to transfers) of only 1.02 in 2005/06, although this is thought to underestimate central administrative costs (Ellis et al, 2009). This reflects the fact that the OAP uses simple categorical targeting, with on-demand enrolment, and delivers payments for a low charge through existing Post Office facilities. Social pensions in general appear to be among the most cost-efficient programmes, due to their simple targeting approach and large scale.
31. Social transfer programmes with more complex targeting (based on PMTs and/or community targeting) tend to be more administratively expensive, as do conditional cash transfers (CCTs) which require mechanisms for monitoring compliance of beneficiary households with the conditions imposed by the programme. Nevertheless, these programmes can be cost-efficient when they are taken to scale and initial fixed costs diminish in importance. The most cited example (see Caldés et al, 2004) is Mexico’s PROGRESA programme (now known as Oportunidades), which by 2000, four years after it was launched, had a TCTR of just 1.05, even accounting for estimated indirect staff costs. By this time the programme reached 2.6 million households, as much as 40 percent of all rural households in Mexico.
32. Programmes of this type in low-income Africa tend to less cost-efficient, but this is at least partly explained by the fact that they tend to be smaller and more tightly targeted, and/or less generous than in the middle-income Latin American countries. Table 2 provides examples of three such African programmes.
Table 2: Cost-transfer ratios in three African programmes with complex targeting
Programme Total cost-transfer ratio (TCTR)
Determining factors
Mozambique Food Subsidy Programme (PSA)
1.55 (2007) Government-run cash transfer for very poor elderly, disabled and chronically ill, begun 1990 in urban areas but expanded to rural areas from 2006. Thinly spread, with high travel costs and lengthy targeting procedures but low transfer level (only 5% of minimum wage by 2010). (Walker et al, 2008; Ellis et al, 2009; Hodges & Pellerano, 2010)
Ghana – Livelihood Empowerment Against Poverty (LEAP)
2.0 approx. (2008-2010 cumulative)
New government-run pilot for extremely poor households. Nationwide coverage, but thinly spread with complex community + PMT targeting system. TCTR raised by payment delays. (White, 2011)
Kenya CT-OVC programme
2.03 (2006/07-2008/09 cumulative). Down to 1.34 by 2008/09.
New pilot for poor OVCs in 7 districts. Intensively managed. Complex community + PMT targeting. TCTR fell as set-up and roll-out costs declined and transfers expanded. See Box 8. (OPM, 2010)

Guidance on measuring and maximising VfM in social transfers Part 2: Explanatory text
32
33. The available data on the relative cost-efficiency of cash transfers versus food distribution supports the view that in most cases it is cheaper (as well as more flexible for beneficiaries) to distribute cash rather than an equivalent amount (in market value) of food. However, this may not be the case in situations of high food scarcity and poorly performing markets. Evidence on cash and food-based programmes in Malawi and Zambia is presented in Box 9.
Box 8: How cost-efficiency improves as programmes mature
Figure 2 below shows how cost-efficiency improves as programmes evolve from small pilots to expand programme coverage. The total cost-transfer ratio for Mexico’s PROGRESA fell sharply from 2.34 in year 1 to 1.05 in year 4, mainly due to the rapid increase in transfer volumes. Kenya’s Hunger Safety Net Programme followed a very similar pattern. For the Kenya Cash Transfer for Orphans & Vulnerable Children (CT-OVC), the TCTR cannot be calculated for Year 1, as there were no transfers, but then declined from 2.63 in Year 2 to 1.34 in Year 3, when costs were almost entirely recurrent operational costs. The ex-ante TCTR for the Nigeria Child Development Grant (CDG) declines from 2.04 in Year 2 (the first year of transfers) to 1.49 in Year 5. Set-up, indirect government staff costs and programme-oriented M&E costs are included in all cases. The relative cost-efficiency of PROGRESA by its fourth year, with only $1.05 total cost for each $1.00 transferred, is noteworthy – PROGRESA was by then a huge programme, reaching 2.6 million rural households, or 40% of all rural households in Mexico, with a relatively generous transfer (up to US$60/month per household by 1999).
The final year’s TCTR in each of these examples provides the best available indication of long-term average programme cost-efficiency, although this is likely to improve further as programmes expand, fixed costs decline and larger economies of scale come into play. Thus it is important to specify stage of maturity when referring to cost-efficiency, especially when making comparisons between programmes.
Figure 2: Evolving TCTRs in social transfer programmes in Kenya, Mexico and Nigeria
Sources: Caldés et al, 2004; OPM, 2010; DFID Kenya, 2012; White, 2012
2.63
1.34
2.04
1.77 1.57
1.40
2.34
1.321.09 1.05
2.41
1.60
1.23 1.21
0
0.5
1
1.5
2
2.5
3
Year 1 Year 2 Year 3 Year 4 Year 5
Tota
l co
st-t
ran
sfe
r ra
tio
Evolution of cost-efficiency in four start-up
social transfer programmes
Kenya CT-OVC Nigeria CDG
Mexico PROGRESA Kenya HSNP

Guidance on measuring and maximising VfM in social transfers Part 2: Explanatory text
33
34. For Ethiopia’s PSNP, a similar cost-efficiency comparison was complicated by lack of information on actual procurement and internal storage, transport, storage and handling (ITSH) costs of food, as detailed in Box 3 in the last section. Table 3 shows how relative cost-efficiency of cash and food transfers might have been influenced by possible ITSH rates in 2009-10 and 2010-11. Thus in 2009-10, when expected prices for imported food were below those in regional markets, a low ITSH rate from central warehouses to regional distribution sites could have made food cheaper to deliver than cash of equivalent value.
Box 9: Relative cost-efficiency of cash, food and farm input transfers
Should donors shift the emphasis of transfers away from food, which has traditionally been dominant in social assistance and humanitarian programmes, to cash or near-cash (vouchers)? The improved cost-efficiency of cash transfers over food transfers has been one of the main arguments for doing so, along with a desire to give beneficiaries more flexibility in meeting their needs and to avoid the risk that food distribution will undermine local agricultural markets and reduce incentives to improve food production, especially if food is imported from outside. However, it would be misleading to claim that cash is always more cost-efficient to deliver than food. This depends to a large extent on how well food markets are working.
White and McCord (2006) argue that, to make valid comparisons it is necessary to convert cash transfers into the food they will buy, using local market prices, or conversely to convert food transfers into their cash value on local markets. The cost-efficiency of transfers of farm inputs, such as seeds and fertiliser, can also be compared in this way if they are converted into their food or cash equivalent at local market prices. Using this approach, White and McCord compared a range of cash, food and farm input transfers in Malawi and Zambia, which confirmed that in general cash transfers are more cost-efficient than food transfers. Their results are shown in Figure 3, with food and farm input transfer values converted into dollars at local market prices rather than using procurement prices. In cost-efficiency terms there appears to be no substantial difference between cash and farm input transfers. These results need to be interpreted with caution, however, as they are based on a small sample of programmes. Cost-efficiency for individual programmes in single years may be affected by idiosyncratic factors such as programme scale and maturity.
Figure 3: Total cost-transfer ratios of cash, food & farm input transfers in Malawi & Zambia
Source: derived from White and McCord, 2006.
1.79
2.20
2.91
1.16
1.17
1.23
1.46
1.67
1.09
1.65
0.0 1.0 2.0 3.0 4.0
WFP assistance for Angolan refugees, Zambia, 2005
WFP country programme, Zambia, 2005
WFP Relief and Recovery Operations, Zambia, 2005
FOOD TRANSFERS
Targeted input programme, Malawi, 2003/04
Fertiliser support programme, Zambia, 2002-04
Winter targeted input programme, Malawi, 2003
Starter pack, Malawi, 1999/2000
Targeted food security packs, Zambia, 2003-04
FARM INPUT TRANSFERS
Kalomo cash transfers pilot, Zambia, 2004-06
Dedza Satefy Nets Pilot, Malawi, 2001/02
CASH AND NEAR-CASH PROGRAMMES
Source: White & McCord, 2006

Guidance on measuring and maximising VfM in social transfers Part 2: Explanatory text
34
Table 3: Ethiopia PSNP: cost-efficiency of food vs. cash transfers at alternative ITSH rates
2009-10 2010-11
Tonnage of food transferred MT 273,196 218,129
Avg. import parity price ex-Addis ETB/kg 5.13 6.98
Avg. regional retail value “ 5.82 6.85
Alternative average ITSH rates ETB/kg 1.30 1.00 0.70 0.40 1.30 1.00 0.70 0.40
Cost of food procurement + ITSH “ 6.43 6.13 5.83 5.53 8.28 7.98 7.68 7.38
Cost-value difference “ 0.61 0.31 0.01 - 0.29 1.43 1.13 0.83 0.53
Extra cost of food over cash ETB m 166 84 2 - 80 312 246 181 116
Source: White & Ellis, 2012
Table 4: Unit cost and cost-efficiency ratios for selected social transfer programmes
(1) (2) (3) (4) (5) (6) (7) (8)
Programme Year of
operation
No. of direct
recipients
Cost per direct
recipient
Cost per wider
beneficiary
Admin cost per recipient
Admin cost as %
of total cost
Total cost-
transfer ratio
Ex ante costs (2012 US$)
Ghana LEAP, 2012 5 164,370 155 40 35 23% 1.29
Nigeria CDG, 2017 5 60,000 400 100 107 27% 1.37
Tanzania PSSN, 2018 5 275,000 296 55 104 35% 1.54
Zambia Child Grant, 2015 5 85,502 237 47 60 25% 1.34
Actual costs (current US$)
Bangladesh CLP, 2011-12 8 17,485 940 235 347 37% 1.59
Ethiopia PSNP, 2010-11 7 7,535,451 34 34 9 28% 1.38
Ghana LEAP, 2010 3 26,079 132 34 69 53% 2.11
Kenya CT-OVC, 2008/09 3 15,000 331 75 83 25% 1.34
Kenya HSNP, 2011/12 4 68,611 297 50 51 17% 1.21
Mexico PROGRESA/ Oportunidades
2000 4 2,600,000 314 63 16 5% 1.05
2012 16 6,500,000 815 163 42 5% 1.05
Zambia Child Grant, 2011 2 32,643 251 50 111 44% 1.79
Notes and sources:
Total cost-transfer ratio is the ratio of total programme costs to the value of transfers
LEAP = Livelihoods Empowerment Against Poverty Programme, Ghana (White, 2011)
CDG = Child Development Grant, Nigeria (White, 2012)
PSSN = Productive Social Safety Net, Tanzania (White/World Bank-Tanzania, 2012)
CLP = Chars Livelihood Programme, Bangladesh (White, 2012) – includes complementary support
PSNP = Productive Safety Net Programme, Ethiopia (White & Ellis, 2012)
CT-OVC = Cash Transfers for Orphans & Vulnerable Children, Kenya (OPM, 2010)
HSNP = Hunger Safety Net Programme, Kenya (DFID Kenya, 2013)
PROGRESA = Programa Nacional de Educación, Salud y Alimentación (renamed Oportunidades),
Mexico (Caldés et al, 2004; http://www.oportunidades.gob.mx/, 2012)

Guidance on measuring and maximising VfM in social transfers Part 2: Explanatory text
35
Using benchmarks from international evidence
35. Total administrative costs as a share of programme costs should be compared with international evidence from other programmes, such as that presented in Table 4 which provides both unit cost metrics and cost-efficiency ratios for specific years for a selection of programmes, measured ex ante after five years of operation, and/or ex post for the most recent year for which data are available. Since both are influenced by the stage of maturity of a programme and its scale, columns 2 and 3 show year of operation and number of direct recipients for each programme. Columns 4 to 6 are unit cost metrics for total cost per direct recipient and per wider beneficiary, and administration cost per direct recipient. These reflect both the cost-efficiency and the level of generosity of programme transfers. Columns 7 and 8 are cost-efficiency ratios: administrative cost as percentage of total cost and TCTR – these are in fact unit costs of a kind, being equivalent respectively to cost of administration per unit of programme spend, and total cost per unit of value transferred.
36. This table underlines the wide range of size, generosity and cost-efficiency seen in social transfers. At about 7.5 million, the Ethiopian PSNP has the largest number of registered ‘clients’ who are direct recipients of transfers, but due to the programme’s policy of ‘full family targeting’ these are actually individual beneficiaries living in approximately 1.6 million households. PROGRESA/Oportunidades is thus by far the largest of these programmes, reaching 6.5 million households (30% of all Mexican households) by its 16th year (2012), followed by PSNP, the proposed Tanzania PSSN and the proposed Ghana LEAP (though the original 2012 LEAP target of 164,370 households will not now be reached until 2015).
37. Column 5 in Table 4 shows that the highest annual cost per individual beneficiary in this group of programmes was for the Bangladesh CLP with US$ 219 in 2011/12, reflecting this programme’s comprehensive range of support in addition to cash and in-kind transfers. This is followed by Oportunidades at US$ 163 in 2012, with the proposed Nigeria CDG some way behind at US$ 100. With the high level of cost-efficiency still claimed for Oportunidades (only 5% of total costs spent on administration), this programme is similar to CLP in its level of support per individual.2 At the other end of the cost per beneficiary scale are the Ethiopia PSNP in 2010-11 and the actual cost for the Ghana LEAP programme in 2010, both at just US$ 34. The PSNP average transfer per individual was only about US$ 24 in 2010-11, while for LEAP it was just US$ 16, mainly due to delays in distributing transfers, compared with a planning figure of US$ 25.3
38. Notwithstanding the inherent difficulties in comparing across countries and programmes, Grosh et al. (2008) provide approximate benchmarks, based on a sample of 55 schemes of different types, for what they consider to be reasonable administrative costs (Figure 4). They conclude that the share of administrative costs in total programme costs clusters in the range of 5 to 15% in well-executed cash and in-kind transfers, and suggest (p. 391) that ‘anything beyond about 12 to 15 percent of total costs bears close examination to see why administrative costs are relatively high’. With the exception of PROGRESA/Oportunidades, the schemes shown in Table 4 all have administrative cost percentages falling towards the upper end of the 55-scheme sample, and it is worth considering why.
2 The average monthly per family transfer for Oportunidades was increased to 777 pesos in 2012
(http://www.oportunidades.gob.mx/). With an average family size of 5 this would suggest an annual transfer per individual beneficiary of US$ 141, compared with US$ 147 for CLP.
3 It is understood that, with DFID support, the Government of Ghana now propose to increase
LEAP’s monthly transfer level per household from 15 to 36 cedis, equivalent to US$ 59 annually per individual beneficiary. This is expected to boost cost-efficiency substantially.

Guidance on measuring and maximising VfM in social transfers Part 2: Explanatory text
36
Figure 4: Share of administrative costs by types of intervention: median values (%)
Source: Grosh et al., 2008.
39. As Grosh et al. themselves acknowledge, care is needed in using such data for benchmarking purposes, due to problems of comparability between the very diverse range of programmes in each group. While the higher costs of food-related programmes in their sample is perhaps to be expected due to their greater logistical demands, especially procurement involved long-distance shipment, the ordering of cost-efficiency between public works, CCTs and cash transfers seems precisely opposite to what one would expect, with public works the most cost-efficient and cash transfers the least. The share of administrative costs for the sampled public works programmes, for example, ranged from 1.6% to 24.0%, and it appears that staff costs were not included in many cases. Many of the programmes appear to have been at a larger scale and/or at a later stage of development than those with higher administrative costs in Table 4, and only 5 of the 55 were in Africa where management systems are generally less developed.
40. Therefore much depends on the choice of benchmark programmes and the completeness and coverage of cost information, and it is essential that every effort is made to ensure that like is being compared with like. There may be perfectly good reasons why the share of administrative costs is higher than international benchmarks in specific instances. But this could also be a sign that the programme can be improved. To apply such benchmarks meaningfully it is necessary to go beyond the headline numbers and ask the following types of questions (summarised on page 13 of the toolkit):
Does the programme also provide specialised social welfare or other complementary services in addition to transfers, and is conditionality involved?
On public works programmes, are administrative costs significantly inflated by the costs of implementing the works projects?
Does the programme serve small groups with special needs, such as groups living with particular disabilities, making it impossible to achieve significant economies of scale?
Is the programme just starting up, with high initial fixed costs, and not yet exploiting economies of scale?
Is the administrative cost share high because the transfer level is too low (to achieve intended social protection outcomes and impacts)? One way of adjusting the cost-efficiency measure for the relative generosity of transfer levels, as proposed by Grosh et
8.96.7
16.0
25.4
4.9
0
5
10
15
20
25
30
Cash and near-cash transfers
(n=16)
Conditional cash transfers
(n=9)
Fee waivers (n=5)
Food related programmes
(n=19)
Public works (n=6)

Guidance on measuring and maximising VfM in social transfers Part 2: Explanatory text
37
al. (op.cit: 392.) is to use an index of administrative costs calculated as: (administrative costs/total programme costs)*(transfer level/beneficiary household consumption).
Is there an inherent design problem? For example, are the targeting and conditionality mechanisms too complex and costly for the benefits they bring, or alternatively should they be strengthened because the benefits in programme performance will outweigh the higher costs? Could new technology in registration and payments systems bring down unit costs? These issues are discussed further in Section 3.
Are there implementation problems, for example in procurement or the need to reach beneficiaries in difficult environments, whether a result of geography, poor infrastructure or conflict?
Limits of cost-efficiency analysis
41. It is important once again to stress the limits of cost-efficiency analysis in assessing VfM for social transfers. First, the analysis is invariably limited to administrative costs and takes no account of private and social costs to beneficiaries, or adverse incentive, broader economic and political costs, all of which are nevertheless very important in broader analysis of programmes. Second, low cost-efficiency does not necessarily mean low cost-effectiveness (which is the cost of achieving outcomes or impact rather than output), and vice versa. A higher administrative cost may be necessary to improve the social and economic outcomes of a programme. For this reason it would be wrong to base choice of programme solely on cost-efficiency criteria. Finally, analysis of cost-efficiency is limited in practice by major deficiencies in data, including for many programmes a lack of information on government overhead costs, lack of transparency where contract costs are involved, and an overall paucity of metadata. Nevertheless, despite these limitations, cost-efficiency analysis should be done in all cases, and an effort made to identify clearly and where possible address critical data gaps.
2.2 Cost-effectiveness
42. Cost-effectiveness should be assessed in all cases, and calculated where benefits can be quantified but not necessarily expressed in money terms. Analysis of cost-effectiveness goes far beyond the limited realm of cost-efficiency by attempting to measure costs against the outcomes and impact of programmes, in other words the results they are ultimately intended to deliver. This gets to the heart of ‘value for money’, making it possible to choose rationally between programmes or variants in programme design on the basis of the relative cost of achieving desired social and economic results.
43. However, the data requirements and analytical methods are more demanding, making it necessary to be realistic about what can be measured with confidence. As a DFID ‘How To Note’ on economic appraisal rightly points out, ‘the sophistication of the techniques that can be used in analysing value for money, and the depth of insight that can be given, depend on whether outcomes and impacts can be credibly quantified’. In the specific case of social transfers these challenges are formidable, although not entirely insuperable, due to the multiple nature of the benefits that transfers are expected to generate, their long time-horizon and serious deficiencies in data.
44. In their book on Social Protection in Africa, Ellis et al (2009, p. 86) draw a clear distinction between ‘cost-effectiveness analysis’ and ‘cost-benefit analysis’, which it is important to bear in mind as we discuss these two different but related approaches over the next two sub-sections:
Cost-effectiveness analysis differs from cost-benefit analysis in that whereas cost-benefit analysis attempts to assess financial or economic returns to an investment by attaching monetary values to all associated costs and benefits and comparing the two, cost-effectiveness analysis more straightforwardly specifies a project objective (or set of

Guidance on measuring and maximising VfM in social transfers Part 2: Explanatory text
38
desired outcomes) and then analyses the cost of achieving it. Cost-effectiveness analysis is appropriate when effects cannot easily be reduced to monetary terms, even if they can be quantified. It is well suited to social transfer schemes, where the focus is most often on assessing value for money in attaining transfer objectives rather than on quantifying overall economic or financial returns to an investment. Like cost-benefit analysis, cost-effectiveness analysis can be used to compare alternative interventions with different costs and different effects, provided the effects can be expressed in the same units.
Methods – estimating outcomes and impacts
45. Cost-effectiveness analysis takes programme outcomes and impacts, together with their associated indicators, as a starting point. These will normally be set out in the programme logical framework. In essence, the analysis calculates unit costs for these results, in the same way that unit costs are derived for outputs at the cost-efficiency level, and judges cost-effectiveness by comparing these unit costs with alternative programme options and similar programmes elsewhere. It is important, however, that such a comparison is made on qualitative as well as quantitative grounds, taking into account qualitative aspects of objectives and contextual factors both for the programme under review and those with which it is being compared.
46. The kinds of effects that social transfers are typically expected to generate vary but they often include (as short to medium term effects) the reduction of monetary poverty, increased spending on food and improved dietary diversity, improved school attendance or reduced drop-out, reduced use of child labour, lower incidence of malnutrition or sickness and increased take-up of health services, the accumulation of household assets and increased productivity. (See Analysing programme benefits in the toolkit, page 10.) These are the same kinds of domains in which impact evaluations of social transfers seek to measure effects on programme beneficiaries (relative to control groups of non-beneficiaries with similar socio-economic characteristics). Impact evaluations, combined with programme cost information, are therefore potentially a valuable source of data for analysing cost-effectiveness. Impact evaluations of transfer programmes are becoming more common in low-income countries, following in the tradition set by CCTs in Latin America (see Section 4 and Dissanayake et al., 2012 p.12). A key source of information and learning on social transfer impacts in Africa is The Transfer Project, summarised in Box 10.
47. Likewise, more scope exists for using data in national household surveys either for ex-post analysis of the cost-effectiveness of existing programmes or for ex ante simulations of the expected cost-effectiveness of social transfers in programme design and planning. Since living standards measurement surveys (LSMS) or other household surveys of a similar type are now being implemented periodically in most low-income countries, they should be used for this purpose where they are reasonably up-to-date. To realise the potential of national surveys for cost-effectiveness analysis may involve working with the national statistical office (and donors supporting it):
For ex post analysis of impact, the survey would need to include questions on household receipt of the social transfer in question, making it possible to identify recipients and then examine their situation. It would also enable robust assessment of targeting performance: beneficiary incidence analysis can reveal what proportion of transfer recipients are falling into the poorest and richest quintiles, or below and above the national poverty line. This level of analysis will be feasible only where the scale of the programme is sufficient for it to be incorporated into survey design, and for the survey to include enough recipients for statistically robust comparisons between recipients and non-recipients to be made.

Guidance on measuring and maximising VfM in social transfers Part 2: Explanatory text
39
When a transfer programme is small, these conditions are unlikely to apply. For geographically targeted programmes it may be possible to overcome this by over-sampling in the programme area, although statistical offices are unlikely to countenance modifying a national survey for this purpose.
48. Simulations may be limited to estimating the short-term income effects of transfers, usually making the simplifying assumption that transfers are added fully to consumption expenditure and ignoring substitution effects and behavioural changes, although more complex models can accommodate these. In most cases, the models employed do not take into account second-round effects and thus are not appropriate for predicting the long-term impacts of programmes, such as for example the returns to education resulting from social transfers over many years.
49. Nonetheless, it is extremely useful to calculate the short-term effects of alternative social transfer options and then combine these results with cost data or cost projections, based on programme planning assumptions, to simulate cost-effectiveness for selected variables. The counterfactual is the absence of the social transfer, or an alternative policy option, such as consumer subsidies (see Box 11), depending on the question being answered.
Box 10: The Transfer Project
The Transfer Project: Learning How Social Transfers Work in Africa is an innovative research and learning initiative that aims to help address unanswered questions about how, why and in what contexts social transfer programmes are most appropriate and effective – questions that national policy makers, implementers and monitoring & evaluation specialists often struggle with in isolation due to a lack of regional opportunities to share experience and learning.
The Transfer Project “supports improved knowledge and practice on social transfers in Africa in several key areas:
Support to national longitudinal quantitative and qualitative impact evaluation in the region – to help us understand not only what impacts cash transfers are achieving, but also how and why.
Cross-regional analysis to draw thematic and operational lessons based on the diversity of social transfer programmes in the region.
Creating mechanisms for regional learning & exchange among regional policy makers, implementers, researchers and civil society – through workshops, web resources, public data availability, and publications.”
Key partners in the Transfer Project are UNICEF, FAO, Save the Children UK and the University of North Carolina at Chapel Hill, collaborating with national governments, research partners and civil society in Africa. The Project began with a design phase in 2008-09, and is now in a five-year implementation phase, supporting existing or new data collection in Ethiopia, Kenya, Malawi, Mozambique, and Rwanda. A growing number of other countries participate in the Project network, including Botswana, Ghana, Lesotho, South Africa, Swaziland, Uganda, Tanzania, Zambia and Zimbabwe.
(Source: Transfer Project website: http://www.cpc.unc.edu/projects/transfer, January 2013)

Guidance on measuring and maximising VfM in social transfers Part 2: Explanatory text
40
Box 11: Comparing the cost-effectiveness of cash transfers and subsidies
Benefit incidence analysis, which analyses the distribution of benefits across the population (e.g. by per capita consumption quintiles), has shown that in many countries subsidies are poorly targeted, benefiting the poorest least. In low-income countries, one of the main reasons for this is that subsidies tend to be applied to goods that are imported and/or traded in formal markets. It is administratively difficult to subsidise the food products that are bought by poor households, which are mainly traded in informal markets. As a result, consumer subsidies are often also less cost-effective than well-targeted cash transfers, and major savings (or a bigger bang for buck) could be obtained by shifting resources from subsidies to cash transfers. In Senegal, for example, cash transfers are being developed as a more cost-effective alternative to subsidies, which were not pro-poor and were very expensive, costing between 3 and 4% of GDP, leading to their abolition in 2008 (World Bank, 2011a). In Mozambique, based on data for 2008, it would have been possible almost to quadruple government expenditure on social transfers if all the resources spent on fuel subsidies had been redirected to this end (Hodges et al, 2010).
A study on policy responses to the impact of the global crisis on children in three West African countries (Burkina Faso, Cameroon and Ghana) compared the cost-effectiveness of food consumption subsidies (in the form of VAT or import tariff exemptions) and cash transfers targeted to households below the national poverty line using a proxy means test (PMT), taking into account the inclusion and exclusion errors predicted by the PMT formula. Cost-effectiveness was shown by measuring the benefits (against a counterfactual scenario of no action) that could be bought with each intervention for a budget outlay equivalent to 1% of GDP, considered to be a reasonable level of social assistance expenditure by the standards of low or lower-middle income countries. The study used a complex methodology, linking a CGE model to simulate the effects of the global crisis on the economy of each country to a micro-level household model, using national household survey data, to simulate both the impacts of the crisis and the impacts of alternative policy measures on child welfare variables. Impacts and cost-effectiveness were simulated with respect to monetary poverty, caloric poverty (‘hunger’), school participation, child labour and access to health services.
The cost-effectiveness of the two policies varied across the countries, but in all cases the targeted cash transfer was more cost-effective than the food subsidy.
Figure 5Figure 5 shows the results for the change in the poverty gap resulting from the combined effects of the global crisis and the three policy scenarios: no action, a food subsidy and a targeted cash transfer programme. As can be seen, the food subsidy only partially offset the impact of the global crisis in Burkina Faso and Cameroon, and had no effect in Ghana, while in all cases the cash transfer more than offset the effects of the crisis, especially in Cameroon.
Figure 5: Simulated change in poverty gap resulting from the global crisis and alternative social protection measures costing 1% of GDP, in three African countries, 2009
Source: Cockburn et al, 2010.
2.2
1.0 1.0
1.6
0.9 1.0
-0.3
-1.5
-0.3
-2.0
-1.5
-1.0
-0.5
0.0
0.5
1.0
1.5
2.0
2.5
Burkina Faso Cameroon Ghana
No social protection measures
Food subsidy
Cash transfer targeted to poor
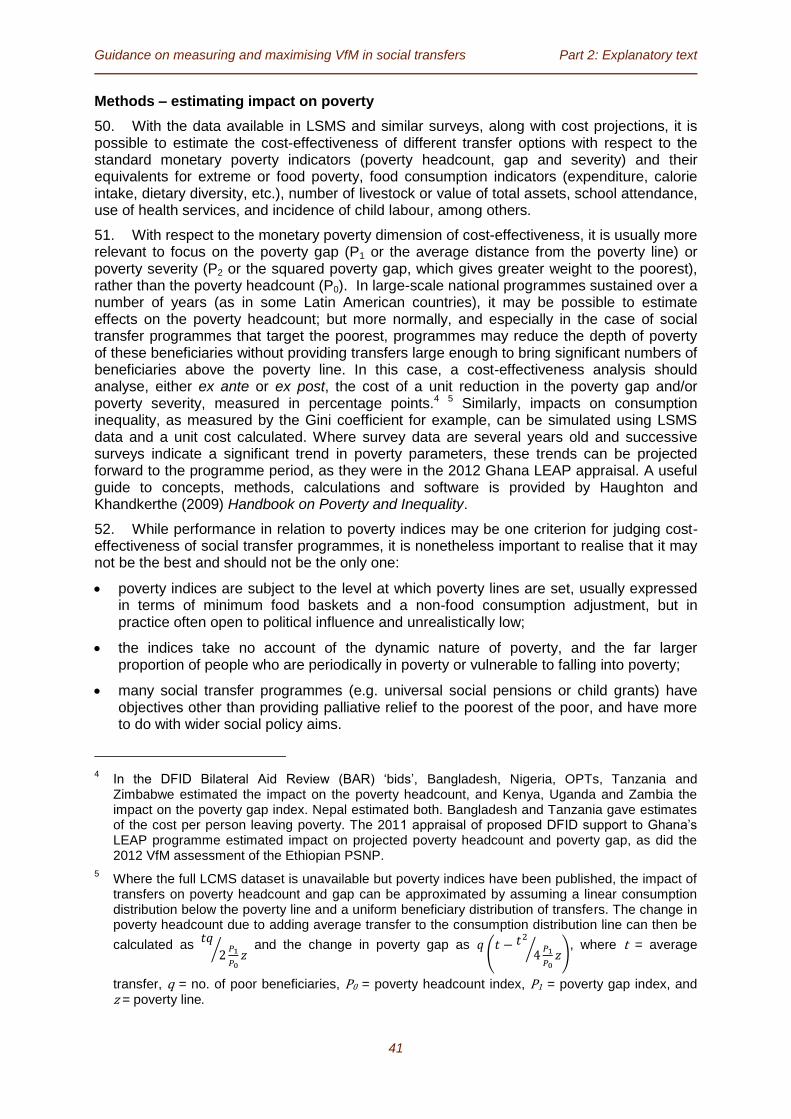
Guidance on measuring and maximising VfM in social transfers Part 2: Explanatory text
41
Methods – estimating impact on poverty
50. With the data available in LSMS and similar surveys, along with cost projections, it is possible to estimate the cost-effectiveness of different transfer options with respect to the standard monetary poverty indicators (poverty headcount, gap and severity) and their equivalents for extreme or food poverty, food consumption indicators (expenditure, calorie intake, dietary diversity, etc.), number of livestock or value of total assets, school attendance, use of health services, and incidence of child labour, among others.
51. With respect to the monetary poverty dimension of cost-effectiveness, it is usually more relevant to focus on the poverty gap (P1 or the average distance from the poverty line) or poverty severity (P2 or the squared poverty gap, which gives greater weight to the poorest), rather than the poverty headcount (P0). In large-scale national programmes sustained over a number of years (as in some Latin American countries), it may be possible to estimate effects on the poverty headcount; but more normally, and especially in the case of social transfer programmes that target the poorest, programmes may reduce the depth of poverty of these beneficiaries without providing transfers large enough to bring significant numbers of beneficiaries above the poverty line. In this case, a cost-effectiveness analysis should analyse, either ex ante or ex post, the cost of a unit reduction in the poverty gap and/or poverty severity, measured in percentage points.4 5 Similarly, impacts on consumption inequality, as measured by the Gini coefficient for example, can be simulated using LSMS data and a unit cost calculated. Where survey data are several years old and successive surveys indicate a significant trend in poverty parameters, these trends can be projected forward to the programme period, as they were in the 2012 Ghana LEAP appraisal. A useful guide to concepts, methods, calculations and software is provided by Haughton and Khandkerthe (2009) Handbook on Poverty and Inequality.
52. While performance in relation to poverty indices may be one criterion for judging cost-effectiveness of social transfer programmes, it is nonetheless important to realise that it may not be the best and should not be the only one:
poverty indices are subject to the level at which poverty lines are set, usually expressed in terms of minimum food baskets and a non-food consumption adjustment, but in practice often open to political influence and unrealistically low;
the indices take no account of the dynamic nature of poverty, and the far larger proportion of people who are periodically in poverty or vulnerable to falling into poverty;
many social transfer programmes (e.g. universal social pensions or child grants) have objectives other than providing palliative relief to the poorest of the poor, and have more to do with wider social policy aims.
4 In the DFID Bilateral Aid Review (BAR) ‘bids’, Bangladesh, Nigeria, OPTs, Tanzania and
Zimbabwe estimated the impact on the poverty headcount, and Kenya, Uganda and Zambia the impact on the poverty gap index. Nepal estimated both. Bangladesh and Tanzania gave estimates of the cost per person leaving poverty. The 2011 appraisal of proposed DFID support to Ghana’s LEAP programme estimated impact on projected poverty headcount and poverty gap, as did the 2012 VfM assessment of the Ethiopian PSNP.
5 Where the full LCMS dataset is unavailable but poverty indices have been published, the impact of
transfers on poverty headcount and gap can be approximated by assuming a linear consumption distribution below the poverty line and a uniform beneficiary distribution of transfers. The change in poverty headcount due to adding average transfer to the consumption distribution line can then be
calculated as
⁄ and the change in poverty gap as
(
⁄ )
, where t = average
transfer, q = no. of poor beneficiaries, P0 = poverty headcount index, P1 = poverty gap index, and z = poverty line.

Guidance on measuring and maximising VfM in social transfers Part 2: Explanatory text
42
53. Thus alternative education-focused social transfers – for example, a CCT, a school feeding scheme and the free distribution of school uniforms – might be compared in terms of the cost of a 1 percentage point increase in the next primary school attendance ratio. Similar types of measures could be devised for other types of effects.
Methods – looking at targeting
54. Cost-effectiveness analysis of social transfers should take into account targeting performance. For example, where a programme is targeted towards those below the extreme poverty line, the benefit incidence (in this case the proportion of transfers expected to reach the extreme poor) should be estimated, based on targeting evaluations of this and/or other programmes, and the unit cost of impacts on poverty headcount and gap adjusted accordingly. This does, however, raise the issue referred to in paragraph 27 above, of what cost-effectiveness weight if any should be given to recipients who fall outside the target group due to inclusion error, even marginally so (i.e. just above the extreme poverty line in this example). An explicit judgement will need to be made about any such weighting, depending on programme objectives. In cost-benefit analysis, estimated benefit incidence across the whole income distribution can be used to weight benefits on distributional grounds, as discussed in the next section.
55. A second issue related to targeting performance is exclusion error: how can cost-effectiveness analysis reflect the extent to which a programme fails to reach those who satisfy targeting criteria but are not registered for transfers? At first sight, this kind of error is more about effectiveness than cost-effectiveness: a programme which reaches only 10 percent of its household target group will not be very effective, but could be considered cost-effective if it does so at a favourable cost per household. However, as mentioned in the last section, much depends on how the ‘units’ for which unit-costs are calculated are specified in outcomes and their indicators:
if specified in terms of numbers of target group members benefiting, then exclusion ‘error’ as such does not arise; however, any additional costs generated by programme undercoverage, for example social divisions and political costs caused by resentment on the part of those excluded or economies of scale foregone, will need to be considered in the analysis even if these are not quantifiable;
if specified more usefully in terms of effects on the target group as a whole, then exclusion error becomes important, but is automatically built into the unit-cost calculation (for example cost per 1 percent reduction in overall national/sub-national poverty gap or Gini coefficient or under-five stunting incorporates both inclusion and exclusion error).
56. In most poverty targeted social transfers exclusion ‘error’ tends to be high, not so much because the targeting system is inaccurate but because it is designed as a rationing mechanism for a pot of benefits that is based on what is considered ‘affordable’ rather than on needs. Such systems often attempt to identify ‘the poorest ten percent’ in target communities through poverty-ranking mechanisms, as well as adding complex criteria to restrict eligibility to particular groups of households which can be identified as most disadvantaged (e.g. those with high dependency ratios). When targeting inaccuracies are added to the picture, and these may be substantial in poverty targeting (see Section 3.2 Targeting), impacts on overall poverty may become marginal and social and other costs may be high.
57. In practice, therefore, cost-effectiveness analysis should aim to ensure that all important costs are assessed, both for recipients and non-recipients, quantifiable or otherwise, over the short, medium and longer term, but should also be prepared to examine effectiveness in broader terms than might be specified in statements of programme outcomes, taking into account wider goals and policy statements.

Guidance on measuring and maximising VfM in social transfers Part 2: Explanatory text
43
Evidence
58. In Figure 6 below, we provide below a few examples of cost-effectiveness analysis applied to social transfers using these types of measures. Some examples for DFID-funded programmes appear on page 14 of the toolkit.
59. In Guatemala, the World Bank estimated the cost required to reduce the poverty gap by 1 quetzal (Qz) for a range of different social protection programmes (see World Bank, 2009, citing World Bank, 2002). To establish the counterfactual, it was assumed that the level of consumption in the absence of each welfare programme equals current consumption minus the welfare payment. For each programme the current and counterfactual poverty gaps are estimated, using data from a household survey. The difference is the contribution of the programme to poverty gap reduction. Finally, cost-effectiveness is calculated by dividing the reduction in the poverty gap by the cost of the programme. In this case, due to the inadequacy of data on administrative costs, costs were limited to the costs of the transfers. The results showed school feeding was one of the most cost-effective options, costing Qz1.5 to achieve a Qz1.0 reduction in the poverty gap, compared with (at the opposite extreme) Qz8.9 for old age pensions and Qz8.3 for electricity subsidies.
60. In the Republic of the Congo, Notten et al (2008) used national household survey data to simulate ex ante the cost-effectiveness of universal and poverty-targeted child allowances (for children aged 0-14), along with universal social pensions for the elderly (aged 55 and above), given assumptions about transfer level (relative to the national food poverty line) and the ratio of administrative costs to transfers, based on international experience. Cost-effectiveness was measured in terms of the CFA franc cost of a 1 CFA franc reduction in the poverty gap, with the results showing the highest cost-effectiveness for targeted child allowances (a unit cost of 1.35 CFA francs per 1 CFA reduction in P1), followed by universal child allowances (1.69) and then universal old-age pensions (2.02). The targeted child allowance had the best performance despite significant inclusion and exclusion errors resulting from a proxy means test, simulated as part of the model.
Figure 6: Comparative cost of reducing the poverty gap
Sources: World Bank (2009), Notten et al (2008), Hodges et al (2010)
8.9
8.3
6.1
5.7
2.9
1.5
0 5 10
Old age pensions
Electricity subsidy
School transport …
Survivor's pensions
Scholarships
School feeding
Guatemala: Qz cost of reducing poverty gap by 1
Qz
1.69
1.35
2.02
0 1 2 3
Universal child allowance
Child allowance for poor
households
Universal old-age pension
Republic of the Congo: CFA franc cost of reducing
poverty gap by 1 CFA franc
56
52
112
57
16
13
0 50 100 150
Child allowance (children 0-14)
Child allowance (children 0-4)
Old age pension
Maternity allowance
Transfers to poor HH
Transfers to 1st percentile HH
Benin: Cost (in billion CFA francs) of 1 percentage
point reduction in poverty gap

Guidance on measuring and maximising VfM in social transfers Part 2: Explanatory text
44
61. In Benin, similar methods were used, although unrealistically assuming perfect targeting, to simulate the cost-effectiveness of a range of cash transfer options, including child allowances, old age pensions, maternity allowances and non-categorical transfers targeted to the poor and the ultra-poor (first percentile), for a feasibility study on cash transfers (Hodges et al, 2010).
62. A broader summary of the cost-effectiveness analysis undertaken as part of a recent VfM assessment of Ethiopia’s Productive Safety Nets Programme (PSNP) is provided in Box 12. This benefited from a substantial accumulation of evaluation studies and research over the years since PSNP was inaugurated in 2006, but had also to work around some substantial information constraints on the costs side as detailed in Box 3 above. The analysis concluded that PSNP has achieved its objectives in a cost-efficient and cost-effective manner, comparing favourably with international benchmarks. It also concluded PSNP would need to be extended at least at its current levels of generosity and coverage well beyond 2014 (the end of the current phase) if government ambitions to ‘graduate’ the present and projected caseload out of chronic food insecurity are to be realised.
Limits of cost-effectiveness analysis
63. Cost-effectiveness analysis of the type described above is useful for measuring the cost of unit changes in the intended social or economic outcomes of social transfer programmes, so long as the effects can be measured in the same units. As indicated above, the absence of a common metric such as money to quantify effects across the range of different dimensions in which transfers can be expected to produce benefits is the main limitation of this approach, although it may be more credible, given the demanding data requirements of a full cost-benefit analysis, and is valuable for making policy choices or refining programme design.
64. A second limitation in practice is that cost-effectiveness analysis sometimes becomes preoccupied with impacts on monetary poverty indices to the neglect of a broader analysis more attuned to programme goals. This is especially important for social transfer programmes such as social pensions which are not exclusively or even mainly focussed on the poorest but serve wider, and more widely supported, social policy aims.
65. A final limitation is the short-term nature of the effects that can be measured with the tools and data available for most cost-effectiveness analysis, whether using model-based ex ante simulations or analysis based on the data from impact evaluations. In the latter case, attribution to the programme of changes in poverty headcount and gap would require two good, well-timed rounds of household survey data with distinct beneficiary and control groups (see Dissanayake et al., 2012, Section 8). But such data constraints also apply to most cost-benefit analysis of social transfers, which often has to rely heavily on assumptions. The difficulty of quantifying certain impacts, such as improvements in social cohesion, limits the scope of both approaches equally.

Guidance on measuring and maximising VfM in social transfers Part 2: Explanatory text
45
Box 12: Cost-effectiveness analysis in Ethiopia’s Productive Safety Nets Programme
A 2012 VfM assessment of Phase 2 (2010-14) of Ethiopia’s Productive Safety Nets Programme (PSNP2) examined cost-effectiveness against the following intended PSNP outcome and impacts:
Outcome: In chronically food insecure (CFI) woredas:
food consumption assured and asset depletion prevented for food insecure households;
markets stimulated and access to services and natural resources enhanced for all households;
natural environment rehabilitated and enhanced through public works projects
Goal: Food security status for male and female members of food insecure households in CFI woredas improved.
Sources: The assessment cited the IFPRI-led Phase 1 (PSNP1, 2006-2010) impact studies based on surveys of PSNP clients in 2006, 2008 and 2010, in particular Berhane et al. (2011) which combined ‘difference in difference’ analysis comparing recipient and comparable non-recipient households, and ‘dose-response’ analysis examining the cumulative impact of receiving PSNP transfers. This also covered the complementary initiative now known as the Household Asset Building Programme (HABP), which provides credit and advice to help households increase assets, raise agricultural productivity and diversify incomes. Reference was also made to a modelling of income-cost ratios for various HABP packages (Coulter & Sutcliffe, 2009), and pilot cost-benefit studies of PSNP public works projects (MA Consulting, 2009; GFDRE, 2011). Finally, preliminary results of Ethiopia’s 2010/11 household income, consumption and expenditure survey (HICES) (GFDRE, 2012) were used to compare PSNP transfers with poverty headcount and gap. Once available, the full HICES dataset – especially if it records PSNP participation – will allow deeper analysis of PSNP poverty impacts.
Evidence of impact: With respect to assuring food consumption, PSNP1 had reduced clients’ annual food gap by 1.3 months (from 3.6 to 2.3 months), with 1.05 months of the reduction attributable to the cumulative effect of 5 years participation compared with 1 year. It had also increased by 0.15 the average daily number of meals eaten by children of PSNP households. For clients of both PSNP and HABP, food gap reduction was greater at 1.53 months. By 2010/11 PSNP had taken 7.6 million out of a humanitarian caseload which had since 2003 fluctuated between 9 and 13 million people, providing them with more regular and predictable transfers in a cost-efficient manner. The addition of a risk financing facility in PSNP2, extending capability to respond to shocks by meeting transient as well as chronic food needs (in food or in cash), raises potential coverage to 9.6 million people.
Cost-effectiveness: While quantitative evidence on the comparative cost-effectiveness of PSNP and emergency humanitarian programmes in meeting immediate food gaps was inconclusive (partly due to cost data constraints – see Box 3), the assessment found that PSNP is almost certainly more cost-effective in meeting longer-term food security objectives. This is mainly due to the difficult-to-measure benefits that come from greater predictability and timeliness and the secure foundation these provide for household asset protection and accumulation. On the assets front, average household livestock holding had been raised by 0.38 units by PSNP alone, but by 1.00 unit by PSNP and HABP jointly. PSNP with HABP had also increased farm tools by US$9 in value and grain yields by 297 kg/ha. Markets had been stimulated and access to services enhanced by PSNP’s move towards cash transfers and its investment in health, education and transport infrastructure via public works. HABP packages could give financial income-cost ratios ranging between 2.0 and 5.6, and economic benefit-cost ratios calculated for public works projects varied between 1.5 and 6.5 in one pilot study and 1.2 and 3.5 in the other, with natural resource rehabilitation providing the best returns. Thus while humanitarian aid, on one estimate costing US$ 180 per capita per year during 2008-2011, had failed to prevent a steady decline in livelihoods prior to 2006, PSNP, at a per capita cost of US$ 34 in 2010-11, appears to have not only arrested this decline for client households but begun to reverse it.
PSNP transfers cover almost 30% of the rural poor, amount to just 10% of the poverty line and raise a fifth of beneficiaries above that line. In 2010-11 transfers equated to a 10.5% reduction in rural poverty gap, costing US$ 1.79 per US$ 1.00 reduction which compares well with international benchmarks.
However, Ethiopia’s demographic and food security dynamics mean that the Government of Ethiopia ambition to ‘graduate’ 80% of chronically food insecure caseload by the end of PSNP2 is not achievable with the current level of programme resourcing and activity. Alongside other initiatives, the PSNP will need to be extended in some form beyond 2014, and its transfer level and coverage maintained or preferably increased, if its food security goal is to be achieved.
Source: White & Ellis (2012).

Guidance on measuring and maximising VfM in social transfers Part 2: Explanatory text
46
2.3 Cost-benefit analysis
66. Whereas cost-effectiveness analysis compares the costs of alternative ways of producing the same or similar benefits, cost-benefit analysis (CBA) quantifies in monetary terms as many of the economic costs and benefits of a proposal as feasible, including items for which the market does not provide a satisfactory measure of economic value. This allows the balance of incremental costs and benefits attributable to an intervention to be assessed quantitatively, and compared between alternative options. CBA is most often undertaken in the economic appraisal of new interventions. Whether cost-effectiveness analysis or full CBA is used for this purpose depends on the size of the proposed investment and the extent to which benefits can be monetised. The same applies to use of these techniques in ex post evaluation. See Consider cost-benefit analysis where main costs and benefits can be credibly monetized on page 14 the toolkit for a summary of metrics and methods.
Methods
67. CBA normally covers the full time horizon over which costs and benefits can be expected to occur – up to 20 or 30 years is often used depending on the nature of benefits – not just the period during which investment takes place. To compare costs and benefits occurring in different time periods, projected incremental cost and benefit streams are discounted to their present value (PV). There are two main methodologies for arriving at a suitable discount rate for this purpose:
the social rate of time preference (SRTP), which assesses the value society attaches to present as opposed to future consumption, and which is recommended and explained in the UK HM Treasury Green Book;
the social opportunity cost of capital (SOC) which seeks to proxy the marginal social return were funds to be invested privately; this may be more appropriate in certain developing country contexts with severe resource scarcities – including constrained access to international finance markets – which mean that SRTP will understate the ‘true’ discount rate.
68. Present DFID guidance is that a uniform discount rate should be established for all DFID’s appraisal work in the country in question and covering several years, using one of these two methods. Often, this will be the rate used by the government or (more commonly) the World Bank.6
69. CBA results are usually expressed as net present value (NPV) (PV of incremental benefits minus PV of incremental costs) or benefit-cost ratio (BCR) (PV of incremental benefits divided by PV of incremental costs). Optionally, economic internal rate of return (EIRR) (the discount rate at which NPV equals zero) can also be provided.
70. For ex ante appraisal, the analysis should be undertaken for each major project option for achieving desired outcome and impacts. At a minimum, two options are analysed: the preferred option and the counterfactual (do nothing) option. Similarly, in applying CBA to ex post evaluation, the estimated actual economic cost and benefit streams are compared with the counterfactual (those that would have occurred without the programme). Full guidance on appraisal methods is provided in the HM Treasury Green Book and DFID’s How To Note on Economic Appraisal.
71. In applying CBA to social transfers, it is necessary to think carefully about the economic benefits that the transfers are expected to yield, identifying the units of benefit that best describe outcome and impact in the results chain. (Metrics are summarised in Analysing
6 For DFID staff, details appear in the internal DFID minute ‘Interim guidance on discount rates’,
DFID Chief Economist, 26-Aug-11

Guidance on measuring and maximising VfM in social transfers Part 2: Explanatory text
47
programme benefits in the toolkit, page 10, with more detail in Dissanayake et al., 2012.) Two examples are presented in Box 13. Both quantify not only immediate impacts on consumption (valued at the level of the transfer itself) but also longer-term impacts deriving from improved health, educational achievement and labour productivity.
72. The Gaza case includes an economic multiplier effect as an additional benefit, based on the injection of cash into the local economy via grocery shops participating in the voucher project. There are different views as to whether it is legitimate to claim such an effect. DFID’s guidance on economic appraisals (DFID, 2009:5) states that “Multiplier effects should generally be excluded because they rely on the existence of spare productive capacity that rarely exists in developing countries.” Local or national multiplier effects were, however, adduced for Malawi’s Dowa Emergency Cash Transfer (Davies and Davey, 2008), India’s Mahatma Gandhi National Rural Employment Guarantee Scheme (MGNREGS) (Hirway et al., 2009) and Zambia’s Child Grant (Hinsley, 2012).
73. Most recently, local general equilibrium impacts of Kenya’s Cash Transfer for Orphans & Vulnerable Children and Lesotho’s Child Grants Programme have been simulated under FAO’s Protection to Production Project (see Box 14). Findings suggest that productive capacity constraints may indeed dampen multiplier effects, but that these remain significantly above 1.0 under most conditions, and are likely to be much higher when cash transfers are complemented by initiatives to relieve those constraints, notably among non-recipient households, within a broader social protection system. Interestingly, because ineligible households are more likely to exhibit a positive supply response to increased demand resulting from cash transfers, multiplier effects may actually be enhanced by targeting inaccuracies. This therefore tends to weaken the argument that targeting cash transfers to the poorest and most vulnerable households provides better VfM than more widely targeted programmes.
74. Other studies estimate impacts of social transfers on local or national GDP growth (e.g. Landim, 2009 for Brazil’s Bolsa Familia, or McCord and Van Sventer, 2004 for labour intensive public works in South Africa). It must be acknowledged, however, that data on multiplier, growth or price impacts are rarely available and seldom captured in impact evaluations. The main concern relating to price levels, especially food prices, is that rising prices will erode the real value of transfers unless they are adequately indexed.
75. The Nigeria example includes a ‘distributional dividend’, which raises the immediate consumption value of the transfers based on the principle that a marginal unit of consumption brings more benefit to a poorer person than a better off one, in proportion to the difference in their incomes. This methodology, which is explained in Annex 5 of the HM Treasury Green Book, is appropriate where priority is given to redistributive or poverty-alleviating objectives, or where data to quantify other more promotive programme aims are lacking, and has been followed in a number of other DFID-supported social transfer appraisal exercises including the Zambia Child Grant, the Programme of Support (PoS 2) for the National Action Plan for OVCs and their Families in Zimbabwe (NAP II) and Uganda’s Expanding Social Protection Programme.7
7 The redistribution in question is from non-poor to poor in the partner country, not from UK tax
payers to the poor: the decision to spend aid in the partner country can be taken as read and is not the investment decision being analysed. A challenge is getting the counterfactual right. Where would the money be spent if not on the programme in question? If it would be spent on equally poor beneficiaries, there will be no benefit from redistribution.

Guidance on measuring and maximising VfM in social transfers Part 2: Explanatory text
48
Box 13: Two case studies of ex ante cost-benefit analysis for social transfers
Gaza Social Protection and Food Security Programme
One of two options appraised by a 2011 VfM analysis for this proposed programme (Shah, 2011) was a US$20m urban voucher programme (UVP). Implemented in partnership with WFP, the UVP would target poor and food insecure households in urban Gaza through provision of monthly vouchers worth US$70, exchangeable for selected food items at registered retail outlets. With administration costs at 17% of total costs (i.e. an alpha ratio of 0.83 or CTR of 0.20), the UVP was judged cost-efficient. Using findings from a mid-term review (MTR) of an earlier pilot voucher programme, the US$270 cost per beneficiary-year was compared with that of in-kind food distribution. Although the latter could meet daily calorie and protein requirements more cheaply, the vouchers were judged more cost-effective due to wider benefits arising from beneficiary access to a more nutritionally varied and higher value food basket, which they could supplement with cereals purchased using money saved due to the vouchers.
The CBA was based on the following units of benefit:
immediate consumption and income effects, valued at the exchange value of the vouchers;
longer-term welfare benefits from improved nutrition, in terms of estimated Disability Adjusted Life Years (DALYs), valued using a GDP per capita estimate for the target population;
labour productivity gains for present and future employed recipients due to better nutrition and education, accounting for future labour force participation, disability and stunting; for over-16s this was based on evidence from Pakistan on nutrition-wage relationships, while for under-16s gains are modelled using findings for the South Africa Child Support Grant (Aguero et al., 2006);
an economic multiplier effect in the Gaza economy and the increase in revenue thereby realized by local retailers; this was based on the pilot MTR finding that the vouchers increased the turnover of participating retailers by 62%, of which 20% would represent increased profit.
The main non-quantifiable benefit considered in the CBA was an expected improvement in social cohesion and stability in Gaza’s fragile social and political context, based on the notion that poverty reducing interventions can contribute to breaking vicious cycles of poverty and instability.
Nigeria Child Development Grants Programme
This £55 million programme focuses on Jigawa and Zamfara States in northern Nigeria, where 77% of the population are poor, half the under-fives are stunted, and infant mortality is 40% higher than in the rest of the country. Deprivation and corruption have fuelled resentment, exploited by jihadists who spread conflict and instability. By providing US$22 per month to 60,000 women with young children, alongside nutritional education and advice, the programme aims to demonstrate how cash transfers can bring affordable and cost-effective food security and nutrition benefits to the region. The preferred targeting option is near-universal targeting (top quintile excluded) with women eligible when pregnant or with children aged under 2, and exiting when the youngest child reaches age 3. Payment is by mobile phone where possible, otherwise mobile banking.
The CBA identified the following main benefits (White, 2012):
the immediate consumption value of the transfers;
a ‘distributional dividend’ reflecting the higher marginal utility of cash for poorer than for better-off sections of the population, based on consumption distribution and benefit incidence;
a short-term welfare impact from reduced mortality and morbidity due to improved dietary adequacy and quality, increased health and nutrition awareness and better access to health services and medicines, and expressed in terms of DALYs;
short- to medium-term productivity gains for households and adults using transfers to make investments on own farms and in income-generating activities, or in seeking employment;
medium- to long-term productivity/earnings gains for children aged 2-15 as they join the labour force, due to improved nutrition, physical and cognitive development and education;
long-term, permanent gains in earning potential of the under-2 age cohort due to reduced stunting and improved cognitive development enabled by better maternal nutrition during pregnancy, better IYCF practices from birth to 2 years, and increased access to health services.
non-monetised benefits of financial inclusion, women’s empowerment and security through automatic cashless banking, own mobile phone accounts and electronic transfers.

Guidance on measuring and maximising VfM in social transfers Part 2: Explanatory text
49
76. Table 5 shows the results of the sensitivity analysis undertaken as part of the Nigeria Child Development Grant cost-benefit analysis. This tests the effect on net present value
Box 14: Local income multiplier effects of social transfers in Lesotho and Kenya
Under its DFID-funded From Protection to Promotion Project, which is part of the wider Transfer Project (see Box 10), the UN Food & Agriculture Organization is collaborating with UNICEF’s Eastern and Southern Africa Regional Office and six countries in the region to strengthen the evaluation of economic impacts of cash transfer programmes. Complementing experimental approaches comparing beneficiary households with control groups, methodological work includes the simulation of general equilibrium impacts on the local economy as a whole resulting from income multiplier effects as beneficiary households spend their cash in local markets. An important feature of this approach is that, using Monte Carlo methods, confidence intervals around simulation findings can be established to validate results.
The first two cases examined were the Lesotho Child Grants Programme (CGP) Pilot and the Kenya Cash Transfer for Orphans and Vulnerable Children (CT-OVC) Pilot Phase. In each case, household groups were established based on eligibility or otherwise for the transfer and whether in treatment or control villages, plus presence of an OVC in the Kenya case, and modelled with respect to their main economic activities, income sources, and the goods and services on which they spend their income. Data sources included programme-specific and other household survey data for each household group. For the Lesotho CGP, this was an ex ante simulation based on the 2011 baseline survey, which included both eligible and ineligible households. In Kenya, sources were the 2009 and 2011 iterations of the Kenya Health, Economic, Demographic and Social Survey of Families with OVC, and the 2004-2005 Kenya Integrated Household Budget Survey. In both countries an additional ad hoc business survey provided detailed information on location of business inputs. Evaluation survey design in both cases ensured that ‘control group contamination’ (income spillovers from treatment to control villages) could be ruled out as a significant source of bias.
Findings
In both cases, results reveal significant spillover effects of the transfers in local economies.
Productive impacts on local economies are mostly among ineligible rather than recipient households. Ineligible households do not benefit directly from the transfers, but tend to be better placed in terms of capital and labour to increase their production in response to higher local demand for goods and services.
Local supply response by both eligible and ineligible households is important for achieving significant real income gains from cash transfers, but is limited by capital, liquidity and labour constraints which exert upward pressure on local prices and reduce the income multiplier in real terms. Transfers loosen liquidity constraints for recipient households but not for others.
For Lesotho’s CGP, each loti transferred stimulates local nominal income gains of up to 2.23 loti. This multiplier is reduced to 1.36 in real terms but remains significantly above 1.00 under most assumptions about factor constraints.
For Kenya’s CT-OVC, local income multipliers significantly exceed 1.0 in nominal terms, even when capital and labour constraints limit the local supply response. In ‘Region 1’ (4 districts in Nyanza Province in the west) the overall nominal multiplier is 1.34, whereas in ‘Region 2’ (2 districts of Garissa and Kwale in the east) it is 1.84. In real terms, the multipliers remain significantly above 1.00 at 1.08 in Region 1 and 1.23 in Region 2, but when there are labour and liquidity constraints on the local supply response, real income multipliers are not significantly different from 1.0.
In both cases, new capital investment closes the gap between nominal and real income multipliers, suggesting that complementary initiatives to loosen capital constraints, including for non-recipient households, may be critical in order to reap significant real income multipliers from cash transfer programmes.
These simulations assume perfect targeting, but to the extent that transfers loosen production constraints in ineligible households, targeting inaccuracies may actually enhance productive impacts while diminishing social ones.
Sources: Taylor et al. (2012; 2013)
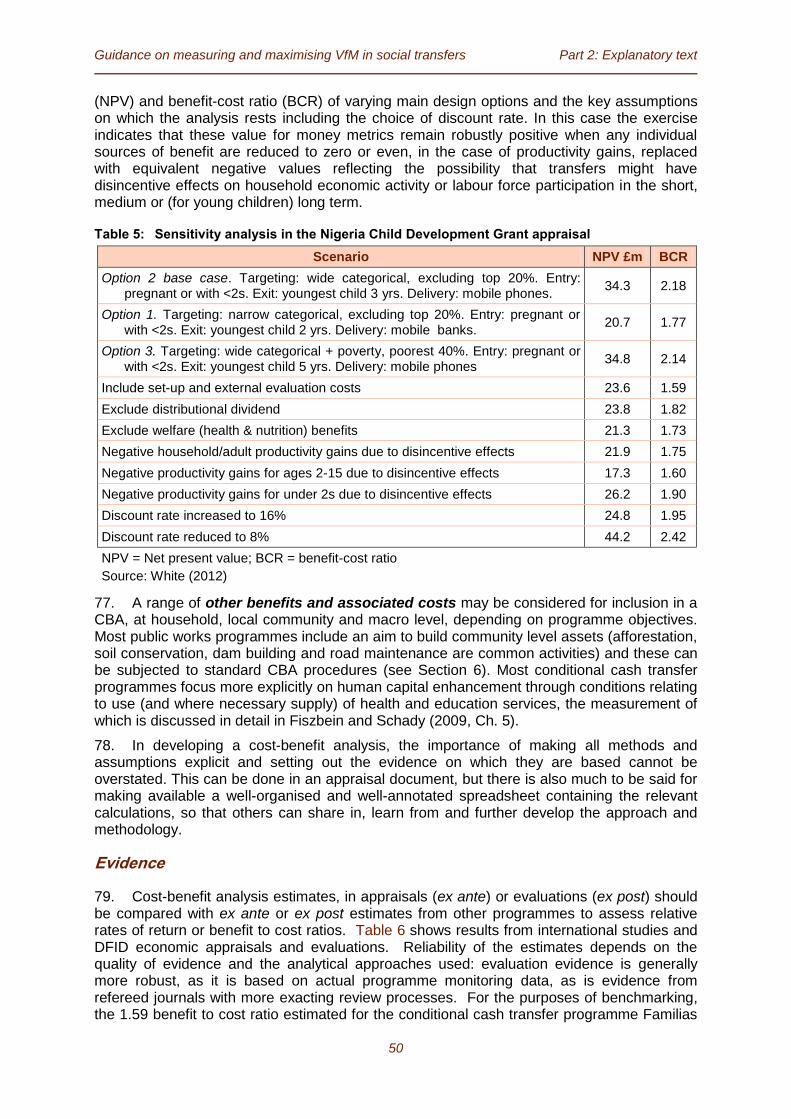
Guidance on measuring and maximising VfM in social transfers Part 2: Explanatory text
50
(NPV) and benefit-cost ratio (BCR) of varying main design options and the key assumptions on which the analysis rests including the choice of discount rate. In this case the exercise indicates that these value for money metrics remain robustly positive when any individual sources of benefit are reduced to zero or even, in the case of productivity gains, replaced with equivalent negative values reflecting the possibility that transfers might have disincentive effects on household economic activity or labour force participation in the short, medium or (for young children) long term.
Table 5: Sensitivity analysis in the Nigeria Child Development Grant appraisal
Scenario NPV £m BCR
Option 2 base case. Targeting: wide categorical, excluding top 20%. Entry: pregnant or with <2s. Exit: youngest child 3 yrs. Delivery: mobile phones.
34.3 2.18
Option 1. Targeting: narrow categorical, excluding top 20%. Entry: pregnant or with <2s. Exit: youngest child 2 yrs. Delivery: mobile banks.
20.7 1.77
Option 3. Targeting: wide categorical + poverty, poorest 40%. Entry: pregnant or with <2s. Exit: youngest child 5 yrs. Delivery: mobile phones
34.8 2.14
Include set-up and external evaluation costs 23.6 1.59
Exclude distributional dividend 23.8 1.82
Exclude welfare (health & nutrition) benefits 21.3 1.73
Negative household/adult productivity gains due to disincentive effects 21.9 1.75
Negative productivity gains for ages 2-15 due to disincentive effects 17.3 1.60
Negative productivity gains for under 2s due to disincentive effects 26.2 1.90
Discount rate increased to 16% 24.8 1.95
Discount rate reduced to 8% 44.2 2.42
NPV = Net present value; BCR = benefit-cost ratio
Source: White (2012)
77. A range of other benefits and associated costs may be considered for inclusion in a CBA, at household, local community and macro level, depending on programme objectives. Most public works programmes include an aim to build community level assets (afforestation, soil conservation, dam building and road maintenance are common activities) and these can be subjected to standard CBA procedures (see Section 6). Most conditional cash transfer programmes focus more explicitly on human capital enhancement through conditions relating to use (and where necessary supply) of health and education services, the measurement of which is discussed in detail in Fiszbein and Schady (2009, Ch. 5).
78. In developing a cost-benefit analysis, the importance of making all methods and assumptions explicit and setting out the evidence on which they are based cannot be overstated. This can be done in an appraisal document, but there is also much to be said for making available a well-organised and well-annotated spreadsheet containing the relevant calculations, so that others can share in, learn from and further develop the approach and methodology.
Evidence
79. Cost-benefit analysis estimates, in appraisals (ex ante) or evaluations (ex post) should be compared with ex ante or ex post estimates from other programmes to assess relative rates of return or benefit to cost ratios. Table 6 shows results from international studies and DFID economic appraisals and evaluations. Reliability of the estimates depends on the quality of evidence and the analytical approaches used: evaluation evidence is generally more robust, as it is based on actual programme monitoring data, as is evidence from refereed journals with more exacting review processes. For the purposes of benchmarking, the 1.59 benefit to cost ratio estimated for the conditional cash transfer programme Familias
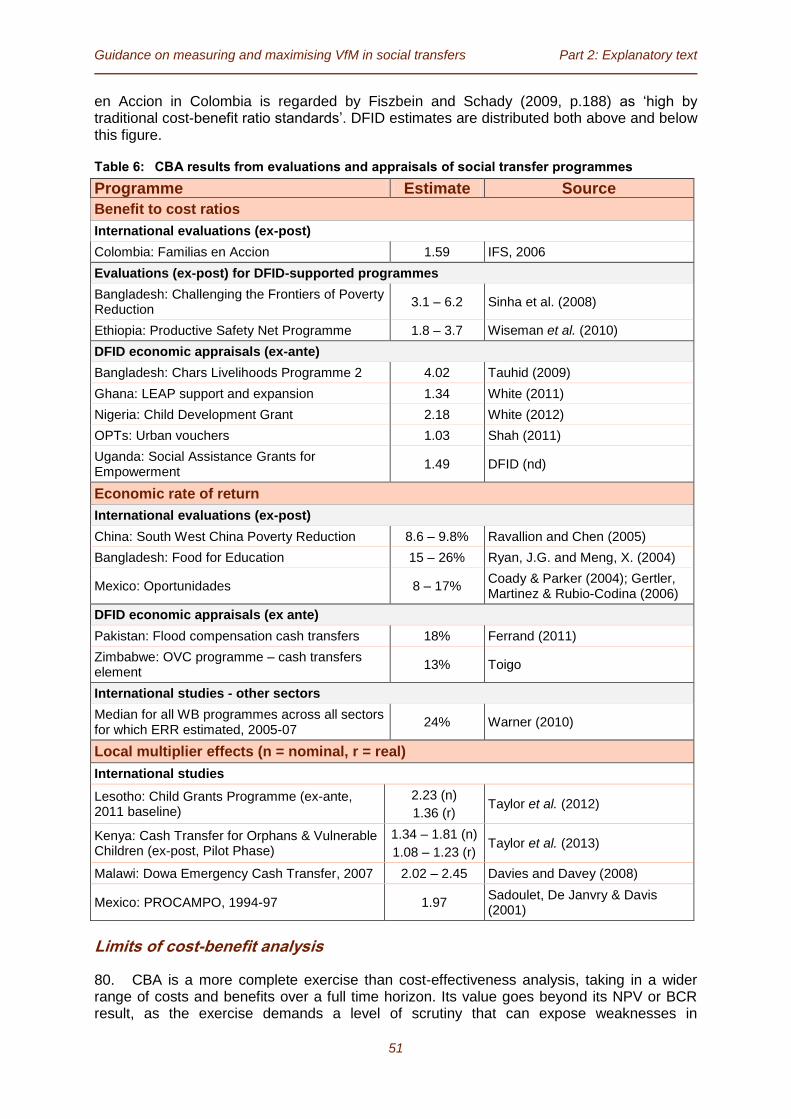
Guidance on measuring and maximising VfM in social transfers Part 2: Explanatory text
51
en Accion in Colombia is regarded by Fiszbein and Schady (2009, p.188) as ‘high by traditional cost-benefit ratio standards’. DFID estimates are distributed both above and below this figure.
Table 6: CBA results from evaluations and appraisals of social transfer programmes
Programme Estimate Source
Benefit to cost ratios
International evaluations (ex-post)
Colombia: Familias en Accion 1.59 IFS, 2006
Evaluations (ex-post) for DFID-supported programmes
Bangladesh: Challenging the Frontiers of Poverty Reduction
3.1 – 6.2 Sinha et al. (2008)
Ethiopia: Productive Safety Net Programme 1.8 – 3.7 Wiseman et al. (2010)
DFID economic appraisals (ex-ante)
Bangladesh: Chars Livelihoods Programme 2 4.02 Tauhid (2009)
Ghana: LEAP support and expansion 1.34 White (2011)
Nigeria: Child Development Grant 2.18 White (2012)
OPTs: Urban vouchers 1.03 Shah (2011)
Uganda: Social Assistance Grants for Empowerment
1.49 DFID (nd)
Economic rate of return
International evaluations (ex-post)
China: South West China Poverty Reduction 8.6 – 9.8% Ravallion and Chen (2005)
Bangladesh: Food for Education 15 – 26% Ryan, J.G. and Meng, X. (2004)
Mexico: Oportunidades 8 – 17% Coady & Parker (2004); Gertler, Martinez & Rubio-Codina (2006)
DFID economic appraisals (ex ante)
Pakistan: Flood compensation cash transfers 18% Ferrand (2011)
Zimbabwe: OVC programme – cash transfers element
13% Toigo
International studies - other sectors
Median for all WB programmes across all sectors for which ERR estimated, 2005-07
24% Warner (2010)
Local multiplier effects (n = nominal, r = real)
International studies
Lesotho: Child Grants Programme (ex-ante, 2011 baseline)
2.23 (n)
1.36 (r) Taylor et al. (2012)
Kenya: Cash Transfer for Orphans & Vulnerable Children (ex-post, Pilot Phase)
1.34 – 1.81 (n)
1.08 – 1.23 (r) Taylor et al. (2013)
Malawi: Dowa Emergency Cash Transfer, 2007 2.02 – 2.45 Davies and Davey (2008)
Mexico: PROCAMPO, 1994-97 1.97 Sadoulet, De Janvry & Davis (2001)
Limits of cost-benefit analysis
80. CBA is a more complete exercise than cost-effectiveness analysis, taking in a wider range of costs and benefits over a full time horizon. Its value goes beyond its NPV or BCR result, as the exercise demands a level of scrutiny that can expose weaknesses in

Guidance on measuring and maximising VfM in social transfers Part 2: Explanatory text
52
programme design or sustainability that might otherwise be overlooked. However, the approach has some significant limitations:
The simulations and projections underpinning CBA can be very time-consuming and resource intensive. Consideration should be given to whether the size of the investment, the amenability of main costs and benefits to quantitative analysis and the data and time available for the analysis make CBA worth undertaking.
Due to inevitable data limitations, CBA relies heavily on a significant number of assumptions. This is acceptable as long as the basis for such assumptions is fully explained and rigorously substantiated using evidence from national and international experience. Even so, questions arise as to how credible such assumptions are, especially when they are drawn from evidence in other countries with possibly quite different contexts and conditions. In their appraisal document for Ethiopia’s PSNP, the World Bank argued that ‘calculating a single economic rate of return for the Program is not appropriate for this type of safety net operation’, due to methodological limitations in imputing economic value for all of the PSNP transfer benefits, as well as difficulties in calculating the economic benefits of some types of public works projects. The short timeframe of available data made it impossible to capture the reduction in the long-term transmission of poverty or long-term increases in human capital. (World Bank, 2009b) It is the discounted flow of such long-term (i.e. over 10 to 30 years) benefits that is needed for CBA.
In the absence of credible evidence, there is a risk of falling into the common trap of arbitrarily varying assumptions until the analysis produces a net present value or benefit-cost ratio that justifies the investment!
81. For these reasons, a well-conducted cost-effectiveness analysis is always to be preferred to a poorly substantiated CBA. Where CBA is undertaken, it is important to test the sensitivity of findings to varying key assumptions, and comment realistically on the likelihood of such variations being borne out in practice. The value of a good CBA goes beyond its NPV or BCR result, as the exercise demands a level of scrutiny that can expose weaknesses in programme design or sustainability that might otherwise be overlooked.
3. Critical cost-effectiveness drivers
82. In this section we look more closely at specific features of social transfer programmes that affect their cost and performance and thus their VfM. One of these is the targeting of beneficiaries, in which there is a trade-off between cost and targeting accuracy, raising the question of what is the optimal targeting solution. A second major issue concerns conditionality. Here an important question is: Do the benefits of conditionality, if any, justify the cost of implementing it? A third series of issues focuses on the implementation systems of social transfer programmes, including management information systems (MIS), and their VfM implications. What VfM gains can be achieved by adopting modern technologies for registration, enrolment and payment of beneficiaries? Essential and desirable metrics for critical cost drivers are summarised on page 16 of the toolkit.
3.1 Form, level, duration and periodicity of transfers
Form of transfer
83. Form of transfer (cash, food, farm inputs, livelihood assets, vouchers etc.) influences VfM in a number of ways. Cash, in physical or electronic form, has risen to prominence in the last 15 years or so due to its multiple advantages over food and other forms of social transfer. In most situations cash is the most cost-efficient and cost-effective form of transfer,

Guidance on measuring and maximising VfM in social transfers Part 2: Explanatory text
53
due to its lower delivery costs and potential for reducing fiduciary risk (especially where transmitted electronically), flexibility of use by recipients including for the purchase of a variety of foods to achieve greater dietary diversity, ability to stimulate rather than undercut local markets (food markets in particular) and generate multiplier effects, and its scope for encouraging financial inclusion and financial services.
84. There are some circumstances in which other forms of transfer offer better VfM. Where food prices are sharply rising, the value of cash transfers in food terms falls. Where cash transfers are indexed to food prices and are on a large enough scale in relation to local food supply, they may in principle bring about further food price inflation. Thus in isolated, food deficit markets food transfers can be more effective in preventing a catastrophic collapse in food security in the short term, when they may also be more cost-efficient despite their higher logistical costs. This will be signalled by total cost-transfer ratios, where the transfer is valued in local market terms, being lower for food than for cash, as illustrated in Table 3 above. Food transfers may also have positive gender impacts, being more likely than cash to be controlled by women in recipient households. Vouchers, denominated in quantity or value terms, provide a means of limiting use of transfers to particular commodities (often food or farm inputs/assets) which are in line with specific programme objectives, in terms of which they may prove more cost-effective than cash. Thus Malawi’s agricultural input subsidy programme, transferred to targeted smallholders as vouchers that can be part-exchanged for a prescribed input package, has resulted in impressive gains in national food self-sufficiency with marked political dividends for the government, despite its high cost, vulnerability to global fertiliser price volatility, risk of failure when drought strikes, and tendency for the poorest recipients to sell their vouchers cheaply to meet cash needs. Nevertheless, social protection objectives are most often better served by cash transfers than other forms, with better VfM.
Level, duration and periodicity of transfer
85. Level or generosity is a basic design feature of a social transfer which has important VfM dimensions. Choice of level varies widely between programmes and usually represents a balance between diverse and often conflicting considerations including programme objectives, affordability, incidence and depth of poverty relative to basic needs and food poverty lines, average or target group household consumption levels, official minimum wage and actual casual wage rates, and political calculations. Level of transfer per time period may be a flat rate per recipient, or vary according to number of household members of specified ages, or by gender, region, target group or time of year. As noted above, transfer levels need to be revised periodically to account for increases in living and food costs. Increases may be pledged by competing political parties to boost support in the lead-up to elections, as occurred with Lesotho’s Old Age Pension in 2007.
86. Section 2.1 showed that low levels of transfer inevitably mean low cost-efficiency, since administrative costs then comprise a higher proportion of total costs. This is likely to impair cost-effectiveness, since it will raise the cost of achieving desired outcomes. In addition, low transfer levels are unlikely to have the transformative outcomes for poor and vulnerable households that might be envisaged in national social protection policies, since their impact on livelihood resilience and capacity to invest in productive activities will be marginal at best. Confronted with widespread poverty but tight budgets, many government programmes are so thinly spread that they are neither cost-efficient nor cost-effective. In 2007, Mozambique’s Food Subsidy Programme provided between US$2.70 and US$5.40 per month depending on the number of dependent household members, equivalent on average to just 5 percent of the minimum wage (Table 2). At the start of Ghana’s LEAP programme in 2008, the transfer level was set at 15–30 percent of minimum wage (then US$6–11 per month), again depending on number of dependents, but this remained unchanged by 2011 despite a 44 percent increase in the consumer price index over this period (White, 2011). In northern Ethiopia, cash transfers provided by the PSNP lost almost 75 percent of their value in maize

Guidance on measuring and maximising VfM in social transfers Part 2: Explanatory text
54
terms between July 2007 and July 2008, due to failure to adjust transfer levels to keep up with rapid food price inflation. Despite subsequent adjustments, by 2011 average PSNP transfers per household were equivalent to under US10 monthly or just 10 percent of the poverty line (Box 12).
87. An alternative model, outlined in Section 3.2 below, is one that attempts to concentrate transfers on the poorest of the poor in the poorest districts, using proxy means tests combined with community targeting, often alongside conditions related to uptake of health and education services and/or participation in public works. Such schemes may permit a more adequate level of transfer, but tend to suffer from high targeting costs, significant targeting errors and limited coverage of the poor. Moreover, where poverty is widespread, those fortunate enough to be enrolled are likely to end up much better off than others in the community who are excluded, with socially divisive effects which are sometimes mitigated only by sharing transfers across the community. Many public works programmes attempt to simplify targeting by setting wage rates at below-market levels so that only the poorest will apply, but high poverty rates often mean that they are over-subscribed and have to ration places by other means. Lowering the wage rate to avoid this problem may serve only to force down cost-efficiency further still.
88. Lesotho’s Old Age Pension, in contrast, started at US$24 per month in 2002, or around 100 percent of the poverty line, and was increased regularly thereafter to reach US$43 in early 2012. This was sufficient to transform the food security status not only for the over-70s who qualify for the pension, but also benefit other household members including children, many orphaned by AIDS, who reside in over 60 percent of pensioners’ households and thereby have access to funds for school uniforms, books and stationery (Croome et al., 2007). South Africa’s system of unconditional social grants is more generous still: the Child Support Grant (CSG) provided about a dollar a day in 2010, while the disability grant and social pension were each roughly equivalent to the household poverty line (Samson et al., 2010, p.8). These grants have had very substantial positive impacts on the quarter of all South Africans who receive them and their families. The CSG has increased height-for-age among recipient children, will potentially more than double their lifetime earnings, and has reduced the probability that a school-age child is not attending school by more than half, all of which provides a strongly positive return on CSG investment (Aguero et al., 2006). The social pension also improves school enrolment, especially among girls in recipient households. Grant recipient households spend more of their income on food and education and less on alcohol, tobacco and gambling, and the grants have together reduced South Africa’s poverty gap by 47 percent (Samson et al., 2010, p.9).
89. Duration and periodicity of social transfers can also have VfM implications. Since cost-efficiency and cost-effectiveness improve as a programme matures, partly due to increasing administrative efficiency but also because regularity and predictability are prerequisites for sustainable impacts, those with limited duration are unlikely to provide good value for money except in terms of providing lessons for wider implementation. Public works programmes (PWPs) designed as safety nets tend to be limited duration (four months or less) one-off events for target communities, so are unlikely to respond to chronic poverty and vulnerability. Some PWPs, such as Ethiopia’s PSNP or India’s MGNREGS, are exceptional in providing seasonal employment on an ongoing, regular annual basis, and provide better VfM. The positive impacts of ‘life-cycle’ programmes such as child, disability and old age grants are partly attributable to their longevity and predictability.
90. Periodicity is also important because it affects the use to which transfers are put. Many social transfer programmes deliver payments monthly, so that households can use them to meet immediate consumption needs, especially for basic foods. It is usually cheaper to deliver payments every two months, as occurs on Ghana’s LEAP programme, but this poses problems for very poor households which struggle to survive from one payment to the next. LEAP’s actual performance in its early years failed even to maintain this two-monthly schedule, since cash release delays meant gaps of up to six months between payments.

Guidance on measuring and maximising VfM in social transfers Part 2: Explanatory text
55
When the cash did arrive, often unpredictably, it tended to be used to pay off debts or invest in small enterprises instead of buying food.
3.2 Targeting
91. Cost-effectiveness of targeting options should be analysed, to the extent that there are genuine choices to be made – some options may be excluded for political or technical reasons. When assessing the cost-effectiveness of transfer programmes, it is crucial to know the extent to which programmes are reaching their intended beneficiaries. The higher the inclusion error (the proportion of actual beneficiaries who are not intended beneficiaries), the more ‘leakage’ of resources reduces cost-effectiveness. Exclusion errors (the non-participation in the programme of some intended beneficiaries) reduce effectiveness and should be of particular concern to programme managers, even though in this case costs may be reduced proportionately. There are a range of alternative possible measures by which to assess the accuracy of targeting mechanisms: the most suitable measure will depend on programme goals, eligibility criteria, and available data.
92. It is not proposed here to review in detail the menu of targeting options, which goes beyond the scope of this note. In-depth guidance and evidence on targeting can be found in Samson et al. (2010) and Coady et al. (2004), the latter analysing the targeting performance of 122 anti-poverty programmes in 48 countries. Box 15 highlights key points about the relative advantages and disadvantages of the different targeting methods used in low income and lower-middle income countries, in terms of their targeting performance and costs.
93. An initial requirement is to be clear about who the intended beneficiaries are. There is a general presumption that governments and donors are ultimately interested in directing transfers to the poor. On this basis, universal categorical targeting (e.g. age-based transfers for children under two years, or the elderly over 65 years) is often judged to be less cost-effective than poverty targeted transfers, as might be inferred for example from Figure 6 above. The case for selecting such programmes would then rest on, for example, whether these groups have higher-than-average poverty incidence, or whether attempts to target poverty more directly (e.g. through geographical, community-based or proxy means test targeting) entail prohibitively higher administrative costs and/or inclusion/exclusion errors.
94. However, experience tells us that, barring a universal grant to all citizens which no country has yet found to be politically and financially feasible, it is impossible to reach all of the poor with a single programme. Poverty targeting is subject to high errors and typically low coverage, while categorical targeting excludes all the poor who fall outside that category. For many social transfers poverty is not the criterion for selection, or may be one criterion amongst many. If, for example, child nutrition or girl enrolment indicators are bad amongst richer quintiles as well as poorer quintiles, then a conditional cash transfer may be intended primarily to address nutrition or gender equality, and the target population is all children or all girls of school age, not only those who are poor. Cash transfers are increasingly considered an appropriate response during or after emergencies, targeted for immediate humanitarian need rather than poverty status. In some circumstances, more universal categorical benefits may be advocated on the grounds that these are thought to be more effective than narrowly targeted transfers in building a sense of citizenship and strengthening state legitimacy and state-society relations (particularly important in fragile or post-conflict settings).
95. There is also an important political economy perspective to incorporate into the analysis, whereby targeting approaches are judged against their ability to generate broad support for social protection. Thus it may be easier to ensure an adequate coalition in favour of support for the elderly or for children, for example, than for poverty-targeted transfers, especially when programmes are seen as stages in the development of a broader social protection system that will be able to cover the poor within a more realistic timeline of, say, 30-40 years. These attributes are difficult to prove or measure and thus hard to capture in VfM calculations, but should be noted in the narrative to a comprehensive VfM analysis.

Guidance on measuring and maximising VfM in social transfers Part 2: Explanatory text
56
Box 15: Relative costs and performance of alternative targeting methods
The different targeting methods employed in developing countries each have their advantages and disadvantages in terms of targeting performance, which affects programme efficiency and effectiveness, and their costs. Several of these methods may be combined, potentially increasing targeting accuracy, but increasing the weight of targeting in overall administrative costs.
Geographical targeting directs transfer programmes to areas (provinces, districts, communes) of greatest
need. Where targeting for poverty, poor areas may be identified in various ways. The ideal is probably small area estimation (SAE), combining census and survey data to produce a map of poverty headcounts. In other cases, target areas may be selected on a more loosely-derived consensus on living standards, poor human development outcomes, or social problems. Geographical targeting is relatively cheap, but may require new household surveys to complement national survey data, which usually do not provide statistical significance below regional or provincial levels. When used alone, which is rare, geographical targeting will lead to inclusion errors (as all households in that area, including the non-needy, will be eligible) and exclusion errors (omitting the needy who live outside the target areas). Where needs are spatially concentrated, for example following disasters, these errors can be minor. In the case of poverty, however, needs may be very high in peripheral, sparsely populated areas: but with the majority of the poor living in densely populated areas with low headcounts. In this case, geographical targeting will work less well. Targeting accuracy will improve with (reliable) fine-grain estimates that allow the identification of a poor district within a wealthy province: however, (i) the statistical reliability of SAE poverty estimates declines at very small scales and (ii) such granularity is only ever possible when both survey and census data are both recent and high quality.
Categorical targeting based on simple identifiable criteria is relatively low-cost, especially for age-based categories when it can be implemented on an on-demand basis through the presentation of widely-held documents that prove age (e.g. identity cards, birth certificates or electoral cards). This is one reason why social pensions in southern Africa are relatively cost-efficient. Initial costs (both private and administrative) can be higher, however, if documents are not widely held and have to be obtained and paid for, or if additional requirements are imposed (for example medical certificates to prove disability or chronic illness, as in Mozambique’s PSA), or if census-type methods are needed, e.g. to identify households with high dependency ratios (see Cosgrove et al., 2011, on the Kenyan HSNP). On the effectiveness side, the main issue is the degree of correlation of the eligibility categories with need. Reaching the poorest using categorical targeting alone can involve high inclusion and exclusion error. On the other hand, categorically targeted programmes often have objectives beyond narrow poverty targeting, tend to spread benefits beyond direct recipients, and score highly in terms of social/political acceptability, social inclusion, predictability and the entrenchment of rights.
Community-based targeting (CBT) allows community structures to help decide on eligibility criteria and select those they believe meet them. CBT forms part of the targeting methodology in many programmes in Africa, such as the HSNP and CT-OVC in Kenya, LEAP in Ghana, and the social cash transfer programmes in Malawi and Zambia. It can be more difficult to apply in urban areas, particularly in contexts of rapid urbanisation and growth of urban poverty. While small well-knit communities can often identify the destitute, broader targeting of the poor through CBT is more difficult because of the shallow difference in wellbeing among the majority of households in communities in most low-income countries and the widespread perception that ‘we are all poor here’ (Ellis, 2008). There are also concerns about the evident tendency for élite capture or manipulation, high costs of supervision and costs to community members who participate in community assemblies, committee meetings and visits to households (see Cosgrove et al., 2011, on Kenya’s HSNP and Watkins, 2008, on the social cash transfer pilots in Zambia).
Proxy means tests (PMTs) are used in poverty targeting as an alternative to income means tests, which are impractical in developing countries where evidence to prove income is most often lacking. Based on a weighted formula of easily verifiable proxy indicators for poverty derived from regression analysis of household survey data, PMTs ‘predict’ poverty and thus eligibility. However, these are inevitably somewhat blunt instruments, particularly in poor countries where differences in income, assets and other household characteristics are very small, making it difficult to identify which households are above or below an eligibility cut-off point. As a result, inclusion and exclusion errors can be quite high (see Kidd and Wylde 2011 for a critical perspective). On the cost side, PMTs are quite ‘heavy’ on data collection and processing requirements to determine eligibility.
Self-selection uses specific programme characteristics (e.g. a requirement to provide manual labour at low wage rates) to attract only the most needy. It is used as a cost-free method of targeting public works programmes, but is rarely successful by itself in preventing inclusion errors and so usually has to be accompanied by other targeting methods (see Section 6).

Guidance on measuring and maximising VfM in social transfers Part 2: Explanatory text
57
96. In the case of categorical targeting, targeting performance may need to work on two tracks. A primary set of targeting performance metrics will measure exclusion and inclusion errors against the eligibility criteria (i.e. are there three year-olds who are receiving a grant intended for those up to age two – an inclusion error; or people over 65 years who are not receiving the pension to which they are entitled – an exclusion error?). A secondary angle on targeting performance might then be to track how many of the eligible recipients (pensioners, children under two, etc.) are poor, and (more importantly) what proportion of the total number of poor do not benefit from the categorical transfers. This will help in decisions about the design of complementary programmes which reach other sections of the poor.
97. No targeting mechanism is perfect. Relatively simple age-based categorical benefits will tend to perform well against their own eligibility criteria (although even these rarely achieve full coverage, either because the rich choose not to take up their small entitlement, and/or because the poor do not know about their entitlement, or face logistical barriers to claiming it). Achieving good targeting performance against the more complex conceptual category of poverty is considerably harder. For a programme designed to reach the poor, the optimal balance between exclusion and inclusion errors is likely to depend heavily on contextual factors. These include the depth and breadth of poverty; resources available for the transfer programme; national administrative capacities; and social and political values and forces. In broad terms:
Narrow poverty targeting can reduce the proportion of benefits channelled to the non-poor (lowering ‘leakage’ or inclusion error) – but at the price that a higher proportion of the poor do not receive the transfer (raising exclusion error). In this case, cost-effectiveness can appear quite high (most or all of the transfer spend will be going to poor people, and helping to reduce poverty), unless it is balanced against the corresponding level of undercoverage and unmet need (exclusion) by taking into account overall effects on poverty (see paragraph 55).
Conversely, it is possible to reach a higher proportion of the poor through universal (non-targeted) transfers or broad, inclusive targeting (setting coverage well above the poverty headcount): but at the price that i) a significant share of public finance will go to non-poor households and (ii) for a fixed budget, the transfer level will be correspondingly smaller.8 Cost-effectiveness measures may be lower (because the programme has to deliver many small payments, with more limited impact on the beneficiaries, rather than a small number of larger payments with greater impact); or higher (if the administrative costs associated with non-targeted or broadly targeted delivery are significantly lower than those involved in administering a complex system of narrow targeting).
98. Poverty targeting using a combination of proxy means tests and community-based targeting is least problematic when the distribution of the welfare measure (e.g. per capita consumption or per capita income) in the population is relatively steep close to the poverty line, so that identification of the poor is relatively simple and uncontroversial, and when available resources are enough to provide transfers to all those who are poor. More commonly in low-income countries, however, consumption distribution for the bottom few deciles is flat and clustered around the poverty line, making targeting less accurate and (as mentioned in paragraphs 13 to 15 above) less socially acceptable, and resources are rationed to the extent that only a small proportion of those considered poor can be covered. These problems are compounded by the dynamics of poverty, whereby poor households move up and down the distribution according to their idiosyncratic circumstances, the large errors to which both proxy means tests and community-based targeting are subject, the high
8 In reality, a budget would only be ‘fixed’ if completely dependent on donor funding; for a
government financed programme, assumption of a fixed budget is, according to Pritchett (2005), ‘naïve’ in the sense that it ignores political economy determinants of programme design, from which the budget follows.

Guidance on measuring and maximising VfM in social transfers Part 2: Explanatory text
58
demands these methods place on administrative capacity, and the high costs thus incurred at the expense of benefits. Box 16 provides illustrative examples of how targeting performance can depend on the fit between targeting method and context.
99. In summary, targeting is designed to increase programme performance by ensuring that scarce resources are directed to those most in need, thus improving cost-effectiveness unless of course the additional targeting costs outweigh these benefits. Samson et al. (2010) note that the costs of improving targeting increase sharply as efforts are made to achieve ever greater targeting accuracy, and provide a ‘targeting test’ with general principles for judging when targeting is more or less costly than universal provision (ibid. Box 8.2). Targeting accounts for quite a high proportion of total administrative costs, ranging from 26% to 88%, in a sample of programmes for which data are provided by Grosh et al. (2008). As a percentage of total programme costs, targeting cost between 0.6% and 6.3% in this sample of programmes, though the proportion is arguably substantially higher in many low-income countries.
100. These costs are often bunched in periods of programme roll-out (see Box 8). This is the case when targeting takes place on a once-off basis and through subsequent re-targeting exercises, using community-based targeting and survey-type data collection exercises (e.g. for a proxy means test). In Mexico, targeting accounted for 34% of administrative costs over the first four years of the programme (1997-2000), but declined from 61% in the first year to 3% in the fourth year (Caldés et al, 2004). In the Kenyan CT-OVC programme, the share of targeting in administrative costs fell from 22% in the first year (2006/07) to 10% in the second year and 0% in the third year when there was no further roll-out (OPM, 2010). In the case of on-demand social assistance programmes, such as universal social pensions and child allowances, targeting is a continuous process but much lighter and cheaper.
101. For community-based targeting, proxy means tests and other methods requiring periodic targeting processes, a further issue is the frequency of re-targeting. Retargeting is designed to ensure that targeting accuracy is maintained as target group circumstances
Box 16: Poverty targeting methods and poverty context
Poverty targeting through community-based targeting combined with proxy means testing might work relatively well if (i) it can be done effectively, without bias towards élites, and within available administrative capacity, (ii) the bottom 20 percent of the population has living standards (as measured by levels of per capita consumption or income) which are markedly below those of the remaining 80 percent, with a sharp step between these two parts of the population and (ii) available finances are sufficient to provide the bottom 20-25 percent of the population with transfers that are big enough to make a difference to the recipients.
By contrast, if, as is common in low-income countries, administrative capacity is weak, differences in living standards amongst the bottom 80% of the population are very small (everyone in this range is almost equally poor), but available resources are limited, programme designers – or communities – face a difficult choice.
They can ration transfers to just 10 or 20 percent of the population, to ensure that transfer size remains big enough to have an effect on the recipients. However, given the small differences within the bottom 80 percent, it is likely that the minor differences in estimated living standards generated by proxy means tests reflect measurement or model errors as much as actual differences; and communities will be forced to choose 10 or 20 households from 80 that are all similarly needy. The selection of recipients thus becomes largely random or manipulated by élites; and for those who are lucky enough to be chosen, the transfer will be sufficient to ‘leapfrog’ them up into the third or fourth quintile, raising serious questions about fairness (Ellis, 2008).
The alternative is to spread the available budget across the entire 80 percent of the population that is considered poor (or, simply, to make it universal). This is equitable and likely to command broader support, but then a bigger budget is required to provide a transfer large enough to make a difference to recipients. Distributing very small sums to many people is unlikely to be cost-efficient because the volume of transfers will be low relative to administrative costs.
Guidance on measuring and maximising VfM in social transfers Part 2: Explanatory text
59
change, but it requires similar resources to be re-invested as in the initial targeting. This might be every three or five years or sometimes more frequently (once a year in the case of the Vision 2020 Umurenge Programme in Rwanda). This stage has not yet been reached, however, in most of the new social transfer programmes in sub-Saharan Africa, so the implications have not yet become clear. But DFID was criticised by the UK National Audit Office for at times supporting the wider roll-out of programmes without simultaneously re-targeting the population in the original programme area (see Box 1).
102. Finally, targeting costs can in principle be reduced by establishing a single registry or common targeting mechanism, making it possible to share targeting costs across a range of social programmes. This has been done in several middle income countries, especially in Latin America, but not yet in most low-income countries. Ghana is one sub-Saharan African country that is currently proposing to establish a common targeting mechanism that could be used for the LEAP cash transfer programme, the free enrolment of ‘indigents’ in the National Health Insurance Scheme, the distribution of free school uniforms and exercise books, and other programmes (MESW, 2011). To date there is little evidence of the successful application of this approach. One danger is that the mechanism’s specific targeting method and its inevitable error will be replicated across the whole range of programmes to which it is applied. An alternative approach, embodied in the UN’s concept of a “social protection floor”, is to focus on the collective performance of a social protection system in minimising exclusion of the most needy sections of the population, by combining, for example, a child grant, a social pension, and some form of targeted transfer to the working age poor
3.3 Conditionality
103. The costs and benefits (if any are evident) of using conditionality should be analysed, to the extent that there is a genuine choice on whether or not to incorporate conditions – they may be ruled out because of capacity constraints or for other reasons (or, conversely, required by a government or taxpayers who feel that public transfers should be made conditional on actions by the recipients). The implementation of conditionality mechanisms is another important cost component of some social transfer programmes, this time at the operational stage, i.e. as an ongoing recurrent cost. Samson et al (2010) have noted the high costs of conditionality, both for programme administration and for beneficiaries. Administrative costs are incurred in monitoring the compliance of CCT beneficiaries with conditions, such as school attendance by children, making the requisite number of visits to health centres for growth monitoring of children, and attending compulsory educational sessions on nutrition and health practices.
104. For example, conditionality accounted for 18% of the administrative costs of Mexico’s PROGRESA in its first four years, rising to 24% by the fourth year when initial fixed costs had greatly diminished (Caldés et al, 2004). This suggests that conditionality adds about one quarter to the long-term recurrent administrative costs of a ‘mature’ CCT.
105. It should be noted that administrative costs are not only incurred in terms of programme staff time. They also usually require substantial time inputs of teachers and health workers, potentially taking them away from other (possibly more useful) core activities – teaching and consulting patients. These costs incurred by schools and the health system are often not captured in the data on administrative programme costs.
106. Even less likely to be computed is the opportunity cost borne by households for complying with the conditions, which could for example include attending meetings that they would not otherwise see any benefit in attending. Moreover there are increasing concerns that conditionality around school attendance subjects school children to a high level of stress and may actually reduce attendance and achievement.
107. If these direct administrative and private opportunity costs are to be justified, they have to be outweighed by the additional benefits in terms of programme outcomes and impact.

Guidance on measuring and maximising VfM in social transfers Part 2: Explanatory text
60
Specifically, these benefits (with respect to these programmes’ human development objectives) would need to be additional to the benefits arising from the income effect alone. However, there is extremely little evidence worldwide on the contribution of conditionality, relative to the income effect, on the human development results of CCTs. In one analysis of Progresa, Handa et al. (2008) found no evidence of a substitution effect on household expenditure arising from the conditionality, suggesting that improved human development outcomes were due only to the income effect, and concluded that more evidence on the benefit of conditionality was needed ‘before confidently recommending their inclusion in cash transfer programmes where budgets are tight, capacity to enforce conditionality is low and the time cost of compliance is significant’. Another study of Progresa found that conditionality did appear to have some effect on enrolment - but only for one particular year of the school system (de Brauw and Hoddinot, 2008). A recent research impact evaluation in Malawi (Baird et al., 2011) found that conditionality enhanced some outcomes (girls’ enrolment), but reduced others (teenage pregnancy and marriage rates, with implications for sexual and reproductive health and girls’ opportunities).
108. The Cash Transfer for Orphans and Vulnerable Children programme in Kenya was intended to test empirically whether conditionality ‘works’, by comparing performance between some districts where conditionality was monitored and enforced and others where conditions were ‘soft’. The results of the impact evaluation (OPM, 2010) did not provide any evidence for an impact on education or health indicators from imposing conditions with penalties but noted that these findings could only be considered indicative at best, as conditionality was not being implemented effectively, especially in the health sector, in the enforcement districts. As a result, the costs of implementing conditionality were also almost insignificant (0.1% in year 3), although this appears also to reflect the fact that monitoring of conditionality was often not accounted for separately by programme staff.
109. A list of metrics for conditionality is provided under Critical cost-effectiveness drivers on page 16 of the toolkit. See also Fiszbein and Schady (2008, pp. 86-91).
3.4 Implementation systems
110. Implementation systems – the “nuts and bolts” of social transfers administration covering registration and enrolment systems, payment mechanisms, management information system and arrangements for managing appeals/grievances and fiduciary risk – impact directly on efficiency and effectiveness and need to be considered throughout the cycle of appraisal, design, implementation and M&E.
111. With many social transfer programmes still depending wholly or partly on manual systems for registering beneficiaries and delivering payment, there is significant scope for introduction of improved ICT-based systems that can drive down costs while enhancing speed, accuracy and security in these operations, thus helping to raise VfM standards. Well designed implementation systems can also bring wider benefits of financial services and financial inclusion to both recipients and non-recipients. Some VfM highlights related to implementation systems are sketched below. For a more detailed description of different systems and their pros and cons, see Samson et al. (2010), Chs. 12-14.
Registration
112. Registration involves the identification of potential members of the programme’s target group(s). This may entail use of large scale national household surveys backed up by ad hoc poverty and vulnerability surveys (survey outreach approach), and/or inviting individuals or households hoping to qualify for benefits to apply to a programme office (on-demand approach). The approach used and contextual factors (e.g. location, access to documentation) will influence both administrative and private registration costs and the balance between them. Administrative costs for registration by survey outreach are normally

Guidance on measuring and maximising VfM in social transfers Part 2: Explanatory text
61
higher due to the costs of surveys and their more complex information requirements, especially where means testing is involved. In general, on-demand registration involves lower administrative costs and is well suited to programmes which are categorically targeted with simple, transparent eligibility criteria and rights-driven rather than limited to arbitrary quotas, although the private costs of travel and obtaining necessary documentation may be higher. In either case the cost of publicity campaigns, a key requirement especially for on-demand registration, needs to be taken into account alongside that of other measures to ensure that intended recipients, the poor in particular, have the documentation they need to register. A flexible, pragmatic and client-focused approach to specifying requirements for documentation and minimising the number of visits applicants must make to programme offices can do much to reduce both private and social costs of registration. On the other hand, long, hard-to-obtain and harder-to-complete forms, stringent certification requirements and unsympathetic or corrupt officials can prove a potent barrier to registration for poor, illiterate would-be claimants, as was documented for programmes in the state of Maharashtra, India (Pellissery, 2005).
113. A centrally-held ‘single registry’, containing information on potential participants across both administrative areas and different programmes within a wider national social protection system, enables efficient sharing of registration and delivery information nationwide, and the ability quickly to assess the degree of overlap between programmes and to monitor their complementarity. The registry will need to include all the information that will be required to identify participants and determine their eligibility for the different programmes that share it, and will need to be updated at regular intervals to account for births, deaths, migration and changes in circumstances. The costs of compiling, validating and maintaining the registry are likely to rise in proportion to the complexity and ease of monitoring of programme eligibility criteria and the frequency of retargeting and updating. These costs can be reduced through the use of ICT-based systems for real-time transmission, storage and access of data between local and central levels.
Eligibility and enrolment
114. Eligibility determination involves application of targeting criteria for individual programmes to the population included in the registry. This might be a simple process for a categorically-targeted programme such as a pension in which participants become eligible once an age threshold is reached, but can become complex, time consuming and more costly where multiple criteria are involved, especially where these include proxy means test scores, eligibility determination by community committees and conditionality arrangements.
115. Enrolment, whereby eligible individuals or households are formally notified of their inclusion in a programme and added to a payments database, is made more efficient by the use of electronic enrolment systems. The payments database should be functionally linked to the registry, but contain only those actually included as eligible transfer recipients. A reliable recipient identification system, essential for ensuring that transfers reach those for whom they are intended, can use smart card and fingerprint recognition technology to improve the cost-efficiency of payment delivery, but could become still more cost-effective if linked to other smart card applications such as national identification, voter registration or health records.
Payments systems
116. Payments systems for social transfers cover delivery of cash or in-kind transfers to enrolled participants according to a preset schedule determined at programme design. Where conditionality is applied, data from the agency responsible for monitoring compliance (or non-compliance) with conditions must be fed into the payment authorisation process at this point. Key attributes of effective payments systems are predictability, regularity and timeliness of transfers: where payments are unpredictable, sporadic or late, as occurred

Guidance on measuring and maximising VfM in social transfers Part 2: Explanatory text
62
during early years of Ghana’s LEAP programme due to delays in funds release, they are unlikely to fulfil their objectives and may have impacts that differ from those intended.
117. Electronic payment systems can dramatically reduce both administrative and recipient costs as well as improve reliability, security and recipient choice. These may include smartcards holding both identification and financial transfer information, mobile phones for rapid, low cost money transfers, automatic teller machines (ATMs) and intelligent Point-of-Sale (PoS) equipment operated by a network of local agents (e.g. retailers). Delivery systems also open up other opportunities when linked to social or financial service provision. Where recipients assemble to collect transfers, training, public awareness campaigns and health services can be provided at the same time. Where transfers are delivered to recipients electronically these benefits of assembly may be precluded, but private collection costs are lower and additional financial services (such as micro-credit or small savings schemes) can be included. Bringing such financial services to the previously ‘unbanked’ benefits the community as a whole, since as they expand, people can use them for a range of financial transactions, thus further stimulating the local and national economy.
Financial management and accountability
118. Sound financial management and accountability systems are essential for ensuring that benefits reach intended target groups in a timely, predictable and regular fashion. Detailed guidance is provided in DFID’s ‘How To’ notes on managing fiduciary risk (DFID, 2006; 2011c). Key issues for social transfers, especially where donor funds flow through host government systems, are:
the timeliness and credibility of budget preparation based on due policy debate and with due regard to the recurrent expenditure implications of donor-funded spending on transfer programmes;
smooth budget execution and funds release mechanisms which give spending units adequate time to follow proper procedure in procuring and paying for services and delivering payments;
adequate controls over establishment and payroll to prevent the accumulation of budget arrears which threaten programme sustainability;
control of corruption risk, including good civil society access to fiscal and public accounts information, and targeting and delivery systems which restrict the scope for manipulation and élite capture.
properly functioning independent grievance procedures (e.g. through an ombudsperson’s office) to handle complaints, including by those excluded by the targeting system, and investigate abuses.
Less complex targeting and eligibility is likely to reduce the risk of fraud and error.
Management information system
119. Most of these functions can be facilitated by combining them into a semi-automated management information system (MIS) which, for example, directly links registry, enrolment and payments databases, and can rapidly generate both standard regular and tailor-made ad hoc reports to support programme management. An MIS of this kind can help to contain fiduciary risk and serve many of the needs of process and impact monitoring as well as providing a solid basis for evaluation, all of which can bring significant VfM dividends. Programmes often rely on manual/rudimentary arrangements at initial stages and then move to a more comprehensive MIS as scale-up proceeds. But in terms of being able to monitor VfM, the earlier a comprehensive MIS is functioning the better in terms of complete, timely and good quality data availability. Further VfM gains can be derived from sharing elements of

Guidance on measuring and maximising VfM in social transfers Part 2: Explanatory text
63
programme-level MISs across a number of programmes administered by the same ministry or department, or even across different ministries.
VfM in national social protection systems
120. At a broader level, an important driver of VfM for individual social transfer programmes is the character, integrity and capacity of the national social protection system of which such programmes form a part, and its associated institutional architecture and policy processes. As noted in paragraphs 73 and 95 above, programmes that complement each other within such a system may together yield significantly greater value than the sum of their individual benefits. This raises the question of how to measure VfM for investments in national social protection systems and their institutional components and arrangements. Although there should be elements of VfM analysis - in terms of economy, efficiency and effectiveness - which it is possible to examine, there appear to be few precedents or models to work with at a quantitative level, and any cost-benefit analysis for such an investment would face inevitable challenges when it comes to monetising benefits. One possible way forward might involve VfM comparisons between similar programmes in different countries with different system contexts. Another might be to assess benefits in terms of capacity to leverage additional social protection funding which is contingent on effective systems being in place, as was adduced in a recent DFID proposal to contribute to the World Bank’s Rapid Social Response Fund. Part of the logic here might be that partner governments tend to be reluctant to borrow to build systems, so there could be significant gains from using donor grants for this purpose. A third approach might involve a cost-effectiveness analysis based on comparing the targeting effectiveness, benefit levels, coverage and poverty gap impacts of the current system with alternative combinations of priority programmes, as has recently been undertaken in Bangladesh (Box 17). Whichever approach is taken, it is important to take account (qualitatively if not in numbers) of the potential benefits of establishing a sustainable system that delivers dividends over a run of years, and that might possibly be scalable in the face of future big shocks.
4. Monitoring and evaluation (M&E)
121. Appropriate M&E indicators for social transfers depend very much on specific programme objectives, but tend to fall into the following categories:
cost indicators relate most directly to the ‘money’ side of VfM and include costs of different programme inputs (cash, staff, equipment, logistics, contracted services etc.) and operations (set-up, roll-out, operations, M&E); cost per recipient (programme and private costs); cost per unit of transfer (cost-efficiency); cost per measure of wider benefits (cost-effectiveness);
targeting indicators which shed light on, for example, appropriateness of targeting criteria, targeting and retargeting process, inclusion and exclusion errors, unintended consequences of targeting, benefits and drawbacks of different targeting approaches, barriers to access for the most vulnerable, local and national politics of targeting;
process or implementation indicators assessing how well a programme is being operated, covering such issues as delivery (timeliness, regularity, predictability, costs to recipients); registration and enrolment (efficiency, participant understanding and experience of process); grievance procedures; recognition of rights and entitlements;

Guidance on measuring and maximising VfM in social transfers Part 2: Explanatory text
64
impact indicators at the level of individuals (consumption, child health and nutrition, vaccination, morbidity, school enrolment, attendance and performance, adult and child labour, use of services), households (expenditure patterns, income generation, asset accumulation, food security, migration, production), community (impact on markets, prices, traders, non-recipients, multiplier effects, social cohesion and reciprocity, financial inclusion) and wider economy and polity (poverty gap and inequality, fiscal priority, exchange rates, social attitudes towards poverty, voting behaviour, political priorities).
122. Indicators should be chosen with an eye to VfM within the M&E process itself, focussing on the minimum dataset required to meet operational, strategic and advocacy information needs, and no more. Too many indicators and too much data will obscure key messages, delay the release of findings and slow down the learning process.
123. A summary and checklist of M&E issues is provided on page 17 of the toolkit. Indicators should also be identified and assessed in the light of the Critical cost-effectiveness drivers listed on page 16.
124. The reader is referred to DFID’s recently published Guidance for evaluating social transfer programmes (Dissanayake et al., 2012). This provides a step-by-step guide to:
evaluation purpose, users and timing;
key evaluation questions on impact and process, and the quality of evidence to be expected for different social transfer outcomes;
Box 17: A system-wide approach to assessing VfM in Bangladesh
In 2012/13, DFID and AusAID is collaborating with the Government of Bangladesh and UN agencies to design a four-year Social Protection Policy and Reform (SPPR) Programme. This aims to support a Government commitment to strengthening the coordination, targeting and coverage of the country’s wide array of social protection programmes. Many of these involve very low levels of transfer and poor cost efficiency and effectiveness. Together they reach less than a third of poor families, at a cost 2.4 percent of GDP of which half is spent on a civil service pension scheme. The SPPR will set up a Social Protection Unit in the Ministry of Finance, working with Government at both strategic and Line Ministry levels to develop capacities and build evidence for policy reform. It will establish a system-wide MIS and produce costed plans for strengthening priority programmes which effectively address poverty and enable families to deal with risks. A selection of which may then be scaled up under a follow-up phase of DFID/AusAid support.
The appraisal used simulations based on the 2010 Household Income & Expenditure Survey to explore poverty impacts of potential combinations of priority programmes. For example, for the same cost as the current system, which achieves a poverty gap reduction of less than 10 percent, a monthly child grant of Tk.300 (US$3.80) for all children aged 0-12 and a monthly old age allowance (OAA) of Tk.800 (US$10) for all people aged 65+ could be provided. This would reach 94 percent of poor households and reduce poverty gap by as much as 35 percent, equivalent to US$ 1 billion each year. A much larger number of families vulnerable to poverty would also benefit; for example if the poverty line were raised by 50%, the same combination of benefits would still reach a similar proportion of the 60 percent of the population who would then be considered poor, reducing the poverty gap by 16 percent or US$ 2 billion annually.
In practice, given the range of interests vested in the current system, reform is likely to be incremental and extend over a much longer period. Under the SPPR it is nevertheless considered feasible to establish a grant for pre-school children and reform the present primary and secondary school stipends, OAA and disability allowance, raising expenditure on these priority programmes from under 0.3 percent to over 0.6 percent of GDP by 2017 without increasing the overall relative allocation to social protection.
Source: Kidd, White and Khondker (2013)

Guidance on measuring and maximising VfM in social transfers Part 2: Explanatory text
65
evaluation design and methods: identifying evaluation questions; factors affecting design; experimental, quasi-experimental and non-experimental designs for impacts; process evaluation; mixing methods;
how the evaluation approach fits with the evidence base;
use of monitoring data;
role of stakeholders;
budgeting and team selection for evaluation;
communicating evaluation findings.
125. The guidance also provides a set of impact evaluation case studies of social transfer programmes in Africa, and a glossary of terms.
5. Financial sustainability
126. Financial sustainability must be analysed for all programmes where programmes are being, or are expected to be, funded through government systems. While going beyond VfM as such, the question of a programme’s affordability on a long-term sustainable basis is an additional critical issue for economic appraisal (see DFID, 2009). Even if donors play a role in the financing of social protection programmes, this is likely (in most cases) to be only a partial contribution to the full cost and often only for an initial pilot or start-up phase. Donors seldom finance fully social protection programmes taken to scale, although there are rare exceptions, such as the Ethiopian PSNP, where this has been seen as an alternative to large-scale, less cost-effective humanitarian assistance. In any case, heavy reliance on donors for funding social protection programmes is generally considered unwise (see Handley, 2009), as donor assistance is by its nature short-term (or medium-term at best) and so tends to be unpredictable, putting the sustainability of programmes at risk. When social transfers are seen as entitlements, or enshrined in law as such, their withdrawal due to funding shortfalls also carries political risks as well as raising ethical/rights issues for beneficiaries.
127. The donor role should therefore in most cases not substitute for a domestic government’s primary responsibility to finance social transfers. One approach, noted by the World Bank (2011a), is for development partners to let governments fund all or most of the actual transfers, while using aid funds mainly for technical assistance and capacity building, particularly in the set-up and roll-out stages of programme development. This can include support for programme design, setting up an MIS, carrying out process and impact evaluations, and strengthening of targeting. This approach has been applied in programmes such as Ghana’s LEAP and Mozambique’s PSA, which have so far been largely financed from government budgets. The World Bank’s new multidonor Rapid Social Response Program is another funding route, attuned to building social protection systems that safeguard poor and vulnerable people against severe shocks like the food, fuel and financial crises. A note of caution is nevertheless sounded by Devereux and White (2010) and Hanlon et al. (2010:157) who warn that involving donors at the set-up stage can give them undue influence over programme design, crowding out local agendas and making it less likely that governments will prioritise programme extension.
128. Where donors do support pilot programmes, they should be especially careful to ensure that these respond to domestic conceptualisations of need and prioritisations of objectives, and that there is tangible evidence of government commitment, usually including through at least some financial contribution. Without this, there is a strong risk that pilots will not be scaled up, whether or not they have proven their cost-effectiveness. Several pilots such as the Hunger Safety Nets Programme in Kenya and the cash transfer programmes in Malawi and Zambia face these risks, despite strong donor advocacy in some cases for

Guidance on measuring and maximising VfM in social transfers Part 2: Explanatory text
66
governments to co-finance scale-up. It also helps sustainability if pilots help build skeleton national social protection systems which can be fleshed out as programmes expand, rather than setting up separate systems.
129. The question that arises is what level of expenditure on social assistance can governments in developing countries be reasonably expected to commit to social assistance programmes? This can be measured as a percentage of GDP or as a percentage of total government expenditure. While in practice the answer ultimately depends at least as much on ideological stance and political priorities as on ‘rational’ economic choices, a rough ballpark figure of the potential spending share is probably in the range of 1-2% of GDP in most low income countries, but slightly more than that in lower middle income countries. To cite some existing examples, Namibia’s social pension was estimated to cost 1.4% of GDP in 2009/10, and Lesotho’s 1.4%, while Mauritius spends 2% of GDP on its basic and enhanced retirement pensions (World Bank, 2011a). The PSNP in Ethiopia costs 1.2% of GDP (World Bank, 2009b). And it has been estimated that by 2025 Ghana’s LEAP could be scaled up to reach a number equivalent to the total projected number of extreme poor households for 0.5% of GDP, although targeting errors will mean that only a portion of beneficiaries will be extremely poor (White, 2011). Some useful regional and cross-sectoral comparisons are made in Figure 7.
130. To contextualise this issue, it bears noting that, for low-income countries in sub-Saharan Africa, government revenue (excluding grants) averaged 15.5% of GDP and government expenditure 22.2% of GDP in 2004-08 (IMF, 2011). On average, governments of developing Sub-Saharan African countries spend about 4% of GDP on education and 3% of GDP on health.9 As Hagen-Zanker and McCord (2010) point out, the setting of international targets for the proportion of GDP that low income countries should devote to spending on social protection ignores the competing demands of other sectors for which international spending targets have also been set. Meeting any of these sectoral targets individually might be feasible, but only with trade-offs against other sectors. Meeting them all simultaneously would, in their study of six sectors in five sub-Saharan countries, require more than 100% of total government expenditure in four countries and 98% in the fifth.
131. The potential for expanding expenditure on social transfers in any particular country can best be assessed by examining the overall situation of government finances (primary and overall balances, level of debt, etc.) and then analysing potential sources of fiscal space, while taking into account competing demands on government resources and political priorities. Bearing in mind the caveat above about over-dependence on aid, the main domestic sources of fiscal space (apart from increasing debt) are increases in government revenue (as a function of GDP growth and/or a higher tax yield, i.e. an increase in the revenue/GDP ratio) or the reallocation of government expenditure.
132. Government revenue as a percentage of GDP has been gradually increasing in most of Africa, due to tax reforms. Governments could consider earmarking specific sources of domestic revenue to finance expanded social protection. One of the most striking examples of such an approach is the 2.5% national health insurance levy, added to VAT to finance the bulk of the National Health Insurance Scheme in Ghana.
133. The reallocation of expenditure is an alternative, but often difficult in practice due to the non-discretionary nature of a large part of government spending and political interests. However, even within social protection, there are potentially important cost-effectiveness gains to be made from reallocating expenditures, as we have seen above with respect to the phasing out of consumer subsidies to finance better targeted social transfers.
9 World Bank, World Development Indicators.

Guidance on measuring and maximising VfM in social transfers Part 2: Explanatory text
67
6. VfM in labour intensive public works
134. Labour-intensive public works programmes (PWPs) combine short-term social protection objectives (increasing employment opportunities and incomes of the poor, either in cash or in food) with longer term developmental objectives, such as the creation, repair or maintenance of infrastructure and environmental protection, and in some cases the provision of training to increase employability. In a few cases, such as the rural employment guarantee scheme established in India, PWPs act as ‘employers of last resort’, providing income insurance through guaranteed employment for all who seek it. Some schemes, such as the Productive Safety Nets Programme (PSNP) in Ethiopia, which is by far the largest PWP in Sub-Saharan Africa, are designed specifically to provide regular employment to food insecure households during the ‘lean season’ before harvests and have been promoted as a more developmental alternative to traditional humanitarian food distribution. For a typology of PWPs, see McCord and Slater (2009).
135. Analysis of value for money in PWPs is more complicated than for ‘direct’ social transfers in so far as the outputs include the social assets created (rural feeder roads, small irrigation systems, terraces, dykes and tree-cover, among others) and services provided (e.g. rubbish collection in urban areas) by public works, in addition to the transfer provided to participants as a wage. A third output comprises human capital or labour supply development, through training and work experience. These outputs in turn are expected to generate long term benefits in terms of economic and social outcomes, such as improved access to markets and social services, reduced exposure to environmental risks, and improvements in agricultural productivity, food security, nutrition and health. On the other side of the ledger, programme costs will be higher because of the need to design and manage large numbers of public works projects (some 47,000 separate projects were underway in 2011 in the case of Ethiopia’s PSNP) and to purchase the equipment and materials needed to implement these projects. Private costs may also be higher because of the opportunity costs incurred by participants (time and income foregone from other
Source: Weigand and Grosh, 2008, p.8
Figure 7: Social assistance, social insurance and social sector spending by region, selected years

Guidance on measuring and maximising VfM in social transfers Part 2: Explanatory text
68
productive activities). All these factors need to be taken into account in comparing the VfM of PWPs with other types of social transfers.
136. The measures most often employed to measure aspects of cost-effectiveness in PWPs, such as labour intensity or the cost of transferring US$1 to a beneficiary, are inadequate when taken alone. On the output side, they focus only on the transfer, excluding the value of the assets created, and they naturally vary according to the types of works involved, which require different degrees of labour intensity. However, high labour intensity is an important factor in determining the extent to which PWPs have income transfer effects.
137. In analysing data for 26 PWPs in Sub-Saharan Africa for which the wage share of budgets is available, McCord and Slater (2009) found that on average 46% of expenditure is on wages. Del Ninno et al (2009) found, however, that the majority of PWPs worldwide (62%) have a wage share of more than 60%. PWPs in Ethiopia’s PSNP have a higher level of wage intensity: stipulated as 80% or more in the 2010 PSNP implementation manual and reaching 87% in Phase 1 according to the World Bank (2009b). Some programmes place caps on wage/capital ratios, but this may be arbitrary and inefficient if higher levels of capital investment would optimally be required to produce the intended assets at lowest cost.
138. Analysing several schemes in Malawi and Zambia, White and McCord (2006) found that the apparent (total) cost per dollar of transfer ranged from US$1.42 (in the Project Urban Self-Help scheme in Zambia in 2005) to $US8.21 (in the I-LIFE programme in Malawi) – see Figure 8. These figures reflect a lack of comparability over what was included as costs, but are in most cases much higher than in ‘pure’ cash transfer programmes. The measure once again focuses only on the transfer, ignoring the assets created, and the capital requirements of the kind of works concerned. However, as McCord and Slater point out, ‘from a fiscal perspective, such a premium is acceptable only if the value of assets created and any other benefits specific to PWP provision of social protection, are commensurate with this premium, a question which remains largely unexplored in the literature and evaluations to date.’
Figure 8: Total cost of transferring US$1 to a PWP beneficiary in Malawi and Zambia
Source: White and McCord (2006).
139. For broader cost-effectiveness, we need to take into account the net wage gain (after deducting the private opportunity costs of participation) and the length of employment

Guidance on measuring and maximising VfM in social transfers Part 2: Explanatory text
69
provided, in addition to labour intensity, targeting performance, the value of the assets created and the longer-term social and economic benefits of the assets.
140. The duration of employment is another important factor, as many PWPs provide only short periods of ad hoc employment rather than a regular predictable source of additional income as withdirect social transfers (see Devereux et al, 2007). An exception is the PSNP, which provides an average of 150 days work per household per year (World Bank, 2009) on a regular annual basis (in principle limited to five years before graduation). Overall in Sub-Saharan Africa, McCord and Slater found that, for 42 PWPs with data on this indicator, the mean duration of employment was 4.8 months. But many programmes provide much less than this: in Madagascar, where PWPs benefit approximately 10.5% of poor households, this relatively high coverage needs to be balanced against the fact that, in 2010, the average length of employment provided was only 24.5 days (Hodges, 2011). A sustained improvement in livelihoods is not likely to result from a low transfer over a short period of time. From this perspective, it is valuable to examine the contribution of the net wage to annual household income.
141. Targeting performance affects the proportion of the gross and net wages benefiting the target group, i.e. taking into account inclusion errors. PWPs often attempt to use the wage rate as a mechanism for self-selection. However, in contexts where unemployment or underemployment is extremely high, PWPs are seldom large enough to make it possible even with very low wages to clear markets, making it necessary to use complementary targeting methods (often community-based targeting) or, as is common in many schemes, to resort to rationing (or lottery allocation) of the limited jobs on offer, rather than rely on self-selection alone.
142. While most PWP evaluations place their emphasis mainly or entirely on the short-term income effects of PWPs, a proper assessment of cost-effectiveness should also incorporate the benefits of the assets created or maintained, both for society as a whole and for the poor specifically. This requires data on the nature, quantity, quality, sustainability and usage of the assets concerned. Standard financial cost-benefit ratios for these investments can be calculated, assuming the required data are available. This analysis can be extended to focus specifically on the proportion of benefits accruing to the poor – likely to be very high in the case of the PSNP, but not always the case in PWPs intended merely as a mechanism for job creation and/or infrastructure creation.
143. Ravallion (1998) has proposed a cost-effectiveness ratio that takes some of these factors into account: labour intensity, the poverty incidence of participants, the net wage gain, indirect benefits accruing to the poor from the assets created, and the potential rate of cost recovery accruing to the state from these assets. This amounts to a formula for deriving a cost-benefit ratio. However, the lack of data available for many of the components of this model means that it is impossible to apply it in practice to most PWPs without resorting heavily to assumed values. Also the formula itself does not take into account all the long-term impacts of the income transfer in PWPs, notably the indirect benefits that may arise from higher levels of human capital development due to the income effects on nutrition and school attendance. Ethiopia’s PSNP has had substantial impacts on beneficiaries’ food security and nutrition and on the use of health and education services, as well as investments in farming inputs and livestock (World Bank, 2009b). The Ravallion method was applied in Shah’s economic appraisal of the job creation programme in Gaza (Shah, 2011).
144. McCord (2012a) has produced a useful toolsheet for appraising productivity enhancing PWPs. This discusses six key questions to be reviewed in order to determine whether a PWP will provide ‘productive’ social protection, leading to higher productivity and the graduation of households out of poverty:
Is the design appropriate for the livelihoods and labour market context in which it will be implemented?

Guidance on measuring and maximising VfM in social transfers Part 2: Explanatory text
70
Is the PWP likely to promote productivity?
o is the wage adequate to meet the consumption shortfall and allow for investment?
o are the assets productive?
o is there demand for the skills gained?
o are complementary interventions in place?
Is the scale of programming meaningful?
o what is the scale of the programme in relation to the scale of unemployment?
o are there technical and institutional constraints to scaling up?
o is the PWP limiting debate on alternative larger scale interventions?
Is the proposal cost effective? Are there cheaper ways to get a similar outcome?
What is the distribution of productivity gains?
Have key institutional challenges been taken into account?
145. In exploring such questions, McCord (2012b) shows that the current policy preference in favour of PWPs rests on a number of assumptions about their capacity to address basic consumption needs but also tackle unemployment, promote productivity, growth and stability while also promoting graduation and preventing ‘dependency’, and that these assumptions are not entirely evidence-based and may be linked in part to political and organisational interests. In particular, while some PWPs such as India’s MGNREGS are designed for short term consumption smoothing, most hold out the promise that participants will be enabled to graduate out of poverty through the bundle of benefits that the programme brings, thus limiting caseloads in a way not matched by other social transfers. This would indeed be a powerful indicator of value for money in PWPs. Yet evidence for successful graduation is as elusive for PWPs as it is for any social transfers, and there is also a general lack of consensus about what the criteria for graduation should be. While Ethiopia’s PSNP-plus-HABP combination, for example, appears to be cost-effective in addressing food gaps and preserving and even building household and community assets (see Box 12), graduation out of the programme10 appears to have been minimal during Phase 1, and according to one government source amounted to a cumulative total of just 270,000 households between 2008 and 2011. Since total beneficiary numbers grew rather than shrank over this period (from 7.4 to 7.6 million people), it seems that new PSNP recipients outstripped any reduction in the caseload achieved by this level of graduation. (White & Ellis, 2012)
146. This further underlines the need to examine value for money on social transfers from a number of angles and on a number of different levels, taking account of political economy pressures which might favour one kind of design over another and influence the collection and presentation of evidence relevant to VfM.
10
Graduation is defined in the PSNP as follows ‘A household has graduated when, in the absence of receiving PSNP transfers, it can meet its food needs for all 12 months and is able to withstand modest shocks.’ Two stages of graduation are proposed: ‘food sufficiency’ when PSNP transfers are no longer needed, and ‘food security’ on achievement of a sustainable household livelihood, capable of generating sufficient income and with enough assets to deal with shocks in future years. (GDFRE, 2007)

Guidance on measuring and maximising VfM in social transfers Part 2: Explanatory text
71
References
Agüero, J., Carter, M. and Woolard, I. (2007) The impact of unconditional cash transfers on nutrition: the South African Child Support Grant. International Poverty Centre Working Paper 39, September. Available at http://www.ipc-undp.org/pub/IPCWorkingPaper39.pdf
Baird, S. C. McIntosh and B. Özler (2011) ‘Cash or condition? Evidence from a cash transfer experiment.’ Forthcoming in The Quarterly Journal of Economics 126:4. Draft (February 23, 2011) available at http://ipl.econ.duke.edu/bread/papers/0511conf/Baird.pdf
Berhane, G., J. Hoddinott, N. Kumar, A. Seyoum Taffesse, M. Tedia Diressie, Y. Yohannes, R. Sabates-Wheeler, M. Handino, J. Lind, M. Tefera, and F. Sima (2011a) Evaluation of Ethiopia’s Food Security Program: Documenting Progress in the Implementation of the Productive Safety Nets Programme and the Household Asset Building Programme.” Mimeo, International Food Policy Research Institute, Washington, DC. 19 October
Berhane, B., J. Hoddinott, N. Kumar & A. Seyoum Taffesse (2011b) The impact of Ethiopia’s Productive Safety Nets and Household Asset Building Programme: 2006-2010, International Food Policy Research Institute, Wahsington DC. 30 December
Caldés, N., D. Coady and J. Maluccio (2004) The cost of poverty alleviation transfer programs: a comparative analysis of three programs in Latin America, FCND discussion paper no. 174, February, International Food Policy Research Institute, Washington, D.C.
Coady, D. (2000) The application of social cost-benefit analysis to the evaluation of Progresa. International Food Policy Research Institute, Washington D.C., November
Coady, D., M. Grosh and J. Hoddinott (2004), Targeting of transfers in developing countries: review of lessons and experience, The World Bank and International Food Policy Research Institute, Washington, D.C. Available at http://ideas.repec.org/a/eee/wdevel/v34y2006i5p818-837.html
Coady, D. and Parker, S. (2004) ‘Cost-effectiveness Analysis of Demand- and Supply-side Education Interventions: the Case of PROGRESA in Mexico’, Review of Development Economics 8(3), pp. 440–451, August
Cockburn, J., I. Fofana and L. Tiberti (2010) Simulating the impact of the global economic crisis and policy responses on children in West and Central Africa, Innocenti working paper IWP-2010-01, UNICEF Innocenti Research Centre, Florence. Available at http://www.unicef-irc.org/publications/596
Coulter L. & Sutcliffe J.P. (2009) Household Extension Packages: Modelling Impacts and Comparing Approach. Prepared for the Review of the Government of Ethiopia’s Other Food Security Programme, 2008
Korboe, D., T. Dogbe & C. Marshall (2010) Participatory Poverty and Vulnerability Assessment (PPVA): Understanding the Regional Dynamics of Poverty, with particular focus on Northern Ghana. Consolidated Report. Participatory Development Associates, Accra, July
Cosgrove, C., L. Hannigan, S. Kidd and A. McPherson (2011) A qualitative review of targeting methodologies in the Kenya Hunger Safety Net Programme (HSNP), Development Pathways, June.

Guidance on measuring and maximising VfM in social transfers Part 2: Explanatory text
72
Croome, D., A. Nyanguru and M. Molisana (2007) The impact of the Old Age Pension on hunger vulnerability – a case-study from the mountain zone of Lesotho, prepared for the Regional Hunger Vulnerability Programme, National University of Lesotho, October
Davies, S. and Davey, J. (2008) A Regional Multiplier Approach to Estimating the Impact of Cash Transfers on the Market: The Case of Cash Transfers in Rural Malawi, Development Policy Review 26 (1): 91-111
de Brauw, A. & Hoddinott, J., (2008). "Must conditional cash transfer programs be conditioned to be effective?: The impact of conditioning transfers on school enrollment in Mexico," IFPRI discussion papers 757, International Food Policy Research Institute (IFPRI). Available at http://www.ifpri.org/publication/must-conditional-cash-transfer-programs-be-conditioned-be-effective
Devereux, S. (2001). Social pensions in Namibia and South Africa. IDS Discussion Paper 379, Brighton: Institute of Development Studies, February. Available at www.ids.ac.uk/download.cfm?file=dp379.pdf
Devereux, S., and S. Coll-Black (2007) Review of evidence and evidence gaps on the effectiveness and impacts of DFID-supported pilot social transfer schemes, evaluation working paper, Department for International Development.
Devereux, S. and White, P. (2010) “Social Protection in Africa: Evidence, Politics, and Rights”, Poverty & Public Policy, Vol. 2: Iss. 3, Article 5. Available at www.psocommons.org/ppp/vol2/iss3/art5
DFID (nd) Expanding Social Protection in Uganda, Annex D Economic Appraisal, DFID Uganda
DFID (2006) Managing the fiduciary risk associated with social cash transfer programmes, How To Note, Department for International Development, June
DFID (2009) A Strengthened Approach to Economic Appraisals, How To Note, Value for Money Department, FCPD, Department for International Development. Available at http://www.dfid.gov.uk/Documents/publications1/how-to-economic-appraisal.pdf
DFID (2010a) Writing a Business Case, How To Note, Value for Money Department, FCPD, Department for International Development.
DFID (2010b) Citizens’ Damage Compensation Programme Phase II: “Flood compensation cash transfers” – Business Case, DFID Pakistan, May
DFID (2011a) DFID’s approach to value for money (VfM), Department for International Development.
DFID (2011b) DFID Cash Transfers Literature Review, Department for International Development, April
DFID (2011c) Managing fiduciary risk when providing financial aid, How To Note, FCPD, Department for International Development, June. Available at http://www.dfid.gov.uk/Documents/publications1/how-to-fiduciary-fin-aid.pdf
Dissanayake, R., Z. Stephenson and M. Greenslade (2012) DFID guidance for evaluating social transfer programmes, DFID, London, June. Available at http://www.dfid.gov.uk/R4D/PDF/Publications/DFID_guidance_for_evaluating_social_transfer_programmes_June_2012.pdf
Guidance on measuring and maximising VfM in social transfers Part 2: Explanatory text
73
Ellis, F., S. Devereux and P. White (2009) Social Protection in Africa, Edward Elgar Publishing, Cheltenham, UK and Northampton, Massachusetts, USA.
Ellis, F. (2008) ‘We are all poor here’: economic difference, social divisiveness and targeting cash transfers in SSA, presentation to the Conference on Social Protection for the Poorest in Africa, 8-10 September, Entebbe, Uganda. Available at www.uea.ac.uk/polopoly_fs/1.87456!/fe-paper-sp-sept2008.pdf
Ferrand, A. (2011) DFID economic appraisal for Citizens’ Damage Compensation Programme Phase II “Flood compensation cash transfers”, Department for International Development, May [Alexis Ferrand, [email protected]]
Fiszbein, A. and Schady, N. (2009) Conditional Cash Transfers – reducing present and future poverty, World Bank Policy Research Report, Washington, DC: The World Bank. Available at http://go.worldbank.org/UQEJK2J5E0
GFDRE (2007) Graduation Guidance Note. Food Security Coordination Bureau, Ministry of Agriculture & Rural Development, Addis Ababa, December
GFDRE (2011) Productive Safety Net Program – 2011 Public Works Impact Assessment, Phase I, Final Report, Government of Ethiopia, Addis Ababa, 30 October
GFDRE (2012) Ethiopia’s Progress Towards Eradicating Poverty: An Interim Report on Poverty Analysis Study (2010/11), Development Planning & Research Directorate, Ministry of Finance & Economic Development, Government of Ethiopia, Addis Ababa, March
Gertler, P., Martinez, S. and Rubio-Codina, M. (2006) Investing cash transfers to raise long term living standards, Policy Research Working Paper Series 3994, World Bank, August
Grosh, M., C. Del Ninno, E. Tesliuc and A. Ouerghi (2008) For protection and promotion: the design and implementation of effective safety nets, The World Bank, Washington, D.C. Available at http://go.worldbank.org/K0Z8SB4VJ0
Government of Kenya (2012), Kenya Social Protection Sector Review, Ministry of State for Planning, National Development and Vision 2030, Nairobi, June http://www.vision2030.go.ke/cms/vds/Kenya_Social_Protection_Review_Final.pdf
Schuring, E. et al. (2007), Impact Evaluation Design, Cash Transfer Pilot in Zambia: Concept Note. A collaborative project implemented by GTZ, MASDAR and CARE with support from GTZ, The World Bank and DFID Zambia. 22 March. Available at http://german-practice-collection.org/en/download-centre/doc_download/514-Cash-Transfer-Pilot
Hagen-Zanker, J. and McCord, A (2010) Financing Social Protection in the Light of International Spending Targets: A Public Sector Spending Review, Final report, Overseas Development Institute, London, October
Handley, G. (2009) Fiscal Space for Strengthened Social Protection, West and Central Africa, Overseas Development Institute, London, and UNICEF, West and Central Africa Regional Office, Dakar. Available at www.odi.org.uk/resources/download/3474-briefing-paper-english.pdf
Haughton, J. and S.R. Khandkerthe (2009) Handbook on Poverty and Inequality, World Bank, Washington, DC. Available at http://go.worldbank.org/7JGPK76TM0

Guidance on measuring and maximising VfM in social transfers Part 2: Explanatory text
74
Hinsley, A. (2012) Economic appraisal of Zambia Child Grant, prepared for draft Business Case, DFID Zambia (forthcoming)
Hirway, I., M.R. Saluja and B. Yadav (2009), Analysing Multiplier Impact of NREGA Works Through Village SAM Modeling, The Levy Economics Institute of Bard College
Hodges, A. (2011) Strategic Directions for Social Protection in Madasgacar, report for the World Bank, July.
Hodges, A., K. Dashdorj,Y.J. Kang, A.-C. Dufay, U. Budragchaa and T. Mungun (2007) Child benefits and poverty reduction: evidence from Mongolia’s Child Money Programme, Division of Policy and Planning working papers, UNICEF, New York.
Hodges, A., L. Pellerano and A. Mabota (2010) Development of social protection, strategic review for UNICEF Mozambique, Oxford Policy Management.
Hodges, A., C. O’Brien, D. Mèdédji and A. Koto-Yerima (2010) Etude de faisabilité d'un programme de transferts sociaux en espèces, report for UNICEF Benin, Oxford Policy Management.
Hodges, A., P. White and M. Greenslade (2011) Guidance for DFID country offices on measuring and maximising value for money in cash transfer programmes – toolkit and explanatory text. DFID, London. October
HTSPE (2011), Impact assessment of the Chars Livelihood Programme (CLP) Phase 1 – an assessment of IMO efficiency and programme costs, Final Report. HTSPE International Programme Management Ltd. in association with Verulam Associates Bangladesh Ltd., DFID Bangladesh, February
IEG (2011). Social Safety Nets: An Evaluation of World Bank Support, 2000–2010. Washington, DC: Independent Evaluation Group, the World Bank Group. Available at http://ieg.worldbankgroup.org/content/ieg/en/home/reports/ssn.html
IFS (2006) Evaluación del Impacto del Programa Familias en Acción–Subsidios Condicionados de la Red de Apoyo Social, Institute for Fiscal Studies, Econometría, and Sistemas Especializados de Información. National Planning Department, Bogotá, Colombia.
Jones, N., W. Ahadzie and D. Doh (2009) Social protection and children: opportunities and challenges in Ghana, Overseas Development Institute, London, and UNICEF, Accra.
Jones, N. & Shaheen, M. (2012) Transforming Cash Transfers: Beneficiary and community perspectives of the Palestinian National Cash Transfer Programme, Part 2: The case of the West Bank, Overseas Development Institute, London & Al-Quds University, Ramallah, December
Kidd, S. and E. Wylde (2011) Targeting the poorest: an assessment of the proxy means test methodology. AusAID, Canberra, September. Available at http://www.ausaid.gov.au/publications/pages/7044_2239_6308_4104_9028.aspx
Kidd, S., R. Calder & E. Wylde (n.d.) Assessing targeting options for Nepal’s social grants: what does the evidence tell us?, Development Pathways discussion paper, DFID-Nepal. Available at www.developmentpathways.co.uk/pubs/assessing-targeting-options-for-nepals-social-grants-what-does-the-evidence-tell-us/ (uploaded 22-Jun-2012)

Guidance on measuring and maximising VfM in social transfers Part 2: Explanatory text
75
Kidd, S., P. White and B. Khondker (2013) Bangladesh Social Protection Policy And Reform Programme (SPPR) – design document prepared for DFID Bangladesh and AusAID Bangladesh, April.
M.A Consulting Group (2009) Impact Assessment Study Report for PW Component of the PSNP in Ethiopia. Addis Ababa: Government of Ethiopia
MacAuslan, I. and Riemenschneider, N. (2011) ‘Richer but resented: What do cash transfers do to social relations and does it matter?’, paper for International Conference: “Social Protection for Social Justice”, Institute of Development Studies, UK, 13–15 April 2011. Oxford Policy Management
McCord, A. (2012a) Appraising productivity enhancing Public Works Programmes, Social Protection Toolsheet, Overseas Development Institute, London
McCord, A. (2012b) The politics of social protection: why are public works programmes so popular with governments and donors?, Background Note, Overseas Development Institute, London, September
McCord, A., and R. Slater (2009) Overview of public works programmes in Sub-Saharan Africa, Overseas Development Institute, London.
MESW (2011) Common targeting mechanism: report on pretesting of data collection instrument, Ministry of Employment and Social Welfare, Accra.
Mkandawire, T. (2005) Targeting and universalism in poverty reduction. Social policy and development programme paper no. 23, United Nations Research Institute for Social Development, December
Namibia Basic Income Grant Coalition, 2009. Making the difference! The BIG in Namibia – Basic Income Grant Pilot Project Assessment Report. Available at http://www.bignam.org/Publications/BIG_Assessment_report_08b.pdf
NAO (2011) Transferring Cash & Assets to the Poor. Report by the Comptroller and Auditor General, HC 1587 Session 2010-2012, 9 November. National Audit Office, London. Available at http://www.nao.org.uk/report/dfid-transferring-cash-assets-to-the-poor/.
Notten, G., B. Buligescu and Mpoué, A.(2008) Policy options to reduce child poverty and improve access to education and health care in the Republic of Congo: cost and impact simulations, UNICEF, Brazzaville.
OPM (2010) Cash Transfer Programme for Orphans and Vulnerable Children (CT-OVC), Kenya: Operational and impact evaluation, 2007-2009, final report, May, Oxford Policy Management, Oxford.
PAC (2012) Transferring Cash & Assets to the Poor. House of Commons Committee of Public Accounts, Sixty-fifth Report of Session 2010–12, London, 3 February. Available at http://www.parliament.uk/business/committees/committees-a-z/commons-select/public-accounts-committee/news/dfid-report-/
Pellissery, S. (2005). “Local determinants of exclusion and inclusion in rural public works programmes”. International Journal of Rural Management 1 (2), pp.164-87, cited in Samson et al. 2010, p. 210.

Guidance on measuring and maximising VfM in social transfers Part 2: Explanatory text
76
Pritchett, L. (2005) A Lecture on the Political Economy of Targeted Safety Nets. Social Protection Discussion Paper Series No. 0501, Social Protection Advisory Service, World Bank, Washington DC
Ravallion, M. (1998) ‘Appraising Workfare Programs’, Policy Research Working Paper 1955, World Bank, August
Ravallion, M. (2003) Appraising workfare programs, policy research working paper, WPS 1955, The World Bank.
Ravallion, M. and Chen, S. (2005) ‘China’s (uneven) progress against poverty’, Journal of Development Economics 82 (2007) 1– 42, Development Research Group, World Bank
Ryan, J.G. and Meng, X. (2004) The contribution of IFPRI research and the impact of the Food for Education program in Bangladesh on school outcomes and earnings. Impact Assessment Discussion Paper No. 22. International Food Policy Research Institute: Washington, DC. Available at http://impact.cgiar.org/
Sadoulet, E., A. de Janvry, and B. Davis (2001) ‘Cash transfer programs with income multipliers: PROCAMPO in Mexico’ World Development 29(6):1043-1056
Samson, M., Lee, U., Ndlebe, A., MacQuene, K., van Niekerk, I., Gandhi, V. and Harigaya, T. (2004) The Social and Economic Impact of South Africa’s Social Security System, Report commissioned by the Ministry of Social Development, Republic of South Africa. Cape Town: Economic and Policy Research Institute (EPRI).
Samson, M., I. Van Niekerk and K. Mac Quene (2010) Designing and implementing social transfer programmes, 2nd Edition, Economic Policy Research Institute Press, Cape Town. Available at http://epri.org.za/resources/book/.
Shah, V. (2011) Gaza social protection and food security programme, Economic Appraisal, Section C of appraisal case for the business case documents, 18 May, Department for International Development. [Valsa Shah, [email protected]]
Sinha, S., Gidwani, J., Das, N.C. (2008) Cost-benefit Analysis of CFPR, BRAC Research and Evaluation Division and EDA Rural Systems Private Limited, March.
Skoufias, E. and V. di Maro (2006) Conditional Cash Transfers, Adult Work Incentives, and Poverty, Policy Research Working Paper, 3973. Washington DC: World Bank
Tauhid, S. (2009) Chars Livelihoods Programme 2 Programme Memorandum, DFID Bangladesh, November. [Syeeda Tauhid currently on secondment to World Bank – alternative DFID contact Arifur Rahman]
Taylor, J.E., K. Thome and M. Filipski (2012) Evaluating Local General Equilibrium Impacts of Lesotho’s Child Grants Program. Paper prepared for the UN Food & Agriculture Organization, UNICEF/ESARO, and the World Bank. Department of Agricultural and Resource Economics, University of California, Davis. November 8th.
Taylor, J.E., J. Kagin, M. Filipski and K. Thome (2013) Evaluating General Equilibrium Impacts of Kenya’s Cash Transfer Program for Orphans and Vulnerable Children (CT-OVC). Paper prepared for the UN Food & Agriculture Organization, UNICEF/ESARO, and the World Bank. Department of Agricultural and Resource Economics, University of California, Davis. January 3rd.

Guidance on measuring and maximising VfM in social transfers Part 2: Explanatory text
77
Toigo, P. (2010) Economic Appraisal of OVC programme – cash transfers element, DFID Zimbabwe [Pietro Toigo: [email protected]]
Turner, S., Devereux, S., Ellis, F., Freeland, N., Ntseane, D., Seeley, J., Seleka, T. and White, P., (2010). ‘A Social Development Policy Framework for Botswana. Phase II: Framework and Strategy’. 26 May 2010. Ministry of Local Government, UNICEF and RHVP, Gaborone: Botswana
Van de Walle, D. (1998) ‘Targeting Revisited’, The World Bank Research Observer, vol. 13, no. 2, August, pp. 231-248.
Walker, D., A. Mabota, J. Carrilho and B. Kallen (2008) Estudo sobre o mecanismo de distribuição para o Programa de Subsídio de Alimentos em Moçambique, Instituto Naciona de Acção Social, Maputo, and Regional Hunger and Vulnerability Programme.
Warner, A. (2010) Cost-Benefit Analysis in World Bank Projects, Independent Evaluation Group, World Bank, June. Available at http://www.worldbank.org/ieg/.
Watkins, B. (2008) Alternative methods for targeting social assistance to highly vulnerable groups, independent monitoring and evaluation study, Kimetrica, 4 February.
Weigand, C. and M. Grosh (2008) Levels and Patterns of Safety Net Spending in Developing and Transition Countries, Social Protection Discussion Paper. Washington, DC: World Bank. Available at http://siteresources.worldbank.org/SOCIALPROTECTION/Resources/SP-Discussion-papers/Safety-Nets-DP/0817.pdf
White, P. (2011) Economic appraisal of LEAP Support and Expansion Programme, Ghana, prepared for Business Case drafted by A. McCord, T. Awori and P. White, Overseas Development Institute, London and DFID Ghana, May
White, P. (2012) Economic appraisal of Nigeria Child Development Grant Programme, prepared for Business Case developed by M. Schultz with B. Fenn, A. Garba, T. Roopnaraine, J. Sandford and P. White for DFID Nigeria, June
White, P. and A. McCord (2006) Cost comparison of cash, food and agricultural input transfer schemes in Malawi and Zambia, summary of conclusions, unpublished paper, 30 January.
White, P. & F. Ellis (2012) Ethiopia’s Productive Safety Net Programme, 2010-2014 – a value for money assessment. International Development UEA, Norwich for DFID Ethiopia, Addis Ababa, 23 July.
Wiseman, W., J. Van Domelen and S. Coll-Black (2010) Designing and Implementing a Rural Safety Net in a Low Income Setting: Lessons Learned from Ethiopia’s Productive Safety Net Program 2005–2009, Productive Safety Net Programme, Government of Ethiopia
World Bank (1990) World Development Report, Oxford University Press, New York
World Bank (2002) Guatemala Poverty Assessment Program: social protection, private transfers and poverty, Washington, D.C.
World Bank (2009a) Specific Guidance for Social Protection: Preparing PERs for Human Development, May, Washington, D.C.

Guidance on measuring and maximising VfM in social transfers Part 2: Explanatory text
78
World Bank (2009b) Project appraisal document on a proposed grant [...] in support of the third phase of the Productive Safety Net Program, report no. 48633-ET, 25 September, Washington, D.C.
World Bank (2010) Republic of Ghana, Improving the targeting of social programs, report no. 55578-GH, Washington, D.C.
World Bank (2011a) Cash transfer programs: the emerging safety net in Sub-Saharan Africa, draft, 28 January, Washington, D.C.
World Bank (2011b) Project Performance Assessment Report, Ethiopia Productive Safety Net Project (CR. 4004, IDA Grant H136, TF056013), Report No. 62549, Independent Evaluation Group, June 16