Embed Size (px)
Citation preview

Microenvironment and Immunology
Guidance Molecule SEMA3A Restricts TumorGrowth by Differentially Regulating theProliferation of Tumor-Associated MacrophagesMajken Wallerius1, Tatjana Wallmann1, Margarita Bartish1, Jeanette €Ostling1,Artur Mezheyeuski1, Nicholas P. Tobin1, Emma Nygren1, Pradeepa Pangigadde1,Paola Pellegrini1, Mario Leonardo Squadrito2, Fredrik Pont�en3, Johan Hartman1,4,
Jonas Bergh1,5, Angelo De Milito1, Michele De Palma2, Arne €Ostman1,John Andersson6, and Charlotte Rolny1
Abstract
Accumulation of tumor-associated macrophages (TAM) corre-lates withmalignant progression, immune suppression, and poorprognosis. In this study, we defined a critical role for the cell-surface guidance molecule SEMA3A in differential proliferativecontrol of TAMs. Tumor cell–derived SEMA3A restricted theproliferation of protumoral M2 macrophages but increased theproliferation of antitumoral M1, acting through the SEMA3Areceptor neuropilin 1. Expansion of M1 macrophages in vivoenhanced the recruitment and activation of natural killer (NK)
cells and cytotoxic CD8þ T cells to tumors, inhibiting theirgrowth. In human breast cancer specimens, we found that immu-nohistochemical levels of SEMA3A correlated with the expressionof genes characteristic of M1 macrophages, CD8þ T cells, and NKcells, while inversely correlating with established characters ofmalignancy. In summary, our results illuminate a mechanismwhereby the TAM phenotype is controlled and identify the cell-surfacemolecule SEMA3A as a candidate for therapeutic targeting.Cancer Res; 76(11); 1–13. �2016 AACR.
IntroductionOver the past few decades, it has become evident that tumor-
associated macrophages (TAM) positively regulate tumor pro-gression [reviewed in (1)].Macrophages (Mf) innormal tissue arehighly plastic and can present tumor-associated antigens, lysetumor cells, and stimulate antitumor functions in T cells andnatural killer (NK) cells [reviewed in (2)]. However, most TAMslack these antitumoral properties (3–5). In fact, high levels ofTAM infiltration are associated with poor clinical outcome inmost cancer types [reviewed in (6)]. During the course of tumorprogression, the TAMpopulation shifts from being predominant-
ly an M1-like antitumoral phenotype toward an M2-like protu-moral phenotype [reviewed in (7)]. ProtumoralM2-Mfs suppresscytotoxic immune cells by secreting immune suppressive factors,such as TGFb and IL10 (8). On the other hand, M1-Mfs arethought to restrict tumor growth by secreting proinflammatoryfactors, such as IFNa/b and IFNg , TNFa, CXCL9, and CXCL10.These cytokines activate and recruit immune cells with antitu-moral properties, such as cytotoxic T cells and NK cells [reviewedin (9)]. Therefore, altering TAMs to acquire an antitumoral phe-notype is an attractive anticancer strategy.
In this study, we investigated the pleiotropic role of the tumorsuppressor SEMA3A in tumor immunity. SEMA3A binds to itsreceptor, neuropilin 1 (NP1), which in turn leads to activation ofthe Plexin A family (Plexin A1-4) signaling complex, whichtransmits SEMA3A-mediated downstream signals regulating cellsurvival, proliferation, and migration (10, 11). We and othershave shown that SEMA3A restricts tumor growth mainly byhampering tumor angiogenesis [reviewed in (12)]. However, therole of SEMA3A in tumor immunity remains poorly defined. Onone hand, SEMA3A is reported to recruit a subset of resident NP1-expressing monocytes (defined as CD11bþGr1�) that possessantitumoral properties (13). On the other hand, Casazza andcolleagues found that SEMA3A is specifically increased in hypoxicareas, where it entraps NP1-expressing Mfs, resulting in accumu-lation of protumoral Mfs that drive tumor progression (14).Altogether, these contradictory data prompted us to furtherexplore the role of SEMA3A in tumor immunity.
We show here that SEMA3A does not skew Mfs toward aspecific phenotype, rather it restricts M2-Mf proliferation whileenhancing M1-Mf proliferation. The differential regulationof M1- and M2-Mf proliferation in SEMA3A-treated tumors
1Department of Oncology-Pathology, Cancer Center Karolinska,Karolinska Institute, Stockholm, Sweden. 2Swiss Institute for Experi-
mental Cancer Research (ISREC), School of Life Sciences, �Ecole Poly-technique F�ed�erale de Lausanne (EPFL), Lausanne, Switzerland.3Department of Immunology, Genetics and Pathology, Science forLife Laboratory, Uppsala University, Uppsala, Sweden. 4Departmentof Clinical Pathology, Karolinska University Hospital, Stockholm,Sweden. 5Radiumhemmet, Karolinska University Hospital, Stockholm,Sweden. 6Department of Medicine Solna, Karolinska Institute, Stock-holm, Sweden.
Note: Supplementary data for this article are available at Cancer ResearchOnline (http://cancerres.aacrjournals.org/).
M. Wallerius and T. Wallmann contributed equally to this work.
Corresponding Author: Charlotte Rolny, Department of Oncology–Pathology,Cancer Center Karolinska, Karolinska Institute, SE-171 76, Stockholm 75185,Sweden. Phone: 46851776580; Fax: 46851777800; E-mail:[email protected]
doi: 10.1158/0008-5472.CAN-15-2596
�2016 American Association for Cancer Research.
CancerResearch
www.aacrjournals.org OF1
Research. on June 20, 2018. © 2016 American Association for Cancercancerres.aacrjournals.org Downloaded from
Published OnlineFirst April 6, 2016; DOI: 10.1158/0008-5472.CAN-15-2596

correlated with increased activity and recruitment of cytotoxiclymphocytes and NK cells, which consequently led to tumorgrowth inhibition. Until recently, it was believed that themajorityof Mfs involved in homeostasis and pathologic conditions arosefrom recruited bone marrow (BM)–derived monocytes (15).However, recent evidence suggests that under pathologic condi-tions, resident Mfs may proliferate, increasing the pool of tissueMfs as well as influencing their phenotype, thus dictating theoutcome of the disease (16–18). Therefore, we propose here thataltering the capacity of M1 andM2-Mf for proliferation is a novelmechanism whereby the overall TAM phenotype may be regu-lated in the context of cancer.
Materials and MethodsCell culture
4T1 tumor cells were grown in complete (supplemented with L-glutamine, penicillin/streptomycin, and 10% FBS) RPMI-1640(Gibco/Life Technologies). 4T1mousemammary carcinoma cellswere originally derived from a single spontaneous tumor thatarose in a BALB/cfC3H mouse, and were purchased from theKarmanos Cancer Institute at Wayne State University.
CD8þ T-cell activation and NK-cell cytotoxicity assayCD8þ T cells were cultured alone (control; CTR) or cocultured
withM1-/M2-Mfs� recombinantmurine SEMA3A (rmSEMA3A)or 4T1-CTR/4T1-3Aþ tumor–derived Mfs overnight (O/N),stained for IFNg , and analyzed by flow cytometry. NK cells werestimulated with conditioned medium from M1-/M2-Mfs �rmSEMA3A or were incubated in Transwell inserts above 4T1-CTR/4T1-3Aþ tumor–derived Mfs. The NK cells were then cocul-tured with 51Cr-labeled 4T1 target cells, and Cr release wasmeasured after 4 hours.
Lentiviral vectorsTumor cells were transduced with an empty lentivirus vector or
a murine SEMA3A-encoding vector, as described in ref. 19.
Animals and tumor modelsFemale BALB/c mice (4–6 weeks old) were purchased from
Charles River Laboratory. For SEMA3A overexpression tumori-genesis experiments, 2�1054T1 cellswere injected in a volumeof50 mL into the mammary fat pad of anesthetized animals. ForMatrigel tumorigenesis, 1 � 106 4T1 cells mixed with 1 mgrmSEMA3A in 2 mg/mL Matrigel (Corning) were injected in100 mL subcutaneously of anesthetized animals. Tumor size wasmeasured externally using calipers, and tumor volumes wereestimated using the following equation: V ¼ 4/3P � (d/2)2 �D/2, where d is the minor tumor axis and D is the major tumoraxis. Mice were typically euthanized 2 to 3 weeks after tumor cellinjection, and tumors were weighed after dissection. All ethicalpermits were obtained from the Swedish Board of Agriculture.
NK-cell/CD8þ T-cell/macrophage depletionMice were depleted of NK cells by i.p. injection of 25 mL anti-
asialoGM1(WakoChemicals) twice aweek for thedurationof theexperiment. BALB/c mice were depleted of CD8þ T cells by i.p.injection with 15mg/kg body weight of a rat anti-CD8a antibody(clone 53.6.72; BioXCell) twice a week. Mfs were depleted by i.p.injection with 20 mg/body weight of a rat anti-CSF1 antibody(clone 5A1; BioXCell) twice a week. As a control in all experi-ments, mice were given injections of an equivalent dose of anisotype control antibody.
ImmunofluorescenceTumor sections (10 mm) were stained for detection of NK
cells (anti-mouse CD49b; eBioscience) or CD8þ T cells (anti-mouse CD8a; BD Phamingen) to detect cytotoxic lymphocytes.In order to detect MAPK phosphorylation in M1 or M2-Mfs,tumor sections where stained for F4/80 (Serotec), MRC1 (R&DSystems) and p-MAPK (Cell Signaling Technology) or F4/80,CD11c (both from Serotec), and p-MAPK (Cell Signaling Tech-nology). Nuclei were stained with 40,6-diamidino-2-phenylin-dole (DAPI; Molecular Probes/Life Technologies). The sectionswere blocked with 10% donkey serum and incubated withprimary antibodies for 1.5 hours at room temperature. Afterwashing, the slides were incubated with the secondary anti-bodies for 1 hour at room temperature. Images were acquiredusing an LSM 700 confocal microscope and analyzed andquantified using ImageJ software.
Mf proliferationBM-derived Mfs were isolated as described below and plated
on 8-well chamber glass slides, polarized, and treated with rmSE-MA3A O/N as described below. BrdUrd was added to cultures 2hours prior to fixation with paraformaldehyde (PFA). Glassslides were treated with 1.5 mol/L HCl and 0.1 mol/L boratebuffer before staining. Glass slides were blocked with 10%donkey serum and incubated with antibodies for BrdUrd (BDBiosciences) and F4/80 (Serotec) for 1.5 hours at room temper-ature. After washing, the slides were incubated with the appro-priate secondary antibodies for 1 hour at room temperature.Images were acquired using an LSM 700 confocal microscopeand analyzed and quantified using ImageJ software.
BM-derived MfsBMprecursorswere acquiredbyflushing theBMfrom the femur
and tibia of 6- to 8-week-old female BALB/c mice. Cells werecultured in complete RPMI-1640medium supplemented with 50ng/mL M-CSF for 6 to 10 days (M0-Mfs). M0-BM–derived Mfswere treated for 4 hours with 100 ng/mL LPS and 200 units/mLIFNg to induce an M1-Mf phenotype, or 20 ng/mL IL4 and 10ng/mLTGFb for 4or 12hours to induce anM2-Mfphenotype. Foranalysis of the effect of SEMA3A on gene expression in M0-, M1-,andM2-Mfs,Mfs were incubated�rmSEMA3AO/N. Silencing ofNP1 was performed by lentivirus-mediated gene transfer with theshCTR and shNP1 vectors (shNP1: NM_008737.2-943s21c1;Sigma), as described in Supplementary Data.
ImmunohistochemistryFor immunohistochemistry, tissue microarrays (TMA) with
dual 1 mm cores were generated from 83 primary breast cancersdiagnosed and resected from 2011–2013 at KarolinskaUniversityHospital, Stockholm, Sweden. The establishment of a TMA plat-form was approved by Ethics Committee at the Karolinska Insti-tutet, and only patients who gave informed consent for biobank-ing were included. The TMA block was sectioned into 4-mmsections. Sections were treated with xylene O/N to remove par-affin, washed in ethanol (EtOH) and water, and then treated withan antigen retrieval agent before blocking nonspecific signals withPBS, 1%Triton, 10%donkey serum, and1%BSA for 1hour. Slideswere then incubated with a specific antibody for human SEMA3A(HPA029447, Human Protein Atlas, Uppsala University; SciLife)O/N followed by incubation with the appropriate horseradishperoxidase (HRP)–conjugated secondary antibody (DAKO). The
Wallerius et al.
Cancer Res; 76(11) June 1, 2016 Cancer ResearchOF2
Research. on June 20, 2018. © 2016 American Association for Cancercancerres.aacrjournals.org Downloaded from
Published OnlineFirst April 6, 2016; DOI: 10.1158/0008-5472.CAN-15-2596

slides were developed with diaminobenzidine (DAB) solution(Vector Laboratories) and counterstained with hematoxylin.Slides were mounted using a xylene-based mounting media[CytoSeal XYL (Thermo Fisher Scientific)].
Flow cytometryTo prevent nonspecific binding of irrelevant antibodies,
single-cell suspensions of tumors were preincubated withanti-CD16/32 mAb (BioLegend) on ice for 15 minutes beforea 30-minute incubation on ice with specific antibodies. Cellswere stained using the following antibodies for extracellularmarkers: CD11b (M1/70), CD45 (30-F11), Ly6C (AL-21), Ly6G(1A8), CD86 (GL1), CD11c (HL3), CD3 (500A2/145-2c11),CD8 (53-6.7), CD4 (RM4-5), CD69 (H1.2F3), CD49b (HMALPHA2), NK 1.1 (PK136), MHC class II (I-A/I-E), MHC class I(H-2K(d)), CD115 and CD80 (16-10A1; all from BD Biosci-ence), F4/80 (BM8) and MRC1 (C068C2; BioLegend), andNP1, CCR2, and Cx3CR1 (R&D Systems). For IFNg analysis,single-cell suspensions were stained with extracellular markersand then treated with Cytoperm/Cytofix reagents (BD Bio-sciences) and stained for IFNg according to the manufacturer'sinstructions. For BrdUrd incorporation analysis, staining wasperformed with the BrdUrd flow kit (BD Biosciences) accordingto the manufacturer's instructions. For in vivo analysis, BrdUrdwas injected i.p. 12 hours before sacrifice. The viability of cellswas verified using 7AAD or the Live/Dead fixable dead cell stain(Life Technologies). Samples were acquired with a LSR II (BDBiosciences) and analyzed using FlowJo software (Tree Star).
Quantitative PCRqPCRwasperformedusing TaqManUniversalMasterMix II and
TaqMan Gene Expression Assays (Applied Biosystems) in a totalvolume of 10 mL. The polymerase was activated at 95�C for 10minutes, and the PCRwas run in 40 cycles of denaturation at 95�Cfor 15 seconds and annealing/extension at 60�C for 60 seconds.TaqMan probes are listed in Supplementary Table S1. Geneexpression was normalized to levels of b-actin.
Western blot4T1-3Aþ and 4T1-CTR tumor cells were lysed in Nonidet P-40
(NP-40) lysis buffer with freshly added SIGMAFAST proteaseinhibitors (Sigma-Aldrich). BM-derived M1-Mfs and M2-Mfswere incubated � rmSEMA3A O/N and stimulated with 10 or50 ng/mL CSF1 for 10 minutes. Cells were lysed in lysis buffer[20 mmol/L Tris (pH 7.5), 150 mmol/L NaCl, 10 mmol/LEDTA, 0.5% Triton X-100, and 0.5% sodium deoxycholate]supplemented with protease inhibitors [20 mg/mL aprotinin, 1mmol/L sodium orthovanadate, and 1 mmol/L phenylmethyl-sulfonyl fluoride (PMSF); Sigma-Aldrich]. Protein concentrationwas determined by the bicinchoninic acid method (ThermoFisher Scientific) according to the manufacturer's instructions.Total lysates were subjected to electrophoresis on 10% or 4% to12% Bis-Tris gels and transferred onto Hybond-C extra mem-branes (Amersham Biosciences) or PVDF membranes (MerckMillipore). Membranes were probed with the indicated primaryantibodies against Sema3A (MBS472057; MyBioSource), HSP90(SC-13119; Santa Cruz Biotechnology), pAKT (9271; Cell Signal-ing Technology), total AKT (9272; Cell Signaling Technology),p-p44/42 MAPK (9101; Cell Signaling Technology), and totalp44/42 MAPK (9102; Cell Signaling Technology), followedby HRP-conjugated secondary antibodies (Life Technologies).
Membranes were then washed and visualized with an enhancedchemiluminescence detection system (GE Healthcare) andImageQuant LAS 4000 (GE Healthcare Life Science). Pixelswere quantified using ImageJ software (NIH).
ResultsSEMA3A expression is downregulated with the increasingdegree of malignancy in human breast cancer
SEMA3A expression is downregulated in various human can-cers, including epithelial ovarian, breast, gastric, and non–smallcell lung cancer compared with the respective normal tissue (20–23). Immunohistochemical staining of 83 breast cancer patientsamples with varying grades of malignancy (grade I and III ductalbreast cancer accounted for 39 patient samples) revealed thatSEMA3A expression is significantly downregulated in grade IIIductal breast carcinoma compared with grade I (Fig. 1A).
SEMA3A overexpression reduces tumor growth and increasesaccumulation of intratumoral M1-like Mfs
Because SEMA3A expression was lost in advanced breasttumors (grade III), the effect of SEMA3A on TAMs and breastcancer progression was examined in an experimental murinebreast cancer model using a gain-of-function approach. 4T1mammary tumor cells were transduced with a murine SEMA3Avector (4T1-3Aþ tumor cells), whereas cells transduced with anempty vector served as controls (4T1-CTR tumor cells). Trans-duction of the SEMA3A vector resulted in a 15-fold increase inSEMA3A mRNA (Fig. 1B) and a 13-fold increase in protein levels(Fig. 1C).Overexpression of SEMA3A in4T1 tumor cells increasedtheir proliferation rate in vitro, compared with CTR cells (Fig. 1D),which was associated with increased glycolytic rate (Supplemen-tary Fig. S1A and S1B) but similar oxygen consumption (Supple-mentary Fig. S1C and S1D). However, upon transplantation intothe mammary fat pad of BALB/c mice, 4T1-3Aþ tumors displayeda 61% decrease in volume (Fig. 1E) and a 60% decrease in weight(Fig. 1F) compared with 4T1-CTR tumors.
We next investigated the intratumoralmyeloid composition, astumor-infiltrating myeloid cells could be responsible for theSEMA3A-mediated tumor growth inhibition. Flow cytometryanalysis revealed that SEMA3A overexpression enhanced therecruitment of F4/80þ Mfs into 4T1 tumors (Fig. 1G and H).Because expansion of TAMs often correlates with increased tumorgrowth [reviewed in (1)], we reasoned that SEMA3Amight inhibittumor growth by altering the protumoral TAM phenotype. M2-Mfs are typically defined as CD11bþLy6G�Ly6ClowMHCIIlow
myeloid cells, whereas antitumoral M1-Mfs are defined asCD11bþLy6G�Ly6ClowMHCIIhighmyeloid cells (24, 25). Indeed,flow cytometry analysis showed a decrease in M2-like Mfs (Fig.2A, left lower quadrant, and B) and an increase in proinflamma-toryM1-likeMfs (Fig. 2A, right lower quadrant, andC)within theCD11bþLy6G�myeloid cell population in 4T1-3Aþ tumors com-pared with controls. Consistent with the above results, flowcytometry analysis revealed that F4/80þ Mfs derived from 4T1-3Aþ tumors displayed enhanced levels of M1-Mf markersinvolved in costimulation and antigen presentation [reviewed in(26)], including CD11c, CD86, MHC class I, and CD80 (Fig. 2D).In addition, the M2-Mf marker mannose receptor, c type 1(MRC1; ref. 24), was decreased in F4/80þ Mfs derived from4T1-3Aþ tumors compared with 4T1-CTR tumors (Fig. 2D). TheSEMA3A-mediated antitumoral Mf phenotype was confirmed by
SEMA3A Promotes Expansion of Antitumor Macrophages
www.aacrjournals.org Cancer Res; 76(11) June 1, 2016 OF3
Research. on June 20, 2018. © 2016 American Association for Cancercancerres.aacrjournals.org Downloaded from
Published OnlineFirst April 6, 2016; DOI: 10.1158/0008-5472.CAN-15-2596

qPCR analysis of flow-sorted CD11bþF4/80þ TAMs from 4T1-3Aþ and 4T1-CTR tumors. TAMs from 4T1-3Aþ tumors displayedenhanced transcript levels of cytokines and chemokines associ-ated with TH1 immune responses, including CXCL9 and CXCL10,IFNg , TNFa, IL12a, and IL6 (Fig. 2E; ref. 9), and adecrease in levelsof immune suppressive cytokines, such as TGFb1, CCL17, andIL10 (Fig. 2E; ref. 2). Importantly, 80% of CD11bþF4/80þ TAMsexpressed NP1, and the expression of NP1 was not modified bySEMA3A overexpression (data not shown).
We next investigated whether SEMA3A altered the pheno-type of intratumoral or circulating monocytes. Intriguingly,even though SEMA3A overexpression caused a slight butnonsignificant increase in total intratumoral CD11bþLy6Cþ
monocytic cells (Supplementary Fig. S2A), it did not affectthe gene signature of these cells (Fig. 2F). Further, SEMA3Adid not modify the frequency of circulating nonclassical(CX3CR1
þCD115þCD11bþ; Supplementary Fig. S2C) or clas-sical (CCR2þCD115þCD11bþ; Supplementary Fig. S2B)monocytes. In sum, these data indicate that SEMA3A did not
significantly alter the representation of monocyte subsets ineither circulation or tumors; therefore, effects on monocytesare unlikely to be responsible for the observed accumulationof M1-Mfs in 4T1-3Aþ tumors. In addition, SEMA3A over-expression did not detectably alter the tumor cell–derivedexpression of cytokines or chemokines that could be respon-sible for the accumulation of M1-like Mfs, as shown by qPCRon flow-sorted GFPþ tumor cells from 4T1-3Aþ and 4T1-CTRtumors (Fig. 2G). Consistently, rmSEMA3A imbedded inMatrigel together with 4T1 tumor cells resulted in hamperingof tumor volume (Supplementary Fig. S2F) and weight (Sup-plementary Fig. S2G), decreased accumulation of M2-like Mfs(Supplementary Fig. S2H and S2I), and increased accumula-tion of M1-like Mfs (Supplementary Fig. S2H and S2J) similarto what was observed for 4T1-3Aþ tumors.
Further evidence that SEMA3A may affect the Mf phenotypewas obtained in human breast cancer using gene expression datafrom the previously published Uppsala breast cancer cohort of253 patients. In line with the above mouse data, SEMA3A gene
Figure 1.SEMA3A reduces tumor growth and induces accumulation of Mfs. A, immunohistochemistry for SEMA3A protein expression on TMAs consisting of samples from 39patients with grade I or III ductal breast cancer. SEMA3A scoring was performed on a scale of 0 to 3, where 3 indicates the highest expression of SEMA3Aand 0 indicates the lowest expression of SEMA3A. Results from all patients are shown (� , P < 0.05). Scale bars, 50 mm. B and C, 4T1 tumor cells were transducedwith SEMA3A or a control vector. SEMA3A expression was quantified by qPCR (B) or Western blot analysis (C). qPCR data are normalized to b-actin andWestern blot to HSP90. Data are presented as the fold change relative to control for both cases (�� , P < 0.01). D, 4T1-3Aþ and 4T1-CTR tumor cells were cultured for3 days under normal condition. An XTT proliferation assay was performed to evaluate tumor cell proliferation. Each time point represents the mean of sixreplicatesþ the SD (���� , P < 0.0001). E and F, 4T1-3Aþ and 4T1-CTR tumor cells were injected into the mammary fat pad of BALB/cmice. Graphs display the tumorvolume (E) and tumorweight (n¼ 7; � ,P <0.05; ��� , P <0.001; ���� , P <0.0001; F). G andH, 4T1-3Aþ and 4T1-CTR tumorswere subjected to flow cytometry. G, gatingstrategies for F4/80þ Mfs. Numbers indicate the percentage of cells in the gate out of all CD11bþ cells. H, graphs showing the quantification of F4/80þ cellsfrom 4T1-3Aþ and 4T1-CTR tumors (n ¼ 6; � , P < 0.05). All data represent one out of three independent experiments and are presented as the mean þ SD.
Wallerius et al.
Cancer Res; 76(11) June 1, 2016 Cancer ResearchOF4
Research. on June 20, 2018. © 2016 American Association for Cancercancerres.aacrjournals.org Downloaded from
Published OnlineFirst April 6, 2016; DOI: 10.1158/0008-5472.CAN-15-2596

expression indeed correlatedwith bothCD80 (Fig. 2H) andCD86gene expressions (Fig. 2I).
Accumulation of cytotoxic lymphocytes regulates SEMA3A-mediated tumor growth inhibition
Because Mfs residing within 4T1-3Aþ tumors expressed cyto-kines associated with recruitment and activation of cytotoxic
lymphocytes, we evaluated the effect of SEMA3A overexpressionon tumor infiltration by cytotoxic lymphocytes. Flow cytometryanalysis showed that 4T1-3Aþ tumors displayed an increase inCD3þ T cells (Fig. 3A) and CD49bþ NK cells (Fig. 3B) comparedwith control tumors. A high ratio of CD8þ T cells to CD4þ T cellscorrelates with increased survival in breast cancer and othertumor types, including colon cancer (27, 28). Accordingly, flow
Figure 2.4T1-3Aþ tumors display an increase of M1-like Mfs. A–C, 4T1-3Aþ and 4T1-CTR tumors were analyzed by flow cytometry. A, dot plots display (1) MHCIIlowLy6Chigh
monocytes, (2) immature MHCIIlowLy6Cintermediate, (3) immature MHCIIhighLy6Chigh/intermediate, (4) protumoral M2- (Ly6ClowMHCIIlow), and (5) antitumoral M1-(Ly6ClowMHCIIhigh) Mfs gated from CD11bþLy6G� cells from representative 4T1-3Aþ and 4T1-CTR tumors. Graphs display quantification of M2-Mfs (B) andM1-Mfs (n¼ 7; � , P < 0.05; �� , P < 0.01; C). D, CD11bþF4/80þ Mfs from 4T1-3Aþ and 4T1-CTR tumors were analyzed by flow cytometry for the antigen-presentationactivation surface markers CD11c, CD86, MHC class I, and CD80 and the M2-marker MRC1 (n ¼ 7; � , P < 0.05; �� , P < 0.01). E and F, total RNA was extractedfrom flow-sorted CD11bþF4/80þMfs (E) and CD11bþLy6Cþmonocytes (F). Expression of the indicated cytokines and chemokines wasmeasured by qPCR. All levelswere normalized to b-actin and are presented as the fold change in expression compared with CTR (n ¼ 7; � , P < 0.05; �� , P < 0.01; ��� , P < 0.001). G, GFPþ
tumor cells were flow-sorted from 4T1-3Aþ-GFPþ tumors and 4T1-CTR-GFPþ tumors, and gene expression was evaluated by qPCR. Expression levels werenormalized to b-actin and presented as the fold change comparedwith CTR (n¼ 5; � , P < 0.05). H and I, Affymetrix probes corresponding to the SEMA3A, CD80, andCD86 genes were extracted from the publicly available Uppsala dataset (n ¼ 253), and a Spearman rank correlation was performed. H, SEMA3A vs. CD80;Spearman rho¼0.42,P <0.012. I, SEMA3A vs.CD86; Spearman rho¼0.24,P <0.001. All data represent one out of three independent experiments and are presentedas the mean þ SD.
SEMA3A Promotes Expansion of Antitumor Macrophages
www.aacrjournals.org Cancer Res; 76(11) June 1, 2016 OF5
Research. on June 20, 2018. © 2016 American Association for Cancercancerres.aacrjournals.org Downloaded from
Published OnlineFirst April 6, 2016; DOI: 10.1158/0008-5472.CAN-15-2596

Figure 3.4T1-3Aþ tumors show accumulation of CD8þT cells and CD49bþNK cells. A and B, flow cytometry analyses for the percentage of CD3þ T cells (A) and CD49bþNK (B)cells out of all CD45þ cells in 4T1-3Aþ and 4T1-CTR tumors (n ¼ 7 and n ¼ 6, respectively; �� , P < 0.01). C and D, 4T1-3Aþ and 4T1-CTR tumors were analyzed forCD8þ T-cell (C) and CD4þ T-cell (D) accumulation by flow cytometry (n¼ 7; �� , P <0.01). Numbers indicate the percentage of cells in the gate out of all CD3þ cells. E,graph shows the ratio between CD8þ T cells and CD4þ T cells out of the total CD3þ T cell population in 4T1-3Aþ and 4T1-CTR tumors (n ¼ 7; �� , P < 0.01). F–I,immunofluorescent staining of 4T1-3Aþ and 4T1-CTR tumor sections for CD8þ T cells (red) and nuclei (blue; F) and CD49bþ NK cells (n ¼ 5; � , P < 0.05and n¼ 4; ���� , P < 0.0001, respectively; H). Scale bars, 200 and 50 mm, respectively. J–O, Affymetrix probes corresponding to SEMA3A, to the T-cell–specific genesCD8A and CD8B, and to the NK-cell–specific genes KLRD1, NCR2, NCR3, and CRTRAM (CD94, CD136, CD137, and CD135, respectively) were extractedfrom the publicly available Uppsala dataset (n¼ 253), and a Spearman rank correlation was performed. J–O, SEMA3A vs. CD8A (Spearman rho¼ 0.25, P < 0.001; J),SEMA3A vs. CD8B (rho ¼ 0.4, P < 0.001; K), SEMA3A vs. KLRD1 (rho ¼ 0.42, P < 0.001; L), SEMA3A vs. NCR2 (rho ¼ 0.46, P < 0.001; M), SEMA3A vs.NCR3 (rho ¼ 0.35, P < 0.001; N), and SEMA3A vs. CRTAM (rho ¼ 0.46, P < 0.001; O). Data represent one out of three (A–E) or two (F–I) independent experimentsand are presented as the mean þ SD.
Wallerius et al.
Cancer Res; 76(11) June 1, 2016 Cancer ResearchOF6
Research. on June 20, 2018. © 2016 American Association for Cancercancerres.aacrjournals.org Downloaded from
Published OnlineFirst April 6, 2016; DOI: 10.1158/0008-5472.CAN-15-2596

cytometry analysis showed an increased proportion of CD8þ Tcells (Fig. 3C and E) within the total CD3þ T-cell population,whereas the proportion of CD4þ T cells (Fig. 3D and E) decreasedin 4T1-3Aþ tumors compared with controls. The increase in totalCD3þ T cells in response to SEMA3A was due to enhancedaccumulation of CD8þ T cells within the CD45þ population(Supplementary Fig. S3A). CD4þ T cells were unaffected bySEMA3A expression (Supplementary Fig. S3B). Immunofluores-cence staining of tumor sections confirmed the increase inCD8þ Tcells (Fig. 3F and G) and CD49bþNK cells (Fig. 3H and I) in 4T1-3Aþ tumors compared with controls. Also, rmSEMA3A imbeddedin Matrigel together with 4T1 tumor cells ensued a high ratio ofCD8þ T cells to CD4þ T cells (Supplementary Fig. S3C) andaccumulation of CD49bþ NK cells (Supplementary Fig. S3D).The correlation between SEMA3A expression andCD8þ T-cell andNK-cell infiltrationwas next examined in the humanbreast cancercohort described above. Consistent with the data obtained in theexperimental model, SEMA3A gene expression correlated withCD8þ T- and NK-cell–specific genes in the human breast cancercohort of 253 patients, including CD8A (Fig. 3J), CD8B (Fig. 3K),KLRD1 (CD94; Fig. 3L), NCR2 (CD336; Fig. 3M), NCR3(CD337; Fig. 3N), and CRTAM (CD335; Fig. 3O).
In some circumstances, cytotoxic lymphocytes accumulate inthe tumor but are inactivated by factors within the tumor micro-environment, as evidenced by their reduced expression of IFNgandCD69. The effect of SEMA3Aexpression on the suppression ofintratumoral lymphocytes was therefore examined. Both CD8þ Tcells (Fig. 4A, B, and E–G) andNK cells (Fig. 4C,D, andH–J) from4T1-3Aþ tumors displayed enhanced levels of IFNg and increasedexpression of the activation marker CD69 (Fig. 4A–D and E–J,respectively) compared with controls. To determine if thesecytotoxic lymphocytes could account for SEMA3A-mediatedtumor growth inhibition, anti-CD8 (depletes CD8þ T cells) oranti-asialo GM1 (depletes NK cells) antibodies were administrat-ed to 4T1-3Aþ and 4T1-CTR tumor–bearing mice. Depletion ofCD8þ T cells (Fig. 4K) or NK cells (Fig. 4L) increased the 4T1-3Aþ
tumor burden by 2.11-fold and 1.7-fold, respectively, comparedwith 4T1-3Aþ tumors treated with isotype control antibodies(Fig. 4K and L). By contrast, 4T1-CTR tumors treated with anti-CD8 (Fig. 4K) or anti-asialoGM1 (Fig. 4L) increased only by 1.10-fold compared with 4T1-CTR tumors treated with isotypecontrol antibodies (Fig. 4K and L). Together, these results indicatethat both cytotoxic lymphocytes and NK cells are involved inSEMA3A-mediated tumor growth inhibition.
SEMA3A-mediated induction of antitumorCD8þ T cells andNKcells is dependent on Mfs
To determine whether SEMA3A has a direct effect on activationof CD8þ T cells and NK cells or if the observed effects aredependent on SEMA3A-mediated accumulation of intratumoralM1-Mfs, a set of ex vivo coculture experiments was performed.M1(LPS- and IFNg-treated) or M2 (IL4- and TGFb-treated) BMDMsexposed to rmSEMA3A were cocultured with CD8þ T cells orCD49bþ NK cells isolated from the spleens of na€�ve mice. Theeffect of SEMA3AonCD8þ T cells was investigated first. CocultureofM1-BMDMswithCD8þT cells increased the number ofCD8þTcells that produced IFNg , which was further increased uponaddition of rmSEMA3A (Fig. 5A). By contrast, M2-polarizedBMDMs suppressed the ability of CD8þ T cells to produce IFNg ;SEMA3A treatment partially reversed this inhibition (Fig. 5A).Importantly, SEMA3A had no direct effect on CD8þ T-cell acti-
vation. To determine whether intratumoral Mfs derived fromSEMA3A-overexpressing tumors could similarly potentiate CD8þ
T-cell activation, F4/80þMfs were flow-sorted from 4T1-CTR and4T1-3Aþ tumors and cocultured with splenic CD8þ T cells fromthe same tumor-bearingmice. Flow-sorted F4/80þMfs from 4T1-3Aþ tumors did indeed increase theproportionofCD8þT cell thatexpressed IFNg . In contrast, flow-sorted F4/80þMfs from controltumors reduced the CD8þ T cells that expressed IFNg (Fig. 5B).
We next examined the effect of SEMA3A on NK-cell–mediatedkilling of 4T1 cancer cells using a chromium release assay. Con-sistent with the above findings, M1-BMDMs enhanced NK-cellkilling of 4T1 tumor cells; this effect was further augmented bypretreatment of M1-BMDMs with SEMA3A (Fig. 5C). In contrast,M2-BMDMs suppressed NK-cell killing (Fig. 5D), and pretreat-ment of M2-BMDMs with SEMA3A reduced their ability tosuppress NK-cell–mediated killing of 4T1 cells (Fig. 5D). Inaddition, F4/80þ Mfs sorted from 4T1-3Aþ tumors significantlyboosted the capacity of na€�ve NK cells to kill 4T1 cells comparedwith NK cells cultured alone or cocultured with Mfs sorted from4T1-CTR tumors (Fig. 5E). Of note, NK-cell killing of 4T1-3Aþ
tumor cells was not increased compared with NK-cell killing of4T1-CTR tumor cells in vitro (Fig. 5F). Altogether, these resultsindicate that SEMA3A, either added as a soluble factor or over-expressed by tumor cells, enhances the capacity of Mfs to activateCD8þ T cells and NK cells.
To further investigate whether the accumulation of T and NKcells in 4T1-3Aþ tumors was regulated byMfs, 4T1-3Aþ and 4T1-CTR tumor–bearing mice were depleted of Mfs with an a-CSF1antibody (Supplementary Fig. S4A; ref. 27). Administration of thea-CSF1 antibody to tumor-bearing mice increased 4T1-3Aþ
tumor growth by 2.5-fold comparedwith 4T1-3Aþ tumors treatedwith an isotype control (Fig. 5G), whereas depletion of Mfs didnot significantly affect control tumor growth, as previously shown(27). Interestingly, depletion of Mfs in 4T1-3Aþ tumors blockedthe effect of SEMA3A on CD8þ T-cell (Fig. 5H) and NK-cell (Fig.5I) infiltration into the tumor. By contrast, CD8þ T-cell and NK-cell infiltration of 4T1-CTR tumors was unaffected. These resultsindicate that the M1-like Mf population within 4T1-3Aþ tumorsinduces tumor infiltration by lymphocytes and enhances theirability to kill tumor cells.
SEMA3A differentially regulates M1- and M2-Mf proliferationWenext investigatedwhether SEMA3Ahad a direct effect onMf
education toward an M1 phenotype. Surprisingly, SEMA3A didnot affect the differentiation of unpolarized (M0) BMDMs towardan M1- or M2-like phenotype, as determined by qPCR for typicalM1 and M2 genes (Supplementary Fig. S5A–S5L). SEMA3A alsofailed to affect the gene signature of M1- or M2-educated BMDMsex vivo (Supplementary Fig. S5A–S5L). We next performed awound-healing assay using M0-, M1-, or M2-skewed Mfs todetermine whether SEMA3A affected their migration, whichmight account for the observed accumulation of M1-like Mfs in4T1-3Aþ tumors. Interestingly, SEMA3Adid stimulateM0-BMDMmigration but did not affect the migration of M1- or M2-BMDMs(Fig. 6A and B). In sum, these results suggest that SEMA3A doesnot control Mf differentiation toward an M1 phenotype orinfluence the migratory capacity of M1-Mfs.
Intriguingly, recent data indicate that local expansion of resi-dent Mfs or BMDMs controls the phenotype of Mfs at inflam-matory sites, including tumors (16, 17, 29). We then assessed theimpact of SEMA3A on M1-Mf proliferation. In fact, treatment
SEMA3A Promotes Expansion of Antitumor Macrophages
www.aacrjournals.org Cancer Res; 76(11) June 1, 2016 OF7
Research. on June 20, 2018. © 2016 American Association for Cancercancerres.aacrjournals.org Downloaded from
Published OnlineFirst April 6, 2016; DOI: 10.1158/0008-5472.CAN-15-2596
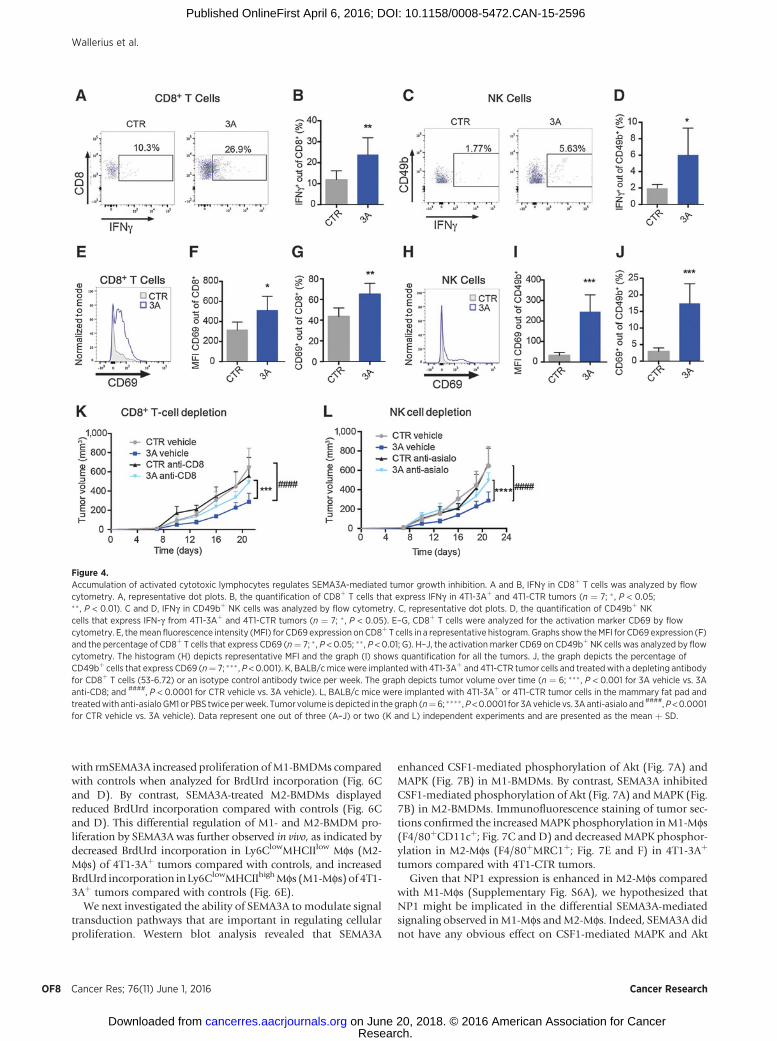
with rmSEMA3A increased proliferation ofM1-BMDMs comparedwith controls when analyzed for BrdUrd incorporation (Fig. 6Cand D). By contrast, SEMA3A-treated M2-BMDMs displayedreduced BrdUrd incorporation compared with controls (Fig. 6Cand D). This differential regulation of M1- and M2-BMDM pro-liferation by SEMA3A was further observed in vivo, as indicated bydecreased BrdUrd incorporation in Ly6ClowMHCIIlow Mfs (M2-Mfs) of 4T1-3Aþ tumors compared with controls, and increasedBrdUrd incorporation inLy6ClowMHCIIhighMfs (M1-Mfs)of 4T1-3Aþ tumors compared with controls (Fig. 6E).
We next investigated the ability of SEMA3A to modulate signaltransduction pathways that are important in regulating cellularproliferation. Western blot analysis revealed that SEMA3A
enhanced CSF1-mediated phosphorylation of Akt (Fig. 7A) andMAPK (Fig. 7B) in M1-BMDMs. By contrast, SEMA3A inhibitedCSF1-mediated phosphorylation of Akt (Fig. 7A) andMAPK (Fig.7B) in M2-BMDMs. Immunofluorescence staining of tumor sec-tions confirmed the increasedMAPK phosphorylation inM1-Mfs(F4/80þCD11cþ; Fig. 7C and D) and decreased MAPK phosphor-ylation in M2-Mfs (F4/80þMRC1þ; Fig. 7E and F) in 4T1-3Aþ
tumors compared with 4T1-CTR tumors.Given that NP1 expression is enhanced in M2-Mfs compared
with M1-Mfs (Supplementary Fig. S6A), we hypothesized thatNP1 might be implicated in the differential SEMA3A-mediatedsignaling observed inM1-Mfs andM2-Mfs. Indeed, SEMA3A didnot have any obvious effect on CSF1-mediated MAPK and Akt
Figure 4.Accumulation of activated cytotoxic lymphocytes regulates SEMA3A-mediated tumor growth inhibition. A and B, IFNg in CD8þ T cells was analyzed by flowcytometry. A, representative dot plots. B, the quantification of CD8þ T cells that express IFNg in 4T1-3Aþ and 4T1-CTR tumors (n ¼ 7; � , P < 0.05;�� , P < 0.01). C and D, IFNg in CD49bþ NK cells was analyzed by flow cytometry. C, representative dot plots. D, the quantification of CD49bþ NKcells that express IFN-g from 4T1-3Aþ and 4T1-CTR tumors (n ¼ 7; � , P < 0.05). E–G, CD8þ T cells were analyzed for the activation marker CD69 by flowcytometry. E, themean fluorescence intensity (MFI) for CD69 expression onCD8þT cells in a representative histogram. Graphs show theMFI for CD69 expression (F)and the percentage of CD8þ T cells that express CD69 (n¼ 7; � , P < 0.05; �� , P < 0.01; G). H–J, the activation marker CD69 on CD49bþNK cells was analyzed by flowcytometry. The histogram (H) depicts representative MFI and the graph (I) shows quantification for all the tumors. J, the graph depicts the percentage ofCD49bþ cells that express CD69 (n¼ 7; ��� , P < 0.001). K, BALB/cmicewere implantedwith 4T1-3Aþ and 4T1-CTR tumor cells and treated with a depleting antibodyfor CD8þ T cells (53-6.72) or an isotype control antibody twice per week. The graph depicts tumor volume over time (n ¼ 6; ��� , P < 0.001 for 3A vehicle vs. 3Aanti-CD8; and ####, P < 0.0001 for CTR vehicle vs. 3A vehicle). L, BALB/c mice were implanted with 4T1-3Aþ or 4T1-CTR tumor cells in the mammary fat pad andtreatedwith anti-asialoGM1 or PBS twice perweek. Tumor volume is depicted in the graph (n¼6; ���� ,P<0.0001 for 3Avehicle vs. 3A anti-asialo and ####,P<0.0001for CTR vehicle vs. 3A vehicle). Data represent one out of three (A–J) or two (K and L) independent experiments and are presented as the mean þ SD.
Wallerius et al.
Cancer Res; 76(11) June 1, 2016 Cancer ResearchOF8
Research. on June 20, 2018. © 2016 American Association for Cancercancerres.aacrjournals.org Downloaded from
Published OnlineFirst April 6, 2016; DOI: 10.1158/0008-5472.CAN-15-2596

phosphorylation in M1-BMDMs (Fig. 7G and H) or M2-BMDMs(Fig. 7I and J) in which NP1 was silenced by lentiviral-mediatedknockdown (shNP1). Interestingly, in CSF1-stimulated M1-BMDMs, NP1 silencing alone enhanced Akt (Fig. 7G) and MAPK(Fig. 7H) phosphorylation by 2.2-fold and 3.0-fold, respectively.Reciprocally, NP1 silencing in M2-BMDMs mimicked the effectsof SEMA3A on Akt (Fig. 7I) andMAPK (Fig. 7J) phosphorylation.Thus, SEMA3A augmented MAPK signaling, Akt signaling, andproliferation of M1-BMDMs, but restricted MAPK signaling, Aktsignaling, and proliferation of M2-BMDMs.
DiscussionCompelling evidence links accumulation of TAMs in breast
cancer to poor prognosis, malignancy, and tumor progression(27, 30, 31). Preclinical studies depleting TAMs as an anticancerstrategy have shown promising results in murine models ofspontaneous breast cancer and orthotopic murine breast carci-noma (3, 27, 32). However, many questions remain as to howthe tumor-promoting phenotype of TAMs is generated andmaintained.
Figure 5.SEMA3A-mediated activation of CD8þTcells andNKcells is dependent onMfS. A, CD8þT cells purified from the spleens of na€�vemicewere coculturedwith orwithoutBMDMs polarized to an M1 or an M2 phenotype �rmSEMA3A. IFNg-producing CD8þ T cells were analyzed by flow cytometry (n ¼ 3; � , P < 0.05; �� , P < 0.01).B, CD8þ T cells were purified from the spleens of 4T1-CTR or 4T1-3Aþ tumor–bearing mice and cultured alone or cocultured with Mfs flow-sorted fromrespective tumor. IFNg-producing CD8þ T cellswere analyzed by flow cytometry (n¼ 3; � ,P <0.05). C andD, splenic NK cellswere seeded in 0.4 mmtranswell insertsplaced in a 12-well plate seeded with M1 (C)- or M2 (D)-polarized BMDMs � rmSEMA3A. Tumor cell lysis was analyzed by measuring the chromium releasewith a gamma counter (n¼ 3; � , NKþM1/M2 vs. NKþ3AM1/M2; #, NKþ3A vs. NKþ3AM1/M2; andþ, NK vs. NKþM1/M2). E, NK cells purified from the spleens of na€�vemice were cultured alone or cocultured with F4/80þMfs flow-sorted from 4T1-CTR or 4T1-3Aþ tumors as described above. Tumor cell lysis was analyzed bymeasuring the chromium release with a gamma counter (n ¼ 3; � , P < 0.05 for NK cells þ CTR-Mfs vs. NK cells þ 3A-Mfs; ##, P < 0.01 for NK cells vs. NKcellsþ3A-Mfs). F, NK cells purified from the spleens of na€�vemicewere culturedwith 4T1-CTRor 4T1-3Aþ tumor cells. Tumor cell lysiswas analyzedbymeasuring thechromium release with a gamma counter (n ¼ 3). G–I, 4T1-3Aþ and 4T1-CTR tumor–bearing mice were treated with a neutralizing antibody against CSF1(5A1) to deplete Mfs. G, the graph displays tumor volume over time (n ¼ 7; ���� , P < 0.0001 for 3A vehicle vs. 3A anti-CSF1; ####, P < 0.0001 for CTR vehicle vs. 3Avehicle). Histograms show the flow cytometric quantification of CD8þ T cells (H) and NK cells (I) in 4T1-3Aþ and 4T1-CTR tumor–bearing mice treated with5A1 (n¼ 7; � , CTR vehicle vs. 3Avehicle; #, 3Avehicle vs. 3A anti-CSF1). Data represent one out of three (A, C, D, andF) or two (B, E, andG–I) independent experimentsand are presented as the mean þ SD.
SEMA3A Promotes Expansion of Antitumor Macrophages
www.aacrjournals.org Cancer Res; 76(11) June 1, 2016 OF9
Research. on June 20, 2018. © 2016 American Association for Cancercancerres.aacrjournals.org Downloaded from
Published OnlineFirst April 6, 2016; DOI: 10.1158/0008-5472.CAN-15-2596
Recent evidence suggests that most tissue-resident Mfsthroughout the body originate during embryonic/fetal develop-ment rather than being derived from adult circulatingmonocytes,and are in part maintained through local proliferation (15). Inpathologic conditions such as atherosclerosis, local Mf prolifer-ation is essential to renew theMfpopulation andmayalter theMfphenotype (16). For instance, in a model of rodent filarial nem-atode Litomosoides sigmodontis infection, an overall TH2-inflam-matory response mediates the local self-renewal of M2-Mfs viaIL4 (17). In addition, tumor cell–derived CSF1 production fostersthe local proliferationof intratumoralMfs,which accounts for theexpansion of TAMs in breast carcinoma (18). Interestingly,SEMA3A boosted CSF1-mediated M1-BMDM proliferation invitro, which resulted in increasedMAPK and Akt phosphorylation.However, inM2-BMDMs, SEMA3A restricted CSF1-regulated pro-liferation and reduced the activation of MAPK and Akt. This effectwas regulated by NP1, since SEMA3A lost its effect on MAPK andAkt phosphorylation in M1- or M2-BMDMs in which NP1 hadbeen silenced. Intriguingly, NP1 silencing per se mimicked theeffect of SEMA3A on Akt andMAPK phosphorylation in bothM1-andM2-BMDMs. It is possible that SEMA3A blocks different NP1receptor complexes in M1- and M2-Mfs, which partially dependon the NP1 expression levels, thereby resulting in the differentialregulation of M1- and M2-BMDM proliferation.
The SEMA3A-mediated differential regulation of M1-and M2-Mf proliferation and regulation of MAPK phosphorylationobserved in vitro was also observed in the experimental 4T1mammary tumor model. Intratumoral Mfs derived fromSEMA3Aþ tumors displayed a potentially immunostimulatory/antitumoral phenotype, as evidenced by increased expressionof surfacemarkers that are present on activated antigen-presentingcells, including MHC class II, MHC class I, CD11c, CD86, andCD80. The correlation between SEMA3A expression and accu-mulation of M1-Mfs was also evident in patient material, wherethe SEMA3A gene expression was correlated with the gene expres-sion of CD80 and CD86, markers associated with M1-Mfs.Moreover, SEMA3A-derived intratumoral Mfs displayedenhanced levels of the proinflammatory cytokines IFNg , IL6,TNFa, CXCL9, and CXCL10 and decreased levels of the immunesuppressive factors TGFb and CCL17. CXCL9 and CXCL10 areunswervingly described as antitumoral because of their abilityto activate and recruit NK cells and CD8þ T cells in both murinemodels (33–35) as well as in human patients; therefore,their expression correlates with good prognosis (28, 36). Eventhough IL6 and TNFa are often associatedwith tumor progression(37, 38), they are also considered classical proinflammatorycytokines that can promote CD8þ T-cell proliferation and acti-vation (39–41). All considered, these M1-like Mfs displayed
Figure 6.SEMA3A enhances M1-Mf proliferation, whereas M2-Mf proliferation is decreased. A, pictograms display M0-BMDMs cultured in a monolayer � rmSEMA3A, andthe migration of cells into a scratch was measured after 24 and 48 hours (n ¼ 3). B, graphs display quantification of migrated M0-, M1-, and M2-BMDMs� rmSEMA3A. Scale bars, 200 mm. C, M1- and M2-polarized BMDMs � rmSEMA3A were stained for BrdUrd (green) and F4/80 antigen (red) to measure Mfproliferation. Quantification is shown in D (n ¼ 4; � , P < 0.05). Scale bars, 50 mm. E, BrdUrd incorporation in M1- (CD11bþLy6G�Ly6ClowMHCIIhigh) andM2- (CD11bþLy6G�Ly6ClowMHCIIlow) Mfs in 4T1-3Aþ and 4T1-CTR tumors analyzed by flow cytometry (n ¼ 7; � , P < 0.05). All data represent one out of threeindependent experiments and are presented as the mean þ SD.
Cancer Res; 76(11) June 1, 2016 Cancer ResearchOF10
Wallerius et al.
Research. on June 20, 2018. © 2016 American Association for Cancercancerres.aacrjournals.org Downloaded from
Published OnlineFirst April 6, 2016; DOI: 10.1158/0008-5472.CAN-15-2596

Figure 7.SEMA3A-mediated differential regulation of M1-Mf and M2-Mf proliferation is NP1-dependent. A and B,Western blot analysis of Akt (A) and MAPK phosphorylationof M1- and M2-polarized BMDMs treated �rmSEMA3A and �CSF1 (B). Data are normalized to b-actin and presented as the fold change relative to CSF1-stimulated CTR-treated Mfs. C–F, 4T1-3Aþ and 4T1-CTR tumor sections were stained for M1-Mfs (F4/80, blue; CD11c, red; phospho-MAPK, green; C) or M2-Mfs (F4/80, blue; MRC1, red; phospho-MAPK, green; E). Graphs display quantifications of MAPK phosphorylation in M1- (D) and M2-Mfs (n ¼ 6; �� , P < 0.01;���� , P < 0.0001; F). Scale bars, 20 mm. G–J, BMDMs were transduced with a control shRNA (shCTR) or an shRNA against NP1 (shNP1). Western blot analysisof Akt (G and I) and MAPK phosphorylation (H and J) of M1- (G and H) and M2-polarized BMDMs treated �rmSEMA3A and �CSF1 (I and J). Data arenormalized to b-actin and presented as the fold change relative to shCTR CSF1-stimulated CTR-treated BMDMs. All data represent one out of two (C–F) orthree (A, B, and G–J) independent experiments and are presented as the mean þ SD.
www.aacrjournals.org Cancer Res; 76(11) June 1, 2016 OF11
SEMA3A Promotes Expansion of Antitumor Macrophages
Research. on June 20, 2018. © 2016 American Association for Cancercancerres.aacrjournals.org Downloaded from
Published OnlineFirst April 6, 2016; DOI: 10.1158/0008-5472.CAN-15-2596

features that could potentially activate and recruit CD8þ T andNKcells. Indeed, by depleting Mfs, we could show that SEMA3A-mediated tumor growth inhibition was dependent on the intra-tumoral Mf phenotype, which in turn controlled the recruitmentof cytotoxic lymphocytes. Importantly, the depletion of Mf cellsleading to reduced recruitment of CD8þ T cells and NK cells alsonegated the inhibitory effect of SEMA3A on tumor growth.Consistent with previous work, depletion of Mfs did not signif-icantly affect tumor growth (3, 27, 32). One explanation could bethat the depletion of macrophages with the ant-CSF1 is notsufficient in order to activate cytotoxic T cells and NK cells thatwill in turn kill the tumor cells. Importantly, SEMA3Adidnot havea direct effect on neither CD8þ T- nor NK-cell activation, in linewith that only 1% of intratumoral and splenocytic CD8þ T andNK cells express NP1 (data not shown).
Finally, direct injection of SEMA3A into the tumor micro-environment efficiently mimicked the effects of tumor cell–derived overexpression of SEMA3A on the microenvironmentin terms of restricting tumor growth accompanied withincreased accumulation of M1-Mfs, cytotoxic T cells and NKcells, indicating that SEMA3A could potentially be used astheoretical anticancer tool.
In conclusion, we propose that SEMA3A-mediated selectiveexpansion ofM1-likeMfs could overcome the immune suppressivefeatures of the tumor microenvironment and stimulate activationand recruitment of cytotoxic lymphocytes. Supporting SEMA3Asignaling thus appears as a novel potential cancer treatment.
Disclosure of Potential Conflicts of InterestNo potential conflicts of interest were disclosed.
Authors' ContributionsConception and design: M. Wallerius, T. Wallmann, C. Rolny
Development of methodology: M. Wallerius, T. Wallmann, J. €Ostling,P. Pangigadde, J. Hartman, J. Bergh, C. RolnyAcquisition of data (provided animals, acquired and managed patients,provided facilities, etc.): M. Wallerius, T. Wallmann, M. Bartish, J. €Ostling,
N.P. Tobin, E. Nygren, P. Pangigadde, P. Pellegrini, M.L. Squadrito, F. Pont�en,J. Hartman, J. Bergh, A. De Milito, M. De Palma, J. Andersson, C. RolnyAnalysis and interpretation of data (e.g., statistical analysis, biostatistics,computational analysis):M.Wallerius, T.Wallmann, J. €Ostling, A.Mezheyeuski,
N.P. Tobin, P. Pangigadde, P. Pellegrini, A. De Milito, A. €Ostman, J. Andersson,C. RolnyWriting, review, and/or revisionof themanuscript:M.Wallerius, T.Wallmann,
M. Bartish, N.P. Tobin, P. Pangigadde, J. Hartman, M. De Palma, A. €Ostman,J. Andersson, C. RolnyAdministrative, technical, or material support (i.e., reporting or organizingdata, constructing databases): J. Bergh, C. RolnyStudy supervision: C. Rolny
AcknowledgmentsThe authors thank Inger Bodin for technical support of histology lab service
CCK core facility.
Grant SupportThis study was supported by the grants from the Swedish Cancer Society
(2013/852), Swedish Scientific Council (2013-5982), Gustaf V:th Radium-hemmets forskningsfonder (134122) foundation and BRECT (to C. Rolny).T. Wallmann and M. Bartish were supported by the KI PhD foundation.
A. €Ostman received support from Swedish Cancer Society, Radiumhemmetsforskningsfonder, and Swedish Research Council (STARGET Linneaus-grant). J. Hartman was supported by grants from the Swedish Society forMedical Research. A. De Milito received grants from Swedish Cancer Society(2012/415). J. Andersson was supported by the Swedish Cancer Society(2013/771) and Stiftelsen Olle Engkvist Byggm€astare (2012/596). JonasBergh's research group is supported by grants from the Swedish CancerSociety, the Swedish Research Council-Starget-Linné, the research funds atRadiumhemmet, the KI-AZ support, KI-Stockholm County Council BRECT,ALF and FoUU and KAW.
The costs of publication of this article were defrayed in part by thepayment of page charges. This article must therefore be hereby markedadvertisement in accordance with 18 U.S.C. Section 1734 solely to indicatethis fact.
Received September 23, 2015; revised March 3, 2016; accepted March 16,2016; published OnlineFirst April 6, 2016.
References1. Hanahan D, Coussens LM. Accessories to the crime: Functions of
cells recruited to the tumor microenvironment. Cancer Cell 2012;21:309–22.
2. Coussens LM, Zitvogel L, Palucka AK. Neutralizing tumor-promotingchronic inflammation: A magic bullet? Science 2013;339:286–91.
3. Rolny C,MazzoneM, Tugues S, Laoui D, Johansson I, Coulon C, et al. HRGinhibits tumor growth and metastasis by inducing macrophage polariza-tion and vessel normalization through downregulation of PlGF. CancerCell 2011;19:31–44.
4. Andreu P, Johansson M, Affara NI, Pucci F, Tan T, Junankar S, et al.FcRgamma activation regulates inflammation-associated squamous carci-nogenesis. Cancer Cell 2010;17:121–34.
5. Germano G, Frapolli R, Belgiovine C, Anselmo A, Pesce S, Liguori M, et al.Role of macrophage targeting in the antitumor activity of trabectedin.Cancer Cell 2013;23:249–62.
6. De Palma M, Coukos G, Hanahan D. A new twist on radiationoncology: Low-dose irradiation elicits immunostimulatory macro-phages that unlock barriers to tumor immunotherapy. Cancer Cell2013;24:559–61.
7. Mantovani A, Allavena P. The interaction of anticancer therapies withtumor-associated macrophages. J Exp Med 2015;212:435–45.
8. De Palma M, Lewis CE. Macrophage regulation of tumor responses toanticancer therapies. Cancer Cell 2013;23:277–86.
9. Galdiero MR, Garlanda C, Jaillon S, Marone G, Mantovani A. Tumorassociated macrophages and neutrophils in tumor progression. J CellPhysiol 2013;228:1404–12.
10. Tamagnone L, Artigiani S, ChenH,He Z,MingGI, SongH, et al. Plexins area large family of receptors for transmembrane, secreted, and GPI-anchoredsemaphorins in vertebrates. Cell 1999;99:71–80.
11. Sakurai A, Doci CL, Gutkind JS. Semaphorin signaling in angiogenesis,lymphangiogenesis and cancer. Cell Res 2012;22:23–32.
12. Eissler N, Rolny C. The role of immune semaphorins in cancer progression.Exp Cell Res 2013;319:1635–43.
13. Carrer A, Moimas S, Zacchigna S, Pattarini L, Zentilin L, Ruozi G, et al.Neuropilin-1 identifies a subset of bone marrow Gr1- monocytes that caninduce tumor vessel normalization and inhibit tumor growth. Cancer Res2012;72:6371–81.
14. Casazza A, Laoui D, Wenes M, Rizzolio S, Bassani N, Mambretti M, et al.Impeding macrophage entry into hypoxic tumor areas by Sema3A/Nrp1signaling blockade inhibits angiogenesis and restores antitumor immuni-ty. Cancer Cell 2013;24:695–709.
15. Epelman S, Lavine KJ, Randolph GJ. Origin and functions of tissuemacrophages. Immunity 2014;41:21–35.
16. Robbins CS, Hilgendorf I, Weber GF, Theurl I, Iwamoto Y, Figueiredo JL,et al. Local proliferation dominates lesional macrophage accumulation inatherosclerosis. Nat Med 2013;19:1166–72.
Cancer Res; 76(11) June 1, 2016 Cancer ResearchOF12
Wallerius et al.
Research. on June 20, 2018. © 2016 American Association for Cancercancerres.aacrjournals.org Downloaded from
Published OnlineFirst April 6, 2016; DOI: 10.1158/0008-5472.CAN-15-2596

17. Jenkins SJ, Ruckerl D, Cook PC, Jones LH, Finkelman FD, van RooijenN, et al. Local macrophage proliferation, rather than recruitment fromthe blood, is a signature of TH2 inflammation. Science 2011;332:1284–8.
18. Tymoszuk P, EvensH,Marzola V,Wachowicz K,WasmerMH,Datta S, et al.In situ proliferation contributes to accumulation of tumor-associatedmacrophages in spontaneous mammary tumors. Eur J Immunol 2014;44:2247–62.
19. Follenzi A, Naldini L. HIV-based vectors. Preparation and use. MethodsMol Med 2002;69:259–74.
20. Jiang H, Qi L, Wang F, Sun Z, Huang Z, Xi Q. Decreased semaphorin 3Aexpression is associated with a poor prognosis in patients with epithelialovarian carcinoma. Int J Mol Med 2015;35:1374–80.
21. Tang C, Gao X, Liu H, Jiang T, Zhai X. Decreased expression of SEMA3A isassociated with poor prognosis in gastric carcinoma. Int J Clin Exp Pathol2014;7:4782–94.
22. Zhou H, Wu A, Fu W, Lv Z, Zhang Z. Significance of semaphorin-3A andMMP-14 protein expression in non-small cell lung cancer. Oncol Lett2014;7:1395–400.
23. Mishra R, ThoratD, SoundararajanG, Pradhan SJ, ChakrabortyG, Lohite K,et al. Semaphorin 3A upregulates FOXO 3a-dependent MelCAM expres-sion leading to attenuation of breast tumor growth and angiogenesis.Oncogene 2015;34:1584–95.
24. Murray PJ, Allen JE, Biswas SK, Fisher EA, Gilroy DW, Goerdt S, et al.Macrophage activation and polarization: Nomenclature and experimentalguidelines. Immunity 2014;41:14–20.
25. Laoui D, Van Overmeire E, Di Conza G, Aldeni C, Keirsse J, Morias Y, et al.Tumor hypoxia does not drive differentiation of tumor-associated macro-phages but rather fine-tunes the M2-like macrophage population. CancerRes 2014;74:24–30.
26. Murray PJ, Wynn TA. Protective and pathogenic functions of macrophagesubsets. Nat Rev Immunol 2011;11:723–37.
27. DeNardoDG, BrennanDJ, Rexhepaj E, Ruffell B, Shiao SL,Madden SF, et al.Leukocyte complexity predicts breast cancer survival and functionallyregulates response to chemotherapy. Cancer Discov 2011;1:54–67.
28. Galon J, Angell HK, Bedognetti D,Marincola FM. The continuum of cancerimmunosurveillance: Prognostic, predictive, and mechanistic signatures.Immunity 2013;39:11–26.
29. Bleriot C, Dupuis T, Jouvion G, Eberl G, Disson O, Lecuit M. Liver-residentmacrophage necroptosis orchestrates type 1 microbicidal inflammation
and type-2-mediated tissue repair during bacterial infection. Immunity2015;42:145–58.
30. Mahmoud SM, Lee AH, Paish EC, Macmillan RD, Ellis IO, Green AR.Tumour-infiltrating macrophages and clinical outcome in breast cancer.J Clin Pathol 2012;65:159–63.
31. Ruffell B, Au A, RugoHS, Esserman LJ, Hwang ES, Coussens LM. Leukocytecomposition of human breast cancer. Proc Natl Acad Sci U S A2012;109:2796–801.
32. Lin EY, Nguyen AV, Russell RG, Pollard JW. Colony-stimulating factor 1promotes progression of mammary tumors to malignancy. J Exp Med2001;193:727–40.
33. Wong JL, Berk E, Edwards RP, Kalinski P. IL-18-primed helper NK cellscollaborate with dendritic cells to promote recruitment of effectorCD8þ T cells to the tumor microenvironment. Cancer Res 2013;73:4653–62.
34. Wennerberg E, Kremer V, Childs R, Lundqvist A. CXCL10-induced migra-tion of adoptively transferred human natural killer cells toward solidtumors causes regression of tumor growth in vivo. Cancer ImmunolImmunother 2015;64:225–35.
35. Saudemont A, Jouy N, Hetuin D, Quesnel B. NK cells that are activatedby CXCL10 can kill dormant tumor cells that resist CTL-mediatedlysis and can express B7-H1 that stimulates T cells. Blood 2005;105:2428–35.
36. Curtis C, Shah SP, Chin SF, Turashvili G, RuedaOM,DunningMJ, et al. Thegenomic and transcriptomic architecture of 2,000 breast tumours revealsnovel subgroups. Nature 2012;486:346–52.
37. Taniguchi K, Karin M. IL-6 and related cytokines as the criticallynchpins between inflammation and cancer. Semin Immunol2014;26:54–74.
38. Grivennikov SI, Karin M. Inflammatory cytokines in cancer: tumournecrosis factor and interleukin 6 take the stage. Ann Rheum Dis2011;70Suppl 1:i104–8.
39. Fisher DT, Appenheimer MM, Evans SS. The two faces of IL-6 in the tumormicroenvironment. Semin Immunol 2014;26:38–47.
40. Ding X, Yang W, Shi X, Du P, Su L, Qin Z, et al. TNF receptor 1 mediatesdendritic cell maturation and CD8 T cell response through two distinctmechanisms. J Immunol 2011;187:1184–91.
41. Calzascia T, Pellegrini M, Hall H, Sabbagh L, Ono N, Elford AR, et al. TNF-alpha is critical for antitumor but not antiviral T cell immunity in mice.J Clin Invest 2007;117:3833–45.
www.aacrjournals.org Cancer Res; 76(11) June 1, 2016 OF13
SEMA3A Promotes Expansion of Antitumor Macrophages
Research. on June 20, 2018. © 2016 American Association for Cancercancerres.aacrjournals.org Downloaded from
Published OnlineFirst April 6, 2016; DOI: 10.1158/0008-5472.CAN-15-2596

Published OnlineFirst April 6, 2016.Cancer Res Majken Wallerius, Tatjana Wallmann, Margarita Bartish, et al. Tumor-Associated MacrophagesDifferentially Regulating the Proliferation of Guidance Molecule SEMA3A Restricts Tumor Growth by
Updated version
10.1158/0008-5472.CAN-15-2596doi:
Access the most recent version of this article at:
Material
Supplementary
http://cancerres.aacrjournals.org/content/suppl/2016/04/06/0008-5472.CAN-15-2596.DC1
Access the most recent supplemental material at:
E-mail alerts related to this article or journal.Sign up to receive free email-alerts
Subscriptions
Reprints and
To order reprints of this article or to subscribe to the journal, contact the AACR Publications
Permissions
Rightslink site. (CCC)Click on "Request Permissions" which will take you to the Copyright Clearance Center's
.http://cancerres.aacrjournals.org/content/early/2016/05/20/0008-5472.CAN-15-2596To request permission to re-use all or part of this article, use this link
Research. on June 20, 2018. © 2016 American Association for Cancercancerres.aacrjournals.org Downloaded from
Published OnlineFirst April 6, 2016; DOI: 10.1158/0008-5472.CAN-15-2596