Embed Size (px)
Citation preview
C O U N T Y O F S A N D I E G O B M P D E S I G N M A N U A L
February 26, 2016
Appendix
G Guidance for Continuous Simulation and Hydromodification Management Sizing Factors

C O U N T Y O F S A N D I E G O B M P D E S I G N M A N U A L
February 26, 2016
This page was left intentionally blank.
Appendix G: Guidance for Continuous Simulation and Hydromodification Management Sizing Factors
G-1 February 26, 2016
Appendix G Guidance for Continuous Simulation and Hydromodification Management Sizing Factors G.1 Guidance for Continuous Simulation Hydrologic Modeling for Hydromodification Management Studies in San Diego County Region 9
G.1.1 Introduction
Continuous simulation hydrologic modeling is used to demonstrate compliance with the performance standards for hydromodification management in San Diego. There are several available hydrologic models that can perform continuous simulation analyses. Each has different methods and parameters for determining the amount of rainfall that becomes runoff, and for representing the hydraulic operations of certain structural BMPs such as biofiltration with partial retention or biofiltration. This Appendix is intended to:
• Identify acceptable models for continuous simulation hydrologic analyses for hydromodification management;
• Provide guidance for selecting climatology input to the models;
• Provide standards for rainfall loss parameters to be used in the models;
• Provide standards for defining physical characteristics of LID components; and
• Provide guidance for demonstrating compliance with performance standards for hydromodification management.
This Appendix is not a user's manual for any of the acceptable models, nor a comprehensive manual for preparing a hydrologic model. This Appendix provides guidance for selecting model input parameters for the specific purpose of hydromodification management studies. The model preparer must be familiar with the user's manual for the selected software to determine how the parameters are entered to the model.
G.1.2 Software for Continuous Simulation Hydrologic Modeling
The following software models may be used for hydromodification management studies in San

Appendix G: Guidance for Continuous Simulation and Hydromodification Management Sizing Factors
G-2 February 26, 2016
Diego:
• HSPF – Hydrologic Simulation Program-FORTRAN, distributed by USEPA, public domain.
• SDHM – San Diego Hydrology Model, distributed by Clear Creek Solutions, Inc. This is an HSPF-based model with a proprietary interface that has been customized for use in San Diego for hydromodification management studies.
• SWMM – Storm Water Management Model, distributed by USEPA, public domain.
Third-party and proprietary software, such as XPSWMM, InfoSWMM, or PCSWMM, may be used for hydromodification management studies in San Diego, provided that:
• Input and output data from the software can interface with public domain software such as SWMM. In other words, input files from the third party software should have sufficient functionality to allow export to public domain software for independent validation.
• The software's hydromodification control processes are substantiated.
G.1.3 Climatology Parameters
G.1.3.1 Rainfall
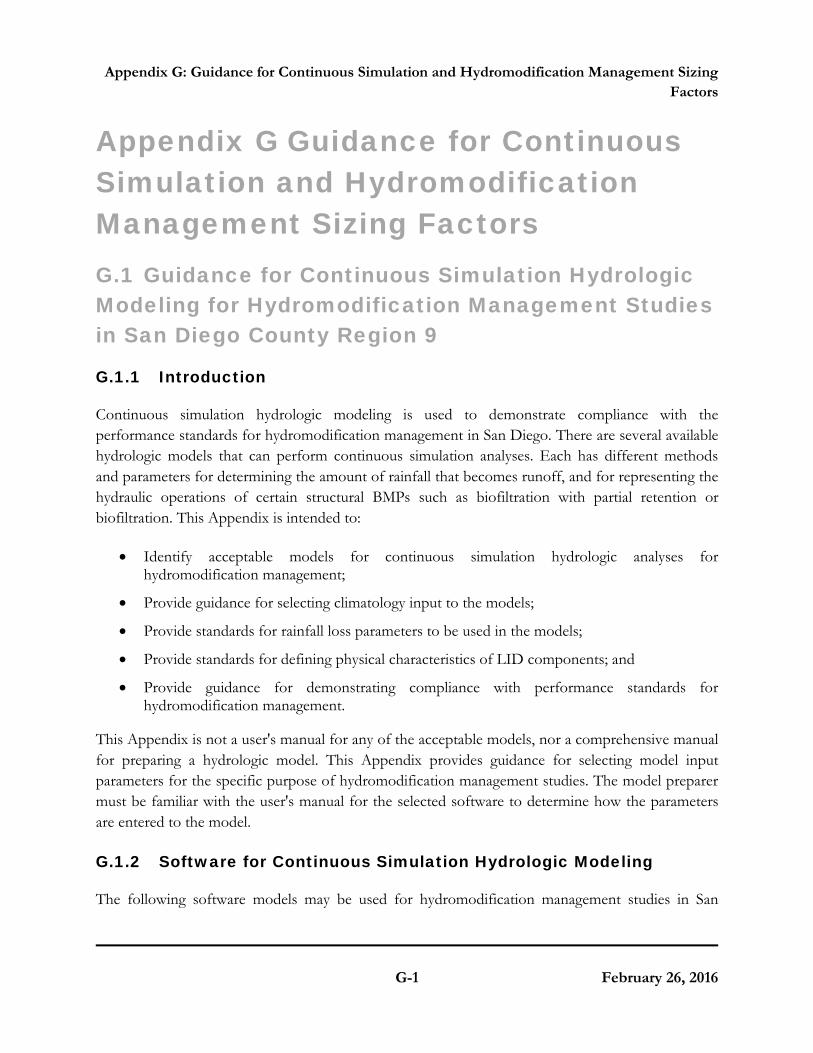
In all software applications for preparation of hydromodification management studies in San Diego, rainfall data must be selected from approved data sets that have been prepared for this purpose. As part of the development of the March 2011 Final HMP, long-term hourly rainfall records were prepared for public use. The rainfall record files are provided on the Project Clean Water website. The rainfall station map is provided in the March 2011 Final HMP and is included in this Appendix as Figure G.1-1.
Appendix G: Guidance for Continuous Simulation and Hydromodification Management Sizing Factors
G-3 February 26, 2016
Figure G.1-1: Rainfall Station Map
Project applicants preparing continuous simulation models must select the most appropriate rainfall data set from the rainfall record files provided on the Project Clean Water website. For a given project location, the following factors should be considered in the selection of the appropriate rainfall data set:
• In most cases, the rainfall data set in closest proximity to the project site will be the appropriate choice (refer to the rainfall station map).
• In some cases, the rainfall data set in closest proximity to the project site may not be the most applicable data set. Such a scenario could involve a data set with an elevation significantly different from the project site. In addition to a simple elevation comparison, the project proponent may also consult with the San Diego County’s average annual precipitation isopluvial map, which is provided in the San Diego County Hydrology Manual (2003). Review of this map could provide an initial estimate as to whether the project site is in a similar rainfall zone as compared to the rainfall stations. Generally, precipitation totals in San Diego County increase with increasing elevation.
• Where possible, rainfall data sets should be chosen so that the data set and the project location are both located in the same topographic zone (coastal, foothill, mountain) and
Appendix G: Guidance for Continuous Simulation and Hydromodification Management Sizing Factors
G-4 February 26, 2016
major watershed unit (Upper San Luis Rey, Lower San Luis Rey, Upper San Diego River, Lower San Diego River, etc.).
For SDHM users, the approved rainfall data sets are pre-loaded into the software package. SDHM users may select the appropriate rainfall gage within the SDHM program. HSPF or SWMM users must download the appropriate rainfall record from the Project Clean Water website and load it into the software program.
Both the pre-development and post-project model simulation period must encompass the entire rainfall record provided in the approved rainfall data set. Scaling the rainfall data is not permitted.
Hydrologic water balance can be used to compare pre-development and post-project conditions, which can be defined by the following equation:
Precipitation = Evapotranspiration + Infiltration + Surface Storage+ Surface Runoff
Rainfall comprises the left side of the equation, however in some cases additional inputs from irrigation, groundwater discharge, or snowmelt may need to be considered. Each term on the right side of the equation is commonly referred to as a “rainfall loss” and is referenced as such in the Final HMP and throughout this document. Despite their name, these rainfall losses include dry weather processes that can significantly impact model results for long-term continuous simulation. Hydrologic losses can occur from standing water on subcatchment surfaces and from soil moisture beneath the ground surface. In SWMM, losses can also be simulated in the hydraulic model, from water traveling through open channels and from water held in surface storage units.
It is also worth noting that the “Surface Runoff” term in the equation includes the disposal of excess runoff generated from a subcatchment into the storm drain, receiving watercourse, or waterbody. Structural BMP designs that include consumptive use (e.g., rainwater harvesting systems) can capture a portion of the surface runoff volume and use it to meet non-potable water demands that don’t require a high level of treatment.
G.1.3.2 Potential Evapotranspiration
The Evapotranspiration term in the water balance equation includes evaporation of surface waters and transpiration of soil moisture through vegetation. Climatology parameters characterize rates, as the actual amount of water evaporated or transpired depends on the amount of available water (i.e., either held in surface depressions or soil pores), temperature, wind velocity, relative humidity, and solar radiation. It is important to understand the source of measurements. Pan evaporation data are derived from measurements in stainless steel pans and therefore need to be adjusted to reflect actual site conditions by applying the appropriate set of pan coefficients. Likewise, evapotranspiration data may be derived from a specific crop or vegetation type and may need to be translated to the appropriate reference evapotranspiration (ETo). Pan coefficients can also be adjusted to reflect

Appendix G: Guidance for Continuous Simulation and Hydromodification Management Sizing Factors
G-5 February 26, 2016
seasonal variations to distinguish growing/dormant periods or to account for excessive transpiration from heavy canopy/root systems.
Project applicants preparing continuous simulation models must select a data set from the sources described below to represent potential evapotranspiration.
For HSPF users, this parameter may be entered as an hourly time series. The hourly time series that was used to develop the BMP Sizing Calculator parameters is provided on the project clean water website and may be used for hydromodification management studies in San Diego. For SDHM users, the hourly evaporation data set is pre-loaded into the program. HSPF users may download the evaporation record from the Project Clean Water website and load it into the software program.
For HSPF or SWMM users, this parameter may be entered as monthly values in inches per month or inches per day. Monthly values may be obtained from the California Irrigation Management Information System "Reference Evapotranspiration Zones" brochure and map (herein "CIMIS ETo Zone Map"), prepared by California Department of Water Resources, dated January 2012. The CIMIS ETo Zone Map is available from www.cimis.gov, and is provided in this Appendix as Figure G.1-2. Determine the appropriate reference evapotranspiration zone for the project from the CIMIS ETo Zone Map. The monthly average reference evapotranspiration values are provided below in Table G.1-1.
In SWMM, there are a number of options available for characterizing potential evaporation rates, including:
• Constant Value: This is not acceptable for hydromodification management studies
• Time Series: A user-defined set of values can be supplied with either a fixed recording interval (e.g., 15-minute or hourly) or variable recording interval
• Climate File: Daily evaporation rates can be read from an external climate file, and monthly pan coefficients can be specified
• Monthly Averages: A set of monthly average values is input by the user
• Temperatures: Daily evaporation rates can be computed based on daily air temperature time series data using the Hargreaves method

Appendix G: Guidance for Continuous Simulation and Hydromodification Management Sizing Factors
G-6 February 26, 2016
Figure G.1-2: California Irrigation Management Information System "Reference Evapotranspiration Zones"

Appendix G: Guidance for Continuous Simulation and Hydromodification Management Sizing Factors
G-7 February 26, 2016
Table G.1-1: Monthly Average Reference Evapotranspiration by ETo Zone (inches/month and inches/day) for use in SWMM Models for Hydromodification Management Studies in San Diego County
CIMIS Zones 1, 4, 6, 9, and 16 (See CIMIS ETo Zone Map)
January February March April May June July August Septembe
r October Novembe
r December
Zone in/month in/month in/month in/month in/month in/month in/month in/month in/month in/month in/month in/month
1 0.93 1.4 2.48 3.3 4.03 4.5 4.65 4.03 3.3 2.48 1.2 0.62
4 1.86 2.24 3.41 4.5 5.27 5.7 5.89 5.58 4.5 3.41 2.4 1.86
6 1.86 2.24 3.41 4.8 5.58 6.3 6.51 6.2 4.8 3.72 2.4 1.86
9 2.17 2.8 4.03 5.1 5.89 6.6 7.44 6.82 5.7 4.03 2.7 1.86
16 1.55 2.52 4.03 5.7 7.75 8.7 9.3 8.37 6.3 4.34 2.4 1.55
January February March April May June July August Septembe
r October Novembe
r December
Days 31 28 31 30 31 30 31 31 30 31 30 31
Zone in/day in/day in/day in/day in/day in/day in/day in/day in/day in/day in/day in/day
1 0.030 0.050 0.080 0.110 0.130 0.150 0.150 0.130 0.110 0.080 0.040 0.020
4 0.060 0.080 0.110 0.150 0.170 0.190 0.190 0.180 0.150 0.110 0.080 0.060
6 0.060 0.080 0.110 0.160 0.180 0.210 0.210 0.200 0.160 0.120 0.080 0.060
9 0.070 0.100 0.130 0.170 0.190 0.220 0.240 0.220 0.190 0.130 0.090 0.060
16 0.050 0.090 0.130 0.190 0.250 0.290 0.300 0.270 0.210 0.140 0.080 0.050
Appendix G: Guidance for Continuous Simulation and Hydromodification Management Sizing Factors
G-8 February 26, 2016
G.1.4 Land Characteristics and Loss Parameters
In all software applications for preparation of hydromodification management studies in San Diego, rainfall loss parameters must be consistent with this Appendix unless the preparer can provide documentation to substantiate use of other parameters, subject to County approval. HSPF and SWMM use different processes and different sets of parameters. SDHM is based on HSPF, therefore parameters for SDHM and HSPF are presented together in Section G.1.4.1. Parameters that have been pre-loaded into SDHM may be used for other HSPF hydromodification management studies outside of SDHM. Parameters for SWMM are presented separately in Section G.1.4.2.
G.1.4.1 Rainfall Loss Parameters for HSPF and SDHM
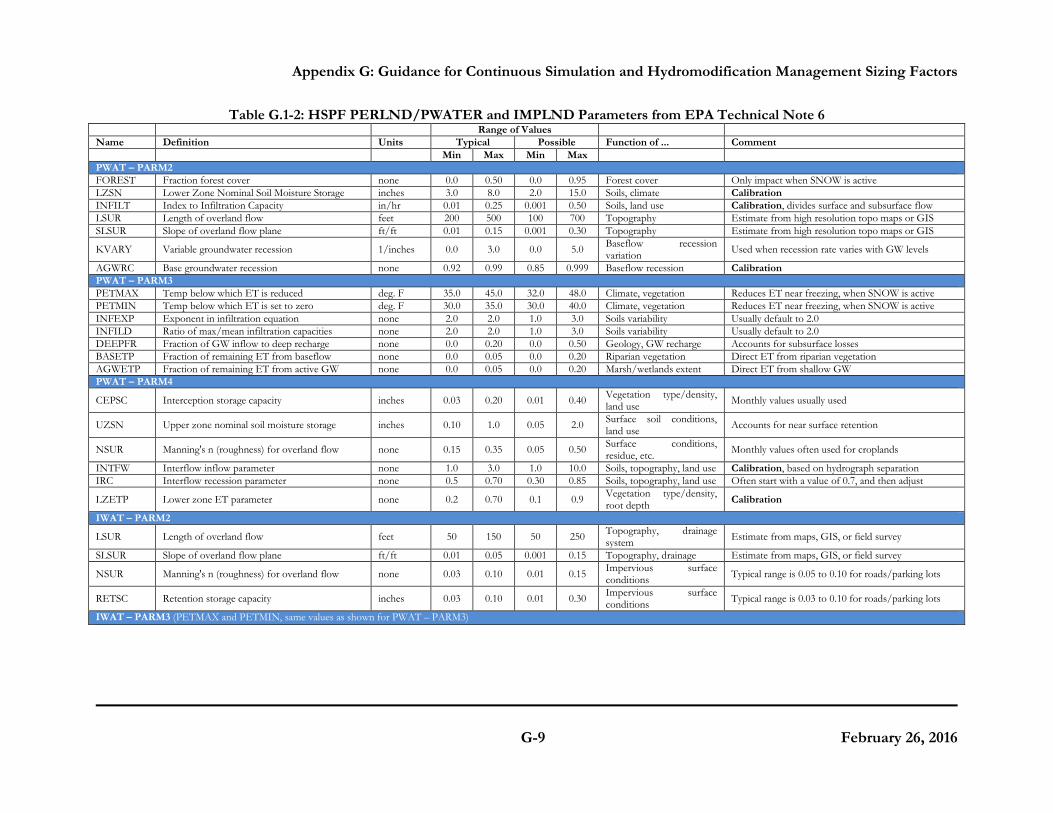
Rainfall losses in HSPF are characterized by PERLND/PWATER parameters and IMPLND parameters, which describe processes occurring when rainfall lands on pervious lands and impervious lands, respectively. "BASINS Technical Notice 6, Estimating Hydrology and Hydraulic Parameters for HSPF," prepared by the USEPA, dated July 2000, provides details regarding these parameters and summary tables of possible ranges of these parameters. Table G.1-2, excerpted from the above-mentioned document, presents the ranges of these parameters.
For HSPF studies for hydromodification management in San Diego, PERLND/PWATER parameters and IMPLND parameters must fall within the "possible" range provided in EPA Technical Note 6. To select specific parameters, HSPF users may use the parameters established for development of the San Diego BMP Sizing Calculator, and/or the parameters that have been established for SDHM. Parameters for the San Diego BMP Sizing Calculator and SDHM are based on research conducted specifically for HSPF modeling in San Diego.
Documentation of parameters selected for the San Diego BMP Sizing Calculator is presented in the document titled, San Diego BMP Sizing Calculator Methodology, prepared by Brown and Caldwell, dated January 2012 (herein "BMP Sizing Calculator Methodology"). The PERLND/PWATER parameters selected for development of the San Diego BMP Sizing Calculator represent a single composite pervious land cover that is representative of most pre-development conditions for sites that would commonly be managed by the BMP Sizing Calculator. The parameters shown below in Table G.1-3 are excerpted from the BMP Sizing Calculator Methodology.
Appendix G: Guidance for Continuous Simulation and Hydromodification Management Sizing Factors
G-9 February 26, 2016
Table G.1-2: HSPF PERLND/PWATER and IMPLND Parameters from EPA Technical Note 6 Range of Values Name Definition Units Typical Possible Function of ... Comment Min Max Min Max PWAT – PARM2 FOREST Fraction forest cover none 0.0 0.50 0.0 0.95 Forest cover Only impact when SNOW is active LZSN Lower Zone Nominal Soil Moisture Storage inches 3.0 8.0 2.0 15.0 Soils, climate Calibration INFILT Index to Infiltration Capacity in/hr 0.01 0.25 0.001 0.50 Soils, land use Calibration, divides surface and subsurface flow LSUR Length of overland flow feet 200 500 100 700 Topography Estimate from high resolution topo maps or GIS SLSUR Slope of overland flow plane ft/ft 0.01 0.15 0.001 0.30 Topography Estimate from high resolution topo maps or GIS
KVARY Variable groundwater recession 1/inches 0.0 3.0 0.0 5.0 Baseflow recession variation Used when recession rate varies with GW levels
AGWRC Base groundwater recession none 0.92 0.99 0.85 0.999 Baseflow recession Calibration PWAT – PARM3 PETMAX Temp below which ET is reduced deg. F 35.0 45.0 32.0 48.0 Climate, vegetation Reduces ET near freezing, when SNOW is active PETMIN Temp below which ET is set to zero deg. F 30.0 35.0 30.0 40.0 Climate, vegetation Reduces ET near freezing, when SNOW is active INFEXP Exponent in infiltration equation none 2.0 2.0 1.0 3.0 Soils variability Usually default to 2.0 INFILD Ratio of max/mean infiltration capacities none 2.0 2.0 1.0 3.0 Soils variability Usually default to 2.0 DEEPFR Fraction of GW inflow to deep recharge none 0.0 0.20 0.0 0.50 Geology, GW recharge Accounts for subsurface losses BASETP Fraction of remaining ET from baseflow none 0.0 0.05 0.0 0.20 Riparian vegetation Direct ET from riparian vegetation AGWETP Fraction of remaining ET from active GW none 0.0 0.05 0.0 0.20 Marsh/wetlands extent Direct ET from shallow GW PWAT – PARM4
CEPSC Interception storage capacity inches 0.03 0.20 0.01 0.40 Vegetation type/density, land use Monthly values usually used
UZSN Upper zone nominal soil moisture storage inches 0.10 1.0 0.05 2.0 Surface soil conditions, land use Accounts for near surface retention
NSUR Manning's n (roughness) for overland flow none 0.15 0.35 0.05 0.50 Surface conditions, residue, etc. Monthly values often used for croplands
INTFW Interflow inflow parameter none 1.0 3.0 1.0 10.0 Soils, topography, land use Calibration, based on hydrograph separation IRC Interflow recession parameter none 0.5 0.70 0.30 0.85 Soils, topography, land use Often start with a value of 0.7, and then adjust
LZETP Lower zone ET parameter none 0.2 0.70 0.1 0.9 Vegetation type/density, root depth Calibration
IWAT – PARM2
LSUR Length of overland flow feet 50 150 50 250 Topography, drainage system Estimate from maps, GIS, or field survey
SLSUR Slope of overland flow plane ft/ft 0.01 0.05 0.001 0.15 Topography, drainage Estimate from maps, GIS, or field survey
NSUR Manning's n (roughness) for overland flow none 0.03 0.10 0.01 0.15 Impervious surface conditions Typical range is 0.05 to 0.10 for roads/parking lots
RETSC Retention storage capacity inches 0.03 0.10 0.01 0.30 Impervious surface conditions Typical range is 0.03 to 0.10 for roads/parking lots
IWAT – PARM3 (PETMAX and PETMIN, same values as shown for PWAT – PARM3)

Appendix G: Guidance for Continuous Simulation and Hydromodification Management Sizing Factors
G-10 February 26, 2016
Table G.1-3: HSPF PERLND/PWATER Parameters from BMP Sizing Calculator Methodology
Hydrologic Soil Group
A
Hydrologic Soil Group
B
Hydrologic Soil Group
C
Hydrologic Soil Group
D
Slope <5% 5-15% =>15% <5% 5-15% =>15% <5% 5-15% =>15% <5% 5-15% =>15%
PWAT_PARM2 Units
FOREST None 0 0 0 0 0 0 0 0 0 0 0 0
LZSN inches 5.2 4.8 4.5 5.0 4.7 4.4 4.8 4.5 4.2 4.8 4.5 4.2
INFILT in/hr 0.090 0.070 0.045 0.070 0.055 0.040 0.050 0.040 0.032 0.040 0.030 0.020
LSUR Feet 200 200 200 200 200 200 200 200 200 200 200 200
SLSUR ft/ft 0.05 0.1 0.15 0.05 0.1 0.15 0.05 0.1 0.15 0.05 0.1 0.15
KVARY 1/inches 3 3 3 3 3 3 3 3 3 3 3 3
AGWRC None 0.92 0.92 0.92 0.92 0.92 0.92 0.92 0.92 0.92 0.92 0.92 0.92
PWAT_PARM3
PETMAX (F) F 35 35 35 35 35 35 35 35 35 35 35 35
PETMIN (F) F 30 30 30 30 30 30 30 30 30 30 30 30
INFEXP None 2 2 2 2 2 2 2 2 2 2 2 2
INFILD None 2 2 2 2 2 2 2 2 2 2 2 2
DEEPFR None 0.4 0.4 0.4 0.4 0.4 0.4 0.4 0.4 0.4 0.4 0.4 0.4
BASETP None 0.05 0.05 0.05 0.05 0.05 0.05 0.05 0.05 0.05 0.05 0.05 0.05
AGEWTP None 0.05 0.05 0.05 0.05 0.05 0.05 0.05 0.05 0.05 0.05 0.05 0.05
PWAT_PARM4
CEPSC inches 0.08 0.08 0.08 0.08 0.08 0.08 0.08 0.08 0.08 0.08 0.08 0.08
UZSN inches 0.6 0.6 0.6 0.6 0.6 0.6 0.6 0.6 0.6 0.6 0.6 0.6
NSUR None 0.2 0.2 0.2 0.2 0.2 0.2 0.2 0.2 0.2 0.2 0.2 0.2
INTFW None 1.5 1.5 1.5 1.5 1.5 1.5 1.5 1.5 1.5 1.5 1.5 1.5
IRC None 0.7 0.7 0.7 0.7 0.7 0.7 0.7 0.7 0.7 0.7 0.7 0.7
LZETP None 0.5 0.5 0.5 0.5 0.5 0.5 0.5 0.5 0.5 0.5 0.5 0.5
Appendix G: Guidance for Continuous Simulation and Hydromodification Management Sizing Factors
G-11 February 26, 2016
Parameters within SDHM are documented in "San Diego Hydrology Model User Manual," prepared by Clear Creek Solutions, Inc. (as of the development of the Manual, the current version of the SDHM User Manual is dated January 2012). Parameters established for SDHM represent "grass" (non-turf grasslands), "dirt," "gravel," and "urban" cover. The documented PERLND and IMPLND parameters for the various land covers and soil types have been pre-loaded into SDHM. SDHM users must use the parameters that have been pre-loaded into the program without modification unless the preparer can provide documentation to substantiate use of other parameters.
G.1.4.2 Rainfall Loss Parameters for SWMM
In SWMM, rainfall loss parameters (parameters that describe processes occurring when rainfall lands on pervious lands and impervious lands) are entered in the "subcatchment" module. In addition to specifying parameters, the SWMM user must also select an infiltration model and the LID manual where applicable. The latest version is available for download, along with detailed documentation and supporting information, at
http://www.epa.gov/nrmrl/wswrd/wq/models/swmm/
The SWMM Manual provides details regarding the hydrologic input parameters and summary tables of possible ranges of these parameters. For SWMM studies for hydromodification management in San Diego, hydrology parameters must fall within the range provided in the SWMM Manual. The program help file is another source of information for typical values and additional guidance. Further, users should confirm that values are consistent within the acceptable range stated in the BMP Design Manual. Some of the parameters depend on the selection of the infiltration model. For consistency across the San Diego region, SWMM users must use the Green-Ampt infiltration model for hydromodification management studies. Table G.1-4 presents SWMM subcatchment and infiltration parameters for use in hydromodification management studies in the San Diego region. The LID module requires an additional set of parameters and these are described below.

Appendix G: Guidance for Continuous Simulation and Hydromodification Management Sizing Factors
G-12 February 26, 2016
Table G.1-4: Subcatchment Parameters for SWMM Studies for Hydromodification Management in San Diego
SWMM Parameter
Name Unit Range Use in San Diego
Name X-Coordinate Y-Coordinate Description Tag Rain Gage Outlet
N/A N/A – project-specific Project-specific
Area acres (ac) Project-specific Project-specific Width feet (ft) Project-specific Project-specific % Slope percent (%) Project-specific Project-specific % Imperv percent (%) Project-specific Project-specific N-imperv -- 0.011 – 0.024 presented
in Table A.6 of SWMM Manual
default use 0.012 for smooth concrete, otherwise provide documentation of other surface consistent with Table A.6 of SWMM Manual
N-Perv -- 0.05 – 0.80 presented in Table A.6 of SWMM Manual
default use 0.10 for undisturbed vegetated areas within the unincorporated areas of the County, otherwise provide documentation of other surface consistent with Table A.6 of SWMM Manual
Dstore-Imperv inches 0.05 – 0.10 inches presented in Table A.5 of SWMM Manual
0.05
Dstore-Perv inches 0.10 – 0.30 inches presented in Table A.5 of SWMM Manual
0.10
%ZeroImperv percent (%) 0% – 100% 25% Subarea routing
-- OUTLET IMPERVIOUS PERVIOUS
Project-specific, typically OUTLET
Percent Routed
% 0% – 100% Project-specific, typically 100%

Appendix G: Guidance for Continuous Simulation and Hydromodification Management Sizing Factors
G-13 February 26, 2016
SWMM Parameter
Name Unit Range Use in San Diego
Infiltration Method HORTON GREEN_AMPT CURVE_NUMBER
GREEN_AMPT
Suction Head (Green-Ampt)
Inches 1.93 – 12.60 presented in Table A.2 of SWMM Manual
Hydrologic Soil Group A: 1.5 Hydrologic Soil Group B: 3.0 Hydrologic Soil Group C: 6.0 Hydrologic Soil Group D: 9.0
Conductivity (Green-Ampt)
Inches per hour 0.01 – 4.74 presented in Table A.2 of SWMM Manual by soil texture class 0.00 – ≥0.45 presented in Table A.3 of SWMM Manual by hydrologic soil group
Hydrologic Soil Group A: 0.3 Hydrologic Soil Group B: 0.2 Hydrologic Soil Group C: 0.1 Hydrologic Soil Group D: 0.025 Note: reduce conductivity by 25% in the post-project condition when native soils will be compacted. For fill soils in post-project condition, see Section G.1.4.3.
Initial Deficit (Green-Ampt)
The difference between soil porosity and initial moisture content. Based on the values provided in Table A.2 of SWMM Manual, the range for completely dry soil would be 0.097 to 0.375
Hydrologic Soil Group A: 0.30 Hydrologic Soil Group B: 0.31 Hydrologic Soil Group C: 0.32 Hydrologic Soil Group D: 0.33 Note: in long-term continuous simulation, this value is not important as the soil will reach equilibrium after a few storm events regardless of the initial moisture content specified.
Groundwater yes/no yes/no NO LID Controls Project Specific Snow Pack Land Uses Initial Buildup Curb Length
Not applicable to hydromodification management studies
A schematic of the basic SWMM setup for hydromodification management studies is shown below, with the LID module is shown as a feature within the hydrology computational block. Surface water

Appendix G: Guidance for Continuous Simulation and Hydromodification Management Sizing Factors
G-14 February 26, 2016
hydrology is distinguished from groundwater, however the groundwater module is not typically used in hydromodification management studies.
The rainfall and climatology input time series data are used to generate surface runoff which in turn is hydraulically routed through the collection system and storage/treatment facilities. The figure includes the following terms in the water balance equation:
• P = Precipitation • E/T = Evaporation / Transpiration • I/S = Infiltration / Seepage • Q = Runoff
Evapotranspiration was previously addressed above; the remainder of this section discusses the other hydrologic losses and parameters.
Soil and Infiltration Parameters
Of the infiltration options available in SWMM, the Green-Ampt equation can best handle variable water content conditions in the shallow soil layers beneath the ground surface, which is critical for long-term continuous simulation of surface water hydrology. The Green-Ampt parameters suggested in Table G.1-4 are referenced according to hydrologic soil group. Green-Ampt parameters can also be determined by relating infiltration parameters to soil texture properties, as identified by in-situ geotechnical analysis results or published County soil survey information. Infiltration parameters include:
• Capillary Tension (Suction Head): a measure of how tightly water is held within the soil pore space;
Appendix G: Guidance for Continuous Simulation and Hydromodification Management Sizing Factors
G-15 February 26, 2016
• Saturated Hydraulic Conductivity: a measure of how quickly the water can be drained vertically; and
• Initial Moisture Deficit: a measure of the initial soilwater deficit, also known as porosity (i.e., the volumetric fraction of water within the soil pore space under initially dry conditions).
Note that when SWMM is used without the Groundwater module, there is no distinction between the upper and lower zone soil moisture storage as in HSPF/SDHM. The LID module does however distinguish several layers/zones within each facility, and these are described below. Overland Flow Parameters Overland flow parameters describe the slope and length characteristics of shallow surface runoff. These are determined by identifying representative overland flow paths for each subcatchment using available digital topographic data for pre-development conditions and the proposed grading plan for post-project conditions. Overland flow path lengths and slopes are measured directly from the available information. Generally, overland flow paths should be less than 1,000 feet in length, otherwise channelized flow is likely present and should be modeled hydraulically. Overland flow path widths are determined based on the subcatchment area divided by the corresponding flow path length for each subcatchment. Although Surface Storage is not depicted in SWMM schematic, it is a component of the water balance equation and includes excess runoff that is held in both hydrologic depression storage and hydraulic storage units. LID Module Details on the use and application of LID controls are provided in the SWMM Manual and program help file. Suggested parameter values for use with hydromodification management studies in the San Diego region are provided in Section G.1.5.
G.1.4.3 Pervious Area Rainfall Loss Parameters in Post-Project Condition (HSPF, SDHM, and SWMM)
The following guidance applies to HSPF, SDHM, and SWMM. When modeling pervious areas in the post-project condition, fill soils must be modeled as hydrologic soil group Type D soils, or the project applicant may provide an actual expected infiltration rate for the fill soil based on testing (must be approved by the County for use in the model). Where landscaped areas on fill soils will be re-tilled and/or amended in the post-project condition, the landscaped areas may be modeled as Type C soils. Areas to be re-tilled and/or amended in the post-project condition must be shown on the project plans. For undisturbed pervious areas (i.e., native soils, no fill), use the actual hydrologic soil group, the same as in the pre-development condition.

Appendix G: Guidance for Continuous Simulation and Hydromodification Management Sizing Factors
G-16 February 26, 2016
G.1.5 Modeling Structural BMPs (Ponds and Lid Features)
There are many ways to model structural BMPs. There are standard modules for several pond or LID elements included in SDHM and SWMM. Users may also set up project-specific stage-storage-discharge relationships representing structural BMPs. Regardless of the modeling method, certain characteristics of the structural BMP, including infiltration of water from the bottom of the structural BMP into native soils, porosity of bioretention soils and/or gravel sublayers, and other program-specific parameters must be consistent with those presented below, unless the preparer can provide documentation to substantiate use of other parameters, subject to County approval. The geometry of structural BMPs is project-specific and must match the project plans.
G.1.5.1 Infiltration into Native Soils Below Structural BMPs
Infiltration into native soils below structural BMPs may be modeled as a constant outflow rate equal to the project site-specific design infiltration rate (Worksheet D.5-1) multiplied by the area of the infiltrating surface (and converted to cubic feet per second). This infiltration rate is not the same as an infiltration parameter used in the calculation of rainfall losses, such as the HSPF INFILT parameter or the Green-Ampt conductivity parameter in the SWMM subcatchment module. It must be site-specific and must be determined based on the methods presented in Appendix D of this manual.
For preliminary analysis when site-specific geotechnical investigation has not been completed, project applicants proposing infiltration into native soils as part of the structural BMP design must prepare a sensitivity analysis to determine a potential range for the structural BMP size based on a range of potential infiltration rates. As shown in Appendices C and D of this manual, many factors influence the ability to infiltrate storm water. Therefore even when soils types A and B are present, which are generally expected to infiltrate storm water, the possibility that a very low infiltration rate could be determined at design level must be considered. The range of potential infiltration rates for preliminary analysis is shown below in Table G.1-5.
Table G.1-5: Range of Potential Infiltration Rates to be Studied for Sensitivity Analysis when Native Infiltration is Proposed but Site-Specific Geotechnical Investigation has not been Completed
Hydrologic Soil Group at Location of Proposed
Structural BMP
Low Infiltration Rate for Preliminary Study
(inches/hour)
High Infiltration Rate for Preliminary Study
(inches/hour) A 0.02 2.4 B 0.02 0.52 C 0 0.08 D 0 0.02
Appendix G: Guidance for Continuous Simulation and Hydromodification Management Sizing Factors
G-17 February 26, 2016
The infiltration rates shown above are for preliminary investigation only. Final design of a structural BMP must be based on the project site-specific design infiltration rate (Worksheet D.5-1).
G.1.5.2 Structural BMPs That Do Not Include Sub-Layers (Ponds)
To model a pond, basin, or other depressed area that does not include processing runoff through sublayers of amended soil and/or gravel, create a stage storage discharge relationship for the pond, and supply the information to the model according to the program requirements. For HSPF users, the stage-storage-discharge relationship is provided in FTABLES. SDHM users may use the TRAPEZOIDAL POND element for a trapezoidal pond or IRREGULAR POND element to request the program to create the stage-storage-discharge relationship, use the SSD TABLE element to supply a user-created stage-storage-discharge relationship, or use other available modules such as TANK or VAULT. For SWMM users, the stage-storage relationship is supplied in the storage unit module, and the stage-discharge relationship may be simulated by including the various control structures such as the orifice, weir, gate, pump or other device directly in the hydraulic model. Stage-storage and stage-discharge curves for structural BMPs must be fully documented in the project-specific HMP report and must be consistent with the structural BMP(s) shown on project plans.
For user-created stage-discharge relationships, refer to County drainage manual criteria for equations representing hydraulic behavior of outlet structures. Users relying on the software to develop the stage-discharge relationship may use the equations built into the program. This manual does not recommend that all program modules calculating stage-discharge relationships must be uniform because the flows to be controlled for hydromodification management are low flows, calculated differently from the single-storm event peak flows studied for flood control purposes, and hydromodification management performance standards do not represent any performance standard for flood control drainage design. Note that for design of emergency outlet structures, and any calculations related to single-storm event routing for flood control drainage design, stage-discharge calculations must be consistent with the County drainage design requirements. This may require separate calculations for stage-discharge relationship pursuant to County manuals. The HMP flow rates must not be used for flood control calculations.
G.1.5.3 Structural BMPs That Include Sub-Layers (Bioretention and Other LID)
G.1.5.3.1 Characteristics of Engineered Soil Media
The engineered soil media used in bioretention, biofiltration with partial retention, and biofiltration structural BMPs is a sandy loam. The following parameters presented in Table G.1-6 are characteristics of a sandy loam for use in continuous simulation models.

Appendix G: Guidance for Continuous Simulation and Hydromodification Management Sizing Factors
G-18 February 26, 2016
Table G.1-6: Characteristics of Sandy Loam to Represent Engineered Soil Media in Continuous Simulation for Hydromodification Management Studies in San Diego
Soil Texture Porosity Field Capacity Wilting Point Conductivity Suction Head
Sandy Loam 0.4 0.2 0.1 5 inches/hour 1.5 inches
• Porosity is the volume of pore space (voids) relative to the total volume of soil (as a fraction).
• Field Capacity is the volume of pore water relative to total volume after the soil has been allowed to drain fully (as a fraction). Below this level, vertical drainage of water through the soil layer does not occur.
• Wilting point is the volume of pore water relative to total volume for a well dried soil where only bound water remains (as a fraction). The moisture content of the soil cannot fall below this limit.
• Conductivity is the hydraulic conductivity for the fully saturated soil (in/hr or mm/hr).
• Suction head is the average value of soil capillary suction along the wetting front (inches or mm).
Figures G.1-3 and G.1-4, from http://www.stevenswater.com/articles/irrigationscheduling.aspx, illustrate unsaturated soil and soil saturation, field capacity, and wilting point.
Unsaturated soil is composed of solid particles, organic material and pores. The pore space will contain air and water.

Appendix G: Guidance for Continuous Simulation and Hydromodification Management Sizing Factors
G-19 February 26, 2016
Figure G.1-3: Unsaturated Soil Composition
Figure G.1-4: Soil saturation, field capacity, and wilting point

Appendix G: Guidance for Continuous Simulation and Hydromodification Management Sizing Factors
G-20 February 26, 2016
G.1.5.3.2 Characteristics of Gravel
For the purpose of hydromodification management studies, it may be assumed that water moves freely through gravel, not limited by hydraulic properties of the gravel. For the purpose of calculating available volume, use porosity of 0.4, or void ratio of 0.67. Porosity is equal to void ratio divided by (1 + void ratio).
G.1.5.3.3 Additional Guidance for SDHM Users
The module titled "bioretention/rain garden element" may be used to represent bioretention or biofiltration BMPs. SDHM users using the available "bioretention/rain garden element" must customize the soil media characteristics to use the parameters from Table G.1-6 above, and select "gravel" for gravel sublayers. All other input variables are project-specific. "Native infiltration" refers to infiltration from the bottom of the structural BMP into the native soil. This variable is project-specific, see Section G.1.5.1.
G.1.5.3.4 Additional Guidance for SWMM Users
The latest version of SWMM includes the following eight types of LID controls:
• Bio-Retention Cell: surface storage facility with vegetation in an engineered soil mixture placed above a gravel drainage bed.
• Rain Garden: same setup as bio-retention cell, but without an underlying gravel bed.
• Green Roof: bio-retention cell with shallow surface storage and soil layers, underlain by a drainage mat that conveys excess percolated rainfall to the regular roof drainage system.
• Infiltration Trench: drainage swale or narrow storage basin filled with gravel or other porous media designed to capture and infiltrate runoff to the native soil below.
• Permeable Pavement: continuous pavement systems with porous concrete, asphalt mix, or paver blocks above a sand or gravel drainage bed with gravel storage layer below.
• Rain Barrel: container (cistern) to collect roof runoff for later use (e.g., landscape irrigation) or release.
• Rooftop Disconnection: to simulate redirection of downspout discharge onto pervious landscaped areas and lawns instead of directly into storm drains.
• Vegetative Swale: grassed conveyance channel (drainage ditch or swale) with vegetation designed to slow down runoff to allow more time for infiltration into the native soil below.
The "bio-retention cell" LID control may be used to represent bioretention or biofiltration BMPs. For bio-retention cells, a number of LID process layers have been defined in SWMM and these are described below. Table G.1-7 provides parameters required for the standard "bio-retention cell" available in SWMM. The parameters are entered in the LID Control Editor.

Appendix G: Guidance for Continuous Simulation and Hydromodification Management Sizing Factors
G-21 February 26, 2016
Table G.1-7: Parameters for SWMM "Bio-Retention Cell" LID Control for Hydromodification Management Studies in San Diego
SWMM Parameter Name Unit Use in San Diego
Surface Berm Height also known as Storage Depth
inches Project-specific
Vegetative Volume Fraction also known as Vegetative Cover Fraction
--- 0
Surface Roughness --- 0 (this parameter is not applicable to bio-retention cell) Surface Slope --- 0 (this parameter is not applicable to bio-retention cell) Soil Thickness inches project-specific Porosity --- 0.40 Field Capacity --- 0.2 Wilting Point --- 0.1 Conductivity Inches/hour 5 Conductivity Slope --- 5 Suction Head inches 1.5 Storage Thickness also known as Height
inches Project-specific
Void Ratio --- 0.67 Seepage Rate also known as Conductivity
Inches/hour Conductivity from the storage layer refers to infiltration from the bottom of the structural BMP into the native soil. This variable is project-specific, see Section G.5.1. Use 0 if the bio-retention cell includes an impermeable liner
Clogging Factor --- 0 Underdrain Flow Coefficient Also known as Drain Coefficient
--- Project-specific
Flow Exponent Also known as Drain Exponent
--- Project-specific, typically 0.5
Offset Height Also known as Drain Offset Height
Inches Project-specific

Appendix G: Guidance for Continuous Simulation and Hydromodification Management Sizing Factors
G-22 February 26, 2016
Surface Layer
This process layer receives direct rainfall (and run-on from upstream subcatchments) and the resultant storm water is available for ponding, infiltration, evapotranspiration, or overflow to the outlet. The following parameters are used:
• Berm Height: This value is the maximum depth that water can pond above the ground surface before overflow occurs. In some cases, this volume may overlap with the hydraulic representation of existing surface storage or another proposed BMP facility. In any case, the user must avoid double-counting the physical storage volume.
• Vegetation Volume Fraction: This represents the surface storage volume that is occupied by the stems and leaves of vegetation within the bio-retention cell.
Soil Layer
This process layer is typically composed of an amended soil or compost mix. Water that infiltrates into this component is stored in the soil void space and is available for evapotranspiration via plant roots or can percolate into the storage layer below. The following parameters are used:
• Thickness: This parameter represents the depth of the amended soil layer.
• Porosity: Ratio of pore space volume to soil volume.
• Field Capacity: Pore water volume ratio after the soil has been drained.
• Wilting Point: Pore water volume ratio after the soil has been dried.
• Conductivity: This represents the saturated hydraulic conductivity.
• Conductivity Slope: Rate at which conductivity decreases with decreasing soil moisture content.
• Suction Head: This represents the capillary tension of water in the soil.
Porosity, conductivity and suction head values as a function of soil texture were included in Table G.1-5. The flow of water through partially saturated soil is less than under fully saturated conditions. The SWMM program accounts for this reduced hydraulic conductivity to predict the rate at which infiltrated water moves through a layer of unsaturated soil when modeling groundwater or LID controls. The conductivity slope is a dimensionless curve-fitting parameter that relates the partially saturated hydraulic conductivity to the soil moisture content.
Storage Layer
This process layer is typically composed of porous granular media such as crushed stone or gravel. Water that percolates into this component is stored in the void space and is available for infiltration into the native soil, or collected by an underdrain and discharged to the outlet. The following parameters are used:
Appendix G: Guidance for Continuous Simulation and Hydromodification Management Sizing Factors
G-23 February 26, 2016
• Thickness: This parameter represents the depth of the stone base.
• Void Ratio: Volume of void space relative to volume of solids. Note, by definition, Porosity = Void Ratio ÷ (1 + Void Ratio).
• Seepage Rate: Filtration rate from the granular media into the native soil below. A value of zero should be used if the facility has an impermeable bottom (e.g., concrete) or is underlain by an impermeable liner.
• Clogging Factor: This value is determined by the total volume of treated runoff to completely clog the bottom of the layer divided by the void volume of the layer.
Drain Layer
This process layer is used to characterize the discharge rate of an underdrain system to the outlet. The following parameters are used:
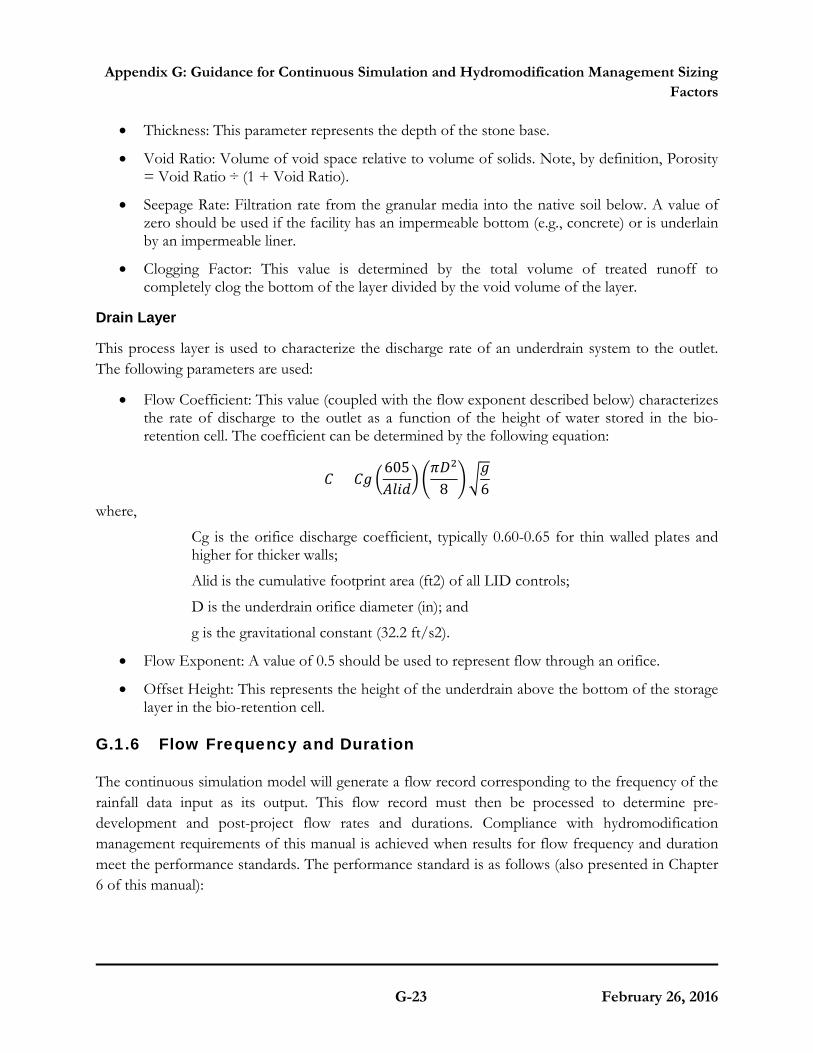
• Flow Coefficient: This value (coupled with the flow exponent described below) characterizes the rate of discharge to the outlet as a function of the height of water stored in the bio-retention cell. The coefficient can be determined by the following equation:
𝐷𝐷 = 𝐷𝐷𝐶𝐶 �605𝐴𝐴𝐴𝐴𝑖𝑖𝑑𝑑� �
𝜋𝜋𝐷𝐷2
8 ��𝐶𝐶6
where,
Cg is the orifice discharge coefficient, typically 0.60-0.65 for thin walled plates and higher for thicker walls;
Alid is the cumulative footprint area (ft2) of all LID controls;
D is the underdrain orifice diameter (in); and
g is the gravitational constant (32.2 ft/s2).
• Flow Exponent: A value of 0.5 should be used to represent flow through an orifice.
• Offset Height: This represents the height of the underdrain above the bottom of the storage layer in the bio-retention cell.
G.1.6 Flow Frequency and Duration
The continuous simulation model will generate a flow record corresponding to the frequency of the rainfall data input as its output. This flow record must then be processed to determine pre-development and post-project flow rates and durations. Compliance with hydromodification management requirements of this manual is achieved when results for flow frequency and duration meet the performance standards. The performance standard is as follows (also presented in Chapter 6 of this manual):

Appendix G: Guidance for Continuous Simulation and Hydromodification Management Sizing Factors
G-24 February 26, 2016
1. For flow rates ranging from 10 percent, 30 percent or 50 percent of the pre-development 2-year runoff event (0.1Q2, 0.3Q2, or 0.5Q2) to the pre-development 10-year runoff event (Q10), the post-project discharge rates and durations must not exceed the pre-development rates and durations by more than 10 percent.. The specific lower flow threshold will depend on the erosion susceptibility of the receiving stream for the project site (see Section 6.3.4).
To demonstrate that a flow control facility meets the hydromodification management performance standard a flow duration summary must be generated and compared for pre-development and post-project conditions. The following guidelines must be used for determining flow rates and durations.
G.1.6.1 Determining Flow Rates from Continuous Hourly Flow Output
Flow rates for hydromodification management studies in San Diego must be based on partial duration series analysis of the continuous hourly flow output. Partial duration series frequency calculations consider multiple storm events in a given year. To construct the partial duration series:
1. Parse the continuous hourly flow data into discrete runoff events. The following separation criteria may be used for separation of flow events: a new discrete event is designated when the flow falls below an artificially low flow value based on a fraction of the contributing watershed area (e.g., 0.002 to 0.005 cfs/acre) for a time period of 24 hours. Project applicants may consider other separation criteria provided the separation interval is not more than 24 hours and the criteria is clearly described in the submittal document.
2. Rank the peak flows from each discrete flow event, and compute the return interval or plotting position for each event.
Readers who are unfamiliar with how to compute the partial-duration series should consult reference books or online resources for additional information. For example, Hydrology for Engineers, by Linsley et all, 1982, discusses partial-duration series on pages 373-374 and computing recurrence intervals or plotting positions on page 359. Handbook of Applied Hydrology, by Chow, 1964, contains a detailed discussion of flow frequency analysis, including Annual Exceedance, Partial-Duration and Extreme Value series methods, in Chapter 8. The US Geological Survey (USGS) has several hydrologic study reports available online that use partial duration series statistics (see http://water.usgs.gov/ and http://water.usgs.gov/osw/bulletin17b/AGU_Langbein_1949.pdf).
Pre-development Q2 and Q10 must be determined from the partial duration analysis for the pre-development hourly flow record. Pre-development Q10 is the upper threshold of flow rates to be controlled in the post-project condition. The lower flow threshold is a fraction of the pre-development Q2 determined based on the erosion susceptibility of the receiving stream. Simply multiply the pre-development Q2 by the appropriate fraction (e.g., 0.1Q2) to determine the lower flow threshold.

Appendix G: Guidance for Continuous Simulation and Hydromodification Management Sizing Factors
G-25 February 26, 2016
G.1.6.2 Determining Flow Durations from Continuous Hourly Flow Output
Flow durations must be summarized within the range of flows to control. Flow duration statistics provide a simple summary of how often a particular flow rate is exceeded. To prepare this summary:
1. Rank the entire hourly runoff time series output.
2. Extract the portion of the ranked hourly time series output from the lower flow threshold to the upper flow threshold – this is the portion of the record to be summarized.
3. Divide the applicable portion of the record into 100 equal flow bins (compute the difference between the upper flow threshold (cfs) and lower flow threshold (cfs) and divide this value by 99 to establish the flow bin size).
4. Count the number of hours of flow that fall into each flow bin.
Both pre-development and post-project flow duration summary must be based on the entire length of the flow record. Compare the post-project flow duration summary to the pre-development flow duration summary to determine if it meets performance criteria for post-project flow rates and durations (criteria presented under Section G.1.6).

Appendix G: Guidance for Continuous Simulation and Hydromodification Management Sizing Factors
G-26 February 26, 2016
G.2 Sizing Factors for Hydromodification Management BMPs This section presents sizing factors for design of flow control structural BMPs based on the sizing factor method identified in Chapter 6.3.5.1. The sizing factors are re-printed from the "San Diego BMP Sizing Calculator Methodology," dated January 2012, prepared by Brown and Caldwell (herein "BMP Sizing Calculator Methodology"). The sizing factors are linked to the specific details and descriptions that were presented in the BMP Sizing Calculator Methodology, with limited options for modifications. The sizing factors were developed based on the 2007 MS4 Permit. Although the sizing factors were developed under the 2007 MS4 Permit, the unit runoff ratios and some sizing factors developed for flow control facility sizing may still be applied at the discretion of County staff. Some of the original sizing factors developed based on the 2007 MS4 Permit and presented in the BMP Sizing Calculator Methodology are not compatible with new requirements of the 2013 MS4 Permit, and therefore are not included in this manual. The sizing factor method is intended for simple studies that do not include diversion, do not include significant offsite area draining through the project from upstream, and do not include offsite area downstream of the project area. Use of the sizing factors is limited to the specific structural BMPs described in this Appendix. Sizing factors are available for the following specific structural BMPs:
• Full infiltration condition:
o Infiltration: sizing factors available for A and B soils represent a below-ground structure (dry well)
o Bioretention: sizing factors available for A and B soils represent a bioretention area with engineered soil media and gravel storage layer, with no underdrain and no impermeable liner
• Partial infiltration condition:
o Biofiltration with partial retention: sizing factors available for C and D soils represent a bioretention area with engineered soil media and gravel storage layer, with an underdrain, with gravel storage below the underdrain, with no impermeable liner
• No infiltration condition:
o Biofiltration: sizing factors available for C and D soils represent a bioretention area with engineered soil media and gravel storage layer, with an underdrain, without gravel storage below the underdrain, with no impermeable liner
o Biofiltration (formerly known as "flow-through planter") with impermeable liner: sizing factors available for C and D soils represent a biofiltration system with engineered soil media and gravel storage layer, with an underdrain, with or without gravel storage
Appendix G: Guidance for Continuous Simulation and Hydromodification Management Sizing Factors
G-27 February 26, 2016
below the underdrain, with an impermeable liner
• Other:
o Cistern: sizing factors available for A, B, C, or D soils represent a vessel with a low flow orifice outlet to meet the hydromodification management performance standard.
Sizing factors were created based on three rainfall basins: Lindbergh Field, Oceanside, and Lake Wohlford.
The following information is needed to use the sizing factors:
• Determine the appropriate rainfall basin for the project site from Figure G.2-1, Rainfall Basin Map
• Hydrologic soil group at the project site (use available information pertaining to existing underlying soil type such as soil maps published by the Natural Resources Conservation Service)
• Pre-development and post-project slope categories (low = 0% – 5%, moderate = 5% – 15%, steep = >15%)
• Area tributary to the structural BMP
• Area weighted runoff factor (C) for the area draining to the BMP from Table G.2-1. Note: runoff coefficients and adjustments presented in Appendices B.1 and B.2 are for pollutant control only and are not applicable for hydromodification management studies
• Fraction of Q2 to control (see Chapter 6.3.4)
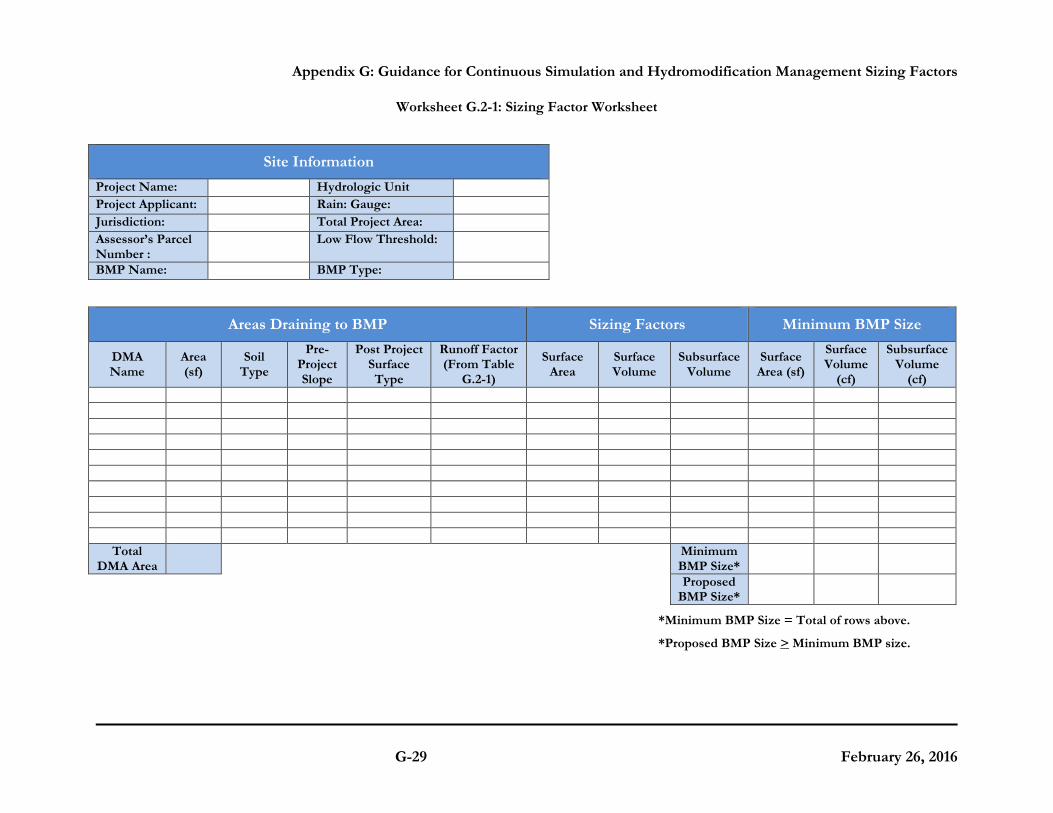
When using the sizing factor method, Worksheet G.2-1 may be used to present the calculations of the required minimum areas and/or volumes of BMPs as applicable.

Appendix G: Guidance for Continuous Simulation and Hydromodification Management Sizing Factors
G-28 February 26, 2016
Figure G.2-1: Appropriate Rain Gauge for Project Sites
Table G.2-1: Runoff factors for surfaces draining to BMPs for Hydromodification Sizing Factor Method
Surface Runoff Factor Roofs 1.0
Concrete 1.0 Pervious Concrete 0.10
Porous Asphalt 0.10 Grouted Unit Pavers 1.0
Solid Unit Pavers on granular base, min. 3/16 inch joint space 0.20 Crushed Aggregate 0.10
Turf block 0.10 Amended, mulched soils 0.10
Landscape 0.10
Appendix G: Guidance for Continuous Simulation and Hydromodification Management Sizing Factors
G-29 February 26, 2016
Worksheet G.2-1: Sizing Factor Worksheet
Areas Draining to BMP Sizing Factors Minimum BMP Size
DMA Name
Area (sf)
Soil Type
Pre-Project Slope
Post Project Surface Type
Runoff Factor (From Table
G.2-1)
Surface Area
Surface Volume
Subsurface Volume
Surface Area (sf)
Surface Volume
(cf)
Subsurface Volume
(cf)
Total DMA Area
Minimum BMP Size*
Proposed BMP Size*
*Minimum BMP Size = Total of rows above.
*Proposed BMP Size > Minimum BMP size.
Site Information
Project Name: Hydrologic Unit Project Applicant: Rain: Gauge: Jurisdiction: Total Project Area: Assessor’s Parcel Number :
Low Flow Threshold:
BMP Name: BMP Type:

Appendix G: Guidance for Continuous Simulation and Hydromodification Management Sizing Factors
G-30 February 26, 2016
G.2.1 Unit Runoff Ratios
Table G.2-2 presents unit runoff ratios for calculating pre-development Q2, to be used when applicable to determine the lower flow threshold for low flow orifice sizing for biofiltration with partial retention, biofiltration, biofiltration with impermeable liner, or cistern BMPs. There is no low flow orifice in the infiltration BMP or bioretention BMP. The unit runoff ratios are re-printed from the BMP Sizing Calculator methodology. Unit runoff ratios for "urban" and "impervious" cover categories were not transferred to this manual due to the requirement to control runoff to pre-development condition (see Chapter 6.3.3).
How to use the unit runoff ratios:
Obtain unit runoff ratio from Table G.2-2 based on the project's rainfall basin, hydrologic soil group, and pre-development slope (for redevelopment projects, pre-development slope may be considered if historic topographic information is available, otherwise use pre-project slope). Multiply the area tributary to the structural BMP (A, acres) by the unit runoff ratio (Q2, cfs/acre) to determine the pre-development Q2 to determine the lower flow threshold, to use for low flow orifice sizing.
Table G.2-2: Unit Runoff Ratios for Sizing Factor Method
Unit Runoff Ratios for Sizing Factor Method
Rain Gauge Soil Cover Slope Q2 (cfs/acre)
Q10 (cfs/ac)
Lake Wohlford A Scrub Low 0.136 0.369
Lake Wohlford A Scrub Moderate 0.207 0.416
Lake Wohlford A Scrub Steep 0.244 0.47
Lake Wohlford B Scrub Low 0.208 0.414
Lake Wohlford B Scrub Moderate 0.227 0.448
Lake Wohlford B Scrub Steep 0.253 0.482
Lake Wohlford C Scrub Low 0.245 0.458
Lake Wohlford C Scrub Moderate 0.253 0.481
Lake Wohlford C Scrub Steep 0.302 0.517
Lake Wohlford D Scrub Low 0.253 0.48
Lake Wohlford D Scrub Moderate 0.292 0.516

Appendix G: Guidance for Continuous Simulation and Hydromodification Management Sizing Factors
G-31 February 26, 2016
Unit Runoff Ratios for Sizing Factor Method
Rain Gauge Soil Cover Slope Q2 (cfs/acre)
Q10 (cfs/ac)
Lake Wohlford D Scrub Steep 0.351 0.538
Oceanside A Scrub Low 0.035 0.32
Oceanside A Scrub Moderate 0.093 0.367
Oceanside A Scrub Steep 0.163 0.42
Oceanside B Scrub Low 0.08 0.365
Oceanside B Scrub Moderate 0.134 0.4
Oceanside B Scrub Steep 0.181 0.433
Oceanside C Scrub Low 0.146 0.411
Oceanside C Scrub Moderate 0.185 0.433
Oceanside C Scrub Steep 0.217 0.458
Oceanside D Scrub Low 0.175 0.434
Oceanside D Scrub Moderate 0.212 0.455
Oceanside D Scrub Steep 0.244 0.571
Lindbergh A Scrub Low 0.003 0.081
Lindbergh A Scrub Moderate 0.018 0.137
Lindbergh A Scrub Steep 0.061 0.211
Lindbergh B Scrub Low 0.011 0.134
Lindbergh B Scrub Moderate 0.033 0.174
Lindbergh B Scrub Steep 0.077 0.23
Lindbergh C Scrub Low 0.028 0.19
Lindbergh C Scrub Moderate 0.075 0.232
Lindbergh C Scrub Steep 0.108 0.274
Lindbergh D Scrub Low 0.05 0.228
Lindbergh D Scrub Moderate 0.104 0.266
Lindbergh D Scrub Steep 0.143 0.319

Appendix G: Guidance for Continuous Simulation and Hydromodification Management Sizing Factors
G-32 February 26, 2016
G.2.2 Sizing Factors for "Infiltration" BMP
Table G.2-3 presents sizing factors for calculating the required surface area (A) and volume (V1) for an infiltration BMP. There is no underdrain and therefore no low flow orifice in the infiltration BMP. Sizing factors were developed for hydrologic soil groups A and B only. This BMP is not applicable in hydrologic soil groups C and D. The infiltration BMP is a below-ground structure (dry well) that consists of three layers:
• Ponding layer: a nominal 6-inch ponding layer should be included below the access hatch to allow for water spreading and infiltration during intense storms.
• Soil layer [topsoil layer]: 12 inches of soil should be included to remove pollutants. • Free draining layer [storage layer]: The drywell is sized assuming a 6-foot deep free draining
layer. However, designers could use shallower facility depths [provided the minimum volume and surface area are met].
Infiltration Facility BMP Example Illustration
Reference: "San Diego BMP Sizing Calculator Methodology," prepared by Brown and Caldwell, dated January 2012
How to use the sizing factors for flow control BMP Sizing:
Obtain sizing factors from Table G.2-3 based on the project's lower flow threshold fraction of Q2, hydrologic soil group, pre-development slope, and rain gauge (rainfall basin). Multiply the area

Appendix G: Guidance for Continuous Simulation and Hydromodification Management Sizing Factors
G-33 February 26, 2016
tributary to the structural BMP (A, square feet) by the area weighted runoff factor (C, unitless) (see Table G.2-1) by the sizing factors to determine the required surface area (A, square feet) and volume (V1, cubic feet) for the infiltration BMP. The civil engineer must provide the necessary volume and surface area of the BMP on the plans.
Additional steps to use this BMP as a combined pollutant control and flow control BMP:
To use this BMP as a combined pollutant control and flow control BMP, determine the size of the BMP using the sizing factors, then refer to Appendix B.4 to check whether the BMP meets performance standards for infiltration for pollutant control. If necessary, increase the surface area to meet the drawdown requirement for pollutant control.
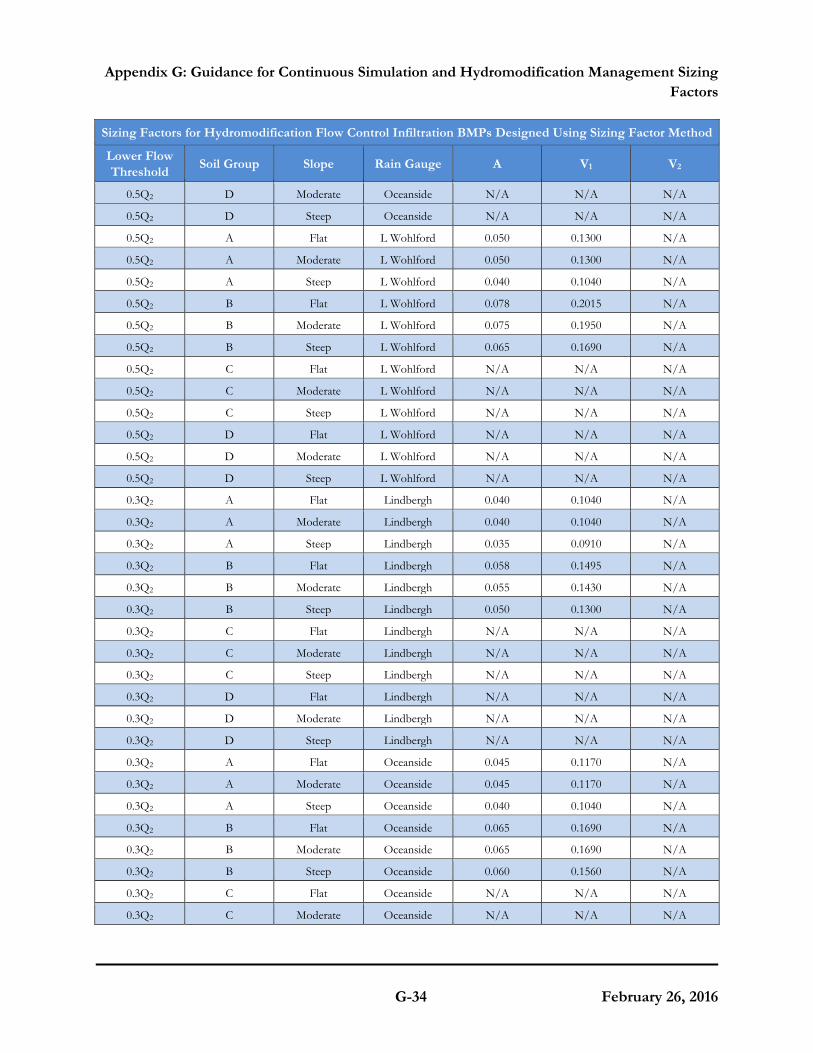
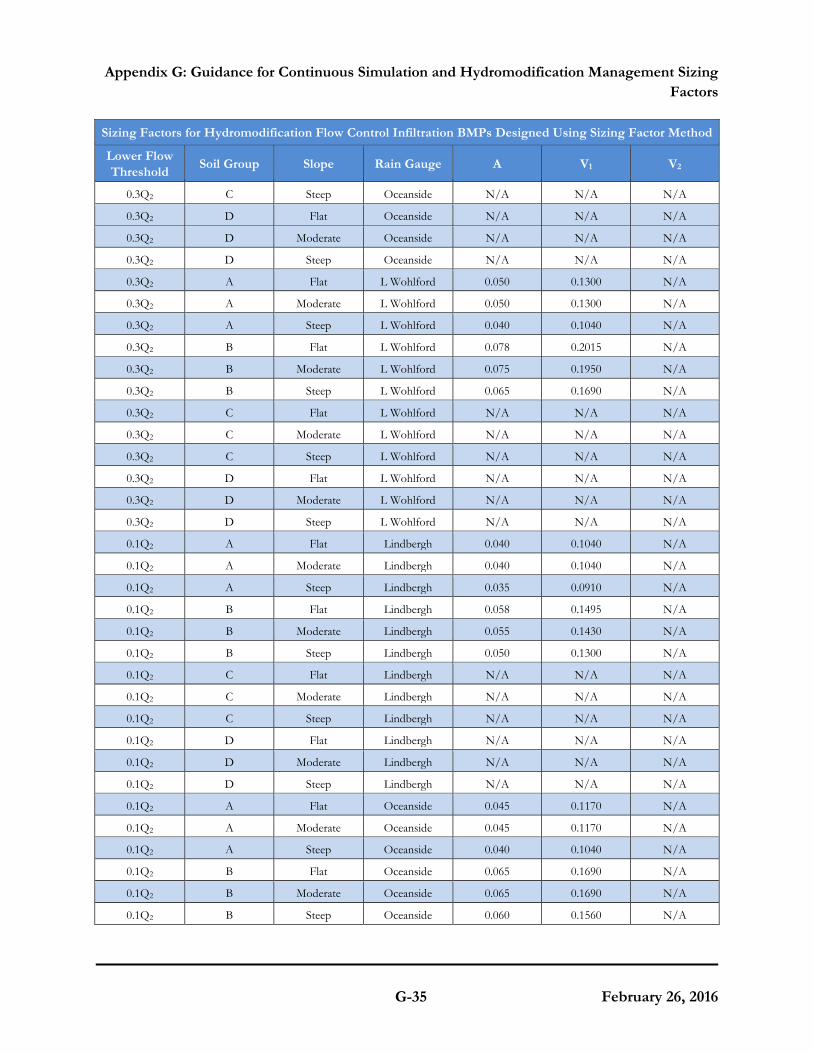
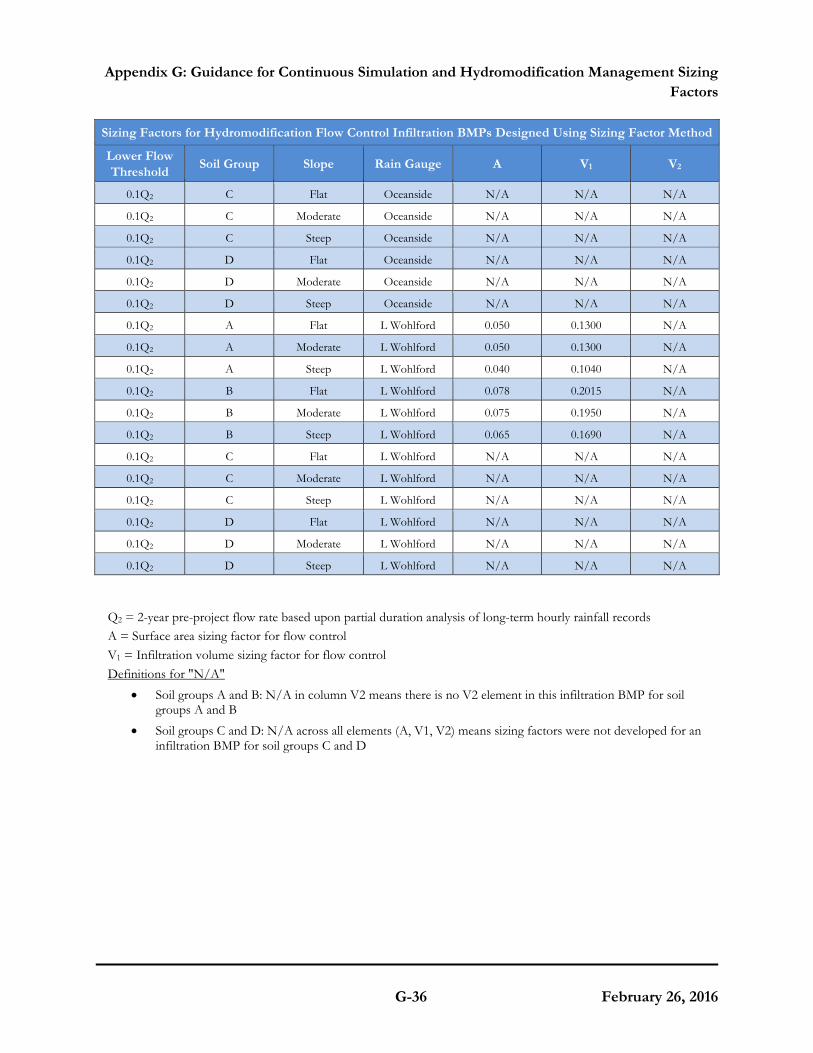
Table G.2-3: Sizing Factors for Hydromodification Flow Control Infiltration BMPs Designed Using Sizing Factor Method
Sizing Factors for Hydromodification Flow Control Infiltration BMPs Designed Using Sizing Factor Method
Lower Flow Threshold Soil Group Slope Rain Gauge A V1 V2
0.5Q2 A Flat Lindbergh 0.040 0.1040 N/A
0.5Q2 A Moderate Lindbergh 0.040 0.1040 N/A
0.5Q2 A Steep Lindbergh 0.035 0.0910 N/A
0.5Q2 B Flat Lindbergh 0.058 0.1495 N/A
0.5Q2 B Moderate Lindbergh 0.055 0.1430 N/A
0.5Q2 B Steep Lindbergh 0.050 0.1300 N/A
0.5Q2 C Flat Lindbergh N/A N/A N/A
0.5Q2 C Moderate Lindbergh N/A N/A N/A
0.5Q2 C Steep Lindbergh N/A N/A N/A
0.5Q2 D Flat Lindbergh N/A N/A N/A
0.5Q2 D Moderate Lindbergh N/A N/A N/A
0.5Q2 D Steep Lindbergh N/A N/A N/A
0.5Q2 A Flat Oceanside 0.045 0.1170 N/A
0.5Q2 A Moderate Oceanside 0.045 0.1170 N/A
0.5Q2 A Steep Oceanside 0.040 0.1040 N/A
0.5Q2 B Flat Oceanside 0.065 0.1690 N/A
0.5Q2 B Moderate Oceanside 0.065 0.1690 N/A
0.5Q2 B Steep Oceanside 0.060 0.1560 N/A
0.5Q2 C Flat Oceanside N/A N/A N/A
0.5Q2 C Moderate Oceanside N/A N/A N/A
0.5Q2 C Steep Oceanside N/A N/A N/A
0.5Q2 D Flat Oceanside N/A N/A N/A
Appendix G: Guidance for Continuous Simulation and Hydromodification Management Sizing Factors
G-34 February 26, 2016
Sizing Factors for Hydromodification Flow Control Infiltration BMPs Designed Using Sizing Factor Method
Lower Flow Threshold Soil Group Slope Rain Gauge A V1 V2
0.5Q2 D Moderate Oceanside N/A N/A N/A
0.5Q2 D Steep Oceanside N/A N/A N/A
0.5Q2 A Flat L Wohlford 0.050 0.1300 N/A
0.5Q2 A Moderate L Wohlford 0.050 0.1300 N/A
0.5Q2 A Steep L Wohlford 0.040 0.1040 N/A
0.5Q2 B Flat L Wohlford 0.078 0.2015 N/A
0.5Q2 B Moderate L Wohlford 0.075 0.1950 N/A
0.5Q2 B Steep L Wohlford 0.065 0.1690 N/A
0.5Q2 C Flat L Wohlford N/A N/A N/A
0.5Q2 C Moderate L Wohlford N/A N/A N/A
0.5Q2 C Steep L Wohlford N/A N/A N/A
0.5Q2 D Flat L Wohlford N/A N/A N/A
0.5Q2 D Moderate L Wohlford N/A N/A N/A
0.5Q2 D Steep L Wohlford N/A N/A N/A
0.3Q2 A Flat Lindbergh 0.040 0.1040 N/A
0.3Q2 A Moderate Lindbergh 0.040 0.1040 N/A
0.3Q2 A Steep Lindbergh 0.035 0.0910 N/A
0.3Q2 B Flat Lindbergh 0.058 0.1495 N/A
0.3Q2 B Moderate Lindbergh 0.055 0.1430 N/A
0.3Q2 B Steep Lindbergh 0.050 0.1300 N/A
0.3Q2 C Flat Lindbergh N/A N/A N/A
0.3Q2 C Moderate Lindbergh N/A N/A N/A
0.3Q2 C Steep Lindbergh N/A N/A N/A
0.3Q2 D Flat Lindbergh N/A N/A N/A
0.3Q2 D Moderate Lindbergh N/A N/A N/A
0.3Q2 D Steep Lindbergh N/A N/A N/A
0.3Q2 A Flat Oceanside 0.045 0.1170 N/A
0.3Q2 A Moderate Oceanside 0.045 0.1170 N/A
0.3Q2 A Steep Oceanside 0.040 0.1040 N/A
0.3Q2 B Flat Oceanside 0.065 0.1690 N/A
0.3Q2 B Moderate Oceanside 0.065 0.1690 N/A
0.3Q2 B Steep Oceanside 0.060 0.1560 N/A
0.3Q2 C Flat Oceanside N/A N/A N/A
0.3Q2 C Moderate Oceanside N/A N/A N/A
Appendix G: Guidance for Continuous Simulation and Hydromodification Management Sizing Factors
G-35 February 26, 2016
Sizing Factors for Hydromodification Flow Control Infiltration BMPs Designed Using Sizing Factor Method
Lower Flow Threshold Soil Group Slope Rain Gauge A V1 V2
0.3Q2 C Steep Oceanside N/A N/A N/A
0.3Q2 D Flat Oceanside N/A N/A N/A
0.3Q2 D Moderate Oceanside N/A N/A N/A
0.3Q2 D Steep Oceanside N/A N/A N/A
0.3Q2 A Flat L Wohlford 0.050 0.1300 N/A
0.3Q2 A Moderate L Wohlford 0.050 0.1300 N/A
0.3Q2 A Steep L Wohlford 0.040 0.1040 N/A
0.3Q2 B Flat L Wohlford 0.078 0.2015 N/A
0.3Q2 B Moderate L Wohlford 0.075 0.1950 N/A
0.3Q2 B Steep L Wohlford 0.065 0.1690 N/A
0.3Q2 C Flat L Wohlford N/A N/A N/A
0.3Q2 C Moderate L Wohlford N/A N/A N/A
0.3Q2 C Steep L Wohlford N/A N/A N/A
0.3Q2 D Flat L Wohlford N/A N/A N/A
0.3Q2 D Moderate L Wohlford N/A N/A N/A
0.3Q2 D Steep L Wohlford N/A N/A N/A
0.1Q2 A Flat Lindbergh 0.040 0.1040 N/A
0.1Q2 A Moderate Lindbergh 0.040 0.1040 N/A
0.1Q2 A Steep Lindbergh 0.035 0.0910 N/A
0.1Q2 B Flat Lindbergh 0.058 0.1495 N/A
0.1Q2 B Moderate Lindbergh 0.055 0.1430 N/A
0.1Q2 B Steep Lindbergh 0.050 0.1300 N/A
0.1Q2 C Flat Lindbergh N/A N/A N/A
0.1Q2 C Moderate Lindbergh N/A N/A N/A
0.1Q2 C Steep Lindbergh N/A N/A N/A
0.1Q2 D Flat Lindbergh N/A N/A N/A
0.1Q2 D Moderate Lindbergh N/A N/A N/A
0.1Q2 D Steep Lindbergh N/A N/A N/A
0.1Q2 A Flat Oceanside 0.045 0.1170 N/A
0.1Q2 A Moderate Oceanside 0.045 0.1170 N/A
0.1Q2 A Steep Oceanside 0.040 0.1040 N/A
0.1Q2 B Flat Oceanside 0.065 0.1690 N/A
0.1Q2 B Moderate Oceanside 0.065 0.1690 N/A
0.1Q2 B Steep Oceanside 0.060 0.1560 N/A
Appendix G: Guidance for Continuous Simulation and Hydromodification Management Sizing Factors
G-36 February 26, 2016
Sizing Factors for Hydromodification Flow Control Infiltration BMPs Designed Using Sizing Factor Method
Lower Flow Threshold Soil Group Slope Rain Gauge A V1 V2
0.1Q2 C Flat Oceanside N/A N/A N/A
0.1Q2 C Moderate Oceanside N/A N/A N/A
0.1Q2 C Steep Oceanside N/A N/A N/A
0.1Q2 D Flat Oceanside N/A N/A N/A
0.1Q2 D Moderate Oceanside N/A N/A N/A
0.1Q2 D Steep Oceanside N/A N/A N/A
0.1Q2 A Flat L Wohlford 0.050 0.1300 N/A
0.1Q2 A Moderate L Wohlford 0.050 0.1300 N/A
0.1Q2 A Steep L Wohlford 0.040 0.1040 N/A
0.1Q2 B Flat L Wohlford 0.078 0.2015 N/A
0.1Q2 B Moderate L Wohlford 0.075 0.1950 N/A
0.1Q2 B Steep L Wohlford 0.065 0.1690 N/A
0.1Q2 C Flat L Wohlford N/A N/A N/A
0.1Q2 C Moderate L Wohlford N/A N/A N/A
0.1Q2 C Steep L Wohlford N/A N/A N/A
0.1Q2 D Flat L Wohlford N/A N/A N/A
0.1Q2 D Moderate L Wohlford N/A N/A N/A
0.1Q2 D Steep L Wohlford N/A N/A N/A
Q2 = 2-year pre-project flow rate based upon partial duration analysis of long-term hourly rainfall records A = Surface area sizing factor for flow control V1 = Infiltration volume sizing factor for flow control Definitions for "N/A"
• Soil groups A and B: N/A in column V2 means there is no V2 element in this infiltration BMP for soil groups A and B
• Soil groups C and D: N/A across all elements (A, V1, V2) means sizing factors were not developed for an infiltration BMP for soil groups C and D

Appendix G: Guidance for Continuous Simulation and Hydromodification Management Sizing Factors
G-37 February 26, 2016
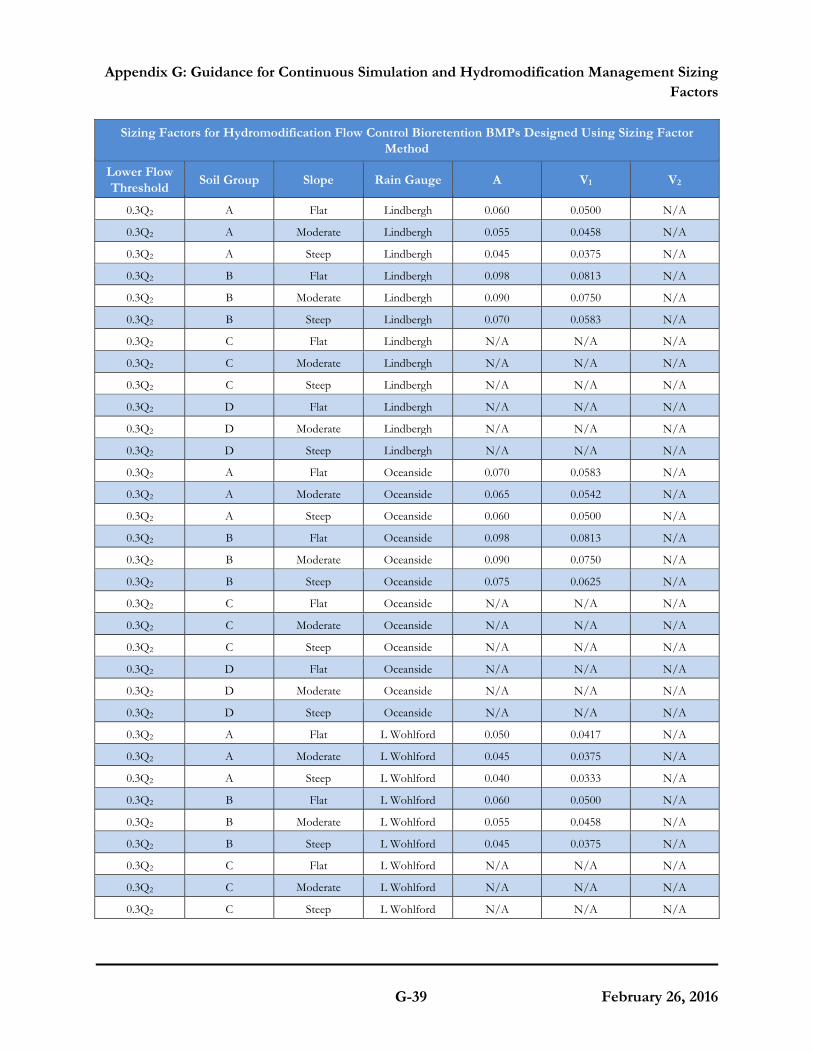
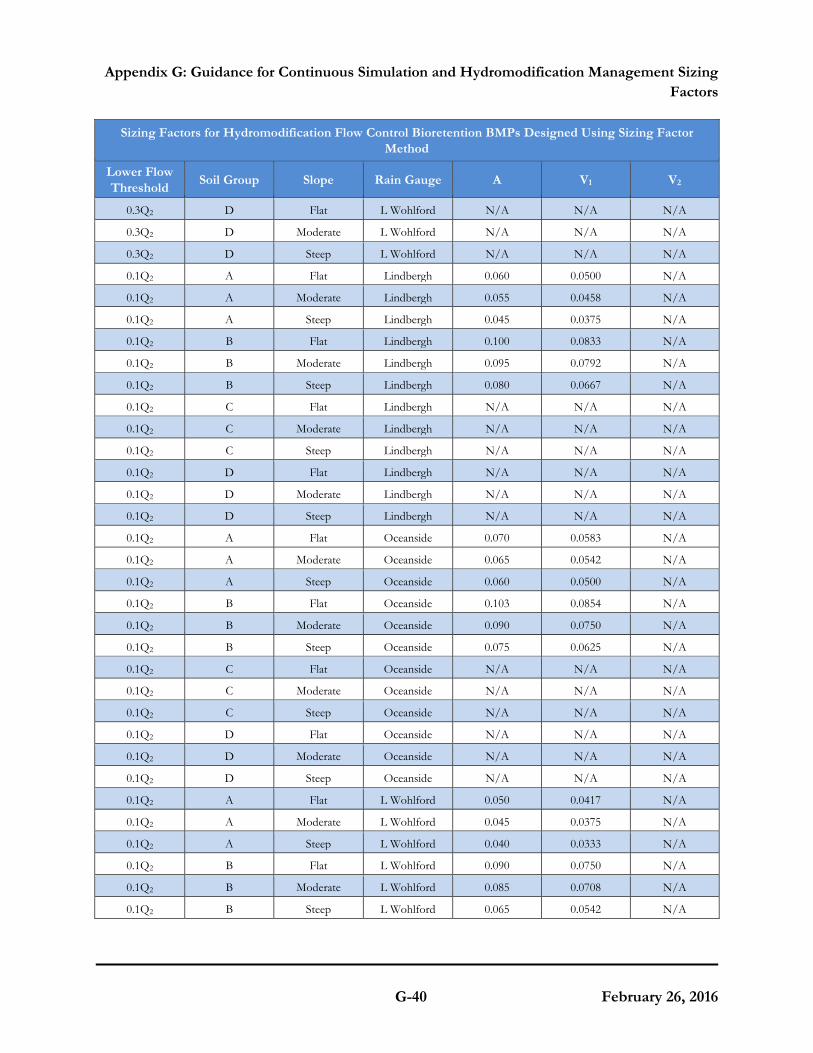
G.2.3 Sizing Factors for Bioretention
Table G.2-4 presents sizing factors for calculating the required surface area (A) and surface volume (V1) for the bioretention BMP. The bioretention BMP consists of two layers:
• Ponding layer: 10-inches active storage, [minimum] 2-inches of freeboard above overflow relief
• Growing medium: 18-inches of soil [bioretention soil media]
This BMP is applicable in soil groups A and B. This BMP does not include an underdrain or a low flow orifice. This BMP does not include an impermeable layer at the bottom of the facility to prevent infiltration into underlying soils, regardless of hydrologic soil group. If a facility is to be lined, the designer must use the sizing factors for biofiltration with impermeable layer (formerly known as "flow-through planter").
How to use the sizing factors for flow control BMP Sizing:
Obtain sizing factors from Table G.2-4 based on the project's lower flow threshold fraction of Q2, hydrologic soil group, pre-development slope, and rain gauge (rainfall basin). Multiply the area tributary to the structural BMP (A, square feet) by the area weighted runoff factor (C, unitless) (see Table G.2-1) by the sizing factors to determine the required surface area (A, square feet) and surface volume (V1, cubic feet). Note the surface volume is the ponding layer. The BMP must also include 18 inches of bioretention soil media which does not contribute to V1. The civil engineer must provide the necessary volume and surface area of the BMP on the plans.
Additional steps to use this BMP as a combined pollutant control and flow control BMP:
To use this BMP as a combined pollutant control and flow control BMP, determine the size of the BMP using the sizing factors, then refer to Appendix B.4 to check whether the BMP meets performance standards for infiltration for pollutant control. If necessary, adjust the surface area, depth of storage layer, or depth of growing medium as needed to meet pollutant control standards.
Table G.2-4: Sizing Factors for Hydromodification Flow Control Bioretention BMPs Designed Using Sizing Factor Method
Sizing Factors for Hydromodification Flow Control Bioretention BMPs Designed Using Sizing Factor Method
Lower Flow Threshold Soil Group Slope Rain Gauge A V1 V2
0.5Q2 A Flat Lindbergh 0.060 0.0500 N/A
0.5Q2 A Moderate Lindbergh 0.055 0.0458 N/A
0.5Q2 A Steep Lindbergh 0.045 0.0375 N/A

Appendix G: Guidance for Continuous Simulation and Hydromodification Management Sizing Factors
G-38 February 26, 2016
Sizing Factors for Hydromodification Flow Control Bioretention BMPs Designed Using Sizing Factor Method
Lower Flow Threshold Soil Group Slope Rain Gauge A V1 V2
0.5Q2 B Flat Lindbergh 0.093 0.0771 N/A
0.5Q2 B Moderate Lindbergh 0.085 0.0708 N/A
0.5Q2 B Steep Lindbergh 0.065 0.0542 N/A
0.5Q2 C Flat Lindbergh N/A N/A N/A
0.5Q2 C Moderate Lindbergh N/A N/A N/A
0.5Q2 C Steep Lindbergh N/A N/A N/A
0.5Q2 D Flat Lindbergh N/A N/A N/A
0.5Q2 D Moderate Lindbergh N/A N/A N/A
0.5Q2 D Steep Lindbergh N/A N/A N/A
0.5Q2 A Flat Oceanside 0.070 0.0583 N/A
0.5Q2 A Moderate Oceanside 0.065 0.0542 N/A
0.5Q2 A Steep Oceanside 0.060 0.0500 N/A
0.5Q2 B Flat Oceanside 0.098 0.0813 N/A
0.5Q2 B Moderate Oceanside 0.090 0.0750 N/A
0.5Q2 B Steep Oceanside 0.075 0.0625 N/A
0.5Q2 C Flat Oceanside N/A N/A N/A
0.5Q2 C Moderate Oceanside N/A N/A N/A
0.5Q2 C Steep Oceanside N/A N/A N/A
0.5Q2 D Flat Oceanside N/A N/A N/A
0.5Q2 D Moderate Oceanside N/A N/A N/A
0.5Q2 D Steep Oceanside N/A N/A N/A
0.5Q2 A Flat L Wohlford 0.050 0.0417 N/A
0.5Q2 A Moderate L Wohlford 0.045 0.0375 N/A
0.5Q2 A Steep L Wohlford 0.040 0.0333 N/A
0.5Q2 B Flat L Wohlford 0.048 0.0396 N/A
0.5Q2 B Moderate L Wohlford 0.045 0.0375 N/A
0.5Q2 B Steep L Wohlford 0.040 0.0333 N/A
0.5Q2 C Flat L Wohlford N/A N/A N/A
0.5Q2 C Moderate L Wohlford N/A N/A N/A
0.5Q2 C Steep L Wohlford N/A N/A N/A
0.5Q2 D Flat L Wohlford N/A N/A N/A
0.5Q2 D Moderate L Wohlford N/A N/A N/A
0.5Q2 D Steep L Wohlford N/A N/A N/A
Appendix G: Guidance for Continuous Simulation and Hydromodification Management Sizing Factors
G-39 February 26, 2016
Sizing Factors for Hydromodification Flow Control Bioretention BMPs Designed Using Sizing Factor Method
Lower Flow Threshold Soil Group Slope Rain Gauge A V1 V2
0.3Q2 A Flat Lindbergh 0.060 0.0500 N/A
0.3Q2 A Moderate Lindbergh 0.055 0.0458 N/A
0.3Q2 A Steep Lindbergh 0.045 0.0375 N/A
0.3Q2 B Flat Lindbergh 0.098 0.0813 N/A
0.3Q2 B Moderate Lindbergh 0.090 0.0750 N/A
0.3Q2 B Steep Lindbergh 0.070 0.0583 N/A
0.3Q2 C Flat Lindbergh N/A N/A N/A
0.3Q2 C Moderate Lindbergh N/A N/A N/A
0.3Q2 C Steep Lindbergh N/A N/A N/A
0.3Q2 D Flat Lindbergh N/A N/A N/A
0.3Q2 D Moderate Lindbergh N/A N/A N/A
0.3Q2 D Steep Lindbergh N/A N/A N/A
0.3Q2 A Flat Oceanside 0.070 0.0583 N/A
0.3Q2 A Moderate Oceanside 0.065 0.0542 N/A
0.3Q2 A Steep Oceanside 0.060 0.0500 N/A
0.3Q2 B Flat Oceanside 0.098 0.0813 N/A
0.3Q2 B Moderate Oceanside 0.090 0.0750 N/A
0.3Q2 B Steep Oceanside 0.075 0.0625 N/A
0.3Q2 C Flat Oceanside N/A N/A N/A
0.3Q2 C Moderate Oceanside N/A N/A N/A
0.3Q2 C Steep Oceanside N/A N/A N/A
0.3Q2 D Flat Oceanside N/A N/A N/A
0.3Q2 D Moderate Oceanside N/A N/A N/A
0.3Q2 D Steep Oceanside N/A N/A N/A
0.3Q2 A Flat L Wohlford 0.050 0.0417 N/A
0.3Q2 A Moderate L Wohlford 0.045 0.0375 N/A
0.3Q2 A Steep L Wohlford 0.040 0.0333 N/A
0.3Q2 B Flat L Wohlford 0.060 0.0500 N/A
0.3Q2 B Moderate L Wohlford 0.055 0.0458 N/A
0.3Q2 B Steep L Wohlford 0.045 0.0375 N/A
0.3Q2 C Flat L Wohlford N/A N/A N/A
0.3Q2 C Moderate L Wohlford N/A N/A N/A
0.3Q2 C Steep L Wohlford N/A N/A N/A
Appendix G: Guidance for Continuous Simulation and Hydromodification Management Sizing Factors
G-40 February 26, 2016
Sizing Factors for Hydromodification Flow Control Bioretention BMPs Designed Using Sizing Factor Method
Lower Flow Threshold Soil Group Slope Rain Gauge A V1 V2
0.3Q2 D Flat L Wohlford N/A N/A N/A
0.3Q2 D Moderate L Wohlford N/A N/A N/A
0.3Q2 D Steep L Wohlford N/A N/A N/A
0.1Q2 A Flat Lindbergh 0.060 0.0500 N/A
0.1Q2 A Moderate Lindbergh 0.055 0.0458 N/A
0.1Q2 A Steep Lindbergh 0.045 0.0375 N/A
0.1Q2 B Flat Lindbergh 0.100 0.0833 N/A
0.1Q2 B Moderate Lindbergh 0.095 0.0792 N/A
0.1Q2 B Steep Lindbergh 0.080 0.0667 N/A
0.1Q2 C Flat Lindbergh N/A N/A N/A
0.1Q2 C Moderate Lindbergh N/A N/A N/A
0.1Q2 C Steep Lindbergh N/A N/A N/A
0.1Q2 D Flat Lindbergh N/A N/A N/A
0.1Q2 D Moderate Lindbergh N/A N/A N/A
0.1Q2 D Steep Lindbergh N/A N/A N/A
0.1Q2 A Flat Oceanside 0.070 0.0583 N/A
0.1Q2 A Moderate Oceanside 0.065 0.0542 N/A
0.1Q2 A Steep Oceanside 0.060 0.0500 N/A
0.1Q2 B Flat Oceanside 0.103 0.0854 N/A
0.1Q2 B Moderate Oceanside 0.090 0.0750 N/A
0.1Q2 B Steep Oceanside 0.075 0.0625 N/A
0.1Q2 C Flat Oceanside N/A N/A N/A
0.1Q2 C Moderate Oceanside N/A N/A N/A
0.1Q2 C Steep Oceanside N/A N/A N/A
0.1Q2 D Flat Oceanside N/A N/A N/A
0.1Q2 D Moderate Oceanside N/A N/A N/A
0.1Q2 D Steep Oceanside N/A N/A N/A
0.1Q2 A Flat L Wohlford 0.050 0.0417 N/A
0.1Q2 A Moderate L Wohlford 0.045 0.0375 N/A
0.1Q2 A Steep L Wohlford 0.040 0.0333 N/A
0.1Q2 B Flat L Wohlford 0.090 0.0750 N/A
0.1Q2 B Moderate L Wohlford 0.085 0.0708 N/A
0.1Q2 B Steep L Wohlford 0.065 0.0542 N/A

Appendix G: Guidance for Continuous Simulation and Hydromodification Management Sizing Factors
G-41 February 26, 2016
Sizing Factors for Hydromodification Flow Control Bioretention BMPs Designed Using Sizing Factor Method
Lower Flow Threshold Soil Group Slope Rain Gauge A V1 V2
0.1Q2 C Flat L Wohlford N/A N/A N/A
0.1Q2 C Moderate L Wohlford N/A N/A N/A
0.1Q2 C Steep L Wohlford N/A N/A N/A
0.1Q2 D Flat L Wohlford N/A N/A N/A
0.1Q2 D Moderate L Wohlford N/A N/A N/A
0.1Q2 D Steep L Wohlford N/A N/A N/A
Q2 = 2-year pre-project flow rate based upon partial duration analysis of long-term hourly rainfall records A = Surface area sizing factor for flow control V1 = Surface volume sizing factor for flow control Definitions for "N/A"
• Soil groups A and B: N/A in column V2 means there is no V2 element in this bioretention BMP for soil groups A and B
• Soil groups C and D: N/A in all elements (A, V1, V2) for soil groups C and D means sizing factors developed for "bioretention" in soil groups C and D under the 2007 MS4 Permit are not applicable in the "bioretention" category under the 2013 MS4 Permit because they were developed with the assumption that an underdrain is operating. Refer to Appendix G.2.4, Sizing Factors for Biofiltration with Partial Retention and Biofiltration

Appendix G: Guidance for Continuous Simulation and Hydromodification Management Sizing Factors
G-42 February 26, 2016
G.2.4 Sizing Factors for Biofiltration with Partial Retention and Biofiltration
Table G.2-5 presents sizing factors for calculating the required surface area (A), surface volume (V1), and sub-surface volume (V2) for a biofiltration with partial retention and biofiltration BMP. The BMPs consist of three layers:
• Ponding layer: 10-inches active storage, [minimum] 2-inches of freeboard above overflow relief
• Growing medium: 18-inches of soil [bioretention soil media] • Storage layer: 30-inches of gravel at 40 percent porosity [18 inches active storage above
underdrain is required, additional dead storage depth below underdrain is optional and can vary]
This BMP is applicable in soil groups C and D. This BMP includes an underdrain with a low flow orifice 18 inches (1.5 feet) below the bottom of the growing medium. This BMP can include additional dead storage below the underdrain. This BMP does not include an impermeable layer at the bottom of the facility to prevent infiltration into underlying soils, regardless of hydrologic soil group. If a facility is to be lined, the designer must use the sizing factors for biofiltration with impermeable liner (formerly known as "flow-through planter").
Biofiltration BMP Example Illustration
Reference: "San Diego BMP Sizing Calculator Methodology," prepared by Brown and Caldwell, dated January 2012

Appendix G: Guidance for Continuous Simulation and Hydromodification Management Sizing Factors
G-43 February 26, 2016
How to use the sizing factors for flow control BMP Sizing:
Obtain sizing factors from Table G.2-5 based on the project's lower flow threshold fraction of Q2, hydrologic soil group, pre-development slope, and rain gauge (rainfall basin). Multiply the area tributary to the structural BMP (A, square feet) by the area weighted runoff factor (C, unitless) (see Table G.2-1) by the sizing factors to determine the required surface area (A, square feet), surface volume (V1, cubic feet), and sub-surface volume (V2, cubic feet). Select a low flow orifice for the underdrain that will discharge the lower flow threshold flow when there is 1.5 feet of head over the underdrain orifice. The civil engineer must provide the necessary volume and surface area of the BMP and the underdrain and orifice detail on the plans.
Additional steps to use this BMP as a combined pollutant control and flow control BMP:
To use this BMP as a combined pollutant control and flow control BMP, determine the size of the BMP using the sizing factors. For BMPs without dead storage below the underdrain, then refer to Appendix B.5 and Appendix F to check whether the BMP meets performance standards for biofiltration for pollutant control. If necessary, adjust the surface area, depth of storage layer, or depth of growing medium as needed to meet pollutant control standards. For BMPs with dead storage below the underdrain, refer to Appendix B.4 to determine the portion of the DCV to be infiltrated for pollutant control, then Appendix B.5 and Appendix F to check whether the BMP meets performance standards for biofiltration for pollutant control for the balance of the DCV. If necessary, adjust the surface area, depth of storage layer, or depth of growing medium as needed to meet pollutant control standards.
Table G.2-5: Sizing Factors for Hydromodification Flow Control Biofiltration with Partial Retention and Biofiltration BMPs Designed Using Sizing Factor Method
Sizing Factors for Hydromodification Flow Control Biofiltration with Partial Retention and Biofiltration BMPs Designed Using Sizing Factor Method
Lower Flow Threshold Soil Group Slope Rain Gauge A V1 V2
0.5Q2 A Flat Lindbergh N/A N/A N/A
0.5Q2 A Moderate Lindbergh N/A N/A N/A
0.5Q2 A Steep Lindbergh N/A N/A N/A
0.5Q2 B Flat Lindbergh N/A N/A N/A
0.5Q2 B Moderate Lindbergh N/A N/A N/A
0.5Q2 B Steep Lindbergh N/A N/A N/A
0.5Q2 C Flat Lindbergh 0.100 0.0833 0.0600
0.5Q2 C Moderate Lindbergh 0.100 0.0833 0.0600
0.5Q2 C Steep Lindbergh 0.075 0.0625 0.0450
0.5Q2 D Flat Lindbergh 0.080 0.0667 0.0480

Appendix G: Guidance for Continuous Simulation and Hydromodification Management Sizing Factors
G-44 February 26, 2016
Sizing Factors for Hydromodification Flow Control Biofiltration with Partial Retention and Biofiltration BMPs Designed Using Sizing Factor Method
Lower Flow Threshold Soil Group Slope Rain Gauge A V1 V2
0.5Q2 D Moderate Lindbergh 0.080 0.0667 0.0480
0.5Q2 D Steep Lindbergh 0.060 0.0500 0.0360
0.5Q2 A Flat Oceanside N/A N/A N/A
0.5Q2 A Moderate Oceanside N/A N/A N/A
0.5Q2 A Steep Oceanside N/A N/A N/A
0.5Q2 B Flat Oceanside N/A N/A N/A
0.5Q2 B Moderate Oceanside N/A N/A N/A
0.5Q2 B Steep Oceanside N/A N/A N/A
0.5Q2 C Flat Oceanside 0.075 0.0625 0.0450
0.5Q2 C Moderate Oceanside 0.075 0.0625 0.0450
0.5Q2 C Steep Oceanside 0.060 0.0500 0.0360
0.5Q2 D Flat Oceanside 0.065 0.0542 0.0390
0.5Q2 D Moderate Oceanside 0.065 0.0542 0.0390
0.5Q2 D Steep Oceanside 0.050 0.0417 0.0300
0.5Q2 A Flat L Wohlford N/A N/A N/A
0.5Q2 A Moderate L Wohlford N/A N/A N/A
0.5Q2 A Steep L Wohlford N/A N/A N/A
0.5Q2 B Flat L Wohlford N/A N/A N/A
0.5Q2 B Moderate L Wohlford N/A N/A N/A
0.5Q2 B Steep L Wohlford N/A N/A N/A
0.5Q2 C Flat L Wohlford 0.065 0.0542 0.0390
0.5Q2 C Moderate L Wohlford 0.065 0.0542 0.0390
0.5Q2 C Steep L Wohlford 0.050 0.0417 0.0300
0.5Q2 D Flat L Wohlford 0.055 0.0458 0.0330
0.5Q2 D Moderate L Wohlford 0.055 0.0458 0.0330
0.5Q2 D Steep L Wohlford 0.045 0.0375 0.0270
0.3Q2 A Flat Lindbergh N/A N/A N/A
0.3Q2 A Moderate Lindbergh N/A N/A N/A
0.3Q2 A Steep Lindbergh N/A N/A N/A
0.3Q2 B Flat Lindbergh N/A N/A N/A
0.3Q2 B Moderate Lindbergh N/A N/A N/A
0.3Q2 B Steep Lindbergh N/A N/A N/A
0.3Q2 C Flat Lindbergh 0.110 0.0917 0.0660

Appendix G: Guidance for Continuous Simulation and Hydromodification Management Sizing Factors
G-45 February 26, 2016
Sizing Factors for Hydromodification Flow Control Biofiltration with Partial Retention and Biofiltration BMPs Designed Using Sizing Factor Method
Lower Flow Threshold Soil Group Slope Rain Gauge A V1 V2
0.3Q2 C Moderate Lindbergh 0.110 0.0917 0.0660
0.3Q2 C Steep Lindbergh 0.085 0.0708 0.0510
0.3Q2 D Flat Lindbergh 0.100 0.0833 0.0600
0.3Q2 D Moderate Lindbergh 0.100 0.0833 0.0600
0.3Q2 D Steep Lindbergh 0.070 0.0583 0.0420
0.3Q2 A Flat Oceanside N/A N/A N/A
0.3Q2 A Moderate Oceanside N/A N/A N/A
0.3Q2 A Steep Oceanside N/A N/A N/A
0.3Q2 B Flat Oceanside N/A N/A N/A
0.3Q2 B Moderate Oceanside N/A N/A N/A
0.3Q2 B Steep Oceanside N/A N/A N/A
0.3Q2 C Flat Oceanside 0.100 0.0833 0.0600
0.3Q2 C Moderate Oceanside 0.100 0.0833 0.0600
0.3Q2 C Steep Oceanside 0.080 0.0667 0.0480
0.3Q2 D Flat Oceanside 0.085 0.0708 0.0510
0.3Q2 D Moderate Oceanside 0.085 0.0708 0.0510
0.3Q2 D Steep Oceanside 0.065 0.0542 0.0390
0.3Q2 A Flat L Wohlford N/A N/A N/A
0.3Q2 A Moderate L Wohlford N/A N/A N/A
0.3Q2 A Steep L Wohlford N/A N/A N/A
0.3Q2 B Flat L Wohlford N/A N/A N/A
0.3Q2 B Moderate L Wohlford N/A N/A N/A
0.3Q2 B Steep L Wohlford N/A N/A N/A
0.3Q2 C Flat L Wohlford 0.075 0.0625 0.0450
0.3Q2 C Moderate L Wohlford 0.075 0.0625 0.0450
0.3Q2 C Steep L Wohlford 0.060 0.0500 0.0360
0.3Q2 D Flat L Wohlford 0.065 0.0542 0.0390
0.3Q2 D Moderate L Wohlford 0.065 0.0542 0.0390
0.3Q2 D Steep L Wohlford 0.050 0.0417 0.0300
0.1Q2 A Flat Lindbergh N/A N/A N/A
0.1Q2 A Moderate Lindbergh N/A N/A N/A
0.1Q2 A Steep Lindbergh N/A N/A N/A
0.1Q2 B Flat Lindbergh N/A N/A N/A

Appendix G: Guidance for Continuous Simulation and Hydromodification Management Sizing Factors
G-46 February 26, 2016
Sizing Factors for Hydromodification Flow Control Biofiltration with Partial Retention and Biofiltration BMPs Designed Using Sizing Factor Method
Lower Flow Threshold Soil Group Slope Rain Gauge A V1 V2
0.1Q2 B Moderate Lindbergh N/A N/A N/A
0.1Q2 B Steep Lindbergh N/A N/A N/A
0.1Q2 C Flat Lindbergh 0.145 0.1208 0.0870
0.1Q2 C Moderate Lindbergh 0.145 0.1208 0.0870
0.1Q2 C Steep Lindbergh 0.120 0.1000 0.0720
0.1Q2 D Flat Lindbergh 0.160 0.1333 0.0960
0.1Q2 D Moderate Lindbergh 0.160 0.1333 0.0960
0.1Q2 D Steep Lindbergh 0.115 0.0958 0.0690
0.1Q2 A Flat Oceanside N/A N/A N/A
0.1Q2 A Moderate Oceanside N/A N/A N/A
0.1Q2 A Steep Oceanside N/A N/A N/A
0.1Q2 B Flat Oceanside N/A N/A N/A
0.1Q2 B Moderate Oceanside N/A N/A N/A
0.1Q2 B Steep Oceanside N/A N/A N/A
0.1Q2 C Flat Oceanside 0.130 0.1083 0.0780
0.1Q2 C Moderate Oceanside 0.130 0.1083 0.0780
0.1Q2 C Steep Oceanside 0.110 0.0917 0.0660
0.1Q2 D Flat Oceanside 0.130 0.1083 0.0780
0.1Q2 D Moderate Oceanside 0.130 0.1083 0.0780
0.1Q2 D Steep Oceanside 0.065 0.0542 0.0390
0.1Q2 A Flat L Wohlford N/A N/A N/A
0.1Q2 A Moderate L Wohlford N/A N/A N/A
0.1Q2 A Steep L Wohlford N/A N/A N/A
0.1Q2 B Flat L Wohlford N/A N/A N/A
0.1Q2 B Moderate L Wohlford N/A N/A N/A
0.1Q2 B Steep L Wohlford N/A N/A N/A
0.1Q2 C Flat L Wohlford 0.110 0.0917 0.0660
0.1Q2 C Moderate L Wohlford 0.110 0.0917 0.0660
0.1Q2 C Steep L Wohlford 0.090 0.0750 0.0540
0.1Q2 D Flat L Wohlford 0.100 0.0833 0.0600
0.1Q2 D Moderate L Wohlford 0.100 0.0833 0.0600
0.1Q2 D Steep L Wohlford 0.075 0.0625 0.0450
Q2 = 2-year pre-project flow rate based upon partial duration analysis of long-term hourly rainfall records A = Surface area sizing factor for flow control
Appendix G: Guidance for Continuous Simulation and Hydromodification Management Sizing Factors
G-47 February 26, 2016
V1 = Surface volume sizing factor for flow control V2 = Subsurface volume sizing factor for flow control Definitions for "N/A"
• Soil groups A and B: N/A in all elements (A, V1, V2) for soil groups A and B means sizing factors were not developed for biofiltration (i.e., with an underdrain) for soil groups A and B. If no underdrain is proposed, refer to Appendix G.2.3, Sizing Factors for Bioretention. If an underdrain is proposed, use project-specific continuous simulation modeling.
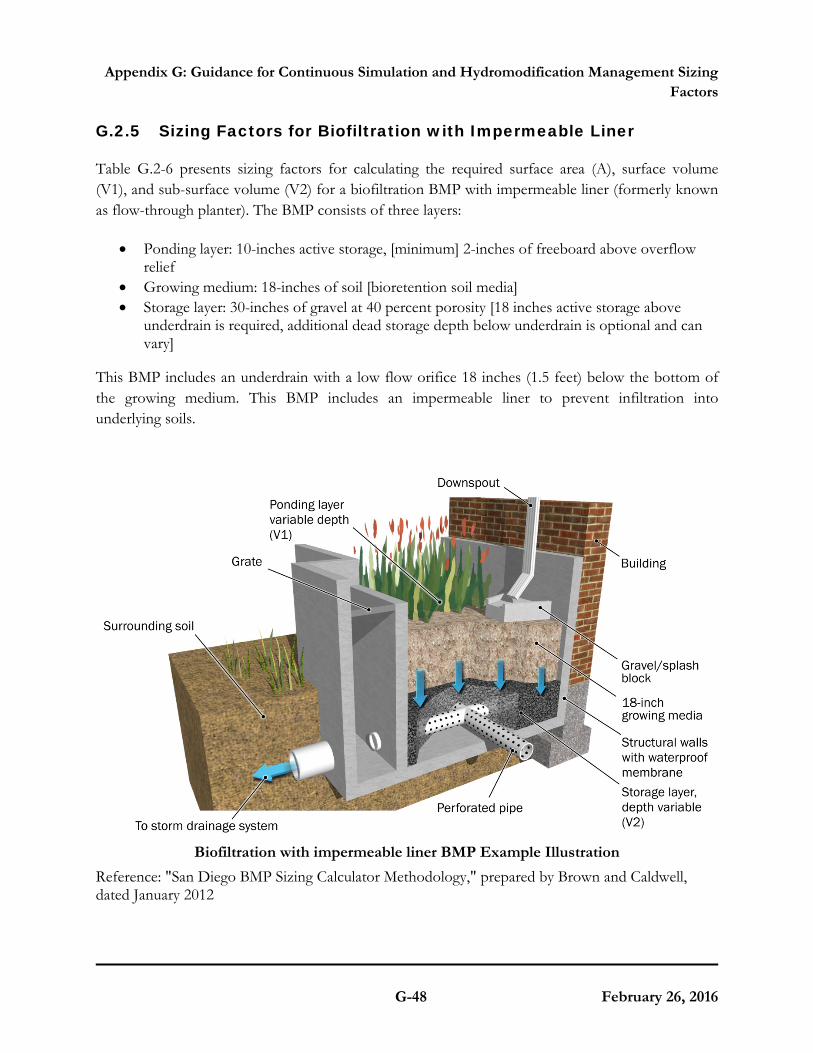
Appendix G: Guidance for Continuous Simulation and Hydromodification Management Sizing Factors
G-48 February 26, 2016
G.2.5 Sizing Factors for Biofiltration with Impermeable Liner
Table G.2-6 presents sizing factors for calculating the required surface area (A), surface volume (V1), and sub-surface volume (V2) for a biofiltration BMP with impermeable liner (formerly known as flow-through planter). The BMP consists of three layers:
• Ponding layer: 10-inches active storage, [minimum] 2-inches of freeboard above overflow relief
• Growing medium: 18-inches of soil [bioretention soil media] • Storage layer: 30-inches of gravel at 40 percent porosity [18 inches active storage above
underdrain is required, additional dead storage depth below underdrain is optional and can vary]
This BMP includes an underdrain with a low flow orifice 18 inches (1.5 feet) below the bottom of the growing medium. This BMP includes an impermeable liner to prevent infiltration into underlying soils.
Biofiltration with impermeable liner BMP Example Illustration
Reference: "San Diego BMP Sizing Calculator Methodology," prepared by Brown and Caldwell, dated January 2012

Appendix G: Guidance for Continuous Simulation and Hydromodification Management Sizing Factors
G-49 February 26, 2016
How to use the sizing factors for flow control BMP Sizing:
Obtain sizing factors from Table G.2-6 based on the project's lower flow threshold fraction of Q2, hydrologic soil group, pre-development slope, and rain gauge (rainfall basin). Multiply the area tributary to the structural BMP (A, square feet) by the area weighted runoff factor (C, unitless) (see Table G.2-1) by the sizing factors to determine the required surface area (A, square feet), surface volume (V1, cubic feet), and sub-surface volume (V2, cubic feet). Select a low flow orifice for the underdrain that will discharge the lower flow threshold flow when there is 1.5 feet of head over the underdrain orifice. The civil engineer must provide the necessary volume and surface area of the BMP and the underdrain and orifice detail on the plans.
Additional steps to use this BMP as a combined pollutant control and flow control BMP:
To use this BMP as a combined pollutant control and flow control BMP, determine the size using the sizing factors, then refer to Appendix B.5 and Appendix F to check whether the BMP meets performance standards for biofiltration for pollutant control. If necessary, adjust the surface area, depth of growing medium, or depth of storage layer as needed to meet pollutant control standards.
Table G.2-6: Sizing Factors for Hydromodification Flow Control Biofiltration BMPs (formerly known as Flow-Through Planters) Designed Using Sizing Factor Method
Sizing Factors for Hydromodification Flow Control Biofiltration with Impermeable Liner BMPs Designed Using Sizing Factor Method
Lower Flow Threshold Soil Group Slope Rain Gauge A V1 V2
0.5Q2 A Flat Lindbergh N/A N/A N/A
0.5Q2 A Moderate Lindbergh N/A N/A N/A
0.5Q2 A Steep Lindbergh N/A N/A N/A
0.5Q2 B Flat Lindbergh N/A N/A N/A
0.5Q2 B Moderate Lindbergh N/A N/A N/A
0.5Q2 B Steep Lindbergh N/A N/A N/A
0.5Q2 C Flat Lindbergh 0.115 0.0958 0.0690
0.5Q2 C Moderate Lindbergh 0.115 0.0958 0.0690
0.5Q2 C Steep Lindbergh 0.080 0.0667 0.0480
0.5Q2 D Flat Lindbergh 0.085 0.0708 0.0510
0.5Q2 D Moderate Lindbergh 0.085 0.0708 0.0510
0.5Q2 D Steep Lindbergh 0.065 0.0542 0.0390
0.5Q2 A Flat Oceanside N/A N/A N/A
0.5Q2 A Moderate Oceanside N/A N/A N/A
0.5Q2 A Steep Oceanside N/A N/A N/A
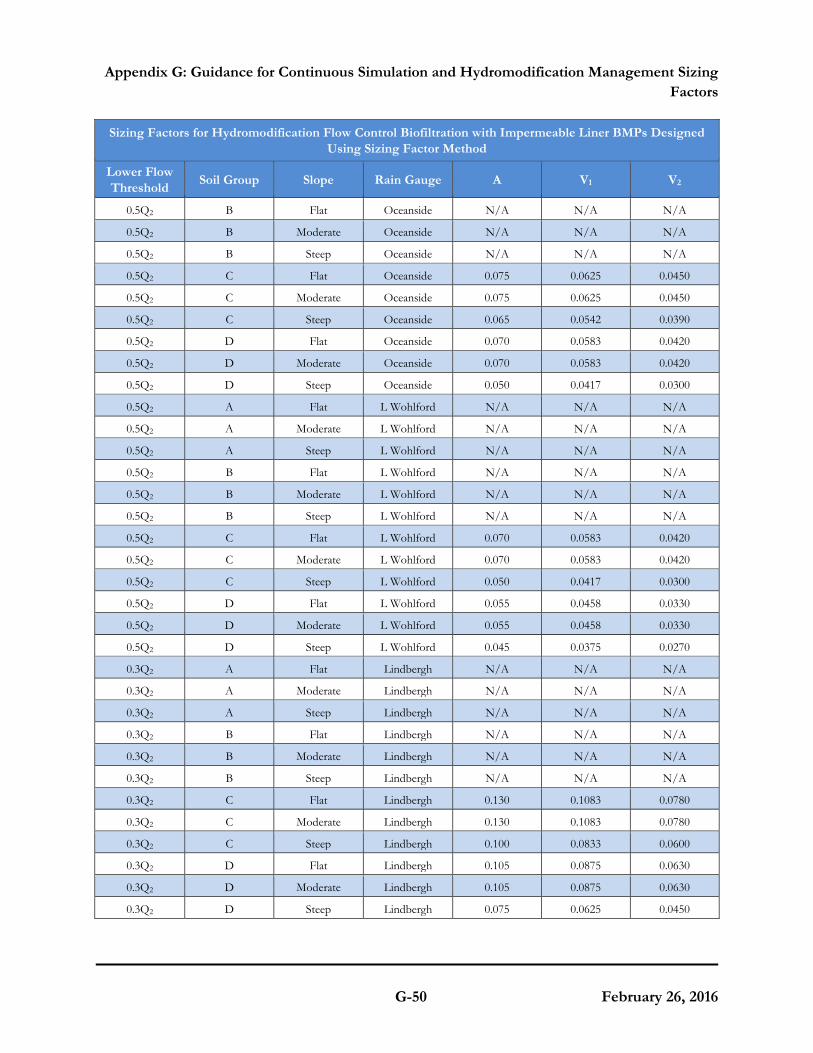
Appendix G: Guidance for Continuous Simulation and Hydromodification Management Sizing Factors
G-50 February 26, 2016
Sizing Factors for Hydromodification Flow Control Biofiltration with Impermeable Liner BMPs Designed Using Sizing Factor Method
Lower Flow Threshold Soil Group Slope Rain Gauge A V1 V2
0.5Q2 B Flat Oceanside N/A N/A N/A
0.5Q2 B Moderate Oceanside N/A N/A N/A
0.5Q2 B Steep Oceanside N/A N/A N/A
0.5Q2 C Flat Oceanside 0.075 0.0625 0.0450
0.5Q2 C Moderate Oceanside 0.075 0.0625 0.0450
0.5Q2 C Steep Oceanside 0.065 0.0542 0.0390
0.5Q2 D Flat Oceanside 0.070 0.0583 0.0420
0.5Q2 D Moderate Oceanside 0.070 0.0583 0.0420
0.5Q2 D Steep Oceanside 0.050 0.0417 0.0300
0.5Q2 A Flat L Wohlford N/A N/A N/A
0.5Q2 A Moderate L Wohlford N/A N/A N/A
0.5Q2 A Steep L Wohlford N/A N/A N/A
0.5Q2 B Flat L Wohlford N/A N/A N/A
0.5Q2 B Moderate L Wohlford N/A N/A N/A
0.5Q2 B Steep L Wohlford N/A N/A N/A
0.5Q2 C Flat L Wohlford 0.070 0.0583 0.0420
0.5Q2 C Moderate L Wohlford 0.070 0.0583 0.0420
0.5Q2 C Steep L Wohlford 0.050 0.0417 0.0300
0.5Q2 D Flat L Wohlford 0.055 0.0458 0.0330
0.5Q2 D Moderate L Wohlford 0.055 0.0458 0.0330
0.5Q2 D Steep L Wohlford 0.045 0.0375 0.0270
0.3Q2 A Flat Lindbergh N/A N/A N/A
0.3Q2 A Moderate Lindbergh N/A N/A N/A
0.3Q2 A Steep Lindbergh N/A N/A N/A
0.3Q2 B Flat Lindbergh N/A N/A N/A
0.3Q2 B Moderate Lindbergh N/A N/A N/A
0.3Q2 B Steep Lindbergh N/A N/A N/A
0.3Q2 C Flat Lindbergh 0.130 0.1083 0.0780
0.3Q2 C Moderate Lindbergh 0.130 0.1083 0.0780
0.3Q2 C Steep Lindbergh 0.100 0.0833 0.0600
0.3Q2 D Flat Lindbergh 0.105 0.0875 0.0630
0.3Q2 D Moderate Lindbergh 0.105 0.0875 0.0630
0.3Q2 D Steep Lindbergh 0.075 0.0625 0.0450

Appendix G: Guidance for Continuous Simulation and Hydromodification Management Sizing Factors
G-51 February 26, 2016
Sizing Factors for Hydromodification Flow Control Biofiltration with Impermeable Liner BMPs Designed Using Sizing Factor Method
Lower Flow Threshold Soil Group Slope Rain Gauge A V1 V2
0.3Q2 A Flat Oceanside N/A N/A N/A
0.3Q2 A Moderate Oceanside N/A N/A N/A
0.3Q2 A Steep Oceanside N/A N/A N/A
0.3Q2 B Flat Oceanside N/A N/A N/A
0.3Q2 B Moderate Oceanside N/A N/A N/A
0.3Q2 B Steep Oceanside N/A N/A N/A
0.3Q2 C Flat Oceanside 0.105 0.0875 0.0630
0.3Q2 C Moderate Oceanside 0.105 0.0875 0.0630
0.3Q2 C Steep Oceanside 0.085 0.0708 0.0510
0.3Q2 D Flat Oceanside 0.090 0.0750 0.0540
0.3Q2 D Moderate Oceanside 0.090 0.0750 0.0540
0.3Q2 D Steep Oceanside 0.070 0.0583 0.0420
0.3Q2 A Flat L Wohlford N/A N/A N/A
0.3Q2 A Moderate L Wohlford N/A N/A N/A
0.3Q2 A Steep L Wohlford N/A N/A N/A
0.3Q2 B Flat L Wohlford N/A N/A N/A
0.3Q2 B Moderate L Wohlford N/A N/A N/A
0.3Q2 B Steep L Wohlford N/A N/A N/A
0.3Q2 C Flat L Wohlford 0.085 0.0708 0.0510
0.3Q2 C Moderate L Wohlford 0.085 0.0708 0.0510
0.3Q2 C Steep L Wohlford 0.060 0.0500 0.0360
0.3Q2 D Flat L Wohlford 0.065 0.0542 0.0390
0.3Q2 D Moderate L Wohlford 0.065 0.0542 0.0390
0.3Q2 D Steep L Wohlford 0.050 0.0417 0.0300
0.1Q2 A Flat Lindbergh N/A N/A N/A
0.1Q2 A Moderate Lindbergh N/A N/A N/A
0.1Q2 A Steep Lindbergh N/A N/A N/A
0.1Q2 B Flat Lindbergh N/A N/A N/A
0.1Q2 B Moderate Lindbergh N/A N/A N/A
0.1Q2 B Steep Lindbergh N/A N/A N/A
0.1Q2 C Flat Lindbergh 0.250 0.2083 0.1500
0.1Q2 C Moderate Lindbergh 0.250 0.2083 0.1500
0.1Q2 C Steep Lindbergh 0.185 0.1542 0.1110

Appendix G: Guidance for Continuous Simulation and Hydromodification Management Sizing Factors
G-52 February 26, 2016
Sizing Factors for Hydromodification Flow Control Biofiltration with Impermeable Liner BMPs Designed Using Sizing Factor Method
Lower Flow Threshold Soil Group Slope Rain Gauge A V1 V2
0.1Q2 D Flat Lindbergh 0.200 0.1667 0.1200
0.1Q2 D Moderate Lindbergh 0.200 0.1667 0.1200
0.1Q2 D Steep Lindbergh 0.130 0.1083 0.0780
0.1Q2 A Flat Oceanside N/A N/A N/A
0.1Q2 A Moderate Oceanside N/A N/A N/A
0.1Q2 A Steep Oceanside N/A N/A N/A
0.1Q2 B Flat Oceanside N/A N/A N/A
0.1Q2 B Moderate Oceanside N/A N/A N/A
0.1Q2 B Steep Oceanside N/A N/A N/A
0.1Q2 C Flat Oceanside 0.190 0.1583 0.1140
0.1Q2 C Moderate Oceanside 0.190 0.1583 0.1140
0.1Q2 C Steep Oceanside 0.140 0.1167 0.0840
0.1Q2 D Flat Oceanside 0.160 0.1333 0.0960
0.1Q2 D Moderate Oceanside 0.160 0.1333 0.0960
0.1Q2 D Steep Oceanside 0.105 0.0875 0.0630
0.1Q2 A Flat L Wohlford N/A N/A N/A
0.1Q2 A Moderate L Wohlford N/A N/A N/A
0.1Q2 A Steep L Wohlford N/A N/A N/A
0.1Q2 B Flat L Wohlford N/A N/A N/A
0.1Q2 B Moderate L Wohlford N/A N/A N/A
0.1Q2 B Steep L Wohlford N/A N/A N/A
0.1Q2 C Flat L Wohlford 0.135 0.1125 0.0810
0.1Q2 C Moderate L Wohlford 0.135 0.1125 0.0810
0.1Q2 C Steep L Wohlford 0.105 0.0875 0.0630
0.1Q2 D Flat L Wohlford 0.110 0.0917 0.0660
0.1Q2 D Moderate L Wohlford 0.110 0.0917 0.0660
0.1Q2 D Steep L Wohlford 0.080 0.0667 0.0480
Q2 = 2-year pre-project flow rate based upon partial duration analysis of long-term hourly rainfall records A = Surface area sizing factor for flow control V1 = Surface volume sizing factor for flow control V2 = Subsurface volume sizing factor for flow control

Appendix G: Guidance for Continuous Simulation and Hydromodification Management Sizing Factors
G-53 February 26, 2016
Definitions for "N/A"
• Soil groups A and B: N/A in all elements (A, V1, V2) for soil groups A and B means sizing factors were not developed for biofiltration (i.e., with an underdrain) for soil groups A and B. If no underdrain is proposed, refer to Appendix G.2.3, Sizing Factors for Bioretention. If an underdrain is proposed, use project-specific continuous simulation modeling.
Appendix G: Guidance for Continuous Simulation and Hydromodification Management Sizing Factors
G-54 February 26, 2016
G.2.6 Sizing Factors for "Cistern" BMP
Table G.2-7 presents sizing factors for calculating the required volume (V1) for a cistern BMP. In this context, a "cistern" is a detention facility that stores runoff and releases it at a controlled rate. A cistern can be a component of a harvest and use system, however the sizing factor method will not account for any retention occurring in the system. The sizing factors were developed assuming runoff is released from the cistern. The sizing factors presented in this section are to meet the hydromodification management performance standard only. The cistern BMP is based on the following assumptions:
• Cistern configuration: The cistern is modeled as a 4-foot tall vessel. However, designers could use other configurations (different cistern heights), as long as the lower outlet orifice is sized to properly restrict outflows and the minimum required volume is provided.
• Cistern upper outlet: The upper outlet from the cistern would consist of a weir or other flow control structure with the overflow invert set at an elevation of 7/8 of the water height associated with the required volume of the cistern – V1. For the assumed 4-foot water depth in the cistern associated with the sizing factor analysis, the overflow invert is assumed to be located at an elevation of 3.5 feet above the bottom of the cistern. The overflow weir would be sized to pass the peak design flow based on the tributary drainage area.
How to use the sizing factors:
Obtain sizing factors from Table G.2-7 based on the project's lower flow threshold fraction of Q2, hydrologic soil group, pre-development slope, and rain gauge (rainfall basin). Multiply the area tributary to the structural BMP (A, square feet) by the area weighted runoff factor (C, unitless) (see Table G.2-1) by the sizing factors to determine the required volume (V1, cubic feet). Select a low flow orifice that will discharge the lower flow threshold flow when there is 4 feet of head over the lower outlet orifice (or adjusted head as appropriate if the cistern configuration is not 4 feet tall). The civil engineer must provide the necessary volume of the BMP and the lower outlet orifice detail on the plans.
Additional steps to use this BMP as a combined pollutant control and flow control BMP:
A cistern could be a component of a full retention, partial retention, or no retention BMP depending on how the outflow is disposed. However use of the sizing factor method for design of the cistern in a combined pollutant control and flow control system is not recommended. The sizing factor method for designing a cistern does not account for any retention or storage occurring in BMPs combined with the cistern (i.e., cistern sized using sizing factors may be larger than necessary because sizing factor method does not recognize volume losses occurring in other elements of a combined system). Furthermore when the cistern is designed using the sizing factor method, the cistern outflow must be set to the low flow threshold flow for the drainage area, which may be inconsistent with requirements for other elements of a combined system. To optimize a system in
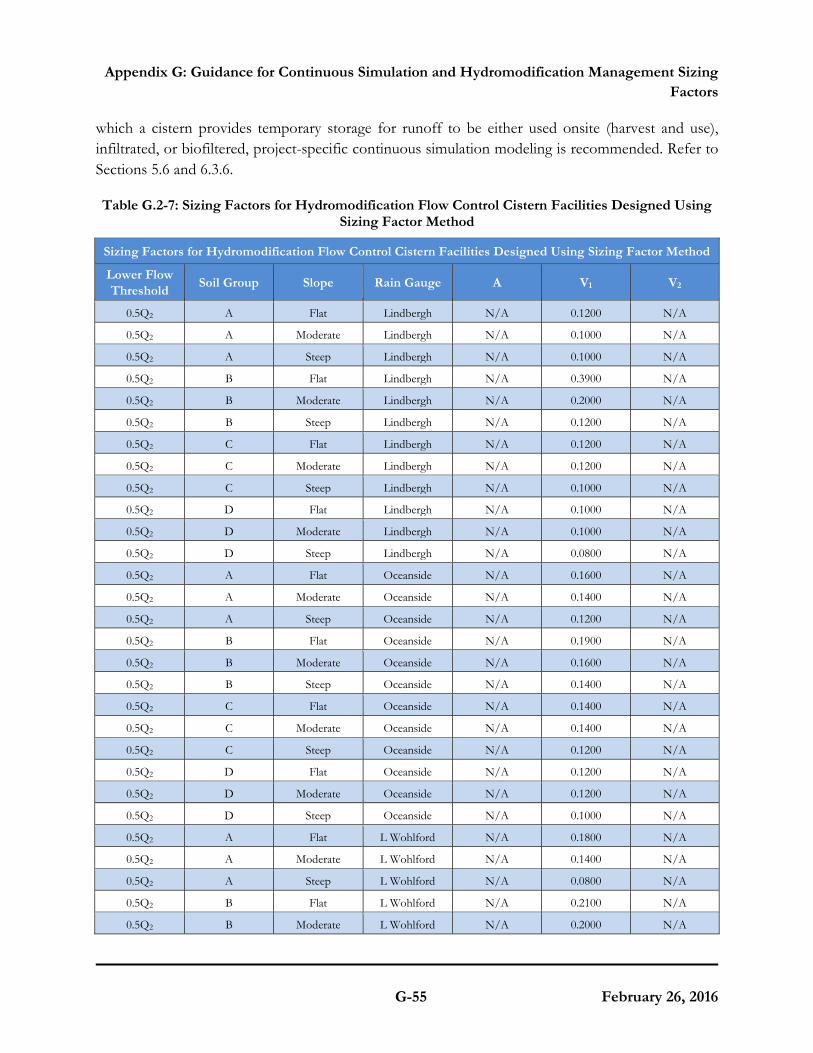
Appendix G: Guidance for Continuous Simulation and Hydromodification Management Sizing Factors
G-55 February 26, 2016
which a cistern provides temporary storage for runoff to be either used onsite (harvest and use), infiltrated, or biofiltered, project-specific continuous simulation modeling is recommended. Refer to Sections 5.6 and 6.3.6.
Table G.2-7: Sizing Factors for Hydromodification Flow Control Cistern Facilities Designed Using Sizing Factor Method
Sizing Factors for Hydromodification Flow Control Cistern Facilities Designed Using Sizing Factor Method
Lower Flow Threshold Soil Group Slope Rain Gauge A V1 V2
0.5Q2 A Flat Lindbergh N/A 0.1200 N/A
0.5Q2 A Moderate Lindbergh N/A 0.1000 N/A
0.5Q2 A Steep Lindbergh N/A 0.1000 N/A
0.5Q2 B Flat Lindbergh N/A 0.3900 N/A
0.5Q2 B Moderate Lindbergh N/A 0.2000 N/A
0.5Q2 B Steep Lindbergh N/A 0.1200 N/A
0.5Q2 C Flat Lindbergh N/A 0.1200 N/A
0.5Q2 C Moderate Lindbergh N/A 0.1200 N/A
0.5Q2 C Steep Lindbergh N/A 0.1000 N/A
0.5Q2 D Flat Lindbergh N/A 0.1000 N/A
0.5Q2 D Moderate Lindbergh N/A 0.1000 N/A
0.5Q2 D Steep Lindbergh N/A 0.0800 N/A
0.5Q2 A Flat Oceanside N/A 0.1600 N/A
0.5Q2 A Moderate Oceanside N/A 0.1400 N/A
0.5Q2 A Steep Oceanside N/A 0.1200 N/A
0.5Q2 B Flat Oceanside N/A 0.1900 N/A
0.5Q2 B Moderate Oceanside N/A 0.1600 N/A
0.5Q2 B Steep Oceanside N/A 0.1400 N/A
0.5Q2 C Flat Oceanside N/A 0.1400 N/A
0.5Q2 C Moderate Oceanside N/A 0.1400 N/A
0.5Q2 C Steep Oceanside N/A 0.1200 N/A
0.5Q2 D Flat Oceanside N/A 0.1200 N/A
0.5Q2 D Moderate Oceanside N/A 0.1200 N/A
0.5Q2 D Steep Oceanside N/A 0.1000 N/A
0.5Q2 A Flat L Wohlford N/A 0.1800 N/A
0.5Q2 A Moderate L Wohlford N/A 0.1400 N/A
0.5Q2 A Steep L Wohlford N/A 0.0800 N/A
0.5Q2 B Flat L Wohlford N/A 0.2100 N/A
0.5Q2 B Moderate L Wohlford N/A 0.2000 N/A

Appendix G: Guidance for Continuous Simulation and Hydromodification Management Sizing Factors
G-56 February 26, 2016
Sizing Factors for Hydromodification Flow Control Cistern Facilities Designed Using Sizing Factor Method
Lower Flow Threshold Soil Group Slope Rain Gauge A V1 V2
0.5Q2 B Steep L Wohlford N/A 0.1400 N/A
0.5Q2 C Flat L Wohlford N/A 0.1400 N/A
0.5Q2 C Moderate L Wohlford N/A 0.1400 N/A
0.5Q2 C Steep L Wohlford N/A 0.1000 N/A
0.5Q2 D Flat L Wohlford N/A 0.1000 N/A
0.5Q2 D Moderate L Wohlford N/A 0.1000 N/A
0.5Q2 D Steep L Wohlford N/A 0.0800 N/A
0.3Q2 A Flat Lindbergh N/A 0.1200 N/A
0.3Q2 A Moderate Lindbergh N/A 0.1000 N/A
0.3Q2 A Steep Lindbergh N/A 0.1000 N/A
0.3Q2 B Flat Lindbergh N/A 0.5900 N/A
0.3Q2 B Moderate Lindbergh N/A 0.3600 N/A
0.3Q2 B Steep Lindbergh N/A 0.1800 N/A
0.3Q2 C Flat Lindbergh N/A 0.1800 N/A
0.3Q2 C Moderate Lindbergh N/A 0.1800 N/A
0.3Q2 C Steep Lindbergh N/A 0.1400 N/A
0.3Q2 D Flat Lindbergh N/A 0.1400 N/A
0.3Q2 D Moderate Lindbergh N/A 0.1400 N/A
0.3Q2 D Steep Lindbergh N/A 0.0800 N/A
0.3Q2 A Flat Oceanside N/A 0.1600 N/A
0.3Q2 A Moderate Oceanside N/A 0.1400 N/A
0.3Q2 A Steep Oceanside N/A 0.1200 N/A
0.3Q2 B Flat Oceanside N/A 0.2200 N/A
0.3Q2 B Moderate Oceanside N/A 0.1800 N/A
0.3Q2 B Steep Oceanside N/A 0.1600 N/A
0.3Q2 C Flat Oceanside N/A 0.1600 N/A
0.3Q2 C Moderate Oceanside N/A 0.1600 N/A
0.3Q2 C Steep Oceanside N/A 0.1400 N/A
0.3Q2 D Flat Oceanside N/A 0.1400 N/A
0.3Q2 D Moderate Oceanside N/A 0.1400 N/A
0.3Q2 D Steep Oceanside N/A 0.1200 N/A
0.3Q2 A Flat L Wohlford N/A 0.1800 N/A
0.3Q2 A Moderate L Wohlford N/A 0.1400 N/A
0.3Q2 A Steep L Wohlford N/A 0.0800 N/A
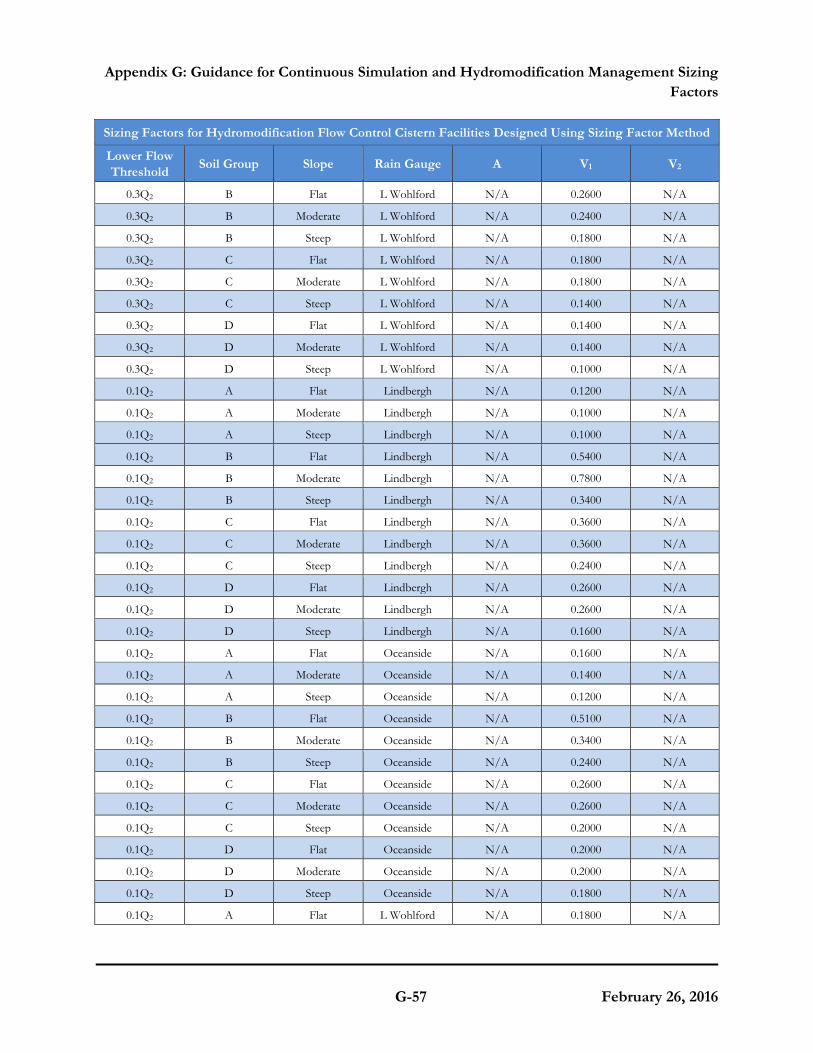
Appendix G: Guidance for Continuous Simulation and Hydromodification Management Sizing Factors
G-57 February 26, 2016
Sizing Factors for Hydromodification Flow Control Cistern Facilities Designed Using Sizing Factor Method
Lower Flow Threshold Soil Group Slope Rain Gauge A V1 V2
0.3Q2 B Flat L Wohlford N/A 0.2600 N/A
0.3Q2 B Moderate L Wohlford N/A 0.2400 N/A
0.3Q2 B Steep L Wohlford N/A 0.1800 N/A
0.3Q2 C Flat L Wohlford N/A 0.1800 N/A
0.3Q2 C Moderate L Wohlford N/A 0.1800 N/A
0.3Q2 C Steep L Wohlford N/A 0.1400 N/A
0.3Q2 D Flat L Wohlford N/A 0.1400 N/A
0.3Q2 D Moderate L Wohlford N/A 0.1400 N/A
0.3Q2 D Steep L Wohlford N/A 0.1000 N/A
0.1Q2 A Flat Lindbergh N/A 0.1200 N/A
0.1Q2 A Moderate Lindbergh N/A 0.1000 N/A
0.1Q2 A Steep Lindbergh N/A 0.1000 N/A
0.1Q2 B Flat Lindbergh N/A 0.5400 N/A
0.1Q2 B Moderate Lindbergh N/A 0.7800 N/A
0.1Q2 B Steep Lindbergh N/A 0.3400 N/A
0.1Q2 C Flat Lindbergh N/A 0.3600 N/A
0.1Q2 C Moderate Lindbergh N/A 0.3600 N/A
0.1Q2 C Steep Lindbergh N/A 0.2400 N/A
0.1Q2 D Flat Lindbergh N/A 0.2600 N/A
0.1Q2 D Moderate Lindbergh N/A 0.2600 N/A
0.1Q2 D Steep Lindbergh N/A 0.1600 N/A
0.1Q2 A Flat Oceanside N/A 0.1600 N/A
0.1Q2 A Moderate Oceanside N/A 0.1400 N/A
0.1Q2 A Steep Oceanside N/A 0.1200 N/A
0.1Q2 B Flat Oceanside N/A 0.5100 N/A
0.1Q2 B Moderate Oceanside N/A 0.3400 N/A
0.1Q2 B Steep Oceanside N/A 0.2400 N/A
0.1Q2 C Flat Oceanside N/A 0.2600 N/A
0.1Q2 C Moderate Oceanside N/A 0.2600 N/A
0.1Q2 C Steep Oceanside N/A 0.2000 N/A
0.1Q2 D Flat Oceanside N/A 0.2000 N/A
0.1Q2 D Moderate Oceanside N/A 0.2000 N/A
0.1Q2 D Steep Oceanside N/A 0.1800 N/A
0.1Q2 A Flat L Wohlford N/A 0.1800 N/A

Appendix G: Guidance for Continuous Simulation and Hydromodification Management Sizing Factors
G-58 February 26, 2016
Sizing Factors for Hydromodification Flow Control Cistern Facilities Designed Using Sizing Factor Method
Lower Flow Threshold Soil Group Slope Rain Gauge A V1 V2
0.1Q2 A Moderate L Wohlford N/A 0.1400 N/A
0.1Q2 A Steep L Wohlford N/A 0.0800 N/A
0.1Q2 B Flat L Wohlford N/A 0.4400 N/A
0.1Q2 B Moderate L Wohlford N/A 0.4000 N/A
0.1Q2 B Steep L Wohlford N/A 0.3200 N/A
0.1Q2 C Flat L Wohlford N/A 0.3200 N/A
0.1Q2 C Moderate L Wohlford N/A 0.3200 N/A
0.1Q2 C Steep L Wohlford N/A 0.2200 N/A
0.1Q2 D Flat L Wohlford N/A 0.2400 N/A
0.1Q2 D Moderate L Wohlford N/A 0.2400 N/A
0.1Q2 D Steep L Wohlford N/A 0.1800 N/A Q2 = 2-year pre-project flow rate based upon partial duration analysis of long-term hourly rainfall records A = Bioretention surface area sizing factor (not applicable under this manual standards – use methods presented in Chapter 5 and Appendix B or Appendix F to size bioretention or biofiltration facility for pollutant control) V1 = Cistern volume sizing factor Definitions for "N/A"
• Column V2: N/A in column V2 means there is no V2 element in the cistern BMP
• Column A: N/A in column A means there is no A element in the cistern BMP. Note sizing factors previously created for sizing a bioretention or biofiltration facility downstream of a cistern under the 2007 MS4 Permit are not applicable under the MS4 Permit.
.