Embed Size (px)
Citation preview

Prospectus Supplement(To REMIC Prospectus dated August 1, 2007)
$833,741,000
Guaranteed REMIC Pass-Through CertificatesFannie Mae REMIC Trust 2010-50
The Certificates
We, the Federal National MortgageAssociation (Fannie Mae), will issuethe classes of certificates listed in thechart on this cover.
Payments to Certificateholders
We will make monthly payments on thecertificates. You, the investor, willreceive
• interest accrued on the balance ofyour certificate (except in the case ofthe accrual class), and
• principal to the extent available forpayment on your class.
We will pay principal at rates that mayvary from time to time. We may not payprincipal to certain classes for long peri-ods of time.
The Fannie Mae Guaranty
We will guarantee that required pay-ments of principal and interest on thecertificates are available for distributionto investors on time.
The Trust and its Assets
The trust will own Fannie Mae MBS.
The mortgage loans underlying the Fan-nie Mae MBS are first lien, single-family,fixed-rate loans.
Class Group
OriginalClass
BalancePrincipalType(1)
InterestRate
InterestType(1)
CUSIPNumber
FinalDistribution
Date
PA . . . . . 1 $ 62,664,000 PAC 4.5% FIX 31398PM63 September 2039PF(2) . . . . 1 15,666,000 PAC (3) FLT 31398PM71 September 2039PS(2) . . . . 1 15,666,000(4) NTL (3) INV/IO 31398PM89 September 2039PC . . . . . 1 4,720,000 PAC 5.0 FIX 31398PM97 May 2040HF . . . . . 1 13,038,461 SUP (3) FLT 31398PN21 May 2040S(2) . . . . . 1 3,911,539 SUP (3) INV 31398PN39 May 2040SI(2) . . . . 1 5,215,383(4) NTL (3) INV/IO 31398PN47 May 2040
AO(2) . . . 2 354,258,000 SEQ 0.0 PO 31398PN54 January 2024FI(2) . . . . 2 202,433,142(4) NTL (3) FLT/IO 31398PN62 January 2024SC(2) . . . . 2 202,433,142(4) NTL (3) INV/IO 31398PN70 January 2024TC(2) . . . . 2 202,433,142(4) NTL (3) INV/IO 31398PN88 January 2024TB(2) . . . . 2 202,433,142(4) NTL (3) INV/IO 31398PN96 January 2024AY . . . . . 2 55,305,000 SEQ 4.0 FIX 31398PP29 May 2025
P . . . . . 3 126,344,000 PAC 4.5 FIX 31398PP37 May 2040CB(2) . . . . 3 10,583,000 PAC 4.0 FIX 31398PP45 May 2040CI(2) . . . . 3 1,175,888(4) NTL 4.5 FIX/IO 31398PP52 May 2040CF . . . . . 3 25,118,357 SUP (3) FLT 31398PP60 May 2040CS . . . . . 3 13,954,643 SUP (3) INV 31398PP78 May 2040
DL . . . . . 4 100,000,000 SEQ 4.5 FIX 31398PP86 August 2035VA(2) . . . . 4 13,447,000 SEQ/AD 4.5 FIX 31398PP94 June 2021VB(2) . . . . 4 13,732,000 SEQ/AD 4.5 FIX 31398PQ28 November 2028ZA(2) . . . . 4 20,999,000 SEQ 4.5 FIX/Z 31398PQ36 May 2040
R . . . . . 0 NPR 0 NPR 31398PQ44 May 2040RL . . . . . 0 NPR 0 NPR 31398PQ51 May 2040
(1) See “Description of the Certificates—Class Definitions andAbbreviations” in the REMIC prospectus.
(2) Exchangeable classes.(3) Based on LIBOR.
(4) Notional balances. These classes areinterest only classes. See page S-8 fora description of how their notionalbalances are calculated.
If you own certificates of certain classes, you can exchange them for certificates of thecorresponding RCR classes to be delivered at the time of exchange. The PW, HS, FA,FB, FC, SB, SA, AB, AC, AD, AE, AG, AH, AJ, AI, CA, VD and DY Classes are the RCRclasses. For a more detailed description of the RCR classes, see Schedule 1 attached tothis prospectus supplement and “Description of the Certificates—Combination andRecombination” in the REMIC prospectus.
The dealer will offer the certificates from time to time in negotiated transactions atvarying prices. We expect the settlement date to be April 30, 2010.
Carefully consider the risk factors on page S-9 of this prospectus supplement and starting on page 10 of the REMIC prospectus.
Unless you understand and are able to tolerate these risks, you should not invest in the certificates.
You should read the REMIC prospectus as well as this prospectus supplement.The certificates, together with interest thereon, are not guaranteed by the United States and do not constitute a debt orobligation of the United States or any agency or instrumentality thereof other than Fannie Mae.The certificates are exempt from registration under the Securities Act of 1933 and are “exempted securities” under theSecurities Exchange Act of 1934.
Deutsche Bank Securities
The date of this Prospectus Supplement is April 26, 2010

TABLE OF CONTENTS
Page
AVAILABLE INFORMATION . . . . . . S- 3RECENT DEVELOPMENTS . . . . . . . S- 4SUMMARY . . . . . . . . . . . . . . . . . . . . . . S- 6ADDITIONAL RISK FACTORS . . . . S- 9DESCRIPTION OF THE
CERTIFICATES . . . . . . . . . . . . . . . . S- 9GENERAL . . . . . . . . . . . . . . . . . . . . . . . S- 9
Structure . . . . . . . . . . . . . . . . . . . . . S- 9Fannie Mae Guaranty . . . . . . . . . . . S-10Characteristics of Certificates . . . . . S-10Authorized Denominations . . . . . . . S-11
THE MBS. . . . . . . . . . . . . . . . . . . . . . . S-11DISTRIBUTIONS OF INTEREST . . . . . . . . . . S-11
General . . . . . . . . . . . . . . . . . . . . . . S-11Delay Classes and No-Delay
Classes . . . . . . . . . . . . . . . . . . . . . S-11Accrual Class . . . . . . . . . . . . . . . . . S-11
DISTRIBUTIONS OF PRINCIPAL . . . . . . . . . S-12STRUCTURING ASSUMPTIONS . . . . . . . . . . S-13
Pricing Assumptions . . . . . . . . . . . . S-13Prepayment Assumptions . . . . . . . . S-13Principal Balance Schedules . . . . . S-13
YIELD TABLES . . . . . . . . . . . . . . . . . . . . S-14General . . . . . . . . . . . . . . . . . . . . . . S-14
Page
The Inverse Floating Rate Classesand the FI Class . . . . . . . . . . . . . S-15
The Principal Only Class . . . . . . . . S-18The Fixed Rate Interest Only
Classes . . . . . . . . . . . . . . . . . . . . . S-18WEIGHTED AVERAGE LIVES OF THE
CERTIFICATES . . . . . . . . . . . . . . . . . . . S-19DECREMENT TABLES. . . . . . . . . . . . . . . . S-20CHARACTERISTICS OF THE RESIDUAL
CLASSES . . . . . . . . . . . . . . . . . . . . . . S-25CERTAIN ADDITIONAL FEDERAL
INCOME TAX CONSEQUENCES . . S-25U.S. TREASURY CIRCULAR 230 NOTICE . . S-26REMIC ELECTIONS AND SPECIAL TAX
ATTRIBUTES . . . . . . . . . . . . . . . . . . . . S-26TAXATION OF BENEFICIAL OWNERS OF
REGULAR CERTIFICATES. . . . . . . . . . . . S-27TAXATION OF BENEFICIAL OWNERS OF
RESIDUAL CERTIFICATES . . . . . . . . . . . S-27TAXATION OF BENEFICIAL OWNERS OF
RCR CERTIFICATES . . . . . . . . . . . . . . S-27PLAN OF DISTRIBUTION . . . . . . . . S-27LEGAL MATTERS . . . . . . . . . . . . . . . S-27SCHEDULE 1 . . . . . . . . . . . . . . . . . . . A- 1PRINCIPAL BALANCE
SCHEDULES . . . . . . . . . . . . . . . . . . B- 1
S-2

AVAILABLE INFORMATION
You should purchase the certificates only if you have read and understood this prospectussupplement and the following documents (the “Disclosure Documents”):
• our Prospectus for Fannie Mae Guaranteed REMIC Pass-Through Certificates dated August 1,2007 (the “REMIC Prospectus”);
• our Prospectus for Fannie Mae Guaranteed Pass-Through Certificates (Single-Family Resi-dential Mortgage Loans) dated
O June 1, 2009, for all MBS issued on or after January 1, 2009,
O April 1, 2008, for all MBS issued on or after June 1, 2007 and prior to January 1, 2009, or
O January 1, 2006, for all other MBS
(as applicable, the “MBS Prospectus”); and
• any information incorporated by reference in this prospectus supplement as discussed belowand under the heading “Incorporation by Reference” in the REMIC Prospectus.
For a description of current servicing policies generally applicable to existing Fannie Mae MBSpools, see “Yield, Maturity, and Prepayment Considerations” in the MBS Prospectus dated June 1,2009.
The MBS Prospectus is incorporated by reference in this prospectus supplement. This meansthat we are disclosing information in that document by referring you to it. That document isconsidered part of this prospectus supplement, so you should read this prospectus supplement,and any applicable supplements or amendments, together with that document.
You can obtain copies of the Disclosure Documents by writing or calling us at:
Fannie MaeMBS Helpline3900 Wisconsin Avenue, N.W., Area 2H-3SWashington, D.C. 20016(telephone 1-800-237-8627).
In addition, the Disclosure Documents, together with the class factors, are available on our corporateWeb site at www.fanniemae.com.
You also can obtain copies of the REMIC Prospectus and the MBS Prospectus by writing orcalling the dealer at:
Deutsche Bank Securities Inc.Syndicate Operations60 Wall StreetNew York, NY 10005(telephone 212-469-5000).
S-3

RECENT DEVELOPMENTS
The Regulatory Reform Act, which became effective on July 30, 2008, established the FederalHousing Finance Agency, or FHFA, as an independent agency with general supervisory and regu-latory authority over Fannie Mae, Freddie Mac and the 12 Federal Home Loan Banks. FHFAassumed the duties of our former regulators, the Office of Federal Housing Enterprise Oversightand the U.S. Department of Housing and Urban Development, or HUD, with respect to safety,soundness and mission oversight of Fannie Mae and Freddie Mac. HUD remains our regulator withrespect to fair lending matters.
On September 6, 2008, the Director of FHFA placed Fannie Mae into conservatorship andappointed FHFA as the conservator. Upon its appointment, FHFA immediately succeeded to all of ourrights, titles, powers and privileges and those of any stockholder, officer, or director of Fannie Maewith respect to us and our assets. The conservator has the authority to take over our assets andoperate our business with all the powers of our stockholders, directors and officers, and to conduct allbusiness of the company. Under the Regulatory Reform Act, FHFA, as conservator, may take “suchaction as may be necessary to put the regulated entity in a sound and solvent condition.” We have nocontrol over FHFA’s actions or the actions it may direct us to take. The conservatorship has nospecified termination date; we do not know when or how it will be terminated. In addition, our boardof directors does not have any duties to any person or entity except to the conservator. Accordingly,our board of directors is not obligated to consider the interests of Fannie Mae or the holders of theCertificates unless specifically directed to do so by the conservator.
On September 7, 2008, Fannie Mae, through our conservator, entered into two agreements withTreasury. The first agreement is the Stock Purchase Agreement, which provided us with Treasury’scommitment (the “Commitment”) to provide us with funding under specified conditions. Under theStock Purchase Agreement, as amended through December 2009, Treasury’s Commitment is cur-rently the greater of (i) $200 billion or (ii) $200 billion plus the cumulative amount of our net worthdeficit (the amount by which our total liabilities exceed our total assets) as of the end of any and eachcalendar quarter in 2010, 2011 and 2012, less any positive net worth as of December 31, 2012. Weissued 1,000,000 shares of Senior Preferred Stock pursuant to the Stock Purchase Agreement. Theother agreement is the Warrant, which allows Treasury to purchase, for a nominal price, shares ofcommon stock equal to 79.9% of the outstanding common stock of Fannie Mae on a fully diluted basis.The Senior Preferred Stock and the Warrant were issued to Treasury as an initial commitment fee forTreasury’s Commitment. We are required to pay a quarterly commitment fee, beginning on March 31,2011. The amount of the commitment fee will be determined by the mutual agreement of Treasuryand Fannie Mae on or before December 31, 2010, and will be reset every five years. Additionalinformation about the conservatorship, the Stock Purchase Agreement, the Warrant and the Com-mitment is included in our Annual Report on Form 10-K for the year ended December 31, 2009 (the“2009 Form 10-K”) which is incorporated by reference into this prospectus supplement.
We generally may draw funds under the Commitment on a quarterly basis when our totalliabilities exceed our total assets on our consolidated balance sheet prepared in accordance withGAAP as of the end of the preceding quarter. Through March 31, 2010, we had received a total of$75.2 billion from Treasury under the Commitment. If we have a negative net worth as of the end offuture fiscal quarters, we expect that the Acting Director of FHFA will request additional funds fromTreasury under the Stock Purchase Agreement to eliminate the net worth deficit. All funds drawn onthe Commitment are added to the liquidation preference on the Senior Preferred Stock, whichcurrently has a 10% annual dividend rate. The aggregate liquidation preference of the SeniorPreferred Stock, including the initial liquidation preference of $1.0 billion, is $76.2 billion, andthe annualized dividend on the Senior Preferred Stock, based on the 10% dividend rate, is $7.6 billion.If we do not pay the dividend quarterly and in cash, the dividend rate would increase to 12% annually,and the unpaid dividend would accrue and be added to the liquidation preference of the SeniorPreferred Stock.
S-4
The Stock Purchase Agreement and the Warrant contain covenants that significantly restrictour business activities. These covenants, which are summarized in our 2009 Form 10-K, includeprohibitions on the following activities unless we have prior written consent from Treasury: theissuance of equity securities (except in limited instances), the payment of dividends or otherdistributions on our equity securities (other than the Senior Preferred Stock or the Warrant), andthe issuance of subordinated debt securities. The covenants also limit the amount of debt securitiesthat we may have outstanding.
Certain rights provided to certificateholders under the trust documents may not be enforcedagainst FHFA, or enforcement of such rights may be delayed, during the conservatorship or if we areplaced into receivership. The trust documents provide that upon the occurrence of a guarantor eventof default, which includes the appointment of a conservator or receiver, certificateholders have theright to replace Fannie Mae as trustee if the requisite percentage of certificateholders consent. TheRegulatory Reform Act prevents certificateholders from enforcing their rights to replace Fannie Maeas trustee if the event of default arises solely because a conservator or receiver has been appointed.
We are continuing to operate as a going concern while in conservatorship and remain liable forall of our obligations, including our guaranty obligations, associated with mortgage-backed securitiesissued by us. The Stock Purchase Agreement is intended to enhance our ability to meet ourobligations. However, certificateholders have certain limited rights to bring proceedings againstTreasury if we fail to pay under our guaranty.
S-5

SUMMARY
This summary contains only limited information about the certificates. Unless other-wise specified, statistical information in this summary is provided as of April 1, 2010. Youshould purchase the certificates only after reading this prospectus supplement and eachof the additional disclosure documents listed on page S-3. In particular, please see thediscussion of risk factors that appears in each of those additional disclosure documents.
Assets Underlying Each Group of Classes
Group Assets
1 Group 1 MBS2 Group 2 MBS3 Group 3 MBS4 Group 4 MBS
Group 1, Group 2, Group 3 and Group 4
Characteristics of the MBS
ApproximatePrincipalBalance
Pass-Through
Rate
Range of WeightedAverage Coupons
or WACs(annual percentages)
Range of WeightedAverage RemainingTerms to Maturity
or WAMs(in months)
Group 1 MBS $100,000,000 5.00% 5.25% to 7.50% 241 to 360Group 2 MBS $409,563,000 4.00% 4.25% to 6.50% 121 to 180Group 3 MBS $176,000,000 4.50% 4.75% to 7.00% 241 to 360Group 4 MBS $148,178,000 4.50% 4.75% to 7.00% 241 to 360
Assumed Characteristics of the Underlying Mortgage Loans
PrincipalBalance
OriginalTerm to
Maturity(in months)
RemainingTerm to
Maturity(in months)
Loan Age(in months)
InterestRate
Group 1 MBS $100,000,000 360 355 5 5.420%Group 2 MBS $409,563,000 180 168 10 4.500%Group 3 MBS $176,000,000 360 352 8 5.000%Group 4 MBS $148,178,000 360 349 9 4.933%
The actual remaining terms to maturity, loan ages and interest rates of most the mortgage loansunderlying the MBS will differ from those shown above, perhaps significantly.
Settlement Date
We expect to issue the certificates on April 30, 2010.
Distribution Dates
We will make payments on the certificates on the 25th day of each calendar month, or on the nextbusiness day if the 25th day is not a business day.
S-6

Record Date
On each distribution date, we will make each monthly payment on the certificates to holders ofrecord on the last day of the preceding month.
Book-Entry and Physical Certificates
We will issue the classes of certificates in the following forms:
Fed Book-Entry Physical
All classes other than the R and RL Classes R and RL Classes
Exchanging Certificates Through Combination and Recombination
If you own certificates of a class designated as “exchangeable” on the cover of this prospectussupplement, you will be able to exchange them for a proportionate interest in the related RCRcertificates. Schedule 1 lists the available combinations of the certificates eligible for exchange andthe related RCR certificates. You can exchange your certificates by notifying us and paying anexchange fee. We will deliver the RCR certificates upon such exchange.
We will apply principal and interest payments from exchanged REMIC certificates to thecorresponding RCR certificates, on a pro rata basis, following any exchange.
Interest Rates
During each interest accrual period, the fixed rate classes will bear interest at the applicableannual interest rates listed on the cover of this prospectus supplement or on Schedule 1.
During the initial interest accrual period, the floating rate and inverse floating rate classes willbear interest at the initial interest rates listed below. During each subsequent interest accrual period,the floating rate and inverse floating rate classes will bear interest based on the formulas indicatedbelow, but always subject to the specified maximum and minimum interest rates:
Class
InitialInterest
Rate
MaximumInterest
Rate
MinimumInterest
Rate
Formula forCalculation of
Interest Rate(1)
PF . . . . . . . . . . 0.68531% 7.00000% 0.45% LIBOR � 45 basis pointsPS . . . . . . . . . . 6.31469% 6.55000% 0.00% 6.55% � LIBORHF . . . . . . . . . . 1.38531% 6.50000% 1.15% LIBOR � 115 basis pointsS . . . . . . . . . . 10.22938% 10.70000% 0.00% 10.70% � (2 � LIBOR)SI . . . . . . . . . . 5.11469% 5.35000% 0.00% 5.35% � LIBORFI . . . . . . . . . . 0.58531% 7.00000% 0.35% LIBOR � 35 basis pointsSC . . . . . . . . . . 6.31469% 6.55000% 0.00% 6.55% � LIBORTC . . . . . . . . . . 0.05000% 0.05000% 0.00% 6.60% � LIBORTB . . . . . . . . . . 0.05000% 0.05000% 0.00% 6.65% � LIBORCF . . . . . . . . . . 1.33531% 7.00000% 1.10% LIBOR � 110 basis pointsCS . . . . . . . . . . 10.19644% 10.62000% 0.00% 10.62% � (1.8 � LIBOR)HS . . . . . . . . . . 17.04896% 17.83333% 0.00% 17.83333% � (3.33333273 � LIBOR)FA . . . . . . . . . . 0.58531% 7.00000% 0.35% LIBOR � 35 basis pointsFB . . . . . . . . . . 0.63531% 7.00000% 0.40% LIBOR � 40 basis pointsFC . . . . . . . . . . 0.68531% 7.00000% 0.45% LIBOR � 45 basis pointsSB . . . . . . . . . . 6.36469% 6.60000% 0.00% 6.60% � LIBORSA . . . . . . . . . . 6.41469% 6.65000% 0.00% 6.65% � LIBOR
(1) We will establish LIBOR on the basis of the “BBA Method.”
S-7

Notional Classes
The notional principal balances of the notional classes will equal the percentages of theoutstanding balances specified below immediately before the related distribution date:
Class
PS . . . . . . . . . . . . . . . . . . 25% of the PA ClassSI . . . . . . . . . . . . . . . . . . 133.3332736808% of the S ClassFI . . . . . . . . . . . . . . . . . . 57.1428569009% of the AO ClassAI . . . . . . . . . . . . . . . . . . 100% of the AO ClassSC . . . . . . . . . . . . . . . . . . 57.1428569009% of the AO ClassTC . . . . . . . . . . . . . . . . . . 57.1428569009% of the AO ClassTB . . . . . . . . . . . . . . . . . . 57.1428569009% of the AO ClassSB . . . . . . . . . . . . . . . . . . 57.1428569009% of the AO ClassSA . . . . . . . . . . . . . . . . . . 57.1428569009% of the AO ClassCI . . . . . . . . . . . . . . . . . . 11.1111027119% of the CB Class
Distributions of Principal
For a description of the principal payment priorities, see “Description of the Certificates—Distributions of Principal” in this prospectus supplement.
Weighted Average Lives (years)*
Group 1 Classes 0% 100% 150% 200% 250% 500% 800% 1200% 1800% 2400%PSA Prepayment Assumption
PA, PF, PS andPW . . . . . . . . . . . . 17.9 7.6 6.0 6.0 6.0 3.5 2.4 1.7 1.2 1.0
PC. . . . . . . . . . . . . . . 27.5 20.7 20.6 20.6 20.6 11.6 7.0 4.2 1.9 1.3HF, S and SI . . . . . . . 29.0 23.3 18.0 9.2 2.7 1.0 0.7 0.5 0.3 0.3HS . . . . . . . . . . . . . . 29.0 23.3 18.0 9.2 2.7 1.0 0.7 0.5 0.3 0.3
Group 2 Classes 0% 100% 235% 400% 600% 800%PSA Prepayment Assumption
AO, FI and SC . . . . . . . . . . . . . . . . . . . . . . . . . . . . 7.8 5.0 3.5 2.5 1.8 1.5TC, TB, FA and FB . . . . . . . . . . . . . . . . . . . . . . . . . 7.8 5.0 3.5 2.5 1.8 1.5FC, SB, SA, AB and AC . . . . . . . . . . . . . . . . . . . . . 7.8 5.0 3.5 2.5 1.8 1.5AD and AE . . . . . . . . . . . . . . . . . . . . . . . . . . . . . . . 7.8 5.0 3.5 2.5 1.8 1.5AG, AH, AJ and AI . . . . . . . . . . . . . . . . . . . . . . . . . 7.8 5.0 3.5 2.5 1.8 1.5AY . . . . . . . . . . . . . . . . . . . . . . . . . . . . . . . . . . . . . . 14.4 12.5 10.8 8.5 6.2 4.7
Group 3 Classes 0% 100% 122% 200% 245% 250% 500% 800% 1150% 1500%PSA Prepayment Assumption
P. . . . . . . . . . . . . . . . . 16.7 7.2 7.2 7.2 7.2 7.2 4.1 2.7 1.9 1.5CB, CI and CA . . . . . . 26.4 12.3 4.7 4.7 4.7 3.7 1.7 1.2 0.9 0.7CF . . . . . . . . . . . . . . . 28.5 21.1 18.6 7.1 2.7 2.6 1.0 0.6 0.5 0.4CS . . . . . . . . . . . . . . . 28.5 21.1 18.6 7.1 2.7 2.6 1.0 0.6 0.5 0.4
Group 4 Classes 0% 100% 254% 400% 600% 800%PSA Prepayment Assumption
DL . . . . . . . . . . . . . . . . . . . . . . . . . . . . . . . . . . . . . . 16.1 6.0 3.0 2.1 1.5 1.2VA . . . . . . . . . . . . . . . . . . . . . . . . . . . . . . . . . . . . . . 6.0 6.0 5.1 3.9 2.9 2.3VB . . . . . . . . . . . . . . . . . . . . . . . . . . . . . . . . . . . . . . 15.0 13.6 8.1 5.7 4.0 3.0ZA . . . . . . . . . . . . . . . . . . . . . . . . . . . . . . . . . . . . . . 27.8 20.8 13.6 9.6 6.6 4.9VD . . . . . . . . . . . . . . . . . . . . . . . . . . . . . . . . . . . . . . 10.5 9.8 6.6 4.8 3.5 2.7DY . . . . . . . . . . . . . . . . . . . . . . . . . . . . . . . . . . . . . . 27.8 19.8 11.5 7.8 5.2 3.9* Determined as specified under “Yield, Maturity and Prepayment Considerations—Weighted Average Lives and
Final Distribution Dates” in the REMIC Prospectus.
S-8

ADDITIONAL RISK FACTORS
Anticipated increases in our purchases ofdelinquent loans from our single-family MBStrusts may result in increased rates of principalpayments on your certificates. On February 10,2010, we announced that we intend to increasesignificantly our purchases of delinquent loansfrom our single-family MBS trusts. If the MBSdirectly or indirectly backing your certificateshold a significant number of delinquent loans,those MBS could experience significant prepay-ments. In turn, this may result in an increase inthe rate of principal payments on your certifi-cates, particularly in the months following thesettlement date specified on the cover of thisprospectus supplement.
You should refer to the MBS Prospectus forfurther information about our option to pur-chase delinquent loans from MBS pools andto our Web site at www.fanniemae.com for fur-ther information about our intention toincrease our purchases of delinquent loans fromour single-family MBS trusts.
“Jumbo-conforming” and “high-balance”mortgage loans, which have original principalbalances that exceed our traditional conformingloan limits, may prepay at different rates thanconforming balance mortgage loans generally.The pools underlying the Group 1 MBS andGroup 3 MBS have been designated as poolsthat include “jumbo-conforming” or “high-bal-ance” mortgage loans. There is limited histori-cal performance data regarding prepaymentrates for jumbo-conforming and high-balancemortgage loans. If prevailing mortgage ratesdecline, borrowers with jumbo-conformingand high-balance mortgage loans may be more
likely to refinance their mortgage loans thanborrowers with conforming balance loans. Thisis because a relatively small reduction in theinterest rate of a jumbo-conforming and high-balance mortgage loan can have a greaterimpact on the borrower’s monthly paymentthan a similar interest rate change for a con-forming balance loan.
Furthermore, jumbo-conforming and high-balance mortgage loans tend to be concentratedin certain geographic areas, which may experi-ence relatively high rates of default in the eventof adverse economic conditions. Defaults onjumbo-conforming and high-balance mortgageloans will result in larger prepayments to inves-tors than defaults on conforming balance loans.
On the other hand, if any of the statutesauthorizing our purchase of jumbo-conformingand high-balance mortgage loans are allowed toexpire, or new legislation is enacted by thefederal government that removes this author-ity, borrowers with jumbo-conforming andhigh-balance mortgage loans may find refi-nancing these loans more difficult. In suchevent, borrowers with jumbo-conforming andhigh-balance mortgage loans may be less likelyto refinance their mortgage loans than borrow-ers with conforming balance loans.
As a result of these factors, the Group 1Classes and Group 3 Classes may receive pay-ments of principal more quickly or more slowlythan expected, and the weighted average livesand yields of those Classes may be affected,perhaps significantly.
DESCRIPTION OF THE CERTIFICATES
The material under this heading describes the principal features of the Certificates. You will findadditional information about the Certificates in the other sections of this prospectus supplement, aswell as in the additional Disclosure Documents and the Trust Agreement. If we use a capitalized termin this prospectus supplement without defining it, you will find the definition of that term in theapplicable Disclosure Document or in the Trust Agreement.
General
Structure. We will create the Fannie Mae REMIC Trust specified on the cover of this prospectussupplement (the “Trust”) pursuant to a trust agreement dated as of August 1, 2007 and a supplementthereto dated as of April 1, 2010 (the “Issue Date”). We will issue the Guaranteed REMIC Pass-Through Certificates (the “REMIC Certificates”) pursuant to that trust agreement and supplement.
S-9

We will issue the Combinable and Recombinable REMIC Certificates (the “RCR Certificates” and,together with the REMIC Certificates, the “Certificates”) pursuant to a separate trust agreementdated as of August 1, 2007 and a supplement thereto dated as of the Issue Date (together with thetrust agreement and supplement relating to the REMIC Certificates, the “Trust Agreement”). We willexecute the Trust Agreement in our corporate capacity and as trustee (the “Trustee”). In general, theterm “Classes” includes the Classes of REMIC Certificates and RCR Certificates.
The assets of the Trust will include four groups of Fannie Mae Guaranteed Mortgage Pass-Through Certificates (the “Group 1 MBS,” “Group 2 MBS,” “Group 3 MBS” and “Group 4 MBS,” andtogether, the “MBS”).
Each MBS represents a beneficial ownership interest in a pool of first lien, one-to four-family(“single-family”), fixed-rate residential mortgage loans (the “Mortgage Loans”) having the charac-teristics described in this prospectus supplement.
The Trust will include the “Lower Tier REMIC” and “Upper Tier REMIC” as “real estatemortgage investment conduits” (each, a “REMIC”) under the Internal Revenue Code of 1986, asamended (the “Code”).
The following chart contains information about the assets, the “regular interests” and the“residual interests” of each REMIC. The REMIC Certificates other than the R and RL Classesare collectively referred to as the “Regular Classes” or “Regular Certificates,” and the R and RLClasses are collectively referred to as the “Residual Classes” or “Residual Certificates.”
REMIC Designation Assets Regular InterestsResidualInterest
Lower Tier REMIC . . . MBS Interests in the Lower TierREMIC other than the RLClass (the “Lower TierRegular Interests”)
RL
Upper Tier REMIC . . . Lower Tier Regular Interests All Classes of REMICCertificates other than theR and RL Classes
R
Fannie Mae Guaranty. For a description of our guaranties of the Certificates and the MBS, seethe applicable discussions appearing under the heading “Fannie Mae Guaranty” in the REMICProspectus and the MBS Prospectus. Our guaranties are not backed by the full faith and credit of theUnited States.
Characteristics of Certificates. Except as specified below, we will issue the Certificates in book-entry form on the book-entry system of the U.S. Federal Reserve Banks. Entities whose names appearon the book-entry records of a Federal Reserve Bank as having had Certificates deposited in theiraccounts are “Holders” or “Certificateholders.”
We will issue the Residual Certificates in fully registered, certificated form. The “Holder” or“Certificateholder” of a Residual Certificate is its registered owner. A Residual Certificate can betransferred at the corporate trust office of the Transfer Agent, or at the office of the Transfer Agent inNew York, New York. U.S. Bank National Association (“US Bank”) in Boston, Massachusetts will bethe initial Transfer Agent. We may impose a service charge for any registration of transfer of aResidual Certificate and may require payment to cover any tax or other governmental charge. Seealso “—Characteristics of the Residual Classes” below.
S-10

Authorized Denominations. We will issue the Certificates in the following denominations:
Classes Denominations
Interest Only, Principal Only andInverse Floating Rate Classes
$100,000 minimum plus whole dollar increments
All other Classes (except theR and RL Classes)
$1,000 minimum plus whole dollar increments
The MBS
The MBS provide that principal and interest on the related Mortgage Loans are passed throughmonthly. The Mortgage Loans underlying the MBS are conventional, fixed-rate, fully-amortizingmortgage loans secured by first mortgages or deeds of trust on single-family residential properties.These Mortgage Loans have original maturities of up to 30 years in the case of the Group 1 MBS,Group 3 MBS and Group 4 MBS and up to 15 years in the case of the Group 2 MBS.
In addition, the pools underlying the Group 1 MBS and Group 3 MBS have been designated aspools that include “jumbo-conforming” or “high balance” mortgage loans as described further under“The Mortgage Loans—Special Feature Mortgage Loans—Loans with Original Principal Balancesthat Exceed our Traditional Conforming Loan Limits” in the MBS Prospectus dated June 1, 2009. Foradditional information about the pools underlying the Group 1 MBS and Group 3 MBS, see the FinalData Statement for the Trust and the related prospectus supplement for each MBS. See also“Additional Risk Factors—“Jumbo-conforming” and “high-balance” mortgage loans, which haveoriginal principal balances that exceed our traditional conforming loan limits, may prepay atdifferent rates than conforming balance mortgage loans generally” in this prospectus supplement.
For additional information, see “Summary—Group 1, Group 2, Group 3 and Group 4—Charac-teristics of the MBS” and “—Assumed Characteristics of the Underlying Mortgage Loans” in thisprospectus supplement and “The Mortgage Pools” and “Yield, Maturity, and Prepayment Consider-ations” in the MBS Prospectus.
Distributions of Interest
General. The Certificates will bear interest at the rates specified in this prospectus supplementon a 30/360 basis. Interest to be paid on each Certificate (or added to principal, in the case of theAccrual Class) on a Distribution Date will consist of one month’s interest on the outstanding balanceof that Certificate immediately prior to that Distribution Date. For a description of the Accrual Class,see “—Accrual Class” below.
Delay Classes and No-Delay Classes. The “delay” Classes and “no-delay” Classes are set forth inthe following table:
Delay Classes No-Delay Classes
Fixed Rate Classes Floating Rate and Inverse Floating Rate Classes
See “Description of the Certificates—Distributions on Certificates—Interest Distributions” in theREMIC Prospectus.
The Dealer will treat the Principal Only Class as a delay Class solely for the purpose offacilitating trading.
Accrual Class. The ZA Class is an Accrual Class. Interest will accrue on the Accrual Class at theapplicable annual rate specified on the cover of this prospectus supplement. However, we will not payany interest on the Accrual Class. Instead, interest accrued on the Accrual Class will be added asprincipal to its principal balance on each Distribution Date. We will pay principal on the AccrualClass as described under “—Distributions of Principal” below.
S-11

Distributions of Principal
On the Distribution Date in each month, we will make payments of principal on the Certificatesas described below.
• Group 1
The Group 1 Principal Distribution Amount in the following priority:
1. To the Aggregate Group to its Planned Balance. PAC Group
2. To HF and S, pro rata, until retired. SupportClasses
3. To the Aggregate Group to zero. PAC Group
The “Group 1 Principal Distribution Amount” is the principal then paid on the Group 1 MBS.
The “Aggregate Group” consists of the PA, PF and PC Classes. On each Distribution Date we willapply payments of principal of the Aggregate Group as follows:
first, to PA and PF, pro rata, until retired; and
second, to PC until retired.
The Aggregate Group has a principal balance equal to the aggregate principal balance of theClasses included in the Aggregate Group.
• Group 2
The Group 2 Principal Distribution Amount to AO and AY, in that order, untilretired.
SequentialPay Classes
The “Group 2 Principal Distribution Amount” is the principal then paid on the Group 2 MBS.
• Group 3
The Group 3 Principal Distribution Amount in the following priority:
1. To P to its Planned Balance.
2. To CB to its Planned Balance.PAC Classes
3. To CF and CS, pro rata, until retired. SupportClasses
4. To CB until retired.
5. To P until retired.PAC Classes
The “Group 3 Principal Distribution Amount” is the principal then paid on theGroup 3 MBS.
• Group 4
The ZA Accrual Amount to VA and VB, in that order, until retired, and thereafterto ZA.
AccretionDirectedClasses andAccrual Class
The Group 4 Cash Flow Distribution Amount to DL, VA, VB and ZA, in that order,until retired.
SequentialPay Classes
The “ZA Accrual Amount” is any interest then accrued and added to the principalbalance of the ZA Class.
Distributions of Principal
On the Distribution Date in each month, we will make payments of principal on the Certificatesas described below.
• Group 1
The Group 1 Principal Distribution Amount in the following priority:
1. To the Aggregate Group to its Planned Balance. PAC Group�����
2. To HF and S, pro rata, until retired. SupportClasses
�����
3. To the Aggregate Group to zero. PAC Group�����
The “Group 1 Principal Distribution Amount” is the principal then paid on the Group 1 MBS.
The “Aggregate Group” consists of the PA, PF and PC Classes. On each Distribution Date we willapply payments of principal of the Aggregate Group as follows:
first, to PA and PF, pro rata, until retired; and
second, to PC until retired.
The Aggregate Group has a principal balance equal to the aggregate principal balance of theClasses included in the Aggregate Group.
• Group 2
The Group 2 Principal Distribution Amount to AO and AY, in that order, untilretired.
SequentialPay Classes
�����������
The “Group 2 Principal Distribution Amount” is the principal then paid on the Group 2 MBS.
• Group 3
The Group 3 Principal Distribution Amount in the following priority:
1. To P to its Planned Balance.
2. To CB to its Planned Balance.PAC Classes
���������������
3. To CF and CS, pro rata, until retired. SupportClasses
�����
4. To CB until retired.
5. To P until retired.PAC Classes
���������������
The “Group 3 Principal Distribution Amount” is the principal then paid on theGroup 3 MBS.
• Group 4
The ZA Accrual Amount to VA and VB, in that order, until retired, and thereafterto ZA.
AccretionDirectedClasses andAccrual Class
�����������
The Group 4 Cash Flow Distribution Amount to DL, VA, VB and ZA, in that order,until retired.
SequentialPay Classes
�����������
The “ZA Accrual Amount” is any interest then accrued and added to the principalbalance of the ZA Class.
S-12

The “Group 4 Cash Flow Distribution Amount” is the principal then paid on theGroup 4 MBS.
Structuring Assumptions
Pricing Assumptions. Except where otherwise noted, the information in the tables in thisprospectus supplement has been prepared based on the following assumptions (the “PricingAssumptions”):
• the Mortgage Loans underlying the MBS have the original terms to maturity, remainingterms to maturity, loan ages and interest rates specified under “Summary—Group 1, Group 2,Group 3 and Group 4—Assumed Characteristics of the Underlying Mortgage Loans” in thisprospectus supplement;
• the Mortgage Loans prepay at the constant percentages of PSA specified in the related tables;
• the settlement date for the Certificates is April 30, 2010; and
• each Distribution Date occurs on the 25th day of a month.
Prepayment Assumptions. The prepayment model used in this prospectus supplement is PSA.For a description of PSA, see “Yield, Maturity and Prepayment Considerations—Prepayment Mod-els” in the REMIC Prospectus. It is highly unlikely that prepayments will occur at any constant PSArate or at any other constant rate.
Principal Balance Schedules. The Principal Balance Schedules are set forth beginning onpage B-1 of this prospectus supplement. The Principal Balance Schedules were prepared based on thePricing Assumptions and the assumption that the related Mortgage Loans prepay at a constant ratewithin the applicable “Structuring Ranges” specified in the chart below. The “Effective Range” for anAggregate Group or a Class is the range of prepayment rates (measured by constant PSA rates) thatwould reduce that Aggregate Group or Class to its scheduled balance each month based on thePricing Assumptions. We have not provided separate schedules for the individual Classes included inthe Aggregate Group. However, those Classes are designed to receive principal distributions in thesame fashion as if separate schedules had been provided (with schedules based on the sameunderlying assumptions that apply to the Aggregate Group schedule). If such separate scheduleshad been provided for the individual Classes included in the Aggregate Group, we expect that theeffective ranges for those Classes would not be narrower than that shown below for the AggregateGroup.
Group and Classes Structuring Ranges Initial Effective Ranges
Aggregate Group Planned Balances Between 150% and 250% PSA Between 150% and 250% PSAP Class Planned Balances Between 100% and 250% PSA Between 100% and 250% PSACB Class Planned Balances Between 122% and 245% PSA Between 122% and 245% PSA
The Aggregate Group listed above consists of the following Classes:
Aggregate Group. . . . . . . . . . . . . . . . . PA, PF and PC
See “—Decrement Tables” below for the percentages of original principal balances of theindividual Classes included in the Aggregate Group that would be outstanding at various constantPSA rates, including the upper and lower bands of the applicable Structuring Range, based on thePricing Assumptions.
We cannot assure you that the balance of an Aggregate Group or Class will conform onany Distribution Date to the balance specified in the Principal Balance Schedules or thatdistributions of principal of an Aggregate Group or Class will begin or end on theDistribution Dates specified in the Principal Balance Schedules.
S-13

If you are considering the purchase of a PAC Class, you should first take into account theconsiderations set forth below.
• We will distribute any excess of principal distributions over the amount necessary to reduce anAggregate Group or a Class to its scheduled balance in any month. As a result, the likelihood ofreducing an Aggregate Group or a Class to its scheduled balance each month will not beimproved by the averaging of high and low principal distributions from month to month.
• Even if the related Mortgage Loans prepay at rates falling within a Structuring Range or anEffective Range, principal distributions may be insufficient to reduce the Aggregate Group orthe applicable Classes to their scheduled balances each month if prepayments do not occur at aconstant PSA rate.
• The actual Effective Ranges at any time will be based upon the actual characteristics of therelated Mortgage Loans at that time, which are likely to vary (and may vary considerably)from the Pricing Assumptions. As a result, the actual Effective Ranges will likely differ fromthe Initial Effective Ranges specified above. For the same reason, the Aggregate Group andthe applicable Classes might not be reduced to their schedule balances each month even if therelated Mortgage Loans prepay at a constant PSA rate within the applicable Initial EffectiveRanges. This is so particularly if the rates fall at the lower or higher end of the applicableranges.
• The actual Effective Ranges may narrow, widen or shift upward or downward to reflect actualprepayment experience over time.
• The principal payment stability of each Aggregate Group or Class that has scheduled balanceswill be supported by one or more other Classes. When the related supporting Classes areretired, the Aggregate Groups and Class receiving the benefit of that support, if still out-standing, may no longer have Effective Ranges and will be much more sensitive to prepay-ments of the related Mortgage Loans.
Yield Tables
General. The tables below illustrate the sensitivity of the pre-tax corporate bond equivalentyields to maturity of the applicable Classes to various constant percentages of PSA and, wherespecified, to changes in the Index. The tables below are provided for illustrative purposesonly and are not intended as a forecast or prediction of the actual yields on the applicableClasses. We calculated the yields set forth in the tables by
• determining the monthly discount rates that, when applied to the assumed streams of cashflows to be paid on the applicable Classes, would cause the discounted present values of theassumed streams of cash flows to equal the assumed aggregate purchase prices of thoseClasses, and
• converting the monthly rates to corporate bond equivalent rates.
These calculations do not take into account variations in the interest rates at which you couldreinvest distributions on the Certificates. Accordingly, these calculations do not illustrate the returnon any investment in the Certificates when reinvestment rates are taken into account.
We cannot assure you that
• the pre-tax yields on the applicable Certificates will correspond to any of the pre-tax yieldsshown here, or
• the aggregate purchase prices of the applicable Certificates will be as assumed.
In addition, it is unlikely that the Index will correspond to the levels shown here. Furthermore,because some of the Mortgage Loans are likely to have remaining terms to maturity shorter or longer
S-14

than those assumed and interest rates higher or lower than those assumed, the principal paymentson the Certificates are likely to differ from those assumed. This would be the case even if all MortgageLoans prepay at the indicated constant percentages of PSA. Moreover, it is unlikely that
• the Mortgage Loans will prepay at a constant PSA rate until maturity,
• all of the Mortgage Loans will prepay at the same rate, or
• the level of the Index will remain constant.
The Inverse Floating Rate Classes and the FI Class. The yields on the Inverse FloatingRate Classes and the FI Class will be sensitive in varying degrees to the rate of principalpayments, including prepayments, of the related Mortgage Loans and to the level of theIndex. The Mortgage Loans generally can be prepaid at any time without penalty. Inaddition, the rate of principal payments (including prepayments) of the Mortgage Loansis likely to vary, and may vary considerably, from pool to pool. As illustrated in theapplicable tables below, it is possible that investors in the PS, SI, FI, SC, TC, TB, HS, SBand SA Classes would lose money on their initial investments under certain Index andprepayment scenarios.
Changes in the Index may not correspond to changes in prevailing mortgage interest rates. It ispossible that lower prevailing mortgage interest rates, which might be expected to result in fasterprepayments, could occur while the level of the Index increased.
The information shown in the following yield tables has been prepared on the basis of the PricingAssumptions and the assumptions that
• the interest rates for the Inverse Floating Rate Classes and the FI Class for the initialInterest Accrual Period are the rates listed in the table under “Summary—Interest Rates” inthis prospectus supplement and for each following Interest Accrual Period will be based onthe specified level of the Index, and
• the aggregate purchase prices of these Classes (expressed in each case as a percentage oforiginal principal balance) are as follows:
Class Price*
PS . . . . . . . . . . . . . . . . . . . . . . . . . 14.000%S . . . . . . . . . . . . . . . . . . . . . . . . . 100.000%SI . . . . . . . . . . . . . . . . . . . . . . . . . 2.250%FI . . . . . . . . . . . . . . . . . . . . . . . . . 10.000%SC . . . . . . . . . . . . . . . . . . . . . . . . . 13.500%TC . . . . . . . . . . . . . . . . . . . . . . . . . 0.125%TB . . . . . . . . . . . . . . . . . . . . . . . . . 0.125%CS . . . . . . . . . . . . . . . . . . . . . . . . . 86.000%HS . . . . . . . . . . . . . . . . . . . . . . . . . 103.000%SB . . . . . . . . . . . . . . . . . . . . . . . . . 13.125%SA . . . . . . . . . . . . . . . . . . . . . . . . . 13.250%* The prices do not include accrued interest. Accrued inter-
est has been added to the prices in calculating the yieldsset forth in the tables below.
S-15

In the following yield tables, the symbol * is used to represent a yield of less than (99.9)%.
Sensitivity of the PS Class to Prepayments and LIBOR(Pre-Tax Yields to Maturity)
LIBOR 50% 100% 150% 200% 250% 500% 800% 1200% 1800% 2400%PSA Prepayment Assumption
0.12000% . . . . . . . . . . . 44.5% 40.9% 37.1% 37.1% 37.1% 25.6% 6.9% (19.8)% (58.3)% (94.4)%0.23531% . . . . . . . . . . . 43.6% 39.9% 36.0% 36.0% 36.0% 24.5% 5.6% (21.2)% (59.6)% (95.7)%2.23531% . . . . . . . . . . . 26.9% 22.8% 18.7% 18.7% 18.7% 4.2% (17.1)% (46.0)% (84.7)% *4.23531% . . . . . . . . . . . 9.9% 5.1% 0.3% 0.3% 0.3% (18.4)% (43.6)% (75.1)% * *6.55000% . . . . . . . . . . . * * * * * * * * * *
Sensitivity of the S Class to Prepayments and LIBOR(Pre-Tax Yields to Maturity)
LIBOR 50% 100% 150% 200% 250% 500% 800% 1200% 1800% 2400%PSA Prepayment Assumption
0.12000% . . . . . . . . . . . 10.7% 10.7% 10.7% 10.7% 10.7% 10.7% 10.7% 10.7% 10.6% 10.6%0.23531% . . . . . . . . . . . 10.4% 10.4% 10.4% 10.4% 10.4% 10.4% 10.4% 10.4% 10.4% 10.4%2.23531% . . . . . . . . . . . 6.3% 6.3% 6.3% 6.4% 6.4% 6.6% 6.8% 6.9% 7.2% 7.5%4.23531% . . . . . . . . . . . 2.3% 2.3% 2.3% 2.3% 2.5% 2.8% 3.1% 3.5% 4.0% 4.5%5.35000% . . . . . . . . . . . 0.0% 0.0% 0.0% 0.1% 0.3% 0.7% 1.1% 1.5% 2.2% 2.8%
Sensitivity of the SI Class to Prepayments and LIBOR(Pre-Tax Yields to Maturity)
LIBOR 50% 100% 150% 200% 250% 500% 800% 1200% 1800% 2400%PSA Prepayment Assumption
0.12000% . . . . . . . . . . . 375.7% 375.7% 375.7% 359.4% 342.2% 246.3% 137.9% 24.4% (84.4)% *0.23531% . . . . . . . . . . . 365.1% 365.1% 365.1% 349.0% 331.9% 236.6% 129.4% 17.9% (88.4)% *2.23531% . . . . . . . . . . . 198.9% 198.9% 198.9% 184.7% 168.5% 79.7% (5.7)% (83.2)% * *4.23531% . . . . . . . . . . . 63.2% 63.1% 63.1% 50.1% 28.4% (63.2)% * * * *5.35000% . . . . . . . . . . . * * * * * * * * * *
Sensitivity of the FI Class to Prepayments and LIBOR(Pre-Tax Yields to Maturity)
LIBOR 50% 100% 235% 400% 600% 800%PSA Prepayment Assumption
0.12000% . . . . . . . . . . . (23.9)% (28.8)% (44.5)% (66.3)% (92.0)% *0.23531% . . . . . . . . . . . (20.7)% (25.5)% (40.8)% (62.1)% (87.5)% *2.23531% . . . . . . . . . . . 11.7% 7.7% (4.5)% (21.5)% (43.4)% (64.8)%4.23531% . . . . . . . . . . . 35.8% 32.1% 21.2% 6.0% (14.0)% (34.4)%6.65000% . . . . . . . . . . . 64.4% 60.8% 50.4% 36.4% 17.8% (1.9)%
S-16

Sensitivity of the SC Class to Prepayments and LIBOR(Pre-Tax Yields to Maturity)
LIBOR 50% 100% 235% 400% 600% 800%PSA Prepayment Assumption
0.12000% . . . . . . . . . . . 39.5% 35.8% 25.0% 10.1% (9.7)% (29.9)%0.23531% . . . . . . . . . . . 38.5% 34.8% 23.9% 8.9% (10.8)% (31.1)%2.23531% . . . . . . . . . . . 20.4% 16.5% 4.9% (11.3)% (32.4)% (53.4)%4.23531% . . . . . . . . . . . 0.6% (3.5)% (16.5)% (34.8)% (57.8)% (79.7)%6.55000% and above . . . * * * * * *
Sensitivity of the TC Class to Prepayments and LIBOR(Pre-Tax Yields to Maturity)
LIBOR 50% 100% 235% 400% 600% 800%PSA Prepayment Assumption
6.550% and below. . . . . 30.0% 26.3% 15.1% (0.4)% (20.7)% (41.3)%6.575%. . . . . . . . . . . . . 4.6% 0.5% (12.2)% (30.0)% (52.5)% (74.3)%6.600% and above . . . . . * * * * * *
Sensitivity of the TB Class to Prepayments and LIBOR(Pre-Tax Yields to Maturity)
LIBOR 50% 100% 235% 400% 600% 800%PSA Prepayment Assumption
6.600% and below. . . . . 30.0% 26.3% 15.1% (0.4)% (20.7)% (41.3)%6.625%. . . . . . . . . . . . . 4.6% 0.5% (12.2)% (30.0)% (52.5)% (74.3)%6.650%. . . . . . . . . . . . . * * * * * *
Sensitivity of the CS Class to Prepayments and LIBOR(Pre-Tax Yields to Maturity)
LIBOR 50% 100% 122% 200% 245% 250% 500% 800% 1150% 1500%PSA Prepayment Assumption
0.12000% . . . . . . . . . . . 12.5% 12.6% 12.7% 15.0% 18.0% 18.3% 28.5% 38.5% 50.2% 62.6%0.23531% . . . . . . . . . . . 12.3% 12.4% 12.5% 14.7% 17.8% 18.1% 28.2% 38.3% 50.0% 62.3%2.23531% . . . . . . . . . . . 8.0% 8.2% 8.3% 10.3% 13.6% 14.0% 24.2% 34.2% 46.0% 58.4%4.23531% . . . . . . . . . . . 3.9% 4.1% 4.2% 6.0% 9.5% 9.9% 20.1% 30.2% 42.0% 54.5%5.90000% . . . . . . . . . . . 0.6% 0.8% 0.9% 2.4% 6.2% 6.5% 16.8% 26.9% 38.8% 51.3%
Sensitivity of the HS Class to Prepayments and LIBOR(Pre-Tax Yields to Maturity)
LIBOR 50% 100% 150% 200% 250% 500% 800% 1200% 1800% 2400%PSA Prepayment Assumption
0.12000% . . . . . . . . . . . 17.5% 17.5% 17.5% 17.2% 16.5% 14.6% 12.9% 10.9% 8.1% 5.4%0.23531% . . . . . . . . . . . 17.1% 17.1% 17.1% 16.8% 16.1% 14.2% 12.6% 10.6% 7.8% 5.1%2.23531% . . . . . . . . . . . 10.3% 10.3% 10.3% 10.1% 9.5% 7.9% 6.5% 4.9% 2.6% 0.3%4.23531% . . . . . . . . . . . 3.6% 3.6% 3.6% 3.4% 2.9% 1.7% 0.6% (0.7)% (2.6)% (4.4)%5.35000% . . . . . . . . . . . (0.1)% (0.1)% (0.1)% (0.2)% (0.7)% (1.8)% (2.7)% (3.8)% (5.4)% (7.0)%
S-17

Sensitivity of the SB Class to Prepayments and LIBOR(Pre-Tax Yields to Maturity)
LIBOR 50% 100% 235% 400% 600% 800%PSA Prepayment Assumption
0.12000% . . . . . . . . . . . 41.7% 38.0% 27.2% 12.4% (7.2)% (27.4)%0.23531% . . . . . . . . . . . 40.6% 36.9% 26.1% 11.3% (8.4)% (28.6)%2.23531% . . . . . . . . . . . 22.0% 18.2% 6.7% (9.4)% (30.3)% (51.3)%4.23531% . . . . . . . . . . . 2.0% (2.2)% (15.1)% (33.2)% (56.1)% (77.9)%6.60000% and above . . . * * * * * *
Sensitivity of the SA Class to Prepayments and LIBOR(Pre-Tax Yields to Maturity)
LIBOR 50% 100% 235% 400% 600% 800%PSA Prepayment Assumption
0.12000%. . . . . . . . . . . . 41.6% 37.9% 27.1% 12.3% (7.3)% (27.5)%0.23531%. . . . . . . . . . . . 40.5% 36.8% 26.0% 11.2% (8.5)% (28.7)%2.23531%. . . . . . . . . . . . 22.1% 18.3% 6.8% (9.3)% (30.2)% (51.2)%4.23531%. . . . . . . . . . . . 2.2% (1.9)% (14.8)% (32.9)% (55.7)% (77.5)%6.65000%. . . . . . . . . . . . * * * * * *
The Principal Only Class. The Principal Only Class will not bear interest. As indicatedin the table below, a low rate of principal payments (including prepayments) on therelated Mortgage Loans will have a negative effect on the yield to investors in thePrincipal Only Class.
The information shown in the yield table has been prepared on the basis of the PricingAssumptions and the assumption that the aggregate purchase price of the Principal Only Class(expressed as a percentage of original principal balance) is as follows:
Class Price
AO . . . . . . . . . . . . . . . . . . . . . . . . . . . . . . . . . . . . . . 90.0%
Sensitivity of the AO Class to Prepayments
50% 100% 235% 400% 600% 800%PSA Prepayment Assumption
Pre-Tax Yields to Maturity . . . 1.8% 2.2% 3.1% 4.4% 5.9% 7.5%
The Fixed Rate Interest Only Classes. The yields to investors in the Fixed Rate InterestOnly Classes will be very sensitive to the rate of principal payments (including prepay-ments) of the related Mortgage Loans. The Mortgage Loans generally can be prepaid atany time without penalty. On the basis of the assumptions described below, the yield tomaturity on each Fixed Rate Interest Only Class would be 0% if prepayments of therelated Mortgage Loans were to occur at the following constant rates:
Class % PSA
CI . . . . . . . . . . . . . . . . . . . . . . . . . . . . . . . . . . . 310%AI . . . . . . . . . . . . . . . . . . . . . . . . . . . . . . . . . . . 246%
S-18

For either Fixed Rate Interest Only Class, if the actual prepayment rate of the relatedMortgage Loans were to exceed the level specified for as little as one month whileequaling that level for the remaining months, the investors in the applicable Class wouldlose money on their initial investments.
The information shown in the following yield tables has been prepared on the basis of the PricingAssumptions and the assumption that the aggregate purchase prices of the Fixed Rate Interest OnlyClasses (expressed in each case as a percentage of the original principal balance) are as follows:
Class Price*
CI . . . . . . . . . . . . . . . . . . . . . . . . . . . . . . . . 12.0000%AI . . . . . . . . . . . . . . . . . . . . . . . . . . . . . . . . 13.3125%* The prices do not include accrued interest. Accrued interest has been
added to the prices in calculating the yields set forth in the tablesbelow.
In the following yield tables, the symbol * is used to represent a yield of less than (99.9)%.
Sensitivity of the CI Class to Prepayments
50% 100% 122% 200% 245% 250% 500% 800% 1150% 1500%PSA Prepayment Assumption
Pre-Tax Yields to Maturity . . . 39.5% 38.8% 16.8% 16.8% 16.8% 13.7% (41.9)% (89.4)% * *
Sensitivity of the AI Class to Prepayments
50% 100% 235% 400% 600% 800%PSA Prepayment Assumption
Pre-Tax Yields to Maturity . . . 16.8% 12.9% 1.1% (15.5)% (36.9)% (58.1)%
Weighted Average Lives of the Certificates
For a description of how the weighted average life of a Certificate is determined, see “Yield,Maturity and Prepayment Considerations—Weighted Average Lives and Final Distribution Dates”in the REMIC Prospectus.
In general, the weighted average lives of the Certificates will be shortened if the level of pre-payments of principal of the related Mortgage Loans increases. However, the weighted average liveswill depend upon a variety of other factors, including
• the timing of changes in the rate of principal distributions, and
• the priority sequences of distributions of principal of the Group 1, Group 2, Group 3 andGroup 4 Classes.
See “—Distributions of Principal” above.
The effect of these factors may differ as to various Classes and the effects on any Class may varyat different times during the life of that Class. Accordingly, we can give no assurance as to theweighted average life of any Class. Further, to the extent the prices of the Certificates representdiscounts or premiums to their original principal balances, variability in the weighted average livesof those Classes of Certificates could result in variability in the related yields to maturity. For anexample of how the weighted average lives of the Classes may be affected at various constantprepayment rates, see the Decrement Tables below.
S-19

Decrement Tables
The following tables indicate the percentages of original principal balances of the specifiedClasses that would be outstanding after each date shown at various constant PSA rates, and thecorresponding weighted average lives of those Classes. The tables have been prepared on the basis ofthe Pricing Assumptions.
In the case of the information set forth for each Class under 0% PSA, however, we assumed thatthe Mortgage Loans have the original and remaining terms to maturity and bear interest at theannual rates specified in the table below.
Mortgage Loans BackingTrust Assets Specified Below
Original and RemainingTerms to Maturity
InterestRates
Group 1 MBS 360 months 7.50%Group 2 MBS 180 months 6.50%Group 3 MBS 360 months 7.00%Group 4 MBS 360 months 7.00%
It is unlikely that all of the Mortgage Loans will have the loan ages, interest rates or remainingterms to maturity assumed, or that the Mortgage Loans will prepay at any constant PSA level.
In addition, the diverse remaining terms to maturity of the Mortgage Loans could produce sloweror faster principal distributions than indicated in the tables at the specified constant PSA rates, evenif the weighted average remaining term to maturity and the weighted average loan age of theMortgage Loans are identical to the weighted averages specified in the Pricing Assumptions. This isthe case because pools of loans with identical weighted averages are nonetheless likely to reflectdiffering dispersions of the related characteristics.
S-20

Percent of Original Principal Balances Outstanding
Date 0% 100% 150% 200% 250% 500% 800% 1200% 1800% 2400% 0% 100% 150% 200% 250% 500% 800% 1200% 1800% 2400%
PSA PrepaymentAssumption
PSA PrepaymentAssumption
PA, PF, PS† and PW Classes PC Class
Initial Percent . . . . . . 100 100 100 100 100 100 100 100 100 100 100 100 100 100 100 100 100 100 100 100April 2011 . . . . . . . . . 99 95 94 94 94 94 94 85 66 46 100 100 100 100 100 100 100 100 100 100April 2012 . . . . . . . . . 98 88 84 84 84 78 57 32 0 0 100 100 100 100 100 100 100 100 0 0April 2013 . . . . . . . . . 96 79 72 72 72 52 26 4 0 0 100 100 100 100 100 100 100 100 0 0April 2014 . . . . . . . . . 95 71 61 61 61 34 10 0 0 0 100 100 100 100 100 100 100 48 0 0April 2015 . . . . . . . . . 93 63 52 52 52 21 2 0 0 0 100 100 100 100 100 100 100 13 0 0April 2016 . . . . . . . . . 91 56 43 43 43 13 0 0 0 0 100 100 100 100 100 100 71 4 0 0April 2017 . . . . . . . . . 90 49 35 35 35 7 0 0 0 0 100 100 100 100 100 100 36 1 0 0April 2018 . . . . . . . . . 88 43 29 29 29 3 0 0 0 0 100 100 100 100 100 100 18 * 0 0April 2019 . . . . . . . . . 85 37 23 23 23 0 0 0 0 0 100 100 100 100 100 99 9 * 0 0April 2020 . . . . . . . . . 83 32 18 18 18 0 0 0 0 0 100 100 100 100 100 68 5 * 0 0April 2021 . . . . . . . . . 81 26 14 14 14 0 0 0 0 0 100 100 100 100 100 46 2 * 0 0April 2022 . . . . . . . . . 78 22 10 10 10 0 0 0 0 0 100 100 100 100 100 31 1 * 0 0April 2023 . . . . . . . . . 75 17 7 7 7 0 0 0 0 0 100 100 100 100 100 21 1 * 0 0April 2024 . . . . . . . . . 72 13 5 5 5 0 0 0 0 0 100 100 100 100 100 14 * * 0 0April 2025 . . . . . . . . . 69 9 3 3 3 0 0 0 0 0 100 100 100 100 100 9 * * 0 0April 2026 . . . . . . . . . 65 5 1 1 1 0 0 0 0 0 100 100 100 100 100 6 * * 0 0April 2027 . . . . . . . . . 61 1 0 0 0 0 0 0 0 0 100 100 95 95 95 4 * * 0 0April 2028 . . . . . . . . . 57 0 0 0 0 0 0 0 0 0 100 76 76 76 76 3 * 0 0 0April 2029 . . . . . . . . . 52 0 0 0 0 0 0 0 0 0 100 61 61 61 61 2 * 0 0 0April 2030 . . . . . . . . . 48 0 0 0 0 0 0 0 0 0 100 48 48 48 48 1 * 0 0 0April 2031 . . . . . . . . . 42 0 0 0 0 0 0 0 0 0 100 37 37 37 37 1 * 0 0 0April 2032 . . . . . . . . . 37 0 0 0 0 0 0 0 0 0 100 29 29 29 29 * * 0 0 0April 2033 . . . . . . . . . 31 0 0 0 0 0 0 0 0 0 100 22 22 22 22 * * 0 0 0April 2034 . . . . . . . . . 24 0 0 0 0 0 0 0 0 0 100 16 16 16 16 * * 0 0 0April 2035 . . . . . . . . . 17 0 0 0 0 0 0 0 0 0 100 12 12 12 12 * * 0 0 0April 2036 . . . . . . . . . 9 0 0 0 0 0 0 0 0 0 100 8 8 8 8 * * 0 0 0April 2037 . . . . . . . . . 1 0 0 0 0 0 0 0 0 0 100 5 5 5 5 * * 0 0 0April 2038 . . . . . . . . . 0 0 0 0 0 0 0 0 0 0 3 3 3 3 3 * * 0 0 0April 2039 . . . . . . . . . 0 0 0 0 0 0 0 0 0 0 1 1 1 1 1 * 0 0 0 0April 2040 . . . . . . . . . 0 0 0 0 0 0 0 0 0 0 0 0 0 0 0 0 0 0 0 0Weighted Average
Life (years)** . . . . . 17.9 7.6 6.0 6.0 6.0 3.5 2.4 1.7 1.2 1.0 27.5 20.7 20.6 20.6 20.6 11.6 7.0 4.2 1.9 1.3
* Indicates an outstanding balance greater than 0% and less than 0.5% of the original principal balance.** Determined as specified under “Yield, Maturity and Prepayment Considerations—Weighted Average Lives and Final Distribu-
tion Dates” in the REMIC Prospectus.† In the case of a Notional Class, the Decrement Table indicates the percentage of the original notional principal balance
outstanding.
S-21

Date 0% 100% 150% 200% 250% 500% 800% 1200% 1800% 2400% 0% 100% 150% 200% 250% 500% 800% 1200% 1800% 2400%
PSA PrepaymentAssumption
PSA PrepaymentAssumption
HF, S and SI† Classes HS Class
Initial Percent . . . . . . 100 100 100 100 100 100 100 100 100 100 100 100 100 100 100 100 100 100 100 100April 2011 . . . . . . . . . 100 100 100 93 87 53 12 0 0 0 100 100 100 93 87 53 12 0 0 0April 2012 . . . . . . . . . 100 100 100 81 62 0 0 0 0 0 100 100 100 81 62 0 0 0 0 0April 2013 . . . . . . . . . 100 100 100 68 38 0 0 0 0 0 100 100 100 68 38 0 0 0 0 0April 2014 . . . . . . . . . 100 100 100 59 21 0 0 0 0 0 100 100 100 59 21 0 0 0 0 0April 2015 . . . . . . . . . 100 100 100 53 10 0 0 0 0 0 100 100 100 53 10 0 0 0 0 0April 2016 . . . . . . . . . 100 100 100 48 3 0 0 0 0 0 100 100 100 48 3 0 0 0 0 0April 2017 . . . . . . . . . 100 100 100 46 * 0 0 0 0 0 100 100 100 46 * 0 0 0 0 0April 2018 . . . . . . . . . 100 100 100 45 0 0 0 0 0 0 100 100 100 45 0 0 0 0 0 0April 2019 . . . . . . . . . 100 100 98 43 0 0 0 0 0 0 100 100 98 43 0 0 0 0 0 0April 2020 . . . . . . . . . 100 100 94 41 0 0 0 0 0 0 100 100 94 41 0 0 0 0 0 0April 2021 . . . . . . . . . 100 100 90 38 0 0 0 0 0 0 100 100 90 38 0 0 0 0 0 0April 2022 . . . . . . . . . 100 100 84 35 0 0 0 0 0 0 100 100 84 35 0 0 0 0 0 0April 2023 . . . . . . . . . 100 100 78 32 0 0 0 0 0 0 100 100 78 32 0 0 0 0 0 0April 2024 . . . . . . . . . 100 100 72 29 0 0 0 0 0 0 100 100 72 29 0 0 0 0 0 0April 2025 . . . . . . . . . 100 100 66 26 0 0 0 0 0 0 100 100 66 26 0 0 0 0 0 0April 2026 . . . . . . . . . 100 100 59 23 0 0 0 0 0 0 100 100 59 23 0 0 0 0 0 0April 2027 . . . . . . . . . 100 100 53 20 0 0 0 0 0 0 100 100 53 20 0 0 0 0 0 0April 2028 . . . . . . . . . 100 98 47 17 0 0 0 0 0 0 100 98 47 17 0 0 0 0 0 0April 2029 . . . . . . . . . 100 88 41 15 0 0 0 0 0 0 100 88 41 15 0 0 0 0 0 0April 2030 . . . . . . . . . 100 78 36 13 0 0 0 0 0 0 100 78 36 13 0 0 0 0 0 0April 2031 . . . . . . . . . 100 68 31 11 0 0 0 0 0 0 100 68 31 11 0 0 0 0 0 0April 2032 . . . . . . . . . 100 59 26 9 0 0 0 0 0 0 100 59 26 9 0 0 0 0 0 0April 2033 . . . . . . . . . 100 50 21 7 0 0 0 0 0 0 100 50 21 7 0 0 0 0 0 0April 2034 . . . . . . . . . 100 41 17 6 0 0 0 0 0 0 100 41 17 6 0 0 0 0 0 0April 2035 . . . . . . . . . 100 33 13 4 0 0 0 0 0 0 100 33 13 4 0 0 0 0 0 0April 2036 . . . . . . . . . 100 25 10 3 0 0 0 0 0 0 100 25 10 3 0 0 0 0 0 0April 2037 . . . . . . . . . 100 18 7 2 0 0 0 0 0 0 100 18 7 2 0 0 0 0 0 0April 2038 . . . . . . . . . 91 11 4 1 0 0 0 0 0 0 91 11 4 1 0 0 0 0 0 0April 2039 . . . . . . . . . 47 4 1 * 0 0 0 0 0 0 47 4 1 * 0 0 0 0 0 0April 2040 . . . . . . . . . 0 0 0 0 0 0 0 0 0 0 0 0 0 0 0 0 0 0 0 0Weighted Average
Life (years)** . . . . . 29.0 23.3 18.0 9.2 2.7 1.0 0.7 0.5 0.3 0.3 29.0 23.3 18.0 9.2 2.7 1.0 0.7 0.5 0.3 0.3
Date 0% 100% 235% 400% 600% 800% 0% 100% 235% 400% 600% 800% 0% 100% 235% 400% 600% 800%
PSA PrepaymentAssumption
PSA PrepaymentAssumption
PSA PrepaymentAssumption
AO, FI† and SC† Classes TC†, TB†, FA and FB Classes FC, SB†, SA†, AB and AC Classes
Initial Percent . . . . . . 100 100 100 100 100 100 100 100 100 100 100 100 100 100 100 100 100 100April 2011 . . . . . . . . . 95 90 85 79 72 65 95 90 85 79 72 65 95 90 85 79 72 65April 2012 . . . . . . . . . 90 79 67 54 40 26 90 79 67 54 40 26 90 79 67 54 40 26April 2013 . . . . . . . . . 85 67 51 34 17 5 85 67 51 34 17 5 85 67 51 34 17 5April 2014 . . . . . . . . . 79 57 37 19 4 0 79 57 37 19 4 0 79 57 37 19 4 0April 2015 . . . . . . . . . 73 47 26 9 0 0 73 47 26 9 0 0 73 47 26 9 0 0April 2016 . . . . . . . . . 67 38 17 1 0 0 67 38 17 1 0 0 67 38 17 1 0 0April 2017 . . . . . . . . . 60 29 9 0 0 0 60 29 9 0 0 0 60 29 9 0 0 0April 2018 . . . . . . . . . 52 21 3 0 0 0 52 21 3 0 0 0 52 21 3 0 0 0April 2019 . . . . . . . . . 44 14 0 0 0 0 44 14 0 0 0 0 44 14 0 0 0 0April 2020 . . . . . . . . . 36 7 0 0 0 0 36 7 0 0 0 0 36 7 0 0 0 0April 2021 . . . . . . . . . 27 1 0 0 0 0 27 1 0 0 0 0 27 1 0 0 0 0April 2022 . . . . . . . . . 17 0 0 0 0 0 17 0 0 0 0 0 17 0 0 0 0 0April 2023 . . . . . . . . . 7 0 0 0 0 0 7 0 0 0 0 0 7 0 0 0 0 0April 2024 . . . . . . . . . 0 0 0 0 0 0 0 0 0 0 0 0 0 0 0 0 0 0April 2025 . . . . . . . . . 0 0 0 0 0 0 0 0 0 0 0 0 0 0 0 0 0 0Weighted Average
Life (years)** . . . . . 7.8 5.0 3.5 2.5 1.8 1.5 7.8 5.0 3.5 2.5 1.8 1.5 7.8 5.0 3.5 2.5 1.8 1.5
* Indicates an outstanding balance greater than 0% and less than 0.5% of the original principal balance.** Determined as specified under “Yield, Maturity and Prepayment Considerations—Weighted Average Lives and Final Distribu-
tion Dates” in the REMIC Prospectus.† In the case of a Notional Class, the Decrement Table indicates the percentage of the original notional principal balance
outstanding.
S-22

Date 0% 100% 235% 400% 600% 800% 0% 100% 235% 400% 600% 800% 0% 100% 235% 400% 600% 800%
PSA PrepaymentAssumption
PSA PrepaymentAssumption
PSA PrepaymentAssumption
AD and AE Classes AG, AH, AJ and AI† Classes AY Class
Initial Percent . . . . . . 100 100 100 100 100 100 100 100 100 100 100 100 100 100 100 100 100 100April 2011 . . . . . . . . . 95 90 85 79 72 65 95 90 85 79 72 65 100 100 100 100 100 100April 2012 . . . . . . . . . 90 79 67 54 40 26 90 79 67 54 40 26 100 100 100 100 100 100April 2013 . . . . . . . . . 85 67 51 34 17 5 85 67 51 34 17 5 100 100 100 100 100 100April 2014 . . . . . . . . . 79 57 37 19 4 0 79 57 37 19 4 0 100 100 100 100 100 63April 2015 . . . . . . . . . 73 47 26 9 0 0 73 47 26 9 0 0 100 100 100 100 74 30April 2016 . . . . . . . . . 67 38 17 1 0 0 67 38 17 1 0 0 100 100 100 100 43 14April 2017 . . . . . . . . . 60 29 9 0 0 0 60 29 9 0 0 0 100 100 100 73 25 7April 2018 . . . . . . . . . 52 21 3 0 0 0 52 21 3 0 0 0 100 100 100 49 14 3April 2019 . . . . . . . . . 44 14 0 0 0 0 44 14 0 0 0 0 100 100 88 32 8 1April 2020 . . . . . . . . . 36 7 0 0 0 0 36 7 0 0 0 0 100 100 62 20 4 1April 2021 . . . . . . . . . 27 1 0 0 0 0 27 1 0 0 0 0 100 100 41 11 2 *April 2022 . . . . . . . . . 17 0 0 0 0 0 17 0 0 0 0 0 100 67 24 6 1 *April 2023 . . . . . . . . . 7 0 0 0 0 0 7 0 0 0 0 0 100 32 11 2 * *April 2024 . . . . . . . . . 0 0 0 0 0 0 0 0 0 0 0 0 75 0 0 0 0 0April 2025 . . . . . . . . . 0 0 0 0 0 0 0 0 0 0 0 0 0 0 0 0 0 0Weighted Average
Life (years)** . . . . . 7.8 5.0 3.5 2.5 1.8 1.5 7.8 5.0 3.5 2.5 1.8 1.5 14.4 12.5 10.8 8.5 6.2 4.7
Date 0% 100% 122% 200% 245% 250% 500% 800% 1150% 1500% 0% 100% 122% 200% 245% 250% 500% 800% 1150% 1500%
PSA PrepaymentAssumption
PSA PrepaymentAssumption
P Class CB, CI† and CA Classes
Initial Percent . . . . . . 100 100 100 100 100 100 100 100 100 100 100 100 100 100 100 100 100 100 100 100April 2011 . . . . . . . . . 99 94 94 94 94 94 94 94 91 76 100 100 90 90 90 90 90 90 0 0April 2012 . . . . . . . . . 97 85 85 85 85 85 85 60 35 14 100 100 72 72 72 72 1 0 0 0April 2013 . . . . . . . . . 95 75 75 75 75 75 58 31 11 1 100 100 56 56 56 56 0 0 0 0April 2014 . . . . . . . . . 94 66 66 66 66 66 40 16 3 * 100 100 42 42 42 42 0 0 0 0April 2015 . . . . . . . . . 92 58 58 58 58 58 28 8 1 * 100 100 31 31 31 31 0 0 0 0April 2016 . . . . . . . . . 90 50 50 50 50 50 19 4 * * 100 100 22 22 22 22 0 0 0 0April 2017 . . . . . . . . . 88 43 43 43 43 43 13 2 * * 100 100 16 16 16 7 0 0 0 0April 2018 . . . . . . . . . 85 36 36 36 36 36 9 1 * * 100 100 11 11 11 * 0 0 0 0April 2019 . . . . . . . . . 83 30 30 30 30 30 6 1 * * 100 97 11 11 11 0 0 0 0 0April 2020 . . . . . . . . . 80 25 25 25 25 25 4 * * 0 100 88 10 10 10 0 0 0 0 0April 2021 . . . . . . . . . 77 20 20 20 20 20 3 * * 0 100 72 9 9 9 0 0 0 0 0April 2022 . . . . . . . . . 74 17 17 17 17 17 2 * * 0 100 53 8 8 8 0 0 0 0 0April 2023 . . . . . . . . . 71 14 14 14 14 14 1 * * 0 100 30 7 7 7 0 0 0 0 0April 2024 . . . . . . . . . 68 11 11 11 11 11 1 * * 0 100 6 6 6 6 0 0 0 0 0April 2025 . . . . . . . . . 64 9 9 9 9 9 1 * * 0 100 6 6 6 6 0 0 0 0 0April 2026 . . . . . . . . . 60 7 7 7 7 7 * * * 0 100 5 5 5 5 0 0 0 0 0April 2027 . . . . . . . . . 55 6 6 6 6 6 * * 0 0 100 4 4 4 4 0 0 0 0 0April 2028 . . . . . . . . . 51 5 5 5 5 5 * * 0 0 100 4 4 4 4 0 0 0 0 0April 2029 . . . . . . . . . 46 4 4 4 4 4 * * 0 0 100 3 3 3 3 0 0 0 0 0April 2030 . . . . . . . . . 41 3 3 3 3 3 * * 0 0 100 2 2 2 2 0 0 0 0 0April 2031 . . . . . . . . . 35 2 2 2 2 2 * * 0 0 100 2 2 2 2 0 0 0 0 0April 2032 . . . . . . . . . 29 2 2 2 2 2 * * 0 0 100 2 2 2 2 0 0 0 0 0April 2033 . . . . . . . . . 22 1 1 1 1 1 * * 0 0 100 1 1 1 1 0 0 0 0 0April 2034 . . . . . . . . . 15 1 1 1 1 1 * * 0 0 100 1 1 1 1 0 0 0 0 0April 2035 . . . . . . . . . 8 1 1 1 1 1 * * 0 0 100 1 1 1 1 0 0 0 0 0April 2036 . . . . . . . . . * * * * * * * * 0 0 87 1 1 1 1 0 0 0 0 0April 2037 . . . . . . . . . * * * * * * * 0 0 0 * * * * * 0 0 0 0 0April 2038 . . . . . . . . . * * * * * * * 0 0 0 * * * * * 0 0 0 0 0April 2039 . . . . . . . . . * * * * * * * 0 0 0 * * * * * 0 0 0 0 0April 2040 . . . . . . . . . 0 0 0 0 0 0 0 0 0 0 0 0 0 0 0 0 0 0 0 0Weighted Average
Life (years)** . . . . . 16.7 7.2 7.2 7.2 7.2 7.2 4.1 2.7 1.9 1.5 26.4 12.3 4.7 4.7 4.7 3.7 1.7 1.2 0.9 0.7
* Indicates an outstanding balance greater than 0% and less than 0.5% of the original principal balance.** Determined as specified under “Yield, Maturity and Prepayment Considerations—Weighted Average Lives and Final Distribu-
tion Dates” in the REMIC Prospectus.† In the case of a Notional Class, the Decrement Table indicates the percentage of the original notional principal balance
outstanding.
S-23

Date 0% 100% 122% 200% 245% 250% 500% 800% 1150% 1500% 0% 100% 122% 200% 245% 250% 500% 800% 1150% 1500%
PSA PrepaymentAssumption
PSA PrepaymentAssumption
CF Class CS Class
Initial Percent . . . . . . 100 100 100 100 100 100 100 100 100 100 100 100 100 100 100 100 100 100 100 100April 2011 . . . . . . . . . 100 100 100 90 84 83 51 12 0 0 100 100 100 90 84 83 51 12 0 0April 2012 . . . . . . . . . 100 100 100 74 59 58 0 0 0 0 100 100 100 74 59 58 0 0 0 0April 2013 . . . . . . . . . 100 100 100 59 37 35 0 0 0 0 100 100 100 59 37 35 0 0 0 0April 2014 . . . . . . . . . 100 100 100 48 22 19 0 0 0 0 100 100 100 48 22 19 0 0 0 0April 2015 . . . . . . . . . 100 100 100 41 11 8 0 0 0 0 100 100 100 41 11 8 0 0 0 0April 2016 . . . . . . . . . 100 100 100 35 4 1 0 0 0 0 100 100 100 35 4 1 0 0 0 0April 2017 . . . . . . . . . 100 100 100 32 1 0 0 0 0 0 100 100 100 32 1 0 0 0 0 0April 2018 . . . . . . . . . 100 100 100 31 0 0 0 0 0 0 100 100 100 31 0 0 0 0 0 0April 2019 . . . . . . . . . 100 100 99 29 0 0 0 0 0 0 100 100 99 29 0 0 0 0 0 0April 2020 . . . . . . . . . 100 100 96 28 0 0 0 0 0 0 100 100 96 28 0 0 0 0 0 0April 2021 . . . . . . . . . 100 100 92 26 0 0 0 0 0 0 100 100 92 26 0 0 0 0 0 0April 2022 . . . . . . . . . 100 100 87 24 0 0 0 0 0 0 100 100 87 24 0 0 0 0 0 0April 2023 . . . . . . . . . 100 100 82 21 0 0 0 0 0 0 100 100 82 21 0 0 0 0 0 0April 2024 . . . . . . . . . 100 100 76 19 0 0 0 0 0 0 100 100 76 19 0 0 0 0 0 0April 2025 . . . . . . . . . 100 93 70 17 0 0 0 0 0 0 100 93 70 17 0 0 0 0 0 0April 2026 . . . . . . . . . 100 85 64 15 0 0 0 0 0 0 100 85 64 15 0 0 0 0 0 0April 2027 . . . . . . . . . 100 78 58 13 0 0 0 0 0 0 100 78 58 13 0 0 0 0 0 0April 2028 . . . . . . . . . 100 70 52 12 0 0 0 0 0 0 100 70 52 12 0 0 0 0 0 0April 2029 . . . . . . . . . 100 63 46 10 0 0 0 0 0 0 100 63 46 10 0 0 0 0 0 0April 2030 . . . . . . . . . 100 56 40 8 0 0 0 0 0 0 100 56 40 8 0 0 0 0 0 0April 2031 . . . . . . . . . 100 49 35 7 0 0 0 0 0 0 100 49 35 7 0 0 0 0 0 0April 2032 . . . . . . . . . 100 42 29 6 0 0 0 0 0 0 100 42 29 6 0 0 0 0 0 0April 2033 . . . . . . . . . 100 35 24 5 0 0 0 0 0 0 100 35 24 5 0 0 0 0 0 0April 2034 . . . . . . . . . 100 29 20 4 0 0 0 0 0 0 100 29 20 4 0 0 0 0 0 0April 2035 . . . . . . . . . 100 23 16 3 0 0 0 0 0 0 100 23 16 3 0 0 0 0 0 0April 2036 . . . . . . . . . 100 17 11 2 0 0 0 0 0 0 100 17 11 2 0 0 0 0 0 0April 2037 . . . . . . . . . 96 12 8 1 0 0 0 0 0 0 96 12 8 1 0 0 0 0 0 0April 2038 . . . . . . . . . 66 6 4 1 0 0 0 0 0 0 66 6 4 1 0 0 0 0 0 0April 2039 . . . . . . . . . 35 2 1 * 0 0 0 0 0 0 35 2 1 * 0 0 0 0 0 0April 2040 . . . . . . . . . 0 0 0 0 0 0 0 0 0 0 0 0 0 0 0 0 0 0 0 0Weighted Average
Life (years)** . . . . . 28.5 21.1 18.6 7.1 2.7 2.6 1.0 0.6 0.5 0.4 28.5 21.1 18.6 7.1 2.7 2.6 1.0 0.6 0.5 0.4
Date 0% 100% 254% 400% 600% 800% 0% 100% 254% 400% 600% 800% 0% 100% 254% 400% 600% 800%
PSA PrepaymentAssumption
PSA PrepaymentAssumption
PSA PrepaymentAssumption
DL Class VA Class VB Class
Initial Percent . . . . . . 100 100 100 100 100 100 100 100 100 100 100 100 100 100 100 100 100 100April 2011 . . . . . . . . . 98 93 86 80 70 61 93 93 93 93 93 93 100 100 100 100 100 100April 2012 . . . . . . . . . 97 83 66 50 31 13 85 85 85 85 85 85 100 100 100 100 100 100April 2013 . . . . . . . . . 95 73 47 25 1 0 77 77 77 77 77 0 100 100 100 100 100 51April 2014 . . . . . . . . . 93 64 31 7 0 0 69 69 69 69 0 0 100 100 100 100 43 0April 2015 . . . . . . . . . 91 55 17 0 0 0 61 61 61 5 0 0 100 100 100 100 0 0April 2016 . . . . . . . . . 89 46 6 0 0 0 52 52 52 0 0 0 100 100 100 20 0 0April 2017 . . . . . . . . . 87 39 0 0 0 0 42 42 18 0 0 0 100 100 100 0 0 0April 2018 . . . . . . . . . 84 31 0 0 0 0 32 32 0 0 0 0 100 100 51 0 0 0April 2019 . . . . . . . . . 82 24 0 0 0 0 22 22 0 0 0 0 100 100 0 0 0 0April 2020 . . . . . . . . . 79 18 0 0 0 0 11 11 0 0 0 0 100 100 0 0 0 0April 2021 . . . . . . . . . 76 12 0 0 0 0 * * 0 0 0 0 100 100 0 0 0 0April 2022 . . . . . . . . . 73 6 0 0 0 0 0 0 0 0 0 0 89 89 0 0 0 0April 2023 . . . . . . . . . 69 1 0 0 0 0 0 0 0 0 0 0 77 77 0 0 0 0April 2024 . . . . . . . . . 66 0 0 0 0 0 0 0 0 0 0 0 64 37 0 0 0 0April 2025 . . . . . . . . . 62 0 0 0 0 0 0 0 0 0 0 0 51 0 0 0 0 0April 2026 . . . . . . . . . 57 0 0 0 0 0 0 0 0 0 0 0 37 0 0 0 0 0April 2027 . . . . . . . . . 53 0 0 0 0 0 0 0 0 0 0 0 23 0 0 0 0 0April 2028 . . . . . . . . . 48 0 0 0 0 0 0 0 0 0 0 0 8 0 0 0 0 0April 2029 . . . . . . . . . 42 0 0 0 0 0 0 0 0 0 0 0 0 0 0 0 0 0April 2030 . . . . . . . . . 37 0 0 0 0 0 0 0 0 0 0 0 0 0 0 0 0 0April 2031 . . . . . . . . . 31 0 0 0 0 0 0 0 0 0 0 0 0 0 0 0 0 0April 2032 . . . . . . . . . 24 0 0 0 0 0 0 0 0 0 0 0 0 0 0 0 0 0April 2033 . . . . . . . . . 17 0 0 0 0 0 0 0 0 0 0 0 0 0 0 0 0 0April 2034 . . . . . . . . . 10 0 0 0 0 0 0 0 0 0 0 0 0 0 0 0 0 0April 2035 . . . . . . . . . 2 0 0 0 0 0 0 0 0 0 0 0 0 0 0 0 0 0April 2036 . . . . . . . . . 0 0 0 0 0 0 0 0 0 0 0 0 0 0 0 0 0 0April 2037 . . . . . . . . . 0 0 0 0 0 0 0 0 0 0 0 0 0 0 0 0 0 0April 2038 . . . . . . . . . 0 0 0 0 0 0 0 0 0 0 0 0 0 0 0 0 0 0April 2039 . . . . . . . . . 0 0 0 0 0 0 0 0 0 0 0 0 0 0 0 0 0 0April 2040 . . . . . . . . . 0 0 0 0 0 0 0 0 0 0 0 0 0 0 0 0 0 0Weighted Average
Life (years)** . . . . . 16.1 6.0 3.0 2.1 1.5 1.2 6.0 6.0 5.1 3.9 2.9 2.3 15.0 13.6 8.1 5.7 4.0 3.0
* Indicates an outstanding balance greater than 0% and less than 0.5% of the original principal balance.** Determined as specified under “Yield, Maturity and Prepayment Considerations—Weighted Average Lives and Final Distribu-
tion Dates” in the REMIC Prospectus.
S-24

Date 0% 100% 254% 400% 600% 800% 0% 100% 254% 400% 600% 800% 0% 100% 254% 400% 600% 800%
PSA PrepaymentAssumption
PSA PrepaymentAssumption
PSA PrepaymentAssumption
ZA Class VD Class DY Class
Initial Percent . . . . . . 100 100 100 100 100 100 100 100 100 100 100 100 100 100 100 100 100 100April 2011 . . . . . . . . . 105 105 105 105 105 105 96 96 96 96 96 96 100 100 100 100 100 100April 2012 . . . . . . . . . 109 109 109 109 109 109 93 93 93 93 93 93 100 100 100 100 100 100April 2013 . . . . . . . . . 114 114 114 114 114 114 89 89 89 89 89 26 100 100 100 100 100 65April 2014 . . . . . . . . . 120 120 120 120 120 75 85 85 85 85 22 0 100 100 100 100 64 33April 2015 . . . . . . . . . 125 125 125 125 93 38 81 81 81 53 0 0 100 100 100 85 40 17April 2016 . . . . . . . . . 131 131 131 131 58 20 76 76 76 10 0 0 100 100 100 63 25 9April 2017 . . . . . . . . . 137 137 137 107 36 10 71 71 59 0 0 0 100 100 93 47 16 4April 2018 . . . . . . . . . 143 143 143 79 23 5 67 67 26 0 0 0 100 100 77 35 10 2April 2019 . . . . . . . . . 150 150 145 59 14 3 62 62 0 0 0 0 100 100 63 25 6 1April 2020 . . . . . . . . . 157 157 120 43 9 1 56 56 0 0 0 0 100 100 52 19 4 1April 2021 . . . . . . . . . 164 164 98 32 5 1 51 51 0 0 0 0 100 100 43 14 2 *April 2022 . . . . . . . . . 171 171 80 23 3 * 45 45 0 0 0 0 100 100 35 10 1 *April 2023 . . . . . . . . . 179 179 65 17 2 * 39 39 0 0 0 0 100 100 28 7 1 *April 2024 . . . . . . . . . 188 188 53 12 1 * 32 19 0 0 0 0 100 92 23 5 1 *April 2025 . . . . . . . . . 196 190 43 9 1 * 26 0 0 0 0 0 100 83 19 4 * *April 2026 . . . . . . . . . 205 170 35 6 * * 19 0 0 0 0 0 100 74 15 3 * *April 2027 . . . . . . . . . 215 151 28 5 * * 11 0 0 0 0 0 100 66 12 2 * *April 2028 . . . . . . . . . 224 133 22 3 * * 4 0 0 0 0 0 100 58 10 1 * *April 2029 . . . . . . . . . 229 116 17 2 * * 0 0 0 0 0 0 100 51 8 1 * *April 2030 . . . . . . . . . 229 101 14 2 * * 0 0 0 0 0 0 100 44 6 1 * *April 2031 . . . . . . . . . 229 86 10 1 * * 0 0 0 0 0 0 100 38 5 * * *April 2032 . . . . . . . . . 229 73 8 1 * * 0 0 0 0 0 0 100 32 3 * * *April 2033 . . . . . . . . . 229 60 6 1 * * 0 0 0 0 0 0 100 26 3 * * *April 2034 . . . . . . . . . 229 48 4 * * * 0 0 0 0 0 0 100 21 2 * * *April 2035 . . . . . . . . . 229 37 3 * * * 0 0 0 0 0 0 100 16 1 * * *April 2036 . . . . . . . . . 196 27 2 * * * 0 0 0 0 0 0 85 12 1 * * *April 2037 . . . . . . . . . 152 18 1 * * * 0 0 0 0 0 0 66 8 1 * * *April 2038 . . . . . . . . . 105 9 1 * * 0 0 0 0 0 0 0 46 4 * * * 0April 2039 . . . . . . . . . 54 1 * * * 0 0 0 0 0 0 0 24 * * * * 0April 2040 . . . . . . . . . 0 0 0 0 0 0 0 0 0 0 0 0 0 0 0 0 0 0Weighted Average
Life (years)** . . . . . 27.8 20.8 13.6 9.6 6.6 4.9 10.5 9.8 6.6 4.8 3.5 2.7 27.8 19.8 11.5 7.8 5.2 3.9
* Indicates an outstanding balance greater than 0% and less than 0.5% of the original principal balance.** Determined as specified under “Yield, Maturity and Prepayment Considerations—Weighted Average Lives and Final Distribu-
tion Dates” in the REMIC Prospectus.
Characteristics of the Residual Classes
A Residual Certificate will be subject to certain transfer restrictions. See “Description of theCertificates—Special Characteristics of the Residual Certificates” and “Material Federal Income TaxConsequences—Taxation of Beneficial Owners of Residual Certificates” in the REMIC Prospectus.
Treasury Department regulations (the “Regulations”) provide that a transfer of a “noneconomicresidual interest” will be disregarded for all federal tax purposes unless no significant purpose of thetransfer is to impede the assessment or collection of tax. A Residual Certificate will constitute anoneconomic residual interest under the Regulations. Having a significant purpose to impede theassessment or collection of tax means that the transferor of a Residual Certificate had “improperknowledge” at the time of the transfer. See “Description of the Certificates—Special Characteristicsof the Residual Certificates” in the REMIC Prospectus. You should consult your own tax advisorregarding the application of the Regulations to a transfer of a Residual Certificate.
CERTAIN ADDITIONAL FEDERAL INCOME TAX CONSEQUENCES
The Certificates and payments on the Certificates are not generally exempt from taxation.Therefore, you should consider the tax consequences of holding a Certificate before you acquire one.The following tax discussion supplements the discussion under the caption “Material Federal IncomeTax Consequences” in the REMIC Prospectus. When read together, the two discussions describe thecurrent federal income tax treatment of beneficial owners of Certificates. These two tax discussionsdo not purport to deal with all federal tax consequences applicable to all categories of beneficialowners, some of which may be subject to special rules. In addition, these discussions may not apply toyour particular circumstances for one of the reasons explained in the REMIC Prospectus. You should
S-25

consult your own tax advisors regarding the federal income tax consequences of holding anddisposing of Certificates as well as any tax consequences arising under the laws of any state, localor foreign taxing jurisdiction.
U.S. Treasury Circular 230 Notice
The tax discussions contained in the REMIC Prospectus (including the sections entitled “Mate-rial Federal Income Tax Consequences” and “ERISA Considerations”) and this prospectus supple-ment were not intended or written to be used, and cannot be used, for the purpose of avoiding UnitedStates federal tax penalties. These discussions were written to support the promotion or marketing ofthe transactions or matters addressed in this prospectus supplement. You should seek advice basedon your particular circumstances from an independent tax advisor.
REMIC Elections and Special Tax Attributes
We will make a REMIC election with respect to each REMIC set forth in the table under“Description of the Certificates—General—Structure.” The Regular Classes will be designated as“regular interests” and the Residual Classes will be designated as the “residual interests” in theREMICs as set forth in that table. Thus, the REMIC Certificates and any related RCR Certificatesgenerally will be treated as “regular or residual interests in a REMIC” for domestic building and loanassociations, as “real estate assets” for real estate investment trusts, and, except for the ResidualClasses, as “qualified mortgages” for other REMICs. See “Material Federal Income Tax Conse-quences—REMIC Election and Special Tax Attributes” in the REMIC Prospectus.
Taxation of Beneficial Owners of Regular Certificates
The Notional Classes, the Principal Only Class, the Accrual Class and the CS Class will be issuedwith original issue discount (“OID”), and certain other Classes of REMIC Certificates may be issuedwith OID. If a Class is issued with OID, a beneficial owner of a Certificate of that Class generally mustrecognize some taxable income in advance of the receipt of the cash attributable to that income. See“Material Federal Income Tax Consequences—Taxation of Beneficial Owners of Regular Certifi-cates—Treatment of Original Issue Discount” in the REMIC Prospectus. In addition, certain Classesof REMIC Certificates may be treated as having been issued at a premium. See “Material FederalIncome Tax Consequences—Taxation of Beneficial Owners of Regular Certificates—Regular Certif-icates Purchased at a Premium” in the REMIC Prospectus.
The Prepayment Assumptions that will be used in determining the rate of accrual of OID will beas follows:
Group Prepayment Assumption
1 200% PSA2 235% PSA3 200% PSA4 254% PSA
See “Material Federal Income Tax Consequences—Taxation of Beneficial Owners of Regular Cer-tificates—Treatment of Original Issue Discount” in the REMIC Prospectus. No representation ismade as to whether the Mortgage Loans underlying the MBS will prepay at any of those rates or anyother rate. See “Description of the Certificates—Weighted Average Lives of the Certificates” in thisprospectus supplement and “Yield, Maturity and Prepayment Considerations—Weighted AverageLives and Final Distribution Dates” in the REMIC Prospectus.
For taxable years beginning after December 31, 2012, certain non-corporate beneficial ownerswill be subject to an increased rate of tax on some or all of their “net investment income,” whichgenerally will include interest, original issue discount and market discount realized on a Regular
S-26

Certificate, and any net gain recognized upon a disposition of a Regular Certificate. You shouldconsult your tax advisor regarding the applicability of this tax in respect of your Regular Certificates.
Taxation of Beneficial Owners of Residual Certificates
The Holder of a Residual Certificate will be considered to be the holder of the “residual interest”in the related REMIC. Such Holder generally will be required to report its daily portion of the taxableincome or net loss of the REMIC to which that Certificate relates. In certain periods, a Holder of aResidual Certificate may be required to recognize taxable income without being entitled to receive acorresponding amount of cash. Pursuant to the Trust Agreement, we will be obligated to provide tothe Holder of a Residual Certificate (i) information necessary to enable it to prepare its federal incometax returns and (ii) any reports regarding the Residual Class that may be required under the Code.See “Material Federal Income Tax Consequences—Taxation of Beneficial Owners of Residual Cer-tificates” in the REMIC Prospectus.
Taxation of Beneficial Owners of RCR Certificates
The RCR Classes will be created, sold and administered pursuant to an arrangement that will beclassified as a grantor trust under subpart E, part I of subchapter J of the Code. The RegularCertificates that are exchanged for RCR Certificates set forth in Schedule 1 (including any exchangeseffective on the Settlement Date) will be the assets of the trust, and the RCR Certificates willrepresent an ownership interest of the underlying Regular Certificates. For a general discussion ofthe federal income tax treatment of beneficial owners of Regular Certificates, see “Material FederalIncome Tax Consequences” in the REMIC Prospectus.
Generally, the ownership interest represented by an RCR certificate will be one of two types. Acertificate of a Combination RCR Class (a “Combination RCR Certificate”) will represent beneficialownership of undivided interests in one or more underlying Regular Certificates. A certificate of aStrip RCR Class (a “Strip RCR Certificate”) will represent the right to receive a disproportionate partof the principal or interest payments on one or more underlying Regular Certificates. The Classes ofRCR Certificates are Combination RCR Certificates. See “Material Federal Income Tax Conse-quences—Taxation of Beneficial Owners of RCR Certificates” in the REMIC Prospectus for a generaldiscussion of the federal income tax treatment of beneficial owners of RCR Certificates.
PLAN OF DISTRIBUTION
We are obligated to deliver the Certificates to Deutsche Bank Securities Inc. (the “Dealer”) inexchange for the MBS. The Dealer proposes to offer the Certificates directly to the public from time totime in negotiated transactions at varying prices to be determined at the time of sale. The Dealer mayeffect these transactions to or through other dealers.
LEGAL MATTERS
Sidley Austin LLP will provide legal representation for Fannie Mae. Sonnenschein Nath &Rosenthal LLP will provide legal representation for the Dealer.
S-27

Sch
edu
le1
Ava
ilab
leR
ecom
bin
atio
ns(
1)
Cla
sses
Ori
gin
alB
alan
ces
RC
RC
lass
esO
rigi
nal
Bal
ance
sP
rin
cip
alT
ype(
2)In
tere
stR
ate
Inte
rest
Typ
e(2)
CU
SIP
Nu
mb
er
Fin
alD
istr
ibu
tion
Dat
e
RE
MIC
Cer
tifi
cate
sR
CR
Cer
tifi
cate
s
Rec
omb
inat
ion
1P
F$
15,6
66,0
00P
W$
15,6
66,0
00P
AC
7.00
%F
IX31
398P
Q69
Sep
tem
ber
2039
PS
15,6
66,0
00(3
)R
ecom
bin
atio
n2
S3,
911,
539
HS
3,91
1,53
9S
UP
(4)
INV
3139
8PQ
77M
ay20
40S
I5,
215,
383(
3)R
ecom
bin
atio
n3
AO
202,
433,
142
FA
202,
433,
142
SE
Q(4
)F
LT31
398P
Q85
Jan
uar
y20
24F
I20
2,43
3,14
2(3)
Rec
omb
inat
ion
4A
O20
2,43
3,14
2F
B20
2,43
3,14
2S
EQ
(4)
FLT
3139
8PQ
93Ja
nu
ary
2024
FI
202,
433,
142(
3)T
B20
2,43
3,14
2(3)
Rec
omb
inat
ion
5A
O20
2,43
3,14
2F
C20
2,43
3,14
2S
EQ
(4)
FLT
3139
8PR
27Ja
nu
ary
2024
FI
202,
433,
142(
3)T
B20
2,43
3,14
2(3)
TC
202,
433,
142(
3)R
ecom
bin
atio
n6
SC
202,
433,
142(
3)S
B20
2,43
3,14
2(3)
NT
L(4
)IN
V/I
O31
398P
R35
Jan
uar
y20
24T
C20
2,43
3,14
2(3)
Rec
omb
inat
ion
7T
B20
2,43
3,14
2(3)
SA
202,
433,
142(
3)N
TL
(4)
INV
/IO
3139
8PR
43Ja
nu
ary
2024
SC
202,
433,
142(
3)T
C20
2,43
3,14
2(3)
Rec
omb
inat
ion
8A
O35
4,25
8,00
0A
B35
4,25
8,00
0S
EQ
2.50
FIX
3139
8PR
50Ja
nu
ary
2024
FI
126,
520,
714(
3)T
B12
6,52
0,71
4(3)
SC
126,
520,
714(
3)T
C12
6,52
0,71
4(3)
A-1
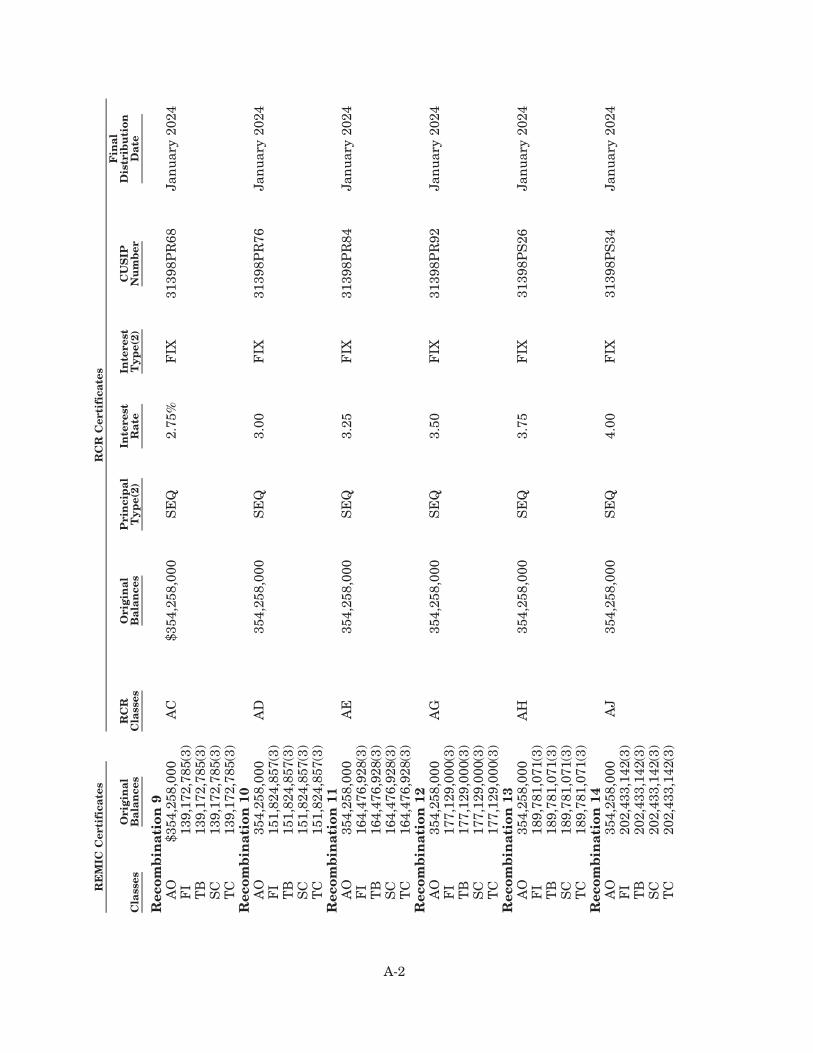
Cla
sses
Ori
gin
alB
alan
ces
RC
RC
lass
esO
rigi
nal
Bal
ance
sP
rin
cip
alT
ype(
2)In
tere
stR
ate
Inte
rest
Typ
e(2)
CU
SIP
Nu
mb
er
Fin
alD
istr
ibu
tion
Dat
e
RE
MIC
Cer
tifi
cate
sR
CR
Cer
tifi
cate
s
Rec
omb
inat
ion
9A
O$3
54,2
58,0
00A
C$3
54,2
58,0
00S
EQ
2.75
%F
IX31
398P
R68
Jan
uar
y20
24F
I13
9,17
2,78
5(3)
TB
139,
172,
785(
3)S
C13
9,17
2,78
5(3)
TC
139,
172,
785(
3)R
ecom
bin
atio
n10
AO
354,
258,
000
AD
354,
258,
000
SE
Q3.
00F
IX31
398P
R76
Jan
uar
y20
24F
I15
1,82
4,85
7(3)
TB
151,
824,
857(
3)S
C15
1,82
4,85
7(3)
TC
151,
824,
857(
3)R
ecom
bin
atio
n11
AO
354,
258,
000
AE
354,
258,
000
SE
Q3.
25F
IX31
398P
R84
Jan
uar
y20
24F
I16
4,47
6,92
8(3)
TB
164,
476,
928(
3)S
C16
4,47
6,92
8(3)
TC
164,
476,
928(
3)R
ecom
bin
atio
n12
AO
354,
258,
000
AG
354,
258,
000
SE
Q3.
50F
IX31
398P
R92
Jan
uar
y20
24F
I17
7,12
9,00
0(3)
TB
177,
129,
000(
3)S
C17
7,12
9,00
0(3)
TC
177,
129,
000(
3)R
ecom
bin
atio
n13
AO
354,
258,
000
AH
354,
258,
000
SE
Q3.
75F
IX31
398P
S26
Jan
uar
y20
24F
I18
9,78
1,07
1(3)
TB
189,
781,
071(
3)S
C18
9,78
1,07
1(3)
TC
189,
781,
071(
3)R
ecom
bin
atio
n14
AO
354,
258,
000
AJ
354,
258,
000
SE
Q4.
00F
IX31
398P
S34
Jan
uar
y20
24F
I20
2,43
3,14
2(3)
TB
202,
433,
142(
3)S
C20
2,43
3,14
2(3)
TC
202,
433,
142(
3)
A-2

Cla
sses
Ori
gin
alB
alan
ces
RC
RC
lass
esO
rigi
nal
Bal
ance
sP
rin
cip
alT
ype(
2)In
tere
stR
ate
Inte
rest
Typ
e(2)
CU
SIP
Nu
mb
er
Fin
alD
istr
ibu
tion
Dat
e
RE
MIC
Cer
tifi
cate
sR
CR
Cer
tifi
cate
s
Rec
omb
inat
ion
15F
I$2
02,4
33,1
42(3
)A
I$3
54,2
58,0
00(3
)N
TL
4.00
%F
IX/I
O31
398P
S42
Jan
uar
y20
24T
B20
2,43
3,14
2(3)
SC
202,
433,
142(
3)T
C20
2,43
3,14
2(3)
Rec
omb
inat
ion
16C
B10
,583
,000
CA
10,5
83,0
00P
AC
4.50
FIX
3139
8PS
59M
ay20
40C
I1,
175,
888(
3)R
ecom
bin
atio
n17
VA
13,4
47,0
00V
D27
,179
,000
SE
Q/A
D4.
50F
IX31
398P
S67
Nov
embe
r20
28V
B13
,732
,000
Rec
omb
inat
ion
18V
A13
,447
,000
DY
(5)
48,1
78,0
00S
EQ
4.50
FIX
3139
8PS7
5M
ay20
40V
B13
,732
,000
ZA
20,9
99,0
00
(1)
RE
MIC
Cer
tifi
cate
san
dR
CR
Cer
tifi
cate
sin
each
Rec
ombi
nat
ion
may
beex
chan
ged
only
inth
epr
opor
tion
sof
orig
inal
prin
cipa
lba
lan
ces
for
the
rela
ted
Cla
sses
show
nin
this
Sch
edu
le1
(dis
rega
rdin
gan
yre
tire
dC
lass
es).
For
exam
ple,
ifa
part
icu
lar
Rec
ombi
nat
ion
incl
ude
stw
oR
EM
ICC
lass
esan
don
eR
CR
Cla
ssw
hos
eor
igin
alpr
inci
palb
alan
ces
show
nin
the
sch
edu
lere
flec
ta
1:1:
2re
lati
onsh
ip,t
he
sam
e1:
1:2
rela
tion
ship
amon
gth
eor
igin
alpr
inci
palb
alan
ces
ofth
ose
RE
MIC
and
RC
RC
lass
esm
ust
bem
ain
tain
edin
any
exch
ange
.Th
isis
tru
eev
enif
,as
are
sult
ofth
eap
plic
able
paym
entp
rior
ity
sequ
ence
,th
ere
lati
onsh
ipbe
twee
nth
eir
curr
ent
prin
cipa
lbal
ance
sh
asch
ange
dov
erti
me.
Mor
eove
r,if
asa
resu
ltof
apr
opos
edex
chan
ge,a
Cer
tifi
cate
hol
der
wou
ldh
old
aR
EM
ICC
erti
fica
teor
RC
RC
erti
fica
teof
aC
lass
inan
amou
nt
less
than
the
appl
icab
lem
inim
um
den
omin
atio
nfo
rth
atC
lass
,th
eC
erti
fica
teh
olde
rw
ill
beu
nab
leto
effe
ctth
epr
opos
edex
chan
ge.
See
“Des
crip
tion
ofth
eC
erti
fica
tes—
Gen
eral
—A
uth
oriz
edD
enom
inat
ion
s”in
this
pros
pect
us
supp
lem
ent.
(2)
See
“Des
crip
tion
ofth
eC
erti
fica
tes—
Cla
ssD
efin
itio
ns
and
Abb
revi
atio
ns”
inth
eR
EM
ICP
rosp
ectu
s.(3
)N
otio
nal
bala
nce
s.T
hes
eC
lass
esar
eIn
tere
stO
nly
Cla
sses
.See
page
S-8
for
ade
scri
ptio
nof
how
thei
rn
otio
nal
bala
nce
sar
eca
lcu
late
d.(4
)F
ora
desc
ript
ion
ofth
ese
inte
rest
rate
sse
e“S
um
mar
y—In
tere
stR
ates
”in
this
pros
pect
us
supp
lem
ent.
(5)
Pri
nci
palp
aym
ents
onth
eR
EM
ICC
erti
fica
tes
inR
ecom
bin
atio
n18
from
the
ZA
Acc
rual
Am
oun
twil
lbe
paid
asin
tere
ston
the
rela
ted
RC
RC
erti
fica
tes
and
thu
sw
ill
not
redu
ceth
epr
inci
pal
bala
nce
sof
thos
eR
CR
Cer
tifi
cate
s.
A-3

Principal Balance Schedules
Aggregate Group Planned BalancesDistribution
DatePlannedBalance
Initial Balance . . . . . $83,050,000.00May 2010 . . . . . . . . . 82,785,553.62June 2010 . . . . . . . . 82,494,889.24July 2010 . . . . . . . . . 82,179,069.04August 2010 . . . . . . . 81,838,256.10September 2010 . . . . 81,472,632.97October 2010 . . . . . . 81,082,401.50November 2010 . . . . . 80,667,782.71December 2010 . . . . . 80,229,016.60January 2011 . . . . . . 79,766,361.97February 2011 . . . . . 79,280,096.12March 2011 . . . . . . . 78,770,514.68April 2011 . . . . . . . . 78,237,931.25May 2011 . . . . . . . . . 77,682,677.15June 2011 . . . . . . . . 77,105,101.08July 2011 . . . . . . . . . 76,505,568.73August 2011 . . . . . . . 75,884,462.46September 2011 . . . . 75,242,180.87October 2011 . . . . . . 74,579,138.40November 2011 . . . . . 73,895,764.88December 2011 . . . . . 73,192,505.05January 2012 . . . . . . 72,469,818.13February 2012 . . . . . 71,728,177.28March 2012 . . . . . . . 70,968,069.08April 2012 . . . . . . . . 70,189,993.04May 2012 . . . . . . . . . 69,394,460.99June 2012 . . . . . . . . 68,605,536.16July 2012 . . . . . . . . . 67,823,165.57August 2012 . . . . . . . 67,047,296.63September 2012 . . . . 66,277,877.18October 2012 . . . . . . 65,514,855.49November 2012 . . . . . 64,758,180.20December 2012 . . . . . 64,007,800.39January 2013 . . . . . . 63,263,665.54February 2013 . . . . . 62,525,725.51March 2013 . . . . . . . 61,793,930.56April 2013 . . . . . . . . 61,068,231.37May 2013 . . . . . . . . . 60,348,578.99June 2013 . . . . . . . . 59,634,924.84July 2013 . . . . . . . . . 58,927,220.76August 2013 . . . . . . . 58,225,418.95September 2013 . . . . 57,529,471.99October 2013 . . . . . . 56,839,332.84November 2013 . . . . . 56,154,954.84December 2013 . . . . . 55,476,291.67January 2014 . . . . . . 54,803,297.41February 2014 . . . . . 54,135,926.48March 2014 . . . . . . . 53,474,133.69April 2014 . . . . . . . . 52,817,874.16May 2014 . . . . . . . . . 52,167,103.42June 2014 . . . . . . . . 51,521,777.31July 2014 . . . . . . . . . 50,881,852.04
DistributionDate
PlannedBalance
August 2014 . . . . . . . $50,247,284.16September 2014 . . . . 49,618,030.56October 2014 . . . . . . 48,994,048.49November 2014 . . . . . 48,375,295.52December 2014 . . . . . 47,761,729.57January 2015 . . . . . . 47,153,308.87February 2015 . . . . . 46,549,992.00March 2015 . . . . . . . 45,951,737.88April 2015 . . . . . . . . 45,358,505.72May 2015 . . . . . . . . . 44,770,255.08June 2015 . . . . . . . . 44,186,945.83July 2015 . . . . . . . . . 43,608,538.17August 2015 . . . . . . . 43,034,992.60September 2015 . . . . 42,466,269.94October 2015 . . . . . . 41,902,331.32November 2015 . . . . . 41,343,138.17December 2015 . . . . . 40,788,652.25January 2016 . . . . . . 40,238,835.60February 2016 . . . . . 39,693,650.56March 2016 . . . . . . . 39,153,059.78April 2016 . . . . . . . . 38,617,026.20May 2016 . . . . . . . . . 38,085,513.06June 2016 . . . . . . . . 37,558,483.89July 2016 . . . . . . . . . 37,035,902.50August 2016 . . . . . . . 36,517,733.00September 2016 . . . . 36,003,939.77October 2016 . . . . . . 35,494,487.48November 2016 . . . . . 34,989,341.09December 2016 . . . . . 34,488,465.82January 2017 . . . . . . 33,991,827.17February 2017 . . . . . 33,499,390.93March 2017 . . . . . . . 33,011,123.14April 2017 . . . . . . . . 32,526,990.12May 2017 . . . . . . . . . 32,046,958.46June 2017 . . . . . . . . 31,570,995.01July 2017 . . . . . . . . . 31,099,066.88August 2017 . . . . . . . 30,631,141.44September 2017 . . . . 30,167,186.33October 2017 . . . . . . 29,707,169.45November 2017 . . . . . 29,251,058.93December 2017 . . . . . 28,800,562.21January 2018 . . . . . . 28,356,638.45February 2018 . . . . . 27,919,194.60March 2018 . . . . . . . 27,488,138.93April 2018 . . . . . . . . 27,063,380.96May 2018 . . . . . . . . . 26,644,831.51June 2018 . . . . . . . . 26,232,402.59July 2018 . . . . . . . . . 25,826,007.47August 2018 . . . . . . . 25,425,560.60September 2018 . . . . 25,030,977.64October 2018 . . . . . . 24,642,175.43November 2018 . . . . . 24,259,071.93
DistributionDate
PlannedBalance
December 2018 . . . . . $23,881,586.28January 2019 . . . . . . 23,509,638.74February 2019 . . . . . 23,143,150.65March 2019 . . . . . . . 22,782,044.48April 2019 . . . . . . . . 22,426,243.77May 2019 . . . . . . . . . 22,075,673.11June 2019 . . . . . . . . 21,730,258.16July 2019 . . . . . . . . . 21,389,925.62August 2019 . . . . . . . 21,054,603.18September 2019 . . . . 20,724,219.57October 2019 . . . . . . 20,398,704.50November 2019 . . . . . 20,077,988.67December 2019 . . . . . 19,762,003.72January 2020 . . . . . . 19,450,682.28February 2020 . . . . . 19,143,957.89March 2020 . . . . . . . 18,841,765.04April 2020 . . . . . . . . 18,544,039.11May 2020 . . . . . . . . . 18,250,716.41June 2020 . . . . . . . . 17,961,734.13July 2020 . . . . . . . . . 17,677,030.31August 2020 . . . . . . . 17,396,543.90September 2020 . . . . 17,120,214.67October 2020 . . . . . . 16,847,983.25November 2020 . . . . . 16,579,791.08December 2020 . . . . . 16,315,580.45January 2021 . . . . . . 16,055,294.41February 2021 . . . . . 15,798,876.86March 2021 . . . . . . . 15,546,272.45April 2021 . . . . . . . . 15,297,426.60May 2021 . . . . . . . . . 15,052,285.53June 2021 . . . . . . . . 14,810,796.17July 2021 . . . . . . . . . 14,572,906.22August 2021 . . . . . . . 14,338,564.10September 2021 . . . . 14,107,718.96October 2021 . . . . . . 13,880,320.66November 2021 . . . . . 13,656,319.76December 2021 . . . . . 13,435,667.52January 2022 . . . . . . 13,218,315.86February 2022 . . . . . 13,004,217.40March 2022 . . . . . . . 12,793,325.42April 2022 . . . . . . . . 12,585,593.84May 2022 . . . . . . . . . 12,380,977.24June 2022 . . . . . . . . 12,179,430.83July 2022 . . . . . . . . . 11,980,910.47August 2022 . . . . . . . 11,785,372.60September 2022 . . . . 11,592,774.30October 2022 . . . . . . 11,403,073.25November 2022 . . . . . 11,216,227.71December 2022 . . . . . 11,032,196.54January 2023 . . . . . . 10,850,939.18February 2023 . . . . . 10,672,415.63March 2023 . . . . . . . 10,496,586.46
B-1

DistributionDate
PlannedBalance
April 2023 . . . . . . . . $10,323,412.78May 2023 . . . . . . . . . 10,152,856.27June 2023 . . . . . . . . 9,984,879.12July 2023 . . . . . . . . . 9,819,444.09August 2023 . . . . . . . 9,656,514.43September 2023 . . . . 9,496,053.91October 2023 . . . . . . 9,338,026.84November 2023 . . . . . 9,182,397.99December 2023 . . . . . 9,029,132.67January 2024 . . . . . . 8,878,196.65February 2024 . . . . . 8,729,556.18March 2024 . . . . . . . 8,583,178.00April 2024 . . . . . . . . 8,439,029.31May 2024 . . . . . . . . . 8,297,077.79June 2024 . . . . . . . . 8,157,291.55July 2024 . . . . . . . . . 8,019,639.16August 2024 . . . . . . . 7,884,089.65September 2024 . . . . 7,750,612.46October 2024 . . . . . . 7,619,177.47November 2024 . . . . . 7,489,755.00December 2024 . . . . . 7,362,315.78January 2025 . . . . . . 7,236,830.94February 2025 . . . . . 7,113,272.04March 2025 . . . . . . . 6,991,611.03April 2025 . . . . . . . . 6,871,820.26May 2025 . . . . . . . . . 6,753,872.46June 2025 . . . . . . . . 6,637,740.77July 2025 . . . . . . . . . 6,523,398.68August 2025 . . . . . . . 6,410,820.08September 2025 . . . . 6,299,979.22October 2025 . . . . . . 6,190,850.72November 2025 . . . . . 6,083,409.54December 2025 . . . . . 5,977,631.02January 2026 . . . . . . 5,873,490.83February 2026 . . . . . 5,770,965.01March 2026 . . . . . . . 5,670,029.90April 2026 . . . . . . . . 5,570,662.22May 2026 . . . . . . . . . 5,472,838.99June 2026 . . . . . . . . 5,376,537.56July 2026 . . . . . . . . . 5,281,735.61August 2026 . . . . . . . 5,188,411.14September 2026 . . . . 5,096,542.45October 2026 . . . . . . 5,006,108.15November 2026 . . . . . 4,917,087.17December 2026 . . . . . 4,829,458.72January 2027 . . . . . . 4,743,202.32February 2027 . . . . . 4,658,297.76March 2027 . . . . . . . 4,574,725.15April 2027 . . . . . . . . 4,492,464.85May 2027 . . . . . . . . . 4,411,497.52June 2027 . . . . . . . . 4,331,804.10July 2027 . . . . . . . . . 4,253,365.77August 2027 . . . . . . . 4,176,164.02September 2027 . . . . 4,100,180.58October 2027 . . . . . . 4,025,397.43
DistributionDate
PlannedBalance
November 2027 . . . . . $ 3,951,796.84December 2027 . . . . . 3,879,361.30January 2028 . . . . . . 3,808,073.57February 2028 . . . . . 3,737,916.65March 2028 . . . . . . . 3,668,873.77April 2028 . . . . . . . . 3,600,928.43May 2028 . . . . . . . . . 3,534,064.34June 2028 . . . . . . . . 3,468,265.45July 2028 . . . . . . . . . 3,403,515.94August 2028 . . . . . . . 3,339,800.22September 2028 . . . . 3,277,102.91October 2028 . . . . . . 3,215,408.87November 2028 . . . . . 3,154,703.16December 2028 . . . . . 3,094,971.06January 2029 . . . . . . 3,036,198.06February 2029 . . . . . 2,978,369.86March 2029 . . . . . . . 2,921,472.37April 2029 . . . . . . . . 2,865,491.68May 2029 . . . . . . . . . 2,810,414.11June 2029 . . . . . . . . 2,756,226.15July 2029 . . . . . . . . . 2,702,914.50August 2029 . . . . . . . 2,650,466.05September 2029 . . . . 2,598,867.87October 2029 . . . . . . 2,548,107.22November 2029 . . . . . 2,498,171.55December 2029 . . . . . 2,449,048.47January 2030 . . . . . . 2,400,725.79February 2030 . . . . . 2,353,191.50March 2030 . . . . . . . 2,306,433.72April 2030 . . . . . . . . 2,260,440.80May 2030 . . . . . . . . . 2,215,201.21June 2030 . . . . . . . . 2,170,703.62July 2030 . . . . . . . . . 2,126,936.83August 2030 . . . . . . . 2,083,889.84September 2030 . . . . 2,041,551.77October 2030 . . . . . . 1,999,911.93November 2030 . . . . . 1,958,959.76December 2030 . . . . . 1,918,684.87January 2031 . . . . . . 1,879,077.01February 2031 . . . . . 1,840,126.07March 2031 . . . . . . . 1,801,822.11April 2031 . . . . . . . . 1,764,155.32May 2031 . . . . . . . . . 1,727,116.02June 2031 . . . . . . . . 1,690,694.69July 2031 . . . . . . . . . 1,654,881.94August 2031 . . . . . . . 1,619,668.52September 2031 . . . . 1,585,045.30October 2031 . . . . . . 1,551,003.31November 2031 . . . . . 1,517,533.67December 2031 . . . . . 1,484,627.67January 2032 . . . . . . 1,452,276.69February 2032 . . . . . 1,420,472.27March 2032 . . . . . . . 1,389,206.05April 2032 . . . . . . . . 1,358,469.80May 2032 . . . . . . . . . 1,328,255.39
DistributionDate
PlannedBalance
June 2032 . . . . . . . . $ 1,298,554.85July 2032 . . . . . . . . . 1,269,360.29August 2032 . . . . . . . 1,240,663.94September 2032 . . . . 1,212,458.15October 2032 . . . . . . 1,184,735.40November 2032 . . . . . 1,157,488.23December 2032 . . . . . 1,130,709.34January 2033 . . . . . . 1,104,391.51February 2033 . . . . . 1,078,527.63March 2033 . . . . . . . 1,053,110.70April 2033 . . . . . . . . 1,028,133.81May 2033 . . . . . . . . . 1,003,590.15June 2033 . . . . . . . . 979,473.04July 2033 . . . . . . . . . 955,775.85August 2033 . . . . . . . 932,492.09September 2033 . . . . 909,615.34October 2033 . . . . . . 887,139.28November 2033 . . . . . 865,057.69December 2033 . . . . . 843,364.43January 2034 . . . . . . 822,053.46February 2034 . . . . . 801,118.81March 2034 . . . . . . . 780,554.63April 2034 . . . . . . . . 760,355.12May 2034 . . . . . . . . . 740,514.59June 2034 . . . . . . . . 721,027.43July 2034 . . . . . . . . . 701,888.10August 2034 . . . . . . . 683,091.16September 2034 . . . . 664,631.23October 2034 . . . . . . 646,503.03November 2034 . . . . . 628,701.34December 2034 . . . . . 611,221.03January 2035 . . . . . . 594,057.03February 2035 . . . . . 577,204.36March 2035 . . . . . . . 560,658.11April 2035 . . . . . . . . 544,413.44May 2035 . . . . . . . . . 528,465.58June 2035 . . . . . . . . 512,809.84July 2035 . . . . . . . . . 497,441.59August 2035 . . . . . . . 482,356.27September 2035 . . . . 467,549.38October 2035 . . . . . . 453,016.51November 2035 . . . . . 438,753.29December 2035 . . . . . 424,755.43January 2036 . . . . . . 411,018.69February 2036 . . . . . 397,538.92March 2036 . . . . . . . 384,312.00April 2036 . . . . . . . . 371,333.90May 2036 . . . . . . . . . 358,600.61June 2036 . . . . . . . . 346,108.23July 2036 . . . . . . . . . 333,852.88August 2036 . . . . . . . 321,830.76September 2036 . . . . 310,038.10October 2036 . . . . . . 298,471.22November 2036 . . . . . 287,126.48December 2036 . . . . . 276,000.28
B-2
Aggregate Group (Continued)

DistributionDate
PlannedBalance
January 2037 . . . . . . $ 265,089.10February 2037 . . . . . 254,389.45March 2037 . . . . . . . 243,897.91April 2037 . . . . . . . . 233,611.09May 2037 . . . . . . . . . 223,525.68June 2037 . . . . . . . . 213,638.40July 2037 . . . . . . . . . 203,946.02August 2037 . . . . . . . 194,445.35September 2037 . . . . 185,133.28October 2037 . . . . . . 176,006.72November 2037 . . . . . 167,062.62December 2037 . . . . . 158,298.00
DistributionDate
PlannedBalance
January 2038 . . . . . . $ 149,709.91February 2038 . . . . . 141,295.45March 2038 . . . . . . . 133,051.77April 2038 . . . . . . . . 124,976.03May 2038 . . . . . . . . . 117,065.48June 2038 . . . . . . . . 109,317.39July 2038 . . . . . . . . . 101,729.05August 2038 . . . . . . . 94,297.83September 2038 . . . . 87,021.11October 2038 . . . . . . 79,896.33November 2038 . . . . . 72,920.96December 2038 . . . . . 66,092.50
DistributionDate
PlannedBalance
January 2039 . . . . . . $ 59,408.50February 2039 . . . . . 52,866.55March 2039 . . . . . . . 46,464.26April 2039 . . . . . . . . 40,199.29May 2039 . . . . . . . . . 34,069.33June 2039 . . . . . . . . 28,072.12July 2039 . . . . . . . . . 22,205.40August 2039 . . . . . . . 16,466.99September 2039 . . . . 10,854.70October 2039 . . . . . . 5,366.41November 2039 and
thereafter . . . . . . . 0.00
P Class Planned BalancesDistribution
DatePlannedBalance
Initial Balance . . . . $126,344,000.00May 2010 . . . . . . . . 125,857,902.21June 2010. . . . . . . . 125,341,672.61July 2010 . . . . . . . . 124,796,062.41August 2010 . . . . . . 124,221,287.53September 2010 . . . 123,617,579.07October 2010. . . . . . 122,985,183.13November 2010 . . . . 122,324,360.66December 2010 . . . . 121,635,387.30January 2011 . . . . . 120,918,553.20February 2011. . . . . 120,174,162.81March 2011 . . . . . . 119,402,534.70April 2011 . . . . . . . 118,604,001.29May 2011 . . . . . . . . 117,778,908.68June 2011. . . . . . . . 116,927,616.35July 2011 . . . . . . . . 116,050,496.94August 2011 . . . . . . 115,147,935.96September 2011 . . . 114,220,331.52October 2011. . . . . . 113,268,094.05November 2011 . . . . 112,291,645.97December 2011 . . . . 111,291,421.41January 2012 . . . . . 110,267,865.86February 2012. . . . . 109,221,435.88March 2012 . . . . . . 108,180,611.14April 2012 . . . . . . . 107,145,362.60May 2012 . . . . . . . . 106,115,661.36June 2012. . . . . . . . 105,091,478.65July 2012 . . . . . . . . 104,072,785.89August 2012 . . . . . . 103,059,554.61September 2012 . . . 102,051,756.50October 2012. . . . . . 101,049,363.39November 2012 . . . . 100,052,347.27December 2012 . . . . 99,060,680.27January 2013 . . . . . 98,074,334.65February 2013. . . . . 97,093,282.81March 2013 . . . . . . 96,117,497.33April 2013 . . . . . . . 95,146,950.88May 2013 . . . . . . . . 94,181,616.31
DistributionDate
PlannedBalance
June 2013. . . . . . . . $ 93,221,466.59July 2013 . . . . . . . . 92,266,474.84August 2013 . . . . . . 91,316,614.30September 2013 . . . 90,371,858.38October 2013. . . . . . 89,432,180.59November 2013 . . . . 88,497,554.61December 2013 . . . . 87,567,954.23January 2014 . . . . . 86,643,353.38February 2014. . . . . 85,723,726.14March 2014 . . . . . . 84,809,046.71April 2014 . . . . . . . 83,899,289.43May 2014 . . . . . . . . 82,994,428.76June 2014. . . . . . . . 82,094,439.30July 2014 . . . . . . . . 81,199,295.78August 2014 . . . . . . 80,308,973.06September 2014 . . . 79,423,446.14October 2014. . . . . . 78,542,690.13November 2014 . . . . 77,666,680.28December 2014 . . . . 76,795,391.96January 2015 . . . . . 75,928,800.67February 2015. . . . . 75,066,882.05March 2015 . . . . . . 74,209,611.84April 2015 . . . . . . . 73,356,965.93May 2015 . . . . . . . . 72,508,920.31June 2015. . . . . . . . 71,665,451.11July 2015 . . . . . . . . 70,826,534.58August 2015 . . . . . . 69,992,147.10September 2015 . . . 69,162,265.15October 2015. . . . . . 68,336,865.35November 2015 . . . . 67,515,924.43December 2015 . . . . 66,699,419.25January 2016 . . . . . 65,887,326.78February 2016. . . . . 65,079,624.12March 2016 . . . . . . 64,276,288.47April 2016 . . . . . . . 63,477,297.17May 2016 . . . . . . . . 62,682,627.65June 2016. . . . . . . . 61,892,257.48July 2016 . . . . . . . . 61,106,164.34
DistributionDate
PlannedBalance
August 2016 . . . . . . $ 60,324,326.01September 2016 . . . 59,546,720.40October 2016. . . . . . 58,773,325.54November 2016 . . . . 58,004,119.55December 2016 . . . . 57,239,080.69January 2017 . . . . . 56,478,187.30February 2017. . . . . 55,721,417.86March 2017 . . . . . . 54,968,750.95April 2017 . . . . . . . 54,220,165.26May 2017 . . . . . . . . 53,475,639.59June 2017. . . . . . . . 52,735,152.84July 2017 . . . . . . . . 51,998,684.05August 2017 . . . . . . 51,266,212.33September 2017 . . . 50,537,716.92October 2017. . . . . . 49,813,177.15November 2017 . . . . 49,092,572.49December 2017 . . . . 48,375,882.47January 2018 . . . . . 47,663,086.76February 2018. . . . . 46,954,165.13March 2018 . . . . . . 46,249,097.43April 2018 . . . . . . . 45,547,863.65May 2018 . . . . . . . . 44,850,443.86June 2018. . . . . . . . 44,156,818.23July 2018 . . . . . . . . 43,466,967.04August 2018 . . . . . . 42,786,359.70September 2018 . . . 42,115,803.62October 2018. . . . . . 41,455,155.21November 2018 . . . . 40,804,272.91December 2018 . . . . 40,163,017.13January 2019 . . . . . 39,531,250.25February 2019. . . . . 38,908,836.56March 2019 . . . . . . 38,295,642.25April 2019 . . . . . . . 37,691,535.41May 2019 . . . . . . . . 37,096,385.94June 2019. . . . . . . . 36,510,065.60July 2019 . . . . . . . . 35,932,447.92August 2019 . . . . . . 35,363,408.22September 2019 . . . 34,802,823.56
B-3
Aggregate Group (Continued)

DistributionDate
PlannedBalance
October 2019. . . . . . $ 34,250,572.73November 2019 . . . . 33,706,536.21December 2019 . . . . 33,170,596.18January 2020 . . . . . 32,642,636.44February 2020. . . . . 32,122,542.45March 2020 . . . . . . 31,610,201.26April 2020 . . . . . . . 31,105,501.52May 2020 . . . . . . . . 30,608,333.42June 2020. . . . . . . . 30,118,588.74July 2020 . . . . . . . . 29,636,160.72August 2020 . . . . . . 29,160,944.14September 2020 . . . 28,692,835.25October 2020. . . . . . 28,231,731.77November 2020 . . . . 27,777,532.82December 2020 . . . . 27,330,138.99January 2021 . . . . . 26,889,452.23February 2021. . . . . 26,455,375.88March 2021 . . . . . . 26,027,814.65April 2021 . . . . . . . 25,606,674.59May 2021 . . . . . . . . 25,191,863.05June 2021. . . . . . . . 24,783,288.72July 2021 . . . . . . . . 24,380,861.56August 2021 . . . . . . 23,984,492.78September 2021 . . . 23,594,094.86October 2021. . . . . . 23,209,581.53November 2021 . . . . 22,830,867.70December 2021 . . . . 22,457,869.51January 2022 . . . . . 22,090,504.26February 2022. . . . . 21,728,690.43March 2022 . . . . . . 21,372,347.66April 2022 . . . . . . . 21,021,396.70May 2022 . . . . . . . . 20,675,759.43June 2022. . . . . . . . 20,335,358.84July 2022 . . . . . . . . 20,000,118.99August 2022 . . . . . . 19,669,965.04September 2022 . . . 19,344,823.18October 2022. . . . . . 19,024,620.66November 2022 . . . . 18,709,285.76December 2022 . . . . 18,398,747.75January 2023 . . . . . 18,092,936.93February 2023. . . . . 17,791,784.57March 2023 . . . . . . 17,495,222.92April 2023 . . . . . . . 17,203,185.18May 2023 . . . . . . . . 16,915,605.51June 2023. . . . . . . . 16,632,418.98July 2023 . . . . . . . . 16,353,561.60August 2023 . . . . . . 16,078,970.28September 2023 . . . 15,808,582.82October 2023. . . . . . 15,542,337.91November 2023 . . . . 15,280,175.10December 2023 . . . . 15,022,034.81January 2024 . . . . . 14,767,858.29February 2024. . . . . 14,517,587.62March 2024 . . . . . . 14,271,165.74April 2024 . . . . . . . 14,028,536.34
DistributionDate
PlannedBalance
May 2024 . . . . . . . . $ 13,789,643.97June 2024. . . . . . . . 13,554,433.92July 2024 . . . . . . . . 13,322,852.28August 2024 . . . . . . 13,094,845.91September 2024 . . . 12,870,362.42October 2024. . . . . . 12,649,350.16November 2024 . . . . 12,431,758.21December 2024 . . . . 12,217,536.39January 2025 . . . . . 12,006,635.22February 2025. . . . . 11,799,005.94March 2025 . . . . . . 11,594,600.46April 2025 . . . . . . . 11,393,371.41May 2025 . . . . . . . . 11,195,272.05June 2025. . . . . . . . 11,000,256.36July 2025 . . . . . . . . 10,808,278.92August 2025 . . . . . . 10,619,294.99September 2025 . . . 10,433,260.47October 2025. . . . . . 10,250,131.87November 2025 . . . . 10,069,866.34December 2025 . . . . 9,892,421.63January 2026 . . . . . 9,717,756.09February 2026. . . . . 9,545,828.69March 2026 . . . . . . 9,376,598.95April 2026 . . . . . . . 9,210,026.99May 2026 . . . . . . . . 9,046,073.49June 2026. . . . . . . . 8,884,699.71July 2026 . . . . . . . . 8,725,867.44August 2026 . . . . . . 8,569,539.04September 2026 . . . 8,415,677.40October 2026. . . . . . 8,264,245.92November 2026 . . . . 8,115,208.55December 2026 . . . . 7,968,529.76January 2027 . . . . . 7,824,174.51February 2027. . . . . 7,682,108.27March 2027 . . . . . . 7,542,297.01April 2027 . . . . . . . 7,404,707.18May 2027 . . . . . . . . 7,269,305.71June 2027. . . . . . . . 7,136,060.02July 2027 . . . . . . . . 7,004,937.97August 2027 . . . . . . 6,875,907.92September 2027 . . . 6,748,938.65October 2027. . . . . . 6,623,999.41November 2027 . . . . 6,501,059.88December 2027 . . . . 6,380,090.18January 2028 . . . . . 6,261,060.85February 2028. . . . . 6,143,942.88March 2028 . . . . . . 6,028,707.65April 2028 . . . . . . . 5,915,326.97May 2028 . . . . . . . . 5,803,773.04June 2028. . . . . . . . 5,694,018.48July 2028 . . . . . . . . 5,586,036.28August 2028 . . . . . . 5,479,799.85September 2028 . . . 5,375,282.96October 2028. . . . . . 5,272,459.77November 2028 . . . . 5,171,304.80
DistributionDate
PlannedBalance
December 2028 . . . . $ 5,071,792.95January 2029 . . . . . 4,973,899.48February 2029. . . . . 4,877,600.01March 2029 . . . . . . 4,782,870.50April 2029 . . . . . . . 4,689,687.27May 2029 . . . . . . . . 4,598,026.99June 2029. . . . . . . . 4,507,866.64July 2029 . . . . . . . . 4,419,183.55August 2029 . . . . . . 4,331,955.39September 2029 . . . 4,246,160.14October 2029. . . . . . 4,161,776.09November 2029 . . . . 4,078,781.86December 2029 . . . . 3,997,156.37January 2030 . . . . . 3,916,878.87February 2030. . . . . 3,837,928.87March 2030 . . . . . . 3,760,286.21April 2030 . . . . . . . 3,683,931.01May 2030 . . . . . . . . 3,608,843.68June 2030. . . . . . . . 3,535,004.91July 2030 . . . . . . . . 3,462,395.69August 2030 . . . . . . 3,390,997.27September 2030 . . . 3,320,791.17October 2030. . . . . . 3,251,759.19November 2030 . . . . 3,183,883.38December 2030 . . . . 3,117,146.08January 2031 . . . . . 3,051,529.85February 2031. . . . . 2,987,017.53March 2031 . . . . . . 2,923,592.21April 2031 . . . . . . . 2,861,237.21May 2031 . . . . . . . . 2,799,936.11June 2031. . . . . . . . 2,739,672.73July 2031 . . . . . . . . 2,680,431.10August 2031 . . . . . . 2,622,195.53September 2031 . . . 2,564,950.51October 2031. . . . . . 2,508,680.79November 2031 . . . . 2,453,371.33December 2031 . . . . 2,399,007.32January 2032 . . . . . 2,345,574.15February 2032. . . . . 2,293,057.45March 2032 . . . . . . 2,241,443.02April 2032 . . . . . . . 2,190,716.92May 2032 . . . . . . . . 2,140,865.38June 2032. . . . . . . . 2,091,874.83July 2032 . . . . . . . . 2,043,731.91August 2032 . . . . . . 1,996,423.47September 2032 . . . 1,949,936.53October 2032. . . . . . 1,904,258.31November 2032 . . . . 1,859,376.22December 2032 . . . . 1,815,277.85January 2033 . . . . . 1,771,950.98February 2033. . . . . 1,729,383.56March 2033 . . . . . . 1,687,563.74April 2033 . . . . . . . 1,646,479.81May 2033 . . . . . . . . 1,606,120.26June 2033. . . . . . . . 1,566,473.75
B-4
P Class (Continued)

DistributionDate
PlannedBalance
July 2033 . . . . . . . . $ 1,527,529.08August 2033 . . . . . . 1,489,275.25September 2033 . . . 1,451,701.40October 2033. . . . . . 1,414,796.84November 2033 . . . . 1,378,551.04December 2033 . . . . 1,342,953.62January 2034 . . . . . 1,307,994.35February 2034. . . . . 1,273,663.16March 2034 . . . . . . 1,239,950.13April 2034 . . . . . . . 1,206,845.49May 2034 . . . . . . . . 1,174,339.60June 2034. . . . . . . . 1,142,422.97July 2034 . . . . . . . . 1,111,086.26August 2034 . . . . . . 1,080,320.26September 2034 . . . 1,050,115.90October 2034. . . . . . 1,020,464.24November 2034 . . . . 991,356.49December 2034 . . . . 962,783.97January 2035 . . . . . 934,738.13February 2035. . . . . 907,210.57March 2035 . . . . . . 880,193.00April 2035 . . . . . . . 853,677.24May 2035 . . . . . . . . 827,655.26June 2035. . . . . . . . 802,119.14July 2035 . . . . . . . . 777,061.06
DistributionDate
PlannedBalance
August 2035 . . . . . . $ 752,473.35September 2035 . . . 728,348.42October 2035. . . . . . 704,678.83November 2035 . . . . 681,457.22December 2035 . . . . 658,676.36January 2036 . . . . . 636,329.12February 2036. . . . . 614,408.48March 2036 . . . . . . 592,907.52April 2036 . . . . . . . 571,819.43May 2036 . . . . . . . . 551,137.50June 2036. . . . . . . . 530,855.13July 2036 . . . . . . . . 510,965.80August 2036 . . . . . . 491,463.11September 2036 . . . 472,340.74October 2036. . . . . . 453,592.48November 2036 . . . . 435,212.20December 2036 . . . . 417,193.86January 2037 . . . . . 399,531.54February 2037. . . . . 382,219.37March 2037 . . . . . . 365,251.60April 2037 . . . . . . . 348,622.55May 2037 . . . . . . . . 332,326.63June 2037. . . . . . . . 316,358.35July 2037 . . . . . . . . 300,712.27August 2037 . . . . . . 285,383.07
DistributionDate
PlannedBalance
September 2037 . . . $ 270,365.48October 2037. . . . . . 255,654.33November 2037 . . . . 241,244.52December 2037 . . . . 227,131.04January 2038 . . . . . 213,308.93February 2038. . . . . 199,773.33March 2038 . . . . . . 186,519.45April 2038 . . . . . . . 173,542.56May 2038 . . . . . . . . 160,838.02June 2038. . . . . . . . 148,401.26July 2038 . . . . . . . . 136,227.75August 2038 . . . . . . 124,313.07September 2038 . . . 112,652.85October 2038. . . . . . 101,242.79November 2038 . . . . 90,078.64December 2038 . . . . 79,156.23January 2039 . . . . . 68,471.46February 2039. . . . . 58,020.29March 2039 . . . . . . 47,798.73April 2039 . . . . . . . 37,802.86May 2039 . . . . . . . . 28,028.83June 2039. . . . . . . . 18,472.82July 2039 . . . . . . . . 9,131.11August 2039 and
thereafter . . . . . . 0.00
CB Class Planned BalancesDistribution
DatePlannedBalance
Initial Balance . . . . . $10,583,000.00May 2010 . . . . . . . . . 10,524,071.02June 2010 . . . . . . . . 10,458,656.68July 2010 . . . . . . . . . 10,386,987.56August 2010 . . . . . . . 10,309,140.19September 2010 . . . . 10,225,198.26October 2010 . . . . . . 10,135,252.62November 2010 . . . . . 10,039,401.12December 2010 . . . . . 9,937,748.54January 2011 . . . . . . 9,830,406.43February 2011 . . . . . 9,717,493.01March 2011 . . . . . . . 9,599,133.03April 2011 . . . . . . . . 9,475,457.60May 2011 . . . . . . . . . 9,346,604.05June 2011 . . . . . . . . 9,212,715.77July 2011 . . . . . . . . . 9,073,941.98August 2011 . . . . . . . 8,930,437.63September 2011 . . . . 8,782,363.11October 2011 . . . . . . 8,629,884.13November 2011 . . . . . 8,473,171.44December 2011 . . . . . 8,312,400.66January 2012 . . . . . . 8,147,752.04February 2012 . . . . . 7,979,410.17March 2012 . . . . . . . 7,813,613.04April 2012 . . . . . . . . 7,650,337.16
DistributionDate
PlannedBalance
May 2012 . . . . . . . . . $ 7,489,559.26June 2012 . . . . . . . . 7,331,256.29July 2012 . . . . . . . . . 7,175,405.29August 2012 . . . . . . . 7,021,983.57September 2012 . . . . 6,870,968.56October 2012 . . . . . . 6,722,337.91November 2012 . . . . . 6,576,069.42December 2012 . . . . . 6,432,141.05January 2013 . . . . . . 6,290,530.97February 2013 . . . . . 6,151,217.52March 2013 . . . . . . . 6,014,179.18April 2013 . . . . . . . . 5,879,394.62May 2013 . . . . . . . . . 5,746,842.68June 2013 . . . . . . . . 5,616,502.37July 2013 . . . . . . . . . 5,488,352.85August 2013 . . . . . . . 5,362,373.46September 2013 . . . . 5,238,543.70October 2013 . . . . . . 5,116,843.23November 2013 . . . . . 4,997,251.86December 2013 . . . . . 4,879,749.60January 2014 . . . . . . 4,764,316.59February 2014 . . . . . 4,650,933.10March 2014 . . . . . . . 4,539,579.62April 2014 . . . . . . . . 4,430,236.74May 2014 . . . . . . . . . 4,322,885.24
DistributionDate
PlannedBalance
June 2014 . . . . . . . . $ 4,217,506.04July 2014 . . . . . . . . . 4,114,080.21August 2014 . . . . . . . 4,012,588.97September 2014 . . . . 3,913,013.70October 2014 . . . . . . 3,815,335.91November 2014 . . . . . 3,719,537.29December 2014 . . . . . 3,625,599.64January 2015 . . . . . . 3,533,504.93February 2015 . . . . . 3,443,235.27March 2015 . . . . . . . 3,354,772.90April 2015 . . . . . . . . 3,268,100.21May 2015 . . . . . . . . . 3,183,199.75June 2015 . . . . . . . . 3,100,054.19July 2015 . . . . . . . . . 3,018,646.34August 2015 . . . . . . . 2,938,959.14September 2015 . . . . 2,860,975.70October 2015 . . . . . . 2,784,679.23November 2015 . . . . . 2,710,053.11December 2015 . . . . . 2,637,080.81January 2016 . . . . . . 2,565,745.97February 2016 . . . . . 2,496,032.34March 2016 . . . . . . . 2,427,923.83April 2016 . . . . . . . . 2,361,404.44May 2016 . . . . . . . . . 2,296,458.34June 2016 . . . . . . . . 2,233,069.80
B-5
P Class (Continued)

DistributionDate
PlannedBalance
July 2016 . . . . . . . . . $ 2,171,223.22August 2016 . . . . . . . 2,110,903.15September 2016 . . . . 2,052,094.24October 2016 . . . . . . 1,994,781.26November 2016 . . . . . 1,938,949.14December 2016 . . . . . 1,884,582.88January 2017 . . . . . . 1,831,667.66February 2017 . . . . . 1,780,188.74March 2017 . . . . . . . 1,730,131.51April 2017 . . . . . . . . 1,681,481.48May 2017 . . . . . . . . . 1,634,224.28June 2017 . . . . . . . . 1,588,345.68July 2017 . . . . . . . . . 1,543,831.50August 2017 . . . . . . . 1,500,667.75September 2017 . . . . 1,458,840.52October 2017 . . . . . . 1,418,336.01November 2017 . . . . . 1,379,140.54December 2017 . . . . . 1,341,240.56January 2018 . . . . . . 1,304,622.59February 2018 . . . . . 1,269,273.30March 2018 . . . . . . . 1,236,523.32April 2018 . . . . . . . . 1,210,583.76May 2018 . . . . . . . . . 1,191,326.00June 2018 . . . . . . . . 1,178,623.36July 2018 . . . . . . . . . 1,172,351.04August 2018 . . . . . . . 1,166,897.10September 2018 . . . . 1,161,313.55October 2018 . . . . . . 1,155,605.31November 2018 . . . . . 1,149,777.19December 2018 . . . . . 1,143,833.88January 2019 . . . . . . 1,137,779.96February 2019 . . . . . 1,131,619.93March 2019 . . . . . . . 1,125,358.16April 2019 . . . . . . . . 1,118,998.93May 2019 . . . . . . . . . 1,112,546.43June 2019 . . . . . . . . 1,106,004.72July 2019 . . . . . . . . . 1,099,377.81August 2019 . . . . . . . 1,092,669.57September 2019 . . . . 1,085,883.83October 2019 . . . . . . 1,079,024.28November 2019 . . . . . 1,072,094.55December 2019 . . . . . 1,065,098.16January 2020 . . . . . . 1,058,038.59February 2020 . . . . . 1,050,919.19March 2020 . . . . . . . 1,043,743.25April 2020 . . . . . . . . 1,036,513.98May 2020 . . . . . . . . . 1,029,234.51June 2020 . . . . . . . . 1,021,907.87July 2020 . . . . . . . . . 1,014,537.06August 2020 . . . . . . . 1,007,124.98September 2020 . . . . 999,674.45October 2020 . . . . . . 992,188.21November 2020 . . . . . 984,668.99December 2020 . . . . . 977,119.38January 2021 . . . . . . 969,541.94
DistributionDate
PlannedBalance
February 2021 . . . . . $ 961,939.17March 2021 . . . . . . . 954,313.48April 2021 . . . . . . . . 946,667.23May 2021 . . . . . . . . . 939,002.73June 2021 . . . . . . . . 931,322.21July 2021 . . . . . . . . . 923,627.84August 2021 . . . . . . . 915,921.76September 2021 . . . . 908,206.04October 2021 . . . . . . 900,482.66November 2021 . . . . . 892,753.59December 2021 . . . . . 885,020.74January 2022 . . . . . . 877,285.94February 2022 . . . . . 869,551.01March 2022 . . . . . . . 861,817.66April 2022 . . . . . . . . 854,087.63May 2022 . . . . . . . . . 846,362.54June 2022 . . . . . . . . 838,644.01July 2022 . . . . . . . . . 830,933.59August 2022 . . . . . . . 823,232.78September 2022 . . . . 815,543.07October 2022 . . . . . . 807,865.87November 2022 . . . . . 800,202.55December 2022 . . . . . 792,554.47January 2023 . . . . . . 784,922.92February 2023 . . . . . 777,309.16March 2023 . . . . . . . 769,714.41April 2023 . . . . . . . . 762,139.85May 2023 . . . . . . . . . 754,586.62June 2023 . . . . . . . . 747,055.84July 2023 . . . . . . . . . 739,548.58August 2023 . . . . . . . 732,065.88September 2023 . . . . 724,608.73October 2023 . . . . . . 717,178.11November 2023 . . . . . 709,774.96December 2023 . . . . . 702,400.17January 2024 . . . . . . 695,054.62February 2024 . . . . . 687,739.18March 2024 . . . . . . . 680,454.61April 2024 . . . . . . . . 673,201.75May 2024 . . . . . . . . . 665,981.32June 2024 . . . . . . . . 658,794.06July 2024 . . . . . . . . . 651,640.68August 2024 . . . . . . . 644,521.83September 2024 . . . . 637,438.16October 2024 . . . . . . 630,390.31November 2024 . . . . . 623,378.87December 2024 . . . . . 616,404.40January 2025 . . . . . . 609,467.47February 2025 . . . . . 602,568.59March 2025 . . . . . . . 595,708.27April 2025 . . . . . . . . 588,886.98May 2025 . . . . . . . . . 582,105.19June 2025 . . . . . . . . 575,363.32July 2025 . . . . . . . . . 568,661.80August 2025 . . . . . . . 562,001.04
DistributionDate
PlannedBalance
September 2025 . . . . $ 555,381.39October 2025 . . . . . . 548,803.22November 2025 . . . . . 542,266.87December 2025 . . . . . 535,772.66January 2026 . . . . . . 529,320.90February 2026 . . . . . 522,911.85March 2026 . . . . . . . 516,545.79April 2026 . . . . . . . . 510,222.98May 2026 . . . . . . . . . 503,943.66June 2026 . . . . . . . . 497,708.03July 2026 . . . . . . . . . 491,516.30August 2026 . . . . . . . 485,368.67September 2026 . . . . 479,265.28October 2026 . . . . . . 473,206.34November 2026 . . . . . 467,191.96December 2026 . . . . . 461,222.29January 2027 . . . . . . 455,297.43February 2027 . . . . . 449,417.50March 2027 . . . . . . . 443,582.59April 2027 . . . . . . . . 437,792.78May 2027 . . . . . . . . . 432,048.15June 2027 . . . . . . . . 426,348.74July 2027 . . . . . . . . . 420,694.62August 2027 . . . . . . . 415,085.79September 2027 . . . . 409,522.31October 2027 . . . . . . 404,004.18November 2027 . . . . . 398,531.39December 2027 . . . . . 393,103.96January 2028 . . . . . . 387,721.87February 2028 . . . . . 382,385.07March 2028 . . . . . . . 377,093.56April 2028 . . . . . . . . 371,847.28May 2028 . . . . . . . . . 366,646.18June 2028 . . . . . . . . 361,490.21July 2028 . . . . . . . . . 356,379.30August 2028 . . . . . . . 351,313.36September 2028 . . . . 346,292.33October 2028 . . . . . . 341,316.10November 2028 . . . . . 336,384.58December 2028 . . . . . 331,497.68January 2029 . . . . . . 326,655.28February 2029 . . . . . 321,857.25March 2029 . . . . . . . 317,103.49April 2029 . . . . . . . . 312,393.85May 2029 . . . . . . . . . 307,728.20June 2029 . . . . . . . . 303,106.41July 2029 . . . . . . . . . 298,528.33August 2029 . . . . . . . 293,993.80September 2029 . . . . 289,502.66October 2029 . . . . . . 285,054.77November 2029 . . . . . 280,649.94December 2029 . . . . . 276,288.02January 2030 . . . . . . 271,968.80February 2030 . . . . . 267,692.13March 2030 . . . . . . . 263,457.82
B-6
CB Class (Continued)

DistributionDate
PlannedBalance
April 2030 . . . . . . . . $ 259,265.68May 2030 . . . . . . . . . 255,115.52June 2030 . . . . . . . . 251,007.14July 2030 . . . . . . . . . 246,940.34August 2030 . . . . . . . 242,914.91September 2030 . . . . 238,930.66October 2030 . . . . . . 234,987.37November 2030 . . . . . 231,084.84December 2030 . . . . . 227,222.83January 2031 . . . . . . 223,401.15February 2031 . . . . . 219,619.56March 2031 . . . . . . . 215,877.85April 2031 . . . . . . . . 212,175.78May 2031 . . . . . . . . . 208,513.13June 2031 . . . . . . . . 204,889.67July 2031 . . . . . . . . . 201,305.17August 2031 . . . . . . . 197,759.39September 2031 . . . . 194,252.10October 2031 . . . . . . 190,783.05November 2031 . . . . . 187,352.02December 2031 . . . . . 183,958.75January 2032 . . . . . . 180,603.01February 2032 . . . . . 177,284.54March 2032 . . . . . . . 174,003.12April 2032 . . . . . . . . 170,758.48May 2032 . . . . . . . . . 167,550.38June 2032 . . . . . . . . 164,378.57July 2032 . . . . . . . . . 161,242.82August 2032 . . . . . . . 158,142.84September 2032 . . . . 155,078.41October 2032 . . . . . . 152,049.26November 2032 . . . . . 149,055.15December 2032 . . . . . 146,095.82January 2033 . . . . . . 143,171.02February 2033 . . . . . 140,280.50March 2033 . . . . . . . 137,423.97April 2033 . . . . . . . . 134,601.22May 2033 . . . . . . . . . 131,811.98
DistributionDate
PlannedBalance
June 2033 . . . . . . . . $ 129,055.97July 2033 . . . . . . . . . 126,332.97August 2033 . . . . . . . 123,642.71September 2033 . . . . 120,984.92October 2033 . . . . . . 118,359.36November 2033 . . . . . 115,765.77December 2033 . . . . . 113,203.89January 2034 . . . . . . 110,673.46February 2034 . . . . . 108,174.25March 2034 . . . . . . . 105,705.97April 2034 . . . . . . . . 103,268.38May 2034 . . . . . . . . . 100,861.23June 2034 . . . . . . . . 98,484.27July 2034 . . . . . . . . . 96,137.23August 2034 . . . . . . . 93,819.87September 2034 . . . . 91,531.92October 2034 . . . . . . 89,273.15November 2034 . . . . . 87,043.29December 2034 . . . . . 84,842.09January 2035 . . . . . . 82,669.32February 2035 . . . . . 80,524.71March 2035 . . . . . . . 78,408.01April 2035 . . . . . . . . 76,318.98May 2035 . . . . . . . . . 74,257.37June 2035 . . . . . . . . 72,222.93July 2035 . . . . . . . . . 70,215.43August 2035 . . . . . . . 68,234.59September 2035 . . . . 66,280.21October 2035 . . . . . . 64,352.01November 2035 . . . . . 62,449.77December 2035 . . . . . 60,573.24January 2036 . . . . . . 58,722.18February 2036 . . . . . 56,896.34March 2036 . . . . . . . 55,095.50April 2036 . . . . . . . . 53,319.42May 2036 . . . . . . . . . 51,567.86June 2036 . . . . . . . . 49,840.58July 2036 . . . . . . . . . 48,137.36
DistributionDate
PlannedBalance
August 2036 . . . . . . . $ 46,457.94September 2036 . . . . 44,802.12October 2036 . . . . . . 43,169.65November 2036 . . . . . 41,560.31December 2036 . . . . . 39,973.87January 2037 . . . . . . 38,410.09February 2037 . . . . . 36,868.76March 2037 . . . . . . . 35,349.66April 2037 . . . . . . . . 33,852.55May 2037 . . . . . . . . . 32,377.22June 2037 . . . . . . . . 30,923.44July 2037 . . . . . . . . . 29,491.00August 2037 . . . . . . . 28,079.67September 2037 . . . . 26,689.25October 2037 . . . . . . 25,319.52November 2037 . . . . . 23,970.25December 2037 . . . . . 22,641.24January 2038 . . . . . . 21,332.29February 2038 . . . . . 20,043.17March 2038 . . . . . . . 18,773.67April 2038 . . . . . . . . 17,523.61May 2038 . . . . . . . . . 16,292.76June 2038 . . . . . . . . 15,080.91July 2038 . . . . . . . . . 13,887.88August 2038 . . . . . . . 12,713.45September 2038 . . . . 11,557.43October 2038 . . . . . . 10,419.60November 2038 . . . . . 9,299.80December 2038 . . . . . 8,197.81January 2039 . . . . . . 7,113.43February 2039 . . . . . 6,046.47March 2039 . . . . . . . 4,996.75April 2039 . . . . . . . . 3,964.07May 2039 . . . . . . . . . 2,948.24June 2039 . . . . . . . . 1,949.08July 2039 . . . . . . . . . 966.39August 2039 and
thereafter . . . . . . . 0.00
B-7
CB Class (Continued)

No one is authorized to give information
or to make representations in connection with
the Certificates other than the information
and representations contained in this Pro-
spectus Supplement and the additional Dis-
closure Documents. You must not rely on any
unauthorized information or representation.
This Prospectus Supplement and the addi-
tional Disclosure Documents do not consti-
tute an offer or solicitation with regard to
the Certificates if it is illegal to make such
an offer or solicitation to you under state
law. By delivering this Prospectus Supple-
ment and the additional Disclosure Docu-
ments at any time, no one implies that the
information contained herein or therein is cor-
rect after the date hereof or thereof.
The Securities and Exchange Commission
has not approved or disapproved the Certifi-
cates or determined if this Prospectus Supple-
ment is truthful and complete. Any
representation to the contrary is a criminal
offense.
TABLE OF CONTENTS
Page
Table of Contents . . . . . . . . . . . . . . . . . S- 2Available Information . . . . . . . . . . . . . . S- 3Recent Developments . . . . . . . . . . . . . . S- 4Summary . . . . . . . . . . . . . . . . . . . . . . . . S- 6Additional Risk Factors . . . . . . . . . . . . . S- 9Description of the Certificates. . . . . . . . S- 9Certain Additional Federal Income Tax
Consequences . . . . . . . . . . . . . . . . . . S-26Plan of Distribution . . . . . . . . . . . . . . . . S-28Legal Matters. . . . . . . . . . . . . . . . . . . . . S-28Schedule 1 . . . . . . . . . . . . . . . . . . . . . . . A- 1Principal Balance Schedules . . . . . . . . . B- 1
$833,741,000
Guaranteed REMIC
Pass-Through Certificates
Fannie Mae REMIC Trust 2010-50
PROSPECTUS SUPPLEMENT
Deutsche Bank Securities
April 26, 2010