Embed Size (px)
Citation preview

1
GUAM VISITORS BUREAU
Russia Visitor Tracker Exit Profile
FY2014 DATA AGGREGATION
Prepared by: QMark Research Information contained herein is the property of the Guam Visitors Bureau.
The use of this information, in part or in whole, shall require written permission from the Guam Visitors Bureau.
__________________________

2
___________________________
Background & Methodology
• All surveys were partially interviewer administered, as well as self-
administered. Upon completion of the surveys, QMark’s professional
Japanese speaking interviewers double-checked each questionnaire for
consistency and completeness, while the respondent is present.
• A total of 601 departing Russian visitors were randomly interviewed
and was coordinated with the Russian tour agents to be interviewed by
QMark interviewers before departing the island.
• The margin of error for a sample of 601 is +/- 4.00 percentage points
with a 95% confidence level. That is, if all Russian visitors who
traveled to Guam in the same time period were asked these questions,
we can be 95% certain that their responses would not differ by +/- 4.00
percentage points.

3
___________________________
OBJECTIVES
• To monitor the effectiveness of the Russian
seasonal campaigns in attracting Russian visitors,
refresh certain baseline data, to better understand the
nature, and economic value or impact of each of the
targeted segments in the Russian marketing plan.
• Identify significant determinants of visitor
satisfaction, expenditures and the desire to return to
Guam.
4
___________________________
SECTION 1
PROFILE OF RESPONDENTS
5
___________________________
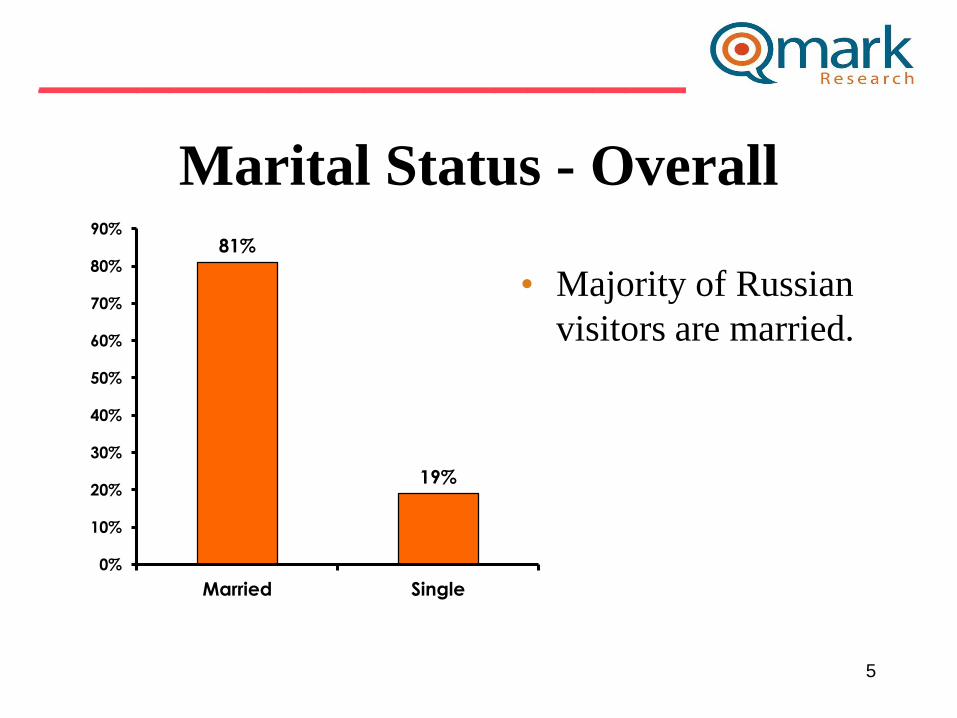
Marital Status - Overall
81%
19%
0%
10%
20%
30%
40%
50%
60%
70%
80%
90%
Married Single
• Majority of Russian
visitors are married.

6
___________________________
MARITAL STATUS
80% 81%
20% 19%
0%
25%
50%
75%
100%
FY2013 FY2014
Married Single

7
___________________________
Age - Overall
• The average age of the
respondents is 41.03
years of age.
5%
26%
45%
24%
0%
5%
10%
15%
20%
25%
30%
35%
40%
45%
50%
18-24 25-34 35-49 50+
8
___________________________
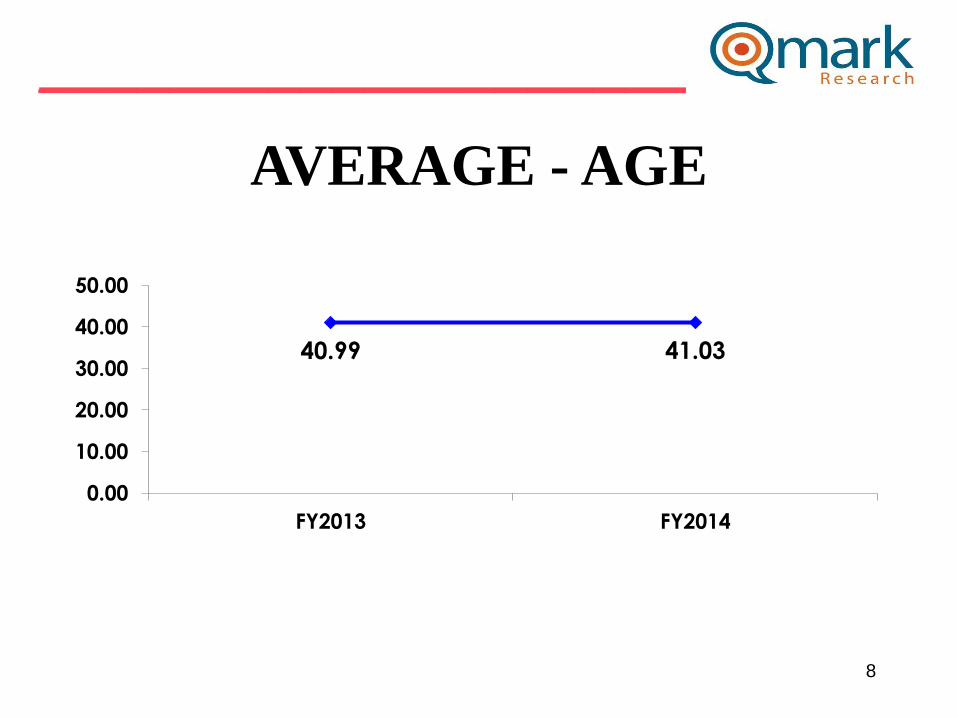
AVERAGE - AGE
40.99 41.03
0.00
10.00
20.00
30.00
40.00
50.00
FY2013 FY2014

9
___________________________
Personal Income
17%
39%
18%
10% 9% 5%
2%
0%
5%
10%
15%
20%
25%
30%
35%
40%
45%
RUBLE/$
QTR1-32.48
QTR2-35.34
QTR3-35.18
QTR4-35.20

10
___________________________
Personal Income FY2013 FY2014
<732,321 18% 17%
732,321-
1,098,481 40% 39%
1,098,482-
1,464,642 18% 18%
1,464,643-
1,830,803 9% 10%
1,830,804-
2,263,124 7% 9%
2,563,125-
3,661,606 4% 5%
3,661,607 4% 2%
Refused/ None 1% 1%

11
___________________________ Personal Income – 1st time vs.
repeat
18%
40%
17%
10% 9% 4% 2%
6%
33%
25%
8% 9% 14%
5%
0%
5%
10%
15%
20%
25%
30%
35%
40%
45%
<732,321 732,321 -
1,098,481
1,098,482 -
1,464,642
1,464,643 -
1,830,803
1,830,803 -
2,263,124
2,563,125 -
3,661,606
3,661,607+
1st Time Repeat

12
___________________________ Personal Income by Gender &
Age

13
___________________________
Travel Companions
72%
59%
28% 20% 19%
7% 7% 4% 1% 0% 0%
10%
20%
30%
40%
50%
60%
70%
80%

14
___________________________
Travel Companions FY2013 FY2014
Family 82% 72%
Spouse 74% 59%
Child 32% 28%
Alone 13% 20%
Friends 15% 19%
Sibling/
Ext family 9% 7%
Office 3% 7%
Parent 4% 4%
Older
parent 1% 1%
Other 0% 0%

15
___________________________
Number of Children Travel Party N=161 total respondents traveling with children.
(Of those N=161 respondents, there is a total of 199 children 18 years or younger)
11%
43% 43%
20%
0% 5%
10% 15% 20% 25% 30% 35% 40% 45% 50%
0-2 Years Old 3-6 Years 7-11 Years 12-18 Years

16
___________________________
Prior Trips to Guam
First trip
89%
Repeat
visitor
11%

17
___________________________
PRIOR TRIPS TO GUAM
83% 89%
18% 11%
0%
25%
50%
75%
100%
FY2013 FY2014
1st Time Repeat

18
___________________________
Trips to Guam by Age & Gender

19
___________________________
• The average repeat
visitor has been to
Guam 1.20 times.
• A majority of the
repeat visitors have
been to Guam
within the last
year.
Repeat Visitors Last Trip n = 65
78%
14% 8%
0%
10%
20%
30%
40%
50%
60%
70%
80%
90%
Within the
last year
1 to 2 years
ago
2+ years

20
___________________________
Average Number Overnight Trips (2009-2014) (2 nights or more)
0.84
0.94
1.05
1.18 1.27
1.01
0.00
0.20
0.40
0.60
0.80
1.00
1.20
1.40
2009 2010 2011 2012 2013 2014

21
___________________________
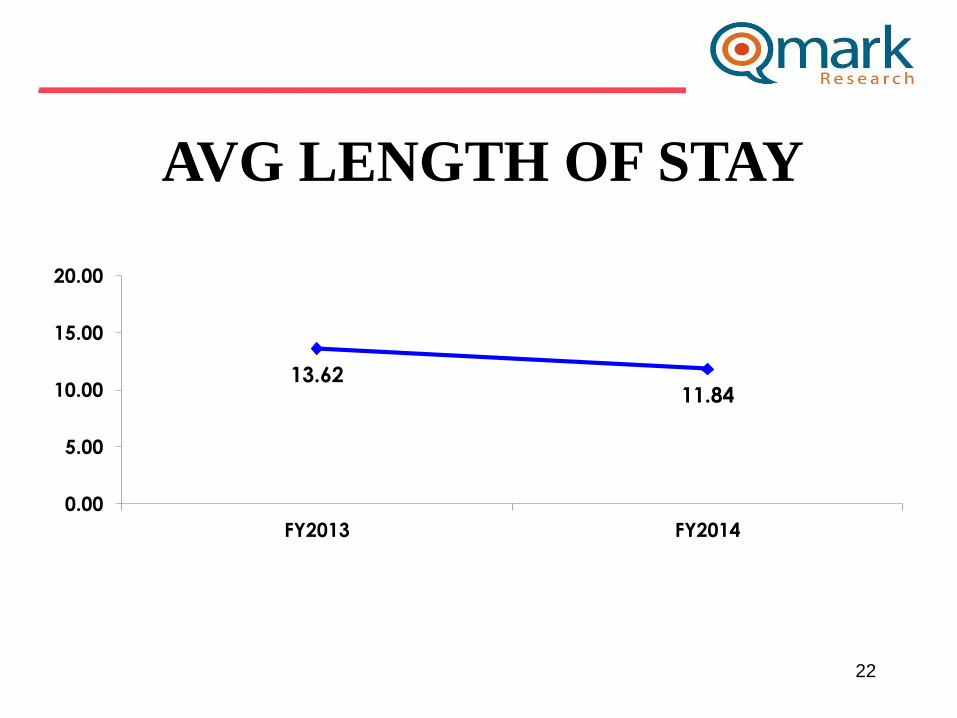
Length of Stay
1-2 Nights 3 Nights 4+ Nights
% 2% 1% 97%
0%
20%
40%
60%
80%
100%
120%
Mean = 11.84 Days
Median = 13.0 Days
22
___________________________
AVG LENGTH OF STAY
13.62 11.84
0.00
5.00
10.00
15.00
20.00
FY2013 FY2014
23
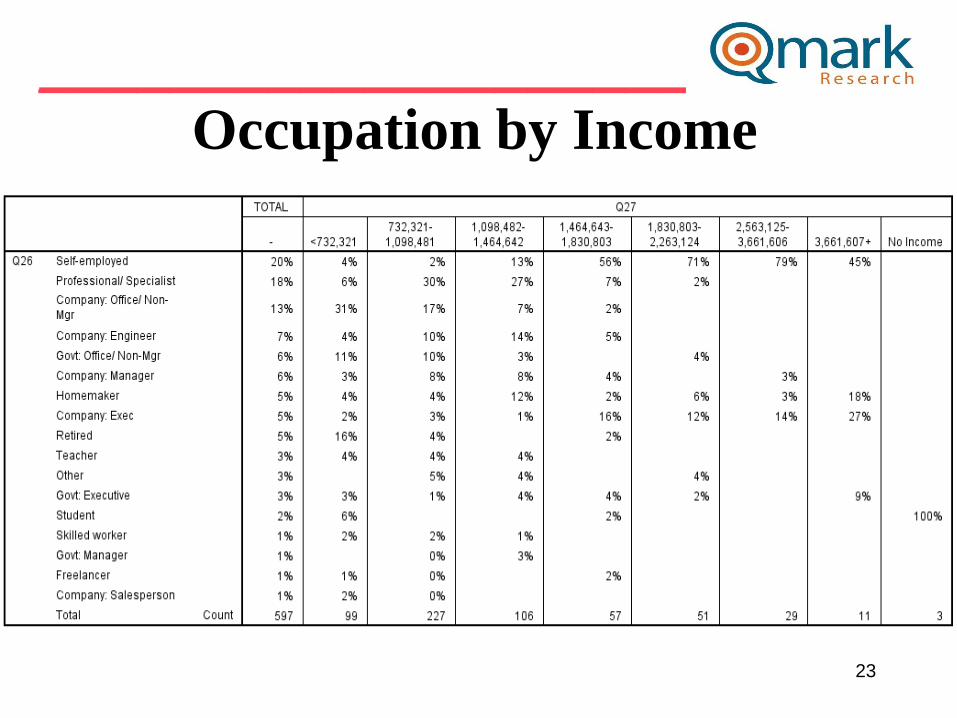
___________________________ Occupation by Income

24
___________________________
SECTION 2
TRAVEL PLANNING

25
___________________________
Travel Planning - Overall
35%
55%
5% 0% 1% 3%
0%
10%
20%
30%
40%
50%
60%
Full tour
package
Free-time
package
tours
Individually
arranged
travel
Group tour Other Company

26
___________________________
Travel Planning - Overall
FY2013 FY2014
Free-time pkg
tour 37% 55%
Full-pkg tour 37% 35%
FIT 28% 5%
Company 2% 3%
Other 1% 1%
Group tour 2% 0%

27
___________________________ Accommodation by Income
Average length of stay: 11.84 days

28
___________________________
Travel Motivation - Top Responses
Beauty No
Visa
Trvl
time Relax
Reco
m Safe
Plea-
sure Price Shop
Prior
trip
Com-
pany
Wtr
sport Scuba
Reasons for travel 96% 94% 87% 71% 52% 44% 40% 37% 25% 10% 4% 4% 3%
Most Important 30% 12% 10% 8% 4% 2% 5% 7% 3% 7% 2% 1% 1%
0%
20%
40%
60%
80%
100%
120%

29
___________________________
Most Important Reason for
Choosing Guam
• Guam’s natural beauty/ beaches,
• Visa waiver and
• Short travel time
are the primary reasons for visiting during
this period.

30
___________________________
Most Important Reason for
Choosing Guam
FY2013 FY2014
Natural Beauty 36% 30%
No Visa 24% 12%
Short travel
time Not top 3 10%
Relax 9% Not top 3

31
___________________________ Motivation by Age & Gender

32
___________________________ Motivation by Income

33
___________________________
SECTION 3
EXPENDITURES

34
___________________________
Prepaid Expenditures Ruble Varies /US$1
• $3,326.50 = overall mean average prepaid expense
(for entire travel party size) by respondent
• $0 = minimum (lowest amount recorded for the entire sample)
• $14,205 = maximum (highest amount recorded for the entire
sample)
• $1,644.43 = overall mean average per person
prepaid expenditures

35
___________________________
PREPAID EXPENDITURES Per Person
$2,603.50
$1,644.43
$0.00
$1,000.00
$2,000.00
$3,000.00
$4,000.00
$5,000.00
FY2013 FY2014

36
___________________________
Breakdown of Prepaid Expenditures Rub Varies=$1
(Filter: Only those who responded/
Per Travel Party) MEAN $
Air & Accommodation package only $2,297.81
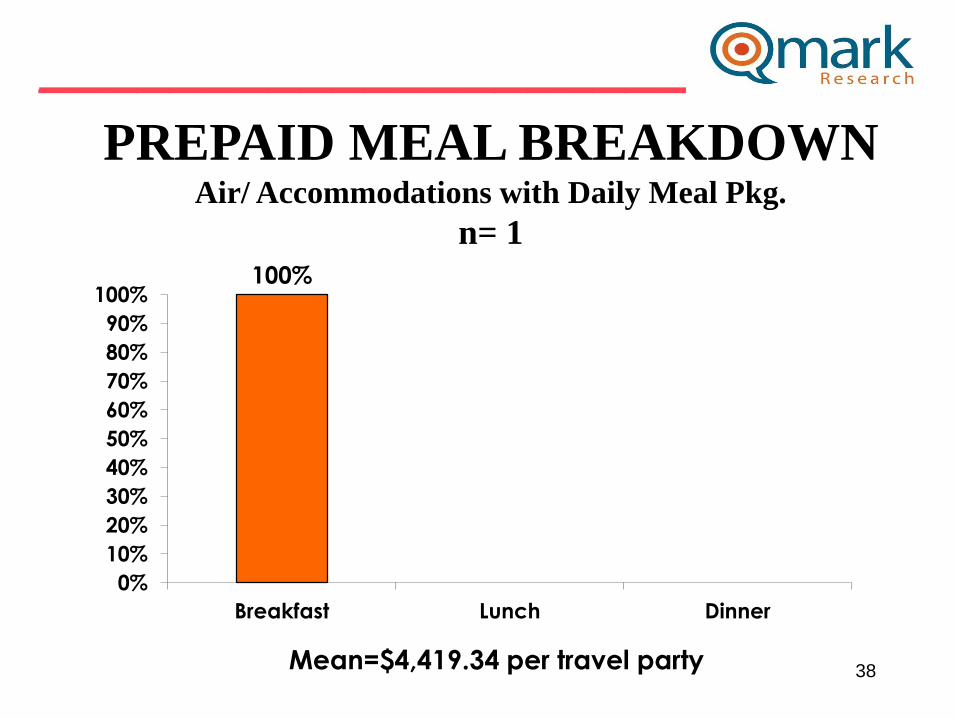
Air & Accommodation w/ daily meal package $4,419.34
Air only $2,406.49
Accommodation only $1,245.05
Accommodation w/ daily meal only $-
Food & Beverages in Hotel $-
Ground transportation – Russia $-
Ground transportation – Guam $-
Optional tours/ activities $-
Other expenses $848.90
Total Prepaid $3,326.50

37
___________________________ Breakdown of Prepaid Expenditures
FY2013 FY2014
Air &
Accommodation
package only
$5,366.19 $2,967.81
Air &
Accommodation w/
daily meal package
$8,323.00 $4,419.34
Air only $2,166.59 $2,406.49
Accommodation
only $2,031.37 $1,245.05
Accommodation w/
daily meal only $3,444.30 -
Food & Beverages in
Hotel - -
Ground
transportation –
Russia
$16.10 -
Ground
transportation –
Guam
- -
Optional tours/
activities - -
Other expenses $610.87 $848.90
Total Prepaid $5,626.62 $3,326.50
38
___________________________
PREPAID MEAL BREAKDOWN Air/ Accommodations with Daily Meal Pkg.
n= 1
100%
0%
10%
20%
30%
40%
50%
60%
70%
80%
90%
100%
Breakfast Lunch Dinner
Mean=$4,419.34 per travel party

39
___________________________
PREPAID MEAL BREAKDOWN Accommodations with Daily Meal Pkg.
n=1 100%
0%
20%
40%
60%
80%
100%
Breakfast Lunch Dinner
Mean=$XXX.XX per travel party

40
___________________________
PREPAID GROUND TRANSPORTATION n=1
100%
0
0.2
0.4
0.6
0.8
1
1.2
Trolley Car rental Scooter Other Bicycle
Mean=$xxx per travel party

41
___________________________
On-Island Expenditures
• $2,162.78 = overall mean average on-island expense (for entire travel party size) by respondent
• $0 = Minimum (lowest amount recorded for the entire sample)
• $20,000 = Maximum (highest amount recorded for the entire
sample)
• $1,225.85 = overall mean average per person on-island expenditure

42
___________________________
ON-ISLAND EXPENDITURES Per Person
$1,596.13
$1,225.85
$0.00
$1,000.00
$2,000.00
$3,000.00
FY2013 FY2014

43
___________________________
PREPAID/ ON-ISLE
EXPENDITURES – Per Person
$2,603.50
$1,644.43
$1,596.13 $1,225.85
$0.00
$1,000.00
$2,000.00
$3,000.00
$4,000.00
$5,000.00
FY2013 FY2014
Prepaid On-isle

44
___________________________
Total On-Island Expenditure
by Gender & Age

45
___________________________
On-Island Expenditure Categories
by Gender & Age

46
___________________________
On-Island Expenditures
First Timers & Repeaters

47
___________________________
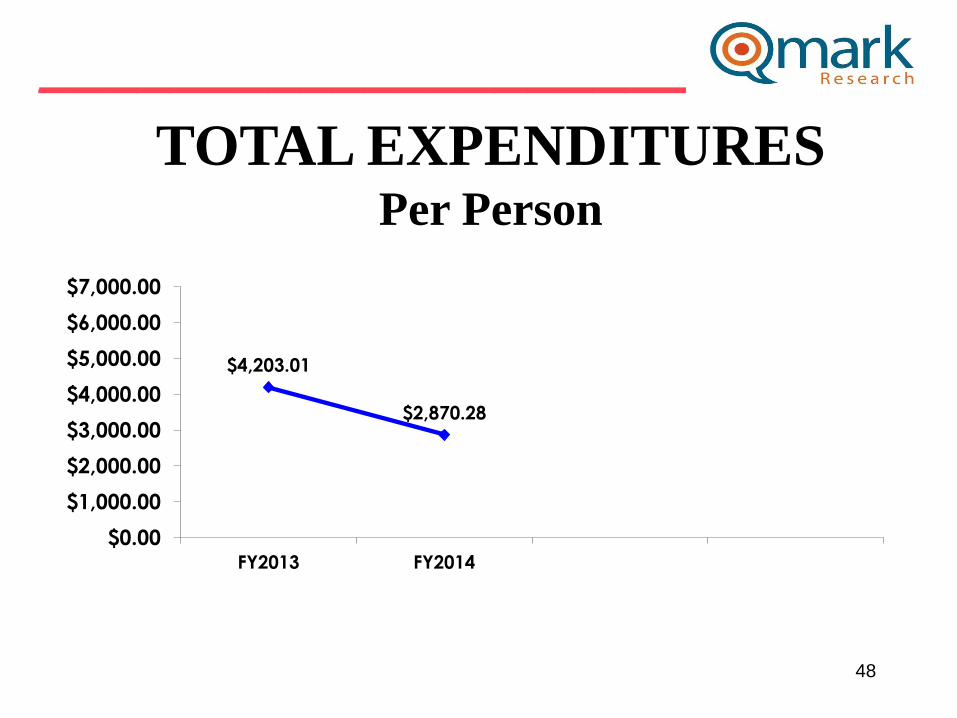
Total Expenditures Per Person
(Prepaid & On-Island)
• $2,870.28 = overall average
• $0 = Minimum (lowest amount recorded for the entire sample)
• $10,392 = Maximum (highest amount recorded for the entire
sample)
48
___________________________
TOTAL EXPENDITURES Per Person
$4,203.01
$2,870.28
$0.00
$1,000.00
$2,000.00
$3,000.00
$4,000.00
$5,000.00
$6,000.00
$7,000.00
FY2013 FY2014

49
___________________________
ONISLE EXPENDITURES Per Day
FY2014
Per Person $120.04
Travel Party $201.89
$0.00
$100.00
$200.00
$300.00
$400.00
$500.00

50
___________________________
Breakdown of On-Island
Expenditures MEAN $
Food & beverage in a hotel $128.20
Food & beverage in fast food restaurant/convenience store
$75.01
Food & beverage at restaurants or drinking establishments outside a hotel
$434.95
Optional tours and activities $274.08
Gifts/ souvenirs for yourself/companions $725.25
Gifts/ souvenirs for friends/family at home $323.91
Local transportation $85.37
Other expenses not covered $109.60
Average Total $2,162.78

51
___________________________ Breakdown of On-Island Expenditures
FY2013 FY2014
Food & beverage in
a hotel $366.52 $128.20
Food & beverage in
fast food
restaurant/convenie
nce store
$52.14 $75.01
Food & beverage at
restaurants or
drinking
establishments
outside a hotel
$532.18 $434.95
Optional tours and
activities $362.95 $274.08
Gifts/ souvenirs for
yourself/
companions $1,151.61 $725.25
Gifts/ souvenirs for
friends/family $482.91 $323.91
Local transportation $214.38 $85.37
Other expenses not
covered $168.12 $109.60
Average Total $3,319.55 $2,162.78
52
___________________________
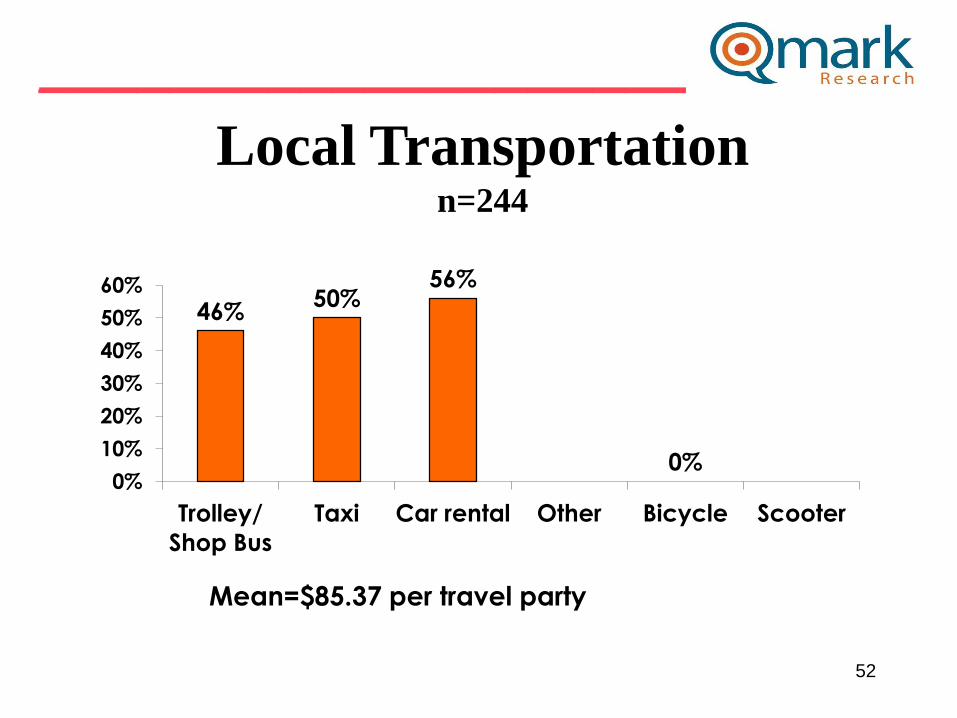
Local Transportation n=244
46% 50%
56%
0% 0%
10%
20%
30%
40%
50%
60%
Trolley/
Shop Bus
Taxi Car rental Other Bicycle Scooter
Mean=$85.37 per travel party

53
___________________________
SECTION 4
VISITOR SATISFACTION

54
___________________________
Satisfaction Scores Overall 7pt Rating Scale
7=Very Satisfied/1=Very Dissatisfied
Ease of
getting
around
Safety
walking at
night
Price OVERALL
Very satisfied 14% 18% 14% 15%
MEAN 5.76 5.79 5.41 5.84
1.00
2.00
3.00
4.00
5.00
6.00
7.00
0%
2%
4%
6%
8%
10%
12%
14%
16%
18%
20%
55
___________________________
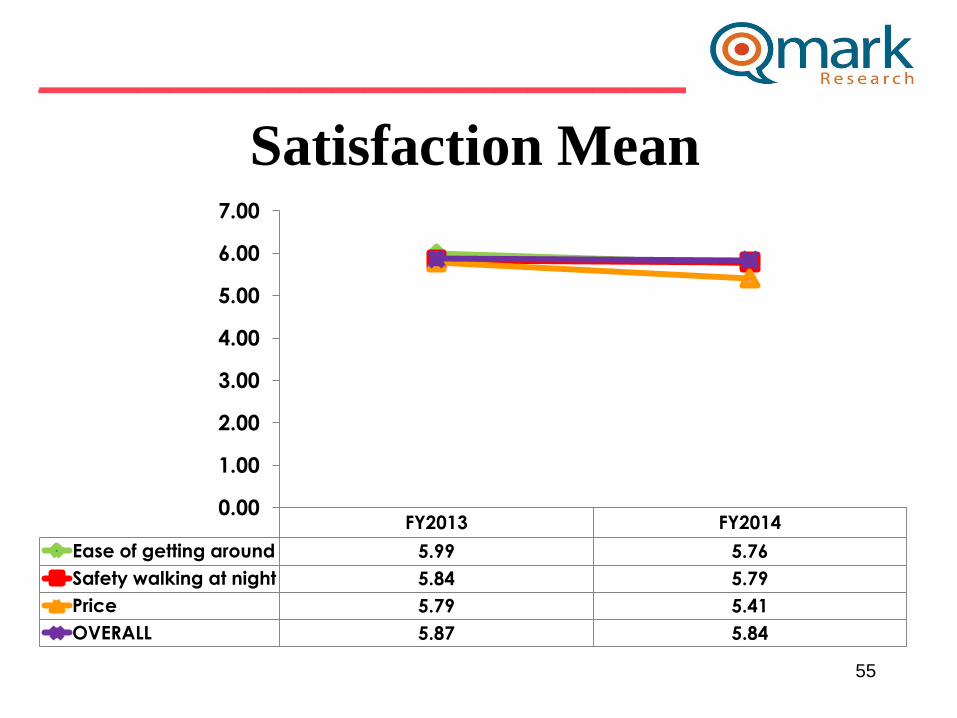
Satisfaction Mean
FY2013 FY2014
Ease of getting around 5.99 5.76
Safety walking at night 5.84 5.79
Price 5.79 5.41
OVERALL 5.87 5.84
0.00
1.00
2.00
3.00
4.00
5.00
6.00
7.00

56
___________________________
Satisfaction Quality/ Cleanliness 7pt Rating Scale
7=Very Satisfied/1=Very Dissatisfied
Beaches
/ Parks Air/ Sky Parks
Land-
scape
Tumon
Land-
scape
Guam
Ground
Handler
Trans
Vehicle
Very satisfied 15% 65% 27% 21% 17% 23% 24%
MEAN 5.66 6.58 6.01 5.79 5.56 5.94 5.97
5.00
5.20
5.40
5.60
5.80
6.00
6.20
6.40
6.60
6.80
0%
10%
20%
30%
40%
50%
60%
70%

57
___________________________
Satisfaction Mean
FY2013 FY2014
Beaches/ Parks 5.95 5.66
Air/ Sky 6.68 6.58
Parks 6.19 6.01
Landscape Tumon 5.94 5.79
Landscape Guam 5.70 5.56
Grnd Handler 5.74 5.94
Trans Vehicle 5.80 5.97
0.00
1.00
2.00
3.00
4.00
5.00
6.00
7.00

58
___________________________
Quality of Accommodations 7pt Rating Scale
7=Very Satisfied/1=Very Dissatisfied
Room View Furnish-
ing
Cleanli-
ness
Food
Quality
Food
Quantity Staff Service Value
OVER-
ALL
Very satisfied 8% 12% 9% 8% 10% 11% 13% 11% 7% 18%
MEAN 5.39 5.54 5.37 5.38 5.48 5.51 5.50 5.44 5.33 5.67
5.10
5.20
5.30
5.40
5.50
5.60
5.70
0%
2%
4%
6%
8%
10%
12%
14%
16%
18%
20%

59
___________________________
Accommodations
Overall Satisfaction
5.93 5.67
1.00
2.00
3.00
4.00
5.00
6.00
7.00
FY2013 FY2014

60
___________________________
Quality of Dining Experience 7pt Rating Scale
7=Very Satisfied/1=Very Dissatisfied
Furnish-
ings
Clean-
liness
Food-
Quality
Food-
Quantity Staff Service Value
Very satisfied 13% 12% 17% 18% 17% 15% 11%
MEAN 5.81 5.80 5.99 6.01 5.87 5.86 5.79
5.65
5.70
5.75
5.80
5.85
5.90
5.95
6.00
6.05
0%
2%
4%
6%
8%
10%
12%
14%
16%
18%
20%

61
___________________________
Visits to Shopping Centers/Malls on Guam Top responses
Micro
Mall Macys Ross
Prem
Outlet
The
Plaza DFS
Tumon
Sands ABC K-Mart
Shopped 90% 78% 70% 68% 62% 62% 58% 51% 43%
0%
10%
20%
30%
40%
50%
60%
70%
80%
90%
100%

62
___________________________
Visits to Shopping Centers/Malls on Guam Top 6
FY2013 FY2014
Micronesian
Mall 93% 90%
Macys 86% 78%
Ross 70% 70%
Prem Outlet 71% 68%
The Plaza Not top 6 62%
DFS 83% 62%
Tumon Sands Not top 6 58%
K-Mart 72% Not top 6

63
___________________________
Satisfaction with Shopping
7pt Rating Scale
7=Very Satisfied/ 1=Very Dissatisfied
Quality of Shopping Variety of Shopping
Score of 6 to 7 = 54% Score of 6 to 7 = 48%
Score of 4 to 5 = 43% Score of 4 to 5 = 46%
Score 1 to 3 = 3% Score 1 to 3 = 6%
MEAN = 5.55 MEAN = 5.39

64
___________________________
Satisfaction with Shopping
FY2013 FY2014
Quality 5.84 5.55
Variety 5.83 5.39
0.00
1.00
2.00
3.00
4.00
5.00
6.00
7.00

65
___________________________
Optional Tour Participation
None
19%
One or
more
81%
• Average number of tours
participated in is 2.61

66
___________________________
Optional Tour Participation
FY2013 FY2014
Optional tour 82% 81%
0%
20%
40%
60%
80%
100%

67
___________________________
Optional Tours
Participation & Satisfaction
Und-
wtr
wld
Cha
m
NM
Sand
-cstl
Fish
Eye
At-
lan-
tis
Flt
Sch Spa
Sky-
dive
Cult
Park
Slng-
shot
Sea-
walk Club
Coc
os
Isle
Alu-
pan
g
Gef
Pag
o
BIG Cop
-ter
Eng
Lang
Snub
a Zorb Oth
Participated 42% 38% 24% 23% 18% 9% 8% 6% 6% 5% 5% 5% 4% 3% 3% 1% 1% 0% 0% 0% 42%
MEAN Satis 5.70 5.25 6.12 6.01 5.17 5.58 6.02 6.26 5.72 5.55 6.03 5.83 4.75 5.58 6.06 6.00 5.88 5.50 5.50 5.00 6.42
0.00
1.00
2.00
3.00
4.00
5.00
6.00
7.00
0%
5%
10%
15%
20%
25%
30%
35%
40%
45%

68
___________________________
Day Tours Satisfaction 7pt Rating Scale
7=Very Satisfied/ 1=Very Dissatisfied
Quality of Day Tour Variety of Day Tour
Score of 6 to 7 = 74% Score of 6 to 7 = 25%
Score of 4 to 5 = 23% Score of 4 to 5 = 51%
Score 1 to 3 = 3% Score 1 to 3 = 25%
MEAN = 5.95 MEAN = 4.56

69
___________________________
Day Tours Satisfaction
FY2013 FY2014
Quality 5.70 5.95
Variety 4.99 4.56
0.00
1.00
2.00
3.00
4.00
5.00
6.00
7.00

70
___________________________
Night Tours Satisfaction 7pt Rating Scale
7=Very Satisfied/ 1=Very Dissatisfied
Quality of Night Tour Variety of Night Tour
Score of 6 to 7 = 36% Score of 6 to 7 = 31%
Score of 4 to 5 = 54% Score of 4 to 5 = 50%
Score 1 to 3 = 11% Score 1 to 3 = 17%
MEAN = 4.99 MEAN = 4.74

71
___________________________
Night Tours Satisfaction
FY2013 FY2014
Quality 4.93 4.99
Variety 4.79 4.74
0.00
1.00
2.00
3.00
4.00
5.00
6.00
7.00
72
___________________________
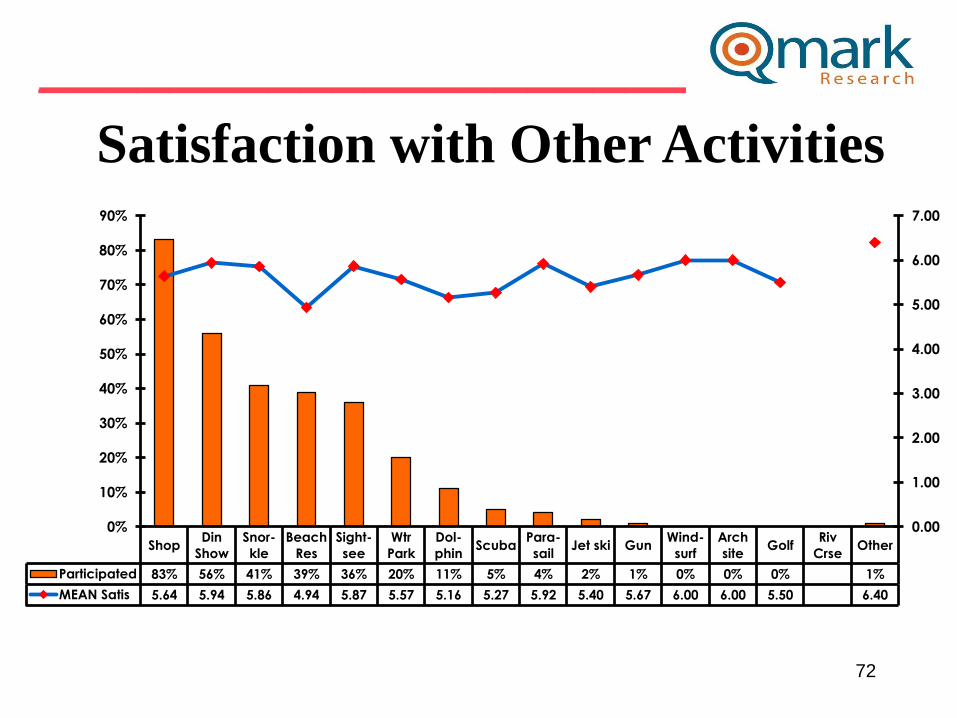
Satisfaction with Other Activities
Shop Din
Show
Snor-
kle
Beach
Res
Sight-
see
Wtr
Park
Dol-
phin Scuba
Para-
sail Jet ski Gun
Wind-
surf
Arch
site Golf
Riv
Crse Other
Participated 83% 56% 41% 39% 36% 20% 11% 5% 4% 2% 1% 0% 0% 0% 1%
MEAN Satis 5.64 5.94 5.86 4.94 5.87 5.57 5.16 5.27 5.92 5.40 5.67 6.00 6.00 5.50 6.40
0.00
1.00
2.00
3.00
4.00
5.00
6.00
7.00
0%
10%
20%
30%
40%
50%
60%
70%
80%
90%

73
___________________________
What would it take to make Guam
more enjoyable for families?
Nothing Cleaner
sites
Russian
speakers
Things to
do Flt Sched
Accom for
extra stay Other
Incentive 61% 14% 13% 13% 3% 6% 3%
0%
10%
20%
30%
40%
50%
60%

74
___________________________
What would it take to make Guam
more enjoyable for families? FY2013 FY2014
Nothing 50% 61%
Cleaner scenic
sites 14% 14%
More Russian
speaking retail 28% 13%
More things to do 14% 13%
Accommodations
for ext stay 7% 6%
Other 6% 3%
Flight schedule
time 12% 3%

75
___________________________
On-Island Perceptions 7pt Rating Scale
7=Very Satisfied/ 1=Very Dissatisfied
Guam
was
better
than
expected
I had no
com-
municati
on
problems
I will
recomme
nd Guam
to friends
Sites on
Guam
were
attractive
I plan to
visit
Guam
again
Not
enough
night
activities
Strongly agree 14% 13% 17% 11% 14% 3%
MEAN 5.31 5.30 5.61 4.76 5.12 4.21
0.00
1.00
2.00
3.00
4.00
5.00
6.00
0%
2%
4%
6%
8%
10%
12%
14%
16%
18%

76
___________________________
On-Island Perceptions
FY2013 FY2014
Guam was better than expected 4.83 5.31
I had no com-munication
problems 4.64 5.30
I will recommend Guam to friends 5.41 5.61
Sites on Guam were attractive 4.54 4.76
I plan to visit Guam again 4.91 5.12
Not enough night activities 4.29 4.21
4.00
5.00
6.00

77
___________________________
Transportation 7pt Rating Scale
7=Strongly agree/ 1=Strongly disagree
Tour Guide-
Professional
Tour Driver-
Professional
Taxi driver-
Professional Taxi- Clean
Guam
Airport-
Clean
Strongly agree 28% 16% 6% 5% 5%
MEAN 5.25 5.12 4.47 4.46 4.97
4.00
4.20
4.40
4.60
4.80
5.00
5.20
5.40
0%
5%
10%
15%
20%
25%
30%

78
___________________________
Transportation
FY2013 FY2014
Tour Guide- professional 4.82 5.25
Tour Driver- professional 4.82 5.12
Taxi - Professional 4.96 4.47
Taxi- clean 5.04 4.46
Guam Airport- Clean 5.29 4.97
0.00
1.00
2.00
3.00
4.00
5.00
6.00
7.00

79
___________________________
SECTION 5
PROMOTIONS

80
___________________________
Internet- Guam Sources of Info
72% 69%
34%
20%
34%
3% 1% 0%
10%
20%
30%
40%
50%
60%
70%
80%
Search
engine
Forums Blogs Q&A sites Social
Networks
Do NOT Use Other

81
___________________________
Internet- Guam Sources of Info FY2013 FY2014
Search engines
73% 72%
Forums 63% 69%
Social Networks
17% 34%
Blogs 35% 34%
Q&A sites 25% 20%
None 5% 3%
Ohter 1% 1%

82
___________________________
Internet- Things To Do
Sources of Info 82%
2%
14%
1% 3%
12%
1% 0%
10%
20%
30%
40%
50%
60%
70%
80%
90%
Google vKontakte Yandex Yahoo Do NOT use Other Twitter

83
___________________________
Internet- Things To Do
Sources of Info
FY2013 FY2014
Google 82% 82%
Yandex 13% 14%
Other 6% 12%
Do not use 5% 3%
vKontakte 4% 3%
Yahoo 2% 1%
Twitter 1% 1%
84
___________________________
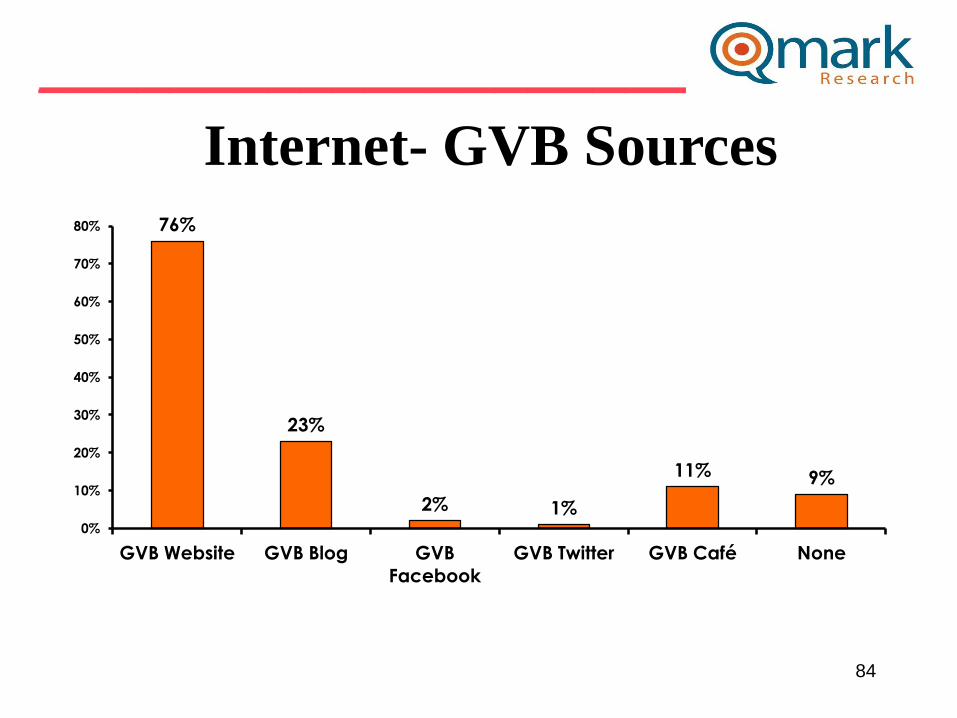
Internet- GVB Sources
76%
23%
2% 1%
11% 9%
0%
10%
20%
30%
40%
50%
60%
70%
80%
GVB Website GVB Blog GVB
GVB Twitter GVB Café None

85
___________________________
Internet- GVB Sources
FY2013 FY2014
GVB Website 54% 76%
GVB Blog 8% 23%
GVB Café 2% 11%
None 36% 9%
GVB Facebook 7% 2%
GVB Twitter 2% 1%

86
___________________________
Travel Motivation- Info Sources
40% 42%
73%
17%
3% 3%
0%
10%
20%
30%
40%
50%
60%
70%
80%
Travel agent Internet Friends/
Family
Social media Travel Show Magazine

87
___________________________
Travel Motivation- Info Sources
FY2013 FY2014
Friends/ Family
56% 73%
Internet 41% 42%
Travel agent 29% 40%
Social media 9% 17%
Travel shows 1% 3%
Magazine 2% 3%

88
___________________________
Sources of Information Pre-arrival
Internet Recomm TV Bro-
chure
GVB
Promo
Maga-
zine
News-
ppr Prior trip
Com-
pany Radio
Guide-
bk
Sources of info 79% 78% 39% 35% 15% 13% 12% 10% 5% 4% 2%
Most important 22% 37% 8% 9% 7% 0% 2% 9% 3% 1% 0%
0%
10%
20%
30%
40%
50%
60%
70%
80%
90%
• The 3 primary sources of information
regarding Guam are:
Internet
Word-of-mouth
Travel Agent Brochures/ TV

89
___________________________
Pre-Arrival Sources – Top 3
Most Important
FY2013 FY2014
Recommendations
Friend/ Family 32% 37%
Internet 36% 22%
Travel agent
brochure 11% 9%
Prior trip Not top 3 9%

90
___________________________
Sources of Information Post-arrival
• The primary local source of information
are tour staff members.
Tour
staff
Hotel
staff Oth vis
Local
ppl
Sign-
age
Inter-
net
Rest-
rnt Retail
Local
pub Vis Ch Taxi Other
Sources of info 88% 60% 53% 41% 27% 26% 25% 17% 4% 4% 2% 13%
Most important 61% 6% 8% 9% 1% 2% 1% 0% 1% 1% 11%
0%
10%
20%
30%
40%
50%
60%
70%
80%
90%
100%

91
___________________________
Post-Arrival Sources – Top 3
Most Important
FY2013 FY2014
Tour staff 49% 61%
Other 11% 11%
Local people Not top 3 9%
Hotel staff 14% Not top 3

92
___________________________
SECTION 6
OTHER ISSUES

93
___________________________
Concerns about travel outside of
Russia - Overall
44%
26%
18% 22%
1%
9%
2% 3%
47%
0%
5%
10%
15%
20%
25%
30%
35%
40%
45%
50%

94
___________________________ Concerns about travel outside of Russia - Overall
FY2013 FY2014
No
concerns 33% 47%
Safety 52% 44%
Food 22% 26%
Terrorism 12% 22%
Expense 17% 18%
Other 9% 9%
Don’t
know 5% 3%
Should
spend at
home 2% 2%
Discrim-
ination 2% 1%

95
___________________________
Concerns about travel outside of
Russia - By Age & Income

96
___________________________
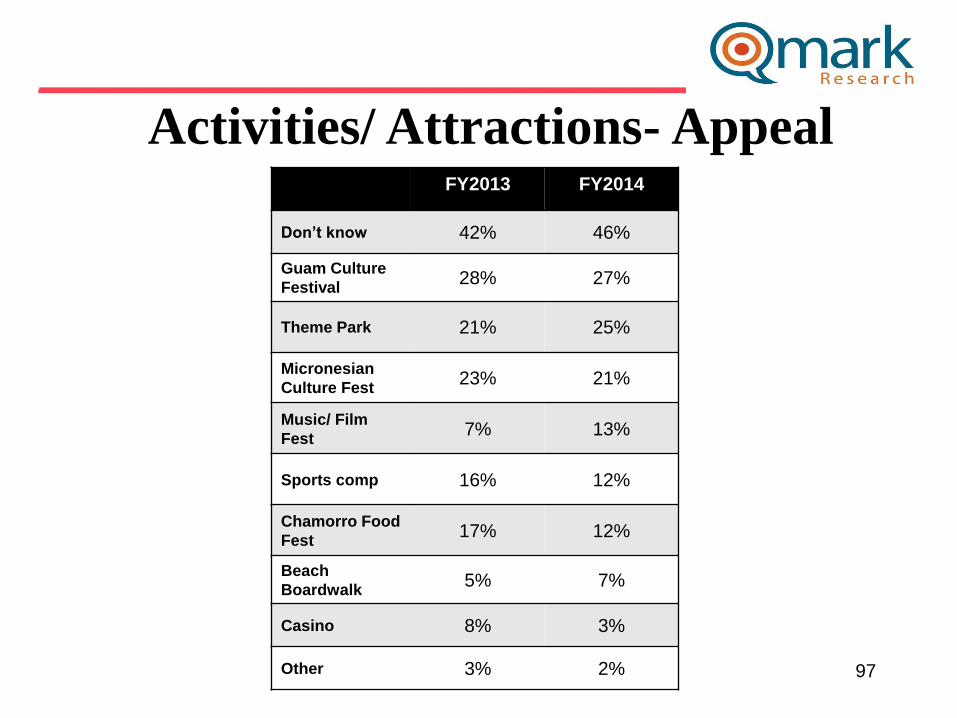
Activities/ Attractions- Appeal
27%
12% 12%
21% 25%
13%
3% 7%
46%
0%
5%
10%
15%
20%
25%
30%
35%
40%
45%
50%
97
___________________________ Activities/ Attractions- Appeal
FY2013 FY2014
Don’t know 42% 46%
Guam Culture
Festival 28% 27%
Theme Park 21% 25%
Micronesian
Culture Fest 23% 21%
Music/ Film
Fest 7% 13%
Sports comp 16% 12%
Chamorro Food
Fest 17% 12%
Beach
Boardwalk 5% 7%
Casino 8% 3%
Other 3% 2%

98
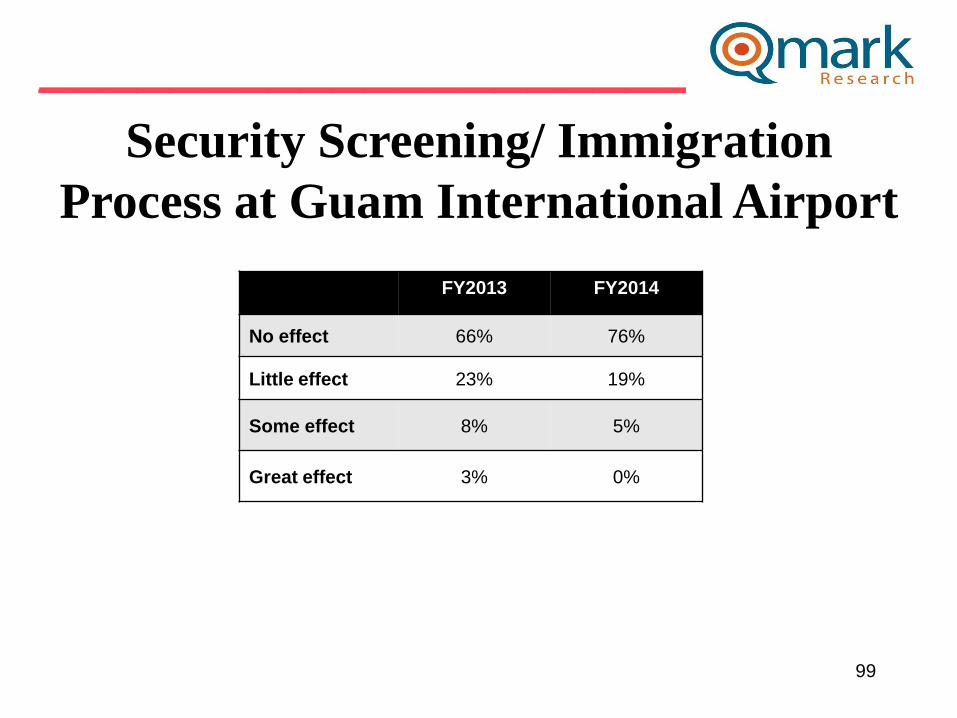
___________________________
Security Screening/ Immigration
Process at Guam International Airport 76%
19%
5% 0%
0%
10%
20%
30%
40%
50%
60%
70%
80%
No affect Little effect, the
process is
necessary
Some affect Great affect, the
process takes too
long, will not return
99
___________________________
Security Screening/ Immigration
Process at Guam International Airport
FY2013 FY2014
No effect 66% 76%
Little effect 23% 19%
Some effect 8% 5%
Great effect 3% 0%

100
___________________________
Airport Arrival Experience 7pt Rating Scale
7=Strongly Agree/ 1=Strongly Disagree
More
Russian
speakers
More
immigration
officers
Friendlier
airport
officials
Facilities
clean/
appeal
Facilities
need better
maint
Strongly agree 12% 4% 3% 5% 3%
MEAN 4.36 4.16 4.20 4.41 4.96
3.60
3.80
4.00
4.20
4.40
4.60
4.80
5.00
5.20
0%
2%
4%
6%
8%
10%
12%
14%

101
___________________________
Airport Arrival Experience
FY2013 FY2014
Russian speaking officials 4.92 4.36
More immigration officers 4.51 4.16
Need friendlier AP officials 4.47 4.20
Facility- clean/ appealing 4.87 4.41
Facility- need better maint 4.59 4.96
2.00
3.00
4.00
5.00
6.00
7.00