Embed Size (px)
Citation preview

A\Gtt'~j~ilfi)~TFfj~rI-!PSJA "FI:&-N tJN PU,N J1A'B: THE CASE OF FOOD
PIiOCESSIJ.V6 '~VDlJSTIlIES
SUKHPAL SINGH
INSTITUTE FOR SOCIAL AND ECONOMIC CHANGE BANGALORE-560 072
A Thesis Submitted to the Bangalore University, Bangalore For the Degree of Doctor of Philosophy in Economics
APRIL 1992
INSTITUTE FOR SOCIAL AND ECONO:\lIC CHANGE an all·india institute for jllter.diseip/inury , eseareh lind 'ruining tn the social scleneel
VINOD VYASULU Professor of Economics and Head, RBI Endowment Unit
C E R T I F I CAT E
I hereby certify that I have guided
Nagarabhav i P. O. Bangalorc-[,GO 072
and
supervised the preparation and writing of the thesis
entitled "AGRO INDUSTRIALISATION IN PUNJAB: THE CASE
OF FOOD PROCESSING INDUSTRIES" by Shri Sukhpal Singh
who worked on this topic at the Institute for Social
and Economic Change, Bangalore from June 1988 to
April 1992.
I also certify that the thesis has not
previously formed the basis for the award of any
Degree, Diploma or Associate Fellowsh ip of the
Bangalore University or any other university.
VINOD VYASULU

DECLARATION
hereby declare that the present thesis entitled
lAGRO-INDUSTRIALISATION IN PUNJAB: THE CASE OF FOOD PROCESSING
INDUSTRIES· is the outcome of the original research work
undertaken and carried out by me under the guidance~of Dr Vinod
Vyasulu, Professor and Head, RBI Endowment Unit. Institute for
Social and Economic Change, Bangalore. Due acknowledgements have
been made wherever anything has been borrowed from other sources.
also declare that the material of this thesis has not
formed. in any way, the basis for the award of any Degree,
Diploma or Associate Fellowship,
University or any other university.
April 1992 Bangalore
previously of the Bangalore
Sukhpal Singn
List. of Tables
Lis t. of
Chapter
Chapter
Chapt.er
Chapt.er
Chapter
Maps
1 :
2:
.~ , .- . 4 :
c:: • . J.
Chapt.er 6:
Ch3pter 7:
Chapter 8:
Appendill
Bibliography
List of Contents
Int.roduc t.iol1
Review of Literature
The St.rlJ,;t.ure of t,ho::. P'ln i Clb E,::onom'{
G row t han d S t. r IJ C t: U reo f t. h e F 00 oj
P r.;) c e 5 sin gin d I.J S t r I e sin P IJ n i a b :
1969-1988
S t. r IJ c t IJ r e and Fun c t ion I n Ii; 'J t F 0 IJ oj
Processing Industries in F'unj.3b:
A District Level An~lysis
Linkag.?s of Food PrQGessing ill
PIJn jab
Entrepreneursnip in Food Processing
I n rj IJ S t. r I e sin P IJ n j ..) b
Summary and Conclusions
• Quest.ionnaire
Page
v
lie:
1-27
28-1)2
63-90
9l.-117
1 U3 - 1 ':
15d-1r
I r~ ,
231- 2'
Acknowledgements
This study is the result of co-operation and help from many
people in many ways. In fact. i tis neither possible nor
sufficient to acknowledge them all in this formal manner.
The
Bangalore
faci I ities
Institute for Social and Economic Change ( ISEC)
provided me with
to carry out this
H'e physical and intellect.u,31
research work. The Director of
ISEC, Shr i T R Satish Chandran always cheerfully helped me out
with the administrative difficulties.
with him were of an eye opening nature.
The initial discussions
Professor Vinod VyasullJ
not only guided me in this research effort in a very valuable and
charming way, but also tried to mould me into a potential
researcher through his constant encouragement and discussions.
will always be indebted to him and his family for their advice,
affection and concern which they always showered on me.
could continue to work with him for a longer period.
I wish I
Professors V M Rao, M V Nadkarni. H G Hanumappa. and Abdul
Aziz and Dr H Ramachandran were always available for discussions
and expressed keen interest. in my research work. Many
researchers outside the Institute like Professor J C Sandesara
and senior academics in the government. I ike Professors Y K Alagh,
and T S Papola also contributed in giving the proposal a concrete
shape. I am indebted to all of them.
The Reserve Bank of India, Bombay not only selected me for
their research fellowship at the Institute but also gav~ me an
opportunity to meet and benefit from Dr S L Shetty. the Economic
Ad vis e r to the Bank. I am grateful to Dr Shetty and the RBI for
this. The members of the RBI Endowment Un rt at the Institute.
including Ms Vanishree who has since left the Institute. wer~
always participant observers to my work and facilitated my work
in many ways. Besides, their concern for me was expl icit and
am particularly obliged to the Unit for heart-warming.
providing me with access to the additional computer facility
without which would have been definitely delayed in the
submission of my thesis.
I am thankful to the Bangalore University, its Department of
Economics, and particularly Professors D T Nanjegowda and 5 N
Nanjegowda and al so Dr R G Desai for their comments and timely
support in completing the formal requirements ot the University.
Friends at the Institute were always ready with their
helping hand. They were a ricn source ot encouragement and
support. Vidya Philar, Indira and Vijayalakshmi did an
excel lent job of editing and proof reading the entire thesis. in
spi te of their own busy schedule ot research. f(ajc:.sekhar and
Nagaraju were always available for computer guidance.
helped me out with the registration formalities at the
University. Perhaps j'Jst thanking them wii not be an adequate
i i

recognition of their contribution to this work.
friends at ISEC were particularly interesting and Other
helpful. never fel t the pinch of hostel I ife in their sweet
company during my stay of about fOIJr years~ at the [SEC hostel.
Ny stay in their company has been certainly an unforgettable one.
The mess staff was always concerned about me and a m g rat I? f IJ Ito
them.
The administrative and library staff of the Institute have
given me their support in academic and non-academic matters. Nr K
S Narayan did a good job at putting the half-baked material at
this thesis into the computer which facilitated the timely
submission at this work. Nr Lingaraju did an excellent job of
preparing maps for this thesis. thank all of them.
Friends in Punjab were always concerned about me and
showered me their good wishes. Special mention must be made at my
teacher DrSucha SinghGill, and friends Sukhpa I, La.khw i nder,
Parshotam. But for their Hans and
perhaps would have lost my way.
study in respondents of my survey
provided very useful information.
My parents and fami iy members
support and encouragement,
am also thankful to the
Ludhiana and Bathinda who
not only put up with my lonj!
absence from home in a cheerful manner. but aiso never drew back
iii

from offering al I possible help and good wishes.
work to them.
lowe a I I my
iv
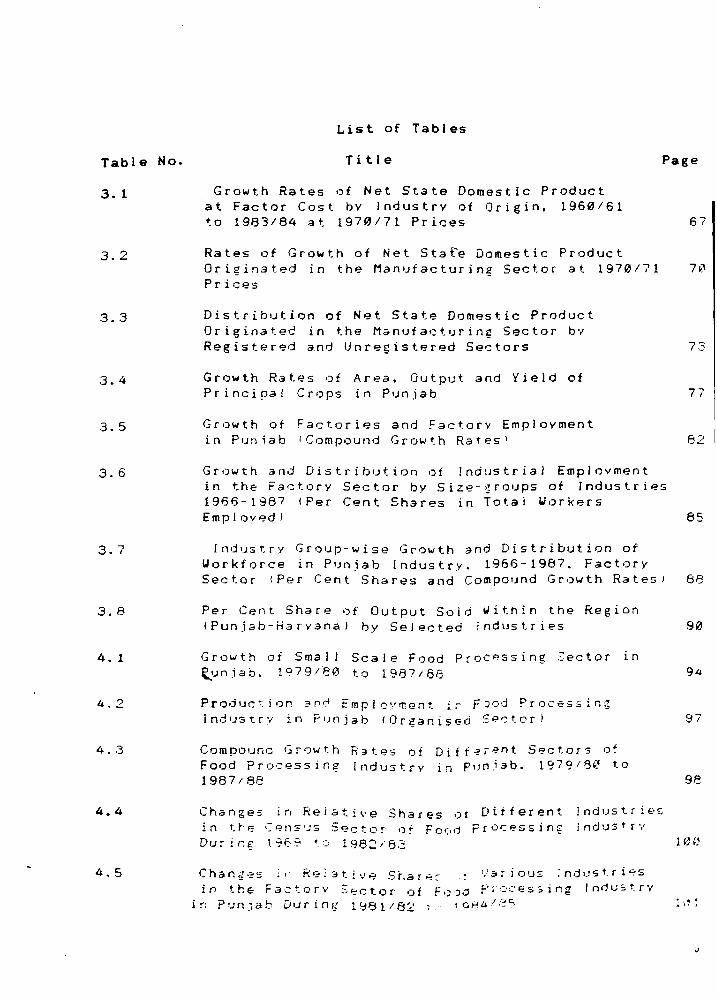
Table No.
3. 1
3.2
3.3
3.4
3.5
3.6
3.7
3.8
4. 1
4.2
4 .. 3
4.4
4.5
List of Tables
T i tl e Page
Growth Rates of Net State Domestic Product at Factor Cost by Industrv of Origin. 1960/61 to 1983/84 at 1970/71 Prices
Rates of Growth of Net State Domestic Product
67
Originated in the Manufacturing Sector at 1970/71 70 Prices
Distribution of Net State Domestic Product Originated in the Manufacturing Sector by Registered and Unregistered Sectors
Growth Rates of Area. Output and Yield of Principal Crops in Punjab
Growth of Factories and Factory Emplovment in Puniab (Compound Growth Rates\
Growth and Distribution of Industrial Emplovment in the Factory Sector by Size-~roups of Industries 1966-1987 (Per Cent Shares in Total ~orkers
Emp IIJved )
Industry Group-wise Growth and Distribution of U ark for c e i n P,) n jab I n d IJ S try. 1966 - 1 987. Fa c tor y Sector (Per Cent Shares and compound Growth Rates)
Per Cent Share of Output Sold ~ithin the Region {Punjab-Haryanal by Selected industries
Growth of Small Scale Food Processing ;:;ector in ~Jnjab. 1979/80 to 1987/136
Production ?rd Emplcy~ent i~ F~od Processing industry in Punjab (Organised Sector)
Com pOlJrtO (~r ow t h Food ?ro·:::ess i ng 1987/88
R3tes of Diff~r~nt Sectors o~ Industry in PtJn,iab. 1979 1 8f1 to
Changes ira Relative Shares or Different Industries in ~~8 C~ns~s 5~ctQr of FOQri Proc~ssing industrY
73
77
82 I
85
88
90
97
Duri~g 196~ '0 1982;83 100
C han? -? s i ,- R'? 1 3 t i \' "? S h a r ~:: .:,1 a: j 0 Us: n.j uS t. r i .", S
in thE- Factory Sector of F.)'Ju f'l.:,ces5ing Inoir.;s;trv in Punjab During 1981/82 :. ,QHa I B5
4.6
4.7
4.8
4.9
5. 1
5.2
5 .. 3
5.4
5.5
5.6
5.7
5.8
5.9
'5 10
'" 1 1
5· 12
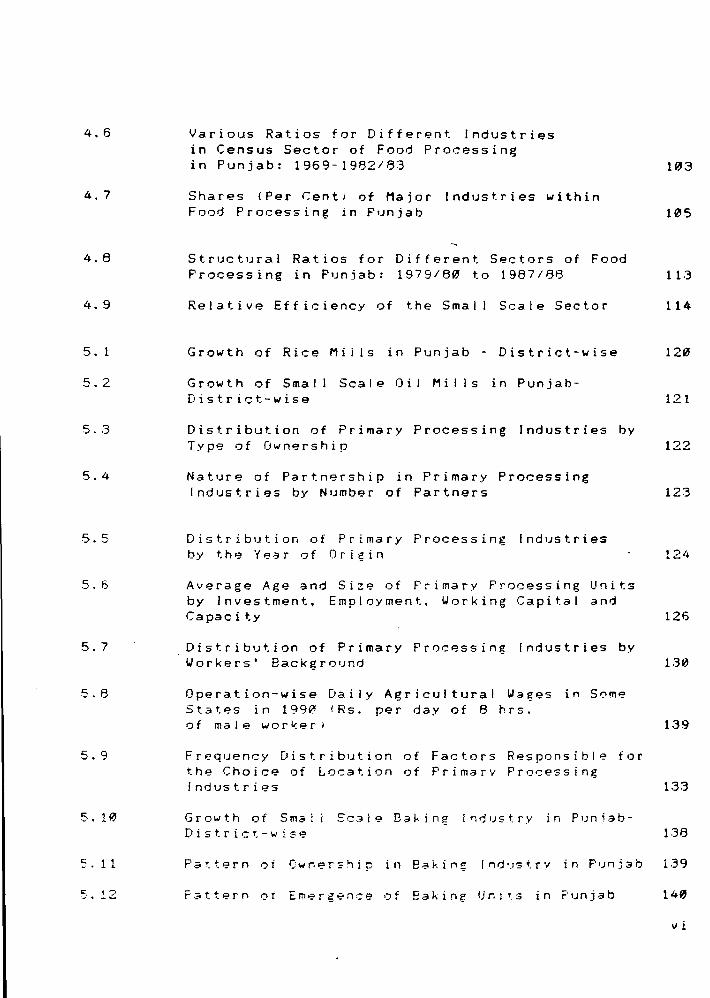
Various Ratios for Different Industries in Census Sector of Food Processing in Punjab: 1969-1982/83
Shares (Per CenU of Major IndlJstries within Food Processing in Punjab
Structural Ratios for Different Sectors of Food Processing in Punjab: 1979/80 to 1987/88
Relative Efficiency of the Small Scale Sector
Growth of Rice Miils in Punjab - District-wise
Growth of Smal District-wise
Scale Oil Mills in Punjab-
Distribution of Primary Processing Industries by Type af Ownership
Nature of Partnership in Primary Processing Industries by Number of Partners
Distribution of Primary Processing Industries by the Year af Origin
Average Age and Size of Primary Processing Units by Investment. Employment. \Jorking Capital and Capac i ty
Distribution of Primary Processing Industries by U 0 r k e r s' B a c k g r 0 I) n d
Operation-wise Daily Agricultural Wages in Some Stat.es in 199V.'! IRs. per day of 8 hrs. of male workeri
Frequency Distribution of Factors Responsible for the Choice of Location of Primary Processing Industries
Growth of Sm5li District-I.'ist?
S C 3 i e B., kin g (n d I) S try i n P I) n jab-
103
105
11.3
114
120
121
122
12.3
124
126
1.'39
133
138
Pattt?rn of Ownt?rship in Baking Ind~strY in Punj3b 139
Fattern of Ernt?rgt?nce af Baking Unl~S in Punjab 140
vi
5. 13
5. 14
5.15
5. 16
5.17
7. 1
7.2
7.3
7.4
7.5
7.6
7.7
7.8
7.9
7.10
7. 11
7.12
7.13
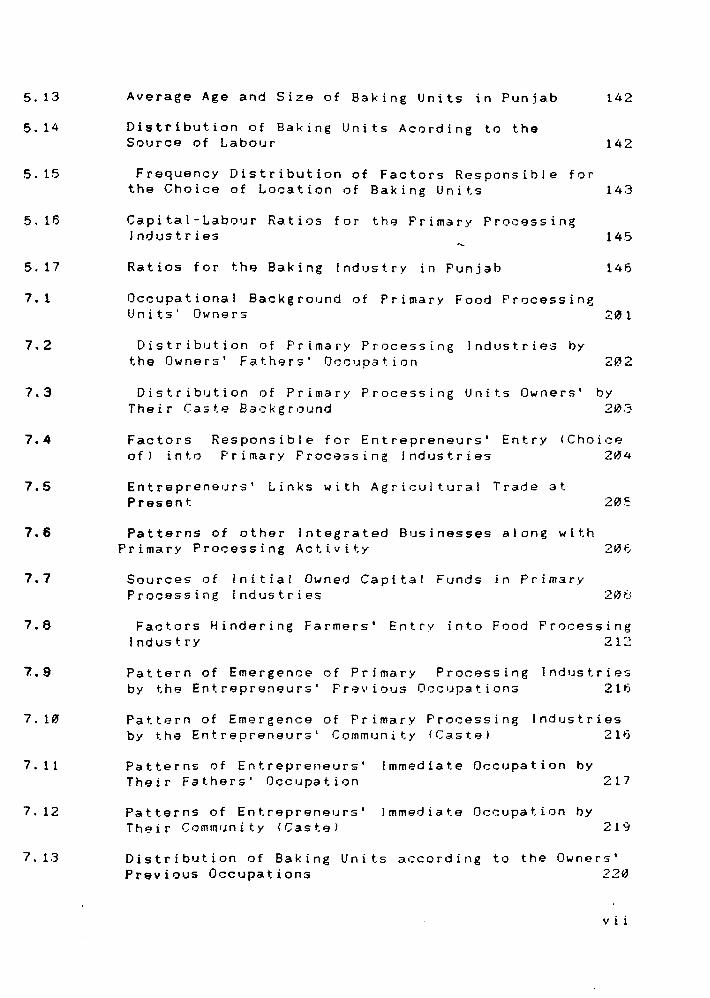
Average Age and Size of Baking Units in Punjab 142
Distribution of Baking Units Acording to the Source of Labour 142
Frequency Distribution of Factors Responsible for the Choice of Location of Baking Units 143
Capital-Labour Ratios for the Primary Processing Industries 145
Ratios for the Baking Industry in Punjab 146
Occupational Background of Primary Food Processing Units' Owners 201
Distribution of Primary Processing Industries by the 0 w n e r s' F Cl. the r s' 0 c C IJ P -3 t ion 20 2
Distribution of Primary Processing Units Owners' by Their Caste Background 203
Factors of) into
Responsible for Entrepreneurs' Primary Processing Industries
Entry (Cho i .:e 20'4
Entrepreneurs' Links with Agricultural Trade at Present
Patterns of other Integrated Businesses along with Primary Processing Activity 20'6
Sources of Initial Owned Capital Funds in Primary Processing Industries
Factors Hindering Farmers' Entry into Food Processing Industry 212
Pattern of Emergence of Primary Processing by the Entrepreneurs' Previous Occupations
Pattern of Emergence of Primary Processing by the Entrepreneurs' Community (Caste)
Industries 216
Industries 21 tj
Patterns of Entrepreneurs' Immediate Occupation by Their Fathers' Occupation 217
Patterns of Entrepreneurs' Immediate Occupation by The i r Com m IJ nit y (C as t; e ) 2 1 9
Distribution of Baking Units according to the Owners' Previous Occupations 220'
vii
7.14
7.15
7. 16
7.17
Distribution of Baking Units by the Owers' Occupation
Pattern of Caste Background of Baking Units Owners
Fathers' 221
223
Frequency Distribution of Factors Responsible for t.he Choice of Indust.ry 225
Distribution of Baking Units According to Other Integrated Businesses 226
\' i i l
(
S. No.
1.1
1.2
3. 1
LIST Of MAPS
Map
Punjab and its Districts
Study Districts in Punjab
Geographical Regions of Punjab
Page
11
21
65
ix

•
Chapter 1
INTRODUCTION
The phenomenon of Green Revolution in Indian
agriculture. which was in fact experien~ed only by a few
crops (mainly wheat and rice) and a few regions ( Punjab.
Haryana, and parts of U P, A P and Tamilnadu) has been
subjected to a very critical analysis and evaluation fro.
various aspects by the researchers. However. the process of
agro-industrialisation which accompanied and fol lowed this
transformation of the agrarian sector in these regions has
not been studied in equal detail.
various aspects of this process is
The understanding of
important because agro-
industrialisation is a step
early stages of development
towards industrialisation in the
in agricultural economies. In
this context, this study looks at the process of agro-
industrial isation with special reference to food processing
industries, as it took place in Punjab during the Green
Revolution and post-Green Revolution period.
There
development.
have
the
been many
dominant
approaches
one being
to
the
promoting
route of
industrialisation. However. the experiences of developing
countries
development
industrial
in their endeavour to achieve growth and
have led to the realisation that the model of
development which took place in the developed
world does not suit the conditions in the developing world.

Thus. there has emerged a strategy of development which tries
to work through the development of resource-based industries
and in the literature it has come to be cal led the theory of
agro-industrial development. The philosophy behind the modern
concept of agro-industriai development is to integrate
industry with agriculture for planned, harmonious and
balanced growth of the two; encompassing al I the operations
from primary production through processing to the marketing
of final products. including by-products.
Agro-industry seeks to usher in a new culture, -an
agro-industrial culture-, wherein agriculture and industry
are in t e r - lin k ed ina f r u it f u I, flo uri 5 hi n g pa r t n e r 5 hip,
adopting modern technological innovations and management.
techniques and profitting from them in either or both the
fields (Rao, 1984) .
development-, could be
'appropriationism' and
concepts represent parallel
Alternately,
defined
'substltutionism' .
-agro-industrial
in terms
These
of
two
processes and broadly correspond
to the industrialisation of rural production and of the
final agricultural produce in terms of industrial production
of agricultural inputs and the processing and distribution
of food (Goodman et. at. 1987, p. 2).
I t is in this process that different aspects of
agricultural production become tra.nsformed into specific
sectors of industrial activity. UHIDO (1983) observes that
the vertical (backward and forward) integration in food
industries has led to a situation ·where the food industries
do not play the role of intermediary between agriculture and
industry. Rather, they introduce the industrial mode of
production into agriculture in order to transform the agro-
food system into a network of factory-style operations
But the mode I, however success f u I, is scarce I y adaptab I e to
conditions in the developing countries· (p. 249).
However, it is not an agro-based industry, but an agro-
integrated industry which is important because an industry
can be agro-based yet completely divorced from agriculture
or the land and farms from where the production comes along
with
(Rao
the growers and producers of the crops processed by it
1964). This assumes significance in a developing
economy like I nd i a. and especially a state
given the
industries
land constraint and the important
in integrating employment and
generation with a more efficient use of
I ike Punjab;
role of these
value added
the land-based
product. In fact, the agro-industrial development approach
leads one to the Resource-Based Industrialisation <RB ( I
strategy for development which was elaborated by the UNCTAD
in the late 19605 (Wall, 1987, p. 611.
The significance of agro-industries lies in the fact
3
that they create employment opportunities, mobilise
investible resources from the rural sector. promote
agricultural production. make use of local resources. add
value to the farm product. improve product quality. achieve
efficient marketing. combat rural-urban migration and promote
industrialisation in an agricultural economy. According to a
criterion laid down by the Planning Commission and approved
by the National Development Council, an agro-industry is one
which -
a) encourages greater input into agriculture;
b) leads to better processing and conversion of agricultural
commodities;
c) ensures high returns on processed goods, and/or
d) increases agricultural productivity (Venkaiah, 1967,
p. 22).
Alternately, there are two types of agro-industries -
processing and servicing. In other words, industries which
utilise agricultural produce as inputs and those which
produce agricultural inputs and services.
study deals only with the processing
worthwhile to look at the expected role of
in the development process. According to
Since the present
industries, it is
these industries
the Agricultural
Credit Review Committee (ACRC) of the Reserve Bank of India
( 1998 ) , agro-processing industries are -those which use not
less than 50 per cent of the raw material fro. agriculture
4
and where
undertaken
the value added as a result. of the processing
is not more than 50 per cent of the final value
of output- (p. 881).
During the early stages of industrial isation, when
agriculture accounts for 50 per cent or more of the gross
domestic product in a developing economy (Kuznets, 1966, p.
121), these industries provide a sound basis for industrial
development since they not only reduce agricultural output
wastage, but also create time, place and form utilities into
the product by way of processing, besides the general
advantages from these industries as mentioned above while
discussing the importance of agro-industries in general. A
UNIDO (1983) study observes that,-during the early stages of
a country's industrial isation, the role played by the agro-
food industries is so vital that failure to fulfil one of
these functions may slow down or even bring to a halt, the
whole development process in the economy- (p. 247). Thakur
in the (1985) also emphasises the role of these industries
initial stages of economic development.
Though the importance of agro processing industries
depends on the nature of the produce and the ty pe of
processing involved, they are expected to play, on a-priori
grounds, an important role in promoting agricultural
development at least in those areas from where the raw
5

materials are drawn. Viewed from this angle, an assessment
of the feedback effects of processing industries on the
bus i ness of farming in the hinterland, forms an important.
part of the role of processing industries in development.
The second facet of their role is to bring about a
greater integration in agricultural marketing. This
integration may be of two types (i) vertical integration
and (ii) horizontal integration. Whereas the former refers
to linking together of successive functions or operations in
the production or marketing of a product under unified
control. the latter type means linking of different business
units doing similar operations or in the same stage of
production or marketing under unified control. Whatever may
be the form of integration, processing generally leads to the
tying up of different on-farm and off-farm functions such as
production,
distribution
Within
storage, transportat ion, wholesal ing and
<Kahlon and George, 1966, p. 42-43).
both functional as we II as institutional
approaches to marketing, processing forms an integral part
of it. In
create forlll
fact, the
uti I ities,
modern processing plants not only
but their integrated structure,
combining processing and distribution has ted to
of place and time utilities as well
1977, pp. 131-133).
..
(H i I I and
the adding
I ngersent.
6

Food processing industries have been and are among the
mos t important industries during the early stages of
industrial isation of an agricultural economy in almost all
the countries of the world and it seems to be a logical step
in the process of industrial isation {Hoffman, 1958, p. 3U.
The growth of these industries not only reduces raw material
losses and generates off-farm employment, but al so
encourages agricultural production through assured market
and remunerative prices and adds value to the primary
product in various ways. The processed foods can be
promising item in the eKports from the developing countries
and thus, it may hel p in saving and earning foreign exchange
(Rao, 1986, p. 8). Apart
the growth of
from this,
indus tr ies
these
like
industries
packaging. stimulate
processing equipment. by-product extraction. etc •• This
multiplier-type effect is important.
In fact, food processing has become very important in
the agro-industrial chain of production. In the processing
of food, four
agricultural
forms Can be differentiated - {11 to conserve
products; {2 I to transform agricultural
produc ts ; ( 3) to process agricultural produce into a new
food product, and (4) to split-up agricultural products
into components which may be used in a broad spectrum of
final food and/or non-food products. The introduction of
7
bio-technology into food processing impl ies that the linear
organisation of food production from a specific agricultural
product to a speeif ic food product has collapsed and in this
process, the technological changes in food processing can
have a big impact on socia-economic developments 1n
ag r i cu I ture (Rui venkamp, 1987, p. 59) . According to Austin
(1981) the transformation of food or a3ricul tural product can
occur at four lellels ranging between primary minimUBl
processing like cleaning and grading etc. and highly
sophisticated
texturisation.
processing like chemical alteration
As the transformation of raw material
and
mOlles
from primary level to sophisticated levels, the linkages with
the farmers and agriculture get reduced and the lIalue added
as well as the price of final product rise.
The food processing industry can broadly be classified
into
which
two categories
process the
one, primary processing industries
agricultural output into a standard
product at a minimum cost, often relying on a by-product for
profitability. These industries are generally less capital
intensive and less sophisticated and perform an essential
function ellen in developing economies. It inc I udes
preserving and simple processing like rice milling, wheat
fJour, etc. On the other hand, secondary processing
industries use the products of primarY processing industries
as inputs to produce identifiable, differentiated, packaged
food, often marketed with branding, advertising and
promotion and they make real or apparent product
innovations. These industries include baking. vegetable
oils, instant foods, etc (Burns, et. at. 1983).
This discussion reveals that food processing industries
lead to greater agricultural stability through the price and
market suppor t, greater employment opportunities and
increased value added to the primary
creating time, place and form utilities.
product by way of
It is from these
points of view that the proposed study assumes signif icance
in the context of an agriculturally developed regional
economy Punjab, where large agricultural surpluses,
foodgrains as well as investible ones. are avai lable. The
type of transformation which Punjab has had, may be witnessed
by the whole country, when and if agricultural growth takes
place. Therefore. it becomes desirable to look a t how
relevant these industries are in forging linkages between
agriculture and industry and in sustaining the growth of
agriculture and the rural
Punjab is experiencing the
sector because
problems of
this sector
high cost
in
of
cultivation.
(especially
ecological degradation, near stagnant yields
and the in two major crops - wheat and ricel
spectre of unemployment and underemployment.
9
Statement of the Probl ••
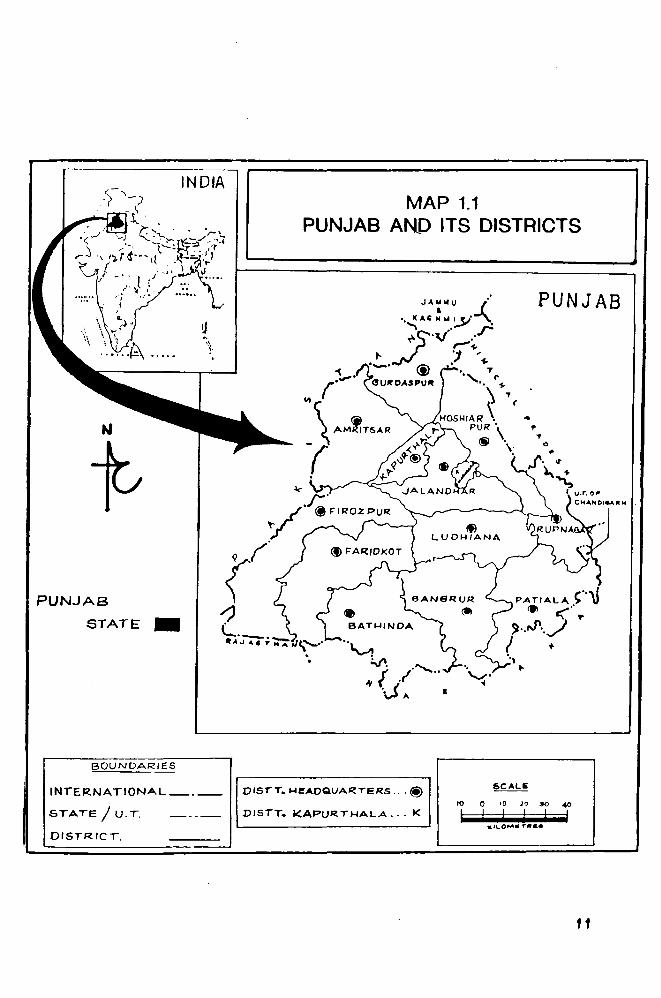
Though agriculturally and in general, Punjab (hereafter
refered to simply as State, and see Hap 1. 1 1 is one of the
most developed States in the country, agriculturally and in
general, it has its own developmental problems because of
regional specificities. Also this model of transformation
has impl ications for Indian development too. The State
economy is characterised by a large agricultural sector, a
highly grown service sector and the smal I scale industries.
The secondary sector accounts for only 15.7 per cent of
State Domestic Product (SDPI and 13.5 percent of employment
as compared to that of 52.6 per cent and 58 per cent of
primary sector and 31.7 per cent and 28.5 per cent of
tertiary sector respectively. The manufacturing sector alone
accounts for only 10.27 per cent of SDP and 19.5 per cent of
employment <data at 1970/71 prices from the Statistical
Abstract of Punjab, 19881. The State's industrial sector is
dominated by non-household industry and private enterprise.
In the agricultural sector, the benefits of the Green
Revolution of the late 1960s and early 1970s aTe tapering off
and the increasing costs in agriculture have led to the
non-viability of small and marginal holdings. The Johl
Committee (1986, Hay) observes • The NSDP worked out on per
hectare basis showed that there was virtually no increase in
10
INDIA
N
t PUNJAB
STATE _
BOUNDARIES
MAP 1.1 PUNJAB AN.D ITS DISTRICTS
. .
J.\ .... v ,..
'. I(.\C! .. 1 IP]-'\ " ,.,. ;;:
." . .. r r-", ,.. "1 ... ~ '-' @ '. .,
PUNJAB
GUItDA.sPU~ "" t'<f,
~ ., HOSI·HAI? \. ( ..
PUR' f'
@ \. ., \: O~
,f. It
~-{, , u.r.o"
PAT/ALA. r''U . .' < .. ~ .. rJ"'../ I • '"
...
INTERNATIONAL _. __ 0/51'T. J.4eAOQ.uAJ(!TERS ... @
STATE I U. T. _ •• _ l)/STT. KAPURTJ.4ALA ... K 10 0 00 10 .0 40 I! !!
... L.o"""·r .... DISTRICT.
11
per hectare income during the pe r iod 1970/1 to 1976/7.
However. there occurred an improvement starting from 1977/8
and the maximum per hectare income was realized during the
years 1977/8 and 1978/9. Thereaf ter, there was again a
decl ine in the per hectare real income. ~
The upshot of
this analysis is that even during the period when
agriculture in the state witnessed an overall fast rate of
growth, the farm incomes in real terms showed stagnation
first in early 1970s and then from the early 1980s. There is
an evidence of even a decline in the real income per hectare
from 1978/9 onwards· (p. 6).
Although the yields per hectare in most of the crops in
Punjab are the highest among the Indian states, the income
per hectare is not the highest which indicates higher cost
of cultivation in Punjab when compared to the other States
like J & K. Kerala, West Bengal, Assam, Madhya Pradesh and
Manipur (PHDCCI, 1987, July).
The cost of cultivation data for 1983/84 revealed that
in the case of wheat, the Punjab farmer obtained lower net
returns per hectare and spent more on .odern inputs per
hectare compared to the Madhya Pradesh farmer (Hadkarni,
1986, p. A-1l5). Gill (1966) also observes that the return
from investment in agriculture is falling. The rate of return
on wheat cultivation per quintal declined from 24.5 per cent
12
in 1970/71 to 1.32 per cent in 1977/78. As a consequence,
net income per hectare from wheat cultivation at 1970/71
prices decl ined from Rs. 328 in 1971172 to Rs. 54 in 1981182
( pp. 2167-68) • A recent study also reveals that the real
margin per quintal of wheat produced (at 1987 prices) has
fallen from Rs. 60 in 1972/75 to only Rs. 22 in 1984/87
(Sidhu and Byerlee. 1991 p. A-162). Chand (1991) also found
that the net income per hectare in Punjab between 1979/80 and
1983/4 had come down to Rs. 332 from Rs. 628 for wheat. to
Rs. 772 from Rs. 1216 for paddy and to Rs. (-) 484 from Rs.
212 for cotton (p. 106'. The other studies on this
phenomenon inc I ude Grewa I. 5 idhu and Rang i ( 1986). Rang 1
(1986), Bhalla and Chadha (1968). Shiva (1989), Grewal, SidhlJ
and Sidhu (1990) and Hansra and Shukla (1991' among others.
Even the terms of
since the mid 1970s.
trade have been against agriculture
Whereas the index of relative prices
of agricultural output with respect to all inputs was 90 in
1984/85, it was only 77.8 with respect to industrial inputs
alone (Nadkarni, 1968, A-117'. In the case of wheat alone, a
decrease in real wheat prices of 3.6 per cent per annu.
during 1972/75 to 1984/87 against a decline of real cost of
production of 2.9 per cent annually, impl led some squeezing
of the profit margin of the farmers (Sidhu and Byerlee. 1991.
p. A-162 and Swamy and Guiatl, 1986 p. A.-57 to A-54).
13

The small and marginal farmers experienced some gain in
their income levels in the initial period but they are now
unable to sustain it. Many smal I and marginal holdings have
become non-viable. A survey carried out between 1976/77 and
1977/78 revealed that marginal and small farmer households
were annually running into an average deficit of Rs. 1513.17
and Rs. 1'348.19 respectively. Consequently, 24 per cent of
the smal I farmers and 31 per cent of the marginal farmers
were living below poverty
21671.
line by 1979/89 (Gill, 1988, p.
The non-viabIlIty of holdings has led to une.ployment
among educated rural people. The nature and structure of
the industrial sector in the State is such that the labour
relieved from agriculture is not getting absorbed into this
sector. This problem of absorption of labour is further
complicated by the ever-declining land-man ratio and the
area under cultivation (83 per cent) which has already
reached an upper limit; and consequent ecological problems.
According to a study, the share of crop production in total
rural workers which was 51.6 per cent in 1977/78 has to come
down to 36.6 per cent by 2091
land-man ratio (Dantwala, 1988).
Market operations have an
A D to maintain the present
important bearing on the
14

farming community who have become commodity producers. The
ratio of marketed surplus to total production in wheat and
rice has gone upto 70 per cent even in the case of snla 11
farmers with holdings of less than 10 acres (Sidhu et. rd,
1998). In this situation, farm surpluses can give a severe
blow to the State economy because the production of
foodgrains even in other (consuming) States is coming up
fast. f t is in this context that the study of food
processing industries assumes significance, since they not
only create time, place and form utilities and add value to
the product, but also promote agricultural product ion
through price and market support. Besides, they are a
potential source of employment and an outlet
of agricultural surpluses.
for investment:
But for certain sections of agriculturists, especially
large farmers, the Green Revolution has led to the
accumulation of agricultural surpluses which have mostly
been used for luxury consumption and in transport rather
than investment in the secondary sec tor.
It is
industrial
generally argued that farmers of Punjab Jack
expertise and skill and hence are unable to
compete in the industrial sector where industry, at present,
lies mainly with the non-farming communities of Hindu traders
and Ramgarhias. An examination of the nature and background
15
of entrepreneurs in food processing industry will provide
.'lter-ences about the quality and ·potential of farmer
en t reprerlellrs in this agriculture-related industry. Could
it be possible for these people to enter and compete in the
industrial field through food processing industries? Also
the nature and sources of labour in these industries is an
3.spect to be studied because these industries, believed to
be labour intensive. may be able to generate employment for
the rural labour; also the nature and organisation of work
may not require,
large extent.
in general, highly skilled labour to any
Objectives of the Study
The present study looks at the growth, structure and
organisation of food processing industries in Punjab- a
predominantly agricultural econolllywhich is faced with the
problems of high cost of cultivation, lack of
diversification, rural unemployment and under-employment,
and narrow industrial base.
study are as fol lows:
The specific objectives ot the
1) an analysis of the industrial structure ot the State in
general
2) an examination of the growth and structure of food
processing industries, in particular; and to trace their
16
backward and forward linkages;
31 a look into the nature and composition of employment and
sources of labour for these industries;
41 an analysis of the nature and sources of entrepreneurship,
and investment funds in order to examine the integration
between agricultural marketing and processing, and the
potentials of entry for farm entrepreneurs in this industry;
51 an examination of the scope and potential of agro-based
industries in Punjab given, ( i I the prevailing cropping
pattern, and (ii) a changing cropping pattern scenario.
Hypotheses
The existing literature on food processing industries
and general familiarity with the study area leads to the
following hypotheses:
11 There
agricultural
industries.
is a significant positive relationship between
growth and the growth of food processinl
2) Labour employment in the primary processing industries is
seasonal, while in the secondary ones, it is perlllanent;
17

3) Food processing in Punjab is largely in the hands of
non-farming trading community and the farming sector has not
yet invested much in the food processing industries;
4) There is an integration taking
marketing and processing, and
place between agricultural
5) The agro-industries, especially the food processing
industry, can, if promoted. provide sustenance to the
agricultural and rural sector.
".thodolo.y
An analysis of the industrial structure of the State
comprises a sub-sector wise
agro-industries and non-agro
analysis
industries.
in terms of
consumer and
capital goods industries and an analysis of the regional
patterns of industrialisation at the district level. As far
as the analysis of growth and structure of the food
processing industries is concerned. the study
output. employment and value added structure.
with agricultural growth especially cropping
looles into the
relationships
pattern at the
district level. and the scale of operation of units. This
is based on both secondary and primary information.
On the other side, an examination of the nature and
sources of labour in food processing industries. both
18

primary as wei I as set::ondary, is an attempt to find out
whether employment is seasonal or permanent, and to know who
are the people employed in these industries? The analysis of
nature and background of entrepreneurship and the source of
investible funds provides an idea abo~t the
between marketing and processing, extent of
integration
investment of
invest.ent by surpluses and the potential for agricultural
the farmers. The backward as wei I as forward integration
has been studied by collecting information regarding the
ownership of stores, transport and distributional network
by the processors and their professional background and the
present al lied/main occupation. This part of the analysis
concerning labour and entrepreneurship is studied with the
help of primary data collected through questionnaires.
50 far as the selection of a sample of food processing
industries is concerned, a choice of certain categories of
industry was essential since the sector is so diverse that
it encompasses al I processing activities from the primary
Keeping in mind, type to highly sophisticated processing.
the employment and value added significance and the
the relevance of industries to the cropping pattern in
5ta teo it was decided to take a sample of both primary as
well as secondary processing i nd us t r i es. The
processing industries were rice .il Is and oil mil Is,
the secondary processing industries included
priIRary
whi Ie
bakery
19

products and fruits and vegetable processing, though in the
case of the latter industry, sufficient number of units were
not available and
analysis.
thus, it was dropped from the detailed
Since Punjab has regional diversity both in agricultural
as weI I as industrial deve I opmen t, it was cons i dered more
desirable and useful to take the sample of selected
industries from two different districts one.
agriculturally and industrially developed, and the other
relatively backward in both these respects. Viewed from this
angle. and with an element of convenience, Ludhiana and
Bathinda
Ludhiana,
seemed
as is
to be the logical choices (see Hap 1.2).
well known. is the pioneer in both
agricultural as well as industrial development. It
highest yields of the major crops in the State as well
the country. Industrially also. the district stands
has the
as in
apart,
accounting for 29 per cent of the industrial employment in
the organised sector. It is the production centre of many
consumer durables like bicycles and components. sewing
machines. hosiery garments, etc., and food products as well.
besides many small scale manufacturing activities.
On the other hand, Bathinda, though considered to be a
beneficiary of the Green Revolution, sti II lags behind both
in agriculture as well as in industry. The district has one
2"

t-,) ..
N
~
t (f)
t<
2 v-).
y J .-
\ '- ,- " , ... ,--_ .... )......... -~.l
( I
'Y
...
.3
•
~ )'
DISTT. 1-4 EAOQUAR'-ERS
TA .... SIL , ,
PUNJAB
..
®
•
MAP 1.2 STUDY DISTRICTS IN PUNJAB
BOUNDA~IES
INT"ER NATIONAL...
SrATE/U.r • .oIST"J<:ICr
T"AH51L...
LUDHIANA
, " T • I C. T
." .... NO lt4A •
r ~ ,
~
e· ,,/
r..J "l / ?
I
"'I' ~ -. " • •
( , I
r " ..
-
I. BATHINOA lIlll 1. L U DJ-4IA NA IDI
2 . ~AMPU~A 2. JAGRAON
.3. TAL WAND/ .:!S. SAMRALA
4· MANSA 4· KHANNA
~
10 0 I. .&0 ... 0 •• ~
J(1L..OM&TA&6

of the lowest employment shares (4.35 per cent) in the total
industrial employment in the organised sector. Certain
pockets of the district still suffer from lack of irrigation
facilities and the district has mainly cotton-wheat crop
rotations as compared to the paddy-wheat and
crop-patterns of Ludhiana district.
more than two
In terms of development ranking of districts by the
Centre for Monitoring
Ludhiana was at the top,
Indian Economy ( CMI E ) , whereas
Bathinda occupied only 7th position
~nd its development index was equal to that of the State as a
who I e.
rank and
Another study also found Ludhiana at the highest
Bathinda at the lowest (Kant, 1986) • In the
industrial sphere alone, in 1978/9, whereas Ludhiana topped
in terms of per capita industrial output in the small scale
as well as
the second
in large and medium scale sectors, Bathinda had
lowest per capita output in the medium and large
scale sector and the fifth lowest in the small scale sector.
With respect to the number of industrial workers pel'
1000 of population also,
the sma I I sca Ie sector,
Ludhiana had the highest rank in
third in the large/medium scale
sector and the highest rank in the total industrial sector.
On the other hand, Bathinda had the lowest rank in the sm~11
sca I e and the tota I indus t ria I sectors and the second lowest
in the medium/large scale sector. Ludhiana was again at the
22
top in terms of number of industrial units per 1"" squarFl
kilomet.res of area. Bathinda occupied the bottom position.
Even in terms of per capita investment in plant and
machinery, Ludhiana topped the list in small scale sFlctor and
occupied third rank in large/medium and total industrial
inllestmFlnt. On the other hand, Bathinda had one of the
lowest per capita industrial
1982 & 1983).
investment (Bawa and Sharma,
From within these two districts, a selection of blocks
was made
respectively.
taking
The
one forward. and
sample consisted
one backward
of registered
scale industries and the unorganised sector units.
block
slla I I
The
sample was taken up on the basis of the list of registered
units available with the District Industries Centre
the district level.
(DIC) at
The Study District.
Ludhiana is one of the central plain districts of the
Punjab state whereas Bathinda is one of the three cotton belt
districts. Ludhiana has 18 blocks and 42 per cent of the
population is urban. In Bathinda. which has 9 blocks. only
22 per cent of the people live in urban area. Also, Ludhiana
has a much higher density of population (472 per square kD.)
than that in Bathinda (235) • In terms of literacy a I so,
23
Ludhiana with 50.6 per cent in 1981 was far ahead of Bathinda
(27 per centl (see Map 1.2).
Though the percentage of workers in the total population
was same (30 per cent) in both the districts. Ludhiana had
much higher cropping and irrigation infensities. Even the
yields of most of the crops (rice. wheat. maize. and
sugarcane) are much higher in Ludhiana than in Bathinda. In
the industrial spheres too, Ludhiana had 2867 factories
against 429 in Bathinda and 83810 workers therein against
only 10191 in Bathinda. The per capita net incoae in
Ludhiana stood at Rs. 1814 against that of Rs. 1598 in
Bathinda (District Statistical Handbook, Ludhiana and
Bathinda, 1987).
Source. of Data
The study utilised both secondary as well as primary
information. One part of the analysis is based on secondary
data. The sources of secondary include
Statistical Abstracts of India and Punjab, Bulletin of Food
Statistics, Annual Survey of Industries, Census of India and
Punjab, National Salllple Survey, Punjab Agricultural
University Reports and Publications, Reports of the Punjab
Agro-Industries Corporation and the District Industries
Centres (DICs) documents. The aspects of labour and
entrepreneurship required primary information which was
24
collected through structured questionnaires and interviews.
Limitations of the Study
It is important to clarify that the present study is not
to be about the economics of tood processing intended
industry. What is attempted is an exami~tion of the process
of agro-industrial isation in Punjab in the Green Revolution
and post-Green Revolution period
food processing industries.
with special reference to
Though the study is based on both primary as we I I as
secondary sources of data, the analysis of relative
efficiency is based only on secondary data. It is 50 because
neither was it deemed fit nor was it possible to obtain
information on price and cost variables from the smal scale
un its. The emphasis of primary enquiry was more on the
qualitative aspects of food processing sector in order to
understand better the process of agro-industrialisation.
Even the secondary data analysis pertains only to the 1980s
because the information on the small scale sector before
1980s was not available.
Fur ther, though the survey intended to cover another
secondary processing industry (fruit and vegetable
processing), besides bakery industry with a view to take care
of an alternative cropping scenario, the non-existence of
25
sufficient number of units in the study districts made it
necessary for us to restrict i t to only one secondary
processing industry. However. wherever found desirable, we
have tried to make use of the data on this industry collected
from a few units in one of the districts.
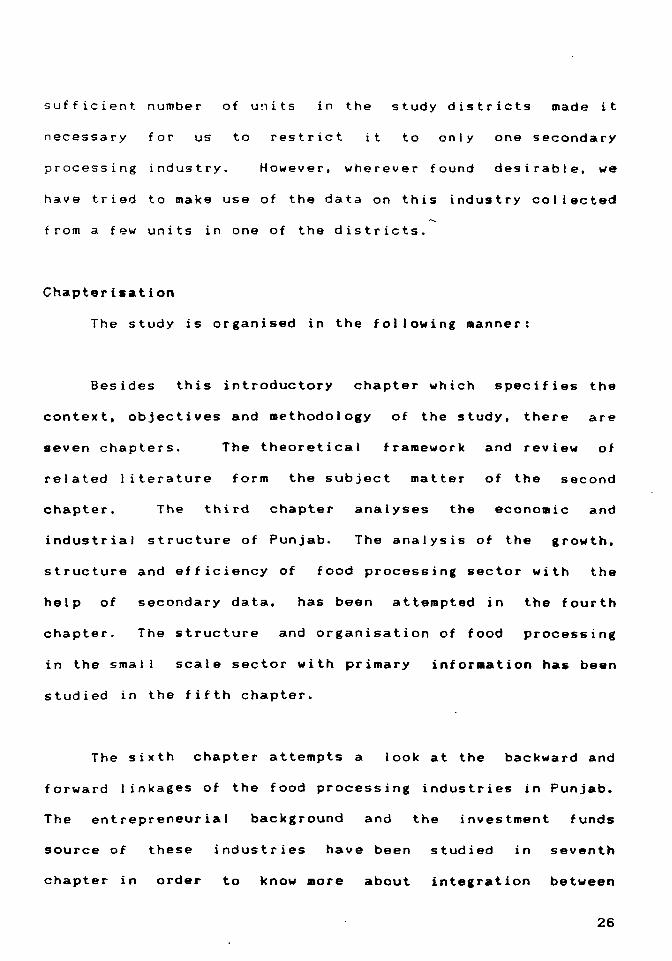
Chapterisation
The study is organised in the following Manner:
Besides this introductory chapter which specifies the
context. objectives and methodology of the study. there are
seven chapters. The theoretical framework and review of
related literature form the subject matter of the second
chapt.er. The t.hird chapter analyses the economic and
industrial structure of Punjab. The analysis of the growth,
structure and efficiency of food processing sect.or wit.h the
help of
chapter.
secondary data. has been attempted in the fourth
The structure and organisat.ion of food processing
in the sma I I scale seclor with primary infor.alion has been
studied in the fifth chapter.
The sixth chapter attempts a look at the backward and
forward linkages of the food processing industries in Punjab.
The entrepreneurial background and the investment funds
source of these industries have been studied in seventh
chapter in order to know more about integration between
26

Chapter 2
REYIEW OF LITERATURE
The study deals with the problems of ~evelopment of an
agriculturally developed economy with a small industrial
sector. So, the I iterature reviewed
with questions of the process of
structural changes with development,
in this chapter deals
industrial isation,
agriculture-industry
balance and the specific subject of processing industries,
including some studies on the Punjab economy in particular.
Given this,
literature
it was
into
regarded as better
certain categories
to classify the
as f 0 I lows: a)
~ndustrialisation and structural change, b) food processing
industries and c) studies on Punjab economy. However, the
review of theories and studies on agriculture-industry
linkage and the entrepreneurship is attempted in the chapters
6 and 7 respectively in order to faciltitate a proper
perspective on the issues dealt with therein.
2.1 Industrialisation and Structural Chan, ••
Industrialisation is a central problelD of econolDic
development of developing countries, because it is closely
inter-related with social and cultural development, with
eConomic development as a whole and, within that, with the
Irowth of other branches of the economy, particularly
alriculture. Ashoff (1991) views development as a process of
28
especially in terms of industrialisation ( p.
73) • Industrialisation is a process through
agricultural economy turns into a more advanced
which an
industrial
economy, and the development of industry means the further
crowth of an already existing industry.
According to the U N Committee for Industrial
Development ( 1963' • - Industrialisation is a process of
economic development where an increasing proportion of home
resources is mobil ised to establish a technically up-to-date
and diversified economic structure. The econolllY 1s
Characterised by a dynamical processing industry producing
of production and consumer goods suitable for making
the fast development of the whole national economy and the
economic and social progress sure- (Cukor, 1974, p. 9'.
Ideas about industrial isation in the developing
countries have undergone radical changes. Today, in the
literature on the economic development of the developing
countries, . the question whether industrialisation is
necessary, is no longer discussed. What is discussed is how
to industrialise these economies? Similarly, the question
of according priority to agriculture or indus try in the
development process is superfluous today. In thi~ case. the
question is how and in what order. can agricutt!.lY4' and
industry be developed? According to Eugene ~ 1954 I
29

-Agricultural
is industrial
improvements cannot go very far unless there
development to take up the released manpower
and to provide a sol id technical base for the equipment and
services essential for modernised agriculture-<p. 304) •
Similarly, Cody et al (1980) argue that -Industrial growth
and accompanying urban development are necessary to relieve
pressures on agricultural I and and permit its increased
productivity, provide markets for primary producers and
supply competitively priced manufactured goods
and other sectors· (p. 3).
the other hand, agriculture is
for consumers
a Iso e q ua I I y On
important
provides
for industrial development because it not only
inputs to the industry in the form of foodgrains.
other agricultural output and labour, but is also a source
of demand for industrial products and of investible
surpluses {Awasthi, 1987/. I< N Raj (1976/ has explained the
link between fluctuations in agricultural incomes and growth
of small industries in a region. The role of agricultural
growth as a potential source of investible surpluses has
been emphasised by Bharadwaj (1982/. According to her. this
explains the higher rates of industrial growth in parts ot
North India where a breakthrough in agricultural growth was
achieved in the early 1970s. Thakur (198S) also observes,-In
view of the correlationship between growth rates of
agricultural income and total national incolle. this movement
(away from agricultur~) should be balanced by efforts to
improve the growth of the agricultural sector with a view to
securing a higher growth rate and rise in per capita income.
This leads us to suggest that in the initial stages of
development when the preponderance of the agricultural sector
can not be diminished, the efforts at industrialisation
should be preceded or balanced by plans to improve the growth
of the agricultural sector or else the overal I growth rate
wil I turn out to be too low to ensure an appreciable rise in
the per capita income w (pp. 112-3).
The relationship between agriculture and industry has
been emphasised by Ahluwalia (1987), Mundie (1965) and Mody
( 1981) as we I I • Johnston and Kilby (1975) argue that wThere
is one more very important inter-sectoral commodity flow
involving agricultural produce which is not picked either by
farm cash receipts or expenditures. This is value added to
the farmers' food and other crops after he has sold it and
before it reaches the final consumer. In addition to
marketing proper, it inc I udes process i ng. 9 torage, trans por t
and distribution w (p. 69).
In f ac t, the problem is not one of deciding on an
agricultural strategy, as oppposed to an industrial strategy
but rather to recognise that the development of manufacturing
does not preclude the development of agriculture. They are
31

mutually dependent; the problem facing the less developed
countries is not one of choosing between primary and
secondary activities but rather one of ensuring the balanced
expansion of al I appropriate sectors of the economy <World
Bank, 1977, p. 9). The initial stimulus to industrialisation "
should come from agriculture which is an i~portant source of
income. savings and investment. The superstructure of
industrial development could be built-onlY on the so I id
foundation of viable and dynamic agriculture with a high
level of productivity (Thakur, 1985, p. 121),
On the process of structural changes, Kuznets (1966)
writes, -A sustained increase in per capita or per worker
product is most often accompanied by an increase in
population and usually by sweeping structural changes. In
modern times, there were changes in the industrial structure
within which product was turned out and resources employed -
away from agriculture towards non-agricultural activities,
the process of industrial isation •.. • (p. 1). Cukor (1974)
argues that -It is typical in economic progress that, at
first, the share of secondary sector grows at the expense
mainly of agriculture, and later the tertiary sector grows
more quickly while the share of primary sector essentially
diminishes and that of the secondary also declines somewhat-
(p.23).
32
Rao (1986) argues that the alarming feature of economic
gr0wth in developing countries is not the change in their
sectoral shares in gross domestic product which is following
the cl3ssical pattern or a rising share for industry and
f 3. I lin g s h a I' e for a g I' i c 11 I t IJ I' e • but the employment linkages
with the changing sectoral shares and the level of
pro d IJ C t; i v i t y per worker. accompanying the change. This lag
between the fall in the share of labour force and that. of the
gross domestic product of the a g I' i c IJ I t IJ I' e sec tor is the
major problem which leads to many undesirable consequences
slJch as f a I I in the a g I' i c IJ I t u I' a I I abo'J I' prod'Jct iv i tv.
underemployment and unemployment in rural areas. etc. The
other studies include Khusro (1962), Johnston a.nd Kilby
( 1975). VyaslJ I u { 1977 I. Chenery (1979), BISR (1980). and
Kainth and Bawa (1985). among ot.hers.
That the process of s t I' UC t u I' a.1 changes wit h
industrial isation in the beginning. is accompanied by the
growth of processing indus t ry, has been emphasised in the
I iterature on industrialisation. Hoffman (1958) argues that
consumer goods industries always develop first during the
process of industrialisation. According to B'Jchanan and
E I lis. RThe beginning of industrial isation is ha.rd I y
dis tin g IJ ish a b I e from the developing and modernisation of
a g I' i c IJ I t'J I' e . This kind
appears in the form of
of
a plant
industrial isat.ion freq'Jently
serving the processing of
33

agricultural products and making feasible a more diversified
cultivation of land w (Cukor. 1974, p.67). Ashoff (1991) also
views Wagro-related industrial isation· as the second phase in
the process of industrial isation in small industrial ised
countries Cp. 73),
This review of theoretical positions on the process of
industrialisation
agriculture as wei
and development suggests that both
as industry are vital in this process and
are interdependent. What is required is the balanced
development of both and in this, processing industries act as
a crucial I ink between the two.
Most of the studies on agro-processing industries have
been management-oriented with a few exceptions which
However, there have also explored problems at
been a few studies
industries on the rural
location.
on the
economy.
impact of food processing
, One such study (Desai and
Narayanan. 1967) looked into the direct and indirect impact
of the modernisation of dairy industry on the economy of a
Gujarat district and found that besides creating additional
employment and value added,
and cattlefeed, though no
observed.
it led to improvements in cattle
impact on cropping pattern was

r;l ~38. 4.+6 G4{) ~:S+ 'SS-!t, S\N
A UNIDO (1983) study of agro-food industries points out
that the achievements of the food industries have been
disappointing because they have been unable to meet the
massive needs generated by domestic urbanisation and
industrialisation and they have exercised a negative
influence on the agricultural sector by displacing staple
foods for industry-oriented crops. The role of these
industries under the Resource-Based Industrialisation (RBII
strategy has also been recognised by a study which deals
with the economy of Malawi ILivingstone, 19841.
Rangi (19861 analysed the marketing and processing of
paddy in Punjab with particular emphasis on marketed surplus,
marketing channels, pricing efficiency, and adequacy,
location and efficiency of paddy processing units. The study
revealed that marketed surplus was positively and
significantly affected by the volume of production and the
level of paddy prices but negativelY by farm consumption.
Though the rice millers dominated the paddy purchase, the
share of procurement agencies was rising in the more recent
past. The proportion of paddy passing through each channel
was found to be dependent on the level of procurement price,
price of levy rice, stock of foodgrains with the government,
and the open market price of rice in the consuming markets.
The paddy markets in the State were found to be well-
'OS f r: l'tH':"nV ~HNG~lr')RE
~". l'i -.G. .. '1!~-r:t. - _ ..... -~1' b' Cf6"
35

integrated and inter-dependent. on each other for price
formation. The prices in various markets moved in unison and
the spatial price differentials and inter-seasonal price
differences were not in excess of transportation and storage
costs. This indicated the high pricing and operational ~
efficiency in the system of paddy marketing in the State.
It was fOlJnd tha.t the mi II ing capacity fell short of
production in the 197f1s and this led to wastage of output,
and the State lost in terms of employment: and income
opportunities. But, at present. the capacity matches the
marketed surplus in the State. The study also pointed to the
uneven distribution of milling capacity at the district level
and suggested setting up of more units in deficit districts.
It also recommended research to make better use of by-
products of rice industry.
Another study (Venkaiah. 1987) in this genre. which
analysed the impact of food processing industries (sugar.
rice. tobacco and khandsari) on the rural economy of Andhra
Pradesh found that social and economic impact of these
industries on various sectors of rural population differed
from industry to industry depending on the nature and size
of industries.
In another study. Goodman and others (1987) while
building up a theory of agro-industrial development. also
36
recognise the role of processing industries in this proc ess
along with the input-based industries, through what they cal I
and ·substitutionism·. Whereas the eappropriationism·
appropriationist capitals are associated with rural
production process and the primary transformation of crops;
substitutionism capitals are involved in the later
that downstream stages of food manufacture. They also note
the partial appropriation which constitutes agro-industries,
has enhanced the total factor productivity of land based
production rather than threatened its existence (p. 18), but
these agro-industrial systems have undermined the importance
of farming in value added to the product.
The study examines the industrial substitution of rural
product in the case of food processing industries like flour
milling, dairying, canning and refrigeration, meat packing
recognise the and margarine in the United States. They
crucial potential role of bio-technologies in agriculture and
food processing which they term as ·bio-industrialisation-.
Srivastava (1989) observes that by-product processing of
major agricultural commodities, intensification of degree of
processing and capital intensive high-tech methods of
processing are some of the new trends in food processing in
India. It is suggested that food processing be viewed as a
system in the sense that each commodity wil I have a system of
37
its own
handling.
consisting of product ion.
processing. and marketing.
storage,
This is
transport.
important,
according to Srivastava, to understand the linkages between
various sub-systems and in order to develop an integrated
view of policy support. He dwel Is on the factors which have
direct or indirect bearing on the organisation and management
of agro-processing units, such as nature of raw
cost of processing, nature of processing
structures
material,
technology, degree of product integration, and potential for
primary producers' participation.
Desai
financial
et. a I . ( 1991 ) analyse the main features and
performance of the selected food processing
industries in India on the basis of secondary data in order
to draw
policies
relative priority among them and identify broad
to improve their development and
performance. The industries studied include
financial
grain Ifti 11
products, sugar, gur and khandsari, dairy products, vanaspati
and hydrogenated oils, and other ed i b leo i Is. The authors
point out that sustained high growth in primary output was
absolutely necessary for higher growth performance of these
industries because it not only relaxes the supply of raw
material constraint but also relaxes the demand constraint.
The analyses of intensities, efficiency in reSOurce use,
and profitability showed that dairy products was least labour
38

intensive. highly and had high profitability
i n d IJ S t r i e s • hand.
analysis of financial performance in three industries Igrain
mil I prod'Jc t'5,
raw material as wei I as
working capital intensive. The financia0 analysis based on
current assets and I iabilities of companies' data showed that
grain mi II industrY was performing better both in private as
wei I as in publ ic sectors. Finally, the financi.al
performance analysis of co-operatives in oil seeds, milk, and
rice mi II ing showed that for two of them (rice and oil), the
co-operatives do not have an advantage over other
organisation.
forms of
2.21 Agricultural Growth and Food Processing
Thapar (1971) studied the impact of Green Revolution on
industrial development in
Haryana) during 1966-1969.
the Punjab region
His study revealed
(Punjab and
that direct
local level effects of Green Revolution on industrial
employment were positive. But the study did not make any
The author attempt to measure the 'employment multiplier'.
followed this study by a ~ore detailed study (1972) of five
districts of Punjab and Haryana but the results of the study
were found to be sensitive to (i)
of 19605 and Iii) the time lag for
effect. However, he concluded
the industrial recession
the
that
realisation of
small scale
39
=
industries in the agro-based sector were not growing fast as
compared to the large agro-based industries. This 1oI3S
particularly true in the case of Punjab. Also, the growth
slower in small of smal scale agro-based industries was
towns.
Papola (1987) examined the 1 eve I, structure and
functioning of the rural
agricultural growth in Uttar
industries in relation to
Pradesh and revealed that
non-traditional industries like food and oil products had
higher levels of productivity and growth and used hired
labour quite substantially. While making an inter-state
comparison of rural industries' structure and performance, he
concluded. wThere is no doubt that the relative size of the
agricultural sector and the extent of rural industrial
activity go together simply due to the size effect •.. but
Punjab and Madhya Pradesh with large agricultural production
have a relatively smaller rural industrial sector- Cpp. 64-
65) •
The analysis of inter-sectoral linkages in Punjab
(Bhalla et ai, 199~) reveals that though agricultural growth
led to many direct and indirect I inkage effects, the has
total effects of direct, indirect and induced demand on the
state economy is considerably reduced because of large scale
imports of intermediate inputs and consumption goods. The
4~
gains of Green Revolution are therefore, increasingly shared
with the rest of the country.
Further, the study points out to the export surplus
nature of the economy wherein considerable parts of State's
savings are being used for investment outside the State. It
is pointed out that a major challenge for pol icy makers is
to encourage investment of these savings within Punjab. The
study emphasises the importance of agricultural growth and
market towns in terms of the widespread effects on the other
sectors of the economy. But this was possible only in a
constrained open economy context I ike India, where Punjab
could benefit from the large market and reap fruits of
special isation.
2.22 r.chnoJo.y in Food Proo ••• in.
On the technological aspects of food processing
industry, there have been two studies, both in the case of
Eastern Carribean Common Market (ECCM) states and Barbados.
Dellimore (1979) identif ied four areas of technological
decision making consumption technology, process
technology, plant technology and organisational technology.
As far as the factors influencing the rate and extent of
technology assimilation are concerned. the study with the
help of a survey of food processing firms conducted in 1976,
41
revealed that 'Ownership and size of the enterprise did not
appear to be
assimilation of
this regard was,
signit icant
technology.
apparently,
factors
The most
the level
in the level of
important factor in
of complexity of
technology and its relationship with assimilation was
inverse· (p. 76) • The lack of organisational effort to
acquire technology, orientation towards the use of imported
semi-processed raw materials and the disorganised state of
agriculture were the organisational technology factors
responsible for the failure to develop greater technological
capability and local resource based agro-industries. I t is
suggested that acquisition of small scale processing
equipment is crucial to the forging of backward linkages
with agriculture and accelerating the growth of
agro-industries· (p. 83).
On the other hand, Whitehead (1979) concentrated on the
secondary food processing industries to examine the economics
of production and the forces which influenced and
circumscribed
the survey of
technological decisions.
41 food processing firas
The study based on
revealed that the
firms were engaged with fin1shinl touch activities. using
imported semi-processed inputs in order to minimise risk -
both operational as well as market and this. consequently
led, partly. to low linkages of these industries with the
rest of the economy. especially agriculture. A Iso. heavy
42

dependence on foreign expertise and decision making led to
inappropriate scale of
(p. 18.3),
plant causing general excess capacity
Unl ike Dellimore, the nature of ow~nership and operation
of firms were found by Whitehead to be behind the given
production structure and they limited the range of products
that could be manufactured locally (p. 158). The ownership
control at the local level was found to be more useful since
it did not only lead to the use of domestic primary
resources and increased employment in agriculture, but also
a greater measure of security to the farmers because of the
contractual nature of supply (pp. 153/154). The development
of technological capabi 1 i ty was identified as a pressing·
requirement if greater linkages with agriculture and other
sectors were to be forged (p. 160). That the low purchas ing
power of the rural population is a major hindrance in agro-
based industrial development is revealed by Livingstone
(1984) in the case of Malawi.
In a recent study, 8agachwa (1992) evaluated the
relative performance of small and large scale grain millinl
techniques in Tanzania to identify appropriate technique.
and explains why some firms select inappropriate technique.
and products. ltd i scusses the consequences of techno log ica I
choice within the context of employment generation, output
expansion. surplus generation. skill formation, economies of
scale and overall resource use (p. 971.
Appropriate technology is defined as the one which uses
locally available resources. particularly labour, economizes
on scarce resources like capital, ensures f u I I capac i ty
utilization, generates linkages, minimizes costs,
producs appropriate products. Th analysis demonstrates
and
the
economic viabil ity of the small scale custom mil ling compared
to household- and merchant- milling (p. 1961.
2.23 Food Proe ••• in, in Punjab
In the particular context of Punjab, Kahlon and George
(1966) studied the role of processors and traders in
agricultural marketing integration and found that the
processors as wei I as traders depended upon the commission
agents to a large extent for the procurement of supplies. The
processors managed to integrate into the supply market
(producers) by extending credit facilities to the commission
agents, some of whom in turn gave production loans to the
cultivators. The study also revealed a high degree of
integration between processing and storage(p. 44'.
Thapar (19711 found that small scale industries in the
agro-based sector were not growing fast as compared to the
large agro-based industries. Also, the growth
44

I
scale agro-based industries was slower in small towns. Ghosh
(1977) also noted that in the Mandi areas of Punjab and
Haryana. a few food processing units had come up and
suggested that one could look at the possibilities of
employment through such industries even at the local level.
Gupta (1982) stud ied rural industry in the Punjab
region. Analysing the census data for 1971. he found tha t,
whereas rural areas accounted for around 35 per cent of the
food products units in the unregistered workshop sector in
Punjab, its share in the household sector and the registered
factory sector was just 6.58 per cent and 15 per cent
respectively in the same industry. A similar pattern was
observed in regard to employment. In terms of number of
enterprises. food products was the second lariest urban
industry in 1971. The industry and the third largest rural
author notes, WThere is no real dichotomy between rural and
urban areas .•• , it is the scale of operation question and
not so much the industrial location which is an important
determinant of
33/34) •
the nature of
The evaluation of the Rural
based on a survey of lee industrial
industrial activity· ( p.
Industries Project (RIP)
units in Malerkotla town
by the author revealed that among the sample industries, oil
crushing and cotton ginning were the largest in terlls of
45
number of workers per unit, fixed capital per unit, value
added per unit, value added/labour ratio and the fixed
capital-labour ratio. On the other hand, labour-output
ratio and wage-value added ratio were the lowest
surveyed
in this
industry among all
capital-labour ratio was
(1986) studied the paddy
industries
the highest ( pp.
processing industry
whereas
39-40) • Rangi
in Punjab and
found that the introduction of modern technology (rubber
rollers) led to higher out-turn and better quality of product
and by-products.
2.3 Studi •• on Punjab Econo.YI Probl •• of Structural Chant ••
There is no dearth of literature on the agrarian
economy of Punjab, especially the literature dealing with
various aspects of Green Revolution in agriculture and its
after-effects on the agrarian structure. However, the area
of industrial and agro-industrial activities still lacks
serious research effort.
studies will provide us
gaps in
study:
the literature
The following reyiew of some
with an insight into the existing
in the particular context of this
The 'Studies in Punjab Economy' (1983) reveals that
while the agricultural performance of Punjab has been
outstanding, maintenance of the rate of growth in the State
requires diversification of the economy through

industrialisation. The industrial development in the State
has been limited in extent and scope i. e. it has been
dominated by smal scale units and confined to low
technology and low productivity areas. The State lagged
behind many other states in i n d us t I' i a I i"5 a t ion. des pit e its
high rate of agricultural growth. The study examines various
factors responsible for the I ack of Industrial development
and emphasizes the need to industrialize so as to combat the
problem of unemployment and to provide dynamism to the State
economy.
Mahajan (1983) recognises the problems of the State
economy in its excessive dependence on the farm sector and
the small industrial base (p. 121). He observes - I t is
interesting to find that in Punjab ... the income froID
in 1976-77 was nearly 80 per cent higher than livestock
combined income from registered and unregistered industrial
sectors of Punjab- (p. 180). While arguing for the need for
balanced growth of agriculture and industry, the author
suggests, -Punjab has a strong agro-base which makes it
particularly suitable for agro- based industries concerned
with the processing of agricultural produce- (p. 154).
Another scholarly study by Chaudhri and Oasgupta (1985)
on the development of agriculture vis-a-vis overa I I
deve I opmen t process in Pun j ab, a I so recogn i ses the I ilal ts to
47
Cl"owth in the State. The study notes the development of
agriculture and rural infrastructure and observes that in
PUnjab, the public administration had been oriented towards
rural and agricultural development. It argues that the need
for industrialisation has now to be foreseen in the same way
as needs of agriculture were anticipated during the 19509
and the 19605.
Fur ther, it ar gues tha t though ag r ieu I tura I development
in Punjab has been truly remarkable not only by comparison
with the period before Independence, but by any standards,
this does not, however, guarantee that such growth is viable
in the sense that it is likely to continue in future.
There are a number of instances of economies which had
apparently 'taken-off' on the basis of a spurt of industrial
growth but which subsequently reverted to stagnation ( for
example, Argentina) and this may occur in the case of
agricultural growth as wei I.
The authors recognise the contribution of agriculture
to economic development in the state through production and
.arket (demand),
of agriculture
but the factor and/or resource contribution
is almost the opposite to that of Japanese
agriculture. And they warn ·Prospects of further growth in
agriculture are becoming limited as the net area sown
approaches its ceiling. A continued failure ot industry to
48

develop will have serious consequences for agriculture
itself. With off-farm employment opportunities lagging
behind the rural population increase, marginal farmers would
be forced off the land and have to compete with landless
labourers for employment in agriculture- (p. 173).
Another study by Kainth and Bawa (1985) deals with the
question of structural changes in the economy as development
takes pi ace. Making an empirical investigation of this
process in the case of
Punjab is we II
Punjab,
set on
the authors argue,
the path of economic -Apparently,
development in terms of changing structure of net state
domestic produc t. However, the service sector expanded at
the expense of secondary sector. This unusual
tertiary sector has been due to the creation of
growth of
improved
infrastructural and service facilities for the rapid growth
of agriculture. The same basic infrastructure can now serve
as a basis for the much delayed industrial growth in the
state- {po 54 •.
The role of the state in rural economic transformation
in Punjab is the subject matter of yet another study (Chadha,
1986) • It takes -a systematic and well knit account of the
technological and institutional factors which led to the
rural economic transformation in the state and tries to
examine whether the benefits of this rural economic
49
prosperity have percolated down to the lower strata of rural
soc iet y 8. The author recognises. at the very outset. the
agricultural bias of the state government in favour of
sector and its neglect of the indus tr ia I sector (pp 28-29).
Uhile dealing with the question of IBarketing of
agricultural produce and returns from it. Chadha argues that
-real net returns on wheat cultivation in Punjab have come
down both per quintal as we I I as per hectare 8 ( p. 214) •
However. the study does not address itself to the question
of agricultural surpluses as the author says, "Although the
study covers a wide canvas, yet a few issues (some of which
are specifically germane to Punjab experience) could not be
tackled. The first issue is the generation and util isation
of surplus from Punjab agriculture. The field is still wide
to conjecture since no syste.atic study on the subject has
appeared so far 8 ( p. 17 ) • The study recognises the
development contradiction in the State in terms of the
inability of agriculture to provide and sustain employment
and the inadequate avenues of non-farm employment.
Johl (1966) discusses the future of agricultural
production in the State. The author points out that the
overly dependence of farmers on wheat and rice has led to an
uncertain situation in the market and also. the foodgrains
from the state now do not find a ready market since the
5"
production in the consuming States is coming up fas t and
their deficits are getting eliminat.ed. or at least reduced
considerably. Consequent I y. the lifting of foodgrains from
the State has been affected adversely (p. 2). As a solution
to the above problem. while recommending ~ the diversion of
sown area from food crops (cereals) to fodder and
fruit/vegetable cultivation, the author does make
lb.tter marketing and processing facilities
a case for
so that:
sustainability in the primary sector can be achieved.
Bhalla et. al (1990) analyse the structural changes in I
the State economy as wei I as within its sectors consequent
upon the rapid agricultural growth since the mid-1969s which
was fa c iii tat ed by ins tit uti 0 n a I , infrastructural, price,
technological and political factors. Though agricultural
sector has experienced changes in technology and new
investments, some lines of manufacturing have witnessed
technological improvements such as new skills, use of power
and the emergence of metal-based industries; though
agro-processing continues to dominate the manufacturing
sec tor. Besides the tertiary sector has expanded very
significantly.
Gil I and Gil I (1990) discuss the major problems of
agriculture and difficulties arising out of the particular
model of development followed in Punjab and dwell on the
51
relevance of the Pepsi project in the context of agricultural
development and problems of industrialisation in the state.
They conclude that the project will not serve the interest of
the farmers in Punjab and is incapable of bringing about
diversification in agriculture because it is spearheaded by a
.ultinational corporation (Pepsico) and does~not inyolve the
'.rmers in the system of agro-industrial processing. They
.uggest co-operatives as a better alternative because it wil I
ensure participation of primary producers and those with
.urplus capital resources into agro-processing which is the
requirement ot the process of development in the state.
2.31 Studies on the rndustrial Sector
An NCAER report (1984) identified certain ·candidate
industries· in Punjab at the district leyel for the period
1977/78 to 1987/88 as part of the perspective pla.n. It points
out t hat i n 1 970 , f 00 d pro c e s 5 i n gin d IJ s try 101' a sat the top in
terms of its contribution to both output and employment. It
recommends the setting up of new units in certain industries
ina I I the districts except. Ludhiana which is aiready
sufficiently industrial ised.
While analYSing the environment for industrialisation in
the State. the report recognises the existence ot large
investible surplus in the state which was the result ot Green
Revolution. The report suggests, wlf the farmers in Punjab
52

can be educated to participate actively in the State's
industrial development and be genuinely interested in it,
Punjab may well witness the emergence of a new class of
entrepreneurs - the farmer entrepreneurs as distinguished
from the traditional merchant entrepreneurs or the new
eng i nee r en t rep r e n e u r s • (p. 80).
Pandit (1985) studied the factors in the growth and
location of footloose industries in Punjab and Haryana and
found that besides the improved overall industrial climate
in the country after Independence, the factors I ike
entrepreneurial background and skills of the people of the
region led to the location and growth of these industries
there. The facilitating factors for the supp I y of
entrepreneurs and skil led labour were; urban and industrial
background of the displaced people from West Punjab, the
Ramgarhia community's skil Is, financial help from the State
governmemt and the low wages in the region.
Sharma (1988) attempted to look
extent of industrialisation in Punjab
at the progress and
for the period 1966 to
1980/81 and concludes • .nspite of being a late comer
tests
in
industrialisation,
industrialisation
two of
postulated
the three
by Sutcl iffe are
satisfied by Punjab •.. The industrial economy of the
of
being
State
is highly dynamic· (p. 1*'3,. But, here it is important to
53
point out that the first and very basic condition for
industrialisation as suggested by Sutcl iffe is not met
because the share of industrial sector in SDP is not 25 per
cent or more. It is only 13.5 per cent.
The study looks at the various industry groups and the
constraints facing them. In the case of food products. it
observes that the industry has high
industries and has very high (0.981
linkages with 13 other
employment correlation
Thus the industry has with the overal I industrial sector.
good scope for further growth. Sharma recognises the role
of the State in industrial growth in Punjab, but identifies
constraints such as socio-political, internal, external,
natural, infrastructural, entrepreneurial etc ••
Myer (1990) looked at the employment potential of agro-
industries
in the
in Punjab with the help
districts of Jalandhar,
of a survey of 100 un its
Ludhiana and Patiala
comprising of smal I as well as large units. He found that
stock of machinery (absolute and per unit of production.,
local sales, and
very important
agro units. The
of production and
sugar, starch,
vegetable oils.
inventory per unit of production emerged as
determinants of employment in large scale
industries which had absolute and per unit
cost advantage were: bakery
cotton spinning and weaving and
products,
paper and
There were other industries also, such as
54

canning and preservation
and manufacture of input
of fruits and vegetables and beer
supply industries like agricultural
machinery, which had higher employment potential on I yin
terms of per unit cost of products.
On the other
determinants of
hand, in the small so-ale unit, the major
employment potential were local sa I es,
operation period, stock of machinery, value of product ion,
working capital and the gross profit per unit of production.
In this the only industry with absolute and per unit of
production and cost
agricultural machinery.
advantage was manufacture of light
However, there were also industries
I ike bakery products, cattle feed, agricultural implements,
diesel engines and electrical pumps which had only per unit
of production as wei I as cost advantage for employment.
2.32 The I_plicationa of Green Revolution
The study by Shiva (1989) traces the aspects of the
conflicts and violence in today's Punjab to the ecological
and political demands of the Green Revolution as a
scientific experiment in development and
transformation. The author argues that at
agricultural
many levels,
social and political insecurity was generated by the Green
Revolution. She analyses
terms of
natural
destruction of
resources. It
this impact of new technology in
genetic diversity and misuse of
is pointed out wit h s ta tis t i oa I
55
evidence that Punjab agriculture is no more remunerative and
this is the major reason behind the present turmoil. A 190,
the Pepsi project has been analysed in a logical framework
with the conclusion that it wi I I not help Punjab
agriculture or farmers because it wil I distort the cropping
pattern and may
farmer.
increase the market uncertainty for the
Chand (1991) attempted an analysis of Punjab
agriculture in terms of systems of output supply and factor
demand in order to find the costs and return for different
crops for 1977/78 to 1979/88 in three zones of Punjab based
on the cost of cultivation of principal crops data. It was
found that wheat and paddy were the most remunerative crops
and capital and fertilizer inputs constituted a major share
in the cost of CUltivation of these crops. However, the
negative effect of factor prices on employment were not
compensated by positive effects of product
employment, at the given price structure.
marketed surpluses of wheat showed greater
prices compared to its output supply. However,
prices
Moreover
response
on
the
to
product and
factor prices had their amazing impact on net income of the
farmers; a one per cent increase in output price raised the
income from wheat and paddy by 6 per cent
respectively.
and 4. per cent
56
However. the postscript analysis by the author for the
years 1981 / 82-1983/84 revealed that the cost increased at a
faster rate than the increase in gross returns. and this
resulted in lowering the rate of return. Further, the
author observes that the yields of most of the crops are
stagnating.
Various implications - social. economic and political
of the Green Revolution in Punjab form the subject matter of
many papers in Hansra and Shukla (1991). The study takes
account of the after-effects and ill-effects of Green
Revolution in agriculture on various spheres of I if e in
Punjab and suggests ways and means out of the crisis of
development.
2.33 Distorted Develop.entr The Political Econoay of Green Revolution
Besides these, a few studies look at the nature and
development of the State economy from a political economy
point of view and trace the roots of the development crisis
in the distorted development of capitalism in the State,
especially agriculture. Among these studies are Gill 11983,
1988), Azad (1986), Dogra (1988) and Singh (1991).
Gil I (1983) who looked at the process of development of
capital ism in the Punjab agriculture found that it fulfilled
57

three main conditions of capitalist development i.e. land
relations, capital accumulation, and existence of wage
labour. Yet, capital ism in the State agricul ture was in the
early stages of its development or was the result of
underdeveloped capitalism in the Indian economy in general,
because the sma II farmers were able to resist their
disintegration while the large farmers
totally dependent on the hired labour.
had not become
Dogra (1988) al so observes that the reasons for the
crisis in the Punjab agriculture lie in the distorted
strategy of agricultural
government
productivity
spread with
at low cost.
agro-ecological degradation
farmers, it has left most
development
the false
But, with
that
promise
its
and unsui tabi Ii ty
the Indian
of high
reality of
for smal I
of the small farmers frustrated
with unrealised expectations and entangled in debt (p. 22).
Azad (1986) also traces the specific limitations of the
capitalist transformation in Punjab agriculture in terms of
lack of large scale migration of rural population to urban
areas. This was due to the restricted growth of
manufacturing, limited diversification, the lack of
pauperisation and immiserisation of the rural
primary
poor, and the
and secondary lack of strong linkages between
sectors es pec i a I I y the accumulation and investment of
58
capital (KalJr, 1988, p.43). Bhal la and Chadha (1983) also
term the development of capital ism in Punjab agriculture as
a case of ·stunted capitalism-.
Alam (1986) also looks at the Punjab crisis in terms of
its economic contradictions and consequent political
impl ications. He is of the view that the growing
capitalisation of agriculture in the State gave rise to a
relatively large accumulation of capital in the hands of
landed gentry which is largely Sikh. Since capital can not
remain static, it needs outlets for productive investment.
However, in the case of Punjab, whereas the route of
unhindered expansion of capital ist enterprise in agriculture
was foreclosed by the ceiling on land holdings, the other
route of large scale and massive entry of surplus
agricul tural capital into the spheres of industry or trade
and commerce or banking was not available due to the slow
pace of industrialisation consequent upon the -disjunction-
between agricultural and industrial development and the
established hegemony of the Hindu trading classes in industry
(p. 8 & 9).
Further. the benefits of Green Revolution are tapering
off because the capital deepening in agriculture has been
much more than
between the two
the productivity growth and the difference
has been the highest in Punjab. This has
59

sharpened the contradiction between farmers and industrial
bourgeoisie. Kaur (1988) looks at the socia-economic and
pol itical consequences of agricultural development
Punjab. He traces the roots of the political crisis in
1n
the
phenomenon of Green Revolution which led to the excessive
dependence of the population on agriculture, a large number
of whom were landless labourers and marginal and sma I I
farmers (p. 85).
D'Souza (1982) finds that there is a class conflict
between Jat Sikh agriculturists (rural bourgeoisie) and Hindu
bania traders and commission agents (urban bourgeoisie) which
has been sharpened due to the stronger link between trade
and agriculture reinforced by the Green Revolution. The
entry of the rural bourgeoisie into trade and
the investment of agricultural surpluses. has
industry with
increased the
tension between Hindu and Sikh urban bourgeoisie on the one
hand and the Sikh urban bourgeoisie and the Sikh rural
bourgeoisie on the other. This is because both (the Hindu
urban and the Sikh urban bourgeoisie) are threatened by the
Sikh rural bourgeoisie.
This emergent class of Sikh capitalist farmers is
coming in conflict with well entrenched and better
established urban Hindu traders and capitalists. There is
al so increasing infiltration in and interference with the
6"
middlemen's (Artiyahs) trade by rural bourgeoisie,
particularly from the Malwa region. The Sikh capitalist
tarmers. for example, have bui I t their
(Kothis) near'mandis' and have started
residential houses
pa r tic i pa tin gin
this trade, causing anxiety and hostility among the urban
Hindus traditionally doing this trade. Above all, the rural
bourgeoisie itself feels frustrated because it can not
invest its surpluses in industrial production to the extent
it wants. Thus, the cycle of internal contradictions within
the bourgeoisie continues (D'Souza, 1982).
Singh (1991) also feels that the contradictions in
Punjab are the consequence of retarded development of Indian
capitalism which has its regional manifestations. Also, there
is a conil ict between the national and regional bourgeoisies
over the
indus t ria I
control of resources. Due to the control of urban
bourgeoisie's predominance in industrial spheres,
the neo-rich are not able to find outlets in industry for
the investment of their surpluses. Besides this, the
petering out of agricultural growth along with adverse terms
of trade and , disjunction'
industrial development has
between
led to
agricultural
the growth
and
of
pauperisation, immiserisation and proletarianisation of
marginal and small farmers.
The above review of studies on various aspects of Punjab
61

economy gives an account of the process of development in
which agriculture was the engine of growth. Also, this
review introduces us to the context in which the role of food
processing industry has to be studied. The fol lowing chapter
examines the structure and growth pattern of the Punjab
economy in greater detail.
62

The
sectoral
Chapter 3
THE STRUCTURE OF THE PUNJAB ECONOMY
structure of an economy is reflected
distribution of income and employment.
through
As an
economy develops, the relative strength of agricultural and
all ied activities decl ines and that of the non-agricultural
in general and industrial activities,
an analysis of
in particular,
the structural increases. In this chapter,
changes in the Punjab economy per se, as well as in relation
to other States has been attempted. The analysis of the
economic structure of Punjab, especially industrial
structure, is for the period 1970/71 to 1987/88.
Punjab is one of the most developed States in the
country in terms of per capita income and this has been
largely because of the agricultural development in the State.
Its per capita
prices and Rs.
income in 1985/86 was Rs. 4479 at current
1656 at 1970/71 prices against that of Rs.
2721 and Rs. 798 respectively for the country as a whole
(Chand, 1991, p.57). The State also has the highest per
capita consumption of milk and the lowest percentage of
people below the poverty line (7 per cent in 1987/88) among
all the States (CMIE, 1990). Punjab accounts for 1. 53 per
cent of area and 2.45 per cent of population of the country.
The density of population in the State is 401 and 57.14 per
cent of the people are literate (Census of India, 1991).
It tops in m~ny indicators of agricultural growth such
as numb~r of tractors p~r thousand h~ctar~s (36), consumption
of ~I~ctricity (477.6 Kwhsl, coms'Jmption of ferti I izers (15:3
Kgs. per hectare in 1987/88), net sown area (83.42 per cent
in 1985/6), irrigated area and irrigation intensity (91.02
per cent (1985/6) and 179 per cent (1987/8) respectively).
cropping intensity (172 per cent in 1987188) and
many important crops (rice. wheat., and cotton).
yields of
The State
accounts for only 2.95 per cent of the cultivated area of the
country but contributes as much as 24.46 per cent of total
prod'Jct ion. Punjab's contribution to centra.l
pool was 61.5 per cent for wheat and 47.0 per cent for rice
in 1986 / 87 (Chand, 1991, p. 57). The ar~a under HYVs in the
case of wh~at was as high as 99.8 per cent and 95.7 per cent
in the case of ric~ (1986/87).
From the geographical and agricultural persp~ctive,
Punjab can be divided into three regions: th~ northern
submontane (hi Ily) strip, the central plains, and the south-
western r~gion (Map 3.1 ). The hilly region consists of the
districts of Gurdaspur. Hoshiarpur and Rupnagar. and maize
and wheat are the major crops of the
plains comprise the districts of
region.
Amritsar.
The central
Kapurthala.
Jalandhar. Ludhiana and Patiala. and most of Sangrur. High
value crops like wheat and gram are grown during the winter;
3.nd rice. maize. cotton, sugarcane, and pulses are grown
during the summer in this region. The south-western region
contains the districts of Ferozpur, Bathinda, Faridkot and
parts of Sangrur. has lowes t rainfall
64 -

MAP 3.1 GEOGRAPHICAL REGIONS OF PUNJAB
o tOo
b:=L-J-b+::;d K i lomclcrs
65

among Thl'? m3in Grops grown ar~ IoIh9at;,
gr 3rt!, Gotton, jowa r, rap9Sged / mustard (MGguirk and
Mundlak. 1991, p. In.
3.1 I nter-Sectoral Changes
The sectoral distribution of net state domestic product
shows the predominance of the agricultural and allied
activities in Punjab. The share of crop production and
livestock in SDP was 58.9 per cent in 1970/71 and was higher
t han a I I
Benga I •
the industrial States (Maharashtra, Gujarat, "'est
Tami I nadu, and Karnataka) except Haryana. In
the 1975/76, the percentage came down to 53.27, but stil
relative position of Punjab remained unchanged. During
1980/81. the share of this sector in SDP further declined to
48.91 per cent and it was still the highest among the above
mentioned States with the exception of Haryana.
I n 1987/88, the shares of three sectors (primary,
secondary and tertiary! were of the order of 44.2 per cent.
20.74 per cent and 35.06 per cent respectively at current
prices and 51.83 per cent. 15.91 per cent, and 32.26 per
cent respectively at 1970/71 prices (Statistical Abstract of
Punjab, 1988, hereafter SAP).
Within the agricultural (crop production and livestock)
sector, significant diversification took place during 1960/1
to 1983/4. The share of livestock which was only of the order
of 14.1 per cent of the total income generated in
agriculture. went upto 25.5 per cent in 1970/1 and further to
66
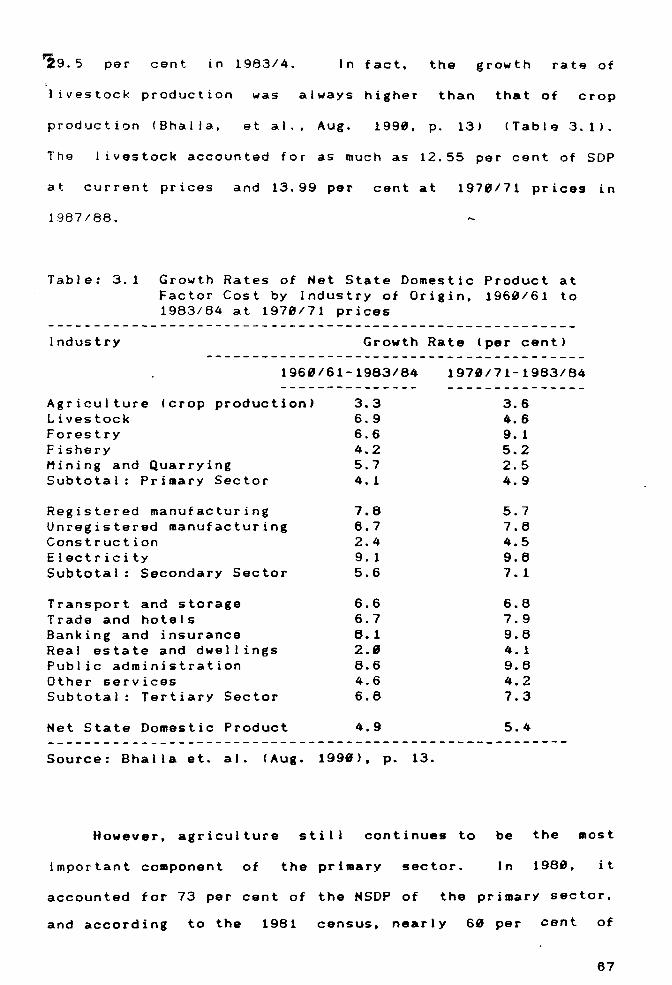
'29.5 per cent in 1983/4. In f ac t. the growth rata of
livestock production was always higher than that of crop
production (Bhalla. et al.. Aug. 1990. p. 13) (Tabla 3.1).
The I ivestock accounted for as much as 12.55 per cent of SDP
at current prices and 13.99 per cent at 1970/71 prices in
1987/88.
Table: 3.1 Growth Rates of Net State Domestic Product at Factor Cost by Industry of Origin, 196"/61 to 1983/84 at 197,,/71 prices
Industry Growth Rate (per cent)
1960/61-1983/84
Agriculture (crop production) Livestock Forestry Fishery Mining and Quarrying Subtotal: Primary Sector
Registered manufacturing Unregistered manufacturing Construction Electricity Subtotal ~ Secondary Sector
Transport and storage Trade and hotels Banking and insurance Real estate and dwellings Public administration Other services Subtotal: Tertiary Sector
Net State Domestic Product
3.3 6.9 6.6 4.2 5.7 4.1
7.6 6.7 2.4 9.1 5.6
6.6 6.7 6.1 2.0 8.6 4.6 6.6
4.9
Source: Bhalla et. al. (Aug. 1990), p. 13.
1970/71-1983/84
3.6 4.6 9. 1 5.2 2.5 4.9
5.7 7.6 4.5 9.6 7.1
6.6 7.9 9.6 4. 1 9.8 4.2 7.3
5.4
However, agriculture still continues to be the most
important component of the primary sector. In 1980. it
accounted for 73 per cent of the NSDP of the primary sector,
and according to the 1981 census, nearly 60 per cent of
67
Punjab's total labour force was employed in agriculture. ot'
the total rural male workers in Punjab in 1981. about 76 per
cent were engaged in agriculture either as cultivators or as
labourers. Further. within agriculture, crop production has
continued to dominate agriculture (Mcguirk and Mundlak, 1991,
p. 16) . Of the total cropped area, foodgrain crops account
for as much as 77 per cent. I t is interesting to note that I the primary sector started picking up again from 1980/81
(48.91 per cent) onward with a marginal dip during 1983/84.
In 1986/87, its share was as high as 52.79 per cent.
The non-primary sector (secondary and tertiary together)
contributed 41.64 per cent of the SOP in 1970/1 and it was
the lowest among the States mentioned earlier. By 1975/76,
the share of this sector increased to 45.1 per cent but the
relative position did not witness any change. This share
further improved to 50.79 per cent in 1980/81 and was less
than those of other States except Haryana. But in the
subsequent period, the relative strength of this sector came
down when it accounted for only 49.61 per cent in 1982/83.
This declining trend was much more perceptible during the
next three years when in 1986/87 it accounted for only 46.92
per cent.
Within the secondary and tertiary sectors. the
manufacturing ac\ivities are seen as more important ones
because they inculcate more dynamism in the economy through
their high productivity nature and backward and forward
linkages. On the other hand, the role of the tertiary or
68

, '.ervice sector is only supportive in nature. Thus, the share
~f the manufacturing sector is used very often to measure the
extent and level of industrial development in an econo.y.
In Punjab, the manufacturing sector claimed 8.91 per
cent of SDP in 1979/71 which was lower than those in other
industrially developed States. Our i ng 1975/76 the share
increased to 10.11 per cent and the trend continued to
preva i I up to 1981/82 when the percentage contribution of
this sector reached its peak (11.71 per cent). By 1987/88,
the share of manufacturing came down to 10.59 per cent at
1970/71 prices though at current prices it. was of the order
of 12.69 per cent (SAP). I t. is interesting to observe that
Punjab in spite of a favourable trend has failed to improve
its relative position. In other words, the temporal analysis
reveals structural transformation of the State economy but
the pace of structural transformation has been very slow and
as a consequence the relative position of Punjab (cross
section analysis) has not improved.
During the period 1979/71 to 1986/87, the average annual
compound growth rates for the secondary and tertiary sectors
(5.41 per cent and 6.51 per cent respectively) were higher
than that of the primary sector (4.42 per cent). However,
during 1988/1 to 1964/5, the primary sector grew faster (5.84
per cent) than the other two sectors whose growth rates came
down significantly during this period. In fact, from 1962/83
onwards, the share of manufacturing sector started dwindling
and it was 9.9 per cent in 1986/87. This In a way, is an
69
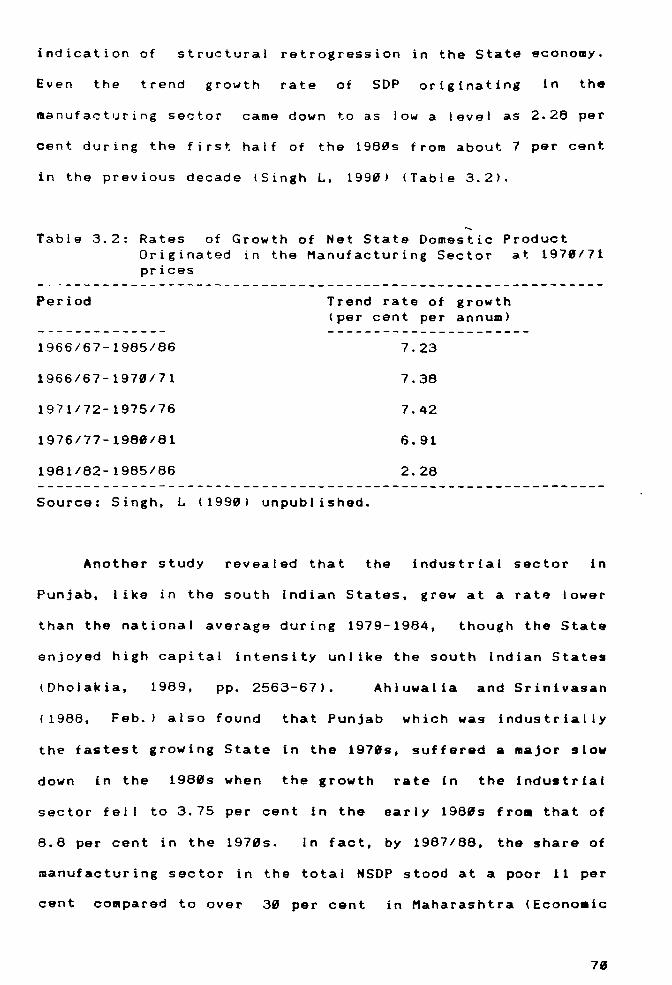
indication of structural retrogression in the State economy.
Even the trend growth rate of SOP originating in the
manufacturing sector came down to as Iowa level as 2.28 per
cent during the first half of the 19805 from about 7 per cent
in the previous decade (Singh L, 1990) (Table 3.2).
Table 3.2: Rates of Growth of Net State Domestic Product Originated in the Manufacturing Sector at 1978/71 prices
Period
1966/67-1985/86
1966/67-1970/71
1971/72-1975/76
1976/77-1988/61
1961162-1965186
Trend rate of growth (per cent per annum)
7.23
7.38
7.42
6.91
2.28
Source: Singh, L (1990) unpublished.
Another study revealed that the industrial sector in
Punjab, like in the south Indian States, grew at a rate lower
than the national average during 1979-1984, though the State
enjoYed high capital intensity unlike the south Indian States
(Oholakia, 1989, pp. 2563-67). Ahluwalia and Srinivasan
( 1988, Feb.) also found that Punjab which was industrially
the fastest growing State in the 1978s. suffered a major slow
down in the 19805 when the growth rate in the industrial
sector fel I to 3.75 per cent in the early 19805 fro. that of
8.8 per cent in the 19705. In fact. by 1987/86. the share of
manufacturing sector in the total NSOP stood at a poor 11 per
cent compared to over 30 per cent in Maharashtra (Econo.ic
78

SIJrvey, Punjab 1988/89, p. 20).
Within the secondary sector, a broad classification of
activities reveals that until the mid 1970s, construction wag
the largest activity claiming about more than 113 of the
t.otal secondary sector output. However, after that, ~
manufacturing proper in the sma I I as well as large sectors
came t.o ocCUpy a pride of place and together they accounted
for more than 2/3 of the output by 1983/84. But in
comparison to this, in India. the share of manufacturing
proper in the secondary sector. went up to about 3/4 during
the same period.
The regression analysis to determine the relative
contribution of secondary sector to per capita income for the
period 1979/71 to 1983/84 revealed that in Punjab this
contribution was more than in the case of India ISharma,
1988, p. 97). But what has to be remembered is that it i5
not the secondary sector as a whole but the manufacturing
part of it which is of importance. And in this, the picture
is dismal because the manufacturing sector is very small. It
was found by another study IMitra, 1989) that Punjab did not
exhibit any relationship between the growth of per capita
income and the inter-sectoral ratio changes during the period
1965/66 to 1983/84. It implies that the high growth of per
capita income in the State was mainly the result of
agricultural growth that took place in the late 19605 and the
1970s (pp. 243-64). Between 1960 and 1980, the real SDP of
Punjab grew at a compound rate of 4.9 per cent a year and the
71
rate of growth of value added in primary sector was 4.4 per
cent per annum. Agricultural growth also seems to have
induced
grew at
the growth in secondary and tertiary sectors which
the annual rates of 6.2 per cent and 4.7 per cent
during this period (Mcguirk and Mundlak, 1991, pp. 14-15).
A study on the industrial development in Punjab (Sharma.
1988) claims that Punjab is industrial ised and its industrial
economy is highly dynamic because the State's industrial
sector meets the industrial development criteria suggested by
Sutcliffe (1971) wherein the share of manufacturing in the
total industrial output has to be more than 60 per cent and
more than 10 per cent of the population is employed in
industry (p.103). But what is forgotten is that the
Sutcl iffe criteria also demands that at least 25 per cent of
the output should come from the secondary sector. In this
respect, Punjab does not qualify to be called industrialised.
A I so, though 10 per cent of the working population is In
.anufacturing, the nature of this employment
smal I scale sector should not be lost sight of.
in Punjab's
Further, as
Sundram (1987) observes,-A sector's contribution to overall
crowth depends not only on its growth rate but also on its
relative size. Thus. even a fast growing sector may not
contribute much to overal I growth if it is small, while even
a slow growing sector may make a bigger contribution if it is
large-. It is in this perspective that the growth of
.anufacturing sector in Punjab has to be viewed.
The division of .anufacturing sector into registered and
72
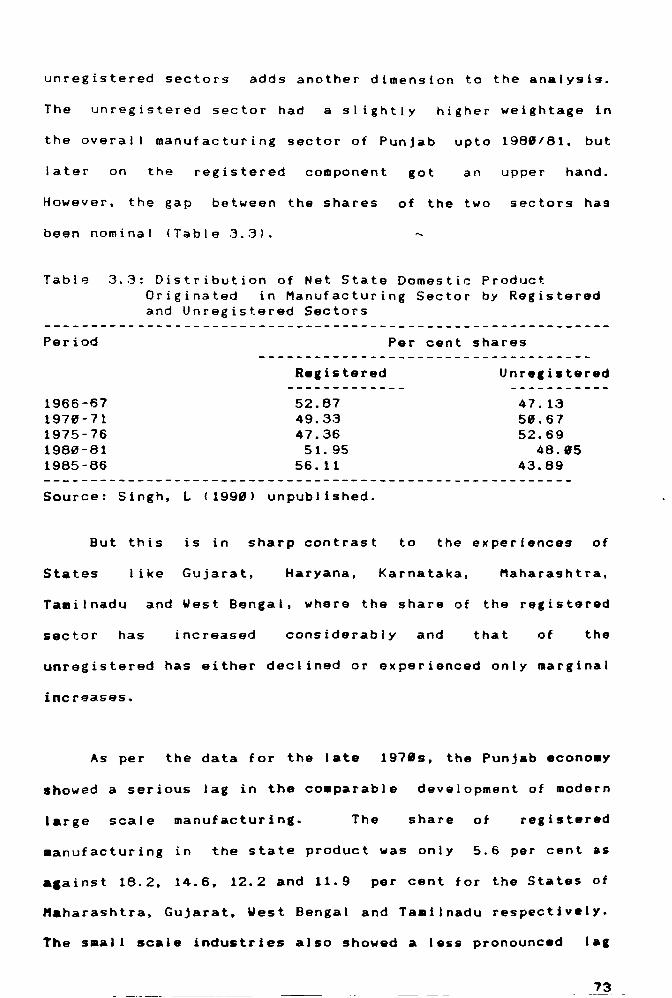
unregistered sectors adds another dimension to the analysis.
The unregistered sector had a sl ightly higher weightage In
the overal I manufacturing sector of Punjab up to 1988/81. but
later on the registered component got an upper hand.
However, the gap between the shares of the two sectors has
been nominal (Table 3.31.
Table 3.3: Distribution of Net State Domestic Product Originated in Manufacturing Sector by Registered and Unregistered Sectors
Period Per cent shares
Registered Unregistered
1966-67 1970-71 1975-76 1980-81 1985-86
52.87 49.33 47.36 51.95
56. 11
Source: Singh, L (19901 unpublished.
But this is in sharp contrast
States I ike Gujarat, Haryana,
47.13 58.67 52.69
48.85 43.89
to the experiences of
Karnataka, Maharas h t ra,
Tamilnadu and West Bengal, where the share of the registered
sector has increased considerably and that of the
unregistered has either declined or experienced only marginal
increases.
As per the data for the late 19785, the Punjab econo.y
showed a serious lag in the comparable development of modern
large scale manufacturing • The share of registered
• anufacturing in the state product was only 5.6 per cent as
a.ainst 18.2,14.6.12.2 and 11.9 per cent tor the States of
"aharashtra, Gujarat. West Bengal and Ta.ilnadu respectively.
The small scale industries also showed a less pronounced lal
73
in development. The share of unregistered manufacturing in
the state product was 5.3 per cent as against 7.8. 7.6. 7.2
and 5. 7 per c e n tin G IJ jar at. Tam i I n a d IJ , M a h a r ash t r a and IJ est
Bengal respectively. In fac t. Punjab
government employees (2,46,11313) than
(1,56,817) (Gill K S, 1983, p. 551).
had more State
factory employees
That Punjab's i nd us t ria I sector is private sector
dominated is also brought out by a study which
about 913 per cnt of the industrial employmnt has
points t.hat
always been
in the private sector during the period 1966 to 1983 though
trend rates of growth in employment were not very different
in the two sectors (Singh and Bhangoo, 1988, p. 62). However.
the analysis of industrial employment across household and
non-household sectors revealed that over the period 1971':'
1981. the share of household sector in the total industrial
employment declined while tha t of the non-household (both
factory and non-factory) increased (Singh and Bhangoo. 1988.
p. 56).
Thus, in Punjab, not only the industrial sector has a
low profile (narrow base), but also. the registered component
of it - which is a symbol of modern industrial isation - until
recently has lagged behind that of the unregistered segment.
However, during 1960/1 to 1983/4, the income from registered
manufacturing in Punjab grew at a much higher rate (7.8 per
cent) than that of the unregistered manufacturing sector 16.7
per cent>IBhalla et al., Aug. 19913. pp. 27-28).
74-
To sum up. the process of structural transformation of
the Punjab economy can be put into two phases; one froID
1978/71 to 1988/81 when the economy eKperienced a slow rate
of structural transformation and the second one froID 1981/82
onwards. since when i t is experiencing structural
retrogression. The overall trend of retrogression in the
Punjab economy was reflected in a more aggravated form in the
three border districts during the 1988s. Al I of these three
districts (Amritsar, Gurdaspur, and Ferozpurl experienced a
decline in non-primary activities and a gain in agricultural
and all ied activities (Alagh, 1991, pp. 16-221.
3.2 Growth and Chan, •• In A,rloultur.
Though Punjab recorded as high a growth rate as 4.6 per
cent even during the pre-Green Revolution period (1958/1 -
196415), the introduction of the new seed-fertilizer
technology in the mid 1968s marked the beginning of a new
chapter in the history of Punjab agriculture. Under the
impact of technological improvements from the late 1968s,
there took place an unparalleled rise in agricultural
production and productivity.
Firstly, there was a remarkable expansion of area under
wheat and paddy, while the CUltivation of most other crops
registered a slow but persistent decline. It was the
technology-price-profitabilityadvantage of these two crops
over other crops that was reflected in the differential
growth in area and output of various crops. Secondly, the
75
yields of wheat and rice grew impressively compared with most
other crops (Table 3.4). During 1960-1979, the yields of
wheat and rice in Punjab increased by 124 per cent and 175
per cent respectively, though the time pattern of this growth
varied crop by crop. Whereas the growth in yields of wheat
outperformed rice yields by a margin ~of 18 per cent during
the 19605, rice yields increased 42 per cent more than wheat
yields In the 1970s (Mcguirk and Mundlak, 1991. p. 19).
Consequently, whereas yield increase had accounted for about
37 per cent of the growth of wheat output in the pre-Green
ReYolution period (1952/3 -1964/5), its contribution
increased to nearly half in the post-Green Revolution period
(1967/8 - 198415). Similarly, in rice. the contribution of
yield to growth of output increased from 20 per cent to 35
per cent over this period (Shalla. 1990. p. 15).
Over the period 1952-53 to 1969-70. the agricultural
Irowth rate in Punjab was 6.6 per cent against 3.1 per cent
for India. It was higher than the growth rate in West Punjab
(Pakistan) too. However, over the period 1972-77. the growth
rate fell to 2.5 per cent per annum at 1960-61 prices due to
the lack of co-operative credit which led to stagnation in
the growth of inputs like fertilizers. tubewells, electric
.otors. tractors, and the lack of unified management of
.,riculture at the State level during this period. However.
the growth picked up again after 1977 when it recorded a rate
of more than 8 per cent in the next two years (1977 to 1979)
(Gill M S. 1981. p. 6-8).
76
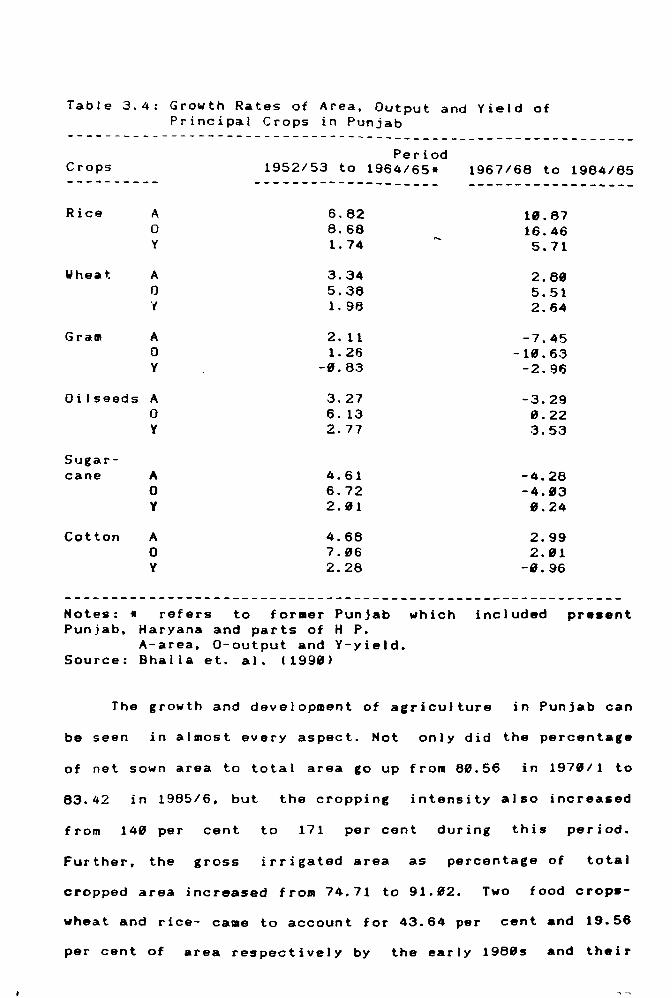
Table 3.4: Growth Rates of Area, Output and Yield of Principal Crops in Punjab
-------------------------------------------------------------Crops
Rice A o Y
Wheat A o 't
Grall A
Oilseeds
Sugar-cane
Cotton
o y
A 0 Y
A 0 Y
A 0 Y
Period 1952/53 to 1964/65.
--------------------6.62 8.66 1. 74
3.34 5.36 1. 98
2.11 1. 26
-0.83
3.27 6.13 2.77
4.61 6.72 2.91
4.66 7.06 2.26
1967/68 to 1984/85
19.67 16.46 5.71
2.89 5.51 2.64
-7.45 -10.63 -2.96
-3.29 0.22 3.53
-4.28 -4.93 9.24
2.99 2.01
-9.96
Hotes: * refers to former Punjab which included pr ••• nt Punjab. Haryana and parts of H P.
A-area. O-output and V-yield. Source: Bhalla et. al. (199")
The growth and development of agriculture in Punjab can
be seen in almost every aspect. Not only did the percentage
of net sown area to total area go up from 80.56 in 1979/1 to
83.42 in 1965/6. but the cropping intensity also increased
from 149 per cent to 171 per cent during this period.
Further. the gross irrigated area as percentage of total
cropped area increased from 74.71 to 91.92. Two food crop.-
wheat and rice- came to account for 43.64 per cent and 19.56
per cent of area respectively by the early 19805 and their
yields also registered significant increases. IoIhereas the
yield of wheat went up from 2238 kilograms per hectare in
197~/1 to 3531 kilograms in 1985/6, in the case of paddy it:
went up from 1765 kilograms to 32~~ kilograms during the same
period (Chand, 1991, pp. 58-6") . The different districts and •
regions of the State went in for parti&Ular crop-rotations.
At present, of the total of twelve districts of the State.
whereas two districts each have rotations of wheat-rice-
cotton, wheat-cotton-rice, and wheat-maize-rice, the
remaining six districts have the rotation of wheat-rice-maize
(Chaurasia et al., 1991, pp.326-32).
This transformation of the Punjab agriculture can be
explained only in terms of a combination of several
institutional, technological, and infrastructural factor •.
Besides. the infrastructural and technological changes during
the period of Green Revolution, the price pol icy of the
government and the political clout of the Punjab peasantry is
also to be considered as agriculture was always given a prime
place in the government's scheme of deve I opmen t. The
contribution of the new technology can be gauged fro. the
fact that the input structure of the Punjab agriculture ca ••
to be dominated by purchased inputs. By 1988/1, the share of
purchased inputs increased to 87 per cent from that of only
38 per cent in 1960/1 and 40 per cent in 1965/6 (Bhalla,
1990, p. 24). But. the pattern of transition fro.. the
traditional to modern varieties varied significantly crop by
crop. Whereas the adopt i on ra te in wheat was very f as t, it
was initially slow in rice but picked up later.
7R -
But this does not mean that Punjab does not have
regional varia+.ions in agricultural growth. While some
districts have shown remarkable growth. others have lagged
behind. Besides. different districts have done well in
in different crops. The yields of paddy were highest
Ludhiana followed by Sangrur. Bathinda and Faridkot; in wheat
Ludhiana, Faridkot, Sangrur and Ferozpur recorded very high
yields. In maize. top ranks were occupied by Jalandhar,
Ludhiana and Amritsar. The yield of sugarcane was very high
in the districts of Ferozpur, Jalandhar and Ludhiana. The
other notable disparity was in the cropping intensity. It
varied between 174 for Ludhiana and 143 for Kapurthala in
1980/81 (Singh P, 1983, p. 45).
An analysis of the changes in crop productivity at the
tehsil level over the period 1965/66 to 1985/86 reveals that
the range of disparity between the higher productivity and
lower productivity regions has decreased during the period.
The area under low productivity category has come down, and
that under moderate productivity category has remained the
same, while the high overal I crop productivity recion has
increased. It was noticed that the regions of overal I
productivity categories changed over time. The increase in
yields was not uniform across all the regions. The high
productivity zone got shifted towards southern districts.
Whereas some areas were able to maintain their ranking in
productivity. some others improved it and some others lost it
compared to their position in 1965/66 (Saini, 1991, pp. 324-
79

325).
However, during the 19805, the phenomenon of Green
Revolution seems to have tapered off and its after-effects
are now surfacing. A comparison of growth rates of area.
output and yield for the major food and non-food crops for
the periods 1969-70 to 1979-80 and 1979-80 to 1988-89 reveals
that al I the three variables experienced a decline in growth
rates in the second period over the first one for both food
• s we I I as non-food crops . The decline was particularly
sharp for rice and maize (Cf1IE. 1990. p. 165).
The data for the period 1981/2 to 1983/4 reveals that in
the case of wheat there was a significant decline in per
hectare use of human and bullock labour and moderate decline
in fertilizers compared to the late 19709. 5 i .. i I a r I y. pe r
hectare use of variable inputs was found to be lower during
the 1980s in the case of paddy and cotton cultivation also.
The yield of cotton touched the lowest point durinl this
period. Thus. during this period of four years. the cost of
cultivation increased by 50 per cent in the case of wheat. 75
per cent in the case of paddy and 83 per cent in the case of
cotton. However, gross returns on these crops during this
period increased only by 40, 41 and 21 per cent respectively
In the Case of wheat, paddy and cotton. Thus, the cost
increasing at a rate faster than that of ,ross returns
resulted in lowering down the rate of return. Whereas the
output-cost ratios came down significantly in the case of
wheat and paddy, it fell to le9s than 1:1 in the case of
80

cotton (Chand, 1991, pp. 102- 106 , . Besides this,
intensive agriculture in Punjab has led to many other
ecological and env i ronmen ta I prob I ems such as ground water
depletion, water logging, so i I deficiency, destruction of
genetic diversity, etc. (Shiva, 1989),
The outer limits of profitable investments in
agricultu~e have now been reached and consequently the scope
for use of agicultural surpluses for capital investments in
the farm sector is steadily narrowing down. Not many
opportunities of profitble investment outside the
agricultural sector exist in the State. The credit-deposit
ratio in Punjab at the end of 1989 was 44.5 against an at I
India figure of 64.7 per cent and was one of the lowest in
the country. The corresponding figures for states like
Tamitnadu, Karnataka, Andhra Pradesh, Orissa and Maharashtra
were 98.4,90.7, 88.1, 84.0 and 77.0 res pec t i vel y.
55.5 per cent of the deposits mobilised in the state of
Punjab were being invested outside (Narayana, 1992, p. 2561.
In SUI1l, Punjab agriculture has to move
stage of development marked by a far
now
11I0re
to a higher
diversified
product ion, with multi-crop rotations and rich dividend
yielding produce. For this, the farmer wil I have to choose
crops and a product mix that combine high yields with high
unit price of the produce.
81
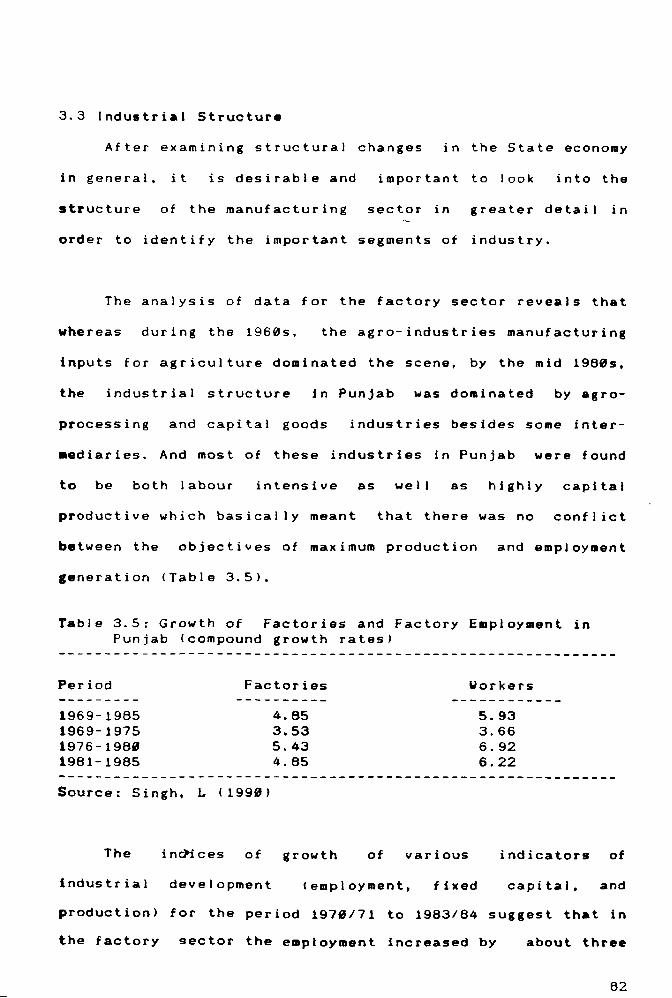
3.3 Industrial Structure
After examining structural changes in the State economy
in general, it is desirable and important to look into the
structure of the manufacturing sector in greater detail in
order to identify the important segments of industry.
The analysis of data for the factory sector reveals that
whereas during the 1960s, the agro-industries manufacturing
inputs for agriculture dominated the scene, by the mid 19805,
the industrial structure in Punjab was dominated by agro-
processing and capital goods industries besides some inter-
.ediaries. And most of these industries in Punjab were found
to be both labour intensive as well as highly capital
productive which basically meant that there was no conflict
between the objectives of maximum production and employment
leneration (Table 3.5).
Table 3.5: Growth of Factories and Factory Employment in Punjab (compound growth rates)
Period
1969-1985 1969-1975 1976-1980 1981-1985
Factories
4.85 3.53 5.43 4.85
Workers
5.93 3.66 6.92 6.22
------------------------------------------------------------Source: Singh, L (1990)
The in"ices of growth of various indicators of
industrial development (emp I oyment, fixed capital, and
production) for the period 1970/71 to 1983/84 suggest that in
the factory sector the employment increased by about three
82
it was more than th~ increases in output and
capital investment. However, the compound growth rates for
the same period suggested that growth of employment was much
lower than that of fixed capital and output and there ",as a
trend towards deceleration in industrial employment during
the early 19805. This was confirmed by the trend rates of
growth as well, wherein over the period 1970/1 to 1983/4.
employment registered only a growth rate of 8.42 against
13.52 in fixed capital (for 1975/6 to 1983/4) and 8.26 in
production (Sharma, 1988. pp. 103-106).
The growth pattern of large/medium scale and smal I scale
sectors in the factory sector over the 19805 reveals that the
number of units in the large/medium sector did not even
double during this period; in the small scale sector, the
Ifowth of number of units was more than three-fold. Location
wise. most of the large/medium units were concentrated in
the districts of Amritsar, Hoshiarpur, Lud hi ana, Patiala,
Ropar and Sangrur, most of which lie on the Grand Trunk Road.
Likewise, most of the small scale units are also concentrated
in these districts (except Sangrur) besides Jalandhar. which
does not have many large/medium scale units. The trend rates
of growth for the period 1966-83 revealed that Ludhiana,
Patiala, Sangrur. Hoshiarpur, Bathinda, Faridkot and Rupnagar
registered very high growth in industrial employment (Singh
and Bhangoo, 1988, p. 61).
In 1980. Ludhiana alone accounted for about 29 per cent
of registered factories as well as workers e.ployed therein,
83
f 0 I I 0\~ed by Amritsar (16.39 and 1.3.70), ,Jalandhar (14.47 and
12.471 and Patiala (6.94 and 11.2.3) (Singh P, 198:3, p. 156).
other hand, Bathir"da, Faridkot.
and ~apurthala continue to be industrially backward in both
the large and sma I I scale sectors ( i n~c I IJd i n g Sangrur).
However, given their smal I
during the 19805 has be""n
base in the
encouraging
1970s, the progress
in most of these
districts. This was revealed by the co""fficient of variation
analysis for the 1970:; as well. Whereas disparities among
districts declined in the smal I scale sector. they increased
in the large and medium scale sectors. However. as a whole,
the inter-district disparities in industrial development in
Punjab did decline during the 1970s (Bawa and Sharma,
1963) .
1982 t..
The analysis of the relative shares of smedl scale and
large scale
significant
sectors over the decade of 1970s brings out the
contribution of the sma II scale sector in
employment generation at low capital cost. I t was found that
in 1983/4. the smal I scale sector with a share of only 38.49
per cent in fixed capital investment, accounted for 77.42 per
cent of employment and 49.04 per cent of output of the
industrial sector. On the other hand. the large scale sector
with 61.51 per cent ot fixed capital provided employment only
to 22.58 per cent of the industrial work force and produced
only as much as the small scale sector. The regression
analysis for the same period also suggested that though the
large scale sector had an edge over the smal I scale one in
terms of labour productivity, it was no better than the small

sector in terms of the capital cost of generating employment
(Sharma, 1988. pp. 113-114).
The size-distribution of the factory sector units and
employment reveals that over time there has been a trend
wherein the share of large and medium scale units in the
total has been going up and that of the small scale units is
declining in absolute as well as in relative terms. This
comes out clearly from the Gini Co-efficient of inequality
which went up fro. 0.62 in 1966 to 0.73 in 1983. 1 n fact,
t~e small-size categories experienced negative rates of
.rowth over the period 1966 - 1985 (Table 3.6). Over ti •• ,
the small scale units have developed into mediu. and large
scale units in many instances. This could be one of the
reasons for the increase in the share of larse/.ediu. units
(Bhalla, 1990, p. 28).
Table 3.6: Growth and Distribution of Industrial EmplOYMent in the Factory Seclor by Size-groups ot Industries, 1966-1987 (Per cenl shares in total employmenl ot workers)
---------------------------------------------------------------Year Size-groups (No. of workers)
----------------------------------------------------------~.'"; <10 10-20 20-50 50-100 100-500 500-1000 >1000
----------------------------------------------------------1966 4.54 16. 17 20. 14 14.83 20.39 9.47 14.45
1970 7. 16 16.83 18.85 14.53 18.74 10.53 13.35
1975 7.11 13.72 19.99 11. 81 21.04 18.88 18.24
1980 4.23 10.22 16.66 18. 12 21.20 8.68 28.89
1985 2.66 6.69 11. 12 9.48 22.97 13.79 33.35-
1987 1. 98 6.57 9.50 7.41 27.58 14.88 32.72-(-1.69) (-3.39) (-1. 99) (-1.31' ( 1.56 , (2.88) (4.33)
---------------------------------------------------------------Note: *
Source:
includes workers employed in the only factory in the state which had an employment of aore than 5888 worker •• Figures in brackets are the co.pound rates of growth of e.ploy.ent in each category over the period 1966-1965. Statistical Abstract of Punjab - various years.
85

The analysis of industry-wise number of units and
employment reveals that though the industrial structure is
stil I dominated by only a few industry groups, there has been
a trend towards more diversification within manufacturing
with the emergence of new types of ind~stries. Whereas in
1966, only five industries (machine tool and parts, wool,
silk and synthetic textiles, cotton textiles, food products,
and transport equipment and parts) accounted for about 3/4th
of total industrial work force. by 1985 at least two of them
had lost their relative position and a few new ones I ike
basic metal and alloys, paper and paper products, beverages
and tobacco products, and non-metallic mineral products had
gained a significant position in the industrial sector of the
State in terms of their contribution to employment in the
factory sector. The positive aspect of this diversification
in the industrial sector is that it occurred in the presence
of absolute growth of all the industries except wood and wood
products (Table 3.7).
Another way to look at the progress of industrialisation
according to Hoffman (1956) is to analyse the nature of
commodities produced by the manufacturing sector. Where~s in
the initial stages, the consumer goods industries
predominate. their share in total output declines ~s the
share of capital goods sector goes up. The incre~sing sh~re
of capital goods, according to Hoffman, is the indicator of
progress towards mature industrial economy.
the analysis of industrial production in
From this angle,
Punjab over two
66
decades reveals that the ratio of consumer goods to capital
goods has substantially come down from 5.99:1 in 1966 to
1.38: 1 by 1982-83 (Sharma, 1988, p. 118).
3.4 Concluding Relllarks
What comes out clearly from these different approaches
to the analysis of industrial structure in Punjab is that the
industrial structure has a lot to do with the agricultural
development in the State. The linkages between agriculture
and industry led to the growth of agro-based industries- both
input as 'oolell as output based. This study of industrial
pattern shows that in 1970-71 about 52 per cent of workers
were engaged in industries which drew their raw materials
from the agricultural sector. The second type of industries
which drew
Supplying
pesticides
their strength from agriculture were those
inputs to agriculture such as insecticides and
for which the demand was generated because of the
Green Revolution. Thus, agriculture has been one of the most
important
strenghten
factors which contributed to initiate and
the process of industrialization in the State.
However. the flourishing rural market resulting frolll
Green Revolution has benefitted industrial development
elsewhere but only to a limited extent within the State
( Gill, 1983, p. 552). This is reflected in the footloose
nature of many industries in the State wherein they obtain
their raw material supplies from other States and haye their
markets outside the State ( Table 3.8). Further. the credit-
deposit ratio indicates that the benefits of Green Revolution
87
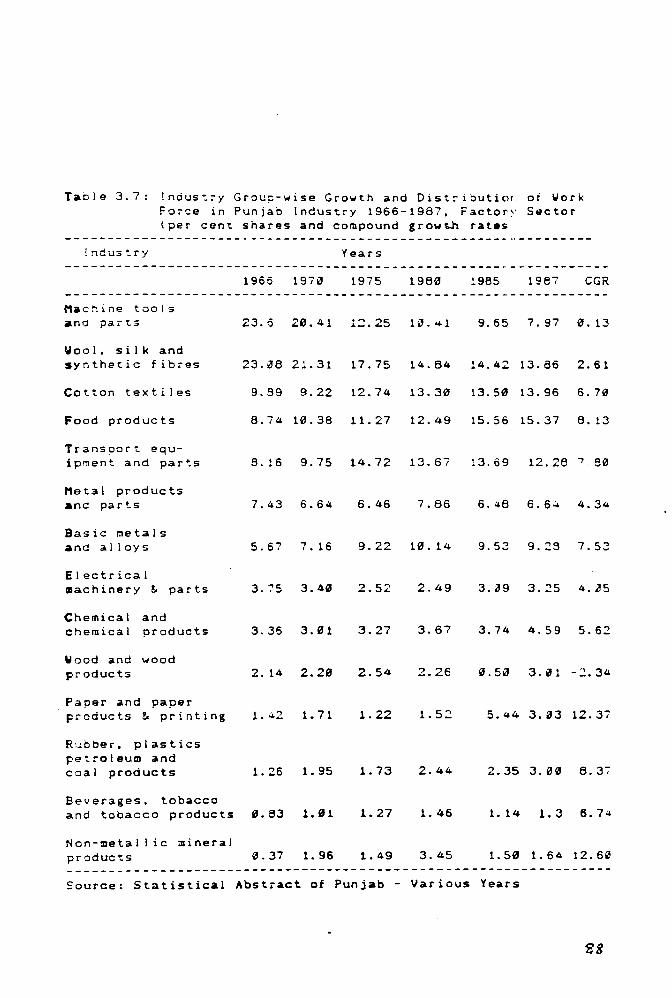
Table 3.7: lndus-:.:-y Grol.!;::-wise Growth and Dist:-i::,utioL of 'Jork Force in Punjab Industry 1966-1987, Factor~ Sector (per cent shares and compound grow~ rates
Industry
Mac~ine tools ana parts
10100 I, s ilk and synthetic fibres
Cotton textiles
Food products
Transport equipment and parts
Met.al products and par ts
Basic metals and al loys
Electrical machinery ~ parts
Chemical and chemica I products
Wood and wood products
P a per and pace r products ~ printing
Rubber, plastics pet.roleum and coa I products
Beverages, tobacco
'fears
1966 1970 1975 1980
23.6 20.41 12.25 1~.~1
23.a821.31 17.75 14.84
9.99 9.22 12.74 13.30
8.74 10.38 11.27 12.49
9.!6 9.75 14.72 13.6,
7.43 6.64 6.46 7.86
5.57 7.16 9.22 U.14
3.75 3.40 2.52 2.49
3.36 3.01 3.27 3.67
2. 14 2.20 2.54 2.26
1. .:.2 1.71 1. 22 1. 52
1. 26 1. 95 1. 73 2.44
and tobacco products 0.83 1.01 1. 27 1. 46
Non-metal I ic iIIineral products 0. 37 1. 96 1. 49 3.45
!.98S 1967 CGR
9.557.970.13
14.42 13.66 2.61
13.50 13.96 6.70
15.56 15.37 8.13
:3.69 12.26 ~8"
6.48 6.6~ 4.34
9.53 9.29 7.53
3.;)9 3.25 4.~5
3.74 4.59 5.62
0.50 3.01 -2.34
5.44 3.03 12.37
2.35 3.00 8.37
1.141.36.7.:.
1.50 1.64 12.60 -----------------------------------------------------------------Source: Statistical Abstract of Punjab - Various Years
Z8
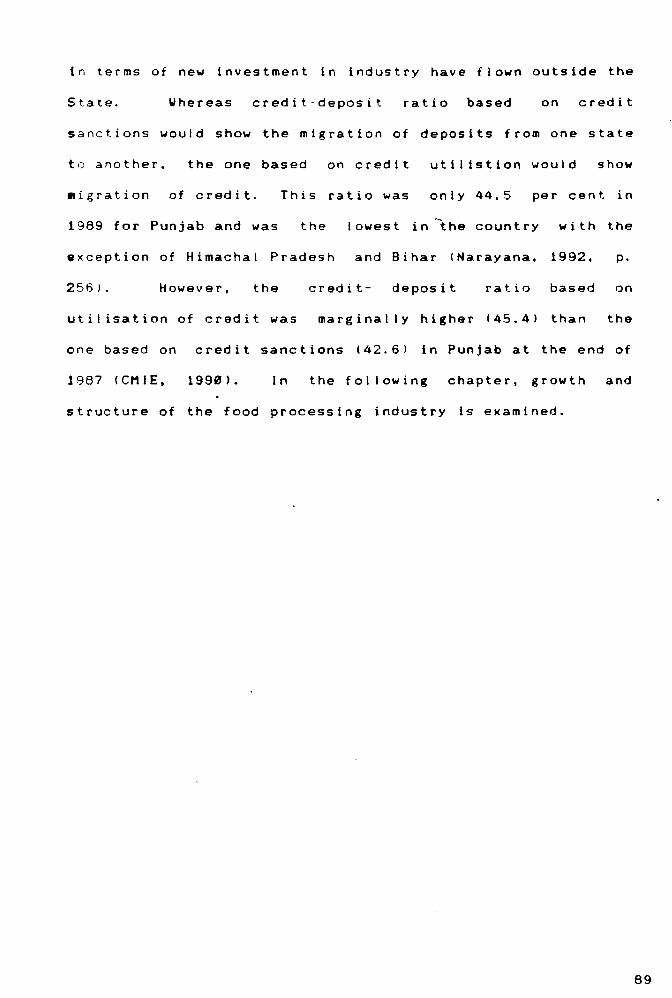
in terms of new investment in industry have flown outside the
State. Whereas credit-deposit ratio based on credit
sanctions would show the migration of deposits from one state
to another. the one based on credit utllistion would show
migration of credit. This ratio was only 44.5 per cent in
1989 for Punjab and was the lowest in the country with the
exception of Himachal Pradesh and Bihar (Narayana. 1992. p.
256) • However, the credit- deposit ratio based on
utilisation of credit was marginally higher (45.41 than the
one based on credit sanctions (42.61 in Punjab at the end of
1987 (CMIE, 1990). In the following chapter, growth and
structure of the food processing industry is examined.
89
Table 3.8
Percentage of Output Sold within the Region (Punjab -Haryana) by Select.ed Industries (1984)
Indust.ry Per cent
Wool len hosiery 9. 1
Rubber footwear 14.0
Water pipe fittings 22.0
HandtooIs and smal I tools 4.2
Bolts and nut.s 14.4
Agricultural implements 16. 1
Utensils 12.3
P'lachine tools 16. 1
Sewing and knitting machines 18.2
Auto parts 17.8
Bicycle and cycle parts 18.4
Scientific instruments 9. 1
Sports goods 2.3
Source: Pandit, M L (1985) p. 91.
Chapter 4
GRO~TH AND STRUCTURE OF THE FOOD PROCESSING INDUSTRY IN PUNJAB: 1969 - 1988
This chapter deals with the growth and structure of the
food processing sector of the Punjab economy, based on
secondary data. It looks at this industry at the district
level and seeks to study its linkages. Also, the question of
relative production efficiency of the small scale sector is
addressed with the help of secondary data. The analysis is
for the period 1969 to 1988 in general and for the 1980s for
purposes of comparison.
4. 1 Introduction
The dominance of non-household (factory and non-factory)
sector and private enterprise are two salient features of the
industrial sector of Punjab which accounts for about 13 per
cent of the Net State Domestic Product (NSDP) as wei I as
total work force in the State. Though the industrial sector
of the State is considered to be dominated by small scale
units; over the years, the employment share of the sma I I
Scale industry in the organised sector has fallen quite
Considerably. Within the organised industrial sector, the
&gro-processing industries (cotton textiles, wool, silk and
SYnthetic fibres, food products, beverages and wood and wood
q.

products) which had an employment share of 46 per cent in
1966 were able to maintain it even during the 1989's when
they accounted for 49 per cent of the total organised sector
industrial employment in the State in 1985 (see Table 3.7 in
Chapter 3). Further. the food processing industry not only
increased its relative share within the agro-processing
sector from 19 per cent of employment in 1966 to 26 per cent
in 1983 while growing at a trend rate of about 8 per cent
during the period 1966-85; but also, was accounting for 13
per cent of the total organised industrial employment by 1983
which was only 9 per cent in 1966.
4.2 Growth and Structure
The food processing industry in Punjab is organised (or
fUnctions) at three levels - factory sector, small scale
sector and the unorganised sector (for definitions and
coverage of these sectors see Appendix to this Chapterl. The
Sources of data on the unorganised sector are quite scanty.
The only source we are aware of is the Directory
"anufacturing Establishments Surveys (DMESI conducted in
1978\9 and 1984\5. The sources of information on the other
two sectors (factory and small scale) are the Annual Survey
of Industries and the Directorate of Industries. Punjab
respectively.
92
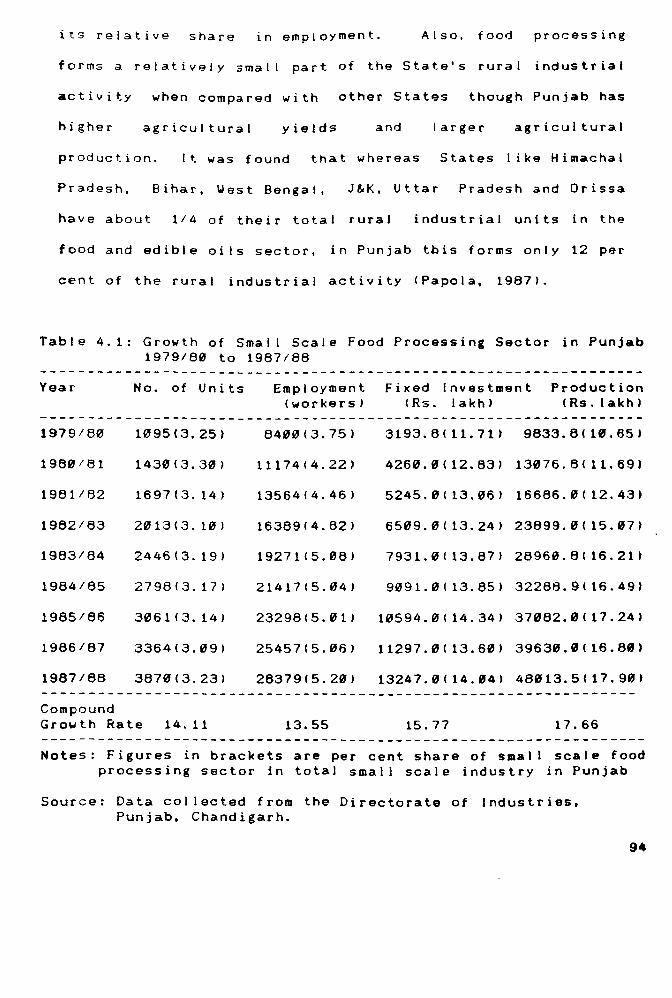
its relative share in employment. Also. food processing
forms a relatively small part of the State's rural industrial
activity when compared with other States though Punjab has
higher agricultural yields and larger agricultural
production. It was found that whereas States I ike Himachal
Pradesh, Bihar, West Bengal, J&K, Uttar Pradesh and Orissa
have about 1/4 of their total rural industrial units in the
food and edible oils sector, in Punjab this forms only 12 per
cent of the rural industrial activity (Papola, 1987).
Table 4.1: Growth of Smal I Scale Food Processing Sector in Punjab 1979/80 to 1987/88
Year
1979/80
1960/81
1961/82
1962/83
1963/84
1984/85
1965/86
1966/87
1967/88
No. of Units
1~9513.251
143013.30)
169713.14)
2013(3.10)
2446(3.19)
2798(3.171
306113.14)
3364(3.09)
3670(3.23)
Employment (workers)
8400(3.751
11174(4.22)
13564(4.46)
16369(4.82)
19271(5.08)
21417(5.04)
23298 (5.01 )
25457(5.06)
28379(5.20)
Fixed Investment (Rs. lakh)
Production (Rs.lakhl
3193. 8 ( 11. 71 ) 9633.61 UL 65)
4260.0(12.83) 13076.8(11.691
5245.0113.06) 16686.0(12.431
6509. 0 ( 13. 24 ) 23899.0115.07)
7931. 0 (13.871 28960.8 ( 16.211
9091. 0 (13.85) 32288.9(16.49)
1 ~ 594 . 0 ( 14. 34 ) 37082.0( 17.24)
11297.0 ( 13.60) 39630.0 ( 16.60'
13247.0(14.04) 48013.5(17.90' ----------------------------------------------------------------Compound Growth Rate 14.11 13.55 15.77 17.66
Notes: Figures in brackets are per cent share of smal I scale food processing sector in total small scale industry in Punjab
Source: Data collected from the Directorate of Industries, Punjab. Chandigarh.
94

Within the organised sector. though the number of food
proce5sin~ units in the non-census sector in Punjab has
always been more than the census sector. the growth of the
latter was relatively high especially during the latter half
of 1970s. It was this sector which contributed to the high
growth of the organised sector food processing industry after
the mid 19705. In the first half of 1980s, the industry did
not perform well and in some years. it even recorded negative
growth in terms of number of units.
The employment in the food processing industry
(organised sector) grew at a higher rate than the production
during the 1970s and the 1980s (Table 4.2). Though the
factory sector accounts for about 2/3 of the total employment
in food processing. during the 1980s. it was the small scale
sector which led to significant increases in employment. It
had a compound growth of more than 13 per cent in employment
as against about less than 4 per cent of the factory
during this period (Table 4.3).
sector
This is also corroborated by the declining rates of
employment growth in the census sector after the 1970s (Table
4.3) . So far as the relative growth performance is
concerned, whereas the factory sector in food processing did
95
not show any departure in growth rates from that of the
factory sector as a whole during the 1980's, the small scale
food processing sector grew at much higher rates than both
the smal I scale sector industry of the State as a whole as
well as the factory sector of the State's food processing
industry in al I terms like number of units, fixed investment,
employment and production. The differenc! was particularly
sharp in case of numb~r of units and employment. The growth
rates were further low in the census sector of the food
processing industry (Table 4.3).
But the growth in production and employment was mainly
contributed by the primary processing industries like rice
mil ling which grew at rates much higher than the average
growth of food processing as such; both in output and
employment, and the share of rice milling in production and
employment went up from 18 per cent and 16 per cent in 1980-
81 to 27 per cent and 21 per cent respectively in 1964-65.
The growth of rice mil ling was the result of the changed
cropping pattern in the State wherein rice cultivation began
in the
19605,
late 1960s and became the second major crop in the
and the rice shellers were a primary requirement for
paddy processing. On the other hand, another major industry
96

I Table 4.2: Production and Employment in Food Processing
Industry in Punjab (Organised Sector) -------------------------------------------------------------Year
1970171 1971172 1972173 1973174 1974/75 1975/76 1976/77 1977 178 1978179 1979/88 1980/81 1981182 1982/83 1983/84 1984/85 1985/86 1986/87
Compound growth rate
Production-( Rs. iakh) ---------10345.11 9859.54
11139.74 11797.09 11979.36 15059.79 15647.58 17188.38 21113.24 19400.61 19917.15 24512.39 27997.20 29192.21 26683.75 29324.48 32467.65(P)
6.7
Hote: P-provisional
Ellployment ( No. of workers)
------------------16273 16115 18258 29755 22508 23338 25577 27434 39344
35279 36410 42782 46783 52146 56522 64585 73188(P)
8.8
* -production values have been adjusted at 1979/71 prices by deflating with the wholesale price index for .anufactured products as given in the Econo.ic Survey, 1984/85 and 1988/89.
Source: Statistical Abstract of Punjab and the Industries Department, Govt. of Punjab, Chandigarh.
in Punjab in the early 1979s (sugar) lost its momentu. in the
late 19795 and early 19895. Though it could .aint.in its
relative share in production (5 per cent) during the 19895,
its share in employment came down to 8 per cent in 1985/6
froll 13 per cent in 1989/1. Perhaps, this was one of the
reasons for the reduction of area under sugarcane durina the
19895.
97
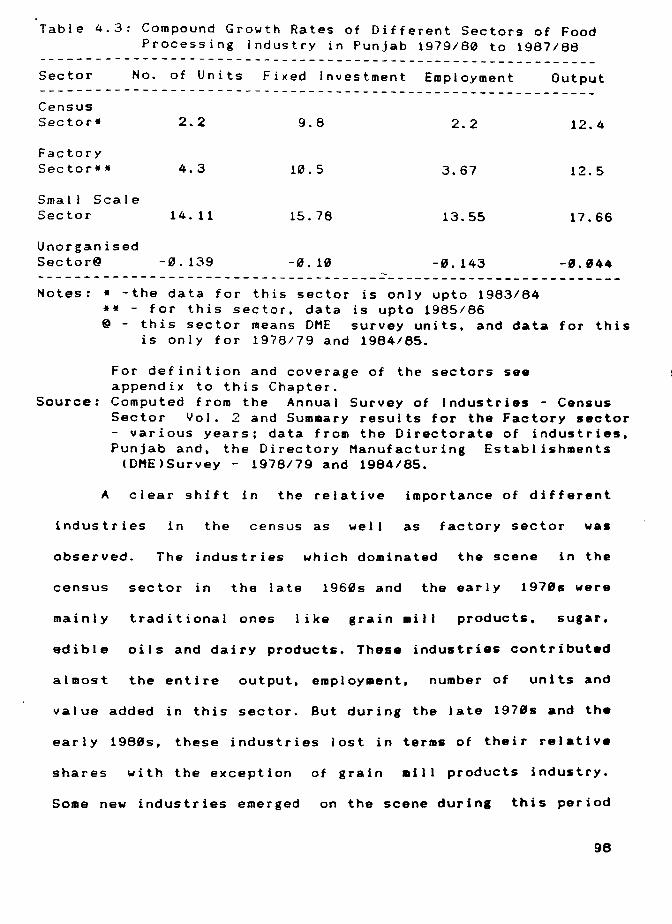
Table 4.3: Compound Growth Rates of Different Sectors of Food Processing Industry in Punjab 1979/80 to 1987/88
-------------------------------------------------------------Sector No. of Units Fixed Investment Employment Output -------------------------------------------------------------Census Sector. 2.2 9.8 2.2 12.4
Factory Sector*. 4.3 10.5 3.67 12.5
Small Scale Sector 14. 11 15.78 13.55 17.66
Unorganised Sector@ -0.139 -0.10 -0.143 -e.e44
~ ----------------------------------------------------------------Notes: • -the data for this sector is only upto 1983/64
** - for this sector. data is upto 1985/86 @ - this sector means DME survey units. and data for this
is only for 1978/79 and 1984/65.
For definition and coverage of the sectors see appendix to this Chapter.
Source: Computed from the Annual Survey of Industries - Census Sector Vol. 2 and Summary results for the Factory sector - various years; data from the Directorate of industries, Punjab and, the Directory Manufacturing Establishments
(OME)Survey - 1978/79 and 1984/85.
A clear shift in the relative importance of different
industries in the census as well as factory sector was
observed. The industries which dominated the scene in the
census sector in the late 1960s and the early 19705 were
mainly traditional ones like grain .ill products, sugar.
edible oils and dairy products. These industries contributed
almost the entire output, employment, number of units and
value added in this sector. But during the late 19705 and the
early 19805, these industries lost in terms of their relative
shares with the exception of grain .ill products industry.
Some new industries emerged on the scene during this period
96

which were secondary processing ones in their nature. Among
them were bakeries and the fruit and vegetable processin~
'Jnits. But they could not: canle out: a very distinct place in
t~h e f 00 d pro c e s sin g sec tor (T a b I e 4. 4 I •
But in the 1980 s. in the factory sector as a whole.
though there was an emergence of new types of food processing
industries like bakeries. ~ruit and vegetable products,
starch and animal feeds, the traditional industries
Grain mill continued to grow and dominate the scene.
prodl.Jc ts, dairy products, sugar. and edible oils were thQ~
major contributors to total employment, output and value
added in this industry though sugar industry los t its
relative share in employment quite substantially during thQ
first half of 19805 (Table 4.5),
This pattern of growth in food processing in Punjab.
espec ia I I y in the census sector is also bornQ out by thQ
individual industry growth rates over the period 1969 to
1962/3. Very high annual growth rates were observed in grain
mi I I products and dairy industry, especially after the mid
1970s. On the other hand, the performance of fruits and
vegetable processing was quitQ dismal. The sugar industry,
lost its relative position and had a fall in valu.,
added after the mid 19705, but eKperienced an absolute growth
in employment and output. Even in the factory sector,
99

Table 4.4: Changes in Relative Shares of Different Industrie. in the Census Sector of Food Processing Industry durinc 1969 to 1982/83
--------------------------------------------------------------------
Years and Industry category Icodesl Variables 201 202 2"4 205 2"6 21'1 211 216 ----------- -------------------------------------------------------No. of units -----------1969 2".8 2".8 58.4 1973/74 9.5 26.2 14.3 11.9 38.1 1978/79 4.7 7.9 62.2 4.7 5.5 hJ.2 1982183 2.7 1.8 79. 1 2.7 2." 4.1 5.1 1.1
Employment Iworkersl --------
1969 14.0 68.6 17.4 1973/74 25.2 13.0 36." 18.3 15.4 l. 1978/79 6.2 14.5 31. 8 25.6 5." 5.1 1982/83 6.9 3.5 49.3 6. 1 17.5 5.9 3.6 2.0
Value of Output -------1969 42.0 28.2 29.9 1973/74 26.2 14.2 8.4 36.6 14.5 1978/79 19.6 9.6 22.0 161.3 24.0 5.5 1962/83 19. 1 1.3 28.6 2.4 6.4 33.7 5.2 1.2
Net 'Ja I ue added -------1969 31. 1 31. 3 37.6 1973/74 69.4 6.0 1.6 14.2 8.8 1978/79 21. 9 23.5 9.6 15.2 12.2 -1.5 1982/83 42.7 1.5 16.6 3.3 7.8 2".3 1.5 2.4 ------------------------------------------------------ -----------------Note: For descriptions of the industry codes, see Appendix at the end of
the chapter. Source: Central Statisticai Organisation: Annual Survey of Industries -
Census sector; 1969. 1973/74, 1978/79 and 1982/83.
lor
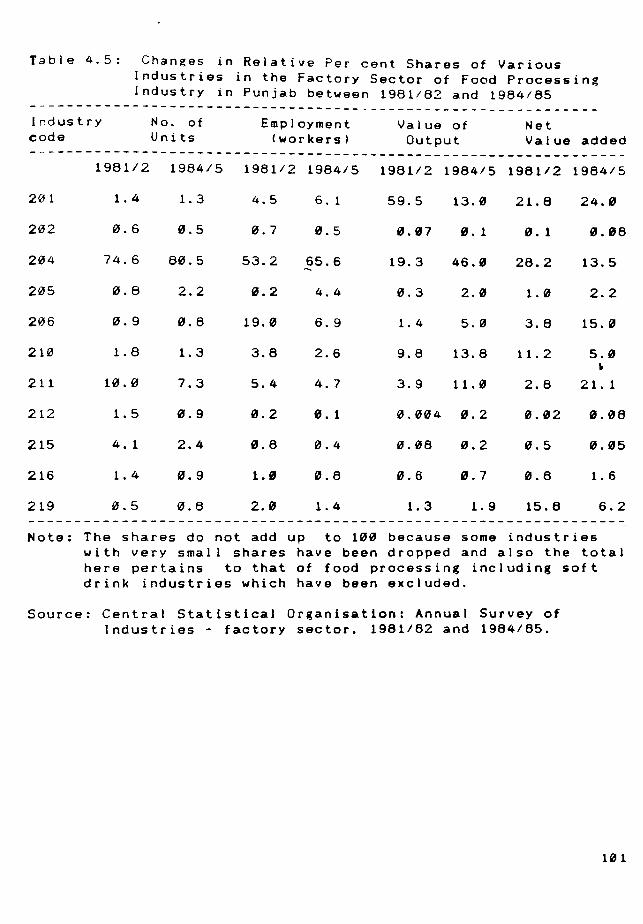
Table 4.5: Chan~es in Relative Per cent Shares ot Various Industries in the Factory Sector at Food Processing Industry in Punjab between 1981/82 and 1984/85
--------------------------------------------------------------Industry code
No. of Un its
Employment (workers)
Value at Output
Net Value added
-----------------------------------------------------------------
201
202
204
205
206
210
211
212
215
216
219
1981/2 1984/5 1981/2 1984/5 1981/2 1984/5 1981/2 1984/5
1.4 1.3 4.5
0.6 0.5 0.7
74.6 80.5 53.2
0.8 2.2 0.2
0.9 0.8 19.0
1.8 1.3 3.8
10.0 7.3 5.4
1.5 0.9 0.2
4.1 2.4 0.8
1.4 0.9 1.8
0.5 0.8 2.0
6. 1 59.5 13.0
0.5 0.07 0.1
65.6 19.3 46.0 ~
4.4 0.3 2.0
6.9 1.4 5.0
2.6 9.8 13.8
4.7 3.9 11.0
0. 1 0.004 0.2
0.4 0.08 0.2
0.8 0.6 0.7
1.4 1.3 1.9
21. 8 24.0
0. 1 0.08
28.2 13.5
1.0 2.2
3.8 15.0
11. 2 5.0 •
2.8 21.1
0.02 0.08
0.5 0.05
0.8 1.6
15.8 6.2
Note: The shares do not add up to 100 because some industries with very small shares have been dropped and also the total here pertains to that ot food processing including soft drink industries which have been excluded.
Source: Central Statistical Organisation: Annual Survey of Industries - factory sector. 1981/82 and 1984/85.
101

similar trends and patterns were emerging. With the exception
of grain mi II products, all the traditional industries were
showing dismal performance; with sugar, dairy products and
edible oils losing in employment. The pertormance of bakery
products in terms of output, value added, employ.ent and
capital invested was encouraging.
Elementary ratio analysis across industries within food
processing over the period 1969 - 1982/3 revealed that In the
census sector, the dairy industry experienced a decline In
capital productivity quite substantially and cost of I abolJr
in terms of capital went up over time. However, there was a
significant perceptible increase in labour productlvlty
which could mean that there was capital
modernisation of technology in dairy industry.
intensive
This was
evident from the decline in employment (especially workers)
as we I I.
products
Similar trends were observed in fruit and vegetable
industry in the late 1970s and early 1980s, where
even the labour productivity declined over time. Even graln
mill products industry experienced a decline in both capital
and labour productivity (Table 4.6).
16'2
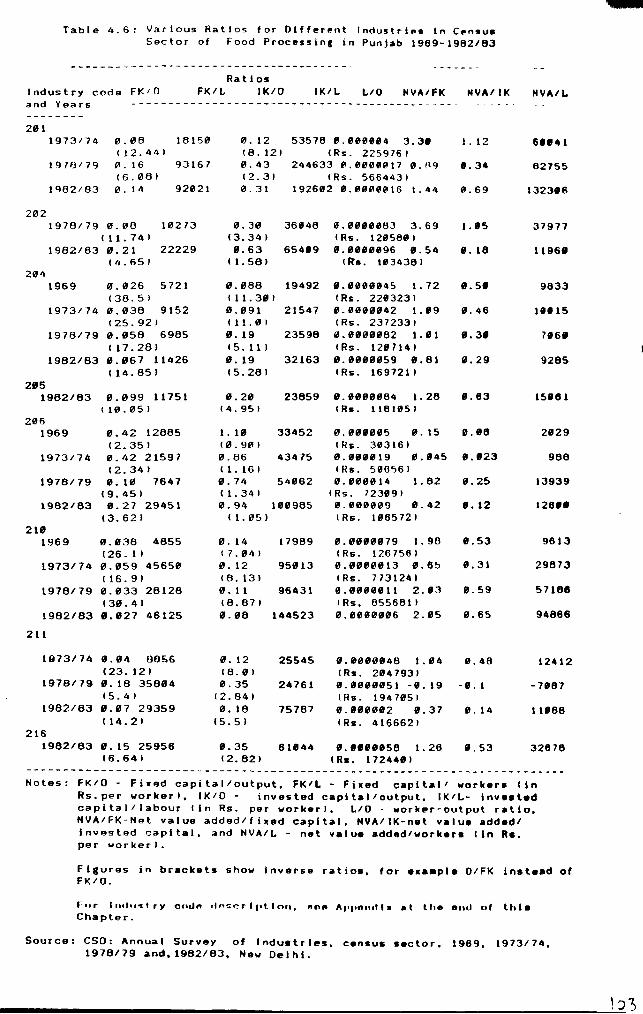
Table 4.6: Various Ratios for Olff~rent IndU5trl~. In Cf'n~u. Sector of Food Processing in Punjab 1969-1962/83
--------------------------------------- -------Ratios
Indus t ry code FtUO FK/L IK/O IK/L L/O HYA/FK HYA/IK HYA/L and Years ------------------------------------------------------201
1973/74 0.0B IB150 0. 12 53516 ". """884 3.3' 1. 12 61'41 ( 12.44 I (6.121 (Rs. 225976 I
I'HO/79 ". 16 93167 0.43 244633 0.0"08017 0.~9 '.34 62755 (6.081 (2.31 (Rs. 5664431
1982/83 0. 1" 92021 0.31 192602 ".0""""'16 1.44 0.69 1323.6
202 1918/79 0.08 10273 0.30 36'46 0. "0""063 3.69 1. "5 37977
(11.741 (3.341 (Rs. 120568 I 1982/83 0.21 22229 8.63 65419 o . "" """ 96 8.54 8. 18 1196.
(1,.65 I ( 1.58 I (If" . '034381 204
1969 0.026 5721 0.068 19492 8.8""""45 1. 72 ".5' 9633 (38.51 ( 1 1 . 30 I (Rs. 22"3231
1973/74 0.038 9152 0.891 21547 8. "''''''''42 1. 89 8.46 lUIS (25.921 111.'" IRs. 2372331
1978179 ".058 6985 8. 19 23598 0.0008082 1.81 8.3' 786. ( 17.28 I (5.111 (Rs. 128114 I
1982/83 8.067 11426 8.19 32163 8. "" "" 0 5 9 '.81 0.29 9285 (14.851 (5.281 (Rs. 1697211
2"5 1982/83 8.099 11751 0.20 23859 "."00"64 I. 28 ".83 15"81
(19.051 (4.951 (Rs. 1161"51 296
1969 0.42 12865 1. 10 33452 0.0"005 0. 15 0.'8 2.29 (2.351 10. 90 1 (Rs. 303161
1913174 8.42 21591 0.86 43415 0.8"0019 0.045 ' .• 23 968 (2.341 11. 161 ( !ls. 500561
1978119 ". 18 1641 0.14 54"62 0."""014 1. 82 0.25 13939 (9.451 ( 1.341 (Rs. 723091
1982163 0.27 29451 0.94 100965 0.0"0"09 0.42 '.12 128 •• (3.621 ( 1. 05 I (Rs. 1065721
210 1969 ".038 4655 ". 14 17989 "."00"019 1. 98 0.53 9613
(26. I I ( 7.041 IRs. 1267561 1913114 0.059 4565" 0. 12 95013 0.0""0013 0.85 0.31 29873
116.91 (8.13 I IRs. 7731241 1916119 0.033 26128 0. 1 1 96431 8.000"111 2.'3 ".59 51108
(30.41 (B. 67 I (Rs, 655681 I 1982/83 ".021 46125 ".08 144523 0."00''''6 2.05 0.65 94666
211
1973114 8.04 BaS6 •. 12 25545 '.010."46 I. "4 ".46 12412 (23.12 I 16 .• I IRs. 2"47931
1916119 8. 18 35684 0.35 24761 ".""00"51 - 0. 19 -I. I -7'67 (5.41 (2.64 I IRs. 1947051
1982/63 0.01 29359 0. 18 15187 0.'."""2 ".31 '.14 11188 ( 14.2 I (5.51 IRs. 4166621
216 1962/83 ". 15 25956 •. 35 61844 "."."'58 I. 26 ".53 32678
(6.641 12.B21 CR •• 11244" --------------------------------------------------------------------------Hotes: FK/O - Fixed capital/output, FK/L - Fixed capltall work.rs lin
Rs.per workerl, IK/O - invested capital/output, IK/L- Inv •• ted capltal1labour lin Rs. per workerl, L/O - workpr-output ratio, HYA/FK-Het value added/fi_ed capital, NYA/IK-n.t valu. add.dl invested t::apltal, and HVA/L - n.t value added/work.r. lin Ra. per workerl.
Figures in brackets show inverse ratios, for •••• pl. O/FK Inst •• d of FK/O.
r .. ,. 1."III .. ',.y ondn """"rll'lloll, "Oft AI'I,n" ..... t lite elld of thl. Chapter.
Source: CSO: Annual Survey of Indu.trles, c.nsus •• ctor, 1969, 1973114, 1978119 and. 1962/B3, New Delhi.
On the other hand. in the sugar and ve~etable oils
industries. both capital and labour productivities were
growing and the growth of labour productivity especially, was
very smooth. The trend was diametrically opposite in the
case of other edible oils industry where both capital and
labour productivities were falling.
Across industries, capital labour ratios (both fixed
capital and invested capital) were found to be low in grain
mill products. bakeries. fruits and vegetable processing. and
other ed ib leo i Is I ike mustard and groundnut. Even the
capital output ratio was low in these industries with the
exception of fruit and vegetable processing units. Capital
as well as labour productivity in terms of ratio of net value
added to capital (fixed and invested) and labour was quite
high only in dairy products, bakeries, hydrogenated oils, and
animal feeds.
But the sma I I scale sector of the food processing
industry, though growing at quite high rates. may be
misleading if not seen from within. What is important is the
content of growth in the small scale sector. This sector of
food processing in Punjab is dominated by only three
industries, two of them - rice mills and oil mills - bein,
primary processing ones. The third industry bread and
104
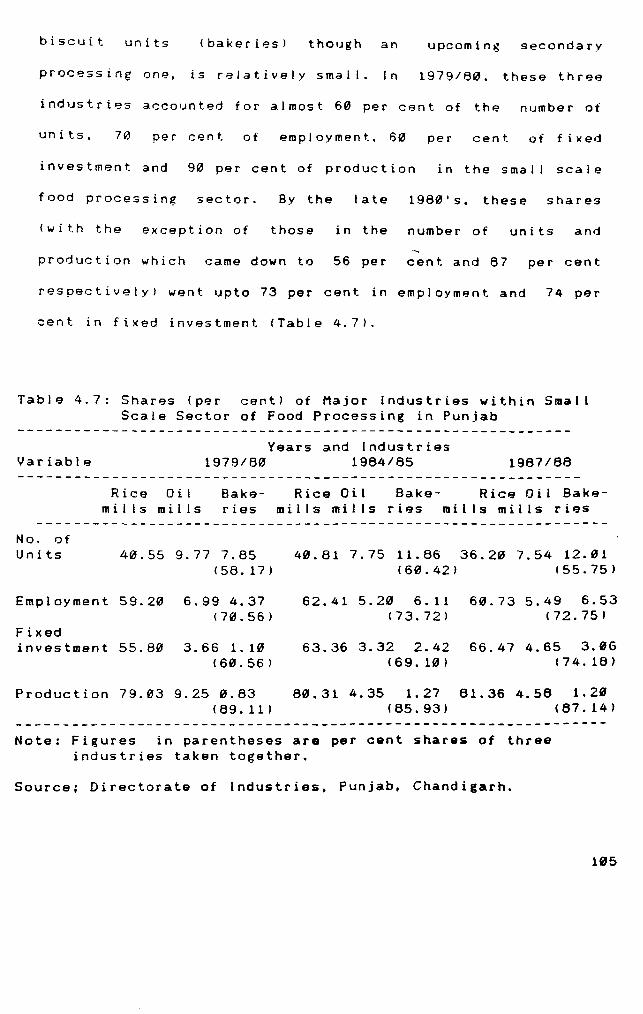
biscuit units (bakeries) though an upcoming secondary
processing one, is relatively small. In 1979/80. these three
industries accounted for almost 60 per cent of the number of
units. 70 per cent of employment, 60 per cent of f i)(ed
investment and 90 per cent of production in the small scale
food processing sector. By the late 1980's, these shares
(with the exception of those in the number of units and
production which came down to 56 per cent and 87 per cent
respectively) went up to 73 per cent in employment and 74 per
cent in fixed investment (Table 4.7).
Table 4.7: Shares (per cent) of Major Industries within Small Scale Sector of Food Processing in Punjab
Years and Industries Variable 1979/80 1984/85 1987/88
Rice Oil Bake- Rice Oil Bake- Rice Oil Bake-mills mills ries mills mills ries mills mills ries
No. of Units 40.55 9.77 7.85 40.81 7.75 11.86 36.20 7.54 12.01
(58. 17 ) (60.42) (55.75)
Employment 59.20 6.99 4.37 62.41 5.20 6. 11 60.73 5.49 6.53 (70.56) (73.72) (72.75)
Fixed investment 55.80 3.66 1.10 63.36 3.32 2.42 66.47 4.65 3.06
(60.56) (69.10 ) 174.18)
Production 79.03 9.25 0.83 80.31 4.35 1. 27 61.36 4.56 1. 20 (69.11) (65.93) (67.14)
Note: Figures in parentheses are per cent shares of three industries taken together.
Source; Directorate of Industries, Punjab, Chandigarh.
105
But, there was a relative stagnation in the share of
rice shellers which perhaps points to the saturation in area
and production of paddy because the growth of this industry
was the direct result of changed cropping pattern in the
State wherein paddy was cUltivated only in some pockets of
the State in the early 1970s; and it became the second major
crop in the 19805. The rice shellers were a primary
requirement for the handling of the 5tate'~ paddy production.
The oil mills too lost in terms of their relative shares. On
the other hand, bakery industry gained in a relative sense.
From the shares of 8 per cent in number of units, 4 per cent
per cent in fixed investment and 0.8 per in employment, 1
cent in production in 1979/80. it moved up to the shares of
12, 7, 3, and 1.2 per cent respectively by the late 1980's
(Table 4.7).
4.3 Agricultural Growth and Food Processing Industry
All this points to the lack of diversification in
Punjab's food processing industry. especially in the smal I
scale sector which perhaps could be the result of lack of
diversification in the agricultural economy of Punjab. The
question of lack of diversification was recognised in the
mid-1980s, and an expert committee under the chairmanship of
5.5. Johl was set up to look into the ways and means of
achieving diversification of agriculture in Punjab.
committee, which submitted its report in May, 1986,
The
made
106
recommendations which go beyond the issue of diversification
of agricul ture and have impl ications for other sectors as
well. It recommended the shifting of 20 per cent of the area
to fodder, horticultural and forest crops by 2001 A.D. to
take the Punjab agriculture out of the wheat-paddy rotation.
Another major recommendation of the committee was the
development of marketing and processing facilities for the to_
-be_encouraged crops like oilseeds, fruits and vegetables. All
this leads one to the question of relationship between
agricultural growth and the growth of food processing
industry which is directly dependent on farm and al lied
production. It is in this context that an attempt has been
made to look at this relationship at the district level for
the State of punjab.
In the small scale food processing sector, the compound
growth rates for the number of units, amp I oymen t, fixed
investment and production in the 1980's were higher than the
State average in the districts of 8athinda, Ferozepur,
Jalandhar, Ludhiana, Patiala and Sangrur, all of which stand
agriculturally developed in terms of the value of output of
16 major crops per hectare. They all had the values above the
State average for the period 1975/6 to 1979/80. These five
districts (other than 8athinda ) accounted for 53 per cent of
employment, 60 per cent of fixed
of production of the small scale
investment, and 63 per cent
food processing sector in
un
Punjab in 1987/8, whereas their shares were only of the order
of 36, 61 and 48 per cent respectively in 1979/80. With
respect to the number of units, their shares went up from 36
per cent to 50 per cent during the above period (see Map
1. 11.
Even in the factory sector of the food processing
industry, these five districts accounted ~r more than 60 per
cent of the total employment. This relationship was further
confirmed by the high degree of rank correlation between the
per hect~re
processing
area under
value of agricultural output and growth of food
industry at the district level. and between the
food crops (1987/8) which represents marketable
surplus and the various indicators of the growth of food
processing industry in the small as wei I as organised sector.
All the rank correlation coefficients were significant either
at 1 per cent or at 5 per cent level when tested for t-test.
Further. in the regression analysis. where area under food
crops was the only independent variable, it explained 33 per
cent of the growth in the number of units. This pOints to the
contribution of agricultural growth in the growth of food
processing industry at all levels, though there are other
contributing factors like urbanisation. bank credit, etc.
which help to promote the food processing industry. The area
under food crops and urbanisation together explained more
than 60 per cent of the growth in number of units and
108
employment in the small scale food processing sector. But.
only the area under food crops had a statistically
significant coefficient at 5 per cent level for the t-test.
4.4 Relative Efficiency of the Saall Scale Food Processing
Units
The role of small scale industry has been emphasised
every now and then because of the role it is supposed to play
in a developing economy. No one can dispute the advantages of
sma II scale production in a capital scarce and labour
abundant economy. But some times, these considerations make
the researchers overlook the very important consideration of
efficiency in production which is essential for any
meaningful growth and development in any sector of economic
activity. Most of the studies on relative efficiency relate
to the Indian industry as a whole. (e.g. Dhar and Lydall
( 1961 ) , Hajra (1965), Sandesara (1969) and Goldar (1988)
among others). No attempt seems to have been made to study
the relative efficiency within a particular region and a
particular industry which perhaps wil I give a more clear and
useful insight for research and policy making. It
this aspect that we look at the relative efficiency of small
scale food processing sector to that of the factory sector in
food processing in Punjab in the 1989's. Before getting to
the case in hand. it is in order to briefly mention the
findings of earlier studies on relative efficiency of the
1119
smal I scale sector.
Dhar and Lydall 1961 ) found that the output-capital
ratio does not fall with size. Rather, in certain cases, it
rises with size. So, they concluded that small scale units
( in the modern sector) are, in genera I, using more capital
than their counterparts in the large scale sector. Hajra ( ~
1965 on the basis of comparison of partial productivity
ratios came to the conclusion that both labour and capital
productivities are low in sma II scale industries. The
findings of Dhar and Lydall were supported by 5andesara's
study 1969 as we I I, where he found a positive
relationship between size and capital-output ratio and a
negative relation between size and capital intensity. And, he
recommended the large scale labour intensive industries for
viable industrial development in India. Sande.ara (1990)
holds this view even today.
In the case of food processing industry in Punjab,
though the small scale sector grew at a much higher rate than
the factory sector during the period 1979/80 to 1987/88, its
relative efficiency is found to be quite low. The small scale
sector was not only found to be more capital intensive (both
in FelL and Fe/O) as compared to the factory and the census
sectors of food processing, but also, the capital and labour
productivities were found to be lower than those in the other
118

-
two sectors. Whereas the fixed investment per worker on the
average was between Rs. 40,000 to Rs. 45,000 in the small
scale sector, it was only about Rs. 25,000 in the other two
sectors. On the other hand, the output-fixed capital ratio
(O/Fe) was only 3.5 in the small sector as compared to more
than 10 in the census and the factory sectors. Also. the ~
output-labour ratio (OIL) in the factory and census sectors
was about 1.5 to 2 times higher than that in the small
scale sector. This supports the findings on relative
efficiency of large and small sector industry brought about
by Goldar ( 1988) . Even the sample sector (small within the
factory sector) also showed a similar pattern - relatively
low capital intensity and relatively high labour and capital
productivities when compared with the small scale sector (see
Tables 4.8 & 4.9).
On the other hand, the unorganised sector (1978/9 and
198415 DME Survey data) showed the capital intensity (both
per labour and per output) as low as in the organised factory
sector though the labour productivity (output/labour) was as
low as in the registered small scale sector. However, the
capital productivity (output/fixed capital) was found to be
higher than both the small scale and the factory sector
(Tables 4.8 & 4.9).
111

If these results show some departure fro. the ones f'Jr
the registered small scale sector, it is perhaps because of
the wide coverage of the DNE Survey. Though. it: included all
the establishments not registered under the Factories Act,
1948, there were within the survey data even units with 28
and more workers, in spite of the fact that 85 per cent of
the units were with 6-19 workers. Perhaps, the inclusion of
these large units led to relatively high capital productivity
in this sector as compared to that of the small scale sector.
Secondly, since t~e DME Survey covered al I the units
employing siK or more persons with at least:. one hired worker
or having production worth Rs. one lakh or more, SOlll8 very
small units would have been included which resulted in
relatively low capital intensity. This is supported by the
fact that about 82 per cent of the OME Survey units were
with fixed investment of less than Rs. 50,800 each.
112
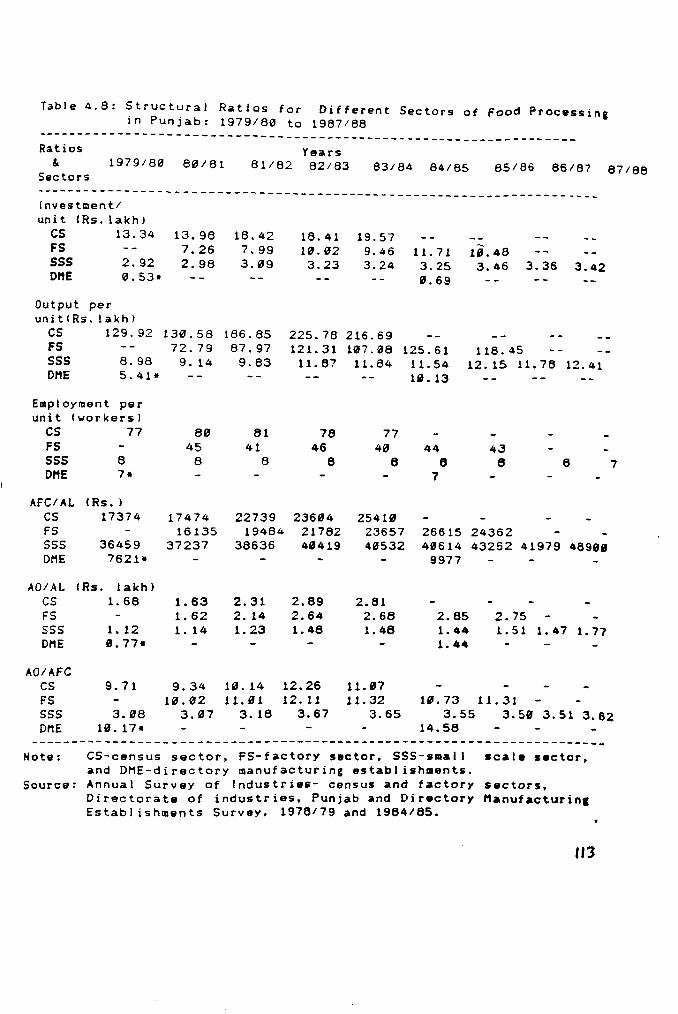
Table 4.8: Structural Ratios for Different Sectors of Food Processina in Punjab: 1979/80 to 1987/88
------------------------------ ------------------------------------Ratios & 1979/80 80/81
Sectors
Years 81182 82/83 83/84 84/85 85/86 86/87 87/88
---------------------------------------------------------------------Inyestmentl un it IRs. 1 ak hI
CS 13.34 FS SSS 2.92 DHE 0.53*
Output per unit(Rs.lakhl
CS 129.92 FS SSS 8.98 DHE 5.41*
Employment per unit (workers)
CS 77 FS SSS 8 DHE 7*
AFC/AL IRs.) CS 17374 FS SSS 36459 DNE 7621*
ADIAL (Rs. lakhl CS 1. 68 FS SSS 1. 12 DNE ".77*
9.71
13.98 7.26 2.98
18.42 7.99 3.09
18.41 BY. 02 3.23
19.57 9.46 3.24
225.78 216.69
11. 71 3.25 ".69
IB.48 3.46 3.36 3.42
130.58 186.85 72.79 87.97
9.14 9.83 121.31 107.08 125.61 11.87 11.84 11.54
HI. 13
11B.45 12. 15 11. 76 12.41
80 45
8
17474 16135
37237
1. 63 1. 62 1. 14
81 41
8
78 46
6
22739 23604 19484 21782
38636 40419
2.31 2.14 1. 23
2.B9 2.64 1. 46
77 40
6
2541" 23657 40532
2.Bl 2.68 1. 46
44 6
7
43 6
26615 24362
6
40614 43262 41979 4690' 9977
2.85 1. 44 1.44
2.75 1..51 1.47 1.77
10.73 11.31
7
AO/AFC CS FS SSS OME
3.08 10.17*
9.34 HL 02
3.07
10.14 11.01
3.18
12.26 12.11
3.67
11.S7 11.32
3.65 3.55 3.50 3.51 3.62 14.58
----------------------------------------------------------------------Note: CS-census sector, FS-factory sector, SSS-s.all scale sector.
and ONE-directory manufacturing establish.ants. Source: Annual Survey of [ndustries- census and factory sectors.
Directorate of industries, Punjab and Directory Manufacturinc Establ ishments Survey, 1976/79 and 1964/65.
113
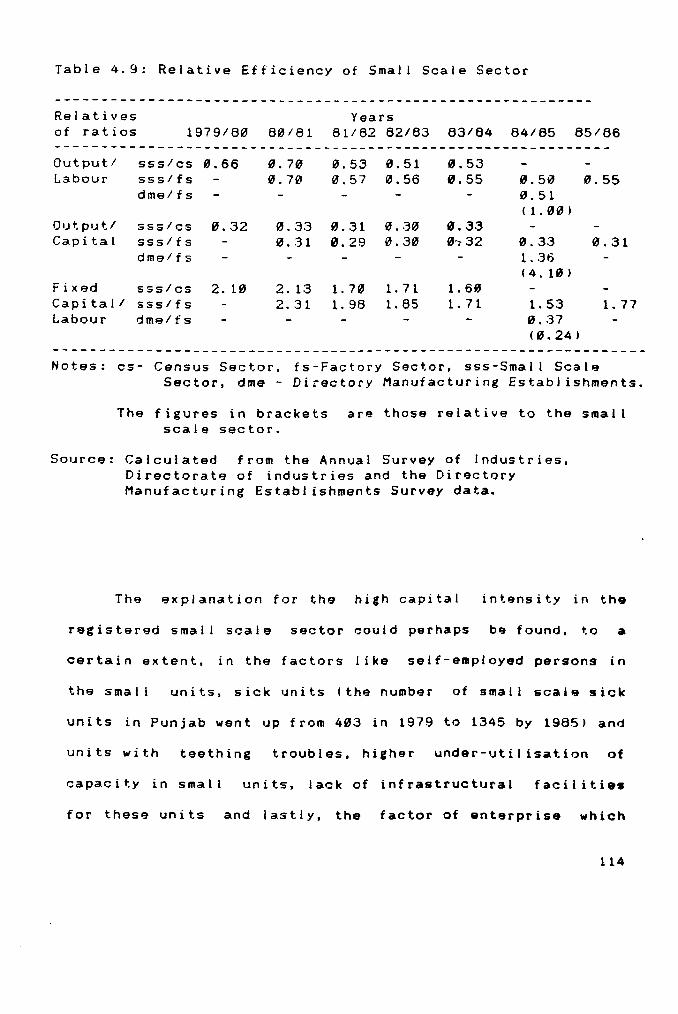
Table 4.9: Relative Efficiency of Small Scale Sector
-----------------------------------------------------------Relatives Years of ratios 1979/80 80/81 81/82 82/83 83/84 84/85 85/86 -------------------------------------------------------------Output/ sss/cs 0.66 0.70 0.53 0.51 0.53 Labour sss/fs 0.70 0.57 0.56 0.55 0.50 0.55
dme/fs 0.51 ( 1.00)
Output/ sss/cs 0.32 0.33 0 .. 31 0.30 0.33 Capital sss/fs 0.31 0.29 0.30 0~32 0.3:3 0.31
dme/fs 1 .. 36 (4. 10)
Fixed sss/cs 2.10 2.13 1. 70 1. 71 1. 60 Capital/ sss/fs 2.31 1. 98 1. 85 1. 71 1. 53 1. 77 Labour dme/fs 0 .. 37
(0.24)
Notes: cs- Census Sector. fs-Factory Sector. sss-Small Scall!t Sector. dme - Directory Manufacturing Establishments.
Thl!t figures in brackets are those relative to the small scale sector.
Source: Calculated from the Annual Survey of Industries. Directorate of industries and the Dirl!tctory Manufacturing Establishments Survey data.
The explanation for the high capital intl!tnsity in the
registered small scale sector could perhaps bIJ found. to a
certain extent. in the factors like self-employed persons in
the sma I I units, sick units (the number of small scale sick
units in Punjab went up from 403 in 1979 to 1345 by 1985) and
units with teething troubles, higher under-utilisation of
capacity in small units, lack of infrastructural f ac i I it ie.
for thesl!t units and lastly, the factor of entl!trprise which
114
could perhaps explain the inefficiencY in thig sectf:>r.
Whatever may be the reasons behind the relative inefficiencY
of the small scale units, it brings forth a debate about th~
supposed role of the sma I I scale sector in promoting
industrial and overal development in a developing economy.
4.5 Conclusions
In sum, one of the important industries in Punjab -
food processing - lacks diversification mainly because ot the
lack of diversification in agriculture and partly due to the
factors I ike lack of urbanisation and technological
sluggishness. The high degree of
agricultural growth and the growth of
relationship between
food processing points
to the importance of agricuitural development in the process
of agro-industrial isation. This is supported by the limited
move towards secondary processing activities from the primary
processing ones which predominate the industry.
on relative efficiency point to the serious
smal scale production and caution about
The findings
dimensions of
the role and
contribution of such enterprises in a small scale enterprise
dominated agr icul tural economy like Punjab. The following
chapter examines the aspects of structure and organisation ot
small scale food processing industry in Punjab with the help
of primary data collected from two districts ot the State.
115
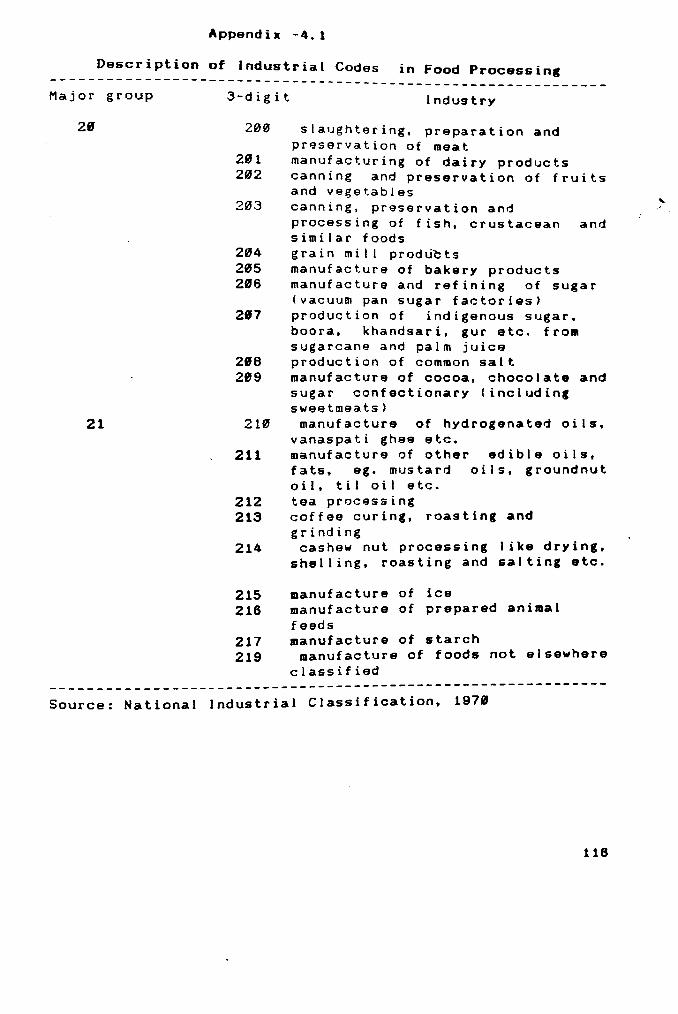
Appendix -4.1
Description of Industrial Codes in Food Processing -------------------------------------------------------------Major group
28
21
3-digit
200
201 202
203
204 205 206
287
206 289
210
211
212 213
214
215 216
217 219
Industry
slaughtering, preparation and preservation of meat manufacturing of dairy products canning and preservation of fruits and vegetables canning, preservation and processing of fish, crustacean and similar foods grain mi II products manufacture of bakery products manufacture and refining of sugar (vacuum pan sugar factories) production of indigenous sugar, boora, khandsar i, gur etc. f 1'0111
sugarcane and palm juice production of common salt manufacture of cocoa, chocolate and sugar confectionary (including sweetmeats)
manufacture of hydrogenated oils, vanaspati ghea etc. manufacture of other adible oils, fats, ago mustard oi I s, groundnut oil, til oil etc. tea processing coffee curing, roasting and grinding
cashew nut processing like drying, shelling, roasting and salting etc.
manufacture of ice manufacture of prepared animal feeds manufacture of starch
manufacture of foods not elsewhere classified
-------------------------------------------------------------Source: National Industrial Classification. 1978
116
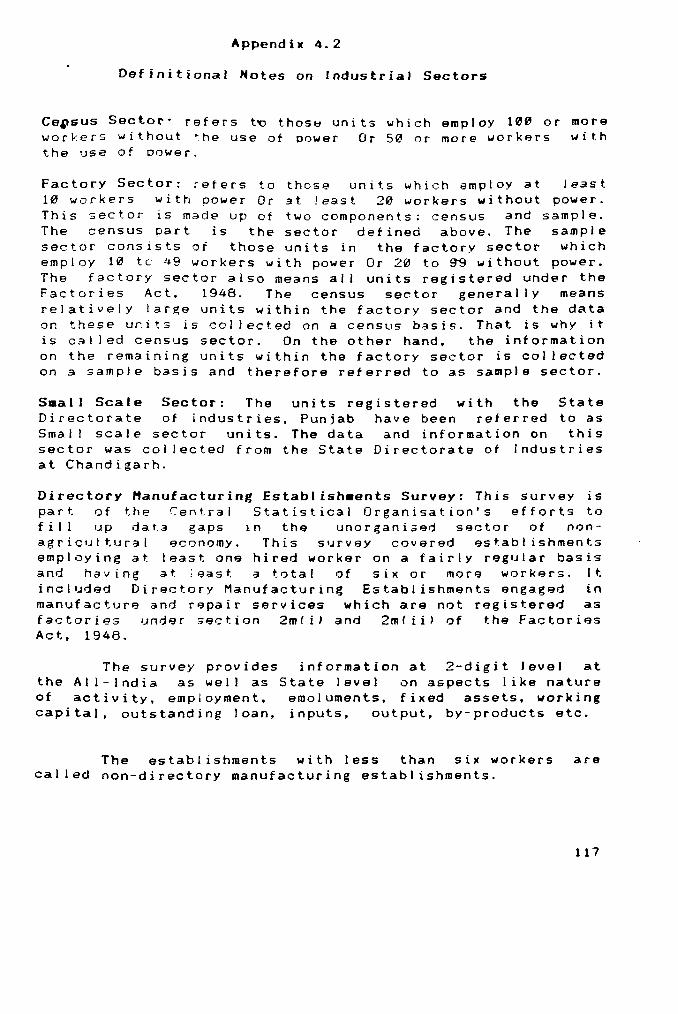
Appendix 4.2
Definitional Notes on Industrial Sectors
Ce~sus Sector' refers t~ thos~ units which employ 100 or workers without ~he use of Dower Or 50 ar more workers the use of Dower.
more wit h
Factory Sector: rerers to those units which emplOY at least 10 workers with power Or at least 20 workers without power. This sector is made up of two components: census and sample. The census part is the sector defined above. The sample sector consists of those units in the factory sector which employ 10 tc 49 workers with power Or 20 to ~ without power. The factory sector also means all units registered under the Factories Act. 1948. The census sector generally means relatively large units within the factory sector and the data on these urits is collected on a census basis. That is why it is call ed census sector. On the other hand. the information on the remaining units within the factory sector is collected on a sample basis and therefore referred to as sample sector.
Small Scale Sector: The units registered with the State Directorate of industries. Punjab have been referred to as Smal I scale sector units. The data and information on this sector was collected from the State Directorate of Industries at Chandigarh.
Directory Manufacturing Establish.ants Survay: This survey is part of the Central Statistical Organisation's efforts to fil I up data gaps in the unorganiaed sector of nonagricultural economy. This survey covered establ ishments employing at least one hired worker on a fairly regular basis and having at ;east a total of six or more workers. It: included Directory Manufacturing Establishments engaged in manufacture and repair services which are not registered as factari8s under section 2mfi) and 2mfiilof th9 Factories Act, 1948.
The survey provides information at 2-digit Jevel at the All-India as well as State level on aspects like nature of activity, employment. emoluments. fixed assets. working capital. outstanding Joan. inputs. output. by-products etc.
The establishments with less than six workers are called non-directory manufacturing establishments.
117
-------- - - -- - -
Chapter 5 STRUCTURE AND FUNCTIONING OF FOOD PROCESSING INDUSTRIES
IN PUNJAB: A DISTRICT LEVEL ANALYSIS
5.1 (ntroduction
An attempt has been made in this chapter to look at the
structure and functioning of the food processing industries
(pr imary and secondary) in a Green Revolution region -
Punjab, with the help of a sample study of two I oca I I y
predominant primary food processing industries - rice mil ling
and 0 i I milling - and a secondary processing industry -
baking. The sample consisted of 20 units in each primary
processing industry and 32 in the organised and unorganised
sectors of baking industry in two districts of the State-
Ludhiana and Bathinda the former highly developed in
agriculture as wei as industry and the latter relatively
less developed in both the sectors. Besides. information
about other secondary processing industries like vanaspati.
which use the output of primary processing industries was
also obtained to locate the forward linkages of primary
industries.
5.2 Structure of Primary Processing (ndustries
Rice mi I I ing, one of the major primary food processing
industries in Punjab took roots in the State in the late
1960s as a direct result of the increase in area under paddy
cui tivation and thus, increased paddy production, due to the
118
phenomenon of -Green Revolution- in the districts of
Amritsar, Gu rdas pur, Patiala, Ferozpur, and Kapurthala
(Gupta and George, 1974, p. 9) • Since rice is not the
staple food of Punjab, the marketed surplus has been quite
high.
total
Whereas it was reported to be 73 PaT cent of the
production in 1971\72 (Gupta and George, 1974, pp. 11
19) , it was 90 per cent by 1979\80 (Gill, M S 1981>. and
increased to about 93 percent in the case of small farms and
about 95 per cent for large farms by the mid
1986) .
1989s (Rangi.
Today, there are more than 1400 rice mills in the
state l with a greater concentration in the central rice
belt of the state (Table 5.1). It was found that the milling
capacity in the State was unevenly distributed among
districts. The districts of Bathinda, Ludhiana, Faridkot and
Jalandhar, which adopted rice cultivation relatively recently
were found to be deficit in paddy processing capacity. This
led to inter-district movement of paddy for processing or
periodic closure of mills which in turn increased the mil lin,
cost of paddy (Rangi, 1986).
A major proportion of paddy 160 per cent to 70 per cent
of total market arrivals) in Punjab was purchased by the rice
mil leI's, followed by the Food Corporation of India and other
State agencies. However, the share of procurement agencies in
paddy purchases in the State have risen significantly in the
"'
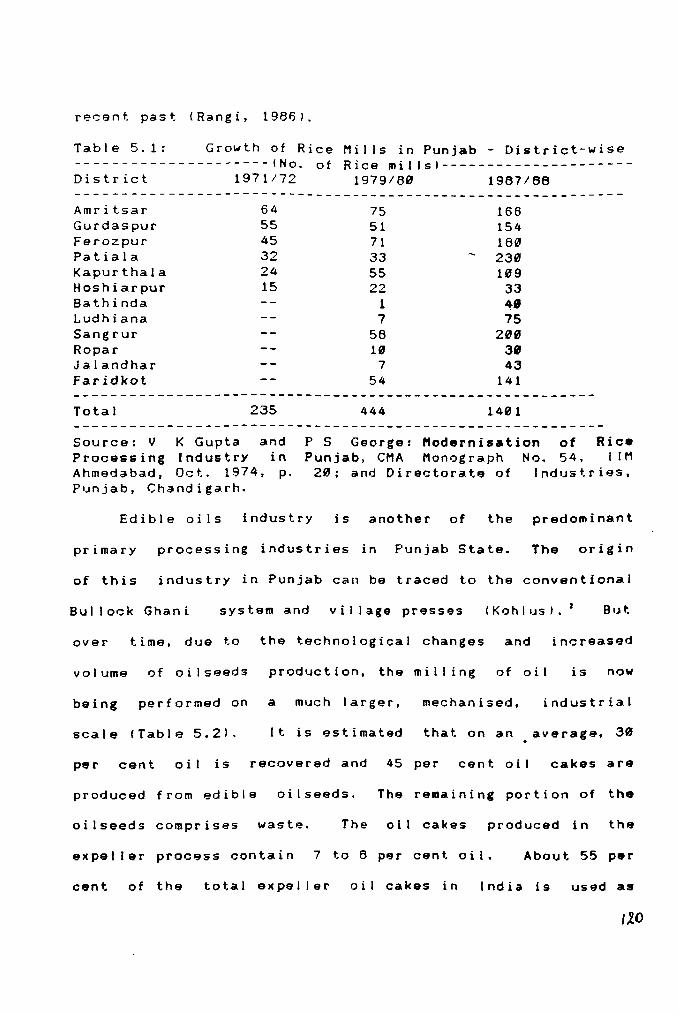
recent. past (Rangi, 191361.
Table 5.1: Growth of Rice Mills in Punjab - District-wise --------------------- (No. at Rice millsl---------------------District 1971/72 1979/80 1987/88 ------------------------------------------------------------Amritsar 64 75 166 Gurdaspur 55 51 154 Ferozpur 45 71 180 Patiala 32 33 230 Kapurthala 24 55 109 Hoshiarpur 15 22 33 Bathinda 1 •• Ludhiana 7 75 Sangrur 58 200 Ropar 10 3. Jalandhar 7 43 Faridkot 54 141
Total 235 444 1401
Source: V K Gupta and Processing Industry in Ahmedabad, Oct. 1974, p. Punjab, Chandigarh.
P S George: Modernisation ot Rice Punj ab, CMA Monog raph No. 54, I 1M
20; and Directorate of Industries,
Edible oils industry is another of the predominant
primary processing industries in Punjab State. The origin
of this industry in Punjab can be traced to the conventional
Sui lock Ghani system and village presses (KohIIJsl. Z But
over time, due to the technological changes and increased
volume of oilseeds prodlJction, the milling of oil is now
being performed on a much larger, mechanised, industrial
scale CTable 5.2'. It is estimated that on an average, 30 •
per cent oi I is recovered and 45 per cent. oi I cakes are
produced from edible oilseeds. The remaining portion of the
oilseeds comprises waste. The oil cakes produced in the
expeller process contain 7 to 8 per cent oil. About 55 per
cent of the total expeller oil cakes in India is used as
,xo
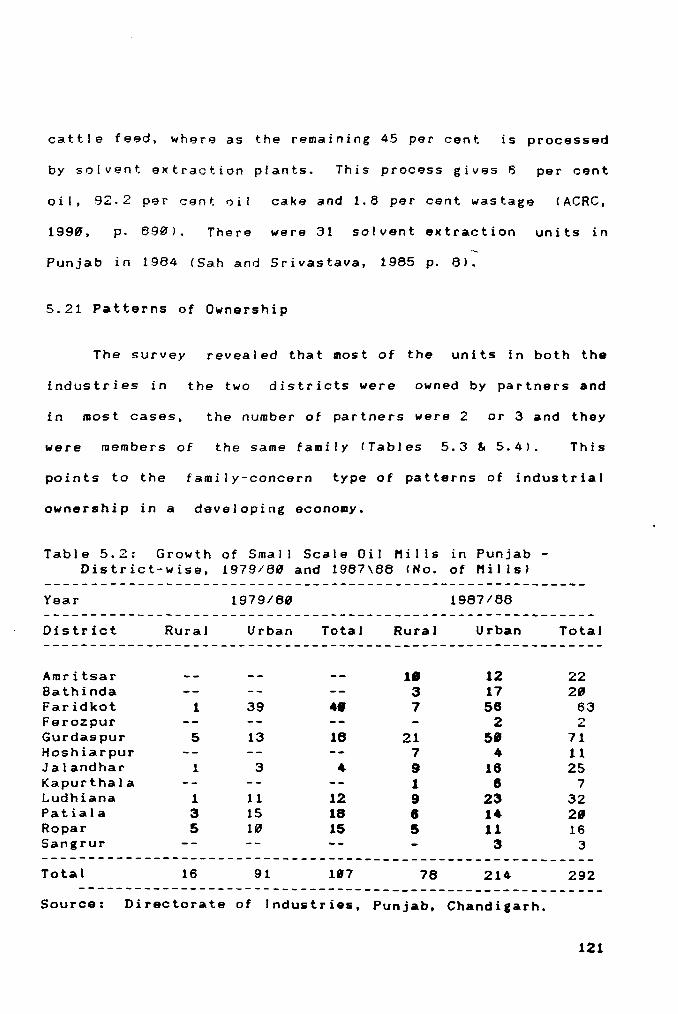
cattle feed, where as the remaining 45 per cent is processed
by solvent extraction plants. This process gives 5 per cent
oil, 92.2 per cent. oil cake and 1.8 per cent. wast.age (ACRC,
1990, p. 890). There were 31 solvent eKtraction units in
Punjab in 1984 (Sah and Srivastava, 1985 p. 8 •.
5.21 Patterns of Ownership
The survey revealed that most of the units in both the
industries in the two districts were owned by partners and
in most cases, the number of partners were 2 or 3 and they
were members of the same family (Tables 5.3 & 5.4). This
points to the family-concern type of patterns of industrial
ownership in a developing economy.
Table 5.2: Growth of Small Scale Oil Mills in Punjab -District-wise, 1979/80 and 1987\88 (No. of Mills)
Year 1979/80 1987/88
District Rural Urban Total Rural Urban
Amritsar 1. 12 8athinda 3 17 Faridkot 1 39 •• 7 56 Ferozpur 2 Gurdaspur 5 13 16 21 5. Hoshiarpur 7 • Jalandhar 1 3 • 9 16 Kapurtha/a 1 6 Ludhiana 1 11 12 9 23 Patiala 3 15 18 e 1. Ropar 5 10 15 5 11 Sangrur 3
Total
22 20
63 2
71 11 25
7 32 28 16
3 ------------------------------------------------------------Total 16 91 187 76 214 292
---------------------------------------------------------Source: Directorate of Industries, Punjab, Chandigarh.
121
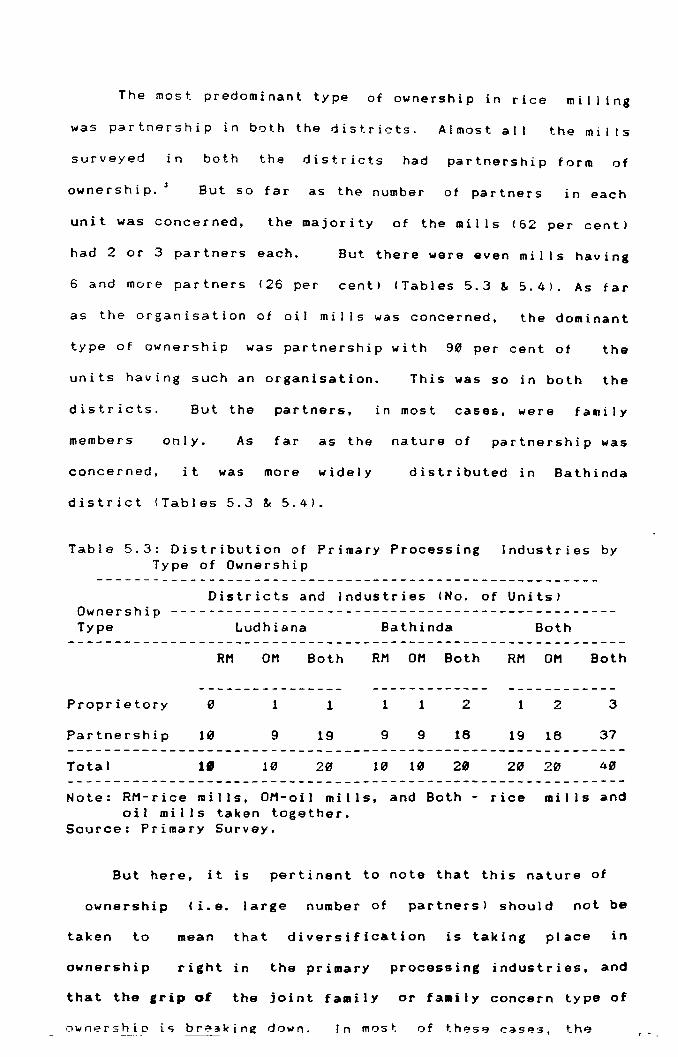
The most predominant type of ownership in rice mi 11 ing
was partnership in both the districts. Al mos tall the mills
surveyed in both the districts had partnership form of
ownership. But so far as the number of partners in each
unit was concerned, the majority of the mills (62 per cent)
had 2 or 3 partners each. But there were even mil Is having
6 and more partners (26 per cent) (Tables 5.3 ~ 5.4). As far
as the organisation of oil mills was concerned, the dominant
type of ownership was partnership with 90 per cent of the
units having such an organisation. This was so in both the
districts. But the partners, in most cases, were family
members only. As far as the nature of partnership was
concerned, it was more widely distributed in Bathinda
district (Tables 5.3 ~ 5.4).
Table 5.3: Distribution of Primary Processing Type of Ownership
Industries by
Districts and Industries (No. of Units) Ownership -------------------------------------------------Type Ludhiana Bathinda Both
RM OM Both RM OM Both RM OM Both
Proprietory 1 1 1 1 2 1 2 3
Partnership 10 9 19 9 9 16 19 18 37
Total 111 10 20 10 10 20 20 20 40
Note: RM-rice mills, OM-oil mills, and Both - rice mills and oi I mi I Is taken together.
Source: Primary Survey.
But here, it is pertinent to note that this nature of
ownership ( i. e. large number of partners) should not be
taken to mean that diversification is taking place in
ownership right in the primary processing industries, and
that the grip of the joint f alii i I y or fa.i I y concern type of
In most: of th-:.-se C<ise:;. the .. ,

Table 5.4: Nature of Partnership in Primary Processing Industries by Number of Partners
Number of Partners
Districts and Industries (No. of Units)
Ludhiana Bathinda Both
RM OM Both RM OM Both RM OM Both ---------------- ------------- -------------
2 and 3 7 9 16 5 5
4 and 5 1 0 1 1 2
6 & above 2 0 2 3 2
Total 10 9 19 9 9
Note: Industries codes as in Table 5.3. Source: As in Table 5.3.
10 12 14 26
S 2 2 4
5 5 ,.., 7 .:.
18 19 18 37
the partners were the members of the same family and
generally directly related to the major owner. for example.
relations like sons. wife or brothers. However, there were
a few instances of partnership between persons or families
belonging to two different occupations and/or communities.
Lele (1971) also found from a study of the family history of
18 trading firms in Punjab that partnership in rice mi I ling
was basically an extension of partnership in grain trade and
it was only partnership between immediate members of the same
family (p. 811.
5.22 Green Revolution and Emerlence , Growth of Proc ••• in.
Uni ts
Though on an av~rage, the units were less than 10 years
old and thus happened to be the direct result of increased
agricultural output and prosperity of the Green Revolution
period, the units in Ludhiana were relatively old, perhaps
due to the lead. the district took in both agricultural and
industrial development. The emergence pattern (year of
origin) suggests that a 11110s tall the rice .ills surveyed
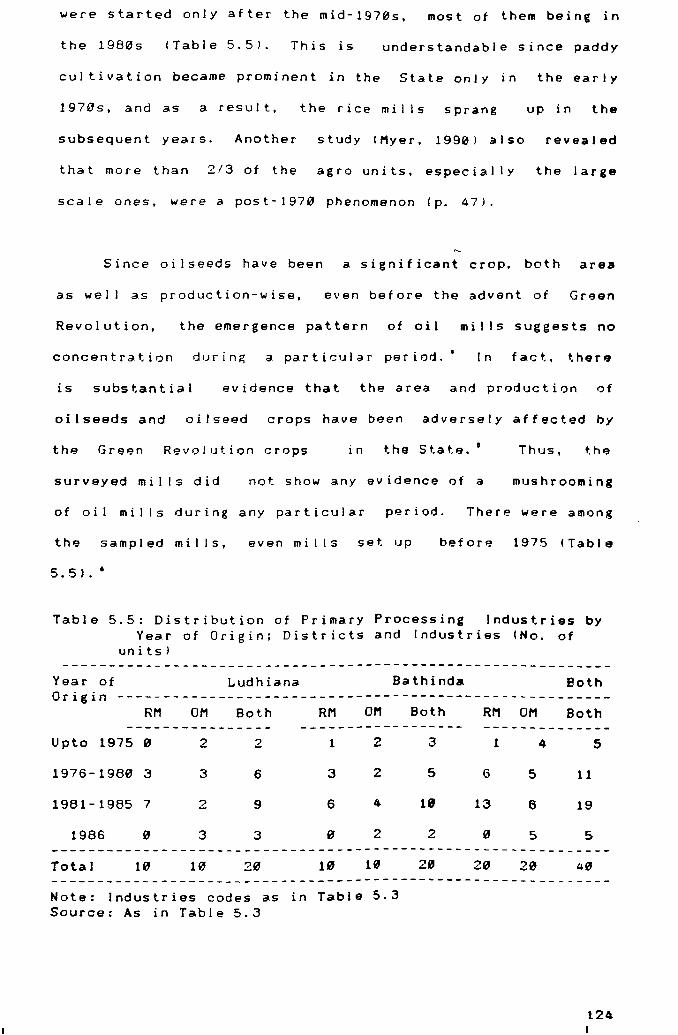
were started only after the mid-1970s, most of them being in
the 1980s ITable 5.5). This is understandable since paddy
cultivation became prominent in the State only in the early
19705, and as a result, the rice mills sprang up in the
subsequent years. Another study (Myer, 1990) also revealed
that more than 2/3 of the agro units, especially the large
scale ones, were a post-1970 phenomenon (p. 47).
Since oilseeds have been a significant crop, both area
as well as production-wise, even before the advent of Green
Revolution, the emergence pattern of oil mills suggests no
concentration during a particular period. [n fact., t.herlJ
is sl.Jbstantial evidence that the area and production of
oilseeds and oilseed crops have been adversely affected by
the Green Revolution crops in the Stat.e. I Thus, the
surveyed mi I [s did not show any evidence of a mlJshrooming
of oil mills during any particular period. There were among
the sampled mills, even mi II s set. IJP before 1975 /Table
5.5) . •
Table 5.5: Distribution of Primary Processing Industries by Year of Origin; Districts and Industries (Ho. of
units) ------------------------------------------------------------
Year of Ludhiana Bathinda Both Origin ------------------------------------------------------
RM OM Both RM OM Both RM OM Both ---------------- ------------------ --------------
Upto 1975 0 2 2 1 2 3 1 4 5
1976-1980 3 3 6 3 2 5 6 5 11
1981-1985 7 2 9 6 4 10 13 6 19
1986 0 3 3 0 2 2 " 5 5 -------------------------------------------------------------Total 10 10 10 20 20 20 40 -------------------------------------------------------------Hote: Industries codes as in Table 5.3 Source: As in Table 5.3
124

Further, the capacity and working period of the rice
mil Is in the two districts suggests that. the mi lis in
agricul turally and otherwise developed districts had much
larger capacity (almost all the mills had each a capacit.y of
2 tonnes/hour or more) and longer working period (5 b:> 7
months for a I I ) compared t.o the ones in the relatively
backward Bathinda district. Here, the average capac i ty was
only 1.6 t.onnes/hour, with 60 per cent. of the mills each
having a capacity below 2 tonnes/hour and ~20 per cent of
them working only for less than 5 months in a year. The
larger capacity and longer working period for the Ludhiana
mil Is was due to the existence of the largest grain market
of Asia in the district (at Khanna) and the intensiv9
cultivation of
infrastructural
p~ d d yin the dis t ric t .
faci I i ties must have
Also, the market and
facilitated the
relativ81y large-siz8 and long-duration working of the rice
mi lis. T h IJ S , the I a r g 8 - s i zed mil I s w ill nat IJ r a I I y r e q IJ ire
high initial and avera I I fi)(ed capital investment and
1010 r kin g cap ita I . The data in Tabl8 5.6 confirms this trend
wherein on an average, Ludhiana mi lis had relatively large
initial and present capital investment and much higher
working capital requirements and average employment per unit.
Unl ike rice mi II tng, ot I mi II ing is not so seasonal in
nature b8caus8 they process two types of oil seeds - cotton
and mustard -which are kharif and rabi crops respectiVely.
However, they also generally operate less than the fiJI I
p8riod of tW81ve months. But sti II 60 per cent of the mi 113
were able to operate for per iods as long as 9 months or
lIIore. Only two m i J lSi n Bathinda district reported t.heir
operation period to be less than or equal to six months.
125
•
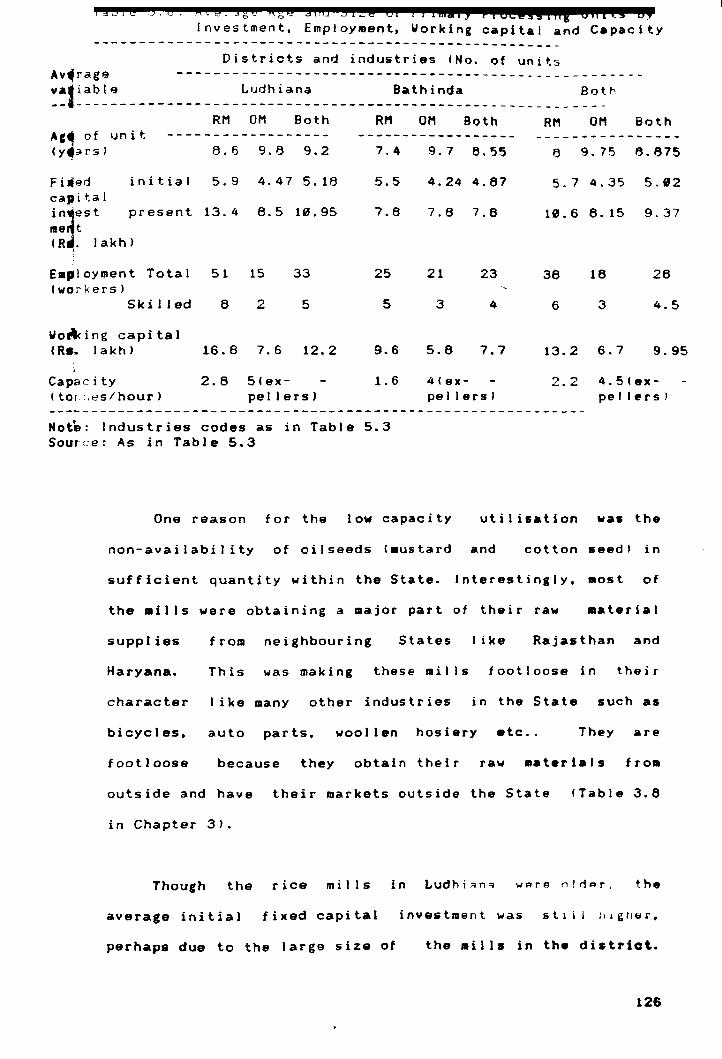
, g 6 : @ 3. 13. A ( @. g g? At@ j : : i3 3 L g U iii iii" 1.4 i , 02' gg ( Ii i 6 i if i.; i5 9 Investment, Employment. Working capital and Capacity
----------------------------------------------------Districts and industries (No. of units
Av.rag9 valiabl9
----------------------------------------------------LlJdhiana Bathinda Both
--~-----------------------------------------------------------RM OM Both RM OM Both
Ac4 of unit (Y.HS)
------------------13.6 9.13 9.2
Fi"~d initial 5.9 4.47 5.18 capital
in~est present 13.4 6.5 10.95 1118 t (R . lakh) ,
,
E __ loyment Total 51 15 33 (workers)
Sk ill ed 6 2 5
Wo.t<ing capital ( Rs. I a k h ) 16 • 8 7. 6 12. 2
Capac i ty (tor~,es/hour )
2.6 5(ex-pe I Ie rs )
7.4
5.5
7.8
25
5
9.6
1.6
Note: Industries codes as in Table 5.3 Source: As in TabJe 5.3
9.7 6.55
4.24 4.87
7.8 7.8
21 23
3 4
5.6 7.7
4Cex-pe I I ers)
RM OM Both ----------------
13 9.75 13.1375
5.7 4.35 5.82
18.6 6.15 9.37
36 16 26
6 3 4.5
13.2 6.7 9.95
2.2 4.5Cex-pe I I ers J
One reason for the low capacity utilisation was the
non-availability of oilseeds C.ustard and cot ton seed) in
sufficient quantity within the State. Interestingly, .ost of
the aills were obtaining a major part of their raw .aterial
supplies frolll neighbouring States like Rajasthan and
Haryana. This was making these III i I Is footloose in their
character like lIIany other industries in the State such as
bicycles. auto par ts, woollen hosiery etc .. They are
footloose because they obtain their raw .at.rials froll
outside and have their markets outside the State CTable 3.6
in Chapter 3).
Though the rice mills in Ludhi~n~ were nlrler, the
average initial fixed capital investment was stlll illgtllH,
perhaps due to the large size of the .ills in the district.
126
This large size of the Ludhiana district rice mills was
evicent. from the employment figures also (Tab!->
Wh.r~as no Bathinda mil I had more than 49 workers. th~
in L'Jdhiana district employed 49 to 89 workers in a majority
of t'l9 units.' But there was not variatilJn in the
employment of ski II ed workers. except tor one ot toe mlij;i
in Ludhiana which had more than 10 sk iI I ed workers. This
may perha.ps be either due to the limitation of n •• d of
ski lied workers after a particular scal~ or because of the
higher skill levels of common workers in Ludhiana where they
must be parforming the jobs of a skilled worker as wei I.
This kind of 9ubstitution of workers cannot be ruled out in
Punjab and particularly Ludhiana. where indigenous
technologies have been in use for some time.
The size of the oil mills in two districts in terms
number of expellers, initial
fixed capital investment did
across districts. Mas t of
fixed investment and pres pnt
not show any large
the mills (85 per
variations
cent) were
operating in shifts with a duration of 12 hours e.ch. But,
in terms of employment size, the units in Bathinda seemed to
be relatively large with 49
than 20 workers each, though
employing between 11 to 2/21
per cent of them amploying more
the predominant ones were those
workers each. These Bathfnda
units had more skilled workers per unlt, With 10 per cent ot
them having 3 or more skilled workers each. It was so only
in the case of 30 per cent in Ludhiana <Table 5.6).
This clearly points to the effects of earlier and hi,her
agricultural growth on the process of industrialisation in
predominantly agricultural economias. Higher agricultural
growth not only aakes larger aarketable surpluses available
127
for processing, but also provides markets for processed
products and funds for investment outside agriculture. The
units in the agriculturally developed district were not only
large in capacity but also were working for longer periods.
Though both the s e i n d IJ S t r i e s (r ice and 0 i I) are sea son a lin
nature, still, the units in Ludhiana were working for a
longer duration than those in Bathinda.
5.23 Capacity Utilizatio~ in Rice Mills
Since the rice mi lIs operate only seasonally. it may be
treated as under-utilisation of capacity. But, for the mills
engaged in commercial mi II ing operations. namely, buying,
sell ing and storage of paddy and rice, as well as processing,
the optimum level of capacity util ization may occur at
comparatively low levels of utilization. While fixed costs
decline as the level of capacity utilization increases, this
can only be achieved by incurring a significant increase in
variable costs both in mi II ing, wages, fuel etc., and in the
purchase, storage and transport of paddy and rice. The cost
of paddy purchase is the major element in variable costs, and
the major element in total operating costs. Earl ier studies
on India (Lele, 1971 and Harriss, 1976) indicate that the
cost of paddy frequently accounts for 90 per cent or more of
the total operating costs.
There are considerable risks involved in lock i ng up
large quantities of capital by storing paddy over long
periods, given the uncertainty of seasonal price movements.
Given these risks, and the fact that variable costs
constitute such a large proportion of total operating costs,
decrease
increases
in the level
in the
of average costs as a result of
level of c~pacity utilisation i.
128
insignificant
operations.
in
Thus,
the
the
context of the total buslneS9
level of instal led capacity and
therefore
preference
effective capacity, wi I I reflect millers'
for milling large quantities of paddy within a
short period of time, enabl ing them to take fIJI I advantage of
favourable movements in rice prices. Here, low throughp'.Jts
do not indicate under-utilisation of capacity and they are
determined by the price of paddy and the difficulty of
predicting future prices of rice. Theretore, significant
changes in government price policy with respect to paddy and
rice also affect the level of optimum capacity (Vokes et al.,
1982) •
5.24 Patterns and Nature of Employment
One of the major objectives of the study was to look
into the nature and type of emp 1 oymen t. But the data on
workers' background raises serious questions about the
significance of such type of industries for
from the employment generation point of view.
local economy
Though both
the industries provided only seasonal employment to workers,
the startling fact that emerged was that most of the workers
were migrants from States like UP, Bihar, Himachal Pradesh,
and West Bengal. No unit had all
state alone ITable 5.7). In all
the workers fr0m
the mills, the
Pllnjab
labour
(unskilled) came from States like U P, Bihar and West
Bengal. They were not only willing to do work under any
condition but also at relatively low wages. The wages in
this industry seem to be at par with agricultural wages in
the State which are the highest in the country ITable 5.6).
The skilled workers Inot all of them) however, were froa
Punjab. Besides this. all the clerical and managerial staff
1 9

Tab[e 5.7: Distribution of PrimarYIProcessing Workers' Background
Industnes 69
---------------------------------------------------------Districts and Industries (No. of Units)
------------------------------------------------Background Ludhiana Bathinda Both State ------------------------------------------------
RM OM Both RM OM Both RM OM Both
Punjab/UP 0 2 2 0 0 0 0 2 2
Punjab/I)P/ Bihar 6 2 10 3 0 3 11 2 13
UP/Bihar 1 6 7 4 9 13 5 15 2"
UP/HP 0 0 0 0 1 1 0 1 1
UP/Bihar/ West Bengal 1 0 1 3 0 3 4 0 4 -----------------------------------------------------A I I 10 10 20 10 10 20 20 20 40
Note: There was not even a single unit which had all its workers from Punjab State alone. Industry codes as in Table 5.3 Source: As in Table 5.3
Table 5.6: Operation-wise Daily Agricultural Wages in Some States in 1990 (Rs.\day of 6 hours for male workers)
State ------------------ Operation----------------------------and (District)
HarYesting Other Carpenter Blacksmith Agril. labour
Assam(Golaghat) 22.00 30.00 40.00 Gujarat(Kairal 15.00 15.00 40.00 40.00 Haryana(Panipatl 27.75 Himachal (Chowri I 20.00 20.00 45.0" 40.00 Kerala(Kozhikodel 36.00 57.00 M.P. (Hoshangabadl 17.00 17.00 22.00 2".0" Orissa(Balasorel 25.00 25.00 35.00 30.00 Punjab(Ludhianal 45.00 (Sept. I 33.00 (Sept. ) 60.00 60.00
50.00(Oct. I 45.00(Oct. ) Rajasthan(Kota) 20.00 TamilnaduIThanjayurl-- 20.00 U. P. (Varanas i I 20.00 20.00
Source: Agricultural Situation in India, Feb. 1991. Pp.607 -606.
were also from the State itself. The most important reason
cited by the millers for the absence of local Punjabi
workers in this industry was their consciousness of status
and refusal to work manually in such a primary industry.
Also. the low wages which were ayailable. was another factor
responsible for their absence. On the other hand. migrant
13t/J

labour was available at relatively low wages and worked tor
longer hours.
labour.
Therefore, the entrepreneurs preferred migrant
Fur ther, the employment in this indus try is seasonal
because most of the units operate for 6 months or so during a
• Thus, except a few permanent employees like year.
accountants, chowkidars, etc. , the other skilled and
unskilled workers face seasonal unemployment, though of
course some of them find employment in the agricultural and
rural activities during the slack months. Myel' (199") also
found that only about 78 per cent of the total employment was
permanent in agI'o units. The extent at seasonal and casual
employment was much more higher 144.7) in small scale units
as against only 19 per cent in large units. Further, the
employment was much more seasonal in agro-processing sector
than in input-supplying sector. More than 1/3 of the workers
were unskilled and their proportion was particularly high
in agro-processing units; 38 per cent of the workers were
migrants and their proportion was higher in agro-processing
(43.4) than in input-supplying units (21.1) (pp. 49-52, 65).
Most of the mills experienced labour shortage during the
harvest season because the wages in agriculture, in general,
and during the harvest season in particular, were very high
in the State CTable 5.8). As in rice mi I Is, the workers of
oil mills also were mainly migrants from States like UP,
Bihar and Himachal Pradesh. In al I the mills, the
predominant majority of workers belonged to the States at UP
and Bihar. Here too, the absence at
was the result of factors discussed
local Punjabi workers
in this context in the
case at rice mil Is. Dhesi also observes that working
131
conditions in Punjab industry are long and strenuous .oJ, \ ,J
wages are low. Thus, what may be acceptable to a -Bhaiya· may
not be accepted by a Punjabi (Alagh, 1991, p. 35).
5.25 Location of the Processing Units
Historical experience suggests that: the primary
processing industries are generally expected t:o be located
near the centres of production of raw-materials (Weber,
19~9) . The Punjab State as a whole is known for its
agricultural slJrpl uses and is a smal t .. State with
wei I-developed infrastructure which has led largely to the
mitigation of rural-urban disparities. Yet, the regional
disparities within the State can provide scope for the study
of location patterns of primary processing industries.
fn this context, whereas most of the units in Ludhiana
attributed their location in the district to the
ava i lab iIi ty of raw materials, markets, and the family
backgrol.lnd of th9 own9rs / entrepreneurs, in Bathinda. family
background and the availability of government incentives
were stated to be the major factors responsible for the
location of units in the district: (Table 5.9). The
relatively lesser importance of the raw material factor in
Ludhiana was due to the emerging footloose character of the
oil mil I units because this central part of the State has
lost in terms of its contribution to the production of
oilseeds; also, the oil mills are dependent on imports of
oilseeds from the States of Rajasthan and Haryana. This was
very much a prevalent factor among the surveyed oil .ills.
132

Table 5.9: Frequency Distribution of Factors Responsible for the Choice of Location of Primary Processing Industries
Districts and Industries (No. of Units)
Factor Ludhiana
RM OM Both
Availabiity of raw material (ARM)
Fa.mily background (FB)
ARM and FB
2
8
ARM and Market 0
ARM and availability of infrastructure 0
ARM and gov t. incentives 0
Market and FB 0
FB and availability of govt.incenti- 0 ves
ARM, FB and gov t. incentives
Market, FB and infrastructure o
o 2
o
o 8
1 1
o o
8 8
o
1 1
RM
fJ
3
fJ
fJ
fJ
8
8
6
1
o
Bathinda Both
OM Both RM OM Both
2 2
3 6 3 3 6
1 1 8 1 9
o 1 1
2 2 2 2
1 1 o 1 1
1 1 o 9 9
1 7 6 1 7
1 1 8 1
1 1 fJ 2 2 ---------------------------------------------------------------
A I I 1fJ 16' 28 10 10 20 20 20 40 -----------------------------------------------------------------Note: Industry codes as in Table 5.3 Source: As in Table 5.3
Whereas availability of raw materials and faa i 1 y
background were responsible for the rice mills' locations
around Khanna in Ludhiana; in Bathinda, apart from these two
factors, availability of government incentives was also found
to be iaportant (Table 5.9). This was so because Bathinda,

- - -----------
being one of the cent,al Iy backwa,d dist,icts in the State,
enjoyed certain government incentives, which along with the
availability of raw materials in certain pockets of the
district, att,acted investment in rice mil Is. In oil l1Iills
al so, the predominant facto,s mentioned by the owners in
Ludhiana district were market availabil ity and f am i I y
Indian background. This perhaps suggests that the
entrepreneur is sti II not free from his bickground and has
not turned into an industrial capital ist. But the oil mills
in Bathinda attributed their location to availability of raw
material, government incentives and family background (Table
5. 9) . In this case, it is suggested by the d~ta that raw
material source is stil I a pul I factor for a firm to locate
its IJnit, if adeq'Jate incentives and facilities exist in the
area.
I t is pertinent to note here that most of the
predominant industries in the district of Ludhiana are
footloose, such as bicycle and components, steel rerolling.
hosiery and some other rubber and metal based industries.
But the acquisition of the footloose character by an
industry like oil milling points to the market oriented and
linkage- based production system of the units in Ludhiana
wherein oil mills supply a major part of their output to
vanaspati and ghee mills in the district,
adjoining centres of vanaspati production.
the State and the
Besides, Ludhiana
is the largest trade centre of the State and houses the
largest grain market in Asia (Khanna). Thus, the growth and
survival of the oil mills is obtained, even without it being
a centre of raw l1Iaterial. Even the oil mil Is of Bathinda
district are dependent on this centre
requirements of markets and machinery,
(Ludhiana) for their
though the district
1.'34
itself has an edible oil refining unit in Bathinda city. If
Most of the vanaspati units are located in the towns of
(Patiala), Khanna, Doraha (both Ludhiana district), Rajpura
and Amritsar, besides Ludhiana itself.
5.26 Sale of Products and Other By-Products
The functioning of an industrial unit depends a great
deal on the efficiency of financial transaetions of the firm.
As regards the rice mills, 75 per cent of the rice mil I ad
goes to the government as I evy quota, II thus leaving behind
only 25 per cent for sale in the open market. The question
asked was how much time it took to receive payment for this
25 per cent of rice sold to the traders in the open market.
The survey revealed that almost al I the rice mi Ilers
were able to obtain payments for their sales within 15 days.
In some cases, even cash transactions were being practised.
Custom- mi I ling is in practice among the rice mills in
Punjab. The millers do custom-milling for the wholesale
traders and the government at the rate of Rs. 5 per quintal.
This rate was only Rs. 2.25 per quintal in the early 197.,s.
Besides this rate, the millers retain paddy husk and rice
bran (the thin brown coating on the grain under the husk)
which are now being marketed on a large scale in Punjab.
Whereas rice bran is being used extensively in the
manufacture of edible and non-edible oils, rice husk is used
for steaming purposes in various industries like hosiery,
oil milling, etc ..
A few years ago, rice husk was a great nuisance to rice
mill owners. They used to invite tenders to remove it from
the mill compounds. Today, it is being used to generate
135
steam and electricity. The husk is fed to boilers in place
of coal to generate steam required for making parboiled rice.
The excess steam is diverted to a turbine to generate
electricity to light the mill and r'Jn motors required in rice
processing.
electricity,
Many of the
wh i 113 soml3 of
mil Is today
them sl3l I
produce their own
it. However, the
c a lor i f i c val u e 0 f ric e h 'J ski son I y 66 p e ~ c e n t 0 f c 0 a I, b 'J t
for a rice mi II owner it is almost free.
market,
quintal.
husk is now being sold at the
Similarly, rice bran is another
Even in the open
rate of Rs. 50 per
very valuable by-
product. If processed within a day of dehusking, rice bran
yields an edible oil for which there are many extraction
plants in the States of Punjab, Haryana, Andhra Pradesh and
Tami I nadu. If not used quickly, rice bran is used for
poultry and livestock feed manufacturing. Rice bran inedib)~
oil is one of the best leather conditioners and is
extensively used in the soap and pharmaceutical industry.
Rice bran is being traded in Punjab at the rate of Rs. 2
pe r Kg.
The financial transactions of oil mills with regard to
the sales of their output showed that there was no consistent
pattern of receiving payments for sales of output. I t
varied between less than a week to about a month tor
different mills by different customers.
On the whole, there were found to be some basic
similarities in the organisation and functioning
.ills
basic
in two districts
nature of the
Ludhiana and Bathinda,
indu!9try. A I so, there
of rice
due to the
were clear
differences in certain respects like size and working of the
mills, and factors in location, al I mainly due to the low
level of in one district in terms of
agricultural
development
production, rice cultivation, i nd us t ria I
progress, infrastructure etc. Thus. the economies of
districts. as such. had a significant impact on
the
the
functioning. structure and performance of
industry in the two districts.
the rice milling
The comparative picture of the two districts in oil
mil Is showed that the average age of the oil mills
the districts was the same. This was so due to
in both
the fact
that the southern region of Punjab. of which Bathinda is a
part, was wei I known for its mustard and rapeseed production
until the advent of irrigation and Green Revolution in this
Thus. the Bathinda district has an equally strong reg ion.
and old
Though
history
the oi I
in oilseeds as LIJdh iana might. claim.
mills in Ludhiana had an edge over those
in Bathinda in terms of size of unit, the average employment
was found to be higher in oil mills in Bathinda district.
This was due to the low level of mechanisation in oil mills
in the district. for e)(ample, if there is an elevator in the
mi 11, less number of workers are required.
5.3 Structure and Functioning of Secondary Processing
Industry: The Case of Bakeries
The primary processing industries are considered the
harbingers of industrialisation in agricultural economies.
As agricultural incomes rise, secondary processing
industries emerge which process the output and by-products of
primary processing industries. The secondary processing
industries represent a more mature industrial nature of the
137

economy because they reflect not only higher incomes by way
of demand for their output, but they also lead to greater
addition of value, to agricultural products by way of
further processing, th~n the primary processing industries.
Punjab h~s had a leading position in the country in
agricultural and overal deve I opment. There has been a
growth of primary processing industries in the State. and the
secondary ones like vanaspati and baking are emerging on the
scene consequent upon the effects of agricultural growth and
higher incomes and investments in the 197~IS and the 1980's
(Table 5.10). This survey of the bakery industry attempted
to look at the emergence. functioning and structure of small
scale bakery units and the unorganised sector bakeries
engaged in the manufacturing of bread, biscuit and other
bakery items. The units covered in the sample survey were
those registered with the State Directorate of Industries.
Punjab and thus called smal I scale. But. only about 50 per
cent of them were registered under the Factories Act.
Table 5.10: Growth of Smal I Scale Baking Industry in Punjab -District -wise, 1979/80 and 1987/88 (No. of IJnits)
Year 1979/80 1987/88
District Bread Biscuit Total Bread Biscuit Total
Amritsar 6 13 19 49 75 124 Ba th i nda. 9 1 1" 18 7 25 Faridkot 4 1" 14 5 12 17 Fe roz p'Jr 2 " 2 17 • 17 Gurdaspur 0 4 4 " 18 18 Hoshiarpur 0 " " " 5 5 Jalandhar 4 6 10 21 33 54 Kapurthala 1 " 1 12 1" 22 Ludhiana 8 9 17 26 42 68 Patiala 5 " 5 56 0 56 Ropar 0 0 fJ 4 35 39 Sangrur .., 4 4 3 17 20
----------------------------------------------------------------Total .'39 47 86 211 254 465 -------------------------------------------------- ---------------Source: State Directorate of Industries. P'.Jnjab. Chandigarh.
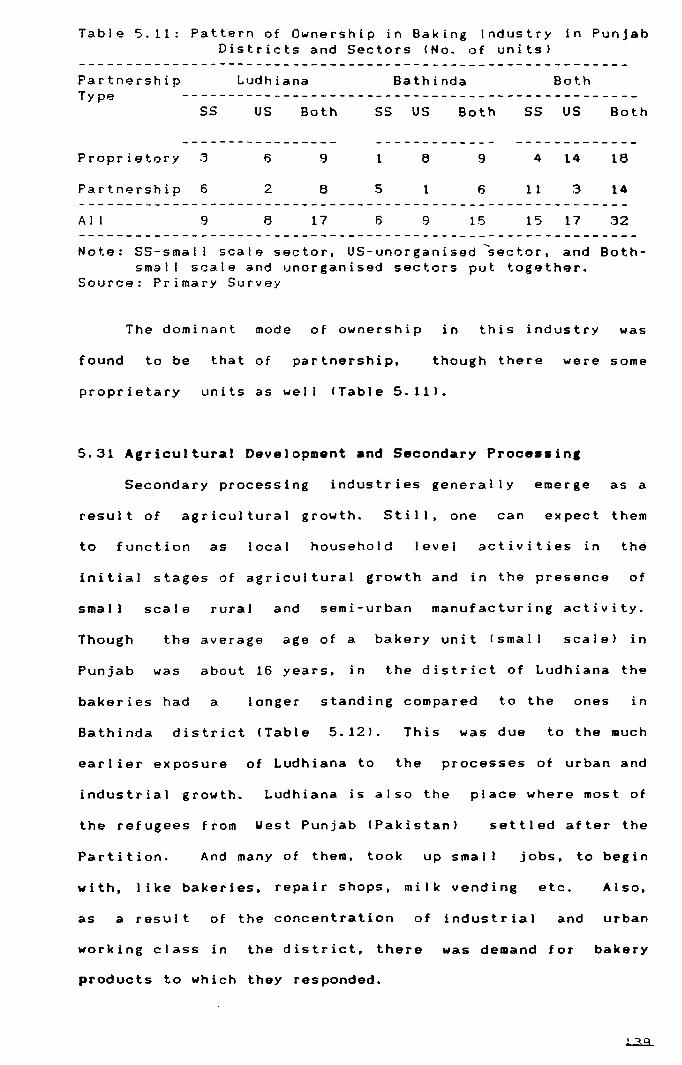
Table 5.11: Pattern of Ownership in Baking Industry in Punjab Districts and Sectors (No. of units)
Partnership Type
Ludhiana Bathinda Both
55 US Both 55 US Both 55 US Both
Proprietary 3 9 1 8 9 4 14 18
Partnership 6 2 8 5 1 6 1 1 3 14
A I I 9 8 17 9 15 15 17 32
Note: SS-smal I scale sector, US-unorganised sector, and Bothsmall scale and unorganised sectors put together.
Source: Primary Survey
The dominant mode of ownership in this industry was
found to be that of partnership, though there were some
proprietary units as well (Table 5.11).
5.31 Agricultural Development and Secondary Processinc
Secondary processing industries generally emerge as a
result of agricultural growth. Still, one can expect them
to function as local household level activities in the
initial stages of agricultural growth and in the presence of
sma I I scale rural and semi-urban manufacturing activity.
Though the average age of a bakery unit (smal I scale' in
Punjab was about 16 years, in the district of Ludhiana the
bakeries had a longer standing compared to the ones in
Bathinda district (Table 5.12'. This was due to the lIIuch
earlier exposure of Ludhiana to the processes of urban and
industrial growth. Ludhiana is also the place where most of
the refugees from West Punjab (Pakistan) settled after the
Partition. And many of them, took up smal I jobs, to begin
with, I ike bakeries, repair shops, mi I k vending etc. Also,
as a result of the concentration of industrial and urban
working class in the district, there was demand for bakery
products to which they responded.
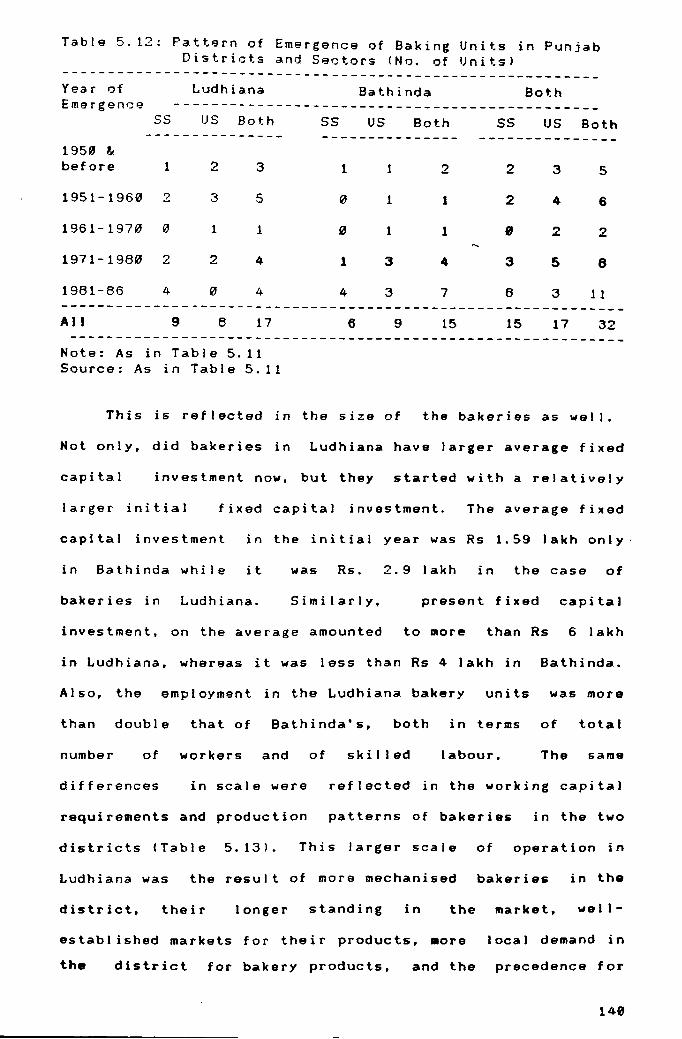
Tabl", 5.12: Patt",rn of Emergenc", of Baking Units in PIJnjab Districts and S"'ctors (No. of Units)
----------------------------------------------------------Year of Ludhiana Bathinda Both Emergence ----------------------------------------------
SS IJS Both S5 U5 Both 5S US Both --------------- --------------- ---------------
1950 & before 1 2 3 1 1 2 2 3 5
1951-1960 2 3 5 0 1 1 2 4 6
1961-1970 " 1 1 0 1 1 " 2 2
1971-1980 2 2 4 1 3 4 3 5 8
1981-86 4 0 4 4 3 7 8 3 11 -------------------------------------------------------------A II 9 8 17 6 9 15 15 17 32 ------------------------------------------------------------
Note: As in Table 5.11 Source: As in Table 5.11
This is retlected in the size ot the bakeries as wei I.
Not only, did bakeries in Ludhiana have larger average fixed
capital investment now, but they started with a relatively
larger initial fixed capital investment. The average fixed
capital investment in the initial year was Rs 1.59 lakh only'
in Bathinda while it was Rs. 2.9 lakh in the case of
bakeries in Ludhiana. Similarly, present fixed capital
investment, on the average amounted to more than Rs 6 lakh
in Ludhiana, whereas it was less than Rs 4 lakh in Bathinda.
Also, the employment in the Ludhiana bakery units was more
than double that of Bathinda's, both in terms of total
number of workers and of skilled labour. The same
differences in scale were reflected in the working capital
requirements and production patterns of bakeries in the two
districts (Table 5.13). This larger scale of operation in
Ludhiana was the result of more mechanised bakeries in the
district, their longer standing in the market, we I 1-
established markets for their products, .ore local demand in
the district for bakery products, and the precedence for
148

this industry in the city of Ludhiana where it was being run
on more commercial and industrial I ines by people from many
walks of life. The pattern of emergence of the baking units
suggested that most of them were post-1970 phenomenon which
supports the well-established hypothesis
processing industries emerge with a lag,
agricultural growth (Table 5.12).
5.32 Size and Working of Bakery Units
tha t
as a
secondary
res IJ I t of
Though these bakery units have been treated here, for
purposes of analysis and sample survey, as the small scale
registered 'Jnits, among themselves. they vary in their size.
There were bakery units with as smal I a present fiKed
capital investment as below Rs 1 lakh, but there were also
baking units with as large an investment as more than Rs 10
I akh, and one in Ludhiana, with investment of more than Rs
20 lakh. But, even then, they fulfil the criterion of small
scale investment, as laid down by the government. At
present, the investment I imit for the small scale sector is
Rs 60 lakh. Even in terms of number of workers employed,
most of them were having less than 20 workers each. Ludhiana
had two mechanised and 3 semi-mechanised bread units against
none in Bathinda district.
Unlike the primary processing industries like rice
mills and oil mills, baking is a perennial activity, as the
secondary processing industries are supposed to be, because
they are not directly dependent on agricultural raw
materials for their production but obtain their raw
materials after some processing from primary processing
industries. Most of the bakery units were working for only
one shift, but for 12 hours, instead of 8 hours, as a shift

Table 5.13: Average Age and Size of Baking UnitS in P'Jnjab Districts and Sectors (No. of units'
------ ---------------------------------------------------Ludhiana Bathinda Both Averagq
Variable -----------------------------------------------55 1)5 SS US SS US
------------------------------------------------ -----------Age of the Unit(years) 18. 1 27.5 13. 1 16 16.2 21.5
Fixed Capi-tal Invest-ment* initial 2.9 0.575 1. 59 4.78 2.38 2.80
present 6.7 48.375 3.58 23.30 5.46 35.12
Employment ( No. of total 31 5 11 4- 22 4.5 workers) ski I led 5 1 2 1 4 1
Working capital 61444 5975 26333 1988 47400 3864.7 (Rs. )
Production 305 39.75 162 28.67 248 33.9 (Rs.'000/month) ----------------------------------------------------------------Notes: * - investment in Rs. Lakh for small scale sector and in
Rs.'000 for unorganised sector; Sector codes as in table 5. 11
Source: As in Table 5.11
is commonly understood. Some mechanised units in Ludhiana
were even operating two shifts a day (of twelve hours each).
On the employment side, a specific feature was that these
baking units were characterised by migrant labour. Except
for one unit in Ludhiana, al I of them had migrant labourers
working for them (Table 5.14).
Table 5.14: Distribution of Baking Units According to Their Sources of Labour
-----------------------------------------------------------Districts and Sectors (No. of Units)
Source ---------------------------------------------------Ludhiana Bathinda Both
------------------------------------------------- ----------------5 5 U S Both S 5 U 5 Both 5 5 U 5 Both
lolithin the State 1 1 2 I 2 2 1 3 4
Outside the State e 6 14 6 6 12 14 12 26
Both (50:5") " 1 1 0 1 1 0 2 2 -----------------------------------------------------------------A I I 9 8 17 6 9 15 15 17 32 -----------------------------------------------------------------Note and Source: As in Table 5.11
142
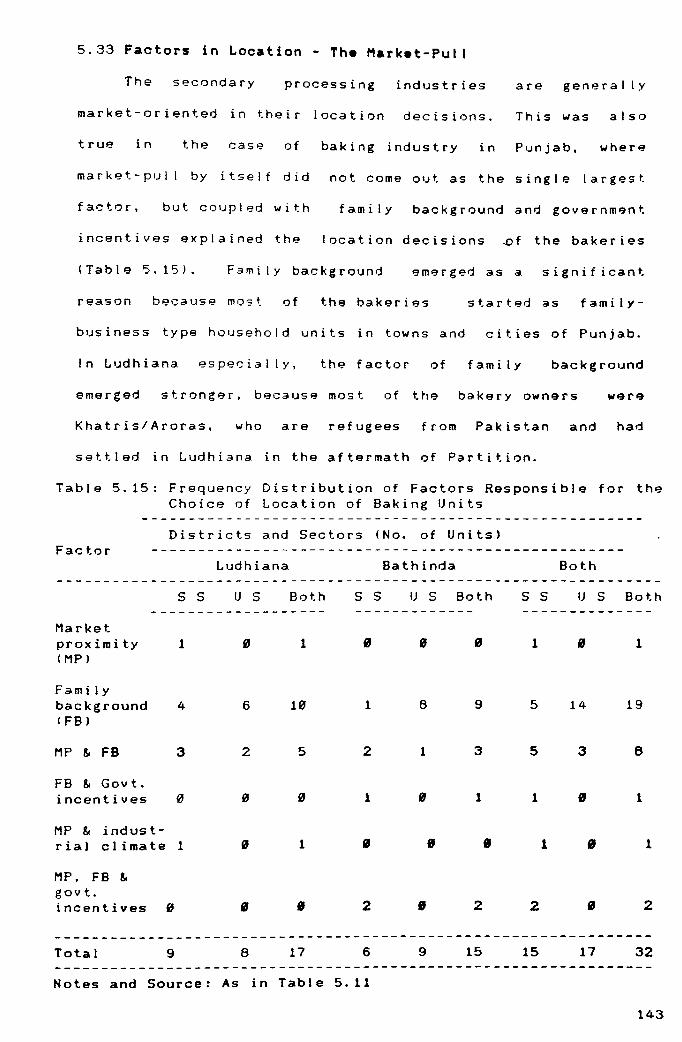
5.33 Factors in Location - The Market-Pull
The secondary processing industries are generally
market-oriented in their location decisions. This was a I so
true in the case of baking industry in Punjab, where
market-pul by itself did not come out as the single largest
factor, but coupled with family background and government
incentives explained the location decisions ~f the bakeries
(Table 5.15). Family background emerged as a significant
reason of family-
business type household units in towns and cities of Punjab.
In Ludhiana especially, the factor of f am i I y background
stronger, becalJse most of the bakery owners
Khatris/Aroras, who are refugees from Pakistan and had
settled in Ludhiana in the aftermath of Partition.
Table 5.15: Frequency Distribution of Factors Responsible for the Choice of Location of Baking Units
Districts and Sectors (No. of Units) Factor
Market proximity (MP)
Family background (FB)
MP & FB
FB & Gov t. incentives
S S
1
4
3
MP & industrial cl imate 1
MP, FB & gov t. incentives 0
Total 9
Ludhiana
u S Both S S
1
6 10 1
2 5 2
1
1
2
8 17 6
Notes and Source: As in Table 5.11
Bathinda
IJ S Both
8 9
1 3
1
2
9 15
Both
S S IJ S Both
1 1
5 14 19
5 3 8
1 1
1 1
2 2
15 17 32
143
In t9rms of th9ir mark9t operations, the Ludhiana units
werp. having mark9ts even outside the Punjab State, in
neighbouring Stat9s like Haryana, Rajasthan etc.
this, the units of Bathinda district wer9 confined
Stat9 of Punjab only in their markets. Though most
Un like
to th9
of the
units in both the districts were sel ling thefr products, on
a wholesale basis, through the commissioned sellers who had
retail outlets, some of the bakery units had their own
showrooms in cities and towns. The supply of product to the
mar ke twas donp. on a daily basis because the product,
especially bread, is perishable, though biscuits and other
items can be supplip.d less frequently.
Subcontracting has become quit9 prominent in som9
industries I ike bicycles, hosiery, soap etc. especially in
Punjab.
bakery
quite
But, no case of subcontracting was found in the
industry. The units in two sectors were operating
ind9pendently of each other. The more important reason
for the absence of this practice was that if the unorganised
bakeries were tied up with the larger units, their margins
would have come down; the reasons being protected local
markets, delay in getting payments from the large buyers.
and rejections by the parent unit due to lack of quality
consciousness in the unorganised bakery sector. On the other
hand, the large firms were wary of tying up with the small
bakeries dlJ9 to low quality of products and the lack of
commitment on their part about keeping to schedules.

5.4 Factor Productivities in Primary and Secondary Proc •• sin.
Industries
The capital labour ratio IK\L) is one of the most
commonly used indicators of labour intensity, especially in
studies relating to the employment implications of
technological choice. This ratio analysis for the primary
processing industries revealed that on the whole, oil mi I Is
in the study dist~icts were more capital intensive (or less
labour intensive) than the rice mills. However, within oil
mills, capital intensity was higher in the more developed
district of Ludhiana. On the other hand, rice mills were
less capital intensive in Ludhiana. In the relatively less
developed district of Bathinda, rice mills were found to be
as capital intensive or as labour intensive as oil mills when
total capital investment was taken into consideration. " major factor explaining the high capital intensity of rice
mills in Bathinda was the underutilization of capacity. They
were more seasonal and operated less number of shifts
CTable 5.16).
Table 5.16: Capital-Labour Ratios for the Primary Processing Industries in Punjab
Ratios
AFC/L
(Rs. )
TC/L (Rs. )
Districts and Industries
Ludhiana Bathinda
Rice mills Oil mills Rice mills Oil mills
26274.5 56666.7 312"" 37142.9
59215.7 1"7333.3 696"" 64761. 9
Note: AFC/L - average fixed capitaillabour, and TC/L -total capitaillabour where labour means number of workers.
Source: calculated from the primary survey data.

....... -----------------. --------------------------------------------------
On the other hand, in baking industry, the small scale
un its i n L ud h ian awe rei e s s cap ita I intensive than their
counterparts in Bathinda. But the capital productivity was
more or lEss the same in both the districts, though labour
productiv ity was higher in the capital intensive district.
In the un~rganised bakery sector, Ludhiana had higher capital
intensity as well as labour productivity, but lower capital
productiv ity than that in Bathinda (Table 5.17).
Table 5.17: Ratios for the Baking Industry in Punjab
Districts and Sectors
Ludhiana Bathinda Ratio
FCI/L (Rs. )
TC/L (Rs. J
O/Fe
OIL (Rs.
s s --------21612.9
23595
4.0298
88548.38
u S S S - - --- --------
9675 32545.5
10870 34939.4
7.38 4.0726
71550 1,32545.4
Note: sector codes as in Table 5.11
U S - - - --5825
6322
11. 08
64507.5
Source: calculated from the primary survey data.
5.5 Prod~c~ion Function Analysis:
The production function analysis for the primary
processi ng industries (rice mills and a i I .. i I Is) and
secondary processing industry (baking both sectors) was
attempted vith the primary survey data. The results of the
analysis are reported below:
In the case of rice mil Is. fixed capital and labour
.xplained 85.7 per cent of the variations in output i .•. the
value of R6 was 85.7 and the coefficients of capital and
labour were significant at 2 per cent and 1 per cent level
the relatively saa11 sized rice aills

I with C3pao::: i ty to mi I I 2 tonnes or I ess of paddy per hour',
the two factors Icapital and labour) explained only about 70
per cent of the output variations. And only the coefficient
of 13bolJr was significant at 5 per cent level.
Specified Production Function: InIRP) = flln INK), In IR[')) where RP - real output, NK - fixed capital, and
RL - labour in man-days.
Regression output for rice mil Is: a) altogether In(RP) = flln (NK),
Constant I n I R[.1 )
4.376863 0. 195257
0.857086 20
17
b) small rice mills
Std Err of Y Est R squared No. of Observations Degrees of Freedom
X-Coefficientfs) Std Err of Coef. Stu. t =
0.449117 0.165527 2.713256
0.395970 0.121747 3.252386
Sum of Coefficients 0.845088
InIRP) = flln INK). Constant
I n I RL ) )
Std Err of Y Est R squared No. of Observations Degrees of Freedom
X-Coefficientls) Std Err of Coet. Stu. t =
0.343879 0.174173 1.974354
5. 190277 0.189329
0.725615 14
11
0.318947 0.139672 2.283538
Sum of Coefficients 0.662826
The analysis of returns to scale in rice milling showed
that the decreasing returns to scale were operative in this
industry because the sum of co-etficients was less than
unity. It was 0.84 in the case of all .ills put together and
only 0.66 in the case of relatively small ones. One ot the
reasons tor the decreasing returns to scale in rice milling
could be the underutilization of capital equipment consequent
upon the underutilization ot capacity and seasonal working ot
the mil Is.
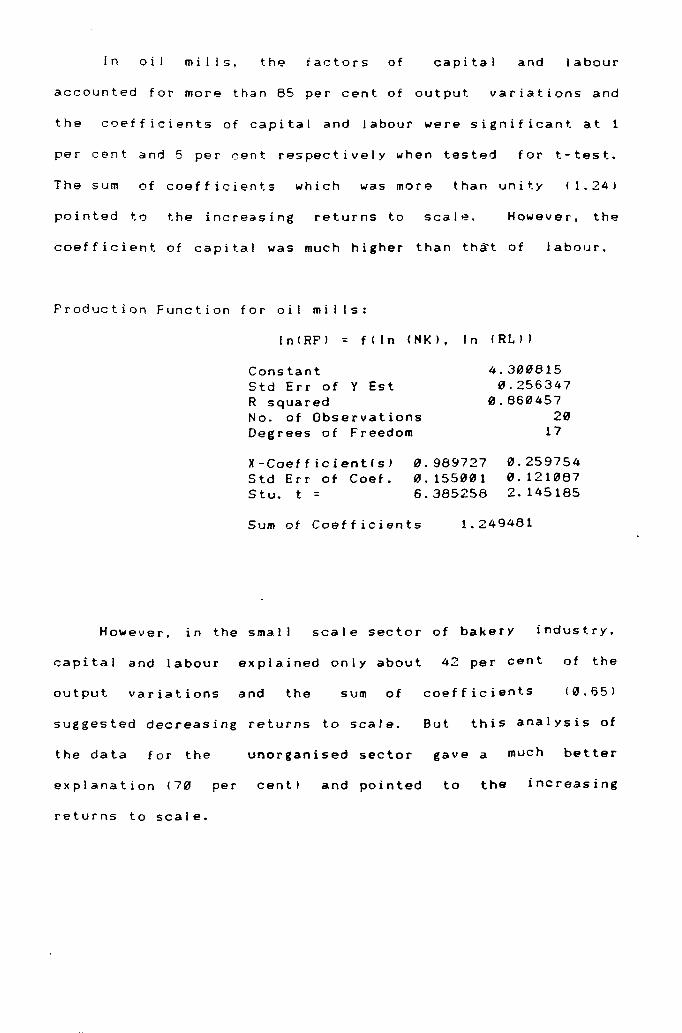
In oil mi I Is. the factors of capital and labour
accounted for more than 85 per cent of output variations and
the coefficients of capital and labour were significant at 1
per c~nt and 5 per cent respectively when tested for t-test..
The sum of coefficients which was more than unit.y ( 1.24)
pointed to the increasing returns to scale. However, the
coefficient. of capital was much higher than th~t of labour.
Pro d lJ C t ion Fun c t ion for 0 i I mil Is:
InlRPI = flln (NKI, In IRLI)
Constant Std Err of Y Est R squared No. of Observations Degrees of Freedom
X-Coefficient(s) Std Err of Coef. Stu. t =
0.989727 0.155001 6.385258
4.300815 0.256347
0.860457 20
17
0.259754 0.121087 2.145185
Sum of Coefficients 1.249481
However. in the small scale sector of bakery industry,
capital and labour explained only about 42 per cent of the
output variations and the sum of coefficients 10.65)
suggested decreasing returns to scale. But this analysis of
the data for the unorganised sector gave a much better
explanation 170 per cenU and pointed to the increasing
returns to scale.
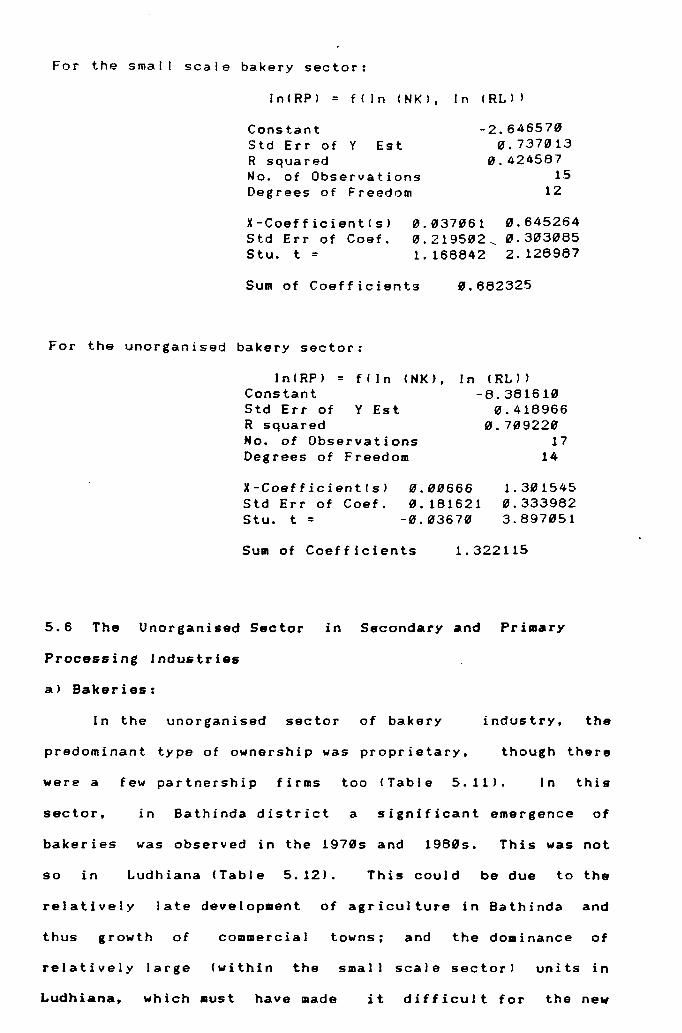
For the smal I scale bakery sector:
In ( RP) = f C InC N K ) ,
Constant Std Err of Y Est R squared No. of Observations Degrees of Freedom
In CRL))
-2.646570 0.737013
0.424587 15
12
X-CoefficientCs) Std Err of Coet. Stu. t =
0.037061 0.645264 0.219502~ 0.303085 1.168842 2.128987
Sum of Coefficients 0.682325
For the unorganised bakery sector:
5.6 The Unorganised
Processing Industries
a) Bakeries:
InCRP) = fCln CNK), Constant Std Err of Y Est R squared No. of Observations Degrees of Freedom
InC RL ) ) -8.381610
0.418966 0.709220
17 14
X-Coefficient Is) Std Err of CoeL Stu. t =
0.00666 0.181621
-0.03670
1. 301545 0.333982 3.897051
Sum of Coefficients 1.322115
Sector in Secondary and Primary
In the unorganised sector of bakery industry, the
predominant type of ownership was proprietary, though there
were a few partnership firms too CTable 5.11). In this
sector, in Bathinda district a significant emergence of
bakeries was observed in the 19705 and 19805. This was not
so in Ludhiana CTable 5.12). This could be due to the
relatively late development of agriculture in Bathinda and
thus growth of commercial towns; and the dominance of
relatively large Cwithin the small scale sector) units in
Ludhiana, which must have made it difficult for the new
entrepr~neurs to enter this line of product ion.
But, even in this sector, the units on the average were
of long~r standing (27.5 years) in Ludhiana, compared to that
of 16 years in the case of Bathinda. S i mil a 1'1 y, in many
other respects I ike present fixed capital investment,
employment, working capital, and production, the Ludhiana
~
bakeries were larger in size than the Bathinda bakeries
!Table 5.1.3'. However, the average initial fixed capital
investment was found to be much lower in Ludhiana than
Bathinda, which was due to the much earl ier emergence of
most of the bakeries in Ludhiana and very late 11970s and
1980s) emergence of bakeries in Bathinda. S i nee t.he
investment refers to the one which was made at the
respective time period, naturally the units of later origin
would have to invest more to start the same level of bakery
business. This initial fixed capital investment in Ludhiana
was less than Rs 600, compared to Rs 4780 of that in
Bathinda. But the present average fixed capital investment
in Ludhiana stands at more than twice IRs 48375) of that in
the case of Bathinda (Rs 23300'.
Employment-wise also, the bakeries in this sector were
very small. The average employment per baking unit was 5 and
4 in Ludhiana and Bathinda respectively and on the average
only one skilled worker was employed in each bakery. This
employment was made up of migrant workers to a very large
extent. In more than 2/3 of the units, a I I the workers
employed were from outside Punjab. However, in some cases,
the ski I led
(Table 5.14'.
of Rs. UHH'
labour happened to be from Punjab State itself
The skil led workers were paid a monthly wage
on the average, while the unskilled ones
received only Rs. 400 per month and that too on the basis of
daily wages without security of job and benefits of paid
hoi id3Ys.
Most of the bakeries were working for more than 8 hours
a day, though time was not fully spent for baking alone.
However, only 1/3 of them were operating at full capacity,
and 1/3 being at capacity utilisation level of between 75
and 100 per cent. Oven baking was the common practice in
all the bakeries. The uti I isation of capacity was found to
be particularly high in Bathinda district than
which could be due to the I jloited number of
in Ludhiana
bakeries in
Bathinda and the growing demand in
This was evident from the
the district in the
of recent past. fact
the Ludhiana baking units (sma I I scale
supplying bread and
Bathinda district.
other bakery items in
that some
sector) were
the towns of
So far as the markets for raw material and final produce
are concerned, half of the bakeries were purchasing raw
materials ( inputs) f rom the re ta i 1 mar ket and the other ha 1 f
from the wholesale market. But in all cases, the market was
local only. The sales were conducted mostly in the form of
bakery-cum-shop outlets. Since these bakeries were more in
the form of small businesses, there was no consideration of
any factors of location. Most of them had co.e up as a
means of livelihood in a very meagre way and were located
within
city.
the house or in a nearby place in the
Family background was the only factor,
sallie town or
mentioned to
be responsible for location of bakery at any place in allDost
all the cases !Table 5.15). Most of the bakeries also took
up biscuit lIIaking on hire basis for the rural and urban
households, at the rate of Rs. 10 per Kg. with raw material
provided by the cl ient.
Thus, to sum up, whereas the organised sector of baking
industry had partnership ownership, the predominant mode in
the case of unorganised sector units was proprietory. Most
of the units in the registered sector were o~ recent origin
or had graduated into registered smal I sector only after the
1960s, and were relatively young in age compared to the
unorganised sector bakeries. The patterns of fixed capital
investment,
skewedness,
initial and present, al so showed extreme
the registered small units having very large
investments and the unorganised sector units very low. The
sa.me holds good for employment patterns as wei I. But, in
terms of production volume. more t.han 50 per cent of the
small scale (registered) units were having as low a
production as mos t of the unorganised sector units.
Bes ides. there were many other sharp differences in the
structure and conduct
sectors.
pattern of the units in these two
b) A Brief Case Study of ·Oil Ghanis·
Two case stUdies of ·Oil Ghanis· (~ooden Oil Crushers).
as they are popularly known. though they have power-run
small expellers. were made in order to know more about the
unorganised sector of this industry in the State. Both the
ghanis - located at Mansa town in Bathinda district. were
started around 1970. They are run by families who were
shopkeepers (Karyana Merchants) earlier in the same town.
Though both of them started with one expeller each (costing
about Rs. 2000 at that time). one of the units later added
another expeller in 1978. Both the units undertake custom

milling
during
of them
for the households as their main business, though
peak months of oil seeds arrival in the market, one
resorted to the crushing of large quantities of oil
seeds and counter sa I es of oi I and oi I cake on reta i I
Only mustard oil seeds were being processed.
bas is.
In both the cases, one skilled
employed and he was paid about Rs.
person per expeller was
1000 per mQnth. Besides,
both the units have integrated Atta Chakkis (flour mill)
al so, where ·:;;us tom milling of wheat for household
consumption is the main activity. Another person was employed
for the flour milling in both the cases and was being paid
about Rs. 400 per month. Here, all the workers were local
(Punjabis) only.
The capacity of the expeller was 40 Kgs. of mustard oi I
seed crushing per hour which yielded about 13 Kgs. of 0 i l.
The cost of crushing 15 Kgs. of oil seed. popularly known as
·One Ghani- in Punjab is Rs. 7. The cost of one expeller
at present was stated to be Rs. 18000, and the fixed capital
investment was of the order of Rs. 25000 in one case and
Rs. 50000 in the other case with two expellers. This is
inclusive of the investment in Atta Chakki (flour mill) as
well. The major items of working capital are
charges and the wages.
electricity
The answer to the question regarding Why Kohlus (wooden
oil crushers: were not used in Punjab for custom mil ling was
a pointer to the regional disparities in oil use. The Ghani
owners stated that no Kohlus are used because Kohlu oil is
bitter and causes burning if applied on the body. That is
why it is not preferred in Punjab. But the Kohlu oil has a
153
-----------------~ .. ~ -------------------- ---
very good market in Calcutta and adjoining areas because
Muslims and others in
and other purposes.
those regions use it for fish frying
Both the units were being run by persons belonging to a
trading caste - Bania. In one case, it was taken up because
it was found to be profitable, while in the other one it was
taken up as an alternative job when the shop of the family
was demol ished by the local authorities as it was an illegal
construction.
5.7 Conclusions
This analysis of primary and secondary processing
industries reveals that the predominant mode of ownership was
p':Htnership in all the industries studied, except the
unorganised sector of the baking industry and the oil ghanis.
In majority of the cases, the partners were members or
relatives of the same family.
Since primary processing industries are based on
agricultural output, the cropping pattern has a direct
bearing on their emergence and existence. In Punjab, most of
the rice milling units emerged on the scene only during the
late 1970s and the early 1980s as a result of change in the
cropping pattern in favour of paddy cultivation in the State.
However, another
was relatively
primary processing industry - oil milling -
free of such a tie-up with the cropping
pattern and was -footloose- in its raw material procurement.
Most of the
neighbouring
Gujarat.
oil mi I Is obtain
states of Haryana
their suppJ ies from the
and Rajasthan and as far as
-
The proximity of the mills to the market place ana urban
centres had a clear impact on them in terms of their size
and working pa t tel' n. The mil lsi n the developed district:
were larger in size. The study shows that agricultural
growth is the major determinant of the emergence and growth
of food processing industries because it: not: only makes
larger 3 g ric I) I t I) r a I rna I' k e t..3 b 18 slJrpl IJses available for
processing but also provides markets for processed products
and funds for investment by way of higher incomes for the
rural f3mi lies.
On the other hand, the secondary processing industries
seemed to be more responsive to urban demand and industrial
consumers along with agricultural growth as was evident from
the study of bakery industry. Here too. the baking units in
the relatively developed district were larger in size on an
average.
But the findings on the employment aspects of tood
processing industry revealed that. though they were major
sources of employment for the unskil led and semi-skilled
migrant workers, they did not generate the type of
employment which would suit the local educated rural youth.
The existing pattern of employment not only excluded local
people. but also the type and quality of jobs generated was
poor. The wages in this industry were as high as or even
lower than that in the agricultural sector of the State
besides and were seasonal in nature. Thus. these jobs acted
as competitors to agricultural work and led to labour
shortage in rural areas during peak months. The employment
character of the secondary processing industry was also of
the same type as in the primary proc~ssing industries.
155

In the follwing chapter, an analysis of linkages of
these industries with the rest of the economy has been
att.empted.
Notes
1. Data for 1987\88 from Punjab. Chandigarh.
the State Directorate of Industries,
2. Gazetteer ot B R Pub. Corpn .•
the Ludhiana District, De I hi.
1904, ~
reprinted in 1985 by
3. A survey of 9 fice mills (automatic modern) conducted by IAMR, New Delhi (1979) in Punjab during the late 1970s also revealed that all the mills were in the registered non-household sector and predominantly partnership firms in private hands. (See Institute of Appl ied Manpower Research (IAMR) Report No. 12/1979, Aug. 1979).
4. That Ludhiana was known for its production of oi) seeds and export of oil even in the beginning of 20th century is revealed by the District Gazetteer (1904) reprinted in 1985 by B R Pub. Corpn. De I hi. Even Bathinda district used to export oil seeds (see Gazetteer of Patiala State, 1904) .
5. Statistical Abstract of Punjab, Various Years.
6. During the 1950s, there were 12 units in cotton ginning and 28 in oilseed crushing in Ludhiana district (See Punjab District· Gazetteer - Ludhiana, 1970). The Gazetteer noted that in the district, oilseed crushing, flour-milling, dal milling and cot.ton ginning were composite industries.
7. In the early 19705, most of the rice mi lis in Punjab were each of one tonne capac i ty (See Gupta and Geo r ge. Dc t. 1974).
8. Even during late 1970s, it was found that the rice mills on an average employed 36 workers each. (See Institute of Applied Manpower Research (IAMR) Report No. 12/1979. Aug. 1979).
9. Even in the early 19705. on an average, the mills worked at full capacity (3 5hifts\day) tor about 5 months in a year (see Gupta and George. Oct. 1974).
10. Interestingly, this particular unit purchased oilseeds worth more than Rs. 6 crore in 1980\81 from the States of Gujarat, Rajasthan, Haryana. and the south Indian States. Even today the uni t depends on oi I seed imports from these States (Govt. of Punjab, Economic and Statistical Organisation Publication No. 435, 19(4).
11. This levy quota was 85 per cent in the early 19705 (See Gupta and George. Oct. 1974).

---------- -------
Chapter 6
LINKAGES OF FOOD PROCESSING IN PUNJAB
The ~rowth of non-farm income and employment in the
rural areas depends on the linkages between agriculture and
related rural activities, and between agricultural activities
in genera I, and those in other sectors, notably
On the other hand, the extent of inter-sectoral
industry.
linkages
depends on the dens i ty of the input structure of various
sectors of an economy which is dependent on the level of
technology used (Bhalla et al., 1990, p. 57-60).
importance of these linkages for the creation of rural
has been
systematic
repeatedly emphasised' as has been
res ea r chi nth i s fie I din I n d i a. I
the need
6.1 Theoretical Perspective
The linkage between agriculture and industry has
The
jobs
for
been
one of the fundamental concerns of development economics ever
since Lewis' two sector model of development for
developing economies. Today, in the literature on
development problems of the developing countries,
the
the
the
question of priority to agriculture or industry is no longer
discussed. What is discussed is how to develop both and in
what order?

Mellor (1976) postulates that both agricultural and non-
agr icul tur-al growth are demand-led. and that growth can be
effectively achieved only by labour intensive methods of
production.
rising rural
He argues that agricul tural growth wi II I ead to
incomes and thus, increased demand in rural
areas for consumer goods and services and thereby encourage
labour intensive decentralised production in those areas.
And the higher incomes in rural areas provide a larger pool
for investment in local, small-scale industry.
a food and employment led strategy
The argument
of development is tha t
should encourage the growth of non-agricultural as well as
of agricultural employment in rural areas, and that
agricultural
rural economic
growth linkages encourage diversification of
activity, where . rura I' is understood to
include market towns al so. Ho (1982) al so emphas i s es the
importance of agricultural growth for rural industry and a
more decentralised pattern of industrial growth.
Some other studies have emphasized the agricultural
surplus linkage of agricultural growth for i ndustr ia I
approaches
relationship
development.
(Classical
Mishra (1988) dwelling on two
and Marxian) to the problem of
between agricultural surplus and economic development argues
that though marketable surplus is a crucial constraint on
industrialisation and development of an economy, the question
of how surplus is generated and realised is more crucial.
lJithout this process, the agricultural surplus could not be
realised
industry.
into productive investment
However, Kumar (1987) in his model
in agriculture and
of the Rrocess of
long -
neither
run growth in a dual open economy, observes that
the existence of a capitalist industrial sector nor
the availability of steadily growing agricultural surplus
assures balanced growth. What is required is an appropriate
mix of the two. This does not imply however that
agricultural surplus has no role to play in the economy. In
his model, the region of successful -take-off- is enlarged
when such surplus does become avai lable, increasing thereby
the chances of transformation of the economy into a mature
capitalist economy. Kumar observes,- Agricultural surplus
therefore is a catalyst for growth rather
as may be implied by the analysis of Fei
as Jorgenson-(p. 21).
(1991) assigns a very
than its 'engine'
and Ranis as wei I
important role to Maitra
technology in forging linkage between the two sectors and
argues that an effective linkage cannot be expected to take
place when
isolation.
technological changes in both sectors occur in
He
evolves into
establishing
contends
industrial
a linkage
that when traditional technology
technology, the question of
does not arise as linkage
16(J

automatically emerges. Har .. iss (19911 seems to suggest
that diversification of rural labour is more a response to
the demand pull of dynamic rural industrial growth, and is of
the growth-opportunity type. Besides,
the diversification of rural activity
Harriss observes that
is linkecfmore to the
growth of large-scale industry in the urban organised
sector. In other words, while agriculture releases labour
and possibly surplus, for the non-agricultural sector and
provides a part of the market for it, it is large scale
modern industry which really is the leading sector of
growth.
6.2 Empirical Studies on India
As far as empirical studies of this linkage in India are
concerned. a number of scholars have dealt with this issue.
Raj 11976) has explained the link between fluctuations in
agr icu I tura I incomes and growth of small industries in a
region. Asian Development Bank (1977) attempted a
quantification of the inter sectoral linkages through
input-output analysis and found
depended more heaviJy on its
that
own
a) agricultural sector
output than does the
non-agricultural sector, b) forward as weI I as backward
linkages with the agricultural sector were weak,
particularly in India, and c) export and import linkages weTe
weaker in India than in other countries. It also observed
that the overal I linkages between increased food crop
1&1

production and growth in the rest of the economy were weak
in most of the countries. including India.
Rangarajan (1982) attempted
relationship between agricultural
growth in India for· the period
measurement of the broad
growth and
1960-1972 and
industrial
found that
agricultural growth
industrial growth.
could have a significant effect on
It was found that 1 per cent addition to
agricultural growth rate stimulated 0.5 per cent increase in
the growth rate of industrial output and 0.7 per cent
increase in growth rate of national income. Sau (1988) whi Ie
discussing the impact of Green Revolution on industrial
growth in India, al so hints at the> investme>nt factor
contribution of agricultural growth to industry wherein
gentlemen farmers, with agricultural investible surpluses,
invested in small-scale industry, and generated demand for
industrial consumer goods. The relationship between
agriculture and industry has been emphasized by Ahluwalia
( 1987), MundIe (1985), and Mody (1981) as wei I among others.
However, Mishra (1988)
during the colonial rule,
observes that in India, whereas
British merchant capital brought
about • forced commercialisation- of Indian agricul ture,
production
backward.
relations in agriculture remained traditional and
Thus, the extraction process of agr icul tural
surplus could not realise surplus value into capital tor
productive investment in agriculture (industry as weill.
But, during the post-Independence period though the emphasis
on agricultural development increased agricultural surplus.
"forced" commercialisation continued and the real ised
surplus value from the extracted surplus did ~ot seem to
have significantly gone into accumulation of capital for
productive investment in agriculture and industry. I t is a
fact that investment in agriculture has been low and
declining in the post-Independence period,
the 1980s (Shetty, 1990, p. 389).
especially during
Hazell and Haggblade ( 1990) a I so find that the rural
non-farm activities in India are closely linked to
agricul tural performance. This could be seen in the shifting
structural composition of the Indian economy over time,
wherein non-farm share of national income and employment
showed a sizeable increase in the 19705 - the p8riod of rapid
agricultural growth associated with the Green Revolution. At
the State level, high performance States in agriculture I ike
Punjab and Haryana, had a greater density of rural non-farm
activity, a greater density of rural towns, and
proportionately more commerce, service and factory
manufacturing than States with poorer records of agricultural
productivity and growth. Ever. the composition of non-farm
activity differed across States wherein high income States
attracted more of non-household !factory manufacturing) and
163
service activities.
The econometric analysis revealed that the income
mul tipi ier was as high as 0.93 in Punjab and Haryana against
only 0.46 in States like M P and Bihar. However, it was
real ised that agricultural growth alone can no~ provide the
necessary market to sustain the rapid growth of
manufacturing sector because the intrastructural and
variables also matter. The role of rural towns was
be very important in inducing non-farm activity.
India's
po 1 icy
found to
In a recent study, Maitra (1991) discusses this
fundamental problem of economic development - the problem of
linkage between agriculture and industry using the cases of
Punjab in India and Japan. Maitra finds that since Japanese
industrial growth was labour intensive in nature, it led to a
shift of the labour force from agriculture to non-agriculture
sectors. However, in Punjab, labour force did not move out
of agriculture. The product and market contribution of
agriculture in Punjab has been at least as much as that of
Japanese agriculture during 1880-1930.
But in the case of factor contribution as taxes and
savings, and labour force, the Punjab pa t t er n is almost
opposite to that observed in the process ot economic
development of Japan. Though labour productivity and land
productivity in agriculture are higher in India and
particularly Punjab, compared to those in .I apanese
agriculture in the late 19th century and early 20th century,
the growth of labour force in agriculture in ?unjab has been
much higher \1.4 per cent between 1951 and 19721 compared to
that in Japanese agriculture (-0.2 per cent during
1905-19351. Maitra concludes, -This problem of developing a
dynamic linkage tod3Y could be salved it India concentrated
on developing its traditional technology to meet the modern
needs of a much larger population with relatively organised
social consciousness of higher order today· (p. 23).
Barbara Harriss (1987) who tested Mel lor's hypothesis
of linkages of rural growth in a study of a town in Tamilnadu
found that most of the non-farm enterprises studied did not
have characteristics desirable for local growt.h linkages,
intensity that is rural location. small size. high labour
and local consumption. However, small industry was found to
be better in terms of use of agricultural raw materials and
funds, and local
industrial estates.
labour
It was
than the units located at the
found that production linkages
(backward and forward) were stronger than consumption
linkages. Within production I inkages. forward I inkages were
more important than backward 1 i nkages. The non-local or
outside linkage of the non-farm economy we.e found to be
more important in terms of demand as we 11 as flow of

investment funds out of the local economy to the more
developed 3nd urban areas.
In another recent study (1991) John Harriss examines the
effects cd age icul tural growth on rural non-farm activity
through backward and forward linkages with the
non-agricul tural
questions:
households
activities
occupation
( i )
and
is a
in
sector. He addresses
whether the diversification
rural labour households
himsel f to two
of
into
peasant
off-farm
move to a more productive and rewarding
the rural industries/service sector as
compared
strategy
to agriculture -or whether it is merely a survival
of the last resort which rural labour adopts as
demographic pressure pushes the winvolution W process beyond
the carrying capacity of
diversification at rural
the land;
employment of
( i i )
the
whether
growth
dpportunity type is led by agricultural growth or whether it
is linked to the growth of large scale industry in the
organised sector.
urban
Harriss finds from his analysis that there h~s been some
diversification within the rural economy, though cui tivation
has
In
continued to absorb roughly the same number of people.
the case of a market town in North Arcot district of
Tami) Nadu, Harriss points that activities like rice
milling. paddy trading, manufacture ot s ilk sarees,

bakeries. wooden furniture manufacture. welding and general
engineering and repair services. tailoring, manufacture of
metal vesseis and trading of various types etc. have
expanded due to agriGul tur.31 growth, though they were still
small in size in terms of investment and employment.
But Harriss found that this pattern of demand which was
created j ue to rise in rura I incomes. did not seem to
encourage new. decentralised labour intensive
because most of the items traded and sold in the
production
(studied)
market town were from metropol itan areas like Madras, and of
urban fashion iike soft drinks, cosmetics etc .
.... nalysing the 1 imits to growth I inkage effects, Harriss
points out that Ii) increased agricul tural output was not
achieved at decreasing unit cost, and t ha tit had been
subject to a ~osts squeeze. Thus real rural incomes did not
rise for al I farmers. (iiI the product, and credit (capitall
markets were
agricultural
inter-linked
produce, {iiil
which led to ·forced
the non-commodity
activities were more profitable, th .... investment
sales· of
producing
in which
constrained funds for agriculture or outside
there was a f I o~ of funds from the rural
of it, and (iv)
local economy
towards the metropol itan areas, thus limiting the resources
available for local productive activity. Thus. it can be
said that while 3.gricultural growth may be a necessary
condition for rural diversification of a non-involutionary
kind, it is certainly not sufficient.
George and Joseph (1992) who traced the backward and
for"ward linkages of rubber plantation i nd us try ~ inK era I a
observe that the backward and forward linkages of the
industry appear to be weak in terms of spread effects and
creation of employment opportunities. Bha II a et al 1199~'
also note the reduced operation of linkages in Punjab due to
the import leakages which result due to the dependence of the
State economy on industrial imports for use in agriculture
as well as in industry.
On the relationship between agricultural growth and
growth of agro industry, Behari (1983) is of the view that it
should be natural to expect that the agricultural prosperity
is closely
agro-units.
linked with the development and concentration of
But, on the bas is of his analysis, he remarks,
WThe ranldng of different States with regard to production
of foodgrains and concentration of agro units does not
indicate that the greater development of agricultural sector
would be necessarily accompanied
large number of agro units, for
highest yield per hectare, but the
units there ranked fifth. Jammu and
by the establishment of
example, Punjab has the
concentration of agro
Kashmir has the fourth
highest per hectare yield but it was nineteenth in the
16'

sequence of agro-unit concentration. On the other hand,
Kerala had the second highest agricultural yield and it had
the highest concentration of agro-based manufacturing units.
Tamil Nadu was third in ranking with respect to both these
variables. One is therefore inclined to support the
hypothesis that the level of agricultural devefOpment is a
necessary condition tor the growth at agro based
manufacturing units. but it is not a sufficient condition
f or the same~ (pp. 172-73).
Similarly, Sanjay Baru (1984) analysed the relationship
between agricultural development and smal I scale
manufacturing in Andhra Pradesh during the period 1976-1982.
Whiie agreeing that manufacturing activity in the Green
Revolution districts (coastal Andhra Pradesh) has increased
during the above period, he is highly doubtful about the
val idity of data and the evidence about the investment ot
agricultural surpluses in these manufacturing activities.
He is of the view that there could be in
this growth of the small scale manufacturing
two factors
activity; i )
creation of a home market in these areas of agricultural
growth due to rise in incomes, tor the goods manufactured by
small units, 1 i i ) the investible capital from the
agricultural communities of Reddy, Kamma and Raju may have
come not from agricultural produc t i on, but tram other
activities like construction. trading and speculation. With
the help of the State government incentives and funds. these
people might have come into industry essentially to find a
source of stable income that is Reasy income-.
How~ver, th~re appears to be no significant relationship
b~tween the rate of growth of agriculture and changes in the
share of non-farm employment across States. The absolute
magnitudes conceal the fact that while Punjab has recorded
only a marginal change in the share of non-farm employment
over time, a State like Orissa appears to have registered a
significant increase.
This is not surprising because the size of employment
in the non-agricultural sector is the result ot the
simultaneous operation of a range of push and pul I factors.
Regions that are yet to experience the full force of Green
Reyolution technology, are therefore characterised by low
levels and rates of growth of agricultural productivity and
have relatively low response of employment increases to
output. neceSSitating alternative sources of employment to
avoid a process of -agricultural involution-. However, in
the more mature Green Revolution areas, where land
productivity tends to taper off and where technical change
enters the labour saving phase characteristic of more
mechanised agriculture, the response of employment to output
11 0
growth declines, leading to a reassertion of the • push-
factor (Shand, 1986, pp. 237-381.
But, the existence of a push in favour of non-
agricultural activity is itself inadequate to ensure growth.
The
the
growth of non-agricultural employment is predicted on
avail.3bility of a market to which such activity can
cater to. That is, there must exist a ·pull- as wei I,
however weak it may be.
So far as backward linkages of agricultural growth are
concerned,
employment
correlated
the available evidence seems to suggest tha t
generation in the rural areas is strongly
with the rate of agricultural growth, but the
evidence comes mainly from areas that have experienced high
agricultural growth rates over long periods such as the
Indian and Pakistani Punjabs, the Republic of Korea,
Malaysia, and Taiwan (Singh I, 1990, p. 233). It has been
found that in Taiwan. and to some extent in the Indian
Punjab. farm
and motors,
tools and equipment
threshers. harrows.
such as irrigation pumps
and tillers are largely
fabricated by small scale enterprises in small rural centres
(Cartiller. 1975 and Child and Kaneda, 1975). By contrast,
artisans has the manufacture of farm implements by rural
been of relatively little importance in India and has
involved few non-farm linkages (Singh I. 1990. pp. 247-48).
1:'/

The relationship between agricultural and industrial
growth in Punjab during the pre-Green Revolution period
(1950-1965) was examined by Macrae (1971). The study focused
on the marketed surplus linkage in terms of contribution of
labour, raw materials and investment funds and tried to
explain the success of Punjab's development. A highly
positive relationship (r = 0.963) between the two sectors was
found during the period 1950-65.
Macrae emphasises the role of marketed surplus,
particularly in the growth and development of Punjab because
as a result of unfavourable terms of trade to agriculture,
the farmers were induced to sel I a
would otherwise have been the case.
larger real surplus than
Punjab industry on the
other hand, gained from lower raw material costs; and low
wage cost which was partly due to the favourable cost of food
and partly due to the lack of unionisation which was made
possible by
ordinated) of
the very character (sma I I scale and unco-
the industry in Punjab. This favourable cost
structure led to higher profit margins and thus faci I Hated
the availability and re-investment of funds in industry (p.
411 ) •
Thapar
agricultural
(1971) explored the spread
growth of the late 1960s in Punjab
effects of
and Haryana
on the tertiary sector at the block level and
agricultural growth had led to the generation of
found that
employment
in many activities in Mandi towns like seed and fertilizer
shops. petrol pumps. engineering repair workshops.
commission agency and wholesale trading in foodgrains.
transport. financial services. and food processing. ~ But the
many of these activities were seasonal in nature.
By adding additional employment generated in the study
areas and dividing it by total additional area brought under
high yielding varieties during the period 1966-70. Thapar
obtained an overall coefficient of employment of 6.4 persons
for every thousand acres. But the study looked only at the
local impact of Green Revolution at the block level and
excluded the emergence and growth of non-agriculture
oriented activities in the same area and nearby towns and
cities. especially the consumption linkages of agricultural
growth.
6.3 The Punjab Experiences
As far as Punjab is concerned. the linkage effects of
agricultural growth. coupled with other factors. have been
Quite evident. On the production side. the input
has gradually changed with increased reliance on
structure
purchased
inputs. This in turn has initiated the process of
agro-industrialisation. with expansion in the numbers of
F13
small scale agro-industrial units and beneficial effects on
off-farm incomes and employment.
As regards forward I inkage, wi th the expanding volume
of a g ric IJ I t: lJ r ~ 1 pro d \J C e , the m~ny types of post-harvesting
activities, inside as weI as outside the village~ have given
rise to a high level of seasonal off-farm employment.
Access to off-farm employment in nearby semi-urban or urban
marketing/industrial centres has also come readily to members
of
the
rural households. Rising rural incomes have accelerated
demand for industrial output and employment, the
benefits of which have accrued partially to the rural sector
itself in terms of increased non-farm employment. Further,
the availability of sizeable agricultural surpluses and the
rising demand for processed food and non-food products have
given a great f i I I ip to
industry (Shand, 1986).
the expansion of an agro-processing
In fact, in Punjab, the traditional village industries,
which are dominated by smaller units, have not stagnated as
in the rest of India. Meanwhile some newer industries
specialising in consumer goods and agricultural processing
(often dominated by small and medium size units) have also
shown vigorous growth. These industries tend to have higher
ratios of value - added to employment and lower ratios of
fixed capital to employment than most of the heGlvy

industries chemicals, steel, and power - that dominate
the industrial sector in other States (Singh I, 1990. pp.
247-48).
At the district level, the agriculturally developed.
industrial ised and
Jalandhar, Amritsar
urbanised
and Patiala,
districts
had very
of ~ Ludhiana,
large non-farm
sector in terms of establishments as we I I as own-account
enterprises in agricultural and non-agricultural sectors in
both rural and urban areas. A I so, except for the own_
account enterprises engaged in the agricultural sector.
majority
districts
Ludhiana,
of the non-farm sector activities in these
were in urban areas. The three districts of
Amritsar and Jalandhar together accounted for 43.5
per
This
cent of al I urban non-agricultural sector enterprises.
reflects on the agriculture-industry linkage and
development of infrastructure in these districts. Moreover,
it is indicative of commercialised rural economy and
apparently implYing large proportion of people foraying in
non-farm activities. This also substantiates the fact that
with the advent of Green Revolution, the labour absorption
in agriculture has declined and that with
agriculture, the non-farm activities gain
the
in
growth of
importance
(Singh S, 1991 pp. 41-53 and Economic Census, 1980).
One of the predominant non-farm sector activities is
food processing both in urban as wei I as rural Punjab. This
includes both primary processing industries like rice
milling. oil milling, 3nd wheat milling and the secondary
processing industries like bakeries. fruit and vegetable
processing and milk and milk products. An analysis at the
"-relationship of this industry with agricultural growth also
pointed to the importance of agricultural growth for
non-farm income and employment generation.
In the small scale sector of food processing industry in
Pun jab. the compound growth rates for the number of units,
employment, fixed investment and production in the 1980s
were higher than the State average in the districts of
Bathinda, Ferozpur, Jalandhar, Ludhiana, Patiala and
Sangrur, al I of which are agriculturally developed in terms
of the value of agricultural output per hectare of major
crops. They al I had this value of output above the State
average for 16 major crops for the period 1975\6 to 1979\60
(CMIE, 1985) and for 26 major crops for the period 1962\3 to
1984\5 with the exception of Bathinda (CMIE, 1967). These
five districts (other than Bathinda) accounted for 53 per
cent of employment, 60 per cent of investment and 63 per
cent of production of the small scale sector food processing
industry in Punjab in 1967\8, whereas their shares were only
of the order of 36, 61 and 46 per cent respectively in
1979\60. In terms of number of units also, their share went

up from 36 per cent to 50 per cent during this
and Vyasulu, 1990, p. 463).
In the factory sector of this industrY,
period (Singh
these
districts accounted for more than 60 per cent of
five
total
with employment. This relationship of food processing sector
agricultural growth was further substantiated by the high
degrees (statistically 5 i g n i f i.C ant ) of rank correlation
between not only the hectare value of agricultural
output and growth of
per
food processing industry at the
district level, but also between the area under food crops
(1987\8) which represents marketable surplus, and the
various indicators of growth of food processing industry in
the smal as well as organised sector.
Further, the
under food crops
regression analysis revealed that the area
explained 33 per cent of the growth in the
number of units. Besides, area under food crops and the
factor of urbanisation together explained more than 60 per
cent of the growth in the number of units and employment in
scale sector of food processing sec tor. though the sma I I
only the factor of area under food crops was statistically
I significant at 5 per cent level.
It is also worth noting that there is not. a single
metropol itan city in Punjab, and the State's IJrbanisation has
1=11
taken the path of smal I town development which again has its
roots in the agricultural d"3velopment in the 5tat"3 b"3caus"3
most of the cities and towns of the State are ·Mandis·
centres for agricultural trade. and the farmers now need
more agricultural inputs and want to spend their incomes on ~
a wider range of goods and services. Thus. it is no
accident that Ludhiana district- the heart of the Green
R"3volution. is th"3 most IJrbanised and industrial is''3d
district of Punjab.
Bhalla et al (1990) in the context of Punjab, observe, •
Of particular interest in this context is the role of small
market v i I I ages and towns that I ie on the main roads
connecting larger townships. These villages and towns have
gradually become hubs of economic activity, not only in
trading and agro-processing and repairs but al so in the
provision of social services, heal th and recreation. In many
cases, they have emerged as tiny growth centres serving a
network of peripheral villages·(p.31).
Thus. the Punjab experience shows that a fast growing
agricultural sector is capable of generating (il high and
rising levels of on-farm employment and income, (iiI new and
expanding avenues of off-farm emp I oym"3n t 3.nd income, (iii)
rising demand for purchas"3d inputs and non-farm consumption
goods. and ( i v) considerable industrial growth, heav i ly
}':IS
biased towardS agro-industrialisation, which by its very
nature, is very widely dispersed in space and strengthens
the rural-urban economic relationship. But the Punjab model
of development carries an important lesson: The process of
agro-industrial isation can not sustain itself on ag~iculture
ina sma I I geographical area., however fast it may be
growing. Local demand for agricultura.1 inputs and outputs
has a definite saturation limit.
6.4 Case of Food Processing Industry
The question addressed in this chapter is: What are the
backward and forward linkages of these processing industries
which have emerged and grown as a result of the Green
Revolution and the consequent agricultural growth in the
Punjab State?
The importa.nt role assigned to the agro and food
processing industries
promote links between
in development literature is
agriculture and industry.
that they
The food
processing industries promote this linkage in four ways: (1i
they provide employment opportunities to the labour from
agricultural sector; (2) they lead to better incomes from
agriculture through better market for food output; (3) they
provide outlets for investment of agricultural surpluses; and
(4) they supply final processed products to the urban and
rural markets and thus promote consumption linkages.
In Punjab. the food processing industries in particular
and the agro processing ones in general, do not seem to have
led to the backward linkages.
provided adequate markets for
they generated enough
opportunities for the peopie of
Neither have these industries
agriculture produce, nor have
employment and investment
the S ta teo A major part of
the State's agricultural surpluses
investible) goes out of the State.
(both marketed as wei I as
~hereas marketed surplus
goes out as unprocessed agricul tural output, the
credit-deposit ratio (44.5 per cent in 1989) which was one of
the lowest among Indian States shows that the agricultural
investible surpluses have flown out of the State to a
significant extent. The credit-deposit ratio was even lower
(35.7 pel' cent) in rural areas and was the lowest among
Indian States with the exception of Himachal Pradesh
(Narayana, 1992, p. 256).
A sur v e y 0 f 40 primary processing units revealed that
neither were they dependent on the local economy for
employment nor for investible surpluses in a direct way (see
Table 5.7 in chapter 5 and Table 7.7 in chapter 7). Of
course, the class of traders and commission agents who own
this industr'y predominantly, made their fortunes in
foodgrains trade only by dealing in large quantities of food
and other crops. Later on, they diverted their surpluses to
the processing of agricultural output in which they had been
dealing for long time (see Table 7.5
the labour side. the industry was
in chapter 7).
independent of
But on
local
labourers to a large extent and dependent on migrant
labourers who are wil ling to work at low wages for longer
hours. As regards raw materials, the industry was more a
consequence than a cause of the cropping pattern in the
State. The role of food processing industry in changing
cropping pattern has been nominal.
The only important linkage promoted by these industries
seems to be the consumption linkage which has its roots in
the relatively high incomes in the State. Besides this,
another very important backward linkage of these industries
has been the growth of units manufacturing processing
machinery, and the repair workshops within the State.
are units within the State which manufacture rubber
shellers, expe 1 1 ers, f i Iter presses, neutralizers,
There
roll
and
rotary mills. This lack of backward linkages has affected
the State's primary sector in the sense that it today faces
the problems of rural underemployment and unemployment, high
cost of cultivation and unviable holdings.
But, on the other hand, the forward linkages of these
industries have been very strong. The growth of rice and oil
mills has led to the emergence and growth of a number of
181

industries
industry,
and activities such as solvent extraction
ed i b leo i I refining industry, vanaspati industry,
feed industry, soap industry, and cattle feed and poultrY
activities like wholesale
transport, packaging, and
trading in rice, oil and oil cake,
brokers' business. Further, rice
husk has proved to be a cheap and easily available source of
energy for steaming purposes in
hosiery, dyestuff, etc.
industries like oil milling,
However, the secondary processing industries (baking)
seem to have played an important role in both ways - backward
as we I I as forward. Not only do they provide a market for
the output of primary processing industries like wheat
milling, but al so promote consumption linkage of the
agricultural sector in the State by way ot their output. For
example, baking industry prOvides commercial market for the
wheat flour produced by the t lour mil Is and the vanaspa t i
industry tor the oil produced by the 0 i 1 mills. But with
regard to employment, in this case a I so, the I oca I workforce
does not seem to have benefitted.
6.5 Conclusions
The above discussion on the Punjab experience reveals
that though agricultural growth is vital for non-farm income
and employment generation, it also suggests that it alone is
not a sufficient factor. There are a host of other factors

in the process of ageo-industrialisation which have a role
to play in the emergence and sustainability of the non-farm
sector. The question of market pul lis very crucial
whether non- farm activities should cater to local, national
or international markets, whether it should cater !o rural
or urban markets; and finally, whether it is necessary and
desirable to promote urbanisation to help non-farm sector?
The analysis of linkages of food processing industry
points to the lack of the appropriate type of links of this
sector in tune with the requirements of the I oca I economy.
No doubt these industries have led to the growth of many
other industries and activities but the backward linkages of
them in terms of labour. product and investment have been
quite low. The analysis points out the importance of
diversification of the crop sector in the growth of non-farm
sector. This is more so as far as processing sector of the
non-farm activity is concerned.
That the lack of development of non-farm sector has
wider implications is observed by Sethi (1991) as we I ! . He
remarks, ·Punjab has witnessed both a
commercialisation of agriculture and a decline
massive
in non-
agricultural activities in rural
usual Marxist hypothesis that
areas, thus falsifying the
with commercialisation of
agriculture, industries should be stimulated. No wonder,
I~

Punjab has decided to start agro-based
areas bypassing rural industrialisation.
industries in urban
The pol itical cos t
of this neglect so far can be seen in educated unemployed
rura I youth tak i ng up the gun- (p. 44). 5 L K3pur also seems
to agree that lack ot non-farm employment in Punjab has led
to growth of violence in rural P'Jnjab.·
The entrepreneurial aspects of these industries are
examined in the next chapter.
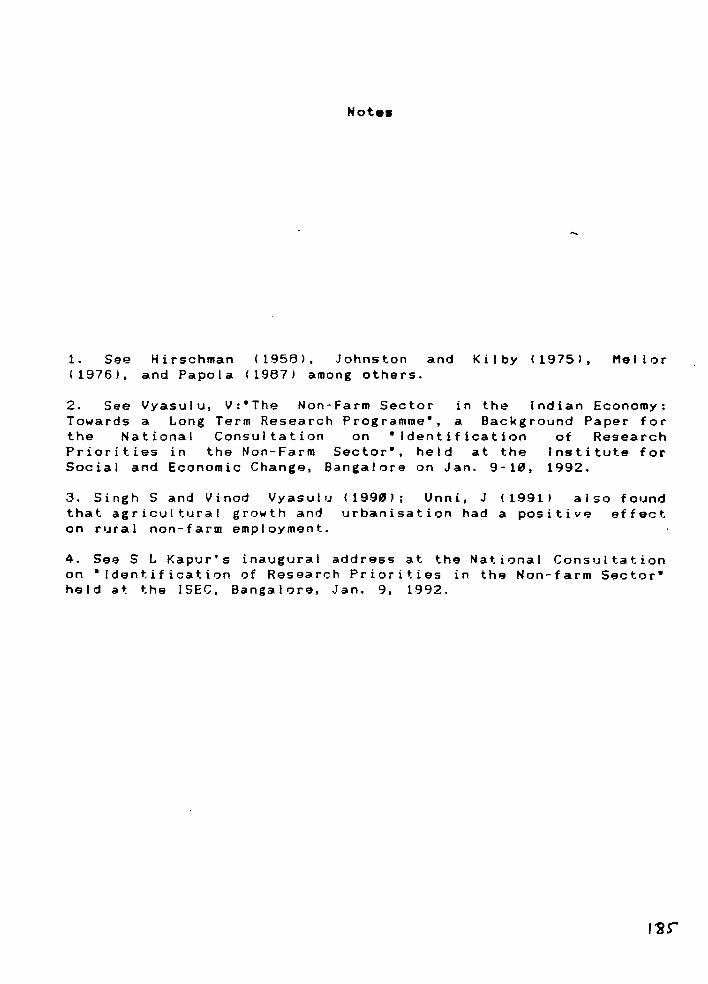
1. See (1976),
Not ••
Hirschman (1958), Johnston and and Papola (1987) among others.
Kilby 11975', Mel lor
2. See Vyasulu, V:"The Non-Farm Sector in the Indian Economy: Towards a Long Term Research Programme", a Background Paper for the National Consultation on "Identification of Research Priorities in the Non-Farm Sector", held at the Institute for Social and Economic Change, Bangalore on Jan. 9-10, 1992.
3. Singh Sand Vinod Vyasulu (1990'; Unni, J (19911 also found that agricultural growth and urbanisation had a positive effect on rural non-farm employment.
4. See S L Kapur's inaugural address at the National Consultation on "Identification of Research Priorities in the Non-farm Sector' held at the ISEC, Bangalore, Jan. 9, 1992.
Chapter 7
ENTREPRENEURSHIP IN FOOD PROCESSING INDUSTRIES IN PUNJAB
In this chapter. an attempt has been made to kook into
the background of entrepreneurs in food processing industry.
The aspects of caste. occupation and family background have
been studied with a view to test Ba~chi's hypothesis that
Indian entrepreneurial class is basically a trading class.
Also. the aspects of integration between agricul tural trade
and processing and the investment of agricultural surpluses
view of farmers' entry into this industry from the point of
into this industry have been dealt with.
7.1 Theoretical Background and Empirical Studies in India
Entrepreneurship or the ability to take calculated risk
in pursuit of profit has come to be recognised as one of the
most important factors in economic development after the
seminal contribution by Schumpeter (1911). According to him.
innovation in the fields of production Methods, markets and
organisation is the prime job of an entrepreneur. There have
since been var i 0')5 theories about the supply of
entrepreneurship in a society. Most of the theories seek to
explain entrepreneurial behaviour in terms of sociological
or psychological variables. These theories in tact try to
answer two major questions: (1) who are the people who
assume the role of entrepreneurs, and (2) who are the more
186

successful
t.heories of
entrepreneurs? A critical analysis of the
ent.repreneurship reveals that one or more of t.he
f a I low i ng factors are considered as crucial in explaining
the rise of entrepreneurship. They include: the ethical
value system, minority group morale, need for achievement
motivation.
commitment
exposure
of the
to new
pol i tical
ideas and opportunities,
system and the regional
industrial climate (Sharma. 1975). The major proponents of
these theoretical positions include Max
McClelland,
1971 ) .
Carroll and Frayer among others
Weber, Hagen,
( K i I by (ed),
Various studies have tended to focus their attention on
different factors in entrepreneurship. One of the dominant
themes in many Indian studies has been the caste background
of entrepreneurs. ~hereas some of them observed that trading
and money lending castes succeeded in entrepreneurship [Lamb
( 1955) , Hezlehurst (1966), Guha (197") and Mahadevan
(1978)], some others found that the entrepreneurs belonged
to ritually higher castes [Nafziger (1978)] and that castes
other than agricultural and trading
entrepreneurial [Pandit (1957)]. However,
Spodek (1969) and Sharma (198S) observed that
were al so
Berna (196S),
general I y all
non-entrepreneurial castes succeeded in entrepreneurship
with necessary education, capital and technical knowledge. I
187

On the other hand. some other studies focused on the
influence of family background in terms of size and type of
families, and their occupational and economic status. Singer
11972), McCrory Sha.rma (1975). Sharma and Singh
(1980) in this gen re, among others, found that the
entrepreneurs from business and industrial background
families did succeed in industry. Singer (1972), Morris
(1967) and Tripa.thi (197 U also repudiated Max Weber's
finding tha t the reI igions in India inhibited
entrepreneurship and contested that Hinduism in fact had an
-inner-worldly- aspect which promoted modern capitalism.
However, recently, Buss (1985) and Singer (1985) have
given a re-interpretation and revision or clarification of
their position on the ·Weber thesis-. They argue that many
of Weber's ideas may still be usefully disclJssed today. Buss
is of the view that Weber has been mistranslated and
misquoted in the Indian context. According to him, Max Weber
found many rational aspects in the ancient
civilization such as princely met:hods of warfare,
Indian
po lit: i cs
and finance. But India has not been able, according to
Weber, to develop, out of its own tradit:ion, a modlJrn western
rational capital ism. Weber asked in what manner the Indian
religious culture might be responsible. as one factor among
others, for the absence of an indigenous capital ist
development.
188
Singer (1985) also states - Sinc~ my Madras studies did
not intend to refute the ~eber thesis, or to confirm it. nor
to portray ~eber as an agent of capital ist progress Qr 3:5 3
prophet of capitalist doom. it is difficult to understand why
my study of the Madras industrial leaders has to be seen as
-the final step- in the gradual refutation of loIeber The
only critical question rais~d is whether t. h e IJ 5 IJ a I
interpretations of Weber's constructLon of an - Indian spirit-
as a major obstacle to the modernisation of I nd i a takes
sufficient account of the facts loIeber himself cites-(p. 1571.
However. Singer argues that though additional research is not.
needed to refute Max \Jebel' , more research is needed,
especially to assess the extent to which the selected Madras
industrialists are representative of industrialist.s in other
parts of the country and of Indians in other occupations such
as law, medicine, science, engineering and the I ike.
Buss (1985) is also of the view that even Singer did not
refute lJeber because Singer has not shown that the ethos of
his i n d IJ S t ria lis t ssp r i n g S d ire c t I y fro III the • (n d ian s p i r it·
as \Jebel' defined it; a hist.orically formed socio-cultural
phenomenon, meaning system, where castes related
intellectually and structurally to other major aspects of the
culture, especially the Karma doctrine. He argues tha t.
Singer has only shown that certain businessmen are adjusting.
189
ad3pting to a western style industrial economy, to a
capitalist system, or to the western world. Buss feels that
it would be possible to refute Weber only if one would show
that the absence of a capitalist spirit in traditional India
was purely incidental and not the Wadequate effect- ",of a
historical configuration which he called the -Indian spirit-
- or if it could be shown that Weber's concept of the ~ Indian
spiritW can be improved or should be changed, or f ina I I y, if
the use of the concept of an -Indian spirit- could be shown
to be inadequate for such stud ies (p. 135).
Another set of studies, which could be put under the
category of regional and cultural factors, observed that
while some necessary traits of good entrepreneurs were
generally found in al
traits varied from region
in their importance. These
Nandy (1973),
among others.
Koppel and
regions and cultures, some
to region and culture to culture
studies include Timberg (1969),
Peterson (1975) and Nabi (1988)
Another very important
entrepreneurship is the role of
aspect
government
relating
pol icies
to
and
programmes. In this context, whereas Guha (1970) and Sagchi
(1970) considered colonial rule in India as a hindrance to
entrepreneurship, Mishra (1966) and Rao and Sumithra (1965)
found that, in many cases, government policies and
198
programmes were helpful in promoting e"trepreneurship. (n a
:5 t I).j Y • B 3 I) mol 19'3~'. with the help of historic31
evidence from 3ncient Rome. e3rly Chin·3.3nd the mi,jdle 3ges
and E u r fj p e • a r g IJ e d • "How the entrepreneur acts at a given
time and place depends on the rules of the game - the relolar,j
s t r 1) c t 1) r e the economy that happl'Jn to prevail
Changes in ~he rules 3nd other attendant circl)mstances. <::an.
of course. modif:,r the composition
entrepreneurs and can also al ter its
of the class
size- (p. 894'.
of
This
once again emphasises the influence of political system,
government pol icies and industrial climate in making or
marring entrepreneurship. This has been emphasised in :~.
recent study by Rosenberg and Birdzell '19871 IoIho a Iso dwe I I
on the role of non-economic factors in the growth and
dl'Jvelopment of the West.
Bagchi (1972) also argues "The Indian entrepreneurial
groups which emerged after the first world war generally came
from trading castes or communities. Before the first world
war, many Indian doctors and lawyers had tried their hand at
industrial enterprise. Landlords were often associated in
these enterprises ... In the Punjab, Lala Harkishan Lal, an
Arora by caste and a lawyer by training. was the founder of
Bharat Insurance,
including cotton
Company Limited ...
and a
mi I Is
During
promoter of a host of companies
and the Lahore Electric Supply
and before the first world war
191
many Indian traders started match factories and glass
factories. Indeed. there was no shortag~ of
entrepreneurship among Indians if ·entrepreneurship· means
the wi II ingness to .~ommit capital for a risky industria!
enterprise. IJhat was lacking mas tl y was thP." proper
environment for investment in the industries chosen and
experience on the p~rt of the entrepreneurs with markets ~nd
the patient business of management· ~pp. 206-207).
He further argues, ·It was the creation of more
suitable environment for indlJstrial investment:. on however
restrici:f:"1Gf a scale, which induced Indian trading communities
to enter modern industry in a big way, first in the twenties
and in much more significant numbers in the thirties. The
case of the Chettiars can be cited to illustrate our point.
The Nattukottai Chettiars came from the districts of Ramnad
and the state of Pudukottai in Madras; they had a very
highly developed agency system tor money lending and tradlng
and were the chief banking and money lending community in
Madras. They were extremely important in the internal trade
and finance of the whole of South East Asia.
did not enter large scale industry in significant numbers
until protective tariffs had been imposed on the import of
cotton textiles and the grip of the Europeans on the economy
of Southern India had been loosened in other ways· (p. 207).
192

However, in other par ts of India, Bagchi points OIJt,
R (n the new business groups, which times
already had a smal 5 t a k e i n i n d IJ 5 try, erne r g e d in strength,
generally controlling large-sized firms or many firms at the
same time. Mos t of t hem be longed to the trading or banking
communities. (n Delhi, Lala Sri Ram, who made Delhi Cloth
and General Mil15 the nucleus of a large business group,
came from an OJ I d banking family. The Narangs, who
contro I I ed a I arge number of sugar mil Is, had been led by Dr
G C Narang, who had
casteR (p. 208).
a training in law and was a Vaishya by
Achaya ( 1990) in the context of oi I mi I Is in I nd i a,
Vaishya or observes, Rlt has always been a preserve of the
commun i ty, though, in later times, there was a trading
schism between those who crushed oi I, the low caste artisans
who traded and made money on the commodity by and those
acting as brokers R (pp. 152- 153). Bagchi (1972) further
opines that -the importance of pol itical factors in al lowing
the latent entrepreneurial potential of trading groups to
express itself in industrial investment is dramatically
ill ustrated
independence R
pol ic ies and
discouraging
by
( p.
the
436,
experience
footnote) .
of
The
the political leadership
entrepreneurship and
Pakistan since
role of economic
in promoting or
thus, growth and
193
development has been masterly documented by Sims ! 1988) in
agr icul bJra.1 the context of a comparative s tlJdy of
de vel 0 p men tin the two (F' a k i s tan ian din d ian) F' lJ n jab s .
-The private entrepreneurial base supporting this
development was rather smal I ... Throughout the country, smal I
businessmen had been busy since before the first world war in
the setting up of cotton gins and presses, rice and oi.l
mills, jute presses, open-pan processes of sugar manufacture
(Khandsaril, and sma I I power loom or handloom factories.
Some times, their efforts in the development of these
enterprises were assisted by joint- stock banks as rice
mills in
Madras.
the Guntur district were helped by the Bank of
More often, it was mainly local capital which
helped in the development of sma II scale i n d I.J S t r i e s -
(Bagchi. 1972, pp. 441-442). But these small capital ists did
not start an industrial revolution. They did not pioneer
any new methods of production or any new industries !Bagchi
1972, P 442).
Bagchi (1972) firmly concludes, -The emergence of new
entrepreneurial groups in India is far better understood if
w. connect them with trade and the opening up of
opportunities in particular fields and regions, than with
specific castes ..•
made production for
tariff protection for modern industries
the home market more profItable than
194
tr3.de, 3.~ least: upt» 3 point. Tn.;? ~gricultural depression,
with its severe e f f e·::; t s .J nth e for t: 'J n e S 0 f pea.5 ant s, m 3 .j e
m'Jney lending less 3ttractive than be f ,J r e: m 3. n :l .~ 3. pit a j i s t:. 5
f .J 'I n did I e in 'J n e :1 i nth e i r han .. j s ==tnd invested in industry.
f ~ i '3 t r ') e t h.3 t the m 0::> s t imp 0 r tan t. S r 0 .) P o fen t rep r e r. e 'J r s
the r1arW3f i'3 cl.~imed to belong to the Bania cast93, bu~.
is. "'ere really 0') ts ide
3ccepted framework of Hinduism. In Punjab 3nd Nor!:.n Ue3tern
India, in general. the entrepreneurs were mainly Aroras 3.nd
~(hatris who claimed Kshatriya (military caste) statlj~"
Finally. most of the g r G U ps which became prominent
industrialists in Pakistan after independence, came from the
(Mus! im) trading castes .. Uhat seems to be common to most of
the
with
440) •
entrepreneurial groups is
trade or construction
7.2 Entrepreneurship in Punjab
that they had been connected
before entering industry· (p.
Coming to the case of Punjab, we find that there have
been some studies on entrepreneurship among certa.in castes.
Ha::elhurst
iAggarwal
Pakistan
( 1966)
Banias
(Khatris
compared two
and Suds) wi th
and Aroras~.
native trading castes
two refugee castes from
He noted tha t
traders did much better than the refugees, since
the caste
they had
changing both willingness and ability to adjust to
conditions. Bhatia (1974) concluded from his study of 5"
195

firms in Punjab tha t; people from Vari01J'S cast.es and
occupations pa r tic i pa ted in manufacturing and 'Succeetjed i. n
it. C3pital and €'xperience in trading were found to be the
major reasons behind success.
Saberwal ( 1976) noted that: Ramgarhias. though
traditionally of a low social status in the caste hierarchy.
were appreciated for their innovative activities. and ·;ame
up as very successful entrepreneurs. He argued that: the
s t i mlJ I i which triggered formation of innovative
personalities included not only the withdrawal but also a
conditional conferment of status respect, which he termed as
·status dissonance-. Hundal (1977) stud i ed 5 ma I I scale
industrial entrepreneurs in Punjab and found that those who
succeed"3d in industry were people with a high level of
achievement motivation. Pandit (1978. 1985) arg1Jl:ts that th"3
key features of the industrialisation process in Punjab hav'?
been the availability of a cadre of industrial entrepreneurs
(mainly p"3rsons displaced by partition) with
experience in trade. b'Jsiness, or industry and
previous
the rapid
emergence of a large
The State government
displaced entrepreneurs
and disciplined skilled labour force.
played its role by providing t.hese
with factory sites. sheds, credit
and the like. In the agricultural sector also, these
displaced agricultural classes spearheaded thllJ Green
Revolution. which suggests the importance of migrants - or
196
remigrants in the C3se of Punjab- because their 3ncestors had
s~ttle the new canal colonies in Yest Pakistan 0nly
two dec 3 des be f .:1 reP 3 r tit i 0 [' in pioneering entrepreneurial
D'Souza ( 1982 I found on the basis of 1971 Census that
·The Hindu and the Sikh religions do not necessarily induce
any bias among their tollowers in t.he choice at their
occupations. I.Ihat rea I I y influences the choice of
occupations is the caste system which is prevalent among the
people belonging to both the religious categories. However',
for historical reasons, in the Punjab, the population of the
castes doing CUltivation is very much over-represented among
following non-agricul tur31 the Sikhs and that of the castes
occupations such as trade and services are over-represented
among the Hindus. Agricultural pursuits generally tie the
people to their land in the rurai areas, whereas the
non-agricultucal occupa t ions leave the i r incumbents
footloose. who are then relatively more free to move to ne",
places for employment. should the occasion arise. The Sikhs
who are preponderate among the cultivators are theretor-e
more likely to
other hand. the
cling to their rural surroundings and on the
Hindus whe are Qver-represented among those
who pursue occupations which have an urban bias are mor-e
likely to migrate to the urban areas· (p. 787 I.
197
• I t therefore reasonable to maintain that the
differenti31 distribution of the population of the Hindus and
t. h e S i k h sin the r u r a I and the 1.1 r ban are a 5 is", a i n I y d I Jet: oJ
the fact t, h :;I t. the e c .J nom icc 0 n d i T: ion s are c h 3 ., n e I I P. d t. h r 0 ugh
system-. D'SoIJza.1982. p. 792). ~
further cone lu,;es. • The two m3j'"Jr sectors of the economy
which have grown en 0 r m 0 IJ sly in the recent years
agriculture 3nd trade. ijominant cast.es3mong
Hindus. by and large are entrenched in t.he latt.er and those
among the Sikhs. in the former. The trading castes among
the Sikhs generally lower scale as compared
with the Hindu traders. On the 0 the r han d • a g ric IJ I t IJ r e and
trade are very much I inked with each other. This link has
become a I I t.he stronger
agr ielJI t.ure. as a result.
wi t.h t.he
of which most.
modernisat.ion
oft h e i n p IJ t S
of
and
outputs of
through the
agriculturists in the rural areas have t.o pass
t. radel'S in the IJ r ban are as. Such a situation
does resul t in a clash of economic interest.s between the
dominant castes of the t. w 0 reI i g i 0 IJ S cat ego r i e s • (p • 7 92 ) •
7.3 Entrepreneurship in Food Processing in
of Primary Data
Punjab: Analysis
In this analysis of entrepreneurial background of
owners of tood processing units (primary and secondary) an
attempt has been made to explore the occupational and caste
background of the entrepreneurs. The main questions
198

addressed in thi.3 section are: Who are the Qwnto?r'3 of these
..... 'i OJ n 1 '. S , Do :;Iny p::d.t<:!rn3 >?merge wit h r >?3 P8':; t to their
ba.:;kgro .Jnd. .::; 3 S t >? and/or occupa t. ion:; ) Does ~he hypot.h>?s i 3
by Bag .::; hit h 3 t b 3.3 i c a I I yIn d ian I n oj 'J:; t: ria I .::; 13.3 S i'3
originating f r,:>m the tr.3ding (Bania) community hold tru>? ?
Besides. be>?n t.h>:? entrepreneurial .::; a pa b iii t yin
terms of diversification of product lines and manufacturing
3.-;ti,,·itie·3
In rice milling, though the immediate owners of units
were predominantly persons with a background in occupat:ions
I ike agro- industry itself. commission agency and toodgrains
trade, land agriculture to a certain extent, the patterns of
their fathers' occupations revealed that the units had been
set up by ~ommission agents predominantly (60 pe r cen t: ) • s
the next major r::ategory being those whose fath~Hs had
a g ric IJ 1 t 'J r e .3 s 1: he i r m a i nor:: r:: 'J pat ion (T a b I e s 7. 1 and 7.2) •
At the district: I eve I. wher>?3s there was total
dominanr::e of commission agents and agriculturists in rice
mil ling in LI.Jdh i ana. there were people from government
service and merchant comm')n it i es in Bathinda. setting 'Jp
rice mills (Tabl.;!s 7. 1 and 7.2) . 5 i nce,
and foodgrain trade business is largely in t he hands of the
Bania community in Punjab, more than 65 per cent of the rice
199
mil Is wer9 run by this Hindu community m9mb9rs ITabl9 7.31
In t9rms of caste background also, the ban i a caste came to
be synonymous with oc.:::upation and r91igion since
I) 0 pe r c e n t 0 f the units in both the districts were those
belonging to Banias ITable 7.3).' The trading backgro..und was
also reflect9d in the decisions of entr9pren9urs to 9nter
this indlJstry. Mos t of
lust for
them had entered into rice millins
due to their more profits and the pre-e)(ist.ing
experience in industry and related trade ITable 7.4).
7.31 Evidence of Integration
A Majority of the rice mill owners stil had links with
agricultural trade in the sense that they themselves were
simultaneously involved in agricul tural products or
foodgrain trade or their family concern andlor partners were
in that trade (Table 7.5). The more common types of
integrated business were cotton ginning and oi I mil Is,
wholesale foodgrain trade, and godowns and another rice
mil I. a I I d i r ec t I y related to
activity'
departure
(Table 7.6/. But
from this pattern in
integrated business was steel
pump in the other.
food processing the main
in Ludhiana. there was a
only two cases where the
mill in one case and petrol
200
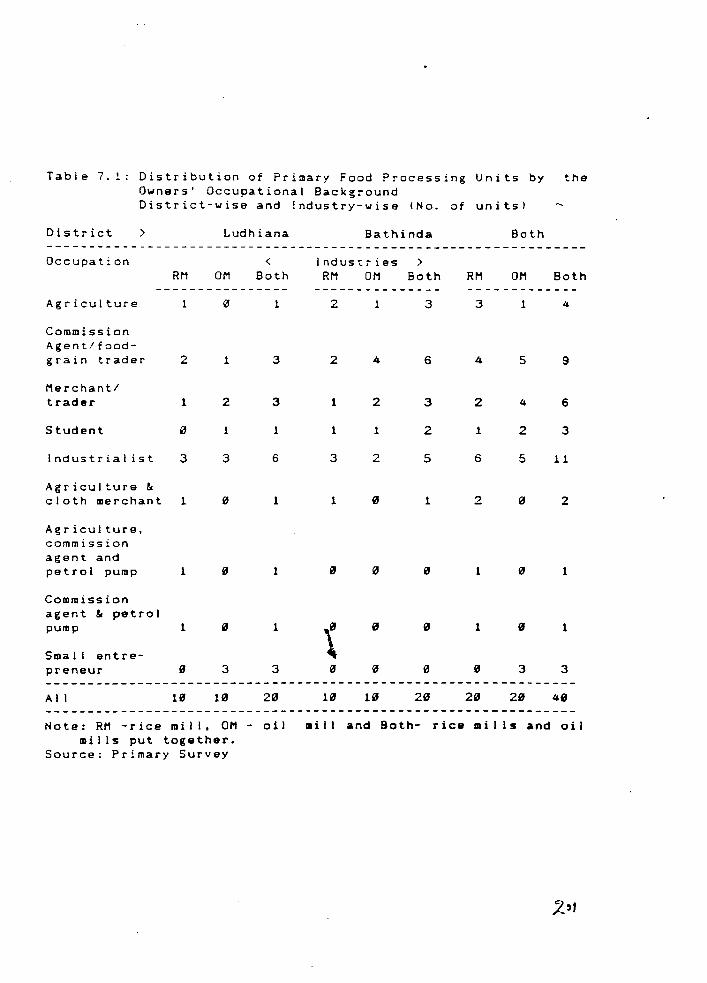
Table 7.1: Distribution of Primary Food Processing Units by the Owners' Occupational Background District-wise and Industry-wise (No. of units)
District >
Occupation
Agriculture
Commission Agent! foodgrain trader
Merchant/ trader
Student
Industrial ist
RM
1
2
1
3
Agriculture t,.
cloth merchant 1
Agriculture, commission agent and petrol pump
Commission agent &. petrol pump
Small entrepreneur
All
1
1
Ludhiana
OM
1
2
1
3
3
10
< Both
1
3
3
1
6
1
1
1
3
Note: RM -rice mill, OM - oil mills put together.
Source: Primary Survey
Bathinda Both
Indus1:ries > RM OM Both RM OM Both
2 1 3 3 1 4
2 4 6 4 5 9
1 2 3 2 4 6
1 1 2 1 2 3
3 2 5 6 5 11
1 1 2 2
o 1 1
o o 1 o 1
o o 3 3
10 UJ 20 20 20 40
mill and Both- rice mil Is and oil
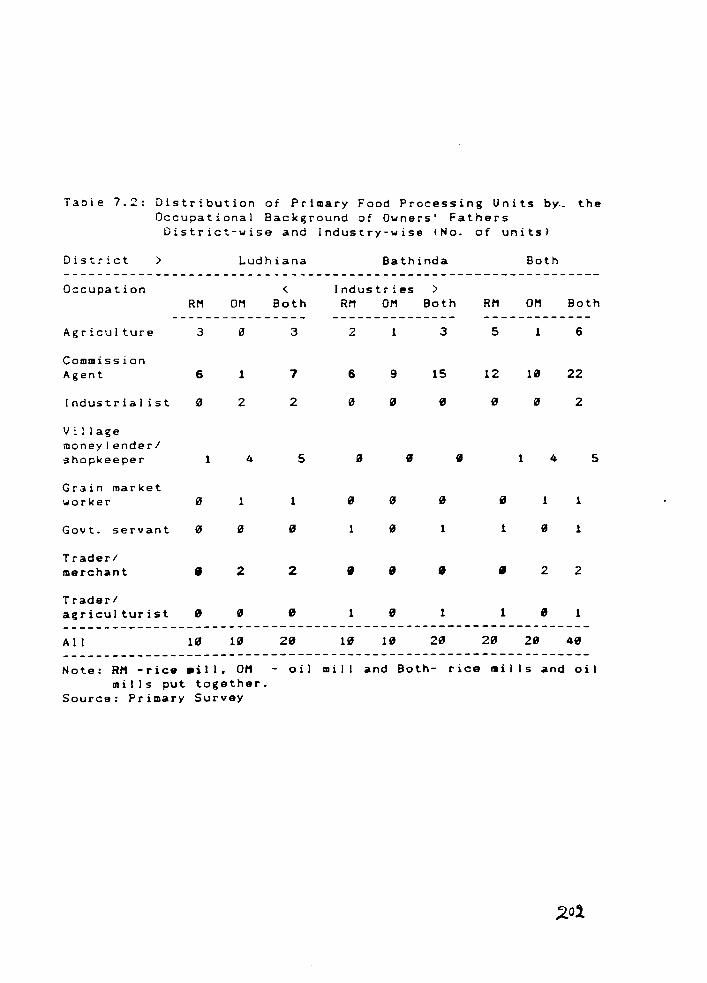
Table 7.2: Distribution of Primary Food Processing Units by~ the Occupational Background of Owners' Fathers District-wise and Industry-wise (No. of units)
District > l.udhiana Bathinda Both
Occupation Industries > RM OM
< Both RM OM Both RM OM Both
Agriculture
Commission Agent
Industrial ist
Village moneylenderl shopkeeper
Grain market worker
Govt. servant
Trader/ merchant
Trader/ agriculturist
3
6 1
2
1
1
" 8 2
o "
3 2
7 6
2
4 5
1 " o 1
2 8
o 1
1 3 5 1 6
9 15 12 22
" " 2
1 4
" " 1 1
1 1 8 1
2 2
" 1 1 " 1
---------------------------------------------------------------All 10 20 18 1" 20 28 4" ---------------------------------------------------------------
5
Note: R" -rice .ill. 0" - oil mill and Both- rice lIIil Is and oil mills put together.
Source: Primary Survey
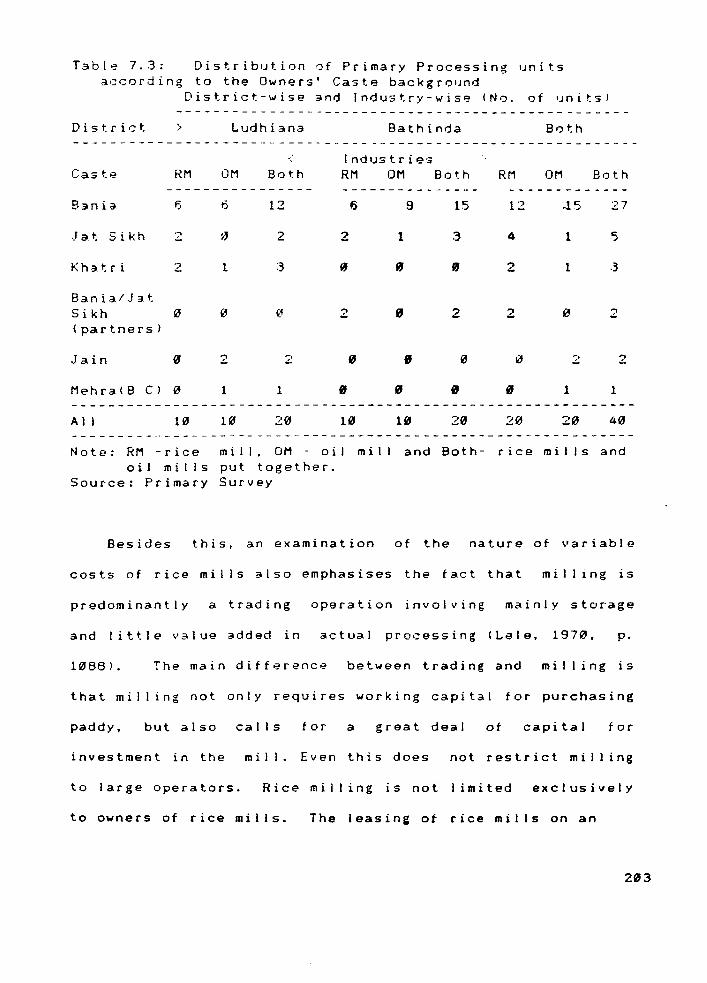
Table 7.3: Distribution of Primary Processing units according to the Owners' Caste background
District-wise and Industry-wise (No. of units)
District > Ludhiana Bathinda Both
, IndlJstries Caste RM OM Both RM OM Both RM OM Both
---------------- --------------- -------------
Bani3 I) 6 12 6 9 15 12 ..15 27
.J a.t Sikh 2 '" 2 2 1 3 4 1 5
Kh3.tri 2 1 ., 0 0 0 2 1 .3
Bania/.Jat Sikh 0 it1 2 2 2 0 2 (partners)
Jain 0 2 ~. 0 , 0 '" 2 2 .:..
Mehra(B C) 0 1 1 , 0 , iJ 1 1
All 10 20 10 10 20 20 20 40
Note: RM -rice mill. OM - oil mill and Both- rice mills and oil mills put together.
Source: Primary Survey
Besides this, an examination of the nature of variable
costs of rice mills also emphasises the tact that milling is
predominantly a trading operation involving mainly storage
and little value added in actual processing (Lele, 1970. p.
1088) . The main difference between trading and mi II ing is
that mill ing not only requires working capital tor purchasing
paddy. but also calls t or a great deal of capital tor
investment in the mi I I. Even th is does not restrict mi II ing
to large operators. Rice milling is not limited exclusively
to owners of rice mills. The leasing of rice mil Is on an
203
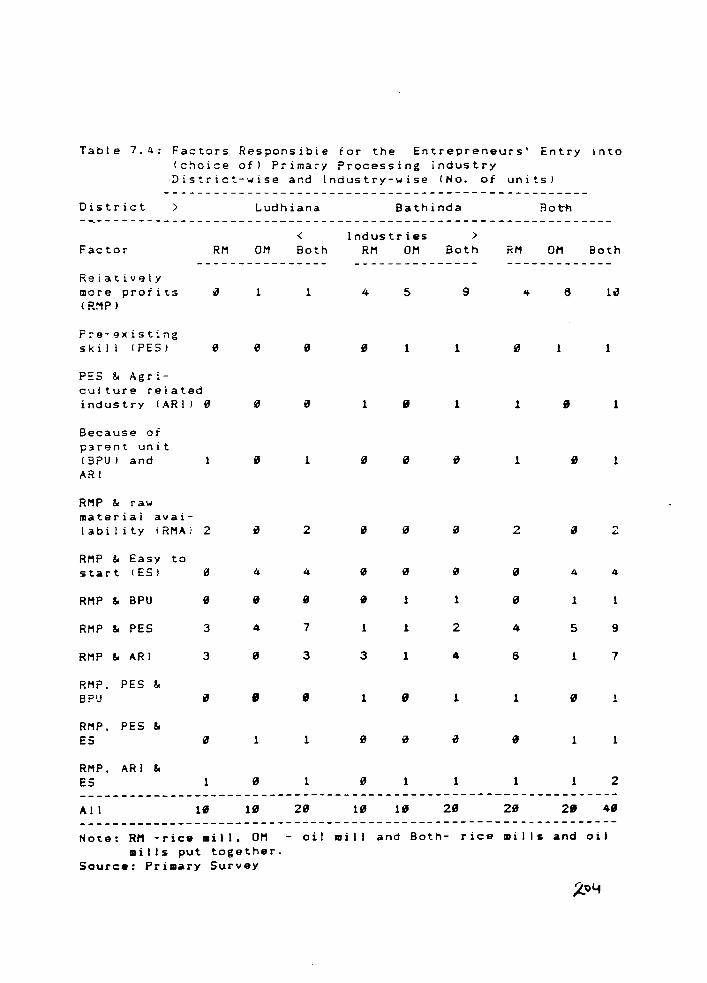
Table 7.4: Factors Responsible for the Entrepreneurs' Entry into (choice of) Primary Processing industry District-wise and Industry-wise (No. of units)
District >
Factor
Reiatively more profits (R!'1P)
P:-e-existing skill (PES)
PES!. Agriculture related industry (ARI) "
Because of parent unit (BPU) and ARI
RMP !. raw ma t e ria I a va i -lability iRMA) 2
RMP !.. Easy to start (ES) "
RMP So BPU
RMP So PES
RMP So ARI
RMP. PES !. B?U
RMP. PES So ES
RI1P, ARI Sr ES
" 3
3
1
RM
"
Ludhiana
OM
1
o
4
" o
" 1
o
< Both
1
"
" 1
2
4
" 7
3
, 1
1
Bathinda
Industries > RM OM Both RM OM
'+ 5 9
1 1
1 1 1
" 1
2
" 1 1
1 1 2 '+
3 1 • 6
1 1 1
" 1 1 1
Both
6
1
1
1
2
4
1
5 9
1 1
" 1
1 1
1 2 -----------------------------------------------------------------All 1" 20 1" 1" 20 28 4" -----------------------------------------------------------------Note: RM -rice .ill. 011 - oil mill and Both- rice mills and oil
aills put together. Source: Primary Survey

common phenomenon among paddy
commission agents.·
Table 7 . 5: E n t rep r en e u r s' Lin k s wit hAg ric IJ I t u r a I T r ad eat Present District-wise and Industry-wise (No. of units)
District > Ludhiana Bathinda Both
" Industries > Link RM OM Both RM OM Both RM OM Both
---------------- --------------- - - - - - - - - - - - - -Yes 8 2 10 6 7 13 14 9 23
No 2 8 10 4 .3 7 6 11 17
A II 10 10 10 10 20 20
Note: RM -rice mill. OM - oil mill and Both- rice mills and oil mills put tog03ther.
Source: Primary Survey
7.32 Agricultural Surplus and Food Processing
The investible agricultural surplus has been an issue
of serious discussion after the Green Revolution, in the
1970's and the early 1980's. But there has been no study of
how much surplus is available with the farmers and how and in
which direction it has been utilised in regions like Punjab.
Lele (1970) found that although there was a preponderance of
certain trading communities in the grain trade in some parts
of India. this phenomenon was by no means very widespread.
205
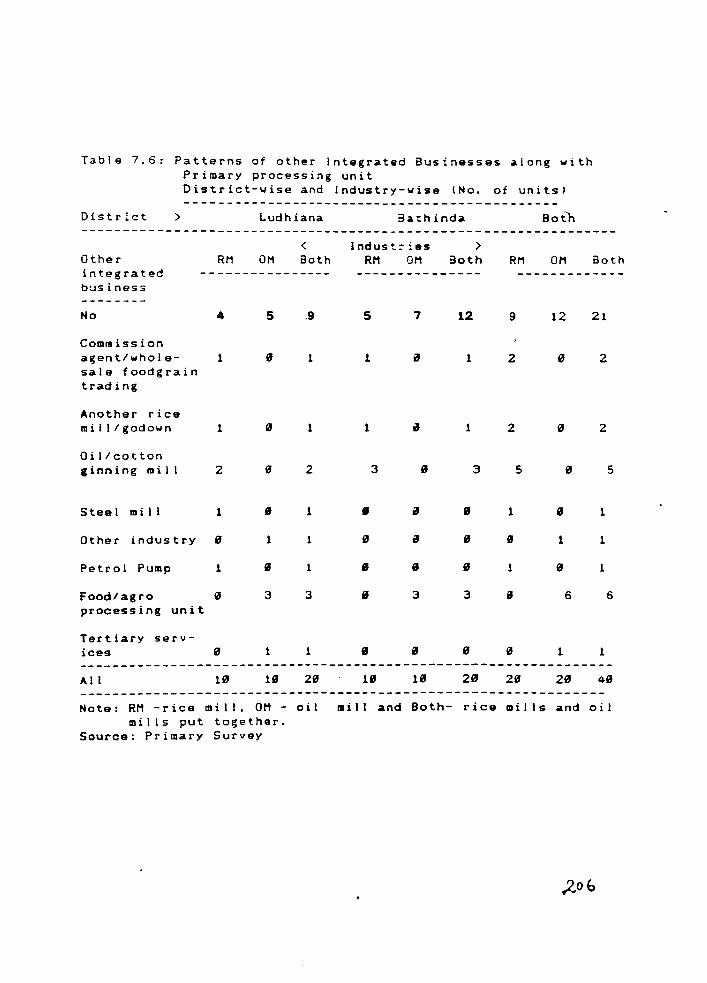
Table 7.6: Patterns of other Integrated Businesses along with Primary processing unit
District
Other integrated business
>
District-wise and Industry-wise (No. of units)
RM
Ludhiana
OM < Both
Indust:-ies > RM OM 30th RM OM Both
No 5 .9 5 7 12 9 12 21
Commission agent/whole- 1 sale foodgrain trading
Another rice mill/godown
Oi IIcotton ginning mi I I
1
2
Steel mi II 1
Other industry "
Petrol Pump 1
Food/agro " processing unit
Tertiary services
1
3
1
1 1 iJ
1 1
2 3
1 • 1 iJ
1 " 3 3
1
1 2 2
1 2 " 2
3 5 o 5
o 1 " 1
o 1 1
1 1
3 " 6 6
o 1 1
----------------------------------------------------------------A I I 10 10 2" 10 20 20 20 40
---------------------------------------------------------------Note: RM -rice mill. OM - oil mill and Both- rice mil Is and oil
mills put together. Source: Primary Survey
Tho ugh t h 8 h i g h (; a. s t 8 S had t r ad i t ion a I I y I 00 ked IJ po n t r ad 13 3 S
a menial a(;tivity, this did not discourage the entry of other
non-trading (;ommuniti8s into trade. LeI e 0 b s 8 r v e s • A I tho IJ g h
Marwaris and local Banias dominate the markets in ~unjab,
J a ts who are predominantly a community o f c IJ I t i vat 0 r S , are
obS8rV8d to hav8 entered trada" (p.76,77).
I n this context, the present effort looks at the dent
th8 farming (;ommunity has made in the food processing
industry, which is supposed to be agriculture related and
easy to start. The survey rl3vealed that ther8 were units
owned by farm8rs both i ndependen t I y wall as in
partnership with oth8rs. In thr88 out of 2~ cases survl3yed,
the o(;cupation of the owner remain8d to b8
though, 5 of th8 total mil Is had a g r i (; IJ I t IJ r e as
profession of th8 ownl3r's fath8r, and only 2 of th8m wer8
owned by Jat Sikhs independently and another 2 in partnership
with Banias. B IJ tin a I I the f 0 U rca s e s • t h 8 so IJ r ceo f f IJnds
was agricultur8 whi(;h points to th8 existence and
mobilisation of agricultural surpluses. Besides, in another
3 mills, the funds were part I y from agriculture since they
were partnership firms of Banias and Jat Sikhs (Table 7.71.
207

T3bl~ 7.7: SourG~s of Initial Capital Funds in PrimarY ProGessing Industries District-wise and Industry-wise (No. of unitS)
-------------------------------------------- --_._---District > Ludhiana Bathinda Both
--------------------------------------------------- --_. ---< Industries ..
RM OM Both RM OM Both RM OM Bot.h
-------------A g riG I) I t. I) r ., 2 0 2 2 1 3 4 ~ 1 5
N':)I"-agri-~I.J I ture ~ 10 17 6 9 15 13 19 I
Both 1 " 1 2 0 2 3 0 3
A I I H' 10 20 10 10 20 20 40
Note: RM -rice mill, OM - oil oil mills put together.
mill and Both- rice mil Is and
Source: Primary Survey
Why is the farming community not coming forward to
invest in industry, especially in agro and food proce:sing?
This is an important question since as agr icul tl.Jral
development takes place in an agrarian economy, farmers are
supposed to become more industrial in their 3pproach 3nd
accumulate surpluses out of farming business and are thus
expected to invest in activities away from farming where
value added is higher. There are instances of this kind of
phenomenon in States like Andhra Pradesh where tarmer
capitalists have become industrialists over time in the
a g ric I.J I 1:1.J r a I I y d eve lop e d reg ion 5 0 f the s tat. e'. In P'Jn jab
al so, farmers hav., extensively invested in the trans por t
sec tor. This comes out clearly from a study of large
288

farmers· in Punjab where about H3 per cent of them had
invested in non-farm assets like transport, shops, rice-
shell ing, 01 I-expel I ing and foundry works IHansra and Shukla
leds), 1991). But: what about farmers' entry into an industry
like primary food processing as this is directly dependent
on agricultural produc t i on and is alien to them.
Besides, they are easy to start
not
and are related to
agriculture in more than one wa}'.
The Green Revolution in India seems to have led to what
Daniel Thorner cal led ·Cowdung Capital ism-, wherein gentlemen
farmers are operating in an intermediate zone of agriculture
and industry lagro-processing?). They are eager to venture
into the field of industrial ca.pitalism. But the entry point
to industry a small firm is uninviting due to low
prof its, and the future prospects are dim as the profit rate
is quite volatile over time in the presence of the
competition
companies.
from the medium, large and multinational
Thus, though a lot of money has come into the
hands of the rural rich benefitting from the Green
Revol ution, they are sti II in search of investment outlets.
Often frustrated in this pursu it, it takes the shape of
consumer durables, or gets reflected into usually high stock
of inventories. ,. Bha II a ( 1981 ) also points out the
predominance of a peasan t culture which lacks industrial
entrepreneurship, the slow transfer of agricultural surpluses
2"9
to the industry. and the relative shyness of merchant capital
which is restricted to trade only. as the main constraints to
the industrial development in PIJnjab (pp. 29-311.
The survey data which was in terms of the opinions of
food processing units' owners revealed that lack of risk
taking capacity. lack of adequate knowledge about indust.ry
and trade and lack of funds with most of the farmers,
together emerged as very
their endeavour to enter
strong factors hindering farmers in
primary food processing industries
in the state (Table 7.8).
What emerged from the discussions with many owners was
that the farmers - who are predominantly Jat Sikhs by caste -
are not used to doing -the sitting job- which characterizes
trade and industry. Even the lack of diversification in
agriculture is a pointer to this. Despite th is. some
farmers have entered food- grains trade and agro-industry in
agriculturally highly developed regions
have given a good performance in such
points to the hidden (passive) potential
onal community, because they are the people
ike Ludhiana and
activities which
in this occupati-
who were known
for their enterprise in a.griculture. especially during the
Green Revolution period. Kumar also argues that the farmers
of Punjab are not well versed in the market mechanisD1; and
they do not have access to high technology or even to a
210

competitive kind of technology (Rangnekar and Malhotra, 1990,
pp. 27-28).
7.4 Entrepreneurship in Oil Mills
Similarly. in the oil milling industry, the owners
predominantly belonged to trading and merchant occupations.
Though the Commission Agent as an occupational category was
an uncharacteristic feature. especially in Ludhiana, in the
case of owner's occupation, it was very characteristic when
it came to the occupation of the fathers of the owners of
oil mills. But here again. the predominance emerged only in
Bathinda district where a I I the mi I Is owned by
non-agriculturist castes. were those with the owners' father
being a commission agent." On the other hand. in Ludhiana,
ownership of oi I mi lis originated from many walks of
like trade. industry, shopkeaping. moneylending and
the
life
smal I enterprising. both in terms of owners' previous
occupations
7.2) •
and their fathers' occupation (Tables 7.1 and
211
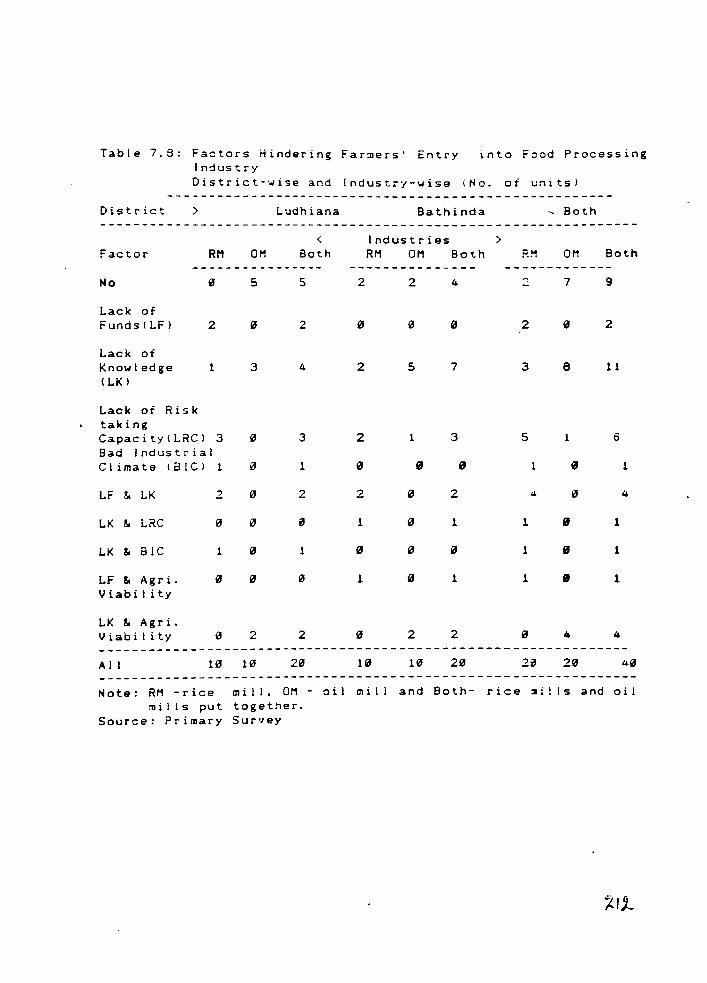
Table 7.8: Factors Hindering Farmers' Entry into F~od Processing Industry District-wise and Industry-wise (No. of units)
District
Factor
No
Lack of Funds(LF)
Lack of Knowledge (LK)
)
RM
2
1
Lack of Risk taking Capacity(LRC) 3 Bad Industrial Climate (BIC) 1
LF p,. LK
LK p,. LRC
LK &. SIC
LF &. Agr i. Viabil ity
LK &. Agr i. Viability
2
1
o
OM
5
3
" 2
Ludhiana
< Both
5
2
4
3
1
2
1
2
Bathinda - Both
Industries ) RM OM Both OM
2 2 4 7
" 2
2 5 7 3 8
2 1 3 5 1
2 " 2
1 " 1 1
" " 1
1 1 1
2 2 "
Both
9
2
11
6
1
4
1
1
1
4
---------------------------------------------------------------All 10 H~ 10 20 20 ----------------------------------------------------------------Note: RM -rice mill. OM - oil mill and Both- rice :JIills and oil
mills put together. Source: Primary Survey

Caste-wise also, whereas at I the oil mills (except: on"!
which belonged to a farmqr - Jat. Sikh) in Bathinda belonged
to Banias la trading castel, in Ludhiana though Banias again
dominated the scene but. there were also .Jain, refuge"! and
backward ~aste entrepreneurs (Table 7 . .31. Jains are again a
to Banias- for at I trading caste, and can thus be equatefj
practical purposes. On the other hand, the participation by
CJ. e n t. rep r e n e IJ r i n 0 i I mil lin g
again point.s to t~e diversificat.ion in entrepreneurial
origins in a. relatively indust.rial ised district..
in all the cases, 'ilxcept one, the initial capit.al came tram
SOIJrces and, s til I about half of the non-agricultural
entrepreneurs had inks with agricultlJral trade and, given
the background of entrepreneurs, it was more so in Bathinda
district. t.han LIJdh iana (Tables 7.7 and 7.51. But, in t.erms
of the oil mills owners having other integrated businesses,
Ludhiana fared better than Bat.hinda, though the predominant
int.egrated activit.ies were food and allied food
units in Ludhiana and agro-processing units in
processing
Bathinda
(Table 7.61.
Given the background of entrepreneurs. what prompted
them to enter oil milling ? In Bat.hinda. the relatively
backward district. it was mainly relatively .ore profits in
this
with
industry in half of the cases.
certain other factors
and profit motive added
like agriculture-related
213

i nd IJS try, pre-e><isting 5 k i I I and the unit'S
encouragement, in the other half of the cases. On the oth"H
hand, in Ludhiana, the profit motive, per se, was not th~
predomin3nt factor blJt. more as a factor allied with
pre-e><isting skil I and easy to start nature of
CTable 7.4).
the industrY
7.5 Summing Up
Put together. these primary processing industries in
Punjab are mainly in the hands of the Bania community. who
traditionally have been traders and merchants, mainlY
largely commission agents in food grains and are still
lin ked wit h .~ g ric IJ I t. IJ r a I t r .3 d e i nth eSt.3 t: e. I 1 BIJ t s t: i I I ,
there has been a smal I presence of Jat Sikhs in this sector
in pas t: who by their
background are large farmers and have entered this industry
by investing the sur p I IJ S e s earned as a reSIJ It: of Green
Revolution in Punjab agriculture in the 1973s.
Though most of the primary processors are basically
commission agents and traders, over time there has emerged a
class of agro industrialists who are owning ·Small
of agro-industries and agro-business in the sense that they
own 0 i I mills, cotton ginning mi II s, other food processing
and agro- processing units, godowns, and foodgrains trade,
along with their main primary processing industry. The most
214

predominant: factor in their entering food processing (oil
and rice milling) was relativ~ly higher profit in these
activities, of course, ~oupled with pre-existing skill in
the foodgr3in tr3de and the easy to start and agro-related
nature of these industries ( Tables 7.1 tQ 7.7).
The pattern of emergence of the primary processing
industries by the occupational background of owners shows
tha. t; before mid 1.97~s, i t: was the trading and
manufacturing community which entered food processing. But
during the second
agents entered this
half of 1970s and the 1980s, commission
i n d us try ina big way, tho IJ g h the trend
of entry of traders and manufacturers continued
simultaneously. Another interesting phenomenon of the 19809
was the entry of agric'JI turists intI) food processin~
industry ITable 7.9). In terms of their community (ca.s te
background), before the 1980s, the industry was totally in
the hands of the Hindu and the Jain Bania:;. But dlJr ing
1980s, other occupational castes like Jat Sikhs and Khatris
made their entry, tho'Jgh the Banias were sti II predominant
(Table 7.U".
7.6 Occupational Mobility
The analysis of the occupations of owners with respect
to their fathers' occupations revealed some interesting
aspects of occupational mobility. Though there was no
mobility among the agricultural and commission agents
215
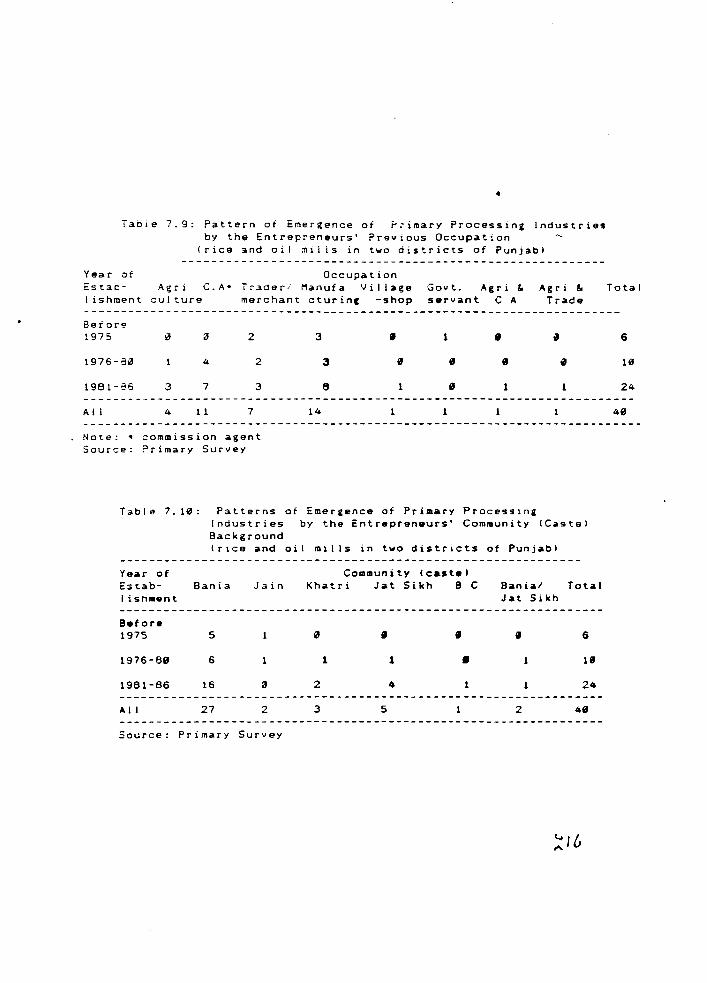
•
Tabie 7.9: Pattern of Emergence of P~imary Processing Industries by the Entrepreneurs' Previous Occupation
(rica and oil :nilis in two districts of Punjab'
Year af Occupation Est.ab- Agri C.A- Trader, Manufa Village lishment culture merchant cturing -shop
Before t975
t976-3.a
1981-36
All
1
3
4
2
4 2
7 3
11 7
Note: • commission agent Source: Primary Survey
3
3 " e 1
14 1
Govt. "gri ~
servant C"
1
" " "
1
"gri ST.ada
1
Tabl e 7. Ul: Patterns of Emergence of Primary Processing Industries by the Entrepreneurs' Community (Casta' Background (rice and oil mills in two districts of Punjab'
Year of Estab- Bania I isn .. ent
B.fore 1975
1976-8"
1981-86
" I I
5
6
16
27
Jain
2
Source: Primary Survey
Community (castel Khatri JOlt Sikh B C Banial Total
JOlt Sikh
" " 6
1 1 • 18
2 • 1 2"
3 5 1 2 ""
~/6 A
Total
6
10
24
4"
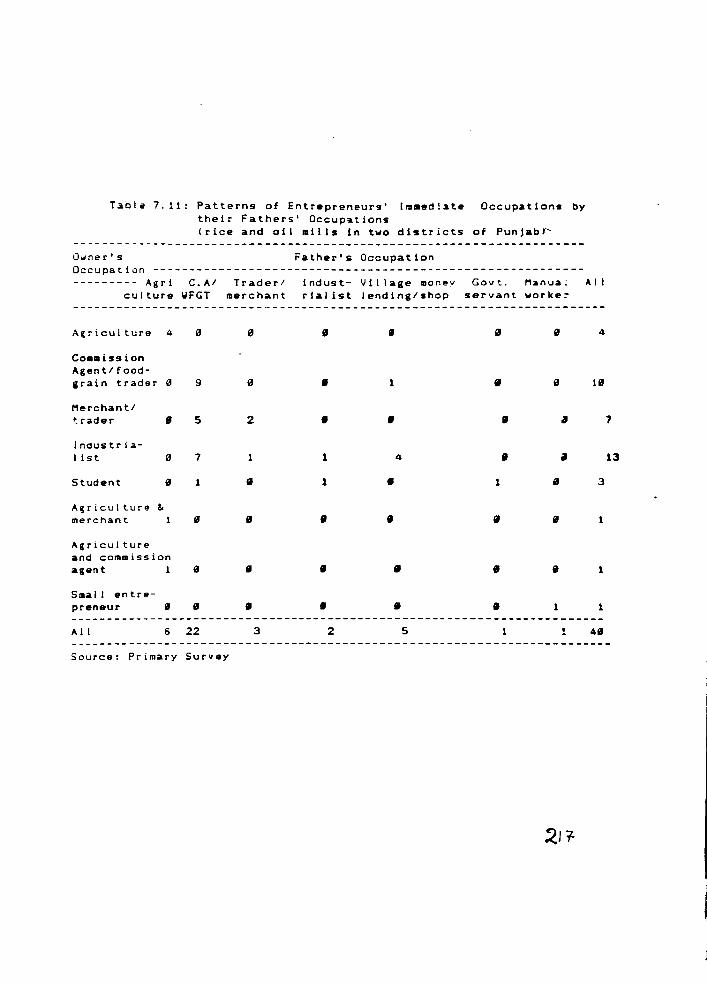
Taolt! 7.11: Patterns of Entrepreneurs' Immediate Occupations by their Fathers' Occup~tions
(rice and oil m1lls in two districts of PunjabI'"
Owner's Father's Occupation
Occupation ------------------------------------------------------------------- Agr! C.AI Traderl indust- Village !Donev Govt. Manua; All
culture ~FGT merchant rialist lending/shop servant worke~
Altriculture 4
Co •• ission Agent/foodgrain trader"
Merchantl trader
Industrialist
Student
A~ricul ture S. merchant
"
" 9
"gricul ture and cOIDmission agent 1
Small entrepreneur
" 9
5
7
1
,
" ,
"I I 6 22
Source: Primary Survey
,
9 • 2 • 1 1
1
, ,
• (I •
3 2
, , 4
1 " 9 19
• • , 4 •
• 1 3
• (I , 1
(I • " 1
• (I 1 1
5
7
13

occupations, there was a very clear evidence of the sons of
commission agents, foodgrains traders, village money-lender5
and shopkeepers becoming industrial ists. This points to the
trading background of Indian i n d IJ S t ria l entrepreneurs.
(Table 7.11).
Further, there was a clear-cut division of occupations
with respect to caste. Uhereas al l the commission agents,
manufacturers and traders/merchants were Banias (Hindus and
Jainsl by caste, all the agriculturalists were Jat Sikhs by
caste background. Similarly, Khatris were confined to trade
and manufacturing as their caste-occupation (Table 7.121.
7.7 Entrepreneurial Background of Baking Units in the Smal)
Scale and the Unorganised Sectors in Punjab
In the sma I I scale sector of baking industry where
there were units making bread, biscuits and other
items, there were quite large variations in size
bakery
of the
units within the sector. Though, there were mechanised bread
factories with investment of Rs. 10 lakh or more, there were
very smal I sized bakeries as well. In this sector in
Ludhiana, the baking units were independent in their origins
from the trading and merchant background. Most of them were
run by those who were earlier bakery employees or owners,
government employees, refugees from Pakistan, and petty
shopkeepers by their occupational background.
216
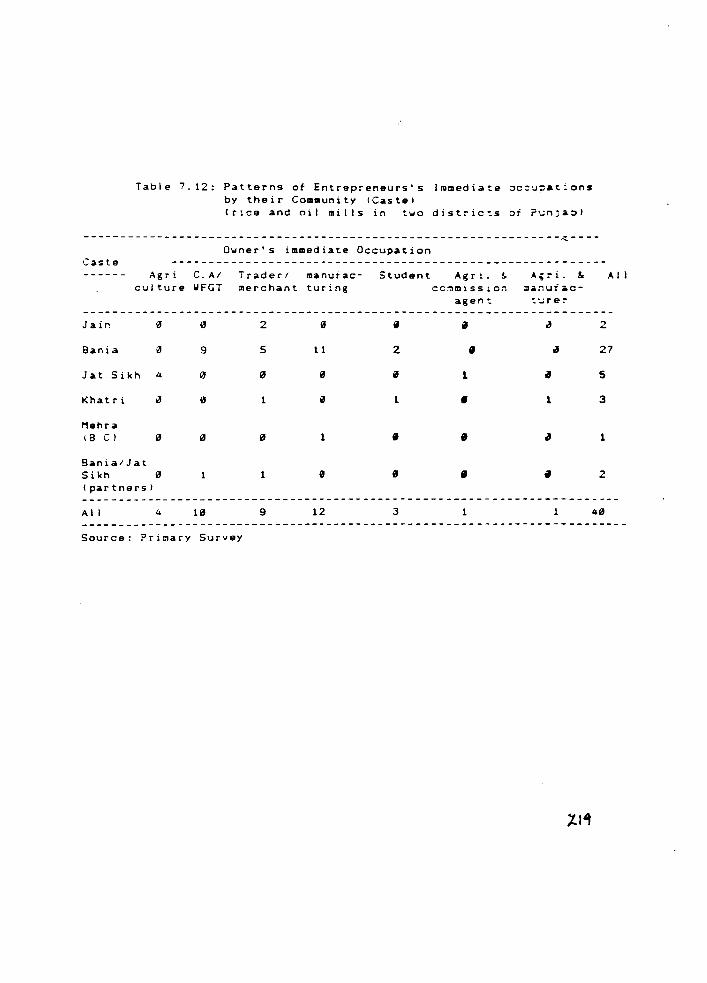
Table 7.12: Patterns of Entrepreneurs's Immediate ~CCu:l~t~ons by their Com.unity (C~ste)
(rice and oil mills in two distric-:.s ~i' ?o..:nj .. o)
------------------------------------------------------ ----------~----
Caste ------ Agri C.AI
culture 1JFGT
J a ir. " " Bania " 9
J at Sikh 4 " Khatri " " l1ehra (8 C) " Bania/Jat Sikh " (partners)
Owner's immediate Occup~tion
Tradert m~nuiac
merchant turing
2 " 5 11
" " 1 " 0 1
"
5 t ud e n tAg r i. !. cCr:lmiSS10n
agen-:.
" e
2 • " 1
1 • e • , •
A~:-i. &. ::Ia:-:ui .. c
,:o..:re~
~
tIJ
• 1
~
•
All
2
27
5
3
1
2
------------------------------------------------------------------------All 4 10 9 12 3 1 1 40
Source: Primary Survey
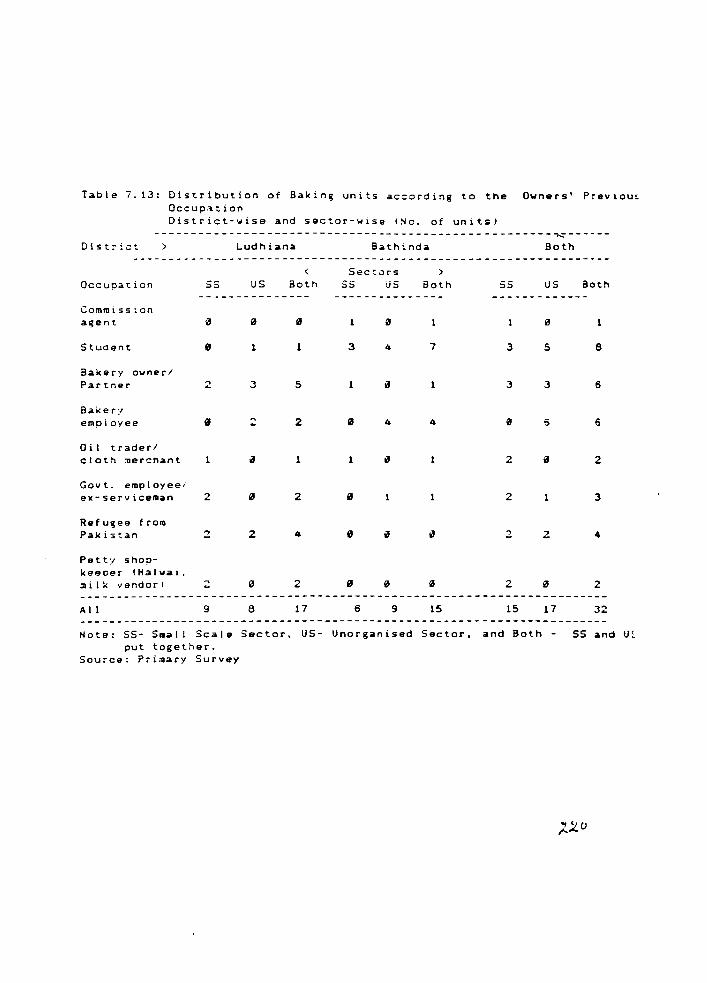
Taole 7.13: Distribution of Baking units according to the Owners' Previou~ Occup'ltion District-wise and sector-wise (So. of units)
-----------------------------------------------------~ ------
Dlst~ict) Ludhiana. Ba.thinda 30th
< SectoJrs Occupation 5S US Both 5S US Both 5S US Both
--------------- --------------- -------------Comllliss~on
agent " " " 1 " " Stuoent " 1 1 3 4 7 3 5 8
Bakery owner/ Partner
., 3 5 " 3 3 6 ... Baker; employee " : 2 " 4 WJ 5 6
Oil trader/ cloth ",ercnant 1 OJ 1 2 iI 2
Gov t. employee/ ell-serviceIDa.n 2 " 2 iI 2 1 3
Refugee froID Pakistan 2 2 " " OJ " 2 Z " Petty shop-keeper (Halwai. mil k vendorl ~
" 2 " WJ WJ 2 iI 2 ... -----------------------------------------------------------------------A II 9 6 17 6 9 15 15 17 32 -----------------------------------------------------------------------Note: SS- SlDal I Scale Sector. US- Unorganised Sector. and Both - SS and UC
put together. Source: Prilllary Survey
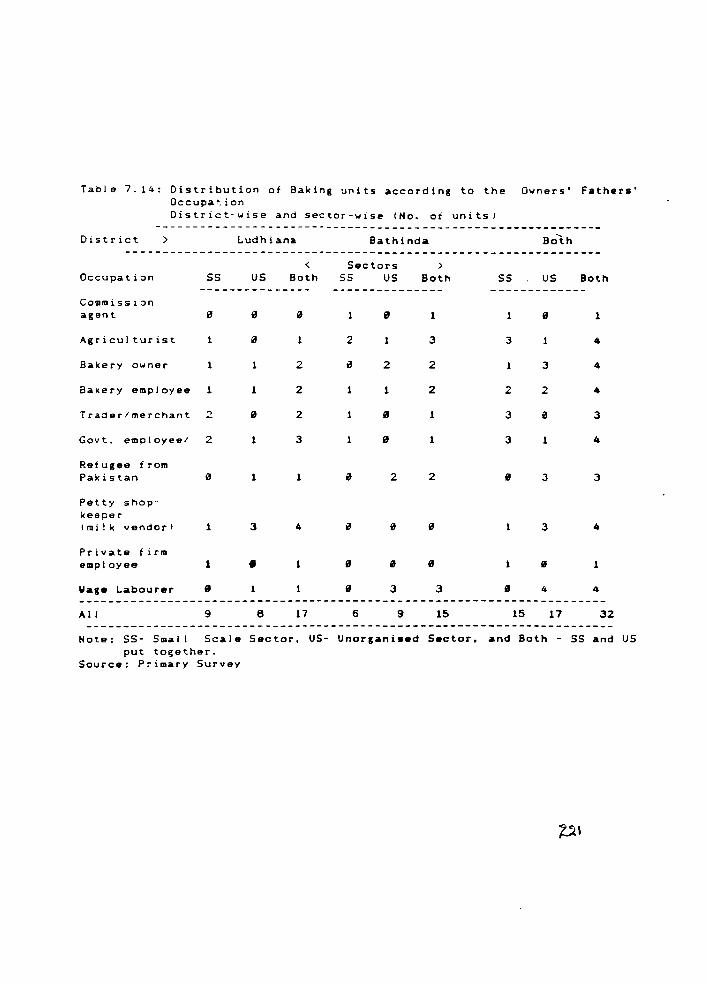
Table 7.14: Distribution of Baking units according to the Owners' Fathers' OccupOlt.ion District-wise and sector-wise (No. of units)
District > Ludhiana BathindOl Both
< Sectors )
Occupation 55 U5 Both SS US Both 55 US Both --------------- --------------- -------------
CODuDission agent " " " " 1 " 1
Agriculturist 1 " 2 1 3 3 1 4
BOlkery owner 1 1 2 iJ 2 2 3 4
Bakery employee 1 1 2 1 1 2 2 2 4
Trader/merchant 2 " 2 1 " 1 3 " 3
GO'lt. emoloyee l 2 1 3 1 " 1 3 1 4
Refugee from Pakistan " 1 1 " 2 2 " 3 3
Petty shop-keeoer ( !D ilk vendor) 1 3 4 iJ " " 3 4
Private firm elllployee 1 • " " " " 1
Wage Labourer " 1 " 3 3 " 4 4
-----------------------------------------------------------------------All 9 6 17 6 9 15 15 17 32 -----------------------------------------------------------------------
Hate: SS- Sma I I Scale Sector. US- Unorgani.ed Sector. and Both - 55 and US put to~ether.
Source: Prilllary Survey
~,
On the other hand, in Bathinda, where the bakery IJnits
were of relatively recent origin, they were owned by peop Ie
with background in occupations like stlJdent, commission
agent, and Oil trading, though there was a unit rlJn by a
also former bakery employee as wei I. Similar patterns
emerged in terms of occupational background of the fathers of
the owners wherein in Ludhiana, they were predominantly
non-agriculturists and non-traders. But, on the other hand,
in Bathinda they were predominantly traders and
agricul turists (Tables 7.13 and 7.14).
The caste background of the bakery owners suggested
that
this
though both the Hindus and the Sikhs were present in
industry in equal numbers, caste-wise most of them
belonged to the Khatri community who are predominantly
refugees from Pakistan. They were found among the Hindus as
well as the
significant
Sikhs. In Ludhiana where they account for a
proportion of the population, they controlled
almost the entire bakery business in the smal I scale sector,
whereas in Bathinda. it was the Bania community who were in
large numbers in this industry (Table 7.15).
Now, why did these entrepreneurs come into this
particular industry? The frequency distribution of baking
units across various factors in the choice of industry
suggests that in Ludhiana, the predominant factor per se and
222

in collaboration with other factors was the pre-existing
skil of the families in this activity" where most of them
were refugees from Pakistan and their fathers had been
deal ing in the same or related businesses like milk vending,
sweet-making, etc .. The faci I itating factors were the
relatively low initial investment and more profits, which
made it easy for these entrepreneurs to enter and stay in
this industry.
Table 7.15: Patterns of Caste background of Baking unit Owners District-wise and Sector-wise (No. of Units)
District > Ludhiana Bathinda Both
Sector Caste 55 US
< Both SS US
> Both 55 US Both
BanIa
Jat Sikh
Khatri! Arora
Brahman
Rajput
B C
s C
1
8
1
2
" II
1 3
1
5 13 2
1 1
II 1
2 3
II 2
II 3 4
1 1 1
2 4 1~ 7 17
1 2 2
1 1 1
3 5 5
2 2 2 ------------------------------------------------------------
All 9 8 17 6 9 15 15 17 32 -------------------------------------------------------------Note: SS -Small Scale Sector. US- Unorganised Sector, and
Both- SS and US put together. Source: Primary Survey
223
On the other hand. in Bathinda.
profitability of this industry was the
relatively high
predominant factor
for entrY into this industry which is mainly
people with trading and merchant background
in the hands 01'
(Table 7.16).
In Ludhiana.
businesses of
even the patterns of other integrated
the entrepreneurs or their families confirmed
the relatively diversified interests in industry like
various types of food processing (Table 7.17),
But. in the unorganised sector of bakery industry. the
owners were in a majority of cases related to the industry
in their occupational background. They were either working
as bakery employees or themselves running bakeries with some
partnership before starting their own bakery business.
Similarly, t.heir fathers' occupational backgro'Jnd was also in
bakery business and other non-agricultural
occupations (Tables 7.12 and 7.13),
and non-trading
One of these predominant occupational categories was
wage labour. tha t too in Bathinda district. This perhaps
shows that. t.he bakery industrY in the unorganised sector is
in the hands of people with meagre funds and occupational
background in pett.y business. t.rade and wage labour, This
was evident from the caste affiliations of the bakery owners
as we 1 I, Though the Khatris were s til I the
224
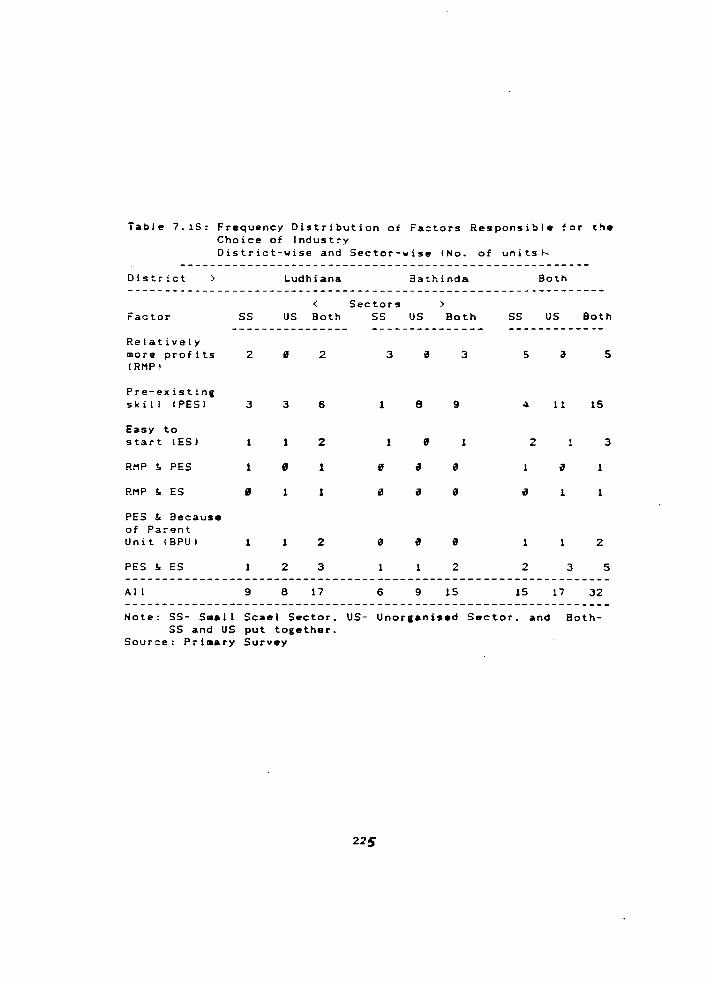
Table 7.15: Frequency Distribution of Factors Responsible for ~~. Choice of Indust~y
District-wise and Sector-wise (No. of units i--
District > l.udhiana 8athinda Both
< Sectors > Factor 55 US Both 55 US Both SS US Both
---------------- --------------- -------------Relatively more profits 2 II 2 3 iJ 3 5 a 5 (Rf'1PI
Pre-existing ski I I (PES) 3 3 6 1 8 9 4 11 15
Easy to start (ES) 1 1 2 1 II 1 2 3
Rf'1P !. PES 1 fI 1 III ~ III if 1
Rf'1P t. ES " 1 1 III if " if 1
PES t. Because of Parent Unit (BPU) 1 1 2 " if II 1 2
PES t. ES 2 3 1 1 2 2 3 5 -----------------------------------------------------------------All 9 8 17 6 9 15 15 17 32 -----------------------------------------------------------------Note: SS- Sm.11 Scael Sector. US- Unorganised Sector. and Both-
SS and US put together. Source: Primary Survey
225

community among the surveyed bakeries, the scheduled cast.e
and backward cast'3 p'3opl e w'3re '3qU3. Ily pr'3dominant in this
industry in Punjab, '3sp'3cially in
Bathinda district. Another eKist.ent community in this
business were the Brahmins (Tabl'3 7.14). Even the analysis
of factors in the choice of this industry by the
entrepreneurs' occupations suggested that what led peo~le to
go for baking business w~s their pre-existing skill in this
occupation wherein they were working as bakery employees in a
large number of cases (Table 7.15).
Table 7.17: Patterns of Other integrated Businesses of Baking Units (Smal I Scale)
Integrated District Activity --------------------------------------------
Ludhiana Bathinda Both
No .3 4 7 Oil mil I ~ 2 2 Food processing 2 ~ 2 Show room ,3 fJ 3 Steel unit 1 ~ 1
A I I 9 6 15
Source: Primary Survey
7.8 Conclusions
This analysis of the entrepreneurial background of
primary and secondary food processing industries in Punjab
reveals that. by and large. the entrepreneurs in the primary
processing industries are those with trading or merchant
background which coincides with their caste as wei I. The
226
present owners' fathers were predominantly commission agents
and traders in agriculturally developed Punjab who made good
fortunes due to the increased
avera I I agricultural trade as
Revolution. Not only were
investment in primary processing
volume of foodgrains and
a
the
result
sources
of
of
the Green
funds for
units non-agricultural but
also the major reason for investment in these industries was
profitability which again reflects
upon the trading background of these entrepreneurs who would
have been more interested in making quick money in this
activity related to their main activity foodgrains trade.
The 1980s seem to have witnessed the entry of agricult.ural
surplus farmers in these industries on a modest scale but:
they do not seem to have made any major dent due to the lack
of appropriate professional background.
The analysis of occupational background points to the
process
wherein
of occupational mobility among the trading castes
the sons of commission agents were found to be
becoming industrial ists. thol.Jgh in small measure and that too
only agro-industrial ists.
But the secondary processing industries did not show any
evidence of their trading background. They were more akin to
the skill patterns of various communities and families such
that most of the bakery entrepreneurs were either owners of
227
bakeries or bakery emp 1 oyees in their earl ier occupation
al so. Their parental occupation revealed that: the
e n t rep r e n e u r sea m e fro m v e r y d i v e r s e b a c k g r 0 IJ n d s . Howe v e r • i n
terms of caste, the industry was in the hands of Khatris and
Aroras - a trading caste most of whom are refugees
Pakistan. Even the important reason for choice of
from
this
occupation turned out to be pre-el<isting ski II unl ike the
processing factor of greater profits as in the primary
industries. A welcome feature of the bakery industry was
that it was the sector where the poor strata with meagre
funds were able to enter and sustain themselves perhaps due
to the small and scale-neutral nature of the activity.
rn the following chapter. the SIJmmary and conclusions of
the stlJdy are put together and some policy suggestions and
research questions are discussed.
228
Notes
1. For an exhalJstiva raview of I iterat.IJra, saa Raman Mahadevan: aEntrepraneurship and Indian Industrial isation in Historical Perspe8tive-, a paper presented at the seminar on - Indian Industrialisation-, June 9 - 12, 1987, Cent.re for Development Studies, Trivandrum (Kerala).
2. Commission Agents operate as middlemen between the produ8er and t.he buyer and receive a commission for their services. A commission agent is known as Kacha Arthiya in Punjab ~nd he is required to receive his 80mmission from the purchaser. On the other hand, a wholesale foodgrain trader is known as a Pucca Art h i ya i n P IJ n jab (L e Ie, 1 97 1 , P p. 52, 53, 56).
3. This is corroborated by a study conducted in the ear I y 1970s as well which states that 8ommission agents often owned I' ice mi I Is (See V K Gupta and P S George: Modernisation of Rice Processing Industry in Punjab, CMA Monograph No. 54, I I f1 Ahmedabad, Oct. 1974).
4. That the Hindus have been associated with trade and industry is reflected in a statement by Randhawa et. ale (1974); -Credit for this revival (after Partition) goes to the Sikh farmers, blacksmiths and carpenters. and the Hindu entrepreneurs of Punjab. It is their co-operative endeavour in the fields of agriculture and industry which laid the foundations of progress in Punjab- (p. 37).
5. The evidence on this integration comes out from a recent study on Bangladesh as well which states: -Most of the (rice) mi I Is opera ted as traders, pu rchas i ng paddy, process i ng it and selling rice-Cpo 214). See Ben Crow:- Plain Tales from the Rice Trade - Indications of Vertical Integration in Foodgrains Markets in Bangladesh- in The Journal of Peasant Studies, Vol. 16, No.2. Jan. 1989. Crow also cites the case of a large rice mill owner who was involved in import-export business. brick making, and palm oil milling. besides rice milling.
6. This was observed by Lele (1971> as well (p.78).
7. This has happened in another Green Coastal Andhra Pradesh too. See Y V Krishna Rao et. al. (eds.) 1984. p. 25
Revolution Rao in Y V
region -Krishna
229
8. sge C B IJpadhya:· Thg Farmer-c.apl1:all::p.,. ...... ~'J ____ •
Pradesh w in Economic and Political Wgekly, July 2 and 9, 1988; and R M Mohan Rao:·Commgrcial isation and Agricultural Growth in Asia: A Comparative Study of South Korea and Coastal Andhra· in J B rem a nan d Sud i P toM IJ n dig ( e d s. ) : R u r a I T ran s for mat ion inA s i a , OUP, Delhi, 1991.
9. A large farmer was one who owned 7 hectares or more of land with 75 per cent of the cultivated area irrigated, and at least one tractor.
10. Sau, R:wThe Green Revolution and Industrial Growth A Tale of Two Paradoxes and a Half·, Economic and Weekly, Vol. 23, No. 16, April 16. 1988.
in I nd i a: Pol itical
11. The only large scale refined oil unit also pioneered by a commission agent.
in this district was
12. A survey of 65 small scale units (25 of them agro-based) in the centrally backward districts of Punjab by the Economic and Statistical .Organisation (ESO), Punjab also revealed that a number of the entrepreneurs were previously commission agents or were ,doing business. These people usually being well-off, with the addition of govt. incentives,had set up a large number of units in the last decade (Govt. of Punjab, 1984).
13. Pre-existing predominant factor in Pakistan (Nabi, (Singh, S, 1989).
skill or experience was also found to be a in entrepreneurship in farm machinery industry 1988) and in bicycle industry in Indian Punjab
230

Chapter 8 SUMMAY AND CONCLUSIONS
The present study has examined the growth, structure
and organisation of food processing industries in a Green
Revolution region. Punjab is a predominantly agricultural
economy which is faced with the problems of high cost of
cultivation. underemployment and unemployment. a'i'\d a narrow
industrial base. Keeping in view the resource based
industrialisation strategy, this st~dy has looked at the
process of agro-industrialisation in the State with special
reference to food processing industries.
The specific objectives of the study were: (l) an
analysis of the industrial structure of the State in general;
(2) an examination of the growth, structure, and organisation
of the food processing industries and their backward and
forward linkages; (3) a look into the nature and composition
of employment in these industries and their sources of
labour; ( 4 ) an analysis of the nature and sources of
entrepreneurship and investment funds in order to examine the
integration between agricultural trade and food processing
and the potential for entry for farm entrepreneurs into this
industry; and finally. (S) an examination of the scope and
potential of food processing industries in Punjab given a)
the prevailing cropping pattern and b) a changed cropping
231
-------- ------------------------
pattern scenariQ.
Findings of the Study
The analysis of the structure of the State economy
revealed an overdependence of the state income and employment
on the primary sector wherein a major component of it - crop
production-was facing the problems of high ~ost of
cultivation, lack of diversification, and lack of
with other sectors of the economy. On the other
linkages
hand, the
secondary sector, especially the manufacturing part of it,
has a very small base, though it experienced very high growth
rates before the slow down in the 1980s. Though the
industrial sector of the State is considered to be sma"-
scale dominated, over the years, the employment share of this
sector has fal len quite considerably. The agro-processin~
sector has been able to maintain its relative share in the
total industrial employment throughout the post-Green
Revolution
production
period.
to that
Also, the ratio of consumer
of cap ita I goods has declined.
other hand, the benefits of Green Revolution seem
accrued more to the
a.nd transport.
tertiary sector, particularly, to
goods
On the
to have
trade
The food processing industry is one of
industries in the factory sector, but its share in
the major
the 9mall
scale sector has been qui t e 9 ma 1 I • Employment in the
232

organised sector of this industry grew at much higher rates
than production during the 1970s and the 1980s.
small s·;al"" sector had much larger increases in
especially in the 19805.
However. th,",
employment.
A clear shift in the relative importance of various
industries within the food processing sector was observed.
tJhereas during the 19605 19705. thl? ~tradition~l
industries like grain milling. s ug a r. ed i b leo i I sand dairy
products dominated the scene, they lost their shares in the
1980s when some new industries like baking and fruit and
vegetable processing emerged. However, in terms of their
weightage. the traditional sector continued to dominate even
during the 1980s. The small scale sector though growing at a
very high rate, was found to be lacking in diversification of.
activity or product manufacturing. It was dominated by three
industries two primary processing (rice mill ing and 0 i I
mil ling) and one secondary processing (baking).
The analysis of secondary information also brought to
the fore the evidence that the small scale sector of food
processing was relatively less efficient when compared to the
factory sector. It not only had lower
productivities but also a higher capital
in the factory sector. However. the
unorganised sector (DME survey sector)
labour and capital
intensity than that
results for the
were quite mixed.
233
Though the '~apital intensity was lower than t ha t of the
l~bour and capital productivities
lower.
The analysis of primary survey data revealed that in the
primary and secondary processing industries the predominant
mode of ownership was
the unorganised sector
partnership in all industries except
of the baking industry and the oil
ghanis. In a majority of the cases, the partners were
members of the same family or relatives.
Since primary
output,
processing industries are based on
agricultural the cropping pattern has a direct
bearing on their emergence and existence. In Punjab, most of
the rice mil ling un its emerged on the scene on I y dur ing the
late 19705 and the early 1980s as a result of the change in
the cropping pattern in favour of paddy cultivation in
5 ta te. However, another primary processing industry
milling - was relatively free of such a tie up with
the
oi I
the
cropping pattern and was -footloose- in its raw material
procurement. Many of the oil mills obtained their suppl ies
from the neighbouring
even as tar as Gujarat.
states of Haryana and Rajasthan and
The prox imi ty of the roi 115 to the market pi ace and urban
centres had a clear impact on them in terms of their size as
234
well as working pattern. The mills in the developed distriGt
were larger in size. On the ot.her hand, t.he second.~ry
proGessing industries seemed to be more responsive to 'J r ban
demand and industrial consumers along loIith 3.gricultur31
growth as was evident from the study of the bakery industry.
Here too, the baking units in t.he relatively developed
distri,:;t had, on an average, a larger 3ize.
The findings on the employment aspects of the food
processing industry revealed that though they were major
sources of employment for the uns k i I led and semi-skilled
migrant loIorkers, they did not generate the type of
employment which would suit the
pattern
also the
of employment not only
I oca I needs.
e)(cluded local
The eKisting
people, blJt
type and quality of jobs generated was low. The
wages in this industry were as high 35 or even
that in the agricultural sector of the State; and
lower than
the nature
of jobs loIas seasonal. Thus, these jobs acted as competitors
to agricultural work and contributed to a labour shortage in
rural areas during peak months. The employment character ot
the secondary processing industry was also of the same type
as in tha primary processing industries.
The capital-labour ratio (K\L)
processing industries revealed that
analysis for the primary
on the whole, oil mi I Is
in the study 1istricts were more capital intensive (or less
235

labour intensive) than the rice mills. However. within oil
mil Is, capital intensity was higher in the more deveioped
rice mills were district of Ludhiana. On the other hand,
less capital intensive in Ludhiana. In the relatively less
developed district of Bathinda, rice mills were found to be
a:; cap ita lin t. en:; i ve 0 r a:; I abo IJ r i n ten s i v e as 0 i I mil I s w hen
total capital investment into consideration. A
rna j Qr factor explaining the high capital intensity of ric~
rn ills in Bathinda was the under-uti I isation of capacity.
They were more seasonal and operated less number of shifts.
On the other hand, in baking industry. the sma I I sca I e
units in Ludhiana were less capital intensive than the i r
counterparts in Bathinda. But the capital productivity was
more or less same in both the districts, though labour
productivity was higher in the capital intensive district.
In the unorganised bakery sector, Ludhiana had
capital intensity as well as labour productivity, but
higher
lower
capital productivity than that in Bathinda.
The high degree of relationship agricultural
growth and the growt.h of food processing sector at the
district level suggested the i mpor tance of
growth in the process of agro-industrialisation
agricult.ural
and thereby
industrial isation. The area under food crops explained 33
per cent. of the growth in the number of units at the district
2.36

However. the factor of urbanisation was also found to
be 3n equally important explanatory variable. This. of
course, takes account of infrastructure development as · ... el I.
Though the primary S IJ r vey a I so pointed to very strong
backward and forward I inkages of these industries. the nature
of these I inks was found to be not quite in tune with the
requirements of the regional economy in terms of employment
and investment opportunities and the sustenance of the
agricultural sector. ,
The analysis of the entrepreneurial background of
primary and secondary food processing industries in Punjab
revealed that, by and large. the entrepreneurs in the primary
processing industries were those with trading or merchant
background which coincided with their caste as well. Tnis
once again validates Bagchi's hypothesis that the Indian
industrial class is basically a trading class. The ptesent
owners' fathers were predominantly commission agents and
traders who made good fortunes due to the increased volume of
foodgrains and overal I agricultural trade as a result of the
Green Revolution in the State.
Not only were the sources of funds for investment in
primary processing units
reason for investment in
non-agricultural but
these industries
the
was
major
their
relatively higher profitability. This again reflects upon the
237
trading background 'Jf these entrepreneurs who would have been
•••• '"'.r •• t.~ in •• kint qYiQk money in this activity which
is related to their mair activity -- foodgrains trade. The
1960's seem to have witnessed the entry of agricultural
surplus farmers into these industries on a modest scale but
they do not Seem to have made any major dent due to the lack
of appropriate professior,al background and lack of sufficient
funds with most of the farmers.
The analysis of occupational background pointed to the
process of occupational mobility among the trading castes
wherein the sons of commission agents were found to be
becoming industrial ists, though in a small measure and that
too confined to agro-industry.
The entrepreneurs in the secondary processing industries
did not show any evidenco of their trading background. They
were more ak into the s I: ill pa t terns of various communities
and famil ies such that most of the bakery entrepreneurs were
either ba.keryowners or bakery employees in their earlier
occupation. Their paruntal occupation revealed that the
entrepreneurs came from very diverse backgrounds. However, in
terms of caste, the induutry was 1n the hands of Khatris and
Aroras - a trading cas~e most of whom are refugees from
Pakistan. Even the important reason for choice of this
occupation turned out to be the pre-eXisting skil I unlike the
236

factor of more profits in the primary processing industries.
A welcome feature of the bakery industry was that it was the
sector where the poor strata with meagre funds were able to
enter and sustain thems; lves perhaps due to the smal I and
scale-neutral nature of the activity.
Policy Suggestions
Though we are a\lare of the limitations of the study in
terms of coverage of districts and industries and do not
intend to generalise the findings, still a few suggestios are
attempted from the above findings of the study.
The question one may ask is: Have the food processing
industries performed the role they are supposed to perform 1n
an agriculturally developed region? The answer perhaps is
though it may not be ·No· either. Of course,
they seem to have helped the rural sector by way of providing
a market for the produce and certain other linkages like some
amount of emplcyment ~nd investment opportunities in sectors
liko transport and trade. However, the growth of food
processing industries has been inadequate in terms of
involvement of the rural community in it. Further the
integration of agricultural trade with processing has led to
no improvement in the share of the producer in the consumer's
rupee.
239

The reason perhaps lies in the form of organization of
food processing units. Thus, if the food processing has to
play the role of catalyst of rural sus tenance in Pun jab, It
has to be organised in a way that rural community could
participate in inveslll~nt, if not in jobs. In this, perhaps
co-operatives can be helpful because they wil I not only lInk
farm sector with processing for supply of raw material but
also in terms of labour and investment linkages. In fact,
one of the demands of the farming community (articulated by
the Punjab unit of the Bharti~a Kisan Union) is that farmers
of Punjab should be involved in trading and agro-processing
so that they can find altern.j.tive outlets of investment; and
the share of producer in consumer's rupee goes up, it the
organisation ie co-operative.
Also, mod~rnisation and technological upgradation of the
industry with a focus on national and international markets,
will make it possible to improve the quality of jobs
generated and will strengthen linkage of these activities
with the rest of the regional economy.
The orgaraisation of th:.s
I ines will also lead to better
industry along co-operative
labour relations which are
very crucial in the given context. This is because in Punjab
the youth from farming familitts are not used to being ordered
around which is generally thE' case in privately owned small
240
scal~ enterprises.
Punjab adopted a particular model of development - a
thrust on economic model in which there was a greater
development. And the people of the State have had a brief
taste of prosperity. The youth of the State are now looking
for particular
possibility of
type of jobs
involving the
at particular wages. Another
educated youth into the
development proc~ss is to make them se!f-employed small
But this will require "Karkhanedars· instead of workers.
training for sel f-empl oyment, credit facilities and
idantifi~ation of viable ~on-farm activities on a vast scale.
So far as the relevance of the cropping pattern for food
processing
that there
industry is concerned, it should be remembered
is a two-way causation between the two. Whereas
processing industries can help change cropping pptterns to a
certain extent, the cropping pattern itself has an impact on
the emergence and growth of processing industries in a
region. Here some observations on the potential for food
processing industries based on present cropping pattern and a
changed cropping pattern have bean attempted.
First. wheat. based industries: Punjab processes only
2.5 per cent of the total output of wheat in the State and
the rest of it moves out cf the State. Here one has to agree
241

that conversion of wheat into wheat flour wi!! not really add
significant value, but on the other hand, may lead to more
wastage in transport of the wheat f lour because it is more
perishable compare' to wheat. But wha tis required is to
make use of wheat in secondary processing industries.
The bakery industry is on~ which has s t r 0,(\ g lin k age s
with the wheat sector of agriculture. The production of one
ton of brea.d requires 9.75 tonnes of wheat flour. Since
bread is less perishable than wheat flour and there is a
growing demand for it within and outside the State, it is
desirable to develop the bakery industry. I t wi I I also haY9
spread effects on other sectors of the economy in terms of
growth of marketing, transport, and distribution linkages
and employment avenues and wi I le~d to more entrepreneurial
in the State.
Paddy is another important crop in Punjab. Besides
rice, processing of paddy yields two by-products - rice bran
and husk. Whereas rice bran is being used in a number of food
and non-food industries, the use of husk so far has been sub
optimal because it is being used as fuel in many industries.
Perhaps a more viable and industrial use of husk can be made
by way of using it as a raw material in production than as a
fuel input. Many industries like
etc. can be SEt up in the State.
furfural, cardboard, cement
242

But it should be remembered that the by-product
processing involves very low raw material cost but very high
capital and management costs compared to the primary
processing industries. Thus, the approach to the development
of such industries wil I be different from the one for product
processing industries in terms of I ocat ion, organisation,
managemen t, techno logy, etc ••
Oilseeds based industries: cotton and mustard are two
other important crops in Punjab after wheat, paddy and
sugarcane. At present, some of the cotton is being sent
outside the State by the traders and the Cotton Corporation
of India. The raw cotton has two components-
cotton seed. Whereas cotton is used in non-food
cotton and
industries,
cotton seed oil is ;sed for extracting oil by the oil mills
and then used in the manufacture of vanaspati. Thus, both as
a raw material and as a iinal product (refined cotton seed
a i I ) , cotton seed oil leads to many direct and indirect
linkages with other sectol's and economic activities in the
S ta te econc)my. These f o)'ward linkages of oil mills were
evident from our study as wei I.
Howe',rer, since the raw material for oil mills is
becoming a ~roblem,
elsewhere for their
the oil mills
requirements.
in the State are looking
The import of oilseeds
243
• (mustard) from other States was reported in our study of oil
mil Is. If the linkage effects of such industries are to be
ut i I ised in an sffeetiv€' manner, then it is important that
oil seed crops should be promoted. This will he I pin
bringing 'farmers out of the wheat-paddy rotation which has
become a. I iabi I ity for t.he Sta.te. However, this change of
cropping pattern will require more attention to yields than
to prices of oilseeds. The Johl committee (1986) also
observed that given the production technology and existing
relative prices, there were very few crops which could
compete with paddy and wheat rotation. Though there is
limited possibility, there is some hope in respect of crops
such as sugarcane, rapeseed. mus ta.rd, arha r I moong. and
soyabean. There is potential for improvement in the
prod'Jction of these crop!;. To achieve this, these crops need
priCing and procurement support on the pattern of wheat and
rice.
Now, if the cropping pattern is different from the
present olle and dominated by new crops like fruits and
vegetables, then the str~tegy for food processing development
has to be different. Recently, there has been a talk of
diversification of agriculture in Punjab towards new crops
consequent up on the recommendations of the Johl committee
( 1986) . At present, fruits occupy ~.8 per cent and
vegetabl e:, 0.92 per cent of the cultivated area in Punjab
244
(1987/88) •
kinnow, pear,
cauliflower,
The major fruits and vegetables grown include
peach, mango, orange, guava, grapes, potato,
onion and tomato. Most of these crops,
especially potato, have been experiencing a cobweb cycle of
output and prices.
It is not easy to change cropping pattern in favour of
these crops since they are perennial, capital intensive, long
gestation, risky crops, and face the problems of lack of
marketing and processing. Our small experience with the
fruit and vagetable processing industry in Ludhiana revealed
that the units were run by the trading caste (Khatris) who
had come to Punjab as refugees from West Punjab. One of the
major problems faced by t~e industry was the seasonality of
raw material availability. They had to procure the raw
material seasonally though they functioned perennially. And
these units were in no way linked to the rural sector.
What has to he realised is that changes in cropping
pattern should be encouraged in such a way that new crops
instead of replacing the traditional crops only complement
and supplement them, because the purpose of the exercise of
diversification is not to change cropping pattern for its own
sake but to provide more viable farm and non-farm jobs to the
rural community.
245

Research [.sues
This study, as mentioned earlier, has its own
limitations. But the findings of the study certainly suggest
some important research issues.
This study concerns only two districts and three
industries and has limited relevance in terms of coverage and
scope. It would certainly be desirable to study other
districts and other processing
study has observed.
industries to test what this
We have looked at the markets of primary and secondary
processing industries and suggested some new industries which
can be promoted. But in the case of new industries, the
market is one of the very crucial determinants of their
viability. The question of market pertains to whether they
should cater to local, national or international markets.
Once the markat issue comos in. the question of technology
becomes very crucial since at every level ot market, the
products have
technology be
difforent levels of technology.
indigenous or imported? Should
Should
it be
labour-saving or labour-augmenting? At what scale -small,
should these activities be organised? medium or large
Perhaps an analysis of relative efficiency at the firm level
wi II throw mor-e I ight on these aspects. These questions wi 11
need serious research at the firm level; and these results
246

· wit I have to bo fitted into a macro strategy.
Our study has observed the absence of subcontracting in
food processing sector unli~e the other industries in the
State. The question that requires fUrther research and
investigation is why there is lack of this phenomenon in this
industry which is so prevalent in other activities; and what
is the potential for such ancillarisation of production.
especially in secondary proc~ssing sector because marketing
and advertising which are so crucial in food industry are
prohibitive to the smal I units in terms of their cost. Thus.
there is need to look into tha potential areas for such tie-
up with the large units. This phenomenon of procuring
products from the smal I and household units has been observed
in hotel industry in some par'~s of the country.
Recently, agro-climatic zonal planning has assumed
desirable significance and the Planning Commission has
demarcated the country into 15 agro-climatic zones for
purposes of more relevant and effective planning on the basis
of economic base of the reg:. 0 n • especially in agriculture.
In this context. a very impol'tant question to be dealt with
is: How to promote linkage at agro and food processing
industries with the crop and allied sectors of particular
regions in which they specialisa or tend to specialise? The
locations and capaciti>' of pl'ocessing plants will have to be
247
linked with the resource ba~e and demand patterns of these
regions. Thus, speciric studies of agro-processing sector
for each agro-cl imattc region need to be conducted.
Since the development of processing sector is not in
isolation, its linkage with the agricultural, rural and urban
economies demand attention. Not only has this sector to be
more productive than agriculture, but also it has to sustain .,
the farDling and non-farmi~g households by providing them
with supplementary incoml?s. But should we not avoid
creating dead-end low productivity jobs? fn specific
conditions, for example in Punjab it is not creation of jobs
which is important but the nature of jobs. They have to
cater to the needs and skills of the people who need them.
Thus, the nature of non-farm activities can not be same in
all the situations. What can be the scope for part-time
off-farm or on-farm jobs in a State like Punjab?
The location of processing activities is another
unsettled question. No doubt the purpose of agro-industrial
development is to help the rural economy, but is it
necessary that the activities have to be located in rural
area.s only? I~ it due to mere market pull that non-farm
activities are located in urban areas or is it because of
better infrastructure? I n fact. the Punjab model of
development points to the role of market towns - wMandis·- in
248
non-farm development. Can we not treat these market rural
towns as ·Hon-Farm Growth Centres· for the purpose of
development of this sector?
FUrther, if the processing sector has to help sustain
the farm sector and mobilise investibl e agricultural
surpluses in the post-Green Revolution period in regions
like Punjab, the form of organisation of this sector assumes
significance. The rich farmers of Punjab are increasingly
engaging in such lines of investment which in terms of their
capital requirements, production levels and returns to
investment are in sharp contrast to the non-farm activities
of the poor. Thus, t'1e nona-farm sector has a crucial role
to play in the internal differentiation of the peasantry,
though this still remains a seriously under- researched
area. There are choices to be made among various types
available, for example, farmers' co-operatives.
partnerships, joint sector etc. What can one learn from the
Gujarat and Punjab experiences in dairying and what are the
chances to replicate the same in other processing activities?
Can these forms of organisation help raise the primary
producer's share in the consumer's rupee?
Though co-operatives seem to be a more desirable form of
organisation in general, stil I the studies of their relative
efficiency and economics in comparison to other modes of
249
organisation need to be conducted, keeping in view the
scarcity of capital resourcos. Co-operatives may be desirable
in one sector of processing while not in others. Thus,
specific studies of various sectors within the processing
sector are absolutely neces~ary.
This study has pointed to the significance of government
incentives in agro-industrial development. In this regard,
questions I ike how to finance these projects, and whether
they sholJld be given capital subsidy or labour subsidy,
remain very crucial and need further research.
The data base for the small scale and unorganised
sectors of food and agro-processing is very weak. There is
need to conduct many more sub-sector level survey studies and
case studies in order to generate sufficient information on
these sectors and understand the problems of the same. For
example, in the context of recent pol icy changes, it is
important to know what wil I be or what has been the impact of
these policies on the smatl scale sector? The study of this
impact on food processing in the smal I sector is particularly
important because it is a potential area for employment
generation and can sustain the rural sector. Also, it is the
activity where some multinational
aI lowed to invest in recentl y.
corporations have been
25"

There are a host' of other issues in this vast domain of
agro-industrial development. but here only those areas of
future research have been outlined which emerge directly or
indirectly from the study.
251
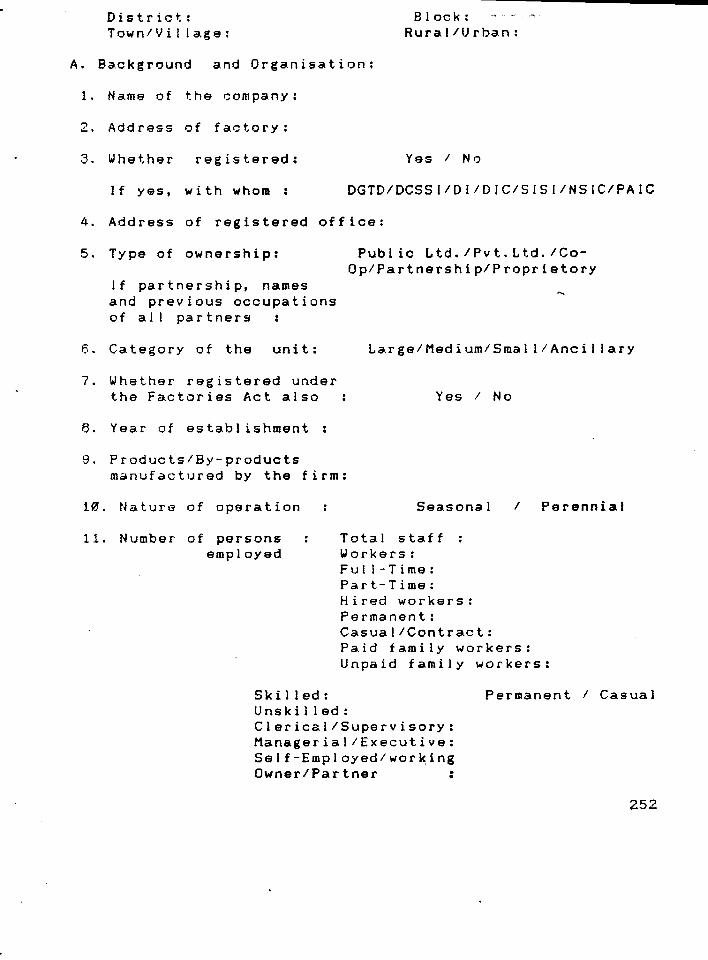
District: Block: Town/Vi Ilage: Rural /U rban:
A. Background and Organisation:
1. Name of the company:
2. Address of factory:
3. Whether registered: Yes / No
If yes, with whom: DGTD/DCSSI/DI/DIC/SISI/NSIC/PAIC
4. Address of registered office:
5. Type of ownership:
If partnership, names and previous occupations of al I partners
Public Ltd./Pvt.Ltd./CoOp/Partnership/Proprietory
6. Category of the unit: Large/Medium/Small/Ancillary
7. Whether registered under the Factories Act also
8. Year of establishment
Yes / No
9. Products/By-products manufactured by the firm:
10. Nature of operation
11. Number of persons employed
Seasonal
Total staff Workers: Fu I 1- Time: Part-Time: Hired workers: Permanent: Casua I /Contract:
/ Perennial
Paid family workers: Unpaid family workers:
Skilled: Permanent I Casual U ns k i I led: Clerical/Supervisory: Managerial/Executive: Self-Employed/working Owner/Partner :
252
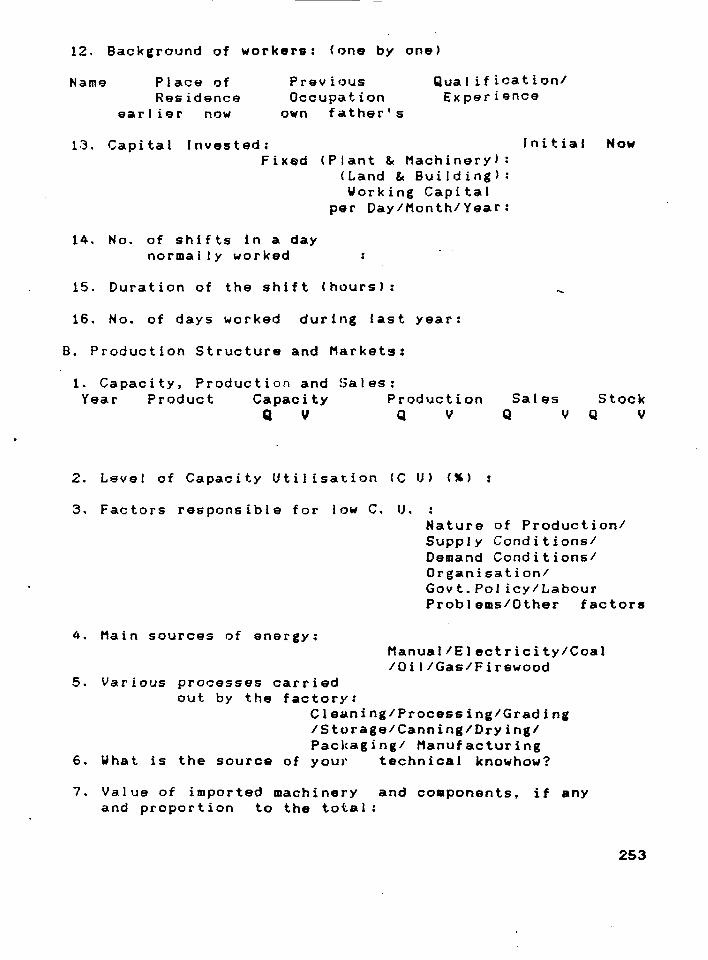
12. Background of workers: (one by one)
Nam~ Place of Residenc~
earli~r now
Previous Occupation
own father's
Qual it ication/ Experience
13. Capital Invested: Initial No", FiKed (Plant & Machinery):
14. No. of shifts in a day normally worked
(Land & Building): Working Capital
per Day/Month/Year:
15. Duration of the shift (hours):
16. No. of days worked during last year:
B. Production Structure and Markets:
1. Capacity, Production and ~)a I es : Year Product Capacity Sales
Q Y Production
Q II Q II
2. L~vel of Capacity Utilisation (C U) (~)
3. Factors responsible for low C. U.
Stock Q II
Nature of Production/ SuppJy Conditions/ Demand Conditions/ Organisation l
Govt.Policy/Labour ProbJems/Other factors
4. Main sources of energy:
5. Various processes carried out by the factory:
ManuaJ/Electricity/Coal /Oil/Gas/Firewood
CleBning/Processing/Grading /Storage/Canning/Drying/ Packaging/ Manufacturing
6. What is the source of your technical knowhow?
7. Value of imported machinery and components, if any and proportion to the total:
253
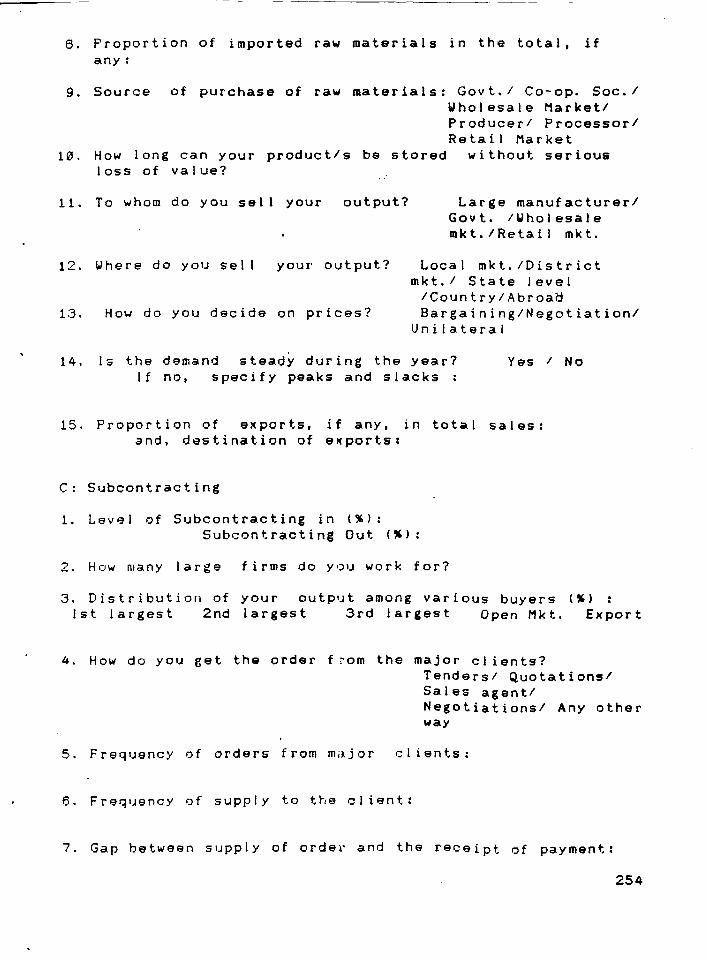
8. Proportion of imported raw materials in the total, if any:
9. Source of purchase of raw materials: Govt./ Co-op. Soc./ Wholesale Market/ Producer/ Processor/ Retail Market
10. How long can your product/s be stored without serious loss of value?
11. To whom do you sel I your output? Large manufacturer/ Govt. /Wholesale mkt./Retail mkt.
12. ~here do you sel I your output? Local mkt./District mkt./ State level
13. How do you decide on prices? /CountrY/Abroaa Bargaining/Negotiation/
Unilateral
14. Is the demand steady during the year? Yes / No If no, specify peaks and slacks:
15. Proportion of exports, if any, in total sales: and, destination of e~ports:
C: Subcontracting
1. Level of Subcontracting in ("): Subcontracting Out ("):
2. How many large firms do you work for?
3 . Dis t rib uti 011 0 f you r 0 u t P!J tam 0 n g v a rio usb u y e r s (") 1st largest 2nd largest 3rd largest Open Mkt. Export
4. How do you get the order f~om the major cl ients? Tendersl Quotations/ Sales agent/ Negotiations/ Any other way
5. Frequency of orders from ma.jor cl ients:
6. Frequency of supply to the client:
7. Gap between supply of order and the receipt of payment:
254
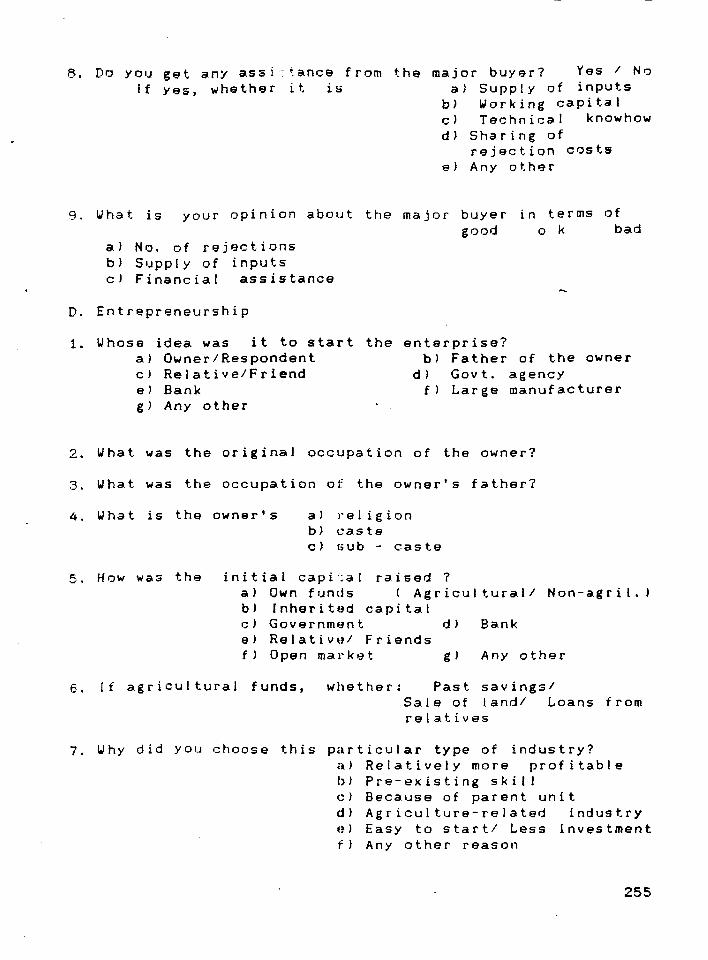
B. Do YOU get any assi ~tance from the If yes, whether it is
major buyer? Yes I No a) Supply of inputs
b) Working capital c) Techn i ca I knowhow
9. IJhat is
d) Sharing of rejection costs
e) Any other
in terms of your opinion about the major buyer good o k bad
a) No. of rejections b) Supply of inputs cl Financial assistance
D. Entrepreneurship
enterprise? 1. Whose idea was it to start the a) Owner/Respondent c) Relative/Friend
b) Father of the owner d) Govt. agency
e) Bank f) Large manufacturer g) Any other
2. What was the original occupation of the owner?
3. What was the occupation of the owner's father?
4. What is the owner's a) )' eli g ion b) caste c) sub - caste
5. How was the initial capi':al ra.ised 7 a) Own flJnds (Agricultural/ Non-agril.) b) Inherited capital c) Government dl Bank e) Relative/ Friends f) Open market g) Any other
6. If agricultural funds, whether: Past savings/ Sa I e of I and/ Loans from relatives
7. Why did you choose this particular type of industry? a) Relatively more profitable bl Pre-existing skill cl Because of parent unit d) Agriculture-related industry el Easy to start/ Less investment f) Any other reason
255
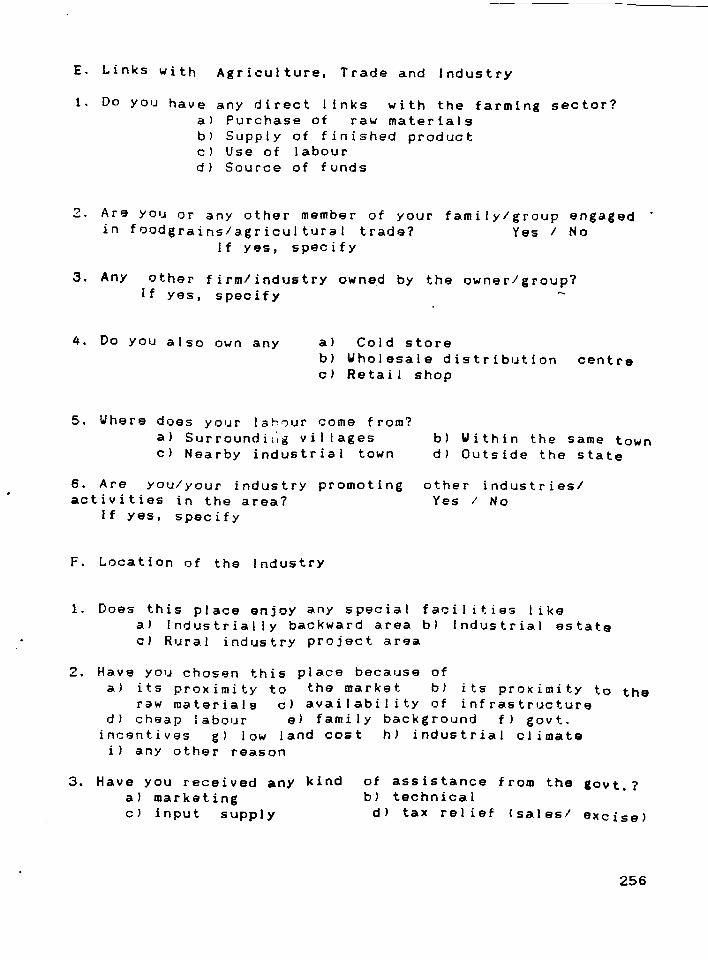
E. Links with Agriculture, Trade and Industry
1. Do you have any direct I inks with the farming sector? a) Purchase of raw materials b) Supply of finished product c) Use of labour d) Source of funds
2. Are YOU or any other member of your family/group engaged in foodgrains/agricultural trade? Yes I No
If yes, specify
3. Any other firm/industry owned by the owner/group? If yes, specify
4. Do you also own any al Cold store bl Wholesale distribution centre c) Retail shop
5. Where does your lah0ur come from? al Surroundil;g villages cl Nearby industrial town
bl Within the same town d) Outside the state
6. Are You/your industry promoting activities in the area?
If yes, specify
F. Location of the Industry
other industries/ Yes / No
1. Doe5 this place enjoy any special facilities like a) Industrially backward area b) Industrial estate c) RIJra.1 industrY project area
2. Have you chosen this place because of a) its proximity to the market b) its proKimity to the
raw materials c) availabil ity of infrastrlJcture d) cheap labour e) family background f) govt.
incentives g) low land cost hI industrial cl imate il any other reason
3. Have you received any kind a) marketing
of assistance from the lovt.? b) technical
c) input supply d) tax relief Isalesl eXcise)
256

4. Do you have any problems regarding a) raw material supply b) c) skilled labour d) e) technical facilities f) g) labour ava i lab iii ty h)
power funds marketing
labour strikes
5. Have you obtained any assistance from the newly set up SIDBI?
G. Opinions
1. Uhat are the factors hindering the farmers from investing in food processing industry?
2. Do you think agriculture is still profitable in~ Punjab given the prevailing cropping pattern?
3. lJhat is a)
c ) d)
a) only to large farmers b) to all farmers c) to none
your opinion about Pepsico's ent~y in Punjab b) contract with the farmers location of the plants impact on the small scale food processors/ yourself
257
BIBLIOGRAPHY
BOOKS
Achaya, K T: Oilseeds and Oil Milling in India - A Cultural and Historical Survey Oxford 8c IBH, New Delhi, 1990,
Ahluwalia, I J: ·Inter-relationship between Agriculture and Industry· in D S Awasthi (ed,): Agriculture-Industry Inter
.:..r...::e~l:....:a=--=-t-=i....:::o::...:nc.!.--=i...!.n.!.-.:..I.:.:n,-"d::...;l:..;-a=., I n d ian E con 0 m i cAs soc i a t ion, 1 967 ,
Alagh. Y K (ed.): Perspectives on Border Area Development:Punjab-Transactions of Two Seminars, Centre for Research in Rural and Industrial Development (CRRID), Chandigarh, March, 1991.
Alagh, Y K, G S Bhalla and S P Kashyap: Structural Analysis of Gujarat. Punjab and Haryana Economies - An Input-Output Study, All ied, New Delhi, 1980.
As ian De vel 0 pm e n t Ban k : As 1:..;' a~n,---,A~g....:r:....;i~c.",u,-,l,-t::...u~r~a::...:....1 _-=S::...:u=-:...r...!.v....::e~yL-!.:_-'Rc:.u~r-=a::...:....1 Asia, Manila, 1977.
Austin, J E Agro-industrial Project Analysis, World Bank, Washington. 1981.
Awasthi, D N: Regional Patterns of India, Concept. New Delhi, 1991.
Industrial Growth
Awasthi. D S (ed.): Agriculture-Industry Inter-relation in India, Indian Economic Association, 1967.
in
Bagch i , A Cambridge
K : P r i vat e I n v e s .:::t.!!:m!..!:e~nc.!...:::t __ 1~-!!n~lc..!n..!:d~i~a~~1....::9:...:0::...:"~ __ ---::1~9~3=9, University Press, Cambridge, 1972.
Bagchi, A K: -European and Indian Entrepreneurship in India 1900 -1930- in Leach E and S N Mukherjee(eds.) EI ites in South Asia, Cambridge University Press, London, 1970,
Baru, Sanjay:·Capitalism in Agriculture and Growth of Manufacturing:Some Issues with Reference to Andhra Pradesh·, in Y V Krishna Rao at. aI. (eds.): Peasant Farming and Growth of Capitalism in Indian Agriculture, Vishalandhra, Vi jaya\oIada, 1964.
Behari, Bepin: Unemployment, Vikas, New Delhi, 1963.
Technology and Rural Poverty,
Berna, Bombay,
J J: Industrial 1960,
Entrepreneurship in Madras State,Asia,
256
Bhal la, G Sand G K Chadha: Green Revolution and the Smal I Peasant A Study of Income Distribution among Punjab Cultivators, Concept, New Delhi, 1983.
Bhal la, G S, G K Chadha, S F' Kashyap, and R K Sharma: Agricultural Growth and Structural Changes in the Punjab Economy: An Input-Output Analysis, International Food Policy Research Institute (IFPRI), Washington in collaboration with Centre for Studies in Regional Development. Jawaharlal Nehru U n i v e r sit y , New Del h i, Aug u~: t , 1 990' .
Birla Institute of Scientific Research (BISR): Structural Transformation and E:Jnomic Development, Arnold Heinemann, New De I hi, 1980' .
Burns, J et al (ed.): ThE' Food Industry - Economics and Pol iciest Heinemann, London, 1983.
Chadha, G K: The State and Rural Economic TransformationThe Case of Punjab 1950'-198E., Sage, New Delhi, 1986.
Chand, R: ~icultural Development, Price Pol icy and Marketed Surplus in India - Study of Green Revolution Region, Concept, New Delhi, 1991.
Chang, Pie-King Agriculture adjustments that take place as industrial ised, Green Wood Fress,
and lndustrialisation- the
Chaudhr i, D P and Development Process 1985.
Chaurasia, Allahabad,
R A 1988.
an agricultural New York, 1949.
country is
A K Dasgupta: Agriculture and the - A St~dy of Punjab, Croom Helm, London,
Agro-industrial Development, Chugh,
Chenery, H B: Structural Change Oxford University Press, New Delhi,
and Development 1979.
Policy,
Chopra, K: Agricultural Development in Punjab - Issues of Resource Use and SustainabilJ...!:y, Sage, New Delhi, 1990.
Cody, J , H Hughes and D Wall (eds.): Pol icies for Industrial Progress in Developing Countries, Oxford University Press, London, 1980.
Cukor, G : Strategies for Industrialisation in the Developing, Countries, C Harst ~( Company, London, 1974.
Day, R H and I Singh: Economic Development as an Adaptive Process- The Green Revolution in Indian Punjab, Cambridge University Press, C':lmbridge, 1977.
259

Desai, B M, V K Gupta and N V Namboodiri: F~o:..::o~d~----!.P--,r:....;::;o..;:c,-"e::..:s:..::.s..:.i,","n..:.Jg ..... Industries - Development and Financial Performance, Oxford & IBH, New Delhi, 1991.
Dhar, P Nand H F Lydall; The Role of Small Scale Enterprises in Indian Economic Development, Asia, Bombay, 1961.
Dogra, B; Punjab Grass-roots Problems and Solutions, Shahid Bhagat Singh Research Committee, Ludhiana, 1988.
E d war d s , E a ( e d. ); E m p...:.l~o:..y<....:.:mc.::e:..!.n.!...t.::----:i:..:n:..:.----"D"-e~v-=e,-,l,-o=-..::p..:.i,-,,n.!...gl:L---!N..:...a::;....;:t..:.i:...,:o:,;n:..:=.s , Columbia Univ. Press, London, 1974.
Eicher, C K and J M Staatz (eds.): Agricultural Development in the Third World, John Hopkins Univ. Press, London, 1984.
Eugene, S; The Future of Underdeveloped Countries, Harper ~
Bros., New York, 1954.
Ghosh, R N; Agriculture in Economic Development (with special reference to Punjab), Vikas, New Delhi, 1977.
Gil I, K S:·Employment and Unemployment in Punjab- in P R Brahmananda and L K Deshpande (eds.) ;Employment Policy in a Developine Country A case study of India, Macmillan, London, 1983.
Gill, S S; - Capitalism in Punjab Agriculture- in Johar and Khanna (eds.): Studies in Punjab Economy, Punjab School of Economics, Guru Nanak .~ev University, Amritsar, 1983.
Goldar, B N -Relative Efficiency of Modern Small Scale Industries in India-, in K B Suri (ed.); Small Scale Enterprise in Industrial Development, Sage, New Delhi, 1988.
Goodman, D et al: From Farming to Biotechnology - A Theory of Agro-Industrial Development, Basil Blackwell, Oxford, 1987.
Gupta, DB: Rural Industry in India - The Experience of the :....P--=u::..:n-'--'-j=a:..::b'---'-'R:..::e:....lg:>.....:..i-=o~n. I nsti tute of Economic Growth Occas ional Paper, New Series, No 7, Hindustan Pub. Corp., Delhi, 1982.
Hamilton, FElan (ed.) ;Industrialisation in Developing and Peripheral Rep,ions, Croom Helm, London, 1986.
Hi I I , B E Agriculture,
and K A I n g e ,~ sen t : !..!A..!.n=--~E-=c!..!o~n:..!-=oc.:.:m~l=-· c=--.-..!A..!.n:..!-=a:..:l,"",y,-,s::...::i..::s,--o~f Heinemann, Lond.)n, 1977.
Hadimani, R N: Dynamics of Industrial Entrepreneurship, Ashish, New Dolhi, 1985.
26'
Hansra, B Political
S and A N Shukla Impl ications of
(eds. ,: Social, Economic and Green Revolution in India,
Classical, New Delhi, 1991.
Harriss. J:-Agriculture/Non-Agriculture Linkages and the Diversification of Rural Economic Activity: A South Indian Case Study-, in J Breman and S Mundie (eds.':Rural Tra.nsformation in Asia, Oxford University Press, Delhi, 1991.
Hayami, Y: Japanese Agriculture under Seize - The Economy of Agricultural Policies, Macmillan, London~
Political 1988.
Hazel I, P Band S Haggblade: Rural-Urban Growth Linkages in India, World Bank Working Paper No. 430, May, 1990.
Hirschman, A O:The Strategy of Economic Development, Univ. Press. New Haven. Conn, 1958.
Hoffman, W University
G: The Growth of Press, India Branch,
I nd lolS t ria I 1958.
Economies,
Yale
Oxford
Indian Council of Social Science Research Research in Economics, Vol. 5, New Delhi,
( ICSSR) 1975.
Survey of
Johar, R Sand J S Punjab School of
Khanna (ads.': Studies in Punjab Economy, Economics, Guru Nanak University, Amritsar
( Pun jab', 1 983.
J oh 1 • S S: Research in Chandigarh,
Future Rural
1988.
of Agriculture and Indus t ria I
in Punjab, Centre for Development (CRRID),
J 0 h n s ton, BFa n d P K i I by: A:...:..o:g..,r:.....:..i ..:::c....::u"-'l:....t=u'-.::.r....::e::..---=a::..!n.:..;d~---=S~t.:..r....::u"-'c,...t=u:...:r....::a~1 Transformation Economic Strategies in Late Developing Countries. Oxford University Press, London, 1975.
Jones, E L: Agriculture and Blackwell, Oxford. 1974.
Industrial Revolution, Bas i I
Kainth, G Sand R S Bawa: Economic Development and Structural Change - An Empirical Investigation, Inter-India, New Delhi, 1985.
Kaur, H: Political Consequences of Agricultural in India, Anmol, New Delhi, 1988.
Devslopmsnt.
Khusro, AM: Transfer, Asia,
E con am i c D e=-:...v~e....::l....::o,...p=m:.;:e,.",n:..:...::t~....:w~i....::t:..:.h.:..--_..:.N:....:o~....:.P.-;o::u:::p..::u:...:l....::a:...:::t..:i....::o,.",n~ Bombay, 1962.
Kilby, P: Entrepreneurship and Economic Development, The Free Press, New York, 1971.
261
Krishna Rao, Y V:wGrowth of Capitalism in Agriculture - A Case Study of Andhra Pradesh, in Y V Krishna Rao et. al (eds.): Peasant Farming ·3.nd Growth of Capital ism in Agriculture, Vishalandhra, Vijayawada, 1984.
Kumar, R C:~ricultural Surolus, Variable Land and Long-run Growth in an Open Economy, RIS Occasional Paper No. 15, Research and Information Systems for the Non-Aligned and Other Developing Countries, New Delhi, 1987.
Kuznets, S: ~odern Economic Growth Spread, Yale University Press, London,
Rate, Structure 1966.
and
Lele, IJ J: Foodgrain Marketing in India - Private Performance and Publ ic Pol~, Cornell Univ. Press, London, 1971.
Little, M D, D Majumdin and J M Page Jr. Manufacturing Enterprises - A Comparative Study of Other Economies, Oxford UniverSity Press, New York,
Smai I India and 1987.
Mahajan, V S : Indian Economy and Regional Development, & Deep, New Delhi, 1983.
Deep
Mahajan, V S: Growth of Oilseeds and AI lied Industries in India, Deep & Deep, New Delhi. 1985.
Mathur, D P and V K Gupta: Management of Co-operative Rice Mills, CMA Monograph No. 99, Centre for Management in Agriculture (CMA). Indian Institute of Management (IUU. Ahmada.ba.d, 1982. .. McCrory, Studies Industry,
J T: ~mall Industry in a North Indian Town: Case in Latent Industrial Potential. Min. of Comm. and Govt. of India, Delhi, 1956.
McGuirk. A and Y Mundlak: Incentives and Constraints in the =-T..!.r....::a:.:n~s..!.f....::o~r:....m==-==a~t::..;l::...· o~n~_o~f_....:I:....)~u!.!.n!..J,L;· a=b:....-....:A!..!.ljg-.!r'-'l:;...· c~u~l:....t~u..!.r~e, I n tel' na t i 0 na I Food PolicY Research Institute (IFPRI) Research Report No. 87. IFPRl, Washington. 1991.
Mel lor, J W: The New Economics of Growth. Cornell Univ. Press, Ithaca, New York, 1976.
Moulik, T K and P Purushotham: Technoloiy Transfer in Rural Industries - Cases and Analysis, Popular, Bombay, 1986.
M u k hot e , B : !..!AcEgL!r~i ~c....::l!..;d!....!:.t~u!.!.r....::e~ __ :3.::.:n~d_....:E=mCl:p::...;l!...:o::...Ly-=m:..:e:<...n::'-"t'--_..:.i..:..n~--"'D~e"-'v'--e~l..::o:...Jp~i ~n:.Ag C Q U n t r i e 5 :3 t rat e Ii!: i e s for _.::E'-!f'-'t::....;::e..:..c:....;t:....l:;...· ~v..::e'--~Rc.::u:;...:r:....;a""-'-I_-=D=---=.e-'v--'e=-=-I ;o...a:p:..:m::..;e:....:..::n-=.t , Wes tv i e\~ press. London, 1985.
Myel'. R M :!:mploYlllenl Pot~ntial of Agro-industries, Himalaya. Delhi, 199~.
262
Nabi, I :Entrepreneurs and Markets in Early Industrial isation A Case Study from Pakistan. International Centre tor
Economic Growth. Institute for Contemporary Studies. San Francisco, Cal itornia. 1968.
Nafziger. E W: Class, Caste and Entrepreneurship - A Study of Indian Industrialists, The University Press of Hawaii, Honolulu, 1978.
Nair, K R G: Regional Experiences in a Developing Economy, Wiley Eastern, New Del hi, 1982.
National Commission on Agriculture: Vol. xii, Chapter 57 on Processing and Agro Industries.
Pandit, M L Industrial Development in the Punjab and Haryana (domination of footloose industries), B R Pub. Corpn. Del hi, 1 965 .
Papola, T S:~Rural Industrialisation and Agricultural Growth A Case Study on India- in R. Islam (ed.) :Rural
Industrialisation and Employment in Asia, Asian Employment Programme(AEP)\Asian Regional Team for Employment PromotionIARTEP), ILO, Geneva, 1967.
Punjab. Govt. of: Impact of Incentives to Set Up Industrial units in CentrallY Backward Districts of the State, Economic and Statistical Organisation Publication No. 435, Chandigarh, 1984.
Randha\Ja, M 5 Punjab, Vikas,
et. al.: Green Delhi, 1974.
Revolution - a case study of
Rangnekar, 5 Band R Malhotra: Technology for Development: Per s p e c t i v e son Nor the r n I n.:j i a - Vol. 1, C en t e r for Res ear c h in Rural and Indu5tri~1 Development, Chandigarh. Sept. 1990.
Rangar~jan, C: Agricyltural Growth and Industrial Performance in India, International ?ood Policy Research Institute (IFPRI) Research Report No. :33, IFPRI. Washington, Oct. 1982.
Rao, R M Mohan:·Comremerciali~ation and Agricultural Growth in Asia-A Comparative Study of South Korea and Coastal Andhrain J Breman and 5 MundIe (ads.) :Rural Transformation in Asia, Oxford University Press, Delhi, 1991.
Rosenberg. Nand L E Birdzell: How the West Grew Rich - The Economic Transformation of the Industrial World, Basic Books, 1986, publ ishod in India by Popular Prakashan, Bombay, 1967.
263

Saberwal, S E)(plorations, 1972.
(ed.): Beyond the Village Indian Institute of Advanced
Sociological Study, Shimla,
Saberwal, S; Mobile Men - Limits to Social Change Punjab, Indian Institute of Advanced Study, Shimla,
in Urban 1976.
Sah, A and U K Srivastava; Insight into Technology and Delhi, 1984.
Rice Bran Oil Industry -Commercial Aspects, Concept,
An New
Saith, A : Contrastina Experiences in Rural Industrialisation - Are the East Asian Successes Transferable?, Asian Regional Team for Employment Promotion (ARTEP)/lnternational Labour Organisation' JLO), Hew Delhi, 1986.
Saith, A;-Asian Rural Industrialisation - Context, Features and Strategies-, in J Breman and S MundIe (eds.): Rural Transformation in Asia, Oxford University Press, Delhi, 1991.
San des a r a , J C =S..:=i..:z=..:e=-----!:a:::.;n~d-=_....;C=a:...tp::...;l~· ..::.t.:::a..:l,---!.I.:..n!..t::..e~n~s::...;l:!!..· ..::.t.J..y_....:=:.i...:.;n~~I.:.;n:.:::d:!!..l:!!..· a=:,:.:.n industry, University of Bombay, Bombay, 1969.
S churn pe t e r , J A : .:.T.:..h!.:e:t----!T~h.:..e=o:..:r'_yL.-_....:o~f_...:E::.;c=o:.!n.!..:o=m~i~c~_...!:D.:...;e~v..!:e:...;I~o=-a:::p;.::m!.:e::...!n~t (Original, 1911), Harvard Univ. Press, Cambridge, 1934 (Translated by R Opiela
Shand, R T (ed.): Off-Farm employment in the development of rural Asia - Vol. 2, National Centre for Development Studies, Australian National Universi~y, Canberra, 1986.
Sharma, K L: Entrepreneurial Performance in Role Perspective, Abhinav, New Delhi, 1975.
Sharma., C P: Deep & Deep,
Industrialisation and Regional Development, New Delhi, 1986.
Sharma, K Land Harnek Singh: Entrepreneurial Growth and Development Programmes in Northern India, Abhinav, New Delhi, 1980.
Sharma, R A: Entrepreneurial Change in Indian Industry,Sterling. New Delhi, 1980.
Shiva, V: The Violence of the Green Revolution - Ecological Degradation and Political Conflict in Punjab, Research Foundation for Science and Ecology, Dehra Dun, 1989.
Sims, H: Pol iUcal Regimes, PublIc Pol icy and Economic Developrnent- Agricultural Performance and Rural Change in the Two Punjabs, Sage. New Delhi, 1988.
264
Singer, M: When A Great Tradition Modernises, Praeger, New York, 1972.
Singh, G: ·Green Revolution, Punjab Economy and Punjab Crisis·, in B S Hansra and A N Shukla (eds.) :Social, Economic and Pol itlcal Implications of Green Revolution in India, Classical, Ne\l Delhi, 1991.
Singh, I: The Grea t Ascen t - The Rura I Poor in South As i a, The Johns Hopkins Univ. Press, Baltimore, 1990.
Sin g h , N: S h a I' i n g 0 f Pr 0 due t i v i t y G a ins i n I n d I a n I n d us try, B R Pub. Corpn., Del hi, 1984.
Singh, Del hi,
P: Emerging Pattern 1983.
in Punjab Economy, Sterling, New
Sundram, R M: Growth and Income Distribution in India Policy and Performance since Independence, Sage, New Delhi, 1987.
Surender, V: Indian Industries - A Study in Growth, Structure and Location, B R Pub. Corpn., Delhi, 1986.
Sutcliffe, R. B: Industry 1971.
and Underdevelopment, Addison Wesley, London,
Taub, Scale
R Pan d D PTa u b: E n-,-,,-t~r~e:..Jp~r.!::e'-!.n~e=-=u'-!.r...:s:...:h~i ~p:....-~i~n!..--l!...;n~d~i~a~· ~s~S:!Cm=a~l,-,l!...; Industries, Manohar, NI~w Delhi, 1989.
Thakur, S Y: Industrialisation and Economic Development - an appropriate strategy for the underdeveloped, Popular, Bombay, 1985.
Thapar, S D • The Green Rev 0 I ut i on and its Employment in the Tertiary !>ector - A case study and Haryana", in R G Ridkar and H Lubel I (eds.) and Unemployment Problems 03 the Near East and Vikas, New Delhi, 1971.
Impact on in Punjab
Employment South Asia,
United Nations Industrial Development Organistion (UNIDO): Food Processing Industry, UNIDO Monograph on Industrial [I eve lop men t No.9, Vie n n a , 1 !3 6 9 .
United Nationc Industrial Davelopment Organisation (UNIDO): Industry in a Changing World. United Nations, New York, 1983.
United Nations Industrial Development Organisation (UNIDO): Rjce Bran - An Underutil is.~d Raw Material, United Nations, New York. 1985.
265

Venkaiah, V: Impact of Agro-Based Industries on Rural Economy - A Case Study, Himalaya, Delhi, 1987.
Verma, H S: Indusrial Families in Nature of their Entrepreneurship,
India- An InquirY Concept, New Delhi,
into the 1987.
V Y as u I u, V : P~a:..!.r...!:a:..:d::..o=)(_....:o~f _---'S~t.::a:....::t:....:i:...;c=----"C'-'h.:.:a::..:....:.n...,g....:::...e Underdevelopment, Sterl ing, New Delhi, 1977.
Lectures on
Vyasulu, V: Development of Backward Areas - Decentralized Production and Regional Development, Yatan, New Delhi, 1988.
Weber, A: Theory of Location of Industries, 1909, f'ranslated by C J Fredrich, Chicago Univ. Press, Chicago, 1929.
Weber, M: The Religion of India - The Sociology of Hinduism and Buddhism, The Free Press, New York, 1958.
Weiss, J: Industry in Developing Countries- Theory, Policy and Evidence, Croom Helm, New York, 1988.
World Bank: The Employment Impact of Industrial Investment -A Preliminary Report, World Bank Staff Working Paper No. 255, Washington. June, 1977.
Reports and Mimeographs
Agricultural Credit Review Committee, (Chairman: A M Khusro): A Review of the Agricultural Credit System in India. Reserve Bank of India, Bombay, 1990.
Chauhan, K K S, P V Krishna, N P Singh and N Mohanan: An Agri-business Study of Rapeseed-Mustard Syste., CMA Monograph No .. 52, Centre for Management in Agriculture, Indian InstitlJte of (1anagement, Ahmedabad, 1974.
George, P S and V V Choukidar: Dynamics of the Paddy-Rice System in India, CMA Monograph No. 42, Centre for Management in Agriculture, Indian Institute of Management, Ahmedabad, 1973.
Gil I, M S:Develop •• nt of Agriculture in Punjab 1977-6., Centre for Monitoring Indian Economy, Bombay, 1981.
Grewal S 5, in Punjab, Agricultural
D 5 Sidhu and M S Sidhu: A Study of Far. Inca ••• De pt. 0 f E c ':>0 0 m i c san d Soc i 0 log y , Pun jab University, Ludhiana, Sept. 1990.
Grewal,SS, D 5 Sidhu, and P 5 Rangi: An AnalYSis of Far. Incomes in Punjab, Dept. of Economics and Sociology, Punjab A g ric IJ I t I.J r a. I I) n i v e r 5 i t y , L I) d '1 ian a , 1 981) .
266
Gupta, V K and P S George: Modernisation of Rice Processing Industry in Punjab, CMA Monograph No. 54, Indian Institute of Managemen t, Ahmedabad, Oc t. 1974.
HazlehlJrst, L W: Entrepreneur.ship and the Merchant Caste. in a Punjab City, Duke I)niversi~y Press, DIJrham, (Monograph and Occas i ona I Pape rs Sari es No. 1), 1966.
Hundal, P S:Entrepreneurial Motivation and Its Structure, Dept. of Psychology, Guru Nanak University. Amritsar, 1977.
Institute of Applied Manpower Research (IAMR): Eaployaent Study of the Grain Milling and Vegetable Oil IndustrY - Vol. 1, Small Sector, IAMR Report No. 12/1979, New Delhi, 1979.
Mody, A: Financing of Modern Economic Growth - The Historical Rola of Agricultural Resources, Centre for Development Studies (CDS) Working Paper 110 121, CDS Trivandrum, 1981.
Moulik, T K, S K Basu and M 5 Patel: Rural Entrepreneurship -Motivations and Constrainta (A study in Anand taluka, Gujarat), CMA Monograph No. 70, Centre for Management in Agric:ulture, Indian InstitutEI of Management, Ahmedabad, 1978.
National Council of Applled Economic Research (NCAER): Perspective Plan for the Industrial Development of Punjab-1977/78 to 1987/86, Unpubli~hed Report, NCAER, New Delhi, 1984 (Sponsored by the Govarnment of Punjab).
Punjab, Government of: Div~rsification of Agriculture in Punjab, Johl Committee RElport IChairman: S 5 Johl), Chandigarh, May, 1986.
Punjab, Haryana and Delhi Ch~mber of Commerce and Industry (PHDCCl): Punjab Econoay, Basefile, New Delhi, July 1987.
Thapar, S D: Industrial E~ployment in Punjab and Haryana 1966-1969: Change in a Peroid of Geueral Economic Rece.sion and the Green Revolution, United States Agency for International Development (USAID), New Delhi, July 1972. (Mimeographed)
Timberg, T A: Industrial Communities of India: Development Report No. 1969.
Entrepreneurship a.ong the Trading How the Patterns Ditfer, Economic
136, Harvard Univ. Cambridge, July,
Vokes, R W Processing in
A with R J G Wei is and L J Fredricks: Rice Kedah Malaysia - An Economic and Technical
Survey, Asian Monog raph No. Bangkok, 1982.
Institute of Technology (AIT) Research 2, TI-:.- Human Settlements Division, AIT,
267
Journal Articles
Alam. J: ·Pol itical Impl ications of Economic in Punjab·. Social Scientist. Vol. 15. No. 10.
Contradictions Oct. 1986.
Ashoff. G:·The Historical Development Pattern of Small Industrialised Countries as a Model for Today's Small Developing Countries?· Economics. Vol. 44. edited by the Institute for Scientific Co-operation. Tubingen.
Bagachwa. M S D:·Choice of Technology in Firms: Grain Milling in Tanzania-, World 20. No.1. January, 1982.
Smal I an~d Large Development, Vol.
Baumol. W J :. Entrepreneurship: Productive, Unproductive and Destructive·, Journal of Pol itical Economy Vol. 98, No.5, Part 1, Oct. 1990.
Bawa. R Sand M K Sharma:· An Analysis into the Inter-district Variations in Industrial Development in Punjab-, PSE Economic Analyst, Vols. 3 and 4. Nos. 1 and 2, Dec. 1982 and June, 1983.
Bhal la, G S:·Problems and Pro=ess of Industrialising Punjab·, PSE Economic Analyst, Vol. II. No.1, 1981.
Bharadwaj, K: 'Regional Differentiation in India', =a"'-n:..,:d::........;P:........:o;..::I'-'l:..· ..=;t.,:i..;:c;..;:a:;;...:..l_-'W;:...e=-=e....:;k""'l;....y..... Vol. x vii. Nos. 1 4. 15, 16, Number, April 1982.
Economic Annual
Bhatia. B S:· New Industrial Entrepreneurs - Their Origins and Problems·, Journal of General Management Vol. 2, No.1. Autumn. 1974.
Buss, A:' Introduction' and • Max Weber' 5 Contributions to Questions of Development in Modern India·, Journal of Developing Societies, Vol. 1, December 1985.
Cartiller, M:· Role of Smal j Scale Industries in Economic Development: Irrigation Pumpsets Industry in Coimbatore W
,
Economic and Pol itical Weekly. Vol. 10, Nos. 44 & 45, Nov. 1, 1975.
Chadha V and R S Johar :·Indulitrial Development of Punjab Pattern. Problems and Perspuctives·, PSE Economic Analyst, Dec. 1980.
Chaurasia. R. P K Sharma and D S Tiwana:· Agricultural Land Use Under Major Crops in Punjab-, National Geographic Journal of India. Vol. 37, Part 4, December. 1991.
268

Child, F C and H Kaneda:-Links to the Green Revolution- A Study of Smal! Scale AgI icultural Iy Related Industry in P3kistan Punjab-, Economic Development and Cultural Change, Vol. 2.3, Jan. 1975.
Crow. B:-Plain Tales from the Rice Trade Indications of Vertical Integration in Foodgrains Markets in Bangladesh-, The Journal of Peasant Studies. Vol. 16, No.2. Jan. 1989.
Dellimore, J H:·Select Issl:es in Agro-Industry- 11), Social and Economic Studies, Vol. 28, No.1, March 1979, Special Number.
Desai. A V:·The Slow Rate of IndustrialisationLook-. Economic and Pol iticsl Weekly. Vol. xix. Nos. 33. Annual Number. Aug. 1984.
A Second 31, 32 &
Desai. 0 K and A V S Narayanan:- Impact of Modernisation of Dairy Industry on the Economy of Kaira District (Gujarat), Indian Journal of Agricultural Economics, July-Sept. 1967.
Dhawan, B D:-Location Fruits and Vegetables-,
of Agro-Industries Artha Vijnana. Sept.
Case Study 1969.
of
Dholakia, R H:-Re€ional Aspects of India·, Economic and Political Weekly, 18, 1989.
Industrialisation in Vo I. 24, No. 46, Nov.
D'Souza. Victor S:-Economy, Caste, Religion and Population Distribution - An Analysis Df Communal Tensions in Punjab-, Economic and Political Weeklt., Vol. xvii, No. 19, May, 1982.
George. T K and T Joseph:- Rubber-Based Industrialisation in Kerala -An Assessment of Missed Linkages·, Economic and Political Weekly, Jan. 4-11, 1992.
Gill, K K and S S Gill:-Agricultural Industrialisation in Punjab - some issues Pepsi modele, Economic and Political Weekly,
Development and related to the
Nov. 10, 1990.
Gi II, S S :-Contradictions ot Punjab Model of Growth - A Search tor an Alternative-, Economic and Political Oct. 15, 1988.
Weekly,
Guha, A:-Parsi Seths as Entrepreneurs 1750 -1850-, Economic =a..:.;n:..;:d:........;P'-.:::o:....:l~l:...·~t..:i...!:c~a~I __ ....:W=-e=e..:;k~I~.Vol. 3~;, (Review of Management), Aug. 29, 1970.
Hajra, S :·Firm Size ane! Industries·, Economic Ueekly,
Efficiency in Aug. 28, 1965.
Manufacturing
269
Harriss, B:-Ragional Growth Linkages from Agriculture and R~source Flows in Non-Farm Economy-, Economic and Political W~ekly, Vol. XXII, Nos. 1 8c 2, Jan. 3 -10, 1987.
and Sri Lanka - A Harriss, revi~w
Science,
B:-Paddy Processing in India of the case for technological
Va 1. 16, No.3, 1976. innovation- Tropical
Ho, S P S:-Economic Development and Rural Korea and Taiwan-, World Dev~lopment, Vol.
Industry in South 10, No. 11. 1982.
Hwa, E C:-The Contribution o~ Agriculture to EconomIc Growth - Some Empirical Evidence-, Uorld Development, Vol. 16. No. 11, Nov. 1968.
Indian Journcd of Asrlcul tlJral Economics, Vol. 21, No •• , Conference Number, Oct-De(~ 1966 (For articles on Location of Agro-Processing Industril~s).
Indian Journal of Asricultl~ral Economics, Jan-March 1960, (for articlos on Impact of Industries on Rural Economy).
Vol. XV, No.1, Agro-Processing
International Social Scienco Journal, Vol. xxxvii, No.3, UNESCO, 1985. (for articles on food systems including food industry, technology and MNCs in food processing)
Kahlon, A Sand M V George:-l'he Role of Processing Industries in Agricultural Marketing Integration-, Indian Journal of Agricul tural Economics, Vol. xxi, No.4, Oct.-Dec., 1966 (Conference Number).
Kamala, G V and S M Khot:-Policy Vacuum in Agro-Processing Industries-, Indian Journal of Agricultural Economics, Vol. 27, No.2, April-June 1972.
Koppel, Band R E Peterson:-Industrial Entrepreneurship in India -A Re-evaluation-,The Developing Economies, Vol. xiii, No.3, Sept. 1975.
Lamb, H B: ·The Indi3n BusinESS Communities and the Evolution of an Industrial Class·, Pacific Affairs Vol. xxviii, No.2, June, 1955.
Leaf, M J :-The Green Revolution and Cultural Punjab Vii lage 1965-78-, Economic Development Chang~, Jan. 1983.
Change in a and Cultural
Lele, U J: -Modernis~tion of the Rice Milling Industry Lessons from Past Performance·, Economic and Political Weekly, July 11, 197".
270

Livingstone, I :-Resource-Based Industrial Development: Past Experience and Future Prosp~cts in Malawi", Industry and Development, No. 10, UNIDO, Now York, 1984.
Macrae, J:-The Relationshlp Between Agricultural and Industrial Growth, with Special Reference to the Development of the Punjab Economy from 1950 to 1965-, The Journal of Development Studies, Vol. 7, tlo. 4, July, 1971.
Mahadeva.n, Entrepreneurs Economic and Feb. 4, 1978.
R:-Patterns of Enterprise of Immigrant
Maitra, between Japan" , 1991.
- A Study of Chettiars in Malaya 1880-1930-, Pol itical Weekly .. , Vol. 13, Nos. 4 & 5, Jan. 28 -
P:-Technology Change and the Question of Linkage Industry and Agriculture - Case Studies of India and
The Asian Economic Review, Vol. xxxiii, No.!. April,
Mathew, E T:"The Role of Pro~essing of Agricultural Produce in Indian RUI'al Economy-, Jndian Journal of Agricultural Economics, Vol. 15, No.1, Jan-March, 1960 (Conference Number).
Mishra, M L :wlmpact of Public Policies on Industrial Entrepreneurship in India-, The Indian Journal of Commerce Vol. xix, Part 1, No. 66, Jan - March, 1966.
NishI'a, G P:·On the Question of Relationship betyeen Agricultur·al Surplus and Economic Development-, Asian Journal of Economics and Social Studios, Vol. 7, No.3, July, 1988.
Mitra, A:·Structural Aspect~;
Analysis·, The Indian Journal 3, 1989.
of Growth A State-Level Vol. 2, No. of Social Science,
Morris, H D:-Values as an Obstacle to South Asia A Historical Survey-,
Economic Growth in Journal of Economic
Historv, Vol. xxvii,No. 4, Dee. 1967.
Mundie, S:·The Agrarian Journal of Peasant Studies,
Bar'rier O(:tober,
to Industrial 1985.
Growth-,
Nadkarni. M V:·Crisis of Incruasing Costs in Agriculture - Is There a Way Out ?-, Economic l( Political Weekly, Vol. xxiii, No. 39, Revie .... of Agriculture, Sept. 1988.
Nandy, A:-Entrepreneurial Cultures and Entrepreneurial Men", Economic and f'olitical lJeekl..x.,VoJ. 8, No. 47, Review of Management, Nov. 24, 1973.
271

Narayana, D:-Directed Credit Narasimham Committee Report-, Vol. 27, No.6, Feb. 8, 1992.
Programmes - A Critique of Economic and Political Weekly,
Pandit, D P:·Creative Response in Indian Economy - A Regional Analysis-, The Economic Weekly, Vol. ix, No.8, Feb.23. 1957 and Vol. ix, No.9, March 2, 1957.
Pandit, M L: - Some Less Known Factors Behind Recent Industrial Changes in Punjat· and Haryana-, Economic and Pol itical Weekly, Vol. 23, No. 47, Nov. 25, 1978.
Raj, K N:-Growth a.nd Stagnation in India's Industrial Development-, Economic and Political Weekly, Annual Number. Feb. 1976.
Raj, K N: -Linkages in Strategy -Some Basic Planning, No.8, 1975.
Industrialisation and Issues-, Journal of
Development Development
Rao, K SHand D G Sumithra:-Planning and Growth of Industrial Entrepreneurship in lndia-, The Indian Journal of Commerce Vol. xviii, Part iv, No. 65, Dec. 1965.
Rao, P V S:-Development of Agf'o-based and Rural Industries·, Andhra Pradesh Industry Handbook, 1984.
Rao, V K R V:-Balance Betweun Agriculture and Industry in Economic Development-, The Indian Economic Journal, Vol. 34, No.2, Oct-Dec 1986.
Roy, P:-Transition in Agriculture - Empirical Indicators and Results (Evidence from Punjab)·, Journal of Peasant Studies, Vol. 8, 1981.
Ruivenkamp, G:-Social Imp<:,cts of Bio-technology on Agriculture and Food Processing Industries·, Development, No. 4, 1987.
Saini, A K:-Sp&tial Changes in Agricultural Productivity in Punjab 1965/66 to 1985/86·, National Geographic Journal of India, Vol. 37, Part 4, December, 1991.
Sandesara, J C:-Small Experience-, Economic 13, March 26, 1988.
Scale Industrialisation- The Indian and Political Weekly, Vol. xxiii, No.
Sandesara, Strategy-,
J C :-Search for an Employment-Oriented Growth Economic and Political Weekly, May 26, 1990.
272
Sau, R:·The Green Revolution and Industrial Growth in India -A Tale of Two Paradoxes and a Half·, Economic and Political Weekly, Vol. xxiii, No. 16, April 16, 1988.
Sethi, J D:·The Dynamics of Agro-based Industry and Economy for RIJral-Urban Linkages·, lASS! Quarterly, Vol. 10, No.1, JIJI y-Sept. 1991.
Shetty, Recent 1990.
S L:-Investment Trends· Economic
in and
Agriculture- Brief Political Weekly,
Review of Feb. 17-24,
Sidhu. D Sand Productivity in Political Weekly, Dec. 28, 1991.
D Byerlee:- Technological Change and Wheat Post- Green Revolution Punjab-, Economic and
Vol. xxvi, No. 52, Review of Agriculture,
Sidhu, M S. R S Deol and A S Bhul lar:-Pattern of Disposal of Marketable Surplus of Wheat in Bathinda District of Punjab-, Journal of Research, Vol. 25, No.3. Sept. 1988.
Sines. R:-Finanacial Deepeoing and Industrial Production - A Micro-Economic Analysis of the Venzuelan Food Processing Sec tor - , Soc i a I and E con 0 ,n i cSt u die s, V 0 I . 28, No.2, J un e , 1979.
Singer, Journal
M:WMax Weber and the of Developing Soci.ties.
Modernisation of India·, Vol. I, December 1985.
Singh, Land K Industrial Work Jan-March, .1988.
S Bhangoo:·Changes in Force in Punjab-, Margin,
the Structure of Vol. 20. No.2,
Singh, S:-Non-farm Employment Indian Journal of Labou,~
in Punjab - A Perspective·, Economics, Vol. 34, No.
The 1,
J an- March, 1991.
Singh, Sand Vinod Vyasulu:-Growth and Structure of Food Processing Industry 'in the Punjab in the Eighties-, Indian Journal of Agricul tural Economics, Vol. XLV. No.4, Oct -Dec. 1990.
Spodek, H:wTraditional Culture and Economic and Po! Itical IJneklyL_Vol. iv, Managemerlt, Feb. 22, 1969.
Entrepreneurship·, No.8, Review of
Srivastava, U K:-Agro-processing Industries- Potential, Constraints and the Task Ahead-, a Keynote paper in The Indian Journal of Agricultural Economics, Vol. XLIV, No.3, July-Sept. 1989, ConferenC(l Number.
273
Swamy, D 5 and Ashok Gulati:·From Prosperity to Retrogression-Indian Cultivators during the 1970s· Economic and Political Weekly, Vol. xxi, Nos. 25 and 26, Review of Agriculture, June 21-28, 1986.
Tewari, R T:India 1971-8P, Oct.-Dec. 1988.
Inter-Regional Pattern of Industrialisation 1n Indian Economic Journal, Vol. 36, No.2,
Tr i pa th i, Perspective week I y Vo I.
D:-Indian Entrepreneurship in Historical - A Re-interpretation-, Economic and Political
vi, No. 22. Review of Management, May 29. 1971.
Unni, J:-Regional Variations in Rural Non-agricultural Employment - An Exploratory Analysis·, Economic and Political Weekly, Vol. XXVI, No.3, Jan. 19, 1991.
Upadhya, Pradesh-, 1988.
C B:-The Farmer-Capitalists Economic and Political Weekly,
Wall, D.: -Processing Prim;~ry Products Cas eSt ud i e s·, F:....::o:..:r:...;e:...::.i ... g .... n"'---:.T...:r:...;a=-d:::..:e'--~R:.!:e:...;v'-=-i .:e.=w , April-June, 1987.
of Coastal Andhra July 2 and July 9.
- A Review of Some Vol. XXI I. No.1,
Whitehead, J A: Select IsslJes and Economic Studies, Vol. 28, 1979.
in Agro-Industry (2), Social No.1, Special Number, March
Unpublished Theses/Papers
Basant, Rand H Joshi :Divel'sification of Employment in an Agriculturally Developed Reg[on - So.e Evidence fro. Rural Kheda, Gujarat, The Gujar.:tt Institute of Area Planning Working Paper No. 33, Gujal'at Institute of Area Planning. Ahmedabad, March 1991.
Dantwala. M L: Eller,in, Ch~ll.nges in Indian AcricuJture. paper presented at the ~ational Seminar on -India-The Emerging Challenges-, held at the Institute for Social and Econom i c Change, Banga lore. (IC lobar 5-7. 1988.
Mahadevan, R:-Entrepreneur&hip and Indian Industrialisation in Historical Perspective-, paper presented at the seminar on - Indian industrialisation- at the Centre for Development Studies, Trivandrum during J~ne 9-12, 1987.
Rangi, P S:An Economic AnalYSis of Marketing and Proce.sing of Rice in the Punjab State, Unpublished Ph D thesis, Dept. of Economics, Punjabi University, Patiala, 1986.
274 '.
Singh, L:lndustrial DeveloplI .. nt in Punjab-An Analyaia of Growth of Produutivity and Structure of Wace., Unpublished Ph D thesis, Dept. of Economics, Punjabi University, Patiala ( Pun jab), 1990.
Singh, S:Bicycle Industry in India- A Study of Localisation. Production and Market Structure. Unpublished M Phil. Dissertation, Jawaharlal Nehru University. New Delhi. 1989.
Singh. S: Growth and Prospects of Agro-based Industries in Punjab - A case study of Nabha. M Phil Dissertation. Dept. of Economics. Punjabi Univ. Patiala (Punjab). May 1983.
Srivastava, U K:-Agro-processiog- Emerging trends, Strategies for Development and Issues in relation to Decentralised Sector-. a paper preser-' ed at the regional pol icy seminar on -Rural Industrialisation a1d Agro-based Activities Approach. Policy and Strategy-, organised by the National Bank for Agriculture and Rural Development (NABARD) at the National Institute of Small Industry and Extension Training, Hyderabad during Feb. 1-3. 1989.
Vyasulu, V:-Thu Non-Farm Sector in the Indian EconollYTowards a Long term Research ~rogramme-. a Background Paper for the National Consultation on -Identification of Research Priorities in the Non-farm Sector-, held at the Institute for Social and Economic Change, Bangalore on Jan. 9-10. 1992.
Newspaper Articles
Ahluwalia. J and K Srinivasan:-Jncome and Growth - A Regional Profile (1), and (2) Punjab tops Industrialisation-, The Economic Times, Bangalore. Feb. 25-26. 1988.
Data Sources
Centre tor Monitoring Indian Economy (CMIE): Agricultural Production in Major States:l967-68 to 1988-69, Crop-wise Data, Centre for Monitoring Indian Economy. Bombay, April. 1990.
Centre for Monitoring Districts - Parts 1 & 2.
Indian Economy Bombay. July,
(CM IE) : 1985.
Profiles of
Centre for Monitoring Indian Economy (CMIE) District Level Data for Key Ecunomic Indicators, Bombay, 1985 and 1987.
Centre for Monitoring Indian Economy (CMIE): Basic Statistics Relating to Indian Economy, :)01. 2, States. Bombay, Sept. 1990.
275

Gazetteer of Ludhiana District, 1904, reprinted in 1985 by B R Publ ishing Corpn., Delhi.
Gazetteer of Patiala State, 1904, reprinted Publ ishing Corpn., Delhi.
in 1985 by B R
India, Government of: Annual Survey of and Census Sectors -Various years, Organisation, New Delhi.
Industries - Factory Central Statistical
India, Government of: Directory Manufacturing Establishments Survey. 1978/79 and 1984/85 Detai led Results, Central S tat i 5 tic a lOr g ani sat ion, De par t men t 0 f S tat i s tj c s, Min i s try of Planning, Nov. 1989 (1984/85).
Punjab District Gazetteer - Ludhiana, 1970, reprinted in 1985 by B R Publishing Corpn., Delhi.
Punjab, Government of: Statistical Abstract of Punjab Various years, The Economic Adviser, Chandigarh.
276