Embed Size (px)
DESCRIPTION
2010 Annual Report of the Treasurer for the State of CT. Shows that the CT Short-term Investment Fund holds securities in GSAA HET 2005-15, Tranches 2A1.
Citation preview

2010
ANNUAL REPORT OF THE TREASURER
For the fi scal year ended June 30, 2010
STATE OF CONNECTICUT

STATE OF CONNECTICUTOffi ce of the State Treasurer
The State Motto “Qui Transtulit Sustinet,” (He Who Transplanted Still Sustains), has been associated with the various versions of the state seal from the creation of the Saybrook Colony Seal.

OFFICE OF THE STATE TREASURER, DENISE L. NAPPIER 1
2010
ANNUAL REPORT OF THE TREASURERFor the fi scal year ended June 30, 2010
STATE OF CONNECTICUT

2 FISCAL YEAR 2010 ANNUAL REPORT

OFFICE OF THE STATE TREASURER, DENISE L. NAPPIER 3
ANNUAL REPORT OF THE TREASURERTABLE OF CONTENTS
IntroductionTREASURER’S LETTER TO THE GOVERNOR ......................................................................................7
TREASURY OVERVIEW .....................................................................................................................9
Division OperationsPENSION FUND MANAGEMENT DIVISION
Letter from the Chairman of the Investment Advisory Council .........................................13 Investment Advisory Council .............................................................................................15 Division Overview .............................................................................................................16 The Year in Review ...........................................................................................................20 Total Fund Performance ......................................................................................20 2010 Management Initiatives ..............................................................................22 Proxy Voting and Corporate Governance............................................................23 Asset Recovery and Loss Prevention .................................................................24 Combined Investment Funds-Total Return Analysis (%) .....................................28 Liquidity Fund ...................................................................................................................29 Mutual Equity Fund ...........................................................................................................33 Core Fixed Income Fund ..................................................................................................37 Infl ation Linked Bond Fund ...............................................................................................42 Emerging Market Debt Fund .............................................................................................46 High Yield Debt Fund ........................................................................................................50 Developed Market International Stock Fund .....................................................................54 Emerging Market International Stock Fund .......................................................................58 Real Estate Fund ..............................................................................................................62 Commercial Mortgage Fund .............................................................................................67 Private Investment Fund ...................................................................................................71DEBT MANAGEMENT DIVISION
Division Overview .............................................................................................................77 The Year in Review ...........................................................................................................79CASH MANAGEMENT DIVISION Division Overview .............................................................................................................83 The Year in Review ...........................................................................................................84 Short-Term Investment Fund ............................................................................................86UNCLAIMED PROPERTY DIVISION
Division Overview .............................................................................................................90 The Year in Review ...........................................................................................................90SECOND INJURY FUND DIVISION
Division Overview .............................................................................................................92 The Year in Review ...........................................................................................................93CONNECTICUT HIGHER EDUCATION TRUST Description of the Trust .....................................................................................................95 The Year in Review ...........................................................................................................96 CHET Advisory Committee ...............................................................................................98
TABLE OF CONTENTS

4 FISCAL YEAR 2010 ANNUAL REPORT
Financial Statements CERTIFICATION BY AUDITORS OF PUBLIC ACCOUNTS AND STATE COMPTROLLER ............................................................................... F-1
MANAGEMENT’S DISCUSSION AND ANALYSIS .................................................................. F-4
MANAGEMENT’S REPORT ............................................................................................... F-12
COMBINED INVESTMENT FUNDS
Statement of Net Assets ................................................................................... F-14 Statements of Changes in Net Assets .............................................................. F-15 Notes to Financial Statements ......................................................................... F-17 Financial Highlights .......................................................................................... F-34 SHORT-TERM INVESTMENT FUND
Statement of Net Assets ................................................................................... F-37 Statements of Changes in Net Assets .............................................................. F-38 Notes to Financial Statements ......................................................................... F-39 List of Investments .......................................................................................... F-45 Schedule of Annual Rates of Return ................................................................ F-47 Schedule of Quarterly Rates of Return ............................................................ F-48 SHORT-TERM PLUS INVESTMENT FUND
Statement of Net Assets ................................................................................... F-49 Statements of Changes in Net Assets .............................................................. F-50 Notes to Financial Statements ......................................................................... F-51 List of Investments .......................................................................................... F-55 CIVIL LIST PENSION AND TRUST FUNDS Schedule of Cash and Investments, Balances and Activity ............................. F-56 NON-CIVIL LIST TRUST FUNDS
Statement of Condition (at Fair Value) ............................................................. F-57 Statement of Revenues and Expenditures ....................................................... F-57 Statement of Changes in Fund Balance........................................................... F-57 Statement of Cash Flows ................................................................................. F-58 Statement of Condition (at Cost) ...................................................................... F-59 Notes to the Financial Statements ................................................................... F-60 SECOND INJURY FUND Statement of Net Assets ................................................................................... F-61 Statement of Revenues, Expenses and Changes in Fund Balance ............... F-62 Statement of Cash Flows ................................................................................. F-63 Notes to Financial Statements ......................................................................... F-64 CONNECTICUT HIGHER EDUCATION TRUST
Statements of Assets and Liabilities ................................................................. F-68 Statements of Operations................................................................................. F-69 Statement of Changes in Net Assets................................................................ F-70 Notes to Financial Statements ......................................................................... F-71 Independent Auditors Report............................................................................ F-74
TABLE OF CONTENTS

OFFICE OF THE STATE TREASURER, DENISE L. NAPPIER 5
STATE OF CONNECTICUT SPECIAL OBLIGATION RATE REDUCTION BONDS
Statement of Net Assets ................................................................................... F-75 Statement of Revenues, Expenses and Changes in Net Assets .................... F-76 Statement of Cash Flows ................................................................................. F-77 Notes to Financial Statements ......................................................................... F-78 Independent Auditor’s Report ........................................................................... F-82
TAX EXEMPT PROCEEDS FUND, INC. Statement of Assets and Liabilities................................................................... F-83 Schedule of Investments .................................................................................. F-84 Breakdown of Portfolio Holdings ...................................................................... F-89 Statement of Operations .................................................................................. F-91 Statement of Changes in Net Assets................................................................ F-92 Financial Highlighs ........................................................................................... F-93 Notes to Financial Statements ......................................................................... F-94 Report of Independent Registered Public Accounting Firm ............................. F-98
Supplemental Information PENSION FUNDS MANAGEMENT DIVISION - COMBINED INVESTMENT FUNDS
Total Net Asset Value by Pension Plans and Trusts .........................................S-1 Schedule of Net Assets by Investment Fund....................................................S-2 Schedules of Changes in Net Assets by Investment Fund ..............................S-4 Statement of Investment Activity by Pension Plan ...........................................S-8 Statement of Investment Activity by Trust ........................................................S-12 Summary of Operations ...................................................................................S-18 Pension and Trust Funds Balances..................................................................S-18 Investment Summary .......................................................................................S-19 Top Ten Holdings by Fund ................................................................................S-22 Schedule of Expenses in Excess of $5,000 .....................................................S-25 List of Investment Advisors and Net Assets Under Management.....................S-28 Schedule of Brokerage Commissions ..............................................................S-32 Glossary of Investment Terms ..........................................................................S-36 Understanding Investment Performance ..........................................................S-40 DEBT MANAGEMENT DIVISION
Changes in Debt Outstanding - Budgetary Basis .............................................S-42 Retirement Schedule of In-Substance Defeased Debt Outstanding - Budgetary Basis .....................................................................................S-43 Schedule of Expenses in Excess of $5,000 .....................................................S-44 CASH MANAGEMENT DIVISION
Cash Management Division Activity Statement ................................................S-45 Civil List Funds Summary Schedule of Cash Receipts and Disbursements ....S-46 Civil List Funds Summary Schedule of Cash and Investments ........................S-47 Civil List Funds Interest Credit Program...........................................................S-48 Schedule of Expenses in Excess of $5,000 .....................................................S-51
TABLE OF CONTENTS

6 FISCAL YEAR 2010 ANNUAL REPORT
UNCLAIMED PROPERTY DIVISION
Schedule of Expenses in Excess of $5,000 .....................................................S-52 Five Year Selected Financial Information .........................................................S-53 Summary of Gross Receipts ............................................................................S-53 EXECUTIVE OFFICE
Ex-Offi cio Responsibilities of the State Treasurer ............................................S-54 Total Administration Expenditures ....................................................................S-56 Schedule of Expenses in Excess of $5,000 .....................................................S-57 SECOND INJURY FUND DIVISION
Schedule of Expenses in Excess of $5,000 .....................................................S-58
Statutory Appendix DEBT MANAGEMENT DIVISION
Schedule of Debt Outstanding - Budgetary Basis ............................................O-1 Schedule of Authorized and Issued Debt Outstanding .....................................O-8 CASH MANAGEMENT DIVISION
Civil List Funds Schedule of Investments.........................................................O-13 Securities Held in Trust for Policyholders .........................................................O-16 Unemployment Compensation Fund ................................................................O-19
TABLE OF CONTENTS

Introduction

OFFICE OF THE STATE TREASURER, DENISE L. NAPPIER 7
December 30, 2010The Honorable M. Jodi Rell, Governor of Connecticut
In accordance with Section 3-37(a) of the Connecticut General Statutes, I enclose for your review the 2010 Annual Report of the Offi ce of the Treasurer of the State of Connecticut, which covers the twelve month period ending June 30, 2010. The Annual Report includes quantitative data, explanatory comments and fi nancial infor-mation regarding the Connecticut Retirement Plans and Trust Funds (CRPTF), the Short-Term Investment Fund (STIF), and the Connecticut Higher Education Trust (CHET) -- Connecticut’s 529 College Savings Program. In addition, the operations of the divisions of Debt Management, Second Injury Fund and Unclaimed Property are also presented.
During 2010, the Offi ce of the Treasurer achieved a number of substantive milestones that will benefi t • state residents and business, including the following highlights:
The Connecticut Retirement Plans and Trust Funds rebounded strongly for the fi scal year ended June • 30, 2010 with an average net return of 12.88%. Net market value increased by $1.5 billion with $2.6 bil-lion from investment returns offset by $1.1 billion in net benefi t payments, to end the fi scal year at $21.9 billion.
Approximately $151 million was generated from the sale of unclaimed securities during fi scal year 2010 • and deposited into the State’s General Fund until the rightful owners come forward to claim their money – far exceeding the budgeted projection of $52 million.
The Unclaimed Property Division of the Treasury returned $33 million to about 17,000 rightful owners in • 2010, which represents the largest dollar amount ever returned.
2010 marks the twelfth consecutive year in which I have been able to either reduce or maintain the Sec-• ond Injury Fund assessment rate for Connecticut businesses – the longest period without an assessment rate increase in the history of the Fund. The achievement is a direct result of management reforms and tighter fi scal controls initiated in 1999 when I was elected. And as a result, Connecticut businesses have realized an estimated $558.7 million in savings – including $75.8 million in projected savings for Fiscal Year 2011. In addition, since the beginning of my administration in 1999, unfunded liabilities of injured workers have declined by 48.8% from $838 million to $426.8 million as June 30, 2010
Signifi cant debt service savings were achieved by refunding existing debt to lower interest rates and by • taking full advantage of the new Build America Bonding program authorized under the federal stimulus bill. During fi scal year 2010, $258.2 million of General Obligation refunding bonds, $49.8 million of Spe-cial Tax Obligation refunding bonds, $36.1 million of UCONN 2000 refunding bonds and $115.8 million of Clean Water Fund refunding bonds were issued. Since January 1999, debt refunding and defeasances have produced $645 million in debt service savings. In addition, during the year $938.3 million of Build America Bonds were issued in three series which provided $44.3 million in debt service savings over the life of the bonds when compared to traditional tax-exempt bonds.
In 2000, my Agency initiated a multi-faceted effort to prevent losses due to the malfeasance of others • and, whenever possible, to recover lost assets. This effort has included the negotiation of best practices contract terms, monitoring of contract obligations, the fi ling of claims, and managing Connecticut’s fair share of securities litigation cases. In the fi scal year that ended June 30, 2010, this Offi ce recovered $5.8 million in class action lawsuits. The Treasury has regained a total of $36 million since 2000 by closely monitoring and participating in class action settlements.

8 FISCAL YEAR 2010 ANNUAL REPORT
At the close of Fiscal Year 2010, the Connecticut Higher Education Trust (CHET), Connecticut’s 529-col-• lege savings program, had over $1.265 billion in assets under management representing 94,886 accounts, which refl ects an increase of 9.6% or 8,327 accounts from 2009. This compares with just over 4,000 accounts and $18 million in assets in 1999.
The Short-Term Investment Fund (STIF) exceeded its primary benchmark by 25 basis points, thereby • earning an additional $11.9 million in interest income for Connecticut’s agencies, authorities, municipali-ties and their taxpayers during the fi scal year. Total assets under management grew to more than $4.6 billion, and STIF’s reserves were bolstered by $4.7 million during the fi scal year. I am pleased to report that Standard & Poor’s reaffi rmed STIF’s AAAm rating, the highest rating available.
The Community Bank and Credit Union Initiative, launched in 2006, supports Connecticut-based banks • and credit unions with assets of less than $500 million through investments in certifi cates of deposit. Eleven banks and one credit union participate in the initiative, and the State has invested $338 million with these institutions.
After an extended run of dismal performance, the equity markets fi nally returned to positive territory. The value of Connecticut Retirement Plans and Trust Fund’s assets increased, fi nishing the fi scal year with assets of $21.9 billion on an average net return of 12.88% following a return loss of 17.37% during the 2009 fi scal year which marks the most diffi cult year in the history of the CRPTF. The three principal retirement plans represent-ing 99% of the CRPTF – Teachers’, State Employees’ and Municipal Employees’ – posted performance results that outperformed their customized benchmarks. The best-performing investment categories in fi scal year 2010 were emerging market equities, returning 25.23%; high-yield bonds, 24.54%; emerging markets debt, 23.02%; and private equity, 17.32%.
During Fiscal Year 2010, indications of long-term strength in the domestic and global economies continued. Corporate profi ts were strong. The European Union responded effectively to the sovereign debt crisis. Infl ation in developed counties remained under control. Emerging economies grew, as did large developed economies of the U.S., Germany and China. The S&P 500 ended the fi scal year 13.3% better than when it began.
The CRPTF continued to play an important role in shaping and advancing its proxy voting agenda, and speak-ing out on a range of public policy initiatives and regulatory developments aimed at protecting and improving upon the value of its investments by advocating that companies in which the pension fund invests improve their corporate governance practices. Promoting responsible corporate behavior was an important element of our engagement with companies on how to rebuild and restore the U.S. economy to a point of sustainable growth. For the Connecticut pension funds, executive compensation, election of members to boards of directors, climate change, and shareholder rights present the list of our shareholder activities. Comments provided to the SEC on proposed regulations resulted in the SEC’s new rule requiring all companies to enhance their disclosure on the fi nancial impact of climate change on the company and a new rule on access to the proxy permitting share-holders to choose their board representatives rather than voting only for board members nominated by current board members.
I am grateful to the members of the Investment Advisory Committee, under the Chairmanship of Joseph D. Roxe, for their insight, fi nancial acumen and dedication to serving the best interests of the 190,000 participants and benefi ciaries of the CRPTF and the taxpayers and citizens of our State.
Finally, this Annual Report is prepared by dedicated employees who work diligently throughout the year to manage the State’s fi nancial resources with utmost care. I acknowledge their work with sincere gratitude, and trust that this Report will prove both informative and useful. In accordance with our practice of recent years, this Annual Report is available both in print and electronically via the Treasury’s website, www.state.ct.us/ott.
Sincerely,
Denise L. NappierTreasurer
2010 TREASURER’S LETTER
OFFICE OF THE STATE TREASURER, DENISE L. NAPPIER 9
Mission StatementTo serve as the premier State Treasurer’s Offi ce in the nation through effective management of public
resources, high standards of professionalism and integrity, and expansion of opportunity for the citizens and businesses of Connecticut.
Duties of the TreasuryThe duties and authority of the Offi ce of the Treasurer are set out in Article Four, Section 22 of the
Connecticut Constitution and in Title 3 of the Connecticut General Statutes. In general, the Treasurer is responsible for the safe custody of the property and money belonging to the State.
The Treasurer receives all money belonging to the State, makes disbursements as directed by Statute, and manages, borrows, and invests all funds for the State.
State revenue is received into the Treasury each year which covers the State’s disbursements. The Treasurer is also responsible for prudently investing the more than $21.9 billion in State pension and trust fund assets, $4.7 billion in total State, local short-term, and other investments, $0.6 billion in the extended investment portfolio, and over $1.2 billion of assets in the Connecticut Higher Education Trust. The Treasurer maintains an accurate account of all funds through sophisticated security measures and procedures.
Boards, Committees, and CommissionsBy law, the Treasurer is a member of the following:
State Bond Commission Investment Advisory Council
Banking Commission Finance Advisory Committee
Connecticut Lottery Corporation Student Financial Aid Information Council
Council of Fiscal Offi cers The Standardization Committee
Information and Telecommunication Connecticut Higher Education Trust Systems Executive Steering Committee Advisory Committee
Connecticut Development Authority Connecticut Housing Finance Authority
Connecticut Health and Educational Connecticut Higher Education Facilities Authority Supplemental Loan Authority
Connecticut Student Loan Foundation
Additional information on responsibilities of each is provided on Supplemental pages S-55 and S-56.
Offi ce of the State Treasurer OrganizationThe Offi ce of the Treasurer consists of an executive offi ce and fi ve divisions, which are as follows:
The Executive Offi ce has responsibility for policy-setting, investor and corporate relations, legal and legislative affairs, compliance, public education and information, business and information services, and special projects. The Executive Offi ce ensures that the Treasury adheres to the highest order of public values, fi scal prudence and ethics in the conduct of the public’s business.
The Pension Funds Management Division, under the direction of the Chief Investment Offi cer, manages the State’s six pension funds and eight state trust funds with a combined market value portfolio in excess of $21.9 billion; ranging in investment diversity from domestic and international stocks to fi xed income, real estate and private investment equity. Benefi ciaries and participants include approximately 160,000 teach-
2010 TREASURY OVERVIEW

10 FISCAL YEAR 2010 ANNUAL REPORT
ers, state and municipal employees, as well as trust funds that support academic programs, grants, and initiatives throughout the state. The Teachers’ Retirement Fund is the Treasury’s largest pension fund under management containing $12.3 billion, followed by the State Employees’ Retirement Fund containing $7.8 billion and the Municipal Employees’ Retirement Fund with $1.5 billion. The Pension Funds Management Division also serves as staff to the Investment Advisory Council.
The Cash Management Division, under the direction of an Assistant Treasurer, has responsibility for cash accounting and reporting, cash positioning and forecasting, bank reconciliation, bank administration, check processing and short-term investments. Over 3 million banking transactions are accounted for and reconciled annually. The division maintains accountability over the state’s internal and external cash fl ows through the Treasury’s 20 bank accounts annually. The Division prudently and productively manages clients’ cash, including 1,123 accounts within the Short-Term investment Fund for the State, State agencies and authorities, and municipal and local government entities.
The Debt Management Division, under the direction of an Assistant Treasurer, administers the state’s bond and debt fi nancing program, including the sale of state bonds. Monitoring the bond markets, fi nancing structures and economic trends that affect interest rates are critical requirements for favorable bond issu-ances. The Division oversees the issuance of bonds to fi nance state capital projects, refi nances outstanding debt when appropriate, manages debt service payments and cash fl ow borrowing, provides information and data to private credit rating agencies, and administers the Clean Water and Drinking Water loan programs. As of June 30, $19.2 billion of state debt was outstanding.
The Second Injury Fund Division, under the direction of an Assistant Deputy Treasurer, is a workers’ compensation insurance program for certain injured worker claims. The Second Injury Fund adjudicates those qualifying workers’ compensation claims fairly and in accordance with applicable law, insurance industry standards and best practices. Where possible, the Second Injury Fund seeks to help injured workers return to gainful employment or will seek settlement of claims, which will ultimately reduce the burden of Second Injury Fund liabilities on Connecticut businesses.
The Unclaimed Property Division, under the direction of an Assistant Deputy Treasurer, collects and safeguards all fi nancial assets left unclaimed by owners for a specifi c period of time, generally three years. Unclaimed assets include, but are not limited to: savings and checking accounts; uncashed checks; deposits; stocks, bonds or mutual fund shares; travelers checks or money orders; life insurance policies; and safe deposit box contents. The Division publicizes the names of rightful owners in an attempt to return unclaimed property to them.
2010 Annual Report Year at a Glance
COMBINED INVESTMENT FUNDS, JUNE 30 Market Value of Assets Under Management $ 21,784,939,405 Net Assets Under Management $ 21,869,590,362Total Investment Returns for the Fiscal Year $ 2,638,772,042Total Management Fees for the Fiscal Year $ 114,881,116Total Number of Advisors 150Increase in Total Advisors from Prior Year 2One-Year Total Return 12.88% (1)
Five-Year Compounded Annual Total Return 2.89%Ten-Year Compounded Annual Total Return 3.08%
(1) Represents a composite return of the total pension and trust funds. Individual returns for the three primary pension funds (Teachers’; State Employees; and Municipal Employees’) are separately presented as the asset allocations of each fund are different.
2010 TREASURY OVERVIEW

OFFICE OF THE STATE TREASURER, DENISE L. NAPPIER 11
2010 TREASURY OVERVIEW
CONNECTICUT HIGHER EDUCATION TRUST, JUNE 30Number of Participant Accounts 94,886Net Assets $ 1,265,851,220
DEBT MANAGEMENT, JUNE 30Total Debt Outstanding $ 19,174,639,529 General Obligation Debt included above $ 13,933,682,088Total New Debt Issued During the Fiscal Year $ 3,430,935,000 General Obligation Debt Issued included above $ 2,632,116,000Total Debt Retired and Defeased During the Fiscal Year $ 2,142,334,243 General Obligation Debt Retired and Defeased included above $ 1,505,126,969Total Debt Service Paid on Outstanding Debt During the Fiscal Year $ 2,639,286,321 General Obligation Debt Service Paid included above $ 1,961,799,499
CASH MANAGEMENT, JUNE 30Total Cash Infl ows During the Fiscal Year $ 90,107,522,529Total Cash Outfl ows During the Fiscal Year $ 90,023,306,480
SHORT-TERM INVESTMENT FUND, JUNE 30 Total Net Assets of the Fund $ 4,581,589,015One-Year Total Return 0.34%Five-Year Compounded Annual Total Return 3.16%Ten-Year Compounded Annual Total Return 2.95%Weighted Average Maturity 19 daysNumber of Participant Accounts 1,123
SHORT-TERM PLUS INVESTMENT FUND, JUNE 30 Total Net Assets of the Fund $ 52,566,866Weighted Average Maturity 105 daysNumber of Participant Accounts 1
SECOND INJURY FUND, JUNE 30Number of Claims Settled During the Fiscal Year 202Total Cost of Claims Settled and Paid $ 10,276,341Second Injury Fund Estimated Unfunded Liability (expressed as reserves) $ 426,848,728Number of Claims Outstanding 2,534
UNCLAIMED PROPERTY, JUNE 30Dollar Value of Gross Unclaimed Property Receipts $ 222,107,523Dollar Value of Claims Paid $ 33,408,124Number of Property Claims Paid 17,360

12 FISCAL YEAR 2010 ANNUAL REPORT

Division Overview

OFFICE OF THE STATE TREASURER, DENISE L. NAPPIER 13
November 18, 2010
The Honorable M. Jodi RellGovernorState of ConnecticutExecutive ChambersHartford, Connecticut
Dear Governor Rell:As Chairman of the Investment Advisory Council (“IAC”), I am pleased to present this report on the perfor-
mance of the State of Connecticut Retirement Plans and Trust Funds (“CRPTF” or “the Funds”) and the activities of the IAC for the fi scal year ending June 30, 2010.
The U.S. economy made a solid recovery during fi scal year 2010, following a year which was among the most diffi cult in the history of the CRPTF due to the unprecedented declines throughout the global capital mar-kets. The one year investment return for the CRPTF was 12.88%; a signifi cant and welcomed rebound from the 2009 fi scal year performance of -17.37%. The three largest plans in the CRPTF provide pension fund benefi ts to approximately 190,000 state and municipal workers and retirees. These plans represent the State Employees’ Retirement Fund (“SERF”), the Teachers’ Retirement Fund (“TERF”) and the Municipal Employees’ Retirement Fund (“MERF”) and comprise 99% of the CRPTF. Specifi cally, SERF, TERF and MERF posted net total returns (after all expenses) of 12.93%, 12.87% and 12.57%, respectively. Each plan also outperformed its customized benchmarks: SERF by .33%; TERF and MERF by .58% and .75% respectively.
The IAC focused on several important policy initiatives put forth by Treasurer Nappier. The maiden allocation to the Alternative Investment Fund (“AIF”) was considered over the past fi scal year, resulting in the Treasurer’s hiring of fi ve Absolute Return Fund of Hedge Funds managers. To that end, the IAC reviewed the AIF fund structure which adhered to the Investment Policy Statement objectives of reducing volatility and hedging against infl ation. The recommendation included a dual track investment approach; fi rst to invest in absolute return strategies and a second track to invest in real assets. Over the course of the fi scal year, the IAC reviewed and rendered advice on a number of competitive investment provider candidates as recommended by the Treasurer. The IAC offered feedback on commitments to two private equity partnerships totaling $175 million and three real estate Public-Private Investment Funds totaling $200 million. With regard to competitive search processes in the public markets, the IAC supported the hiring of two Emerging Markets International Stock Fund money managers.
Also presented during the fi scal year, at my request, was an educational presentation by an actuarial fi rm to provide the IAC members with a better understanding of the liability structure c/o 55 Elm Street, Hartford, Con-

14 FISCAL YEAR 2010 ANNUAL REPORT
INVESTMENT ADVISORY COUNCIL
necticut 06106-1773, Telephone: (860) 702-3000 for the CRPTF. IAC members, including Treasurer Nap-pier, held numerous discussions surrounding the funded levels of the SERF and TERF. While the Treasurer does not administer the liabilities of these plans, the unfunded level of these plans will greatly infl uence future asset allocation and portfolio designs in order to meet the primary objective of each fund - to provide a stream of income with which to meet benefi t payments. The fi nancial strength of the two largest pension plans, SERF and TERF, remain a paramount concern and the IAC collectively urge responsible fi scal leg-islative policy and a full understanding of the long term economic implications of any policy with respect to the State of Connecticut pension plans.
The IAC continued its practice of reviewing fund performance at each meeting, discussing individual manager changes, when necessary, and conducted a more extensive review of fund and manager per-formance on a quarterly basis. Finally, throughout the year, the Treasurer presented for the IAC’s review compliance reports on Corporate Governance, MacBride Principles and Connecticut’s statute regarding investments in Sudan. I would like to add that the membership comprising the IAC remained consistent in fi scal year 2010.
As Chairman of the IAC, I am very pleased to serve alongside fellow council members whose dedication to the IAC’s mission demonstrates an unwavering commitment to those whom we represent. It is with this sense of duty and solemn pledge to maintain our commitment to all the current and future pension benefi -ciaries and the taxpayers of the State of Connecticut that I submit this summary on behalf of the IAC.
Sincerely,
Joseph D. Roxe, ChairmanInvestment Advisory Council

OFFICE OF THE STATE TREASURER, DENISE L. NAPPIER 15
INVESTMENT ADVISORY COUNCIL
The Investment Advisory Council (IAC) consists of The State Treasurer and Secretary of the Offi ce of Policy and Management (as ex-offi cio members of the council), fi ve public members all of whom shall be experienced in matters relating to investments appointed by the Governor and legislative leadership, and three representatives of the teachers’ unions and two representatives of the state employees’ unions (CGS Sec. 3-13b).
Pursuant to C.G.S. Sec.3-13b, the IAC annually reviews the Investment Policy (IPS) Statement recommended by the Treasurer which includes an outline of the standards governing investment of the plan and trust funds by the Treasurer. The IPS includes, with respect to each plan and trust fund, (A) investment objectives; (B) asset allocation policy and risk tolerance; (C) asset class defi nitions, including specifi c types of permissible investments within each asset class and any specifi c limitations or other considerations governing the investment of any funds; (D) investment and money manager guidelines; (E) investment performance evaluation guidelines; (F) guidelines for the selection and termination of providers of investment related services who shall include, but not be limited to, external investment and money managers, investment consultants, custodians, broker-dealers, legal counsel, and similar investment industry professionals; and (G) proxy voting guidelines. The Treasurer shall thereafter adopt the IPS, including any such changes recommended by the IAC the Treasurer deems appropriate, with the approval of a majority of the members appointed to the IAC. The current IPS was adopted by the Treasurer and approved by the IAC in October 2007. Subsequently in May 2008, the IAC approved the Treasurer’s adopted asset allocation modifi cations for various plans to increase the allocations to the Liquidity Fund and subsequently in February 2009, the IAC approved the Treasurer’s adopted revision to set forth guidelines for the Connecticut Retirement Plans and Trust Funds’ (“CRPTF”) new Alternative Investment Fund (“AIF”)
All plan and trust fund investments by the State Treasurer shall be reviewed by the Investment Advisory Council along with all information regarding such investments provided to the IAC which the Treasurer deems relevant to the council’s review and such other information as may be requested by the council. The IAC shall also review the report provided by the Treasurer at each regularly scheduled meeting of the IAC as to the status of the plan and trust funds and any signifi cant changes which may have occurred or which may be pending with regard to the funds. The council shall promptly notify the Auditors of Public Accounts and the Comptroller of any unauthorized, illegal, irregular or unsafe handling or expenditure of plan and trust funds or breakdowns in the safekeeping of plan and trust funds or contemplated action to do the same within their knowledge.
At the close of the fi scal year, the IAC shall make a complete examination of the security investments of the State and determine as of June thirtieth, the value of such investments in the custody of the Treasurer and report thereon to the Governor, the General Assembly and benefi ciaries of plan and trust fund assets administered, held or invested by the Treasurer (CGS Sec. 3-13b(c)(2)).
Council members who contributed their time and knowledge to the IAC during fi scal 2010 include:
JOSEPH D. ROXE, Chairman, as appointed by the Governor. Chairman, Bay Holdings LLC.
THOMAS BARNES, Branch Manager, Riverside Investment Services.
MICHAEL FREEMAN, Representative of State Teachers’ unions, Teacher, Stonington High School.
ROBERT L. GENUARIO, Secretary, State Offi ce of Policy and Management (Ex-offi cio member). (Served until May 10, 2010.)
DAVID HIMMELREICH, Principal, Hynes, Himmelreich, Glennon & Company.
STANLEY MORTEN, Independent consultant, CitiGroup/Smith Barney.
WILLIAM MURRAY, Representative of State Teachers’ unions, NEA, Danbury.
DENISE L. NAPPIER, Treasurer, State of Connecticut (Ex-offi cio member) and council secretary.
SHARON M. PALMER, Representative of State Teachers’ unions, President, AFT Connecticut.
DAVID M. ROTH, Principal and Managing Director, WLD Enterprises, Inc. BRENDA L. SISCO, Acting Secretary, State Offi ce of Policy and Management (Ex-offi cio member).
CAROL M. THOMAS, Representative of State Employees’ unions, Retiree, Department of Developmental Services.
PETER THOR, Representative of State Employees’ unions, Coordinator, Policy & Planning, AFSCME Council 4.

16 FISCAL YEAR 2010 ANNUAL REPORT
Division OverviewIntroduction
As principal fi duciary of six state pension funds and eight trust funds, (known collectively as the “Con-necticut Retirement Plans and Trust Funds” or “CRPTF”), the Treasurer is responsible for managing $21.9 billion of net assets of retirement plans for approximately 190,000 teachers, state and municipal employees, as well as trust funds that support academic programs, grants, and initiatives throughout the state. The Pension Funds Management Division (“PFM” or “the Division”) is responsible for the day-to-day administra-tion of the CRPTF.
Prudent investment management requires properly safeguarding pension assets in order to ensure the retirement security of the benefi ciaries. Funding of the pension benefi t liability is dependent on investment returns, state contributions and the contribution requirements of eligible retirement plan participants.
As shown in Figure 1-1, over the last ten years pension and trust assets have grown from $20.4 bil-lion to $21.9 billion, or 7.4%. The Teachers’ Retirement Fund (“TERF”), with $12.3 billion of assets under management at June 30, 2010, is the largest participating fund. The State Employees’ Retirement Fund (“SERF”) and the Municipal Employees’ Retirement Fund (“MERF”) have $7.8 billion and $1.5 billion of as-sets, respectively. During the fi scal year ended June 30, 2010, total investment return (comprised of interest income, dividends, securities lending income, and net realized gains and unrealized capital gains, net of Fund operating expenses) was $2.6 billion. (See fi gure 1-2.)
CRPTF’s total investment in securities at fair value as of June 30, 2010 is illustrated below:
COMBINED INVESTMENT FUNDS Investment Summary at June 30, 2010
Fair % of Total Fund Value (1) Fair Value
Liquidity Fund (“LF”)(2) $1,621,182,259 7.44%Mutual Equity Fund (“MEF”) 5,288,853,566 24.28%Developed Market International Stock Fund (“DMISF”) 4,328,450,937 19.87%Emerging Market International Stock Fund (“EMISF”) 2,065,255,957 9.48%Real Estate Fund (“REF”) 792,483,221 3.64%Core Fixed Income Fund (“CFIF”) 2,789,605,943 12.81%Infl ation Linked Bond Fund (“ILBF”) 1,070,660,872 4.91%Emerging Market Debt Fund (“EMDF”) 1,155,351,613 5.30%High Yield Debt Fund (“HYDF”) 656,175,724 3.01%Commercial Mortgage Fund (“CMF”) 3,818,115 0.02%Private Investment Fund (“PIF”) 2,013,101,198 9.24%Total Fund $21,784,939,405 100.00%
(1) “Fair Value” includes securities and cash invested in Liquidity Fund (LF), and excludes receivables (FX contracts, interest, dividends, due from brokers, foreign tax, securities lending receivables, reserve for doubtful accounts, invested securities lending collateral and prepaid expenses), payables (FX contracts, due to brokers, income distribution, securities lending collateral and accrued expenses), and cash not invested in LF.
(2) The market value of LF presented represents the market value of the pension and trust balances in LF only (excluding receivables and payables); the LF balances of the other combined investment funds are shown in the market value of each fund.
2010pension fund management division

OFFICE OF THE STATE TREASURER, DENISE L. NAPPIER 17
PENSION FUNDS MANAGEMENT DIVISION
Fund ManagementUnder the supervision of a Chief Investment Offi cer, the Division executes and manages the investment
programs of the pension and trust funds with a fi fteen-member professional staff. Internal resources are augmented by several outside consulting fi rms that provide research and analytical expertise to the Treasurer, the Chief Investment Offi cer and Pension Fund Management Division staff. State Street Bank and Trust, as the custodian of record for the CRPTF, retains physical custody, safeguards plan assets and provides record keeping services under the supervision of PFM staff.
The Treasurer employs external money and investment managers to invest each Fund. The money and investment managers are selected based on asset class expertise, investment performance and style and are expected to comply with the parameters, guidelines, and restrictions set forth in the Investment Policy Statement (“IPS”). As of June 30, 2010, 150 external money and investment managers were employed by the Treasury to invest the pension and trust assets, an increase of 2 managers from June 30, 2009. (See fi gure 1-5.)
The Division allocates all operating overhead directly to the earnings of the pension and trust fund as-sets under management. It is therefore incumbent upon the Division to manage assets in a cost-effective manner consistent with maximizing long-term returns.
Investment PolicyOne of the immutable principles of investment management is that asset allocation decisions are respon-
sible for as much as 90% of the resulting returns. In October 2007, the independent Investment Advisory Council (“IAC”) approved, and the Treasurer adopted, the IPS including the asset allocation plan, which gov-erns CRPTF investments. The asset allocation plan is customized for each plan and trust and each plan’s main objective is to maximize investment returns over the long term at an acceptable level of risk, primarily through asset diversifi cation. Risk, in this context, is defi ned as volatility of investment returns. (See the Understanding Investment Performance discussion in the Supplemental Section.)
Diversifi cation across asset classes is a critical component in structuring portfolios to maximize return at a given level of risk. Likewise, asset allocation is used to minimize risk while seeking a specifi c level of return. In selecting an asset allocation strategy, there is a careful examination of the expected risk/return tradeoffs, correlation of investment returns, and diversifi cation benefi ts of the available asset classes (i.e., those not restricted by statute) under different economic scenarios.
As shown in Figure 1-3, the number and complexity of asset classes comprising the asset allocation policy have fl uctuated during the last ten years. As of June 30, 2010, multiple asset classes were included in the IPS, including public market funds associated with the management of global equities and fi xed in-come, and alternative investments such, real estate, private investments and other opportunistic investment strategies..
At fi scal year-end, global developed and emerging markets equities comprised the largest percent of the total CRPTF, at 53.9%. Equities have an established record of maximizing investment returns over the long term. Fixed income and alternative investments were also included to enhance portfolio returns during highly infl ationary or defl ationary environments and to mitigate the effects of volatility in the stock market.
Asset ClassesTo realize the asset allocations set forth in the IPS, the Treasurer administers the Combined Invest-
ment Funds as a series of mutual funds in which the CRPTF may invest through the purchase of ownership interests. The asset mix for each of the 14 plans and trusts is established by the Treasurer, with approval of the independent IAC, based on (1) capital market theory, (2) fi nancial and fi duciary requirements, and (3) liquidity needs. A broad array of asset classes is considered for inclusion in a potential asset allocation

18 FISCAL YEAR 2010 ANNUAL REPORT
PENSION FUNDS MANAGEMENT DIVISION
structure. Each asset class has its own distinct characteristics, as well as expectations for long-term return and risk behavior.
The asset classes which make up the CRPTF’s portfolio include:
Domestic EquityThe Mutual Equity Fund (“MEF”) invests primarily in the common stocks of U.S. corporations. These
investments are made using external money managers. MEF assets, which are allocated across the U.S. stock market, ensure diversifi cation by both market capitalization and investment style, such as value and growth. The MEF may invest opportunistically to take advantage of shifts in the investment landscape that offer diversifi cation and/or risk return benefi ts. This opportunistic allocation is made within the broad context of the MEF. The Fund measures its performance against the Russell 3000 Index. As currently structured, the MEF replicates the approximate capitalization of the U. S. equity market as a whole with 76% of the portfolio invested in large-cap stocks, 20% in small/mid-cap stocks, and 4% in all-cap.
Management of the MEF entails pure indexing, enhanced indexing, active management, and opportunistic strategies executed by external money managers. The goal of enhanced indexing is to generate a return slightly in excess of the selected index. Indexing is a particularly appropriate strategy for the “large-cap” segment of the equity markets, which is defi ned as the securities of the largest capitalized public compa-nies, typically comprising the major market indices. Given the effi ciency of the domestic equity market, approximately 87% of the portfolio adheres to indexing, enhanced indexing, or risk controlled strategies. The balance of the portfolio is activity managed, mainly in the “small- and mid-cap” sections of the equity markets, to allow the CRPTF the opportunity to achieve enhanced returns. Small- and mid-cap securities are issued by companies that are much smaller and not as closely monitored, researched or analyzed as the larger capitalization companies. Consequently, the small-cap segment of the U.S. equity market is less effi cient. Certain active money managers are therefore more likely to outperform the markets over the long term, while earning an acceptable level of return per unit of risk.
International EquityThe international equities are divided into two funds: the Developed Markets International Stock Fund
(“DMISF”) and the Emerging Markets International Stock Fund (“EMISF”). The DMISF and the EMISF are separate asset classes and provide fl exibility for each plan and trust fund to pursue individual allocation to each stock fund. DMISF and EMISF assets are allocated across foreign markets so that there is diversifi ca-tion by market, capitalization and style, comprising a mix which is structured to replicate the characteristics of the comparable developed and emerging non-U.S. stock market indices.
The DMISF invests primarily in the common stocks of non-U.S. corporations, and the investments are made using external money managers. Non-U.S. stocks are defi ned as common stocks issued by compa-nies domiciled outside the U.S. International developed markets are defi ned as the countries included in the S&P/Citigroup Broad Market Index (BMI) EPAC (Europe, Pacifi c Asia Composite). The Performance Benchmark for DMISF is the S&P/Citigroup Broad Market Index (BMI) EPAC (Europe, Pacifi c Asia Com-posite) 50% hedged with net dividends reinvested.
The EMISF invests primarily in the common stocks of non-U.S. corporations, defi ned as the countries included in the Morgan Stanley Capital International (MSCI) Emerging Markets Free Index (“EMF Index”). The Performance Benchmark for EMISF is the MSCI Emerging Markets Investable Index (IMI) with net dividends reinvested. These investments are made using external money managers.
The DMISF is comprised of passive indexing, risk controlled, core developed markets and opportunistic strategies. Mandates for active growth/value and small cap developed market strategies represent roughly 24% and 13% of the DMISF, respectively, and introduce greater fl exibility with regard to benchmark weight-ings. The currency exposure of the DMISF investments is managed through a currency hedging overlay strategy.
The EMISF is invested 100 percent in active, unhedged emerging markets strategies.

OFFICE OF THE STATE TREASURER, DENISE L. NAPPIER 19
PENSION FUNDS MANAGEMENT DIVISION
Fixed Income InvestmentsThe fi xed income assets are diversifi ed across four types of funds: the Core Fixed Income Fund (“CFIF”),
the Infl ation Linked Bond Fund (“ILBF”), the Emerging Markets Debt Fund (“EMDF”), and the High Yield Debt Fund (“HYDF”). Investments in the various fi xed income fund serves to reduce volatility of the CRPTF returns under various economic scenarios. Further, the fi xed income portfolio provides cash fl ow to the CRPTF over all economic cycles, through interest payments and bond maturities.
The CFIF consists of managed fi xed income portfolios that include debt instruments issued by the U.S. Government and its agencies, quasi-government agencies, U.S. corporations or any other public or private U.S. corporation whose debt security is regulated by the Securities and Exchange Commission. The Per-formance Benchmark for CFIF is the Barclay’s US Aggregate Index.
The ILBF consists of managed fi xed income portfolios containing domestic and foreign government-issued bonds. These bonds offer protection against infl ation and contribute to overall diversifi cation. Treasury Infl ation Protected Securities (TIPS) pay semi-annual interest according to the bonds’ coupon; the principal of the bonds are adjusted for infl ation as measured by the Consumer Price Index (“CPI”). The Performance Benchmark for ILBF is the Barclay’s US TIPS Index.
The EMDF consists of managed fi xed income portfolios that contain debt instruments issued by govern-ments and companies operating in emerging countries as defi ned by the benchmark and/or by The World Bank. The Performance Benchmark for EMDF is the J.P. Morgan Emerging Markets Bonds Global Index.
The HYDF consists of managed fi xed income portfolios that included debt instruments rated below in-vestment grade by a nationally recognized rating agency service (example: Standard & Poors, Moody’s or Fitch). The majority of the bonds are U.S. dollar denominated. The Performance Benchmark for HYDF is the Citigroup High Yield Market Index.
Liquidity FundThe Liquidity Fund (“LF”) is designed to provide the ability to generate cash, as needed for benefi t pay-
ments, through the sale of readily marketable securities. This structure enables the core holdings of the CRPTF to remain fully invested according to their investment mandate. A secondary objective of the LF is to earn a return above money market rates. While the majority of the LF is invested in money market instru-ments, there are allocations to intermediate maturities and developed and emerging global markets. The benchmark for the LF is the one-month LIBOR.
Real Estate and Private EquityThe Real Estate Fund (“REF”) is the vehicle by which the CRPTF makes investments in the real estate
asset class. The investments may consist of a number of different investment strategies and investment vehicles, including externally managed commingled funds, separate accounts and/or publicly traded real estate securities. The REF invests in real estate properties and mortgages and is designed to dampen vola-tility of overall returns through diversifi cation and to provide long-term rates of return. The REF will invest in the following types: core investments; value added (investments involving efforts to increase property value through repositioning, development and redevelopment); opportunistic (investments that represent niche opportunities, market ineffi ciencies, or special purpose markets); and publicly traded (primarily Real Estate Investment Trusts and Real Estate Operating Companies). Leverage within the REF is limited to 60%. These investments also adhere to the Responsible Contractor Policy. The Performance Benchmark for REF is the NCREIF Property Index.
The Private Investment Fund (PIF) investments generally are made in externally managed limited part-nerships or through separate accounts that focus on private stock investments, which include both venture capital and corporate fi nance investment strategies. Venture capital typically involves equity capital invested in young or development stage companies, whether start-up, early, mid or late-stage companies. Corporate fi nance typically involves equity and debt capital invested in growth, mature or distressed stage companies, often through the fi nancing of acquisitions, spin-offs, mergers or changes in capitalization. The Performance Benchmark for PIF is the S&P 500 plus 500 basis points Index.

20 FISCAL YEAR 2010 ANNUAL REPORT
Alternative InvestmentsThe Alternative Investment Fund (“AIF”) invests CRPTF assets in investment strategies which offer the
potential to enhance return characteristics and/or reduce risk. The AIF provides a vehicle for investment in portfolio strategies which are not easily classifi ed, categorized, or described in the other investment funds. Hybrid strategies which contain multiple asset classes are also considered part of the opportunity set.
Securities LendingThe Treasury maintains a securities lending program for the CIF designed to enhance investment re-
turns. This program involves the lending of securities to broker/dealers secured by collateral valued slightly in excess of the market value of the loaned securities. Typically, the loaned securities are used by broker/dealers as collateral for repurchase agreements, as well as to cover short sales, customer defaults, dividend recapture, and arbitrage trades. To mitigate the risks of securities lending transactions, the master custo-dian carefully monitors the credit ratings of each counter-party and overall collateral level. Collateral held is marked-to-market on a daily basis to ensure adequate coverage. The guidelines of the securities lending collateral investment pool require a high level of creditworthiness and consist of short duration assets.
State Street Bank and Trust Company, the current master custodian for the Funds, is responsible for marketing the program, lending the securities, and obtaining adequate collateral. For the fi scal year ended June 30, 2010, securities with a market value of approximately $2.7 billion had been loaned against col-lateral of approximately $2.8 billion. Income generated by securities lending totaled $15.7 million for the fi scal year.
The Year in ReviewTotal Fund Performance
During the fi scal year, the value of CRPTF’s portfolio increased to $21.9 billion from $20.4 billion as of June 30, 2010. The portfolio posted a net infl ow of funds from operations of $2.6 billion (net investment income of $0.7 billion, realized gains of $0.2 billion and unrealized gains of approximately $1.7 billion) and a net cash outfl ow of $1.1 billion. The net cash outfl ow of $1.1 billion was comprised of pension payments to benefi ciaries of $1.7 billion that were offset by net contributions from unit holders of $0.6 billion.
For the fi scal year ended June 30, 2010, the CRPTF posted an investment return of 12.88% (3), net of all expenses. The CRPTF is made up of 14 plans and trusts and the return for each plan or trust is measured against its customized benchmark. The three largest plans, which represent approximately 99% of the CRPTF assets, are the State Employees’ Retirement Fund (SERF), TERF, and the Municipal Employees’ Retirement Fund (MERF). The returns of TERF, SERF and MERF are measured against a hybrid benchmark customized to refl ect each plan’s asset allocation and performance objectives. Invest-ment return calculations are prepared using a time weighted rate of return based on market rate of return.
(3) Represents a composite return of the total pension and trust funds. Individual returns for the three primary pension funds (Teachers’; State Employees; and Municipal Employees’) are separately presented as the asset allocations of each fund are different.
TERF’s benchmark is comprised of 25% Russell 3000 Index; 20% S&P/Citigroup EPAC Broad Market 50% Hedged index; 9% MSCI Emerging Market Investable Market Index; 13% Barclay’s US Aggregate Index; 4% JP Morgan Emerging Markets Global Index; 2% Citigroup High Yield Market Index; 6% Barclay’s US TIPS Index; 6% One Month Libor Index; 5% NCREIF Index; and 10% S&P 500 Index.
SERF’s benchmark is comprised of 26% Russell 3000 Index; 20% S&P/Citigroup EPAC Broad Market 50% Hedged index; 9% MSCI Emerging Market Investable Market Index; 13% Barclay’s US Aggregate Index; 4% JP Morgan Emerging Markets Global Index; 2% Citigroup High Yield Market Index; 6% Barclay’s US TIPS Index; 4% One Month Libor Index; 5% NCREIF Index; and 11% S&P 500 Index.
MERF’s benchmark is comprised of 20% Russell 3000 Index; 16% S&P/Citigroup EPAC Broad Market 50% Hedged index; 8% MSCI Emerging Market Investable Market Index; 19% Barclay’s US Aggregate In-
PENSION FUNDS MANAGEMENT DIVISION

OFFICE OF THE STATE TREASURER, DENISE L. NAPPIER 21
PENSION FUNDS MANAGEMENT DIVISION
dex; 5% JP Morgan Emerging Markets Global Index; 2% Citigroup High Yield Market Index; 10% Barclay’s US TIPS Index; 3% One Month Libor Index; 7% NCREIF Index; and 10% S&P 500 Index.
Domestic Equity PerformanceOver the fi rst half of the fi scal year, equity markets rebounded strongly across all market caps (large,
mid, small) and investment styles (value, core, growth) following news of increases in US economic growth and investor appetite for taking on risk. The broad market continued to recover through March driven by performance in the consumer discretionary and industrial sectors. However, the MEF suffered in the quar-ter ending June 30, 2010 as all major domestic equity indices posted losses led by events such as the European debt crisis, the Gulf of Mexico oil spill, and a rebound of uncertainty regarding the health of the economic recovery. All ten sectors of the S&P 500 posted losses during the last quarter of the fi scal year. The materials, industrials, fi nancials and energy sectors were particularly hard hit. During fi scal year 2010, the MEF generated a positive return of 14.01%, net of fees and operating expenses, which underperformed the Russell 3000 Index return of 15.72% by 171 basis points.
International Equity PerformanceLike the US, the developed international markets were affected by the same global economic environ-
ment and they rose in unison with, and rebounded similar to, US equity markets. In particular, the DMISF posted a gain of 11.03%, net of fees and operating expenses, which outperformed its benchmark index return of 9.68% by 135 basis points.
During the fi scal year ended June 30, 2010, the emerging markets continued to lead the global equity rally led by the strength in the fi nancial sector. As many investors regained confi dence and viewed the emerging market countries as signifi cant players in the global economic recovery, performance of the BRIC (Brazil, Russia, India and China) led the rally. However beginning in calendar year 2010, countries such as China and Brazil experienced negative returns and the market value advances came to a halt over the quarter ending June 2010. The fi nancial instability in several European countries fueled by the sovereign debt crisis, decreased investment appetite throughout the region. Despite the pull back during the last quar-ter of the fi scal year, the EMISF generated a return of 25.23%, net of fees and operating expenses, which outperformed its benchmark index return of 24.57% by 66 basis points.
Fixed Income PerformanceThe fi xed income markets continued to improve and become more liquid by virtue of Government pro-
grams such as TALF and PPIP, which stabilized the more illiquid fi xed income mortgage and asset backed sectors of the market. Risk appetite returned given the improving economic environment, which ultimately led to a further narrowing of credit spreads resulting in a dramatic improvement in the overall return for all fi xed income markets in which the CRPTF invests.
For the fi scal year 2010 the CFIF generated a total return of 11.81%, net of fees and operating expenses, outperforming the benchmark return of 9.50% by 231 basis points. The outperformance was attributable to the fact that core holdings were underweight U.S. Treasury notes and overweight credit sensitive securi-ties. The improvement in risk appetite helped support the below investment grade market and the HYDF posted a return of 24.54% net of fees and operating expenses, the fund did underperform the benchmark return of 25.64% by 110 basis points due to the fact that the CRPTF’s high yield portfolio had a higher than average credit quality profi le. The ILBF, supported by falling US Treasury rates, generated a total return of 9.48% net of fees and operating expenses, virtually even to its benchmark return of 9.52%. The EMDF generated a total return of 23.02%, net of fees and operating expenses, outperforming the benchmark return of 17.90% by 512 basis points. Finally, the LF generated a return of .98%, outperforming the one month LIBOR benchmark of .27%, by 71 basis points.
Real Estate and Private Equity PerformanceFor the fi scal period ending June 30, 2010, the REF generated a total return of -20.18%; net of fees,
which underperformed the un-levered National Council of Real Estate Investment Fiduciaries Index (NCREIF) of -9.60% by 10.58%. The underperformance was caused by the falling real estate market values, the fact that the REF portfolio uses leverage, and the addition of several new funds that are still in the early stages and have not generated pro-forma returns. The REF increased its portfolio from $769.7 million to $783.8

22 FISCAL YEAR 2010 ANNUAL REPORT
PENSION FUNDS MANAGEMENT DIVISION
million primarily due to new purchases offset by net unrealized losses. The strategy for the REF is to invest in core real estate holdings, value add and opportunistic funds. Allocated to the lower risk strategy of core real estate is 36%, and these funds have a maximum leverage requirement of only 30%. The remaining 64% of the portfolio is invested in value add and opportunistic strategies and allow for a higher amount of leverage, typically 60% - 75% loan to value. The REF also has outstanding commitments of approximately $400 million which are being held in reserve by various investment managers to take advantage of distressed commercial real estate sales. At fi scal year-end the REF represented 3.6% of the CRPTF assets
For the fi scal year ended June 30, 2010, the Private Investment Fund (“PIF”) generated a one year 17.32% compounded annual rate of return. This compares favorably to its public market benchmark, the S&P 500, which returned 14.43% over the same period. Following a relatively slow start, U.S. buyout and venture markets were active during the latter half of fi scal year 2010, with deal volume increasing 29% and 23%, respectively, compared to the same time period one year earlier. There were 22 venture-backed IPOs in the fi rst six months of calendar year 2010, the highest level since the last market peak in 2007. The fund-raising environment continues to be challenging for private equity fund managers. U.S. buyout fundraising dropped 43% and venture fundraising was down 33% through the fi rst half of calendar year 2010 compared the same period in 2009.
2010 Management InitiativesDuring the fi scal year the Offi ce of the Treasurer completed the implementation of the Alternative Invest-
ment Fund (AIF), including a structure review of the asset class and the conclusion of the fi rst phase manager search in which the Treasurer named fi ve absolute return fund of hedge fund managers as preferred vendors. In furtherance of the asset class objectives, the AIF will provide the CRPTF the fl exibility to consider evolving and market-driven investment strategies.
As a result of a competitive search, two Emerging Markets International Stock Fund managers were hired. Also during fi scal year 2010 two investment commitments totaling $175 million were awarded to Pri-vate Investment Fund managers. There were three Real Estate Fund commitments this fi scal year with the investment in the Public-Private Investment Program, or PPIP. This is a U.S. Treasury opportunity designed to repair the capital markets by investing in legacy, distressed residential and commercial mortgage-backed securities and loans. Three of the eligible investment fi rms were hired to manage a total investment com-mitment of $200 million.
The Connecticut Horizon Fund (“CHF”), funded in August 2005, is a $631 million fund-of-funds public market program and a $155 million private equity allocation created to give access to the Treasury’s busi-ness to a wider number of fi rms, and to open up such business to more women-owned, minority-owned, Connecticut-based and emerging fi rms. In fi scal year 2010, public market managers totaled 42 CHF sub-managers; 16 were minority-owned, 8 were women-owned, and 7 were Connecticut-based fi rms (3 of which are also women and/or minority owned) and 14 were emerging fi rms There are 7 private equity submanagers, including 4 minority-owned, 2 emerging strategies and 1 Connecticut-based. Additionally, there are 7 private equity submanagers, including 4 minority-owned, 2 emerging strategies and 1 Connecticut-based.
The CRPTF continued to expand the diversity of fi rms with which PFM does business. Overall, minority-owned, women-owned, Connecticut-based and emerging fi rms, 34 in all, comprised 29% of the fi rms with which the division did business; these fi rms earned fees of over $36 million, representing 39% of all fees paid by the division. In actual dollars this was the highest level ever and as a percentage of all fees paid by the division, the second highest level ever, trailing only 2009. Since 1999, the number of minority-owned, women-owned, Connecticut-based and emerging fi rms has more than doubled, the annual fees paid to such fi rms have increased 3 times and the assets under management have nearly tripled.
Proxy Voting and Corporate GovernanceDuring 1999 and 2000, the Treasurer’s Offi ce developed comprehensive domestic and international proxy
voting policies. These policies, which are part of the Investment Policy Statement as mandated by state law, guide proxy voting at Connecticut Retirement Plans and Trust Funds (“CRPTF”) portfolio companies.

OFFICE OF THE STATE TREASURER, DENISE L. NAPPIER 23
Under these policies, the Treasurer not only votes proxies, but also engages with companies through letters, dialogues, and fi ling shareholder resolutions either alone or in concert with other institutional investors to protect and enhance the value of the CRPTF. The Offi ce also advocates for the protection and enhancement of shareholder rights with the Securities and Exchange Commission (SEC), the U.S. Congress and the stock exchanges. In spring of 2007, the Investment Advisory Counsel approved changes to the domestic policies to refl ect recent developments in the laws and regulations affecting proxy voting.
Connecticut law requires the Treasurer to consider the economic, social, and environmental impact of investment decisions. State law also prohibits investment in companies doing business in Northern Ireland that have not implemented the MacBride Principles of fair employment. Similar statutory prohibitions allow the Treasurer to engage with, and divest of holdings in, companies conducting business with Sudan and with Iran counter to U.S. foreign policy.
The Treasurer’s activities in 2010 were against a backdrop of the continuing international fi nancial cri-sis that severely impacted the global economy and all companies in which the CRPTF invests, as well as government initiatives to address the crisis. During the 2010 fi scal year, Treasurer Nappier provided formal policy comments to regulatory agencies on issues that have a signifi cant impact on institutional investors. She also provided input to the U.S. Congress on its regulatory reform legislation, which was signed into law by the President in July 2010. In letters to the U.S. congressional leadership the Treasurer joined with other investors providing input and making recommendations on how the then pending legislation would impact the Treasury. These issues included corporate governance, executive compensation, regulation of banks, fi nancial advisors and hedge funds, use and transparency of fi nancial derivatives, securities lending, credit rating agencies, and fi nancial literacy, and other related issues. The legislative process will be followed by an intense period of adoption of regulations by administrative agencies (particularly the SEC), and implementa-tion. The Treasurer has and will continue to provide the SEC and other oversight agencies with comments on proposed rules affecting these issues.
The issues surrounding the fi scal crisis were evidenced on the CRPTF shareholder front as well. In fi scal year 2010, the CRPTF fi led shareholder resolutions at 16 companies. The CRPTF engaged with companies through activities ranging from writing letters and attending annual shareholder meetings, to holding face-to-face dialogues with corporate management and board members. In support of its efforts, the Treasurer’s Offi ce worked with a wide cross-section of investors representing public pension funds, labor funds, and faith-based investors. Executive compensation is one of the key issues for the CRPTF, and the fund was active in this area throughout the reporting period. In 2010, the Treasurer addressed executive compensa-tion on a number of fronts including advocating for an annual advisory vote on executive compensation at all companies (say on pay), calling for independence of compensation consultants, working with several portfolio companies to adopt policies related to severance payments, addressing internal pay equity, and requesting policies requiring equity compensation be held until retirement.
In the area of climate change and related energy issues, the Offi ce continued to take a leading role in the Investor Network on Climate Risk (INCR) and the Global Warming Shareholder Campaign (GWSC). The Treasurer engaged with a number of companies on these issues, including asking companies to set greenhouse gas emission goals, to set targets for energy use reductions and report to shareholders on prog-ress in achieving those targets, to issue sustainability reports to shareholders that directly address climate and energy issues, calling on auto companies to produce more energy effi cient vehicles, and engaging with investors and electric utility companies on new business models that will be needed in that industry.
As part of its corporate governance practices, the Treasurer’s offi ce is charged with enforcing the state law relating to religious non-discrimination practices in the workplace in Northern Ireland. During the fi scal year, two companies agreed to implement the MacBride Principles, which are a corporate code of conduct for companies doing business in Northern Ireland and consist of nine fair employment and affi rmative action principles. The list of adopting companies in fi scal year 2010 includes Art Technologies and The PublicCard Inc.
In addition to the MacBride Principles, the Treasurer’s Offi ce proposed, and the General Assembly ad-opted a law, requiring the CRPTF to review pension fund investments in companies doing business in the Republic of Sudan. The 2006 law grants the Treasurer authority to engage and potentially divest holdings from companies shown to contribute to the Sudanese government-backed genocide. In May 2007, the Trea-
PENSION FUNDS MANAGEMENT DIVISION

24 FISCAL YEAR 2010 ANNUAL REPORT
PENSION FUNDS MANAGEMENT DIVISION
surer announced the fi rst divestment of CRPTF holdings companies doing business in Sudan. Through the end of FY 2010, the Treasurer has directed CRPTF’s investment managers to divest from and refrain from further investment in 13 companies: Bharat Heavy Electricals Ltd. (BHEL), China Petroleum and Chemical Corp., CNPC (Hong Kong), Dongfeng Motor Corporation, MISC Bhd, Nam Fatt Corp., Oil and Natural Gas Corp. (ONGC), PECD Group, PetroChina Co. Ltd., Petronas Capital Ltd., Sinopec Shanghai Petrochemical Corp., Sudan Telecom (Sudatel), and Wartsila Oyj.
Copies of the Connecticut pension fund’s proxy voting policies and a report of proxy votes cast are avail-able for review and download at the State Treasurer’s web site: http://www.state.ct.us/ott/proxyvoting.htm
Asset Recovery and Loss PreventionWhile market risk will always be a component of any investment program, Treasurer Nappier’s Legal
and Compliance Units work to manage such risk by limiting opportunities for loss due to the malfeasance of others. Extensive pre-contracting due diligence helps the Offi ce of the Treasurer select the best vendors and products to meet the needs of the Offi ce. Careful contract negotiation, coupled with implementation of best practice contract language, lends clarity to the obligations of the Offi ce of the Treasurer and of the vendors of the Offi ce. The Offi ce maintains contact with other similar governmental offi ces and shares ideas for enhancement of contract language, frequently offering advice to counterparts in other states.
The Offi ce of the Treasurer deters malfeasance with its reputation for aggressive pursuit of all oppor-tunities to recover assets lost due to the misfeasance or malfeasance of others.
While Congress considered the Dodd-Frank Wall Street Reform and Consumer Protection Act, enacted into law on July 21, 2010, the Offi ce of the Treasurer carefully monitored the proposals and offered sug-gestions and shareholder perspective on the bill’s original language and amendments, both directly and in conjunction with other shareholders and elected offi cials.
The US Treasury and the Securities and Exchange Commission continue to propose structural regulatory and rule changes that are designed to rebuild and enhance fi nancial supervision of our nation’s fi nancial industry. The Offi ce of the Treasurer has carefully reviewed the proposals and, where appropriate, supported or offered comment on the proposed language. As an institutional investor, the Offi ce believes stronger federal regulation of fi nancial institutions is likely to result in increased compliance and reduced risk.
The Offi ce of the Treasurer takes a measured approach to litigation, but is prepared, when necessary, to pursue judicial solutions where negotiations are unsuccessful. The Offi ce of the Treasurer continues to consider making application to serve as lead plaintiff in class action litigation and encourages other institu-tional investor lead plaintiffs to aggressively negotiate reasonable legal fees. From time to time, the Offi ce of the Treasurer has used litigation to encourage corporate governance enhancements. Although rare, the Offi ce of the Treasurer has fi led individual and group actions to pursue specifi c rights where disputing par-ties are unwilling or unable to reach an extra-judicial conclusion.
Class Action Securities LitigationThe CRPTF recovered $5.76 million from class action settlements in the fi scal year ended 2010, includ-
ing substantial recovery from the securities litigation involving Enron, McKesson and Merrill Lynch. We continue to closely monitor opportunities to recover lost assets through participation in class action litiga-tion. The Offi ce of the Treasurer, as the Trustee for the CRPTF, is currently the lead plaintiff in the matter known as In Re Amgen, Inc. Securities Litigation, fi led in the federal district court for the Southern District of California.
The court in Amgen approved the class certifi cation motion. We entered the discovery phase of the case in the fall of 2009. The Defendants have fi led an appeal to the 9th Circuit Court of Appeals, seeking to set aside the class certifi cation order. All discovery activities have been stayed, pending the appeal.
Corporate Governance Related LitigationLitigation has not been required for corporate governance matters in the past fi scal year. The Offi ce
of the Treasurer prefers to focus on engagement of companies with these issues. Litigation is an effective tool, but used judiciously.

OFFICE OF THE STATE TREASURER, DENISE L. NAPPIER 25
Other LitigationThe Offi ce of the Treasurer engaged legal counsel in Belgium to pursue recovery of losses in connec-
tion with certain alleged malfeasance by the Dutch-Belgian fi nancial fi rm Fortis, N.A. This matter is in very early stages of litigation.
The matter involving Keystone Venture V L.P. (the “Partnership”) is awaiting fi nal distribution of the partnership’s assets. Although such fi nal distribution was anticipated to have occurred in December 2008, counsel and the liquidating trustee are in agreement that such distribution should wait until the conclusion of a certain action initiated by the Securities and Exchange Commission against the Managing Partners and Michael Liberty. Expected to have been resolved in the fall of 2008, the matter was not concluded during the fi scal year ended 2010. The limited partners have requested that any disgorged assets obtained by these federal agencies be turned over to the investors. The SEC’s case against Mr. Liberty settled in October 2010. Upon receipt of amounts to be distributed to the limited partners pursuant to the order of the court, the remaining assets will be distributed.
PENSION FUNDS MANAGEMENT DIVISION

26 FISCAL YEAR 2010 ANNUAL REPORT
PENSION AND TRUST FUNDSGrowth in Assets ($ in millions)
TERF - Teachers’ Retirement FundSERF - State Employees Retirement FundMERF - Connecticut Municipal Employees’ Retirement Fund
Figure 1-1
PENSION AND TRUST FUNDSInvestment Returns ($ in millions)
Figure 1-2
TERF - Teachers’ Retirement FundSERF - State Employees Retirement FundMERF - Connecticut Municipal Employees’ Retirement Fund
$0
$5000
$10000
$15000
$20000
$25000
$30000Trusts
OtherPlans
MERF
SERF
TERF
1009080706050403020100
As of June 30, 2010$21.9 Billion
$-5000
$-4000
$-3000
$-2000
$-1000
$0
$1000
$2000
$3000
$4000Trusts
Other Plans
MERF
SERF
TERF
10090807060504030201
PENSION FUNDS MANAGEMENT DIVISION
Figure 1-3
PENSION AND TRUST FUNDS ASSET ALLOCATIONActual vs. Policy at June 30, 2010 TERF SERF MERF Target Lower Upper Target Lower Upper Target Lower Upper Actual Policy Range Range Actual Policy Range Range Actual Policy Range RangeU.S. EQUITYMutual Equity Fund (MEF) 24.4% 25.0% 17.0% 35.0% 25.3% 26.0% 17.0% 35.0% 18.4% 20.0% 12.0% 27.0%
INTERNATIONAL EQUITY Developed Market Intl Stock Fund (DMISF) 20.7% 20.0% 13.0% 27.0% 20.9% 20.0% 13.0% 27.0% 15.5% 16.0% 8.0% 21.0%Emerging Market Intl Stock Fund (EMISF) 9.5% 9.0% 6.0% 12.0% 9.7% 9.0% 6.0% 12.0% 8.8% 8.0% 6.0% 10.0%
REAL ESTATEReal Estate Fund (REF) 3.6% 5.0% 4.0% 7.0% 3.6% 5.0% 4.0% 7.0% 3.5% 7.0% 5.0% 9.0%
FIXED INCOMECore Fixed Income Fund (CFIF) 11.6% 13.0% 9.0% 20.0% 11.8% 13.0% 9.0% 20.0% 17.1% 19.0% 14.0% 26.0%Infl ation Linked Bond Fund (ILBF) 4.5% 6.0% 4.0% 8.0% 4.5% 6.0% 4.0% 8.0% 9.3% 10.0% 7.0% 13.0%Emerging Market Debt Fund (EMDF) 5.3% 4.0% 3.0% 5.0% 5.4% 4.0% 3.0% 5.0% 5.3% 5.0% 3.0% 7.0%High Yield Debt Fund (HYDF) 3.1% 2.0% 1.0% 3.0% 3.2% 2.0% 1.0% 3.0% 3.1% 2.0% 1.0% 3.0%Liquidity Fund (LF) 8.0% 6.0% 4.0% 10.0% 6.3% 4.0% 2.0% 7.0% 10.0% 3.0% 1.0% 6.0%Commercial Mortgage Fund (CMF) 0.0% 0.0% 0.0% 0.0% 0.0% 0.0% 0.0% 0.0% 0.0% 0.0% 0.0% 0.0%
PRIVATE EQUITYPrivate Investment Fund (PIF) 9.3% 10.0% 8.0% 14.0% 9.3% 11.0% 8.0% 14.0% 9.0% 10.0% 7.0% 13.0%
TOTAL 100.0% 100.0% 100.0% 100.0% 100.0% 100.0%

OFFICE OF THE STATE TREASURER, DENISE L. NAPPIER 27
PENSION FUNDS MANAGEMENT DIVISION
PENSION AND TRUST FUNDSAnnual Return at June 30, 2010 (1)
Figure 1-7
PENSION AND TRUST FUNDSAsset Class Diversifi cation
Figure 1-4
PENSION AND TRUST FUNDSAdvisor Breakdown
Figure 1-5
Figure 1-6
June 30, June 30, Fund 2010 2009MEF 9 10DMISF(1) 13 14EMISF 4 2PIF 66 66CFIF 5 6ILBF 2 2EMDF 5 5HYDF 4 4CMF 1 1REF 35 34LF 6 4Total(2) 150 148
(1) Does not include the Currency Overlay Manager.(2) Actual total advisors was 142 and 139, respectively
when factoring in advisors across multiple funds. Private Investment Fund partnerships with a $0 market value are not included.
PENSION AND TRUST FUNDSAnnual Returns vs. Benchmarks
0%
20%
40%
60%
80%
100% LiquidityFund
PrivateEquity
High YieldDebt
EmergingMarket Debt
InflationLinked Bond
Core FixedIncome
Fixed Income
Real Estate
EmergingMarket International Stocks
DevelopedMarketInternational Stocks
InternationalStocksU.S. Stocks
1009080706050403020201
0%
3%
6%
9%
12%
15%
MER
F Be
nchm
ark
Mun
icip
alEm
ploy
ees'
Retir
emen
tFu
nd (M
ERF)
SERF
Ben
chm
ark
Stat
e Em
ploy
ees'
Retir
emen
t Fun
d(S
ERF)
TERF
Ben
chm
ark
Teac
her's
Retir
emen
tFu
nd (T
ERF)
-25%
-20%
-15%
-10%
-5%
0%
5%
10%
15%
20%
25%
30%
LFPIF
CMF
ILBF
HYD
F
EMD
F
CFIF
REF
EMIS
F
DM
ISF
MEF
Russ
ell 3
000
50%
Hed
ged
BMI
MSC
I EM
IMI N
et
NCR
EIF
Libo
r 1 M
onth
BC A
gg
JP M
orga
n G
loba
l
BC A
gg
S &
P 50
0
BC U
S Ti
ps
Citig
roup
HYM
I
(1) Each Plan benchmark composite represents the Plans policy allocation weights times each investment Fund’s return.

28 FISCAL YEAR 2010 ANNUAL REPORT
Combined Investment Funds Total Return Analysis (%)
Fiscal Years Ending June 30, Annualized 3 5 10 2010 2009 2008 2007 2006 Years Years Years(Investment performance is calculated using a time-weighted rate of return based on the market rate of return.)
PLANSTeacher’s Retirement Fund (TERF) 12.87 (17.14) (4.77) 17.47 10.74 (3.79) 2.99 3.10 TERF Benchmark-NCREIF 12.29 (16.85) (6.03) 17.85 10.55 (4.27) 2.71 2.59 TERF Benchmark-Russell 3000 13.63 (17.62) (7.29) 18.00 10.01 (4.61) 2.41 2.15 State Employees’ Retirement Fund (SERF) 12.93 (18.25) (4.83) 17.37 10.57 (4.22) 2.66 2.89 SERF Benchmark-NCREIF 12.60 (17.42) (6.20) 17.85 10.55 (4.46) 2.59 2.53 SERF Benchmark-Russell 3000 13.93 (18.19) (7.46) 18.00 10.01 (4.81) 2.29 2.08 Municipal Employees’ Retirement Fund (MERF) 12.57 (14.90) (4.11) 16.96 9.87 (2.79) 3.37 3.19 MERF Benchmark-NCREIF 11.82 (14.20) (5.11) 17.85 10.55 (3.08) 3.47 2.97 MERF Benchmark-Russell 3000 13.71 (15.26) (6.57) 18.00 10.01 (3.44) 3.17 2.52 COMBINED INVESTMENT FUNDS U.S. Stocks Mutual Equity Fund 14.01 (28.36) (12.99) 18.24 10.29 (10.76) (1.51) (0.66) Russell 3000 Index 15.72 (26.56) (12.69) 20.07 9.56 (9.47) (0.48) (0.92) International Stocks Developed Markets International Stock Fund 11.03 (27.98) (14.60) 26.36 23.91 (11.93) 1.35 N/A S&P/Citigroup EPAC BMI 50% Hedged 9.68 (26.79) (16.05) 27.07 27.37 (12.32) 1.76 N/AEmerging Markets International Stock Fund 25.23 (30.90) 0.19 42.27 35.85 (4.65) 10.88 10.12 MSCI Emerging Market Investable Market Index 24.57 (26.84) 3.49 44.99 35.47 (1.93) 13.12 10.21 Equity Commercial Real Estate (1) Real Estate Fund (20.18) (28.66) 6.04 14.21 6.87 (15.48) (5.92) 1.18 Russell 3000 Index 15.72 (26.56) (12.69) 20.07 9.56 (9.47) (0.48) (0.92) Russell NCREIF (1 Qtr. Lag) (9.60) (14.68) 13.58 16.59 20.19 (4.32) 4.19 7.12 U.S. Fixed Income Core Fixed Income Fund 11.81 2.84 5.65 5.84 (0.39) 6.70 5.07 6.45 BC Aggregate Bond Index 9.50 6.05 7.13 6.12 (0.81) 7.55 5.54 6.47 Emerging Market Debt 23.02 (3.62) 5.59 14.84 11.07 7.78 9.81 N/A JP Morgan EMBI Global 17.90 2.24 5.10 11.12 4.62 8.21 8.16 N/AHigh Yield Debt 24.54 (4.59) (1.88) 12.01 4.49 5.25 6.41 6.49 Citigroup High Yield Market Index 25.64 (3.26) (2.29) 11.63 4.14 5.90 6.66 7.18 Infl ation Linked Bonds 9.48 (0.20) 16.81 3.45 (1.70) 8.47 5.35 N/A BC US Tips 9.52 (1.11) 15.09 3.99 (1.64) 7.62 4.98 7.46 Commercial Mortgage Fund 6.75 (3.14) 12.05 8.17 9.51 5.03 6.54 7.88 BC Aggregate Bond Index 9.50 6.05 7.13 6.12 (0.81) 7.55 5.54 6.47 Alternative Assets (1) Private Investment Fund 17.32 (16.36) 13.66 19.56 11.46 3.71 8.25 3.49 S & P 500 14.43 (26.22) (13.12) 20.59 8.63 (9.81) (0.79) (1.59) State Street Private Equity Index (1 Qtr. Lag) 20.89 (29.34) 13.54 29.75 27.89 (1.02) 9.98 N/A Liquidity Fund (2) Liquidity Fund 0.98 1.54 4.59 5.61 4.51 2.36 3.43 3.19 Libor 1 Month Index 0.27 1.35 4.10 5.37 4.51 1.89 3.10 2.87
(1) Real Estate and Private Investment returns published for prior years were net of management fees and for 2008 forward published numbers are net of all expenses.
(2) The Liquidity Fund includes all cash balances, including manager cash. However all fund returns still refl ect cash balances.
PENSION FUNDS MANAGEMENT DIVISION

OFFICE OF THE STATE TREASURER, DENISE L. NAPPIER 29
Fund Facts at June 30, 2010
Investment Strategy/Goals: To provide a liquid source of funds to meet the cash fl ow needs of the pension and trust funds, thereby enabling the other investment funds to remain fully invested.
Performance Objective: An annual total return in excess of the benchmark.
Benchmark: One Month LIBOR Index Date of Inception: November 1, 2007
Total Net Assets: $2,218,880,969 Number of Advisors: 6 external
Management Fees: $2,892,287 Operating Expenses: $388,757
Expense Ratio: .15%
Description of the FundThe Liquidity Fund is structured into three tiers for the purpose of enhancing investment returns and better
matching cash outfl ows. The fi rst tier invests solely in money market instruments, which are highly liquid securities with maturities of less than one year The second tier adds incremental credit risk and an extension of maturities, to match future expected benefi t cash outfl ows and to generate additional interest income. The third tier adds foreign exposure and further maturity extension, providing global diversifi cation and enhanced expected return. This structure enables the CRPTF to strategically manage cash to meet the outfl ow requirements of the plans and trusts, while maximizing potential returns and avoiding forced securities sales in other investment funds, especially in down markets.
Portfolio CharacteristicsThe preservation of the Fund’s capital, a high degree of liquidity and a strong focus on credit fundamentals
represent the core of the investment philosophy for the Liquidity Fund. The Liquidity Fund investments include Treasury securities, Government Agency paper, commercial paper, certifi cates of deposit, asset-backed securities, mortgage backed securities, domestic and foreign corporate bonds, sovereign debt and foreign currency. Preferred stock and convertible bonds are not permitted, nor are derivative securities, with the exception of currency spot or forward contracts. At June 30, 2010, the weighted average maturity of the LF was 202 days and the average quality rating was AA-1. (See Figure 2-5.)
Market ReviewShort term interest rates remained historically low and relatively stable during the fi scal year. One-month LIBOR
traded around 25 basis points for the period while the targeted Fed Funds rate was between zero and 25 basis points. During early fi scal 2010, Treasury yields rose due to increased investor risk appetite and concerns about excess supply of Treasury issues. The Treasury yield curve steepened signifi cantly with the difference between two and ten year Treasuries widening to 270 basis points during the fi rst half of the fi scal year, but fl attening by almost 50 basis points in the second half of the year. The sovereign debt crisis, along with discouraging domes-tic economic data, led to a shift back towards higher quality assets. The U.S. dollar declined against a basket of major currencies during the fi rst fi ve months of the year and rose steadily thereafter, although there were marked differences in relative currency movements across countries. For example, the reverse trends occurred against the Euro, with the U.S. dollar rising through November and declining into early June before turning upward again. The Euro was adversely impacted by the Greece debt crisis and fears of contagion. The dollar was fl at against the Chinese yuan most of the fi scal year due to Chinese central bank intervention.
2010liquidity fund

30 FISCAL YEAR 2010 ANNUAL REPORT
PENSION FUNDS MANAGEMENT DIVISION
Performance SummaryFor the fi scal year ended June 30, 2010, the Liquidity Fund generated a return of .98%, net of all expenses,
outperforming the one month LIBOR benchmark of .27%, by 71 basis points. (See Figure 2-6.) Tier 1 returned .30%, having the lowest credit and interest rate risk of the three tiers. During fi scal 2010, Tiers 2 and 3 were fully funded. Their annual return contributions of 2.00% and 3.87%, respectively, were the result of maturity extension, credit exposure and foreign diversifi cation.
As of June 30, 2010, the Fund’s compounded annualized total returns for the trailing three, fi ve and ten year periods were 2.36%, 3.43% and 3.19%, respectively, net of all expenses. These returns exceeded those of the Fund’s benchmark for the time periods listed by 47, 33 and 32 basis points, respectively. The cumulative returns of the Liquidity Fund for the three, fi ve and ten year periods were 7.24%, 18.37% and 36.88%, respectively. (See Figure 2-6.)
Risk Profi leBy maintaining a short average maturity the Fund has relatively low interest rate risk and by investing in high
quality securities, the Liquidity Fund has a lower risk of credit default. The Fund does assume currency risk though its investments in global sovereign bonds and emerging market currencies. The Fund has negligible liquidity risk, reinvestment risk or infl ation risk. Counter party risk is carefully managed by dealing only with reputable, very high quality fi rms.

OFFICE OF THE STATE TREASURER, DENISE L. NAPPIER 31
PENSION FUNDS MANAGEMENT DIVISION
LIQUIDITY FUNDOwnership Analysis at June 30, 2010 ($ in millions)
TERF - Teachers’ Retirement FundSERF - State Employees’ Retirement FundMERF - Connecticut Municipal Employees’ Retirement FundCIF - Combined Investment Funds
Figure 2-1
LIQUIDITY FUND(1)
Risk Profi le at June 30, 2010
Figure 2-2
Figure 2-3
LIQUIDITY FUNDSecurity Maturity(1) Analysis at June 30, 2010
Figure 2-4
(1) Or Interest Rate Reset Period.
Relative Volatility 1.02Standard Deviation 0.61R2 0.20Beta 0.68Alpha 0.33
(1) Based upon returns over the last fi ve years.
0%
20%
40%
60%
80%
100%
Over 2 years
1-2 years
271-360 days
91-270 days
31 - 90 days
0 - 30 days
CIF$581.0
MERF$146.5
TERF$980.3
Other$18.8
SERF$492.3
Figure 2-5
LIQUIDITY FUNDDistribution by Security Type at June 30, 2010
Figure 2-6
Money Market/Cash Equivalents79.48%
AgencyMortgage-Backed
1.05%
Foreign Government6.71%
U. S. GovernmentAgency4.07%
Corporate Notes6.34%
Asset-BackedNotes2.35%
LIQUIDITY FUNDComprehensive Profi le
(1) Represents annual total return of the Fund for year ended June 30.
Number Average Average Date of Issues Yield(1) Maturity Quality 2010 244 0.98% 202 days AA-12009 162 1.54% 36 days AA-22008 71 4.59% 39 days A-1+/AA+2007 97 5.61% 87 days A-1+/AA+2006 69 4.54% 54 days A-1+/AA+2005 100 2.38% 44 days A-1+/AA+2004 92 1.30% 48 days A-1+/AA+2003 109 1.80% 48 days A-1+/AA+2002 104 3.03% 51 days A-1+/AA+2001 90 6.35% 65 days A-1+/AA+
LIQUIDITY FUNDPeriods ending June 30, 2010
1 YR 3 YRS 5 YRS 10 YRS
Compounded, Annual Total Return (%) LF 0.98 2.36 3.43 3.19Libor 1 Month Index 0.27 1.89 3.10 2.87
Cumulative Total Return (%) LF 0.98 7.24 18.37 36.88Libor 1 Month Index 0.27 5.79 16.49 32.74

32 FISCAL YEAR 2010 ANNUAL REPORT
PENSION FUNDS MANAGEMENT DIVISION
Figure 2-7 Figure 2-8
Figure 2-9
LIQUIDITY FUNDAnnual Total Return
0%
1%
2%
3%
4%
5%
6%
7%
Libor 1 Month IndexLF
10090807060504030201
LIQUIDITY FUNDInvestment Advisor Tiers at June 30, 2010
LIQUIDITY FUNDTen Largest Holdings* at June 30, 2010
Net Asset % ofInvestments Value Fund
Tier I $1,493,003,627 67.29%
Tier II 376,918,808 16.99%
Tier III 348,958,534 15.72%
Total LF $2,218,880,969 100.00%
Security Name Maturity Date Market Value %
Barclays Cap Tri Party C 7/1/2010 $99,245,000 4.48%Bank Of Nova Scotia 7/14/2010 53,000,000 2.39%Westpac Banking Corp 7/12/2010 47,996,187 2.16%Deutsche Bank Ag Ny 7/6/2010 45,000,000 2.03%Barclays Capital Repo 7/1/2010 44,000,000 1.99%Credit Suisse First Boston Repo 7/1/2010 44,000,000 1.99%Barclays Bank Plc 1/7/2011 40,000,000 1.81%HSBC Tri Party C 7/1/2010 40,000,000 1.81%CSFB Tri Party C 7/1/2010 40,000,000 1.81%Deutsche Tri Party C 7/1/2010 40,000,000 1.81%Top Ten $493,241,187 22.28%
* A complete list of portfolio holdings is available from the Offi ce of the Treasurer.
Figure 2-10
LIQUIDITY FUNDInvestment Advisors at June 30, 2010 Net Asset % ofInvestment Advisor Value Fund
State Street Global Advisors $1,493,003,644 67.29%Payden & Rygel 100,657,036 4.54%PIMCO 176,020,927 7.93%Ambassador Capital Management 100,240,839 4.52%Lazard 172,298,394 7.76%Colchester Global Investors Ltd. 176,660,129 7.96%
TOTAL LF $2,218,880,969 100.00%

OFFICE OF THE STATE TREASURER, DENISE L. NAPPIER 33
Fund Facts at June 30, 2010
Investment Strategy/Goals: To participate in the growth of the U. S. economy through the ownership of do-mestic equity securities.
Performance Objective: An annual total return that is 65 to 135 basis points greater than that of the Russell 3000 after expenses.
Benchmark: Russell 3000 Index Date of Inception: July 1, 1972
Total Net Assets: $5,289,091,696 Number of Advisors: 9 external
Management Fees: $10,744,251 Operating Expenses: $2,224,959
Expense Ratio: 0.24%
Description of the FundThe Mutual Equity Fund (MEF) is an externally managed fund investing in primarily the common stocks
of U.S. corporations. MEF serves as an investment vehicle for the Pension and Trust Funds with the goal of earning a long-term real rate of return signifi cantly above the infl ation rate.
At the close of the fi scal year, MEF consisted of ten externally managed equity portfolios structured to approximate the composition of the Russell 3000 Index. The ten portfolios were managed by nine advisors grouped into fi ve style categories. By style, investments at year end were diversifi ed as 63.7% in large capi-talization, 5.1% in all capitalization 9.5% in small to mid-capitalization, 14.4% in active- extension, and 7.3% in cash equivalents and other net assets.
Portfolio CharacteristicsThe largest industry weightings at June 30, 2010 were information technology (15.8%), followed by fi nancials
(14.1%) and consumer discretionary (11.3%). (See Figure 3-3.)
The MEF’s ten largest holdings, aggregating to 13.1% of Fund investments, included a variety of blue chip companies and were broadly diversifi ed with the largest holding of 2.2% in Exxon Mobil. (See Figure 3-9.)
Market ReviewThe fi scal year began with a rally within the domestic equity markets as investor appetite for risk increased,
following the worst global recession in the post- WWII era. Over the fi rst half of the fi scal year, markets rebounded strongly across all market caps (large, mid, small) and investment styles (value, core, growth) following news of increases in home-building and automotive sales. The broad market continued to recover through March as markets were driven by performance in the consumer discretionary and industrial sectors. However, the MEF suffered in the quarter ending June 30, 2010 as all major domestic equity indices posted losses. Several events, including the European debt crisis, the Gulf of Mexico oil spill, and a Congressional vote on new fi nancial regulatory measures resulted in a sell-off by investors. All ten sectors of the S&P 500 posted losses during the last quarter of the fi scal year. The materials, industrials, fi nancials and energy sectors were particularly hit hard. Domestic equity markets posted positive returns for the one-year period ending June 30, 2010.
Performance SummaryFor the fi scal year ended June 30, 2010, the Mutual Equity Fund (MEF) posted a return of 14.01%, net of
fees and operating expenses, which underperformed the Russell 3000 Index return of 15.72% by 171 basis
2010mutual equity fund

34 FISCAL YEAR 2010 ANNUAL REPORT
PENSION FUNDS MANAGEMENT DIVISION
points. (See Figure 3-5.) The returns from the small cap portion of the portfolio were higher than the large cap returns, but the small cap segment had a lower dollar allocation than the large cap. The active exten-sion segment of the portfolio created the greatest drag on performance. During this same period, MEF’s net assets fell from $5.590 billion to $5.289 billion, a decrease of $.301 billion. Of this net total change, an increase of $.691 billion was due to net realized and unrealized gains and $1.078 billion in net cash outfl ows to participating pension plans and trusts. Offsetting this amount is an infl ow of $87 million in net investment income.
While volatility in investment returns is expected in the short-term, the Fund’s long-term performance remains the most important comparative measure. As Figure 3-4 illustrates, MEF has generated annualized total returns, net of fees, of -10.76%, -1.51%, and -0.66% over the last three, fi ve, and ten-year periods, respectively. The Fund returns underperformed the Russell 3000 for the three and fi ve-year periods by 129 and 103 basis points, respectively, and outperformed for the ten-year period by 26 basis points.
The MEF’s cumulative total returns for the three, fi ve, and ten year periods ending June 30, 2010, were -28.94%, -7.33%, and -6.42%, respectively.
Risk Profi leBased on returns over the last fi ve years, the Fund has exhibited a similar degree of risk as that of its
benchmark, the Russell 3000 Index. With a relative volatility of 1.01, the MEF’s returns have almost equal volatility to those of the Index and refl ect a strong degree of correlation, as shown by the fund’s beta of 1.00. MEF’s annual excess return during the fi ve year period, or return relative to that achieved by the benchmark, was a negative 1.03%. (See Figure 3-2.)
MUTUAL EQUITY FUNDOwnership Analysis at June 30, 2010 ($ in millions)
TERF - Teachers’ Retirement FundSERF - State Employees Retirement FundMERF - Connecticut Municipal Employees’ Retirement Fund
Figure 3-1
MUTUAL EQUITY FUND (1)
Risk Profi le at June 30, 2010
Figure 3-2
Relative Volatility 1.01Standard Deviation 17.55R2 1.00Beta 1.00Alpha -1.03
(1) Based upon returns over the last fi ve years.
Other$56.6
TERF$2,988.2
MERF$270.9
SERF$1,973.4

OFFICE OF THE STATE TREASURER, DENISE L. NAPPIER 35
MUTUAL EQUITY FUNDFiscal 2010 Industrial Sector vs. Index (%)Based on Investments in Securities, at Value (1)
Figure 3-3
MUTUAL EQUITY FUNDPeriods ending June 30, 2010
Figure 3-4
At 6/30/2010: MEF Russel 3000 % of Net Annual %of Net Annual Assets Return Assets ReturnEnergy 8.9 3.1 9.8 4.2Materials 4.0 19.3 4.0 18.3Industrials 9.1 17.9 11.6 24.2Consumer Discretionary 11.3 25.7 11.9 28.2Consumer Staples 8.6 15.5 8.7 14.9Health Care 11.2 9.9 12.2 10.5Financials 14.1 15.5 17.4 17.2Information Technology 15.8 19.8 17.9 17.0Telecommunication Services 2.7 5.2 2.8 6.0Utilities 2.9 4.3 3.7 6.9Commingled Fund 11.4 10.4 0.0 - 100.0 100.0
1 YR 3 YRS 5 YRS 10 YRS
Compounded, Annual Total Return (%) MEF 14.01 -10.76 -1.51 -0.66Russell 3000 15.72 -9.47 -0.48 -0.92
Cumulative Total Return (%) MEF 14.01 -28.94 -7.33 -6.42Russell 3000 15.72 -25.80 -2.39 -8.82
(1) Excludes the Liquidity Fund.
PENSION FUNDS MANAGEMENT DIVISION
MUTUAL EQUITY FUNDAnnual Total Return
Figure 3-5
MUTUAL EQUITY FUNDComponents of Total Return ($ in millions)
Figure 3-6
MUTUAL EQUITY FUNDComprehensive Profi le for the Fiscal Years ending June 30,
Figure 3-7
2010 2009 2008 2007 2006 MEF Russell MEF Russell MEF Russell MEF Russell MEF Russell # of Issues 1,914 3,000 1,954 3,000 2,206 3,000 2,175 3,000 2,033 3,000
Cap ($ Bil) $57.2 $59.0 $52.8 $58.7 $69.6 $72.2 $81.1 $81.5 $67.9 $69.3P/E 16.3 17.5 20.5 19.8 18.5 18.1 17.6 18.8 17.0 18.2Div Yield 1.90% 2.00% 1.98% 2.19% 1.90% 2.10% 1.60% 1.70% 1.70% 1.80%ROE 15.9% 15.8% 18.4% 20.2% 19.0% 20.2% 19.5% 20.0% 19.3% 19.1% P/B 2.7 2.9 2.9x 3.0x 3.6x 3.8x 3.6x 4.0x 3.5x 3.6x Cash & Equiv. 0.9% 0.0% 9.7% 0.0% 0.8% 0.0% 0.7% 0.0% 1.0% 0.0%
Source: Monthly Bundle-Equity Portfolio Characteristics under Russell 3000
-30%-25%-20%-15%-10%
-5%0%5%
10%15%20%25%
Russell 3000MEF
10090807060504030201 $-2500
$-2000
$-1500
$-1000
$-500
$0
$500
$1000
$1500
$2000
Capital AppreciationIncome
10090807060504030201
$11.3
($1,190.9)
($840.3)
$1,355.6
$620.2$849.1
$1,610.7
($1,223.0)
($2,278.9)
$777.3

36 FISCAL YEAR 2010 ANNUAL REPORT
PENSION FUNDS MANAGEMENT DIVISION
MUTUAL EQUITY FUNDInvestment Advisors at June 30, 2010
Figure 3-8
MUTUAL EQUITY FUNDTen Largest Holdings* at June 30, 2010
Figure 3-9
(1) Other represents cash equivalents and other net assets.
Net Asset % ofInvestment Advisor Value Fund Large Cap $3,369,646,357 63.71%BGI Barclays 765,654,045 14.48%T. Rowe Price Associates 741,404,050 14.01%State Street Global Advisors 1,862,588,262 35.22%
Active Extension 762,654,863 14.42%AXA Rosenberg Investment Management 187,719,220 3.55%Pyramis 291,501,068 5.51%Numeric 283,434,575 5.36%
All Cap 268,916,132 5.08%Capital Prospects 135,861,230 2.57%FIS Group, Inc. 133,054,902 2.51%
Small/Mid Cap Enhanced 371,812,347 7.03%AXA Rosenberg 371,812,347 7.03%
Small/Mid Cap Active 129,038,328 2.44%Bivium 129,038,328 2.44%
Other (1) 387,023,669 7.32%
TOTAL MEF 5,289,091,696 100.00%
Security Name Sector Market Value %
Exxon Mobil Corp Energy $117,859,718 2.23%
Apple Inc Information Tech 80,523,053 1.52%
Microsoft Technology 75,320,543 1.42%
Proctor & Gamble Co Consumer Staples 72,737,506 1.37%
JP Morgan Chase & Co Financials 64,376,818 1.22%
AT&T Inc Telecomm Svcs 63,320,107 1.20%
Johnson & Johnson Health Care 59,811,952 1.13%
Wells Fargo & Co Financials 54,879,258 1.04%
Intl Business Machines Information Tech 52,635,202 1.00%
Bank of America Corp Financials 51,993,821 0.98%
Top Ten $693,457,978 13.11%
* A complete list of portfolio holdings is available from the Offi ce of the Treasurer.

OFFICE OF THE STATE TREASURER, DENISE L. NAPPIER 37
2010core fi xed income fundFund Facts at June 30, 2010
Investment Strategy/Goals: To provide a long-term real rate of return above the infl ation rate and provide a stream of income to meet the cash fl ow needs of the pension and trust funds, by investing in a range of fi xed income securities.
Performance Objective: To achieve a net return that exceeds its benchmark by 37 to 125 basis points per an-num, over rolling three to fi ve year periods.
Benchmark: Barclays Capital U. S. Aggregate
Date of Inception: November 1, 2007 Total Net Assets: $2,701,446,209
Number of Advisors: 5 external Management Fees: $3,499,757
Operating Expenses: $790,443 Expense Ratio: 0.15%
Description of the FundThe Core Fixed Income Fund (“CFIF”) is an externally managed fund investing primarily in domestic fi xed
income securities with the goal of achieving a long-term, real rate of return above the infl ation rate and to gener-ate income. Diversifi cation of the assets across the spectrum of fi xed income classes and among multiple money managers is expected to reduce the volatility of investment returns under various economic scenarios. Fixed income securities include both fi xed and variable rate coupon bonds that are issued by U.S. federal and state governments, domestic corporations and municipalities, as well as securitized assets such as mortgage-backed and asset-backed securities.
At June 30, 2010 the CFIF was managed by one passive and four active money managers, representing 38% and 62% of the Fund, respectively. The active strategies included a fund-of-funds manager for the Connecticut Horizon Fund.
The CFIF’s long-term objective has been to achieve an annual return, net of management fees and operating expenses, of between 37.5 and 125 basis points in excess of the Barclays Capital U.S. Aggregate, which is widely considered to be a proxy for the performance of the overall U.S. bond market.
Portfolio CharacteristicsCFIF continues to be well diversifi ed across the spectrum of available fi xed income securities. The Fund was
invested in U.S. Government (22%), agency (36%), corporate (24%), mortgage-backed (8%) and asset-backed (4%) securities. The remaining 6% was invested in the Liquidity Fund and other assets. For the purpose of en-hancing value, each CFIF active manager is given some discretion to deviate from the Barclays Capital Aggregate in the management of its funds. This active investment management can result in weighting differences between CFIF and the Barclays Capital Aggregate in terms of sectors, quality ratings and maturities. The Fund’s average quality rating of AA-1, as judged by Moody’s Investor Services, was the same as the Barclays Aggregate rating. At June 30, 2010, the CFIF was under weighted U.S. Treasury and agency securities and over weighted corporate bonds, mortgage-backed securities and asset backed securities versus the Barclays Capital Aggregate. (See Figure 4-4.)
Market ReviewFiscal 2010 was a year in which the global economy began to recover from the worst recession in the post-
WWII era. Investors became more confi dent with market conditions, leading them to favor riskier products, which in turn led to credit spreads narrowing. Specifi cally, corporate bonds were especially strong performers benefi ting from investors seeking alternatives to Treasuries, as the fi nancial stability of corporations improved relative to that of the Government. Collateralized mortgage-backed securities (CMBS) performed well as investors showed

38 FISCAL YEAR 2010 ANNUAL REPORT
PENSION FUNDS MANAGEMENT DIVISION
increase interest for bonds that were anticipated to be eligible for the Government’s legacy TALF and PPIP programs. Treasuries performed poorly into early 2010, as concerns over Treasury issuance and poor auc-tion results resulted in a sell-off, causing an increase in yields. However, over the quarter ending June 2010, concerns regarding debt challenges facing Greece and several of its European neighbors, along with unease associated with domestic economic data, led many investors to favor higher quality assets. Treasuries and investment grade credit rallied over the fi nal quarter amid a fl ight-to-quality.
Performance SummaryThe CFIF’s value as of June 30, 2010 was $2.7 billion, down from $3.2 billion one year earlier. Of this
$458 million decline, $787.1 million was due to net cash outfl ows from participating pension and trust funds, $206.3 million from net realized and unrealized gains, and $122.9 million from net investment income.
For the fi scal year ended June 30, 2010 the Core Fixed Income Fund generated a total return of 11.81%, net of fees and operating expenses, outperforming the benchmark return of 9.50% by 231 basis points. The out performance for the fi scal year was primarily attributable to underweighting of U.S. Treasuries and over weightings of mortgage-backed and credit securities. For the trailing three, fi ve and ten-year periods, CFIF’s compounded annual total returns were 6.70%, 5.07% and 6.45% respectively, net of all expenses The cumulative total returns for the three, fi ve, and ten-year periods ending June 30, 2010, were 21.48%, 28.08% and 86.90%, respectively. (See Figure 4-8.)
Risk Profi leGiven CFIF’s investment policies and objectives, the Fund is exposed to various forms of risk, such as
credit default risk, interest rate risk, liquidity risk, infl ation risk, reinvestment risk and counter party risk. These risks are monitored on an on-going basis and actions are taken to mitigate identifi ed risks.
External rating agencies assign credit ratings to individual securities refl ecting their view of the underly-ing fi rm’s credit worthiness or in the case of securitized debt, the underlying assets. U.S. Treasury bonds, which carry the highest rating of AAA, are backed by the full faith and credit of the U.S. Government and, therefore, have no credit risk. The overall quality of the Core Fixed Income Fund is very high quality at AA-1. Sixty nine percent of the Fund is rated AAA the same average quality of the AAA Barclays Capital Aggregate. (See Figure 4-5.)

OFFICE OF THE STATE TREASURER, DENISE L. NAPPIER 39
PENSION FUNDS MANAGEMENT DIVISION
CORE FIXED INCOME FUNDOwnership Analysis at June 30, 2010 ($ in millions)
Figure 4-1 Figure 4-2
CORE FIXED INCOME FUNDModifi ed Duration vs. Index (1) (in Years)
Figure 4-3 Figure 4-4
TERF - Teachers’ Retirement FundSERF - State Employees’ Retirement FundMERF - Connecticut Municipal Employees’ Retirement Fund
CORE FIXED INCOME FUND (1)
Risk Profi le at June 30, 2010
Relative Volatility 1.12Standard Deviation 4.13R2 0.84Beta 1.02Alpha -0.47
(1) Based upon returns over the last fi ve years.
(1) Computed without the effect of Cash and other Net Assets.
CORE FIXED INCOME FUNDDistribution by Sector at June 30, 2010Based on Investments in Securities, at Value
Barclays CFIF Aggregate Variance
Treasury 22.0% 32.7% -10.7%
Agency 36.2% 41.1% -4.9%
Corporate 23.7% 18.8% 4.9%
Mortgage-Backed 8.2% 3.1% 5.1%
Asset-Backed 4.0% 0.3% 3.7%
Other1 5.9% 4.0% 1.9%
TOTAL 100.0% 100.0%
(1) Other category includes Liquidity Fund and other assets.
MERF$252.3
TERF$1,421.5 Other
$111.7
SERF$915.9
4.0
4.5
5.0
Barclays Aggregate*CFIF
6/30/106/30/09
4.60
4.50
4.20
4.30
CORE FIXED INCOME FUNDDistribution by Quality Rating at June 30, 2010Based on Investments in Securities, at Value
Figure 4-5
CORE FIXED INCOME FUNDDistribution by Coupon at June 30, 2010Based on Investments in Securities, at Value
Figure 4-6
Aaa 68.6%
AA-1 1.5%
AA-2 to A-1 7.0%
A-2 to BAA-1 10.3%
Less than BAA-1 8.6%
Not Rated1 4.0%
Total 100.0%
(1) Represents securities for which ratings are unavailable.
Liquidity Fund8.01-10.00%
6.01-8.00%
Unclassified
4.01-6.00%
Greater than 10.01%
0.00-4.00%

40 FISCAL YEAR 2010 ANNUAL REPORT
PENSION FUNDS MANAGEMENT DIVISION
CORE FIXED INCOME FUNDInvestment Advisors at June 30, 2010
Figure 4-11
Net Asset % ofInvestment Advisor Value Fund State Street Global Advisors $1,038,045,975 38.43%BlackRock Financial Mgmnt, Inc. 662,480,061 24.52%Wellington 531,174,461 19.66%Phoenix 324,967,803 12.03%Progress 131,722,970 4.88%Other (1) 13,054,939 0.48%TOTAL CFIF $2,701,446,209 100.00%
CORE FIXED INCOME FUNDAnnual Total Return
Figure 4-9 Figure 4-10
CORE FIXED INCOME FUNDDuration Distribution at June 30, 2010Based on Investments in Securities, at Value
CORE FIXED INCOME FUNDPeriods ending June 30, 2010
Figure 4-8
0-3 Years 44.3%3-5 Years 20.7%5-7 Years 11.1%7-10 Years 8.6%10+ Years 9.2%Unknown(1) 1.6%Liquidity Fund 4.5%Total 100.0%
1 YR 3 YRS 5 YRS 10 YRS
Compounded, Annual Total Return (%) CFIF 11.81 6.70 5.07 6.45BC Aggregate 9.50 7.55 5.54 6.47
Cumulative Total Return (%) CFIF 11.81 21.48 28.08 86.90BC Aggregate 9.50 24.39 30.94 87.14
Figure 4-7
(1) Other represents Liquidity Fund, other assets and terminated advisor balances.
-2%
0%
2%
4%
6%
8%
10%
12%
Barclays AggregateCFIF
10090807060504030201
CORE FIXED INCOME FUNDComprehensive Profi le for the Fiscal Year ending June 30,
* Note: Beginning weights.
(1) Represents securities for which the duration could not be calculated by the custodian..
2010 2009 CFIF BC AGG* CFIF LBAI*Number of Issues 3,398 7,755 3,421 8,454
Average Coupon 4.70% 4.50% 4.90% 5.00%
Yield Maturity 3.10% 2.70% 5.70% 4.00%
Average Maturity 6.60 6.10 6.70 5.90
Modifi ed Duration 4.50 4.30 4.60 4.20
Average Quality AA-1 AA-1 AA-1 AAA
Liquidity Fund* 4.5% 0.0% 6.8% 0.0%

OFFICE OF THE STATE TREASURER, DENISE L. NAPPIER 41
CORE FIXED INCOME FUNDTen Largest Holdings(1) at June 30, 2010
Figure 4-12
Market Security Name Maturity Value %
U.S. Treasury N/B 5/15/2040 35,747,721 1.28%FNMA TBA Aug 30 Single Fam 12/1/2099 27,365,490 0.98%U.S. Treasury Bonds 2/15/2015 25,408,076 0.91%U.S. Treasury N/B 8/31/2011 24,356,816 0.87%U.S. Treasury N/B 10/31/2014 21,562,948 0.77%U.S. Treasury N/B 5/15/2020 21,538,205 0.77%FHLMC TBA Aug 30 Gold Single 12/1/2099 18,332,466 0.66%FNMA TBA Aug 30 Single Fam 12/1/2099 18,132,584 0.65%FNMA Pool 745275 2/1/2036 16,724,202 0.60%FNMA Pool 888876 5/1/2033 15,272,804 0.55%Top Ten 224,441,312 8.04%
(1) A complete list of portfolio holdings is available from the Offi ce of the Treasurer.
PENSION FUNDS MANAGEMENT DIVISION
Figure 4-13
CORE FIXED INCOME FUNDQuarterly Current Yield (1) vs. Indices (%)
6/30/10 3/31/10 12/31/09 9/30/09 6/30/09CORE FIXED INCOME 4.53 4.71 4.82 7.47 7.90Barclays Aggregate 4.18 4.38 4.51 4.63 4.80Citigroup 3 Month T-Bill 0.17 0.15 0.05 0.11 0.19Barclays Treasury 2.90 3.09 3.19 3.25 3.47Barclays Agency 3.05 3.20 3.27 3.40 3.59Barclays Mortgage 4.80 4.96 5.05 5.06 5.20Barclays Corporate 5.48 5.62 5.74 5.79 6.20Barclays Asset Backed 4.38 4.56 4.76 4.79 5.36
(1) Current Yield represents annual coupon interest divided by the market value of securities.
* All of the Barclays Capital indicies were formerly known as the Lehman Brothers indicies.
42 FISCAL YEAR 2010 ANNUAL REPORT
2010infl ation linked bond fundFund Facts at June 30, 2010
Investment Strategy/Goals: To invest primarily in U.S. infl ation-linked securities with a goal of achieving a long-term real rate of return above the infl ation rate.
Performance Objective: To achieve a net return that exceeds its benchmark by 20 to 40 basis points per an-num, over rolling three to fi ve year periods.
Benchmark: Barclays Capital U.S. Treasury Infl ation Protection Securities (“BC TIPS”) Index.
Date of Inception: November 1, 2007 Total Net Assets: $1,062,889,500
Number of Advisors: 2 external Management Fees: $901,014
Operating Expenses: $289,217 Expense Ratio: 0.13
Description of the FundDescription of the Fund
The Infl ation Linked Bond Fund (“ILBF”) is an externally managed fund investing primarily in U.S.Treasury Infl ation Protection Securities (“TIPS”), although nominal U.S. Treasuries and foreign government securities can be included on a limited basis. The goal of the Fund is to achieve a long-term rate of return above the infl ation rate and provide a source of interest income to help offset the outfl ow of retirement benefi t payments. Infl ation-linked bonds can provide protection against rampant infl ation and this asset class has low to negative correlations to other asset classes within the CRPTF. An infl ation-linked bond pays a fi xed real coupon on an infl ation-adjusted principal amount. Therefore, while the rate of the coupon payment is locked the actual dollars of interest earned will vary according to the change in principal. The ultimate amount of interest paid over the life of the bond will depend on the change in infl ation. At June 30, 2010, the Fund had two investment advisors.
The ILBF’s long-term objective has been to achieve an annual return, net of management fees and operat-ing expenses, of between 20 and 40 basis points in excess of the Fund’s benchmark.
Portfolio CharacteristicsThe ILBF is comprised mainly of U.S. TIPS. The Fund has Moody’s Investor Services highest quality rating,
AAA, matching the quality rating of the benchmark. The Fund’s average coupon at June 30, 2010 was 2.25% versus 2.19% for the benchmark. The average maturity of Fund and its benchmark were 9.15 years and 9.17 years, respectively. (Figure 5-9.)
Market ReviewDuring the fi rst half of the fi scal year, improvements in the economy, reductions in defl ationary concerns,
fi rmer commodity prices and an increase in nominal Treasury supply drove the performance of the TIPS market. Crude oil prices began the fi scal year at $72/barrel and jumped up to $80/barrel by the end of December. The fi ve year TIPS’ breakeven rate, defi ned as the difference between nominal U.S. Treasury bonds and the TIPS rate, was fl at during the quarter ending September 2009 but returned close to its long-term average ending 2009 at 2.2%.
During the beginning of 2010, long-term infl ation expectations fell after news of weaker core infl ation. However, as the US economy slowed down, investors became more risk averse. In conjunction with a dip in commodity prices, the TIPS market improved on an absolute basis towards the end of the fi scal year. However, the high supply and low price of oil negatively infl uenced the relative performance of the TIPS market over the last half of the fi scal year. Crude oil prices increased during the beginning of 2010 to $84/barrel but ended the fi scal year down at $76/barrel. The fi ve year TIPS breakeven rate dipped in 2010 to 1.6%, lower than the long-term average.

OFFICE OF THE STATE TREASURER, DENISE L. NAPPIER 43
PENSION FUNDS MANAGEMENT DIVISION
Performance SummaryThe ILBF’s value as of June 30, 2010 was $1,062.9 million, an increase of $ 225.6 million from the prior
fi scal year. Of this total, $142 million was due to net cash infl ows from participating pension and trust funds and $34.1 million of net investment income, plus $ 49.5 million from net realized and unrealized gains.
For the fi scal year ended June 30, 2010 the ILBF generated a total return of 9.48%, net of fees and operating expenses, underperforming the benchmark return of 9.52% by 4 basis points. For the trailing three year period, ILBF’s compounded annual total return was 8.47%, net of fees and operating expenses, outperforming the benchmark by 85 basis points (Figure 5-7.)
Risk Profi leThe major risk facing the Infl ation Linked Bond Fund is a rise in real interest rates. Real interest rates
are primarily driven by expectations for real growth in the economy and for monetary policy. Economic growth and tight monetary policy to stem infl ationary pressures are conditions that can drive up real interest rates. A rise in real interest rates decreases the effectiveness of TIPS as an infl ation hedge, as bond prices fall.

44 FISCAL YEAR 2010 ANNUAL REPORT
PENSION FUNDS MANAGEMENT DIVISION
INFLATION LINKED BOND FUNDOwnership Analysis at June 30, 2010 ($ in millions)
Figure 5-1 Figure 5-2
INFLATION LINKED BOND FUNDModifi ed Duration vs. Index (1) (in Years)
Figure 5-3 Figure 5-4
INFLATION LINKED BOND FUNDDistribution by Quality Rating at June 30, 2010Based on Investments in Securities, at Value
Figure 5-5
INFLATION LINKED BOND FUNDDistribution by Coupon at June 30, 2010Based on Investments in Securities, at Value
Figure 5-6
TERF - Teachers’ Retirement FundSERF - State Employees Retirement FundMERF - Connecticut Municipal Employees’ Retirement Fund (1) Computed without the effect of Cash and other Net Assets.
INFLATION LINKED BOND FUNDDistribution by Sector at June 30, 2010Based on Investments in Securities, at Value
ILBF BC US TIPS* Variance
Treasury 96.2% 100.0% -3.8%
Agency 0.0% 0.0% 0.0%
Corporate 0.0% 0.0% 0.0%
Foreign 0.0% 0.0% 0.0%
Liquidity Fund 3.8% 0.0% 3.8%
TOTAL 100.0% 100.0%
Aaa 100.0%
AA-1 0.0%
AA-2 to A-1 0.0%
A-2 to BAA-1 0.0%
Less than BAA-1 0.0%
Not Rated1 0.0%
Total 100.0%
(1) Represents securities for which ratings are unavailable.
MERF$136.1
TERF$548.9
Other$26.6
SERF$351.3
*Liquidity Fund
2.01-4.00%
0.00-2.00%
0
1
2
3
4
5
6
7
8
BC US TIPS*ILBF
6/30/106/30/09
7.747.717.94 7.77
INFLATION LINKED BOND FUNDDuration Distribution at June 30, 2010Based on Investments in Securities, at Value
0-3 Years 54.2%3-5 Years 5.8%5-7 Years 10.8%7-10 Years 22.6%10+ Years 2.8%Unknown(1) 0.0%Liquidity Fund 3.8%Total 100.0%
(1) Represents securities for which the duration could not be calculated by the custodian.
*Note: Ending weights

OFFICE OF THE STATE TREASURER, DENISE L. NAPPIER 45
PENSION FUNDS MANAGEMENT DIVISION
INFLATION LINKED BOND FUNDInvestment Advisors at June 30, 2010
Figure 5-11
INFLATION LINKED BOND FUNDTen Largest Holdings (1) at June 30, 2010
Net Asset % ofInvestment Advisor Value Fund Brown Brothers Harriman $600,761,965 56.52%Hartford Investment Mgmt Co. 461,830,308 43.45%Other (1) 297,227 0.03%TOTAL ILBF $1,062,889,500 100.00%
Market Security Name Maturity Value %
U.S. Treasury Bonds 01/15/25 99,213,493 9.27%U.S. Treasury Bonds 01/15/26 87,043,947 8.13%U.S. Treasury Notes 01/15/16 84,301,286 7.87%U.S. Treasury Notes 04/15/11 72,610,257 6.78%U.S. Treasury Notes 01/15/14 66,797,952 6.24%U.S. Treasury Notes 07/15/16 64,307,460 6.01%U.S. Treasury Notes 01/15/17 57,903,348 5.41%U.S. Treasury Notes 01/15/15 54,088,528 5.05%U.S. Treasury Bonds 04/15/28 52,389,083 4.89%U.S. Treasury Notes 07/15/12 46,685,398 4.36%Top Ten 685,340,752 64.01%
INFLATION LINKED BOND FUNDAnnual Total Return
Figure 5-9
Figure 5-10
INFLATION LINKED BOND FUNDPeriods ending June 30, 2010
Figure 5-8
1 YR 3 YRS 5YRS
Compounded, Annual Total Return (%) ILBF 9.48 8.47 5.35LB U.S. Tips 9.52 7.62 4.98
Cumulative Total Return (%) ILBF 9.48 27.63 29.79LB U.S. Tips 9.52 24.64 27.49
Figure 5-7
(1) Other represents Liquidity Fund, other assets and terminated advisor balances.
(1) A complete list of portfolio holdings is available from the Offi ce of the Treasurer.
-5%
0%
5%
10%
15%
20%
BC US TIPS*ILBF
1009080706
INFLATION LINKED BOND FUNDComprehensive Profi le for the Fiscal Year ending June 30,
2010 2009 BC US BC US ILBF TIPS ILBF TIPS*
Number of Issues 26 29 26 27
Average Coupon 2.25% 2.19% 2.22% 2.28%
Average Maturity 9.15 9.17 9.23 9.19
Modifi ed Duration 7.71 7.74 7.94 7.77
Average Quality AAA AAA AAA AAA
Liquidity Fund (1) 3.8% 0.0% 1.6% 0.0%
(1) Ending Weights
* The Barclays Capital U. S. TIPS Index was formerly known as the Lehman Brothers U. S. TIPS Index.

46 FISCAL YEAR 2010 ANNUAL REPORT
2010Fund Facts at June 30, 2010
Investment Strategy/Goals: To invest primarily in debt securities of select foreign emerging markets with a goal of portfolio diversifi cation and enhanced risk-adjusted returns.
Performance Objective: To achieve a net return that exceeds its benchmark by 100 to 200 basis points per an-num, over rolling three to fi ve year periods.
Benchmark: J.P. Morgan Emerging Market Bond Index (EMBI) Global Index.
Date of Inception: November 1, 2007 Total Net Assets: $1,175,862,368
Number of Advisors: 5 external Management Fees: $4,544,477
Operating Expenses: $385,283 Expense Ratio: 0.43%
Description of the FundThe Emerging Market Debt Fund (EMDF) is an externally managed fund investing primarily in government
and corporate debt securities of select foreign emerging markets with a goal of achieving a long-term real rate of return above the infl ation rate. The economies and fi nancial markets of emerging countries have historically had lower correlations to U.S. markets and provide desirable risk diversifi cation for the portfolio. Emerging markets are expected to have higher economic growth rates than developed countries. The EMDF money managers have different investment approaches and generate returns from both country and currency selection. Securities can be dollar denominated or in the local currency of the country, with the latter sometimes hedged back to the U.S. dollar. Sovereign loans, Brady bonds and Eurobonds, along with quasi-sovereigns, multinational companies and local corporate debt are examples of securities held in this fund.
At June 30, 2010, the Fund had fi ve money managers.
Portfolio CharacteristicsThe Emerging Market Debt Fund is a diversifi ed portfolio with an overall yield to maturity of 6.33%. This com-
pares favorably to the benchmark yield to maturity of 5.86%. (See Figure 6-11.) The Fund is diversifi ed across geographic regions with the highest weighting in Latin American countries at 40%. Europe was the second highest regional concentration in the portfolio and was also the highest underweight compared to the index. Investments in Africa also out weighed those of the index. (See Figure 6-3.) The average quality of EMDF was Baa-3, the same quality as the benchmark. (See Figure 6-11.) The distribution by quality ratings for the Fund is portrayed in Figure 6-4. With a duration lower than the index, 6 years versus 7.1 years, the fund has less interest rate risk than the index.
Market ReviewThe emerging debt markets began the fi scal year strongly, rallying behind news of recovering market condi-
tions. Specifi cally, optimistic views of the global GDP recovery, the loosening of credit conditions and government policies propelled the emerging debt market during the quarter ending September 2009. The rally continued into the end of 2009; however fears of central banks abandoning their economic stimulus plans, a rise in US interest rates as well as the strengthening of the US dollar slowed the emerging debt markets rally. Regardless of these setbacks, emerging debt market spreads continued to tighten. News of the European sovereign debt crisis and the debt crisis involving state-owned Dubai World led investors to favor emerging market sovereigns in lieu of their developed market counterparts. Sovereign risk concerns temporarily dwindled during the beginning of 2010 after reports of EU fi nancial aid and hopes of IMF involvement in the Greek debt crisis. An increase in large fl ows into the emerging market debt asset class, fundamental improvements in credit quality, improvements in global liquid-ity and attractive bond yield curves led investors into higher yielding emerging market bonds. However, over the quarter ending June 2010, emerging debt market spreads widened in most emerging market countries as fears of contagion of the European debt crisis outside of the Euro zone were met. As a result, S&P downgraded Greece
emerging market debt fund

OFFICE OF THE STATE TREASURER, DENISE L. NAPPIER 47
PENSION FUNDS MANAGEMENT DIVISION
to junk status and downgraded Portugal and Spain further fueling the mounting sovereign debt problems. The emerging debt markets faced extreme volatility in May, ending the month lower. Sentiment improved in June, reopening the new issue market, which was closed during the economic crisis.
Performance SummaryThe EMDF’s value as of June 30, 2010 was $1.2 billion, a rise of $.44 million. Of this increase, $199
million was due to net cash outfl ows from participating pension and trust funds and $87.3 million was gener-ated from net investment income. Net realized and unrealized gains contributed $155.8 million.
For the fi scal year ended June 30, 2010 the Emerging Market Debt Fund outperformed its benchmark by 512 basis points. It generated a return of 23.02%, net of fees and operating expenses compared the benchmark return of 17.90%. For the trailing three year and fi ve year periods, EMDF’s compounded annual total returns were 7.78% and 9.81%, respectively, net of fees. The cululative return over the past fi ve years was 1166 basis points more than the benchmark. (See Figure 6-7.)
Risk Profi leGiven EMDF’s investment policies and objectives, the Fund is exposed to various forms of risk. These
include, but are not limited to interest rate risk, currency risk, purchasing power risk, default risk, and rein-vestment risk. In addition, the Fund is potentially exposed to geopolitical risk. These risks are monitored on an on-going basis and actions are taken as appropriate to mitigate identifi ed risks.

48 FISCAL YEAR 2010 ANNUAL REPORT
PENSION FUNDS MANAGEMENT DIVISION
EMERGING MARKET DEBT FUNDOwnership Analysis at June 30, 2010 ($ in millions)
Figure 6-1 Figure 6-2
EMERGING MARKET DEBT FUNDModifi ed Duration vs. Index (1) (in Years)
Figure 6-3 Figure 6-4
EMERGING MARKET DEBT FUNDDistribution by Quality Rating at June 30, 2010Based on Investments in Securities, at Value
Figure 6-5
EMERGING MARKET DEBT FUNDDistribution by Coupon at June 30, 2010Based on Investments in Securities, at Value
Figure 6-6
TERF - Teachers’ Retirement FundSERF - State Employees Retirement FundMERF - Connecticut Municipal Employees’ Retirement Fund (1) Computed without the effect of Cash and other Net Assets.
EMERGING MARKET DEBT FUNDDistribution by Region at June 30, 2010
Aaa 2.4%
AA-1 0.0%
AA-2 to A-1 1.4%
A-2 to BAA-1 19.1%
Less than BAA-1 37.9%
Not Rated(1) 39.2%
Total 100.0%
(1) Represents securities for which ratings are unavailable.
MERF$78.2
TERF$656.0
Other$21.6
SERF$420.1
*Other
Unclassified
Greater than 10.01%
8.01-10.00%
6.01-8.00%
4.01-6.00%
0.00-4.00%
0
1
2
3
4
5
6
7
8
JP Morgan EMBI Global Index
EMDF
06/30/1006/30/09
6.01
7.09
5.936.37
EMERGING MARKET DEBT FUNDDuration Distribution at June 30, 2010Based on Investments in Securities, at Value
0-3 Years 12.3%3-5 Years 14.9%5-7 Years 40.1%7-10 Years 12.7%10+ Years 11.0%Unknown(1) 4.7%Liquidity Fund 4.3%Total 100.0%
(1) Represents securities for which the duration could not be calculated by the custodian.
* Includes Liquidity Fund and other assets. Note: Ending weights.
JP Morgan EMDF EMBI Variance
Asia 16.0% 17.1% -1.1%
Africa 5.9% 2.9% 3.0%
Europe 27.4% 32.4% -5.0%
Latin America 40.4% 39.0% 1.4%
Middle East 2.2% 1.9% 0.3%
United States 8.1% 6.7% 1.4%
TOTAL 100.0% 100.0%

OFFICE OF THE STATE TREASURER, DENISE L. NAPPIER 49
PENSION FUNDS MANAGEMENT DIVISION
EMERGING MARKET DEBT FUNDInvestment Advisors at June 30, 2010
Figure 6-11
EMERGING MARKET DEBT FUNDTen Largest Holdings* at June 30, 2010
Net Asset % ofInvestment Advisor Value Fund Ashmore $275,397,208 23.42%Stone Harbor Investment Partners 258,043,051 21.95%ING Investment Management 204,085,677 17.36%Pyramis 220,008,611 18.71%UBS Global Asset Management 216,987,326 18.45%Other (1) 1,340,495 0.11%TOTAL EMDF $1,175,862,368 100.00%
Market Security Name Maturity Value %
Russian Federation 03/31/30 32,278,161 2.79%Nota Tesouro Nacional 01/01/21 19,304,440 1.67%Republic of Argentina 03/28/11 18,368,845 1.59%UBS Glam REF 70325 03/05/11 12,458,890 1.08%UBS Glam REF 70325 03/05/15 12,243,246 1.06%Republic of Indonesia 03/04/19 12,175,625 1.05%UBS Glam REF 70491 03/20/17 10,605,430 0.92%South Africa (Republic) 12/21/18 10,496,341 0.91%Republic of Poland 07/15/19 10,315,502 0.89%Brazil (FED REP) 05/15/45 10,142,666 0.88%Top Ten $148,389,146 12.84%
EMERGING MARKET DEBT FUNDAnnual Total Return
Figure 6-9 Figure 6-10
EMERGING MARKET DEBT FUNDPeriods ending June 30, 2010
Figure 6-8
1 YR 3 YRS 5YRS
Figure 6-7
(1) Other represents Liquidity Fund, other assets and terminated advisor balances.
* A complete list of portfolio holdings is available from the Offi ce of the Treasurer.
-5%
0%
5%
10%
15%
20%
25%
JP Morgan EMBI Global Index
EMDF
1009080706
EMERGING MARKET DEBT FUNDComprehensive Profi le for the Fiscal Year ending June 30,
2010 2009 EMDF EMBI EMDF EMBI
Number of Issues 475 225 391 203
Yield to Maturity 6.33% 5.86% 14.48% 7.77%
Average Maturity 10.19% 12.40% 10.98% 12.30%
Modifi ed Duration 6.01 7.09 5.93 6.37
Average Quality BAA-3 BAA-3 BA-1 BA-1
*Other 6.7% 0.0% 6.9% 0.0%
* Includes Liquidity Fund and other assets. Note: Ending weights
Compounded, Annual Total Return (%) EMDF 23.02 7.78 9.81JP Morgan EMBI Global Index 17.90 8.21 8.16
Cumulative Total Return (%) EMDF 23.02 25.19 59.68JP Morgan EMBI Global Index 17.90 26.69 48.02

50 FISCAL YEAR 2010 ANNUAL REPORT
2010Fund Facts at June 30, 2010
Investment Strategy/Goals: To invest in below investment grade debt securities with a goal of achieving a long-term real rate of return above the infl ation rate.
Performance Objective: To achieve a net return that exceeds its benchmark by 150 to 300 basis points per an-num, over rolling three to fi ve year periods.
Benchmark: Citigroup High Yield Market Index
Date of Inception: November 1, 2007 Total Net Assets: $692,764,499
Number of Advisors: 4 external Management Fees: $2,544,771
Operating Expenses: $239,169 Expense Ratio: 0.39%
Description of the FundThe High Yield Debt Fund (HYDF) is an externally managed fund investing in below investment grade
debt securities with a goal of achieving a long-term real rate of return above the infl ation rate. This asset class pays a higher interest rate than investment grade credit to compensate the investor for higher default risk. Combining top-down macro analysis with fundamental bottom-up security selection, the Fund managers identify distressed corporations that have upside potential. Higher interest income and security price apprecia-tion are the drivers of investment return.
At June 30, 2010 the Fund had four money managers. (See Figure 7-11.)
The HYDF’s long-term objective is to achieve an annual return, net of management fees and operating expenses, of between 150 and 300 basis points in excess of the Citigroup High Yield Market Index over rolling three-to-fi ve year periods.
Portfolio CharacteristicsThe HYDF is comprised of 679 securities and is well diversifi ed across a range of corporate high yield
securities, predominantly in the U. S. Two of the fund’s managers tend to invest in the higher quality end of the spectrum while the other two will consider opportunities in lower quality investments. The Fund’s average quality rating was B-2, matching the average quality of the benchmark. (See Figure 7-10.) At June 30, 2010, two-thirds of the portfolio’s investments had maturities in the three to seven year time frame.
Market ReviewAs investors began to show a willingness to take on more risk, the bond market saw a decline in credit
spreads in high yield securities during the fi scal year ended June 30, 2010. As a result, high yield bonds dis-played strong returns at the beginning of the fi scal year, continuing the rally that began in early 2009. Over the fi rst three quarters of the fi scal year, CCC-rated bonds were the best performers versus higher-quality bonds as investors sought higher yielding, riskier assets. High yield bonds returned positive performance in eleven out of the twelve months in 2009, resulting in the asset class’s best performance on record. The rally began to slow down in the quarter ending March 2010, but high yield continued to generate positive returns due to opti-mistic economic news and improved corporate balance sheets. Over the quarter ending June 2010, investors began to question the legitimacy of the market recovery. Concerns regarding debt challenges facing Greece and several of its European neighbors, along with unease associated with domestic economic data, led many investors to seek higher quality assets, leaving high yield bonds out of favor. BB-rated bonds became the best performer, contrasting the strong performance of CCC-rated bonds throughout most of the fi scal year.
high yield debt fund
OFFICE OF THE STATE TREASURER, DENISE L. NAPPIER 51
PENSION FUNDS MANAGEMENT DIVISION
Performance SummaryThe HYDF’s value as of June 30, 2010 was $692.8 million, a decline of $40.4 million since June 2009.
This decrease was the result of, $206.7million from net cash outfl ows to participating pension and trust funds, $63.7 million from net investment income and $102.6 million from net realized and unrealized gains.
For the fi scal year ended June 30, 2010 the HYDF gained 24.5%, net of fees and operating expenses, compared to the benchmark return of 25.6%. Over the fi ve year period, HYDF had an annualized return of 6.4% versus the index return of 6.7%. On a cumulative basis over the same period, this fund returned 36.5% compared to the index return of 38% (See Figure 7-8.)
Risk Profi leGiven the HYDF’s investment policies and objectives, the Fund is exposed to several forms of risk. These
include, but are not limited to credit default risk, interest rate risk, liquidity risk, reinvestment risk and infl ation risk. In addition, the Fund is occasionally exposed to political, economic and currency risk resulting from in-vestments in international high yield securities.

52 FISCAL YEAR 2010 ANNUAL REPORT
PENSION FUNDS MANAGEMENT DIVISION
HIGH YIELD DEBT FUNDOwnership Analysis at June 30, 2010 ($ in millions)
Figure 7-1 Figure 7-2
HIGH YIELD DEBT FUNDModifi ed Duration vs. Index (1) (in Years)
Figure 7-3 Figure 7-4
HIGH YIELD DEBT FUNDDistribution by Quality Rating at June 30, 2010Based on Investments in Securities, at Value
Figure 7-5
HIGH YIELD DEBT FUNDDistribution by Coupon at June 30, 2010Based on Investments in Securities, at Value
Figure 7-6
TERF - Teachers’ Retirement FundSERF - State Employees Retirement FundMERF - Connecticut Municipal Employees’ Retirement Fund
HIGH YIELD DEBT FUND (1)
Risk Profi le at June 30, 2010
Relative Volatility 0.84Standard Deviation 11.37R2 0.92Beta 0.81Alpha -0.25
(1) Based upon returns over the last fi ve years.
(1) Computed without the effect of Cash and other Net Assets.
HIGH YIELD DEBT FUNDDistribution by Sector at June 30, 2010Based on Investments in Securities, at Value
HYDF Citigroup Variance
Treasury 0.0% 0.0% 0.0%
Agency 0.0% 0.0% 0.0%
Corporate 94.1% 99.9% -5.8%
Mortgage-Backed 0.0% 0.0% 0.0%
Asset-Backed 0.0% 0.1% -0.1%
Other(1) 5.9% 0.0% 5.9%
TOTAL 100.0% 100.0%
(1) Other category includes non fi xed-income securities such as common and preferred stock and convertible securities, Liquidity Fund and other assets.
AA-2 to A-1 0.9%
A-2 to BAA-1 3.9%
Less than BAA-1 84.9%
Not Rated1 10.3%
Total 100.0%
(1) Represents securities for which ratings are unavailable.
MERF$44.9
TERF$384.2
Other$16.5
SERF$247.2
*LiquidityFund
Unclassified
Greater than 10.00%
8.01-10.00%6.01-8.00%
4.01-6.00%
0.00-4.00%
4
5
6
Citigroup High YieldHYDF
6/30/106/30/09
4.93
4.20
4.70
4.37
* Note: Ending weights.

OFFICE OF THE STATE TREASURER, DENISE L. NAPPIER 53
PENSION FUNDS MANAGEMENT DIVISION
HIGH YIELD DEBT FUNDInvestment Advisors at June 30, 2010
Figure 7-11
HIGH YIELD DEBT FUNDTen Largest Holdings* at June 30, 2010
Figure 7-12
Net Asset % ofInvestment Advisor Value Fund Loomis Sayles & Co., Inc. $229,269,448 33.10%Stone Harbor Investment Partners 94,233,670 13.60%Shenkman Capital Management 226,634,207 32.71%Oaktree Capital Management, L.L.C. 137,825,017 19.90%Other (1) 4,802,157 0.69%TOTAL HYDF $692,764,499 100.00%
Market Security Name Maturity Value %
Borden Inc 02/15/23 $ 6,832,875 1.04%Toys R Us Inc 10/15/18 6,603,500 1.00%Qwest Capital Funding 07/15/28 6,236,100 0.95%Dynegy Hldgs Inc 05/01/16 5,234,119 0.80%Valeant Pharma- ceuticals Intl 11/15/13 5,222,100 0.80%Tenet Healthcare Corp 11/15/31 5,190,900 0.79%AES Corp 10/15/17 5,181,300 0.79%Citibank NA 07/02/10 4,976,173 0.76%Vertex Pharma- ceuticals Inc Com. Stock 4,908,187 0.75%Aramark Corp 02/01/15 4,545,000 0.69%Top Ten 54,930,254 8.37%
HIGH YIELD DEBT FUNDAnnual Total Return
Figure 7-9 HIGH YIELD DEBT FUNDComprehensive Profi le for the Fiscal Year ending June 30,
Figure 7-10
HIGH YIELD DEBT FUNDDuration Distribution at June 30, 2010Based on Investments in Securities, at Value
HIGH YIELD DEBT FUNDPeriods ending June 30, 2010
Figure 7-8
0-3 Years 18.7%3-5 Years 35.4%5-7 Years 27.2%7-10 Years 9.0%10+ Years 2.3%Unknown(1) 3.4%Liquidity Fund 4.0%Total 100.0%
1 YR 3 YRS 5 YRS 10 YRS
Compounded, Annual Total Return (%) HYDF 24.54 5.25 6.41 6.49Citigroup High Yield Market Index 25.64 5.90 6.66 7.18
Cumulative Total Return (%) HYDF 24.54 16.58 36.45 87.46Citigroup High Yield Market Index 25.64 18.76 38.06 100.12
(1) Represents securities for which the duration could not be calculated by the custodian.
Figure 7-7
(1) Other represents Liquidity Fund, other assets and terminated advisor balances.
* A complete list of portfolio holdings is available from the Offi ce of the Treasurer.
-5%
0%
5%
10%
15%
20%
25%
30%
Citigroup High YieldHYDF
10090807060504030201
2010 2009 HYDF Citigroup HYDF CitigroupNumber of Issues 679 1,394 605 1,222
Average Coupon 8.10% 8.34% 7.90% 8.10%
Yield Maturity 9.11% 8.95% 11.90% 12.20%
Average Maturity 6.86 5.71 7.8 6.5
Modifi ed Duration 4.93 4.37 4.7 4.2
Average Quality B-2 B-2 B-1 B-1
Liquidity Fund 4.0% 0.0% 8.2% 0.0%
*Note: Ending Weights

54 FISCAL YEAR 2010 ANNUAL REPORT
2010developed markets international stock fund
Description of the FundThe Developed Markets International Stock Fund (“DMISF”) is an externally managed fund, which invests
in equity securities of non-U.S. corporations. The goal of this asset class is to participate in the growth of developed foreign markets and achieve a long–term, real rate of return above the U.S. infl ation rate. At the end of fi scal year 2010, the Fund had fourteen external advisors specializing in different aspects of the market. (See Figure 8-6.) Based on the Fund’s net asset value as of June 30, 2010, actively managed core investments accounted for approximately 29.9% of the portfolio. The remaining portion of the portfolio that was actively managed was allocated as follows: 22.3% in active growth/value, 14.5% in small cap, and 14.4% risk controlled. Fourteen and a half percent of the portfolio was passively managed and 1.6% was contained in the currency management account. Additionally, approximately 2.3% was managed through the Connecticut Horizon Fund (CHF) with the fi nal .5% held in cash equivalents.
Portfolio CharacteristicsAt fi scal year-end, DMISF was 99.5% invested in developed market foreign securities, refl ecting the
Fund’s policy to be fully invested. The DMISF country allocations were generally similar to the weightings of the index, with Japan, Australia, and Korea slightly underweighted relative to the index. The largest geo-graphic concentrations were Japan (19.4%) and the United Kingdom (18.1%). The variances from the index weightings refl ect the active management of the portfolio. (See Figure 8-5.)
The DMISF was well diversifi ed by market, sector and capitalization. At year-end, the Fund’s largest investment, consumer staples’ leader Nestlé’s, comprised 1.8% of the total aggregate investment securities. At June 30, 2010, the top ten holdings of the portfolio accounted for only 10.5% of the Fund’s investments indicating broad stock diversifi cation. (See Figure 8-7.)
Market ReviewThe developed markets began the fi scal year on a high note, rallying throughout the quarter ending Sep-
tember 30, 2009. Performance was driven by strong gains within the European equities’ market. Signifi cant exposure to the fi nancials sector, specifi cally within banking stocks, led the equities’ rally over the quarter. However, by June the rally in developed markets subsided. The Greek debt crisis led investors to raise con-cerns regarding the fi scal and economic policies of many other European countries and also threatened the stability of the Euro. In addition, concerns over the rising debt to GDP ratios across the region and further questions about fi nancial stability drove down performance across the region. Greece ended the fi scal year down 46.8%. As a result of the instability within the European markets, the developed markets rally came to a halt over the quarter ending June 30, 2010.
Fund Facts at June 30, 2010
Investment Strategy/Goals: To achieve a long-term real rate of return above the U.S. infl ation rate and provide asset diversifi cation through equity investments in developed foreign countries.
Performance Objective: An annual total return 100 to 250 basis points greater than the Benchmark after ex-penses.
Benchmark: S&P/Citigroup BMI EPAC (Europe, Pacifi c, Asia Composite) Index 50% Hedged
Date of Inception: November 1, 2007 Total Net Assets: $4,434,960,564
Number of Advisors: 14 external Management Fees: $22,085,148
Operating Expenses: $1,839,727 Expense Ratio: 0.54%

OFFICE OF THE STATE TREASURER, DENISE L. NAPPIER 55
PENSION FUNDS MANAGEMENT DIVISION
Performance SummaryFor the fi scal year ended June 30, 2010, the Developed Markets International Stock Fund generated a
return of 11.03%, net of fees and operating expenses, which outperformed its benchmark return of 9.68% by 135 basis points.
DMISF’s market value grew from $4,415.9 million on June 30, 2009 to $4,434.9 million, an increase of $19 million. Net realized and unrealized gains of $412.9 million along with $110.8 million of net investment income were offset by cash withdrawals of $503.7 million by participating pension plans and trusts. The Fund outperformed its benchmark by 39 basis points over the three year period, generating a return of -11.93% versus -12.32% for the index. Over the fi ve year period, the Fund’s annualized return was 1.35% versus 1.76% for its benchmark, an underperformance of 41 basis points. (Figure 8-3).
The cumulative total returns produced by DMISF exceeded the benchmark over the one and three year periods and was below the index over the fi ve year period.
Risk Profi leGiven DMISF’s investment policies and objectives, the Fund is exposed to several risks. These include,
but are not limited to, political and economic risk, currency exchange risk, market risk, and individual com-pany risk. A currency hedging strategy is employed. As stated in the Investment Policy Statement, a 50% hedge ratio should provide an acceptable reduction in the portfolio’s currency risk profi le over time. The Fund has been slightly less volatile than its benchmark over the fi ve-year period ending June 30, 2010. DMISF’s high R2 score of 0.99 demonstrates a relatively strong overall correlation with the performance of the index. The results of these two measurements indicate that the Fund is producing higher risk–adjusted returns compared to its benchmark.

56 FISCAL YEAR 2010 ANNUAL REPORT
DEVELOPED MARKETS INTERNATIONAL STOCKOwnership Analysis at June 30, 2010 ($ in millions)
TERF - Teachers’ Retirement FundSERF - State Employees Retirement FundMERF - Connecticut Municipal Employees’ Retirement Fund
Figure 8-1 Figure 8-2
Figure 8-3
DEVELOPED MARKETS INTERNATIONAL STOCKPeriods ending June 30, 2010
Figure 8-4
1 YR 3 YRS 5YRS
Compounded, Annual Total Return (%) DMISF 11.03 -11.93 1.35S&P/Citigroup BMI EPAC 50% Hedged 9.68 -12.32 1.76 Cumulative Total Return (%) DMISF 11.03 -31.69 6.95S&P/Citigroup BMI EPAC 50% Hedged 9.68 -32.59 9.11
PENSION FUNDS MANAGEMENT DIVISION
DEVELOPED MARKETS INTERNATIONAL STOCKAnnual Total Return
MERF$228.2
TERF$2,544.9
Other$34.7
SERF$1,627.2
-30%-25%-20%-15%-10%
-5%0%5%
10%15%20%25%30%
S&P Citigroup BMIEPAC 50% Hedged
DMISF
100908070605
DEVELOPED MARKETS INTERNATIONAL STOCK (1)
Risk Profi le at June 30, 2010
Relative Volatility 0.98Standard Deviation 18.38R2 0.99Beta 0.97Alpha -0.41
(1) Based upon returns over the last fi ve years.

OFFICE OF THE STATE TREASURER, DENISE L. NAPPIER 57
DEVELOPED MARKETS INTERNATIONAL STOCKDiversifi cation by Benchmark Country with Return (%) at June 30, 2010 (1)
DMISF Benchmark % of % of Net Assets Net Assets 6/30/10 6/30/10 VarianceAustralia 5.2 7.7 -2.5Austria 0.6 0.4 0.2Belgium 0.8 1.0 -0.2Denmark 1.0 1.0 0.0Finland 0.9 1.1 -0.2France 8.0 8.7 -0.7Germany 6.7 7.0 -0.3Greece 0.3 0.3 0.0Hong Kong 3.1 3.1 0.0Ireland 0.4 0.4 0.0Italy 2.7 3.0 -0.3Japan 19.4 22.2 -2.8Korea 3.2 4.8 -1.6Luxembourg 0.2 0.5 -0.3Netherlands 3.5 2.6 0.9New Zealand 0.2 0.1 0.1Norway 0.6 0.9 -0.3Portugal 0.2 0.4 -0.2Singapore 1.9 1.8 0.1Spain 2.1 3.2 -1.1Sweden 2.1 2.9 -0.8Switzerland 8.2 7.5 0.7United Kingdom 18.1 19.4 -1.3Other 10.6 0.0 10.6Total 100.0 100.0
PENSION FUNDS MANAGEMENT DIVISION
DEVELOPED MARKETS INTERNATIONAL STOCKInvestment Advisors at June 30, 2010
DEVELOPED MARKETS INTERNATIONAL STOCKTen Largest Holdings* at June 30, 2010
Net Asset % ofInvestment Advisor Value Fund
Index $643,899,823 14.52%State Street Global Advisors 643,899,823 14.52%
Core 1,427,372,133 32.19%Invesco Global Asset Mgmt. 175,522,939 3.96%AQR Capital Management 518,387,343 11.69%Acadian Asset Management 182,882,308 4.12%Artio Global 449,467,939 10.14%Progress 101,111,604 2.28%
Active-Growth 511,832,524 11.54%MFS Institutional Advisors, Inc. 511,832,524 11.54%
Active-Value 479,311,240 10.81%Grantham, Mayo, Van Otterloo 479,311,240 10.81%
Small Cap 644,021,970 14.52%Schroder Investment Mgmt. 221,955,384 5.00%Dimensional Fund Advisors 201,856,115 4.55%William Blair & Company 220,210,471 4.97%
Risk Controlled 640,159,768 14.43%BlackRock 314,448,922 7.09%Pyramis 325,710,846 7.34%
Other (1) 88,363,106 1.99%
TOTAL DMISF 4,434,960,564 100.00%
Security Name Country Market Value %
Nestle SA CHFO.10 REGD Switzerland $ 77,999,342 1.80%
Royal Dutch Shell PLC A Shares Eur .07 United Kingdom 53,794,807 1.24%
Roche Holdings AG Genusscheine NPV Switzerland 51,536,598 1.19%
HSBC Holdings ORD USD 0.50 UK REG United Kingdom 46,545,054 1.08%
Novartis AG CHF 0.50 REGD Switzerland 44,326,091 1.02%
Glaxosmithkline ORD GBP 0.25 United Kingdom 40,731,126 0.94%
Sanofi Aventis EUR 2.0 France 36,436,956 0.84%
Total SA Eur 2.5 Post Division France 35,270,998 0.82%
Astrazeneca ORD USD 0.25 United Kingdom 33,785,298 0.78%
Vodafone Group ORD USD 0.11428571 United Kingdom 33,235,013 0.77%
Top Ten 453,661,283 10.48%
(1) Other represents Liquidity Fund, other assets and terminated advisor balances, as well as, currency overlay balances for the DMISF (managed by Pareto).
* A complete list of portfolio holdings is available from the Offi ce of the Treasurer.
Figure 8-5 Figure 8-6
Figure 8-7

58 FISCAL YEAR 2010 ANNUAL REPORT
2010
Description of the FundThe Emerging Market International Stock Fund (“EMISF”) is an externally managed fund, which invests
in foreign companies located in countries having developing or emerging economies. Emerging markets are expected to grow at a higher rate than developed markets and investments in these markets also provide further diversifi cation for CRPTF assets. EMISF is managed by four emerging markets external money managers. The newest manager was hired during the third quarter of fi scal 2010 as a result of an increased strategic asset allocation to emerging markets’ equity investments.
Portfolio CharacteristicsThe EMISF country allocations differ, in some cases signifi cantly, to the weightings of the index. Each
manager is permitted some discretion to deviate from the index in order to enhance performance. China had the largest variance from the index representing 5.7% of the EMISF portfolio compared to 19.4% of the index. Other countries that were meaningfully underweighted relative to the benchmark were India, South Africa and Taiwan. Thailand and Turkey had signifi cant over weights to the index. Twenty percent of the fund was allocated to stocks in emerging countries outside of the benchmark. (See Figure 9-6.).
The EMISF was well diversifi ed at year-end. The top ten holdings accounted for 19.24% of the Fund’s investments across six countries. (Figure 9-8.). The EMISF’s largest holdings included a variety of “blue chip” companies located in Latin America, Eastern Europe, and the Far East. The Fund’s largest investment, comprising 2.62% of investment securities, was Korea’s Samsung Electric.
Market ReviewDuring the fi scal year ended June 30, 2010, emerging markets continued to lead the global equity rally,
which began at the beginning of 2009. The rally was led by the fi nancials’ sector as investor confi dence recovered over 2009. As many investors saw emerging market countries as being signifi cant players in the global economic recovery, performance of the BRIC countries (Brazil, Russia, India and China) led the rally in 2009. However beginning in 2010, the emerging markets’ rally began to lose steam, as countries such as China and Brazil experienced negative returns. China’s underperformance is attributable to poor returns amongst banks and real estate companies, as investors grew concerned over the lending practices of banks, coupled with the bubble developing within the real estate market. Brazil’s poor performance was a result of a decline in returns within telecommunications and consumer discretionary companies, as well as a sharp decline in Petrobas, the largest company in Latin America. The emerging markets’ rally came to a halt over the quarter ending June 2010, as the fi nancial instability in several European countries, fueled by the sovereign debt crisis, decreased investor confi dence throughout the region.
Fund Facts at June 30, 2010
Investment Strategy/Goals: To achieve a long–term, real rate of return above the U.S, infl ation rate by partici-pating in the growth of emerging market economies through the ownership of equity securities.
Performance Objective: An annual total return of 200 basis points greater than the MSCI Emerging Markets IMI (with net dividends) Index benchmark after expenses.
Benchmark: MSCI Emerging Markets IMI (Investable Market Index) Index
Date of Inception: November 1, 2007 Total Net Assets: $2,073,164,572
Number of Advisors: 4 external Management Fees: $12,333,677
Operating Expenses: $1,689,274 Expense Ratio: 0.87%
emerging markets international stock fund

OFFICE OF THE STATE TREASURER, DENISE L. NAPPIER 59
PENSION FUNDS MANAGEMENT DIVISION
Performance SummaryFor the fi scal year ended June 30, 2010, the Emerging Markets International Stock Fund (EMISF) gen-
erated a return of 25.23%, net of fees and operating expenses, outperforming its benchmark index return of 24.57% by 66 basis points. Under weighting China, India and South Africa, and over weighting Turkey, relative to the index, contributed positively to performance. Over weighting Hungary and under weighting Taiwan detracted from performance.
The EMISF’s value as of June 30, 2010 was $2,073.1 million, up from $1,147.3 million one year earlier. Of this $925.8 million increase, $548.1 million emanated from net cash infl ows from participating pension and trust funds, $343.1 million from net realized and unrealized gains, and $34.9 million from net investment income.
The Fund returned -4.65% and 10.88% for the three and fi ve year periods, underperforming by 272 basis points and 224 basis points respectively. Over the ten year period, the fund was within 9 basis points of the benchmark return of 10.21%, returning 10.12%. The cumulative returns for the Fund for the three, fi ve and ten year periods were -13.30%, 67.56% and 162.26%, respectively, as illustrated in Figure 9-4.
Risk Profi leGiven EMISF’s investment policies and objectives, the Fund is exposed to several forms of risk. These
include, but are not limited to, political and economic risk, currency exchange risk, market risk, and individual company risk. Based on returns over the last fi ve years, the Fund’s risk profi le is similar to that of the bench-mark. Its high R2 of 0.99 demonstrates a strong overall correlation with the performance of the index. In the aggregate, EMISF’s annualized excess return over the fi ve-year period, or return in excess of that earned by the benchmark, was -2.24%. (See Figure 9-2.) Over the past fi ve years, the fund has experienced less volatility than the benchmark as evidenced by its .97% relative volatility.

60 FISCAL YEAR 2010 ANNUAL REPORT
EMERGING MARKETS INTERNATIONAL STOCKOwnership Analysis at June 30, 2010 ($ in millions)
TERF - Teachers’ Retirement FundSERF - State Employees Retirement FundMERF - Connecticut Municipal Employees’ Retirement Fund
Figure 9-1
EMERGING MARKETS INTERNATIONAL STOCKRisk Profi le at June 30, 2010
Figure 9-2
EMERGING MARKETS INTERNATIONAL STOCKFiscal 2010 Economic Sector vs. Index (%)
Figure 9-3EMERGING MARKETS INTERNATIONAL STOCKPeriods ending June 30, 2010
Figure 9-4
Relative Volatility 0.97Standard Deviation 27.62R2 0.99Beta 0.97Alpha -2.24
(1) Based upon returns over the last fi ve years.
EM MSCI Vari- ISF Index anceEnergy 13.6 12.4 1.2Materials 10.5 15.8 -5.3Industrials 8.2 8.8 -0.6Consumer Discretionary 7.4 7.1 0.3Consumer Staples 5.5 5.4 0.1Health Care 1.4 0.7 0.7Financials 24.3 25.6 -1.3Information Technology 9.3 12.5 -3.2Telecommunication Services 6.4 8.3 -1.9Utilities 1.8 3.4 -1.6Commingled Fund 10.0 0.0 10.0Preferred Stock 0.0 0.0 0.0Private Placement 0.0 0.0 0.0Liquidity Fund 1.6 0.0 1.6 100.0 100.0
1 YR 3 YRS 5 YRS 10 YRS
Compounded, Annual Total Return (%) EMISF 25.23 -4.65 10.88 10.12MSCI EMERGING MARKETS IMI INDEX 24.57 -1.93 13.12 10.21
Cumulative Total Return (%) EMISF 25.23 -13.30 67.56 162.26MSCI EMERGING MARKETS IMI INDEX 24.57 -5.69 85.25 164.33
PENSION FUNDS MANAGEMENT DIVISION
Figure 9-5
EMERGING MARKETS INTERNATIONAL STOCKAnnual Total Return
MERF$129.0
TERF$1,169.2
Other$20.2
SERF$754.8
-40%
-30%
-20%
-10%
0%
10%
20%
30%
40%
50%
MSCI Emerging Markets IMI Index (1)EMISF
10090807060504030201

OFFICE OF THE STATE TREASURER, DENISE L. NAPPIER 61
PENSION FUNDS MANAGEMENT DIVISION
EMERGING MARKETS INTERNATIONAL STOCKDiversifi cation by Benchmark Country with Return (%) at June 30, 2010 (1)
Figure 9-7
EMERGING MARKETS INTERNATIONAL STOCKInvestment Advisors at June 30, 2010
Figure 9-8
EMERGING MARKETS INTERNATIONAL STOCKTen Largest Holdings* at June 30, 2010
Net Asset % ofInvestment Advisor Value Fund Grantham, Mayo, Van Otterloo 579,031,270 27.93%Emerging Markets Management 562,542,529 27.13%Aberdeen Asset Management 511,208,154 24.66%Schroders Investment Mgt 415,973,739 20.07%Other (1) 4,408,880 0.21%TOTAL EMISF 2,073,164,572 100.00%
Security Name Country Market Value %Samsung Electronic KRW 5000 Republic of Korea 54,210,055 2.62%Vale SA Depository Receipts Brazil 53,183,480 2.58%Petroleo Brasileiro SA Sponsored ADR Brazil 51,738,522 2.51%Gazprom ADR OAO Russian Federation 47,943,655 2.32%China Mobile Ltd. HKD 0.10 Hong Kong 47,795,789 2.31%CNOOC Ltd HKD 0.02 Hong Kong 38,764,655 1.88%Lukoil OAO ADR Rub 0.025 Russian Federation 30,949,045 1.50%America Movil ADR Series L Mexico 24,795,570 1.20%Grupo Financiero Banorte NPV Mexico 24,162,107 1.17%Taiwan Semiconductor SP ADR Taiwan 23,838,175 1.15%
Top Ten 397,381,053 19.24%
(1) Includes Liquidity Fund and cash equivalents at each country level.
EMISF EMISF Benchmark % of % of Net Assets Total Net Assets Total 6/30/10 Return 6/30/10 ReturnArgentina 0.1 15.3 0.1 39.9Brazil 14.7 26.8 15.3 21.8Chile 0.6 35.4 1.5 25.2China 5.7 20.3 19.4 10.9Columbia 0.1 52.8 0.8 53.6Czech Republic 0.5 1.9 0.4 -1.5Egypt 0.8 9.2 0.5 11.4Hungary 1.4 -1.6 0.4 15.5India 2.9 48.2 8.3 32.0Indonesia 3.1 69.2 2.4 66.0Israel 0.6 12.7 0.0 0.0Jordan 0.0 0.0 0.0 0.0Kazakhstan 0.0 0.0 0.0 0.0Korea 12.9 25.3 13.5 31.9Malaysia 2.4 42.0 2.9 33.9Mexico 4.6 31.9 4.4 31.7Morocco 0.0 -20.7 0.2 -11.5Pakistan 0.0 -4.8 0.1 34.3Peru 0.2 27.1 0.6 52.2Philippines 1.0 50.1 0.5 35.5Poland 1.0 11.3 1.3 23.1Russia 7.9 18.5 6.3 26.5South Africa 3.6 23.9 7.2 18.4Taiwan 7.2 11.9 10.8 15.4Thailand 4.2 39.6 1.5 34.6Turkey 4.4 54.8 1.6 43.7Venezuela 0.0 0.0 0.0 0.0Other Countries 20.1 0.0 0.0 0.0Total 100.0 100.0
(1) Other represents Liquidity Fund, other assets and terminated advisor balances, as well as, currency overlay balances for the DMISF.
* A complete list of portfolio holdings is available from the Offi ce of the Treasurer.
Figure 9-6

62 FISCAL YEAR 2010 ANNUAL REPORT
2010
Description of the FundThe Real Estate Fund (REF) is an externally managed fund that invests in real estate, real estate related
investments and mortgages. These investments are restricted by policy to the purchase of shares in group annuities, limited partnerships, group trusts, corporations, and other indirect ownership structures managed by professional commercial real estate investment fi rms.
REF is benchmarked against the NCREIF index. Its strategic objectives are: (1) to provide diversifi ca-tion to the overall CRPTF investment program; (2) to preserve investment capital and generate attractive risk-adjusted rates of return; (3) to provide current income; and (4) to provide a hedge against infl ation. Its returns are expected to be equal to or greater than CRPTF’s actuarially determined assumed rate of return (currently 8.5%) and competitive with that of other asset classes in which CRPTF invests, on a risk adjusted basis.
Portfolio CharacteristicsAt June 30, 2010, the portfolio consisted of 35 externally managed portfolios/investments with 0.3%
invested in real estate trusts, 90.0% invested in limited partnerships or limited liability companies and 9.7% invested in the Liquidity Fund. The Fund’s ten largest holdings aggregated to 47.25% of the fund. (See fi gure 10-12.)
As currently structured, 9.7% of the REF is invested in the Liquidity Fund, 13.4% apartment, 11.4% hotel, 9.1% retail, 21.9% offi ce 8.4% industrial and 26.1% in other real estate including mixed use, land, resorts, senior housing and condominiums. (See fi gure 10-7.)
The portfolio is reasonably well diversifi ed geographically with 22.6% in the West, 22.4% in the South, 28.4% in the East and 6.6% in the Midwest. The balance of 4.2% is invested internationally with 15.8% invested in the Liquidity Fund and other assets. (See fi gure 10-6.)
Performance SummaryFor the fi scal year ending June 30, 2010, the REF generated a total return of -20.18%, net of fees, which
under performed the National Council of Real Estate Investment Fiduciaries Index (NCREIF) of -9.60% by 1,058 basis points. Most of the underperformance was due to early recognition of valuation declines result-ing from the national credit crisis and the REF’s 59% leverage which compounds the valuation declines in a down market versus the unleveraged index.
Fund Facts at June 30, 2010
Investment Strategy/Goals: To provide diversifi cation to the overall CRPTF investment program; preserve investment capital and generate attractive risk-adjusted rates of return. The REF also provides current income and serves as a hedge against infl ation.
Performance Objective: An annual total return which is equal to or greater than CRPTF’s actuarially deter-mined assumed rate of return and competitive with that of other asset classes in which CRPTF invests, on a risk adjusted basis.
Benchmark: National Council of Real Estate Investment Fiduciaries Index (NCREIF) with a one quarter lag.
Date of Inception: July 1, 1982 Total Net Assets: $783,828,981
Number of Partnerships: 35 external Management Fees (1): $3,100,126
Operating Expenses: $861,849 Expense Ratio: 0.51%
Capitalized and Netted Fees: $14,317,722
(1) See note 1 to the Financial Statements for a discussion of similar fees incurred at the investment level.
real estate fund
OFFICE OF THE STATE TREASURER, DENISE L. NAPPIER 63
PENSION FUNDS MANAGEMENT DIVISION
During the fi scal year, the value of REF increased from $769.6 million to $783.8 million, due primarily to $202.8 million of new purchases offset by ($174.4) net unrealized losses, $13.9 million of distributions and $0.3 million in salaries.
For the trailing three, fi ve and ten year periods, REF’s compounded annual returns were (15.48%), (5.92%), and 1.18%, respectively, net of all expenses (see fi gure 10-8). The REF returns underperformed the benchmark in the three, fi ve and ten year periods by 1,116 basis points, 1,011 basis points and 594 basis points, respectively. Most of the long-term underperformance is due to a legacy portfolio (1998 com-mitments) that has underperformed. The short-term underperformance is due to 59% portfolio leverage versus an unlevered index.
During fi scal year 2010, the CRPTF committed $200 million to three Public Private Investment Funds, which was part of a broad effort to repair balance sheets throughout the U.S. fi nancial system and ensure that credit is available to households and businesses. Three separate limited partnership investment were made into these fund: $50 million into AllianceBernstein Legacy Securities (Delaware) LP; $50 million into Marathon Legacy Securities Public-Private Investment Fund, LP, and $100 million into WLR IV PPIP Co-Invest, LP.
Market ReviewThe outlook for the US real estate markets is highly contingent upon a growing economy and a low
unemployment rate. Despite recent encouraging trends for both the US economy and the job market, job creation is expected to remain sluggish and the economic outlook uncertain. The broader economic recov-ery will ultimately fi lter through to offi ce jobs, which will support an offi ce property recovery, but fi rst must overcome hesitancy by tenants to expand space needs. The recession has also taken its toll on industrial and retail properties. The downturn in demand for these properties is primarily due to lack of consumer demand, which has led to a reduction in inventories and higher vacancy rates for retail space. One bright spot has been the growth in the apartment sector, vacancies have declined and improvements have been seen across virtually all markets helped by the expiration of the home buyer’s tax credit. More recently, there are continued signs of decelerating declines in market value, and in some cases modest appreciation across the asset class. Transaction activity is increasing, and capitalization rates are beginning to compress within certain lower risk real estate sectors. Institutional investors have begun to refocus on making invest-ments within this battered real estate asset class.
Risk Profi leGiven REF’s investment policy and objectives, the Fund is exposed to several forms of risk. These
include risks attendant to alternative investments, such as management, operations, market, and liquidity risk, but also include geographic, fi nancing, and construction risks specifi c to real estate investments.
As shown below, based on returns over the last fi ve years, the Fund has exhibited substantially more volatility than its benchmark. The Fund’s statistics are consistent with its extraordinarily low R2 of 0.00, signifying almost no correlation between Fund returns and those of the benchmark. Its beta of -0.03 indi-cates little sensitivity to overall fl uctuations in the benchmark. In the aggregate, the Fund’s monthly alpha, or return relative to that achieved by the benchmark, was negative 10.11 over the fi ve-year time period. Work continues on rebuilding the portfolio to more closely align the Fund with the benchmark.
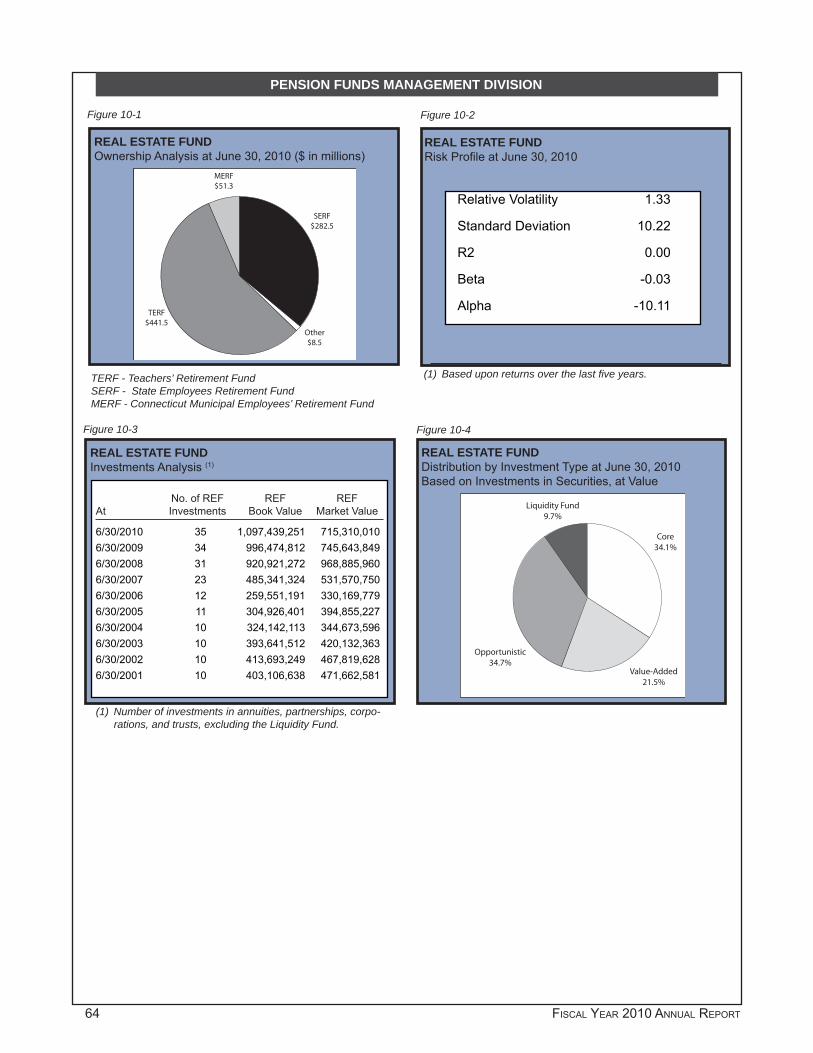
64 FISCAL YEAR 2010 ANNUAL REPORT
PENSION FUNDS MANAGEMENT DIVISION
REAL ESTATE FUNDOwnership Analysis at June 30, 2010 ($ in millions)
TERF - Teachers’ Retirement FundSERF - State Employees Retirement FundMERF - Connecticut Municipal Employees’ Retirement Fund
Figure 10-1
REAL ESTATE FUNDRisk Profi le at June 30, 2010
Figure 10-2
REAL ESTATE FUNDInvestments Analysis (1)
Figure 10-3
REAL ESTATE FUNDDistribution by Investment Type at June 30, 2010Based on Investments in Securities, at Value
Figure 10-4
Relative Volatility 1.33
Standard Deviation 10.22
R2 0.00
Beta -0.03
Alpha -10.11
(1) Based upon returns over the last fi ve years.
No. of REF REF REFAt Investments Book Value Market Value
6/30/2010 35 1,097,439,251 715,310,010 6/30/2009 34 996,474,812 745,643,849 6/30/2008 31 920,921,272 968,885,960 6/30/2007 23 485,341,324 531,570,750 6/30/2006 12 259,551,191 330,169,779 6/30/2005 11 304,926,401 394,855,227 6/30/2004 10 324,142,113 344,673,596 6/30/2003 10 393,641,512 420,132,363 6/30/2002 10 413,693,249 467,819,628 6/30/2001 10 403,106,638 471,662,581
(1) Number of investments in annuities, partnerships, corpo-rations, and trusts, excluding the Liquidity Fund.
MERF$51.3
TERF$441.5
Other$8.5
SERF$282.5
Liquidity Fund9.7%
Opportunistic34.7%
Value-Added21.5%
Core34.1%

OFFICE OF THE STATE TREASURER, DENISE L. NAPPIER 65
PENSION FUNDS MANAGEMENT DIVISION
REAL ESTATE FUNDDistribution by Investment Type at June 30, 2010Based on Investments in Securities, at Value
Figure 10-5
REAL ESTATE FUNDDistribution by Geographic Location at June 30, 2010Based on Investments in Securities, at Value
Figure 10-6
REAL ESTATE FUNDDiversifi cation by Property Type at June 30, 2010Based on Investments in Securities, at Value
Figure 10-7
REAL ESTATE FUNDPeriods ending June 30, 2010
Figure 10-8
REF NCREIF Variance
East 28.4% 34.5% -6.1%
Midwest 6.6% 11.0% -4.4%
South 22.4% 21.7% 0.7%
West 22.6% 32.8% -10.2%
International 4.2% 0.0% 4.2%
Other (1) 15.8% 0.0% 15.8%
100.0% 100.0%
REF NCREIF Variance
Apartment 13.4% 24.5% -11.1%
Industrial 8.4% 14.8% -6.4%
Offi ce 21.9% 35.0% -13.1%
Retail 9.1% 23.8% -14.7%
Hotel 11.4% 1.9% 9.5%
Other(1) 35.8% 0.0% 35.8%
100.0% 100.0%
1 YR 3 YRS 5 YRS 10 YRS
Compounded, Annual Total Return (%) REF -20.18 -15.48 -5.92 1.18NCREIF Property -9.60 -4.32 4.19 7.12
Cumulative Total Return (%) REF -20.18 -39.62 -26.30 12.40NCREIF Property -9.60 -12.40 22.76 99.00
REAL ESTATE FUNDAnnual Total Return
Figure 10-9
REAL ESTATE FUNDComponents of Total Return ($ in millions)
Figure 10-10
(1) Includes senior living, real estate mixed use, land, Liquidity Fund and other assets.
0%
20%
40%
60%
80%
100% LiquidityFund
Trusts
LtdPartnerships
-30%-25%-20%-15%-10%
-5%0%5%
10%15%20%25%30%
NCREIFREF
10090807060504030201 $-350
$-300
$-250
$-200
$-150
$-100
$-50
$0
$50
$100
Capital AppreciationIncome10090807060504030201
$2.6
$89.3
$23.7
$70.7
$3.7$14.5
$67.0
$-174.8
$55.9
$-298.8
(1) Includes Liquidity Fund and other assets.

66 FISCAL YEAR 2010 ANNUAL REPORT
PENSION FUNDS MANAGEMENT DIVISION
REAL ESTATE FUNDFunds at June 30, 2010
Figure 10-11
REAL ESTATE FUNDTen Largest Holdings* at June 30, 2010
Figure 10-12
Net Asset % ofFund Value Fund 1800 E. St. Andrew Place $18,156,905 2.32%1155 Perimeter Center West 26,639,547 3.40%AEW Partners III 7,883,709 1.01%AEW 221 Trust 2,708,893 0.35%AEW Core 481,132 0.06%Alliance Bernstein Legacy 42,887,005 5.47%Apollo Real Estate 15,223,252 1.94%Blackstone Real Estate VI LP 30,978,400 3.95%Blackstone Real Estate Partner Europe III LP 2,405,287 0.31%Canyon Johnson Urban Fund II 29,275,945 3.73%Canyon Johnson Urban Fund III 1,142,460 0.15%Capri Select Income II LLC 6,985,650 0.89%Colony Realty Partners II LP 18,531,176 2.36%Cornerstone Patriot 42,865,500 5.47%Covenant Apartment Fund V LP 24,673,550 3.15%Covenant Apartment Fund VI 10,103,790 1.29%The Glen at Lafayette Hill 12,622,352 1.61%IL & FS India Realty Fund II 25,725,591 3.28%Macfarlane Urban Real Estate Fund II LP 14,320,948 1.83%Marathon Legacy Securities PPI 33,072,845 4.22%Mullica Hill Plaza 7,446,307 0.95%North Scottsdale Corporate Center 43,404,835 5.54%Prime Property Fund 60,641,800 7.74%Rio Hill Shopping Center 38,727,058 4.94%RLJ RE Fund III LP 8,659,408 1.10%RLJ Urban Lodging Fund II 28,751,650 3.67%Rocky Creek Apartments 11,896,889 1.52%Rockwood Capital Fund V 8,109,795 1.03%Rockwood Capital VI Limited Partnership 9,708,590 1.24%Rockwood Capital VII Limited Partnership 6,509,793 0.83%Starwood Opportunity Fund VII 31,755,800 4.05%Starwood Opportunity Fund VIII 10,955,630 1.40%Urban Strategy America Fund LP 17,116,204 2.18%Walton Street Real Estate 15,366,560 1.96%WLR IV PPIP Co Invest LP 49,575,756 6.32%Other (1) 68,518,969 8.74%TOTAL REF $783,828,981 100.00%
Market Property Name Type Value %
Prime Property Fund Core $60,641,800 7.65%WLR IV PPIP Co Invest LP Opportunistic 49,575,756 6.26%Alliance Bernstein Legacy Value-Added 42,887,005 5.41%Cornerstone Patriot Core 42,865,500 5.41%Marathon Legacy Securities PPI Value-Added 33,072,845 4.17%Starwood Opportunity Fund VII Opportunistic 31,755,800 4.01%Blackstone Real Estate VI LP Opportunistic 30,978,400 3.91%Canyon Johnson Urban Fund II Opportunistic 29,275,945 3.69%RLJ Urban Lodging Fund II Opportunistic 28,751,650 3.63%Covenant Apartment Fund V LP Value-Added 24,673,550 3.11%Top Ten $374,478,251 47.25%
(1) Other represents moneys earmarked for distribution to participants, reinvestment, and expenses as well as terminated advisor balances.
* A complete list of portfolio holdings is available from the Offi ce of the Treasurer.
REAL ESTATE FUNDNew Investments Made in Fiscal Year 2010(1) (in Excess of $3 Million)
Figure 10-13
(1) These represent new Real Estate Partnerships that were invested in by the Fund during fi scal year 2010.
Partnership Name Commitment Amount Investment TypeAllianceBernstein Legacy Securities $50 million Public-Private Investment FundMarathon Legacy Securities Public-Private Investment Fund, LP $50 million Public-Private Investment FundWLR IV PPIP Co-Invest, LP $100 million Public-Private Investment FundTotal $200 million

OFFICE OF THE STATE TREASURER, DENISE L. NAPPIER 67
2010
Description of the FundThe Commercial Mortgage Fund (CMF) is an externally managed fund that holds mortgages on income-
producing commercial property. Established in 1982, it serves as a fi xed income investment tool for the pension plans with the goal of realizing yields in excess of those available from traditional domestic fi xed income securities, while accepting slightly greater credit risk.
CMF’s investment assets consist of one externally managed commercial real estate mortgage loan and interests in Yankee Mac pooled residential mortgage-backed securities created pursuant to a previous Connecticut State Treasury program.
The CMF’s performance objective is an annual total return, net of management fees and operating expenses, which exceeds that of the BCI by 100 basis points.
Portfolio CharacteristicsThe sole remaining commercial mortgage loan is secured by three mobile home parks in Phoenix, AZ.
The loan has a 9.55% interest rate and a maturity of September 2012. The loan amortized by approximately $1.27 million during the fi scal year. Debt service coverage is abundant at 2.99 times.
The portfolio is healthy from a credit risk standpoint. CMF had no delinquent or non-performing loans at fi scal year end. None of the Fund’s investments are scheduled to mature in the next 12 months.
Performance SummaryFor the fi scal year ended June 30, 2010, the CMF generated a return of 6.75%, net of management fees
and operating expenses, under performing the BCI of 9.50% by 2,750 basis points. The CMF’s unfavorable performance is attributable to an unrealized valuation adjustment.
During the fi scal year, CMF assets declined from $5.137 million to $3.826 million. This reduction was due to distributions of $0.391 million, redemptions of $1.267 million, net gains from operations of $0.364 million and $0.02 million in salaries.
For the trailing three, fi ve, and ten-year periods, CMF’s total compounded annual portfolio return was 5.0%, 6.54% and 7.88%, respectively, net of all expenses. The Fund’s results over the three year period under-preformed the benchmark by 252 basis points. For the fi ve and 10 year periods the fund’s results exceeded the benchmark by 100 basis points and 141 basis points, respectively.
Fund Facts at June 30, 2010
Investment Strategy/Goals: To achieve yields in excess of those available on domestic fi xed income securities by investing in mortgages on income producing property or in commercial mortgage backed securities (CMBS).
Performance Objective: An annual total return which is one percentage point greater than that of the BC Ag-gregate Bond Index after expenses.
Benchmark: Barclays Aggregate Bond Index (BCI) Date of Inception: November 2, 1987
Total Net Assets: $3,826,443 Number of Advisors: 1 external
Management Fees: $37,125 Operating Expenses: $17,286
Expense Ratio: 1.21%
commercial mortgage fund
68 FISCAL YEAR 2010 ANNUAL REPORT
PENSION FUNDS MANAGEMENT DIVISION
At June 30, 2010, the Fund consisted of one commercial mortgage loan in the amount of $3,464,167 and fi ve residential mortgage pools with a combined value of $193,054 and cash of $160,894 at fair value. The CMF continues to be inactive regarding new loans and is being managed to maximize the total return of its remaining holdings.
Risk Profi leGiven CMF’s investment policies and objectives, the Fund is exposed to several forms of risk. These
include risks specifi c to fi xed income investing, such as purchasing power risk, market risk, and default risk. Moreover, falling interest rates subject commercial mortgages to the risk of prepayment, thereby shortening investors’ assumed time horizon and exposing them to reinvestment risk. However, yield maintenance-based prepayment penalties, which are included in the majority of the Fund’s commercial mortgage investments, help minimize this risk.
Based on returns over the last fi ve years, the Fund’s risk profi le is similar to that of the BC Aggregate Bond Index. With a relative volatility of 2.13, its returns are more volatile than the index. The Fund’s beta of .35 signifi es a limited amount of sensitivity to movements in the Index as a whole. CMF’s fi ve-year monthly alpha, or return in excess of that predicted by returns in the overall market, at June 30, 2010 was 1.00.

OFFICE OF THE STATE TREASURER, DENISE L. NAPPIER 69
COMMERCIAL MORTGAGE FUNDOwnership Analysis at June 30, 2010 ($ in millions)
TERF - Teachers’ Retirement FundSERF - State Employees Retirement FundMERF - Connecticut Municipal Employees’ Retirement Fund
Figure 11-1
COMMERCIAL MORTGAGE FUND (1)
Risk Profi le at June 30, 2010
Figure 11-2
COMMERCIAL MORTGAGE FUNDQuarterly Current (1) Yield Analysis
Figure 11-3
COMMERCIAL MORTGAGE FUNDDistribution by Property Type at June 30, 2010Based on Investments in Securities, at Value
Figure 11-4
Relative Volatility 2.13
Standard Deviation 7.89
R2 0.03
Beta 0.35
Alpha 1.00
(1) Based upon returns over the last fi ve years.
BC CMF Aggregate
6/30/2010 7.70% 4.18%
3/31/2010 7.95% 4.38%
12/31/2009 7.99% 4.51%
9/30/2009 7.86% 4.63%
6/30/2009 8.14% 4.80%
PENSION FUNDS MANAGEMENT DIVISION
COMMERCIAL MORTGAGE FUNDDistribution by Location at June 30, 2010Based on Investments in Securities, at Value
Figure 11-5
COMMERCIAL MORTGAGE FUNDMaturity AnalysisDollar Value ($ in millions)/Number of Loans
Figure 11-6
(1) Current Yield represents annual coupon interest divided by the market value of securities.
MERF$0.2
TERF$2.1
SERF$1.5
MBS5.1%
LiquidityFund4.2%
Residential90.7%
Mountain90.7%
Northeast5.1%
Liquidity Fund4.2%
$0.0
$0.5
$1.0
$1.5
$2.0
$2.5
$3.0
$3.5
12
$3.5(1)

70 FISCAL YEAR 2010 ANNUAL REPORT
PENSION FUNDS MANAGEMENT DIVISION
COMMERCIAL MORTGAGE FUNDPeriods ending June 30, 2010
Figure 11-7
COMMERCIAL MORTGAGE FUNDAnnual Total Return
Figure 11-8
COMMERCIAL MORTGAGE FUNDComponents of Total Return ($ in millions)
Figure 11-9 Figure 11-10
Figure 11-11
1 YR 3 YRS 5 YRS 10 YRS
Compounded, Annual Total Return (%) CMF 6.75 5.03 6.54 7.88BC Aggregate 9.50 7.55 5.54 6.47
Cumulative Total Return (%) CMF 6.75 15.87 37.26 113.60BC Aggregate 9.50 24.39 30.94 87.14
COMMERCIAL MORTGAGE FUNDInvestment Advisors at June 30, 2010
COMMERCIAL MORTGAGE FUNDFive Largest Holdings* at June 30, 2010
(1) Other also includes residential mortgage-backed securities for the Commercial Mortgage Fund.
Net Asset % ofInvestment Advisor Value Fund
AEW Capital Management $3,464,356 90.54%
Other (1) 362,087 9.46%
TOTAL CMF $3,826,443 100.00%
Property Market Property Name Type Value %
SASCO Other $3,464,167 90.73%
Yankee Mac Series G 11.125% Residential 94,453 2.47%
Yankee Mac Series E 11.056% Residential 68,224 1.79%
Yankee Mac Series F 12.981% Residential 28,227 0.74%
Yankee Mac Series A 13.075% Residential 2,149 0.06%
Top Five $3,657,220 95.79%
* A complete list of portfolio holdings is available from the Offi ce of the Treasurer.
-5%
0%
5%
10%
15%
20%
25%
BC AggregateCMF
10090807060504030201
$-10
$0
$10
$20
Capital AppreciationIncome
10090807060504030201
$3.4$1.9
$13.5
$0.9
$13.7
$0.3
$1.8$0.7 $0.8
$-0.2

OFFICE OF THE STATE TREASURER, DENISE L. NAPPIER 71
2010private investment fundFund Facts at June 30, 2010
Investment Strategy/Goals: A long-term asset allocation with the goal of earning returns in excess of the public equity markets through investments in private equity companies.
Performance Objective: To outperform the Standard & Poor 500 Index (“S&P 500”) by 500 basis points at the end of ten years.
Benchmark: S&P 500
Date of Inception: July 1, 1987 Total Net Assets: $2,013,846,298
Number of Partnerships: 66 external Expensed Management Fees (1): $8,323,349
Operating Expenses: $1,654,756 Expense Ratio: 0.55%
Capitalized and Netted Fees: $30,432,412
(1) See Note 1 to the Financial Statements for a discussion of similar fees incurred at the investment level.
Description of the FundThe Private Investment Fund (PIF) is an externally managed fund whose strategic focus is divided into
two sub-asset classes: venture capital and corporate fi nance. Further corporate fi nance encompasses several underlying strategies, including buyout, mezzanine, and special situations. The Private Investment Fund serves as a long-term investment tool for the Pension and Trust Funds, with the goal of earning returns in excess of the public equity markets through investments in private and public companies.
This Fund structure allows for experienced industry professionals to manage PIF’s assets while allowing the Fund to realize the benefi ts of a diversifi ed private market portfolio in the areas of investment type, stra-tegic focus, industry type and geographic region. The performance objective of the Fund is to outperform, net of management fees and Division operating expenses over a rolling ten-year period, the Standard & Poor’s 500 Index by 500 basis points.
Portfolio CharacteristicsThe Private Investment Fund invests in private equity funds either directly as a Limited Partner to a
specifi c fund or indirectly as a limited partner to a fund of funds vehicle. Fund-of-funds investments are investment funds which may have multiple areas of strategic focus. These funds invest in multiple private equity partnerships that invest in underlying companies. Private equity investments include two general areas of strategic focus:
Corporate FinanceBuyout focused investments can be defi ned as controlling or majority investments in private equity • or equity-like securities of more established companies on the basis of the company’s asset values and/or cash fl ow.
Mezzanine Debt focused investments can be defi ned as investments in securities located between • equity and senior debt in the company’s capital structure. Mezzanine debt investments offer higher current income than senior debt securities and often offer equity participation features that may take the form of warrants or contingent equity interests.
Special Situations focused investments can be defi ned as investments in a variety of securities • (Debt, Preferred Equity, Common Equity) in portfolio companies at a variety of stages of develop-ment (Seed, Early Stage, Later Stage).

72 FISCAL YEAR 2010 ANNUAL REPORT
PENSION FUNDS MANAGEMENT DIVISION
International Private Equity focused investments can be defi ned as investments in private equity • or equity-like securities in companies located outside the continental United States. International Private Equity investments often offer higher return potential as a result of the above average rates of growth available in select international economies.
Venture CapitalVenture Capital focused investments can be narrowly defi ned as investments in the private equity • or equity-like securities of developing companies in need of growth or expansion capital. These investments can range from early-stage fi nancing, where a company has little more than a marketable idea, to expansion fi nancing, where a company has a marketable product but requires additional capital to bring the product to market.
Through June 30, 2010, the PIF had 70 funds with aggregate capital commitments in the amount of $5.9 billion of which approximately 75 percent, or $4.3 billion has been “drawn down” for investment pur-poses while the balance of approximately $1.6 billion or 25 percent is committed but not yet drawn. (See Figure 12-6.)
Market ReviewThe private equity market has shown some signs of recovery in 2010. Despite continued volatility in
the global capital markets and softness in the U.S. economy, private equity fi rms are deploying capital at an increasing rate. In addition, exit activity is increasing and the operating and fi nancial performance of portfolio companies is improving.
The slowdown in private equity fundraising has persisted through 2010. Global fundraising in 2010 is on pace to be 12% below 2009 and 70% below the peak in 2007, according to Thomson One. Conversely, the amount of capital invested in U.S. private equity transactions has increased. Approximately $81 billion was invested in 4,141 buyout and venture deals in fi rst half of 2010, versus $28 billion invested in 3,323 deals in the fi rst half of 2009, according to Thomson One.
U.S. credit markets rebounded in the fi rst half of 2010. Average debt-to-EBITDA ratios for all transac-tion sizes rose from a low of 3.7x in 2009 to 4.4x in the second quarter of 2010; but still signifi cantly lower than the peak of 6.0x in 2007, according to Standard & Poor’s Leveraged Commentary.
The IPO and M&A markets have also strengthened this year. Through the fi rst half of 2010 there were 322 private equity backed IPO and M&A transactions versus 368 in all of 2009, according to Thomson One.
The Dodd-Frank Wall Street Reform and the Consumer Protection Act have impacted regulatory oversight of the private equity industry. In particular, private equity fi rms with more than $150 million of assets under management are now required to register with the SEC and adhere to certain disclosure requirements.
Performance SummaryFor the fi scal year ended June 30, 2010, PIF generated a compounded annual rate of return of 17.32%.
This return was measured using a Time Weighted Return (“TWR”) calculation methodology.
While short-term returns are evaluated, longer term (e.g. 10 years) returns are more meaningful in evaluating private equity portfolio performance. Long-term horizons better refl ect the illiquid nature of PIF’s holdings and the time it takes these investments to mature. PIF’s performance return is benchmarked against the S&P 500 plus 500 basis points. Over the last 10 years through June 30, 2010, PIF has exceeded its benchmark of the S&P 500 plus 500 by 8 basis points. From a TWR perspective, the PIF has under-performed the State Street Private Equity Index time-weighted benchmark of 20.89% by 357 basis points.
The institutional standard for measuring private equity performance is the Internal Rate of Return (“IRR”), rather than the TWR. IRR is a dollar-weighted annualized return that considers both cash fl ows and time. Since its inception in 1987, PIF has generated a 7.9% IRR. A tool commonly used by institutional investors to benchmark IRR performance is the public market equivalent (“PME”). The PME essentially converts a

OFFICE OF THE STATE TREASURER, DENISE L. NAPPIER 73
PENSION FUNDS MANAGEMENT DIVISION
public equity index TWR into an IRR. From inception through June 30, 2010, PIF has generated 590 basis points in excess of its S&P 500 PME benchmark.
During fi scal 2010, PIF added $175 million of new commitments to two private equity fund managers (See Figure 12-10).
During fi scal year 2010, PIF’s assets increased from $1,626 million to $2,014 million, an increase of $388 million.
Risk Profi leGiven PIF’s investment policy and objectives, the Fund is exposed to several forms of risk. These in-
clude, but are not limited to, risks attendant with alternative investments, such as management, operations, and product risk, as well as overall liquidity risk. Assuming these risks as part of a prudent, total portfolio strategy enables PIF to participate in the possibility of substantial long-term investment returns.
PIF’s risk profi le is complex given the valuation judgments and liquidity constraints placed on it due to its alternative investment strategy. Over the last fi ve years, PIF’s volatility relative to its benchmark has been 0.51 with a correlation of 0.03. Over the last fi ve years, the Fund has returned an annual alpha, or return relative to that predicted by its benchmark, of -1.73. (See Figure 12-2.)

74 FISCAL YEAR 2010 ANNUAL REPORT
PRIVATE INVESTMENT FUNDOwnership Analysis at June 30, 2010 ($ in millions)
TERF - Teachers’ Retirement FundSERF - State Employees Retirement FundMERF - Connecticut Municipal Employees’ Retirement Fund
Figure 12-1
PRIVATE INVESTMENT FUND (1)
Risk Profi le at June 30, 2010
Figure 12-2
PRIVATE INVESTMENT FUNDDistribution by Industry at June 30, 2010Based on Investments in Securities, at Value
Figure 12-3
PRIVATE INVESTMENT FUNDDistribution by Geographic Location at June 30, 2010Based on Investments in Securities, at Value
Figure 12-4
Relative Volatility 0.51
Standard Deviation 8.55
R2 0.03
Beta 0.09
Alpha -1.73
(1) Based upon quarterly returns over the last fi ve years.
(1) Includes Liquidity Fund and other assets at the partnership level.
(1) Includes the Liquidity Fund and other assets at the partnership level..
Region %Northeast (Excludes Connecticut) 16.0%International 13.8%West Coast 16.2%Other(1) 7.3%Southeast 15.0%Mid-Atlantic 9.0%MidWest 10.3%Southwest 8.2%Connecticut 2.4%Northwest 1.8%TOTAL 100.00%
PENSION FUNDS MANAGEMENT DIVISION
PRIVATE INVESTMENT FUNDDistributed by Committed and Invested CapitalAs of June 30, 2010 ($ in millions)
PRIVATE INVESTMENT FUNDPeriods ending June 30, 2010
Figure 12-6
1 YR 3 YRS 5 YRS 10 YRS
Compounded, Annual Total Return (%) PIF 17.32 3.71 8.25 3.49S & P 500 14.43 -9.81 -0.79 -1.59State Street Private Equity Index (1 Qtr. Lag) 20.89 -1.02 9.98 5.14
Cumulative Total Return (%) PIF 17.32 11.54 48.64 40.88S & P 500 14.43 -26.65 -3.91 -14.78State Street Private Equity Index (1 Qtr. Lag) 20.89 -3.01 60.93 65.09
Figure 12-5
MERF$133.0
TERF$1,136.8
Other$20.5
SERF$723.5
Industrial14.5%
Financial Services12.0%
Other (1)
7.3%
Telecommunications2.7%
Media4.7%
Healthcare9.8%
Diversified16.4%
Energy1.6%
Technology15.3%
Consumer15.7%
$0
$1,000
$2,000
$3,000
$4,000
$5,000
Funded CapitalCommited Capital
Corporate FinanceVenture Capital

OFFICE OF THE STATE TREASURER, DENISE L. NAPPIER 75
PENSION FUNDS MANAGEMENT DIVISION
Figure 12-9
PRIVATE INVESTMENT FUNDTen Largest Holdings* at June 30, 2010
Market Partnership Name Partnership Type Value %Constitution Liquidating Fund Fund of Funds 160,725,705 7.99%Fairview Constitution II LP Fund of Funds 123,187,147 6.12%Carlyle Asia Partners LP International 99,721,385 4.95%Parish Capital Buyout Fund II Fund of Funds 96,260,356 4.78%KKR 2006 Fund Buyout 88,197,715 4.38%Pegasus Partners IV Special Situations 88,133,949 4.38%KKR Millennium Fund Buyout 86,909,736 4.32%Welsh Carson Anderson & Stowe X LP Buyout 84,599,510 4.20%FS Equity Partners V Buyout 78,460,140 3.90%Charterhouse Equity Partners IV Buyout 71,505,266 3.55%Top Ten 977,700,909 48.57%
PRIVATE INVESTMENT FUNDAnnual Total Return
Figure 12-7
PRIVATE INVESTMENT FUNDComponents of Total Return ($ in millions)
Figure 12-8
PRIVATE INVESTMENT FUNDNew Investments Made in Fiscal Year 2010(1) (in Excess of $3 Million)
Figure 12-10
(1) These represent new Private Equity Partnerships that were invested in by the Fund during fi scal year 2010.
Partnership Name Commitment Amount Partnership Type Inv. Date
Landmark XIV $100 million Fund-of-Funds February 25, 2010Audax Mezzanine III 75 million Mezzanine May 10, 2010Total: $175 million
* A complete list of portfolio holdings is available from the Offi ce of the Treasurer.
$-30$-25$-20$-15$-10
$-5$0$5
$10$15$20$25$30
Venture EconomicsS & P 500PIF
10090807060504030201$-600
$-300
$0
$300
$600
$900
Capital AppreciationIncome10090807060504030201
$322.1
$126.6 $154.8$256.2
$214.1
($311.6)
($251.8)
($287.6)
($180.0)
$298.9

76 FISCAL YEAR 2010 ANNUAL REPORT
PENSION FUNDS MANAGEMENT DIVISION
PRIVATE INVESTMENT FUNDInvestment Advisors at June 30, 2010
Net Asset % ofInvestment Advisor Value Fund
Buyout $916,118,768 45.49%KKR Millennium Fund 86,909,736 4.32%Yucaipa American Alliance Fund II LP 52,968,853 2.63%Hicks, Muse Tate & Furst Equity Fund III 23,531,328 1.17%Thomas H. Lee Equity Fund VI 46,016,032 2.28%Welsh Carson Anderson & Stowe VIII 15,962,376 0.79%Wellspring Capital Partners III 18,019,745 0.89%SCP Private Equity Partners 3,471,924 0.17%Charterhouse Equity Partners IV 71,505,266 3.55%Forstmann Little Equity Fund VI 735,755 0.04%DLJ Merchant Banking Fund II 14,447,823 0.72%KKR 1996 Fund 5,973,159 0.30%FS Equity Partners V 78,460,140 3.90%FS Equity Partners VI 10,679,364 0.53%Blackstone Capital Partners III 8,258,510 0.41%Thayer Equity Investors IV 14,279,684 0.71%Kelso Investment Associates VI 5,181,616 0.26%Green Equity Investors III 2,310,785 0.11%Wellspring Capital Partners II 2,151,798 0.11%Candover 2008 Fund 6,289,922 0.31%Leeds Equity Partners V LP 4,855,229 0.24%Welsh Carson Anderson & Stowe XI 13,409,239 0.67%AIG Healthcare Partners LP 32,643,135 1.62%AIG Altaris Health Partners II 11,761,887 0.58%Welsh Carson Anderson & Stowe X LP 84,599,510 4.20%Court Square Capital Partners II 43,143,342 2.14%Ethos Private Equity Fund V 26,590,596 1.32%Boston Ventures VII 37,232,513 1.85%KKR 2006 Fund 88,197,715 4.38%Nogales Investors Fund II 10,213,598 0.51%ICV Partners II LP 18,061,711 0.90%Vista Equity Partners Fund III 50,354,935 2.50%RFE Investments Partners 4,893,452 0.24%RFE Investment Partners VII 23,008,090 1.14%
Venture Capital $23,340,281 1.16%Conning Capital Partners V 1,943,359 0.10%Crescendo World Fund 72,584 0.00%Grotech Partners V 6,155,241 0.31%Crescendo III 2,087,161 0.10%Syndicated Communications 13,081,936 0.65%
Figure 12-11
(1) Other represents moneys earmarked for distribution to participants, reinvestment, and expenses as well as terminated advisor balances.
Net Asset % ofInvestment Advisor Value Fund
Mezzanine $40,477,895 2.01%SW Pelham Fund 3,398,397 0.17%GarMark Partners 526,570 0.02%GarMark Partners II LP 30,345,402 1.51%SW Pelham Fund II 6,207,526 0.31%
International $170,876,573 8.49%Compass Partners European Equity Fund 16,426,114 0.82%Gilbert Global Equity Partners 35,300,379 1.75%Carlyle Europe Partners 8,250,076 0.41%AIG Global Emerging Markets Fund 11,178,619 0.56%Carlyle Asia Partners 99,721,385 4.95%
Fund of Funds $550,355,818 27.33%The Constitution Liquidating Fund 160,725,704 7.98%Landmark Private Equity Fund VIII 23,804,890 1.18%CS/CT Cleantech Opp Fund 13,459,707 0.67%CT Emerging Pvt Equity 9,121,390 0.45%Fairview Constitution III 52,459,954 2.60%Goldman Sachs Private Equity Partners CT 8,426,270 0.42%Lexington Capital Partners II 4,073,132 0.20%Parish Capital I LP 37,666,321 1.87%Parish Capital Buyout Fund II 96,260,356 4.78%Fairview Constitution II LP 123,187,147 6.12%Connecticut Horizon Legacy 7,822,662 0.39%Landmark Equity Partners XIV LP 8,968,930 0.45%JP Morgan Nutmeg I 4,379,355 0.22%
Special Situations $203,240,295 10.09%Welsh Carson Anderson & Stowe Capital Partners III 16,209,171 0.80%Levine Leichtman Capital Partners IV LP 10,511,435 0.52%Greenwich Street Capital Partners II 2,450,819 0.12%Pegasus Partners IV 88,133,949 4.38%WLR Recovery Fund IV 55,193,279 2.74%KPS Special Situations Fund II 30,741,642 1.53%
Other (1) 109,436,668 5.43%
SUBTOTAL PIF 2,013,846,298 100.00%

OFFICE OF THE STATE TREASURER, DENISE L. NAPPIER 77
2010debt management division
Division OverviewThe Debt Management Division is responsible for the cost-effective issuance and management of the State
of Connecticut’s bonded debt. The State’s strategic investment in local school construction, roads, bridges, air-ports, higher education, clean water, and economic development are the foundation of Connecticut’s physical and social infrastructure. The Division uses the latest fi nancial instruments available in the public fi nancing market when issuing new debt. The Debt Management Division consists of eleven professionals under the direction of the Assistant Treasurer.
The Division maintains relationships with institutional and retail investors who have shown confi dence in the State’s economy by purchasing bonds and notes at attractive interest rates. The optimization of the State’s credit rating is critical to obtaining low rates in the future. Debt Management staff is in continual contact and actively participates in rating presentations with Moody’s Investors Service, Standard and Poor’s Ratings, and Fitch Rat-ings, the three major rating agencies.
During the last several legislative sessions, Division staff has been involved in the drafting of new laws with the Executive and Legislative Branches and has provided fi nancial advice on new legislative initiatives. This has resulted in the design of new bonding programs that have been well received in the fi nancial markets, while main-taining exemption from federal and State taxes where appropriate. Specifi c examples include electric deregulation; Second Injury; UCONN 2000; school construction; open space; economic development in Bridgeport, Hartford, and New Haven; municipal fi nancial oversight; Bradley International Airport; Economic Recovery Notes; Transportation Strategy Board Project Funding; Unclaimed Property Securitization; securitization to preserve Conservation and Clean Energy Programs; the establishment of a Housing Trust Fund bonding program; the authorization of bond-ing backed by future federal transportation funds; and a program designed to improve the funding of the Teachers’ Retirement Fund including the issuance of bonds.
The Division manages all public fi nancing programs for the State and coordinates the issuance of bonds with State quasi-public authorities, including the Connecticut Development Authority, the Connecticut Health and Educational Facilities Authority, the Connecticut Housing Finance Authority, the Connecticut Resources Recovery Authority, the Connecticut Higher Education Supplemental Loan Authority, and the Capital City Economic Devel-opment Authority.
The active public fi nancing programs for the State include:
Amount Outstanding June 30, 2010
GENERAL OBLIGATION BONDS $13,017,887,088General Obligation bonds are paid out of the revenues of the State General Fund and are supported by the full faith and credit of the State of Connecticut. General Obligation bonds are issued for construction of State buildings, grants and loans for housing, local school construction, economic development, community care facilities, State parks, and open space.
Public Act 07-186 authorized the issuance of bonds suffi cient to fund a $2 billion deposit into the Teachers’ Retirement Fund. On April 30, 2008, the State issued $2,276,578,271 of Taxable General Obligation - Teacher Retirement Fund bonds.
ECONOMIC RECOVERY NOTES $915,795,000Economic recovery notes are paid out of the revenues of the State General Fund and are supported by the full faith and credit of the State of Connecticut. Economic recovery notes were issued to fi nance the State’s FY 2009 budget defi cit.
UCONN 2000 BONDS $877,492,441The University of Connecticut pays UCONN 2000 bonds from a debt service commitment appropriated from the State General Fund originally established under P.A. 95-230 and extended in 2010. Up to $2.3 billion of Debt Service Commitment bonds will be issued under a 22-year $2.8 billion capital program to rebuild and refurbish the University of Connecticut.
OTHER GENERAL FUND APPROPRIATION DEBT $176,560,000The State has committed to pay interest and principal on these bonds by appropriation from the State’s General Fund. This debt consists of the following programs:
Connecticut Health and Educational Facilities Authority special obligation bonds for a childcare facilities program were assumed by the State, and the State has committed to pay interest and principal on these bonds by appropriation from the State’s General Fund ($68,240,000).

78 FISCAL YEAR 2010 ANNUAL REPORT
DEBT MANAGEMENT DIVISION
The Connecticut Housing Finance Authority (CHFA) Bonds were issued to provide funding of the new supportive hous-ing program. The State is required to make all debt service payments on the bonds pursuant to a contract assistance agreement between CHFA, the Treasurer, and OPM ($61,775,000).
Other appropriation debt includes CDA Tax Incremental Financing and CDA lease revenue fi nancing for a State facil-ity, ($30,465,000) and a Certifi cate of Participation issue for the Connecticut Juvenile Training School Energy Center Project ($16,080,000).
SPECIAL TAX OBLIGATION BONDS $3,030,485,000Transportation-related bonds are paid out of revenues pledged in the State Transportation Fund. Special Tax Obliga-tion bonds are issued for the State’s portion of highway and bridge construction, maintenance and capital needs of mass transit systems, State piers, and general aviation airports. The bonds are secured by transportation-related taxes and revenues, and additional security for the bonds is provided by a debt service reserve fund that totaled $428.7 million on June 30, 2010.
CLEAN WATER FUND REVENUE BONDS $821,950,000The Clean Water Fund and the Drinking Water Fund constitute the State’s revolving fund programs. Revenue bonds provide below-market-rate loans to Connecticut municipalities for the planning, design, and construction of wastewater treatment projects and to Connecticut municipalities and private water companies for drinking water quality improvement projects. The bonds are secured by loan repayments from Connecticut municipalities and private borrowers, general revenues of the program, and restricted revolving fund assets of $110.4 million as of June 30, 2010. The revolving fund includes State G.O. bonds and Federal Capitalization Grants. An interest rate subsidy is provided to borrowers from earnings on the revolving fund and from State G.O. subsidy bonds. The State also provides grants and some loans for the program through its general obligation bond program. CAPITAL CITY ECONOMIC DEVELOPMENT BOND $102,680,000The Capital City Economic Development Authority (CCEDA) bonds were issued to provide funding for the Adriaen’s Landing Development project in Hartford. The State is required to make all debt service payments on the bonds up to a maximum annual amount of $9 million pursuant to a contract assistance agreement between CCEDA, the Treasurer, and OPM. CCEDA is required to reimburse the State for the debt service payments from net parking and central utility plant revenues.
BRADLEY INTERNATIONAL AIRPORT REVENUE BONDS $188,785,000The airport revenue bonds are payable solely from gross operating revenues from the operation of Bradley Interna-tional Airport, and proceeds are used for capital improvements at the airport.
BRADLEY PARKING GARAGE REVENUE BONDS $43,005,000Parking garage bonds are payable from garage parking revenues and by a guarantee from the project developer/lessee.The bonds fi nanced the design and construction of a new parking garage at Bradley International Airport with approximately 3,450 parking spaces on fi ve levels.
Total debt outstanding at June 30, 2010 $19,174,639,529
In FY 2010, the Debt Management Division managed the sale of $1.7 billion in new money bonds issued to fund State programs and capital projects, $915.8 million of Economic Recovery Notes and $353.1 million in bond anticipation notes to refund notes. The Division also issued $258.2 million in refunding bonds for the General Obligation program, $49.8 million in refunding bonds for the Special Tax Obligation Bond program, $115.8 million in refunding bonds for the Clean Water Fund Revenue Bond program, $36.1 million in refunding bonds for the UCONN 2000 program, for a total of $459.9 million in refunding bonds. The following table summarizes the bonds issued during the last fi scal year:
True Average Par Interest LifeBond Type Amount Cost (1) (Years) Issue DateNEW MONEY ISSUES:GENERAL OBLIGATION2009 Series D $165,750,000 1.83% 3.1 12/03/20092009 Series B Taxable BABs (2) 450,000,000 3.53% 15.8 12/23/20092010 Series A 105,000,000 2.60% 6.4 04/28/20102010 Series A Taxable BABs (2) 184,250,000 3.22% 12.3 04/28/20102010 A Bond Anticipation Notes 353,085,000 0.58% 1.1 04/28/20102010 Series B 200,000,000 2.37% 4.9 06/23/2010
ECONOMIC RECOVERY NOTES2009 Series A 915,795,000 2.34% 4.2 12/03/2009
UCONN 2000 2010 Series A 97,115,000 3.60% 10.2 05/25/2010
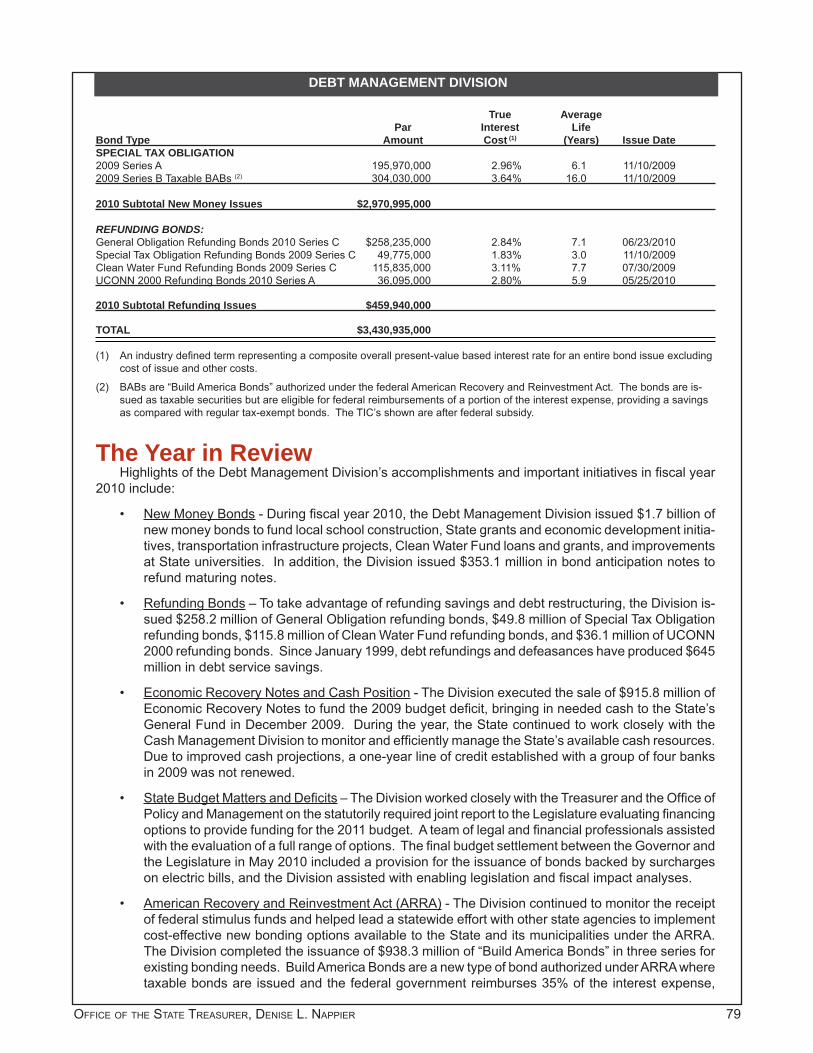
OFFICE OF THE STATE TREASURER, DENISE L. NAPPIER 79
DEBT MANAGEMENT DIVISION
True Average Par Interest LifeBond Type Amount Cost (1) (Years) Issue DateSPECIAL TAX OBLIGATION2009 Series A 195,970,000 2.96% 6.1 11/10/20092009 Series B Taxable BABs (2) 304,030,000 3.64% 16.0 11/10/2009
2010 Subtotal New Money Issues $2,970,995,000
REFUNDING BONDS:General Obligation Refunding Bonds 2010 Series C $258,235,000 2.84% 7.1 06/23/2010Special Tax Obligation Refunding Bonds 2009 Series C 49,775,000 1.83% 3.0 11/10/2009Clean Water Fund Refunding Bonds 2009 Series C 115,835,000 3.11% 7.7 07/30/2009UCONN 2000 Refunding Bonds 2010 Series A 36,095,000 2.80% 5.9 05/25/2010
2010 Subtotal Refunding Issues $459,940,000
TOTAL $3,430,935,000
(1) An industry defi ned term representing a composite overall present-value based interest rate for an entire bond issue excluding cost of issue and other costs.
(2) BABs are “Build America Bonds” authorized under the federal American Recovery and Reinvestment Act. The bonds are is-sued as taxable securities but are eligible for federal reimbursements of a portion of the interest expense, providing a savings as compared with regular tax-exempt bonds. The TIC’s shown are after federal subsidy.
The Year in ReviewHighlights of the Debt Management Division’s accomplishments and important initiatives in fi scal year
2010 include:
New Money Bonds• - During fi scal year 2010, the Debt Management Division issued $1.7 billion of new money bonds to fund local school construction, State grants and economic development initia-tives, transportation infrastructure projects, Clean Water Fund loans and grants, and improvements at State universities. In addition, the Division issued $353.1 million in bond anticipation notes to refund maturing notes.
Refunding Bonds• – To take advantage of refunding savings and debt restructuring, the Division is-sued $258.2 million of General Obligation refunding bonds, $49.8 million of Special Tax Obligation refunding bonds, $115.8 million of Clean Water Fund refunding bonds, and $36.1 million of UCONN 2000 refunding bonds. Since January 1999, debt refundings and defeasances have produced $645 million in debt service savings.
Economic Recovery Notes and Cash Position• - The Division executed the sale of $915.8 million of Economic Recovery Notes to fund the 2009 budget defi cit, bringing in needed cash to the State’s General Fund in December 2009. During the year, the State continued to work closely with the Cash Management Division to monitor and effi ciently manage the State’s available cash resources. Due to improved cash projections, a one-year line of credit established with a group of four banks in 2009 was not renewed.
State Budget Matters and Defi cits• – The Division worked closely with the Treasurer and the Offi ce of Policy and Management on the statutorily required joint report to the Legislature evaluating fi nancing options to provide funding for the 2011 budget. A team of legal and fi nancial professionals assisted with the evaluation of a full range of options. The fi nal budget settlement between the Governor and the Legislature in May 2010 included a provision for the issuance of bonds backed by surcharges on electric bills, and the Division assisted with enabling legislation and fi scal impact analyses.
American Recovery and Reinvestment Act (ARRA)• - The Division continued to monitor the receipt of federal stimulus funds and helped lead a statewide effort with other state agencies to implement cost-effective new bonding options available to the State and its municipalities under the ARRA. The Division completed the issuance of $938.3 million of “Build America Bonds” in three series for existing bonding needs. Build America Bonds are a new type of bond authorized under ARRA where taxable bonds are issued and the federal government reimburses 35% of the interest expense,

80 FISCAL YEAR 2010 ANNUAL REPORT
DEBT MANAGEMENT DIVISION
providing a savings as compared with traditional tax-exempt bonds. These Build America Bond is-sues allowed the State increased market access to new bond investors and provided $44.3 million in debt service savings over the life of the bonds.
Transportation Bonding• - The Division completed the issuance of $500 million of Special Tax Obliga-tion bonds to fund transportation infrastructure improvements as well as $49.8 million of refunding bonds for savings. This fi nancing included the Division’s fi rst use of Build America Bonds. The Divi-sion also consulted with the Offi ce of Policy and Management, the Department of Transportation, and the Legislature on budget, credit rating, and bonding matters impacting the Special Transportation Fund. The Division also worked closely with the Department of Transportation evaluating a variety of fi nance issues related to the Bradley Airport bonding programs, including reviewing potential refunding options, responding to credit reviews, and funding planned expansions.
Clean Water Fund and Municipal Finance Issues• – After carefully monitoring the markets for more than a year, the Division moved ahead with an economic refunding of $115 million of Clean Water Fund auction rate securities. The “AAA” rated Clean Water Fund refunding bonds attracted more than $190 million of retail orders. The Division worked closely with the Departments of Environ-mental Protection and Public Health to successfully deploy 100% of the federal stimulus funding by critical deadlines ensuring no funding was forfeited to other states. The Division completed recommendations to the City of Waterbury on its issuance of $330 million of pension obligation bonds and reached an agreement with the City of Ansonia to address affordability concerns with their Clean Water Fund loans.
Quasi-Public Agencies• – The Division continued to coordinate with the State’s quasi-public agencies including consulting with the Connecticut Housing Finance Authority on the issuance of bonds for the supportive housing and emergency mortgage assistance programs, with the Connecticut Health and Educational Facilities Authority on a new hospital equipment loan program, with the Connecticut Development Authority on deploying various new bonding options included in the ARRA to local projects, and with the Connecticut Higher Education Supplemental Loan Authority on bonding and credit issues as well as evaluating future options for the agency.
University of Connecticut• - The Division continued its collaboration with the University of Connecti-cut completing a new money and refunding bond issue for the UCONN 2000 program as well as a refunding of some of the University’s Student Fee Revenue bonds for additional savings, the fi rst issuance of bonds for this credit in several years. The Division also consulted with the University on a variety of fi nance issues including expansion and extension of the UCONN 2000 program to provide for funding of a new John Dempsey Hospital, contingent on certain additional federal funds.
Industry Matters• - The Division continued to monitor developments in the municipal credit markets including the impact of various provisions of the federal Financial Reform Legislation on the municipal industry, the impact of municipal credit rating recalibrations on Connecticut’s bond programs, and proposals for changes in municipal disclosure.
Work continued on strengthening Division administration, including new systems and contracting • with professionals, and personnel:
The Clean Water Fund program continued with the phased installation of its new loan and grant ♦project management accounting system. An amendment to the interagency Memorandum of Agreement with DPH was drafted to inform the passage of new legislation to update the agen-cies’ roles in managing the Drinking Water program.
The Division implemented further improvements to its investor relations program with strategic ♦advertising of direct links to the BUYCTBONDS website on State news outlets’ websites. Enhance-ments were also made to the BUYCTBONDS website to include links to other state quasi-public agencies’ websites. The Division also increased the frequency of use of institutional investor road shows offered over the internet, as more investors seek to complete a thorough credit analysis prior to purchasing bonds.
OFFICE OF THE STATE TREASURER, DENISE L. NAPPIER 81
DEBT MANAGEMENT DIVISION
Recommendations were developed and approved for the extension of the U.S. Bank paying agent ♦contract, and the Division negotiated a fi ve-year extension with no fee increases and implemented the contract extension and approval process.
The Division coordinated activities related to tax-exempt bond inquiries by the Internal Revenue ♦Service for three different bonding programs, and all of the audits were successfully concluded with no adverse fi ndings.
A detailed investment policy recommendation was developed for investment of the assets of the Spe- ♦cial Tax Obligation reserve fund, incorporating input from the Treasury’s investment divisions.
Following her appointment to the federal Environmental Facilities Advisory Board in March 2009, the ♦Division’s Clean Water Fund fi nancial administrator became active in her new role by contributing signifi cant work on one of the latest EFAB reports which analyzed state revolving fund fi nancing programs and related investment options.
An opening for a Research Analyst, resulting from an early retirement, was approved for refi ll and ♦fi lled with a qualifi ed candidate.
2010 Division PerformanceThe Division focused on several important challenges during the fi scal year, all stemming from a national
economic recession which quickly followed the crisis in the fi nancial markets during the prior fi scal year. Major areas of focus included the evaluation of fi nancing options to assist the Legislature with projected budget defi -cits, maintaining proactive communications with the credit rating agencies and investors regarding the State’s fi scal situation, continuing to work with the Cash Management Division to monitor and effi ciently manage the State’s overall state cash resources, and taking full advantage of the savings offered by the new bonding op-tions authorized under the American Recovery and Reinvestment Act. With the State’s fi scal challenges, the Division’s participation in the drafting of legislation and in the formulation of budget options, including options for defi cit fi nancing and securitizations, was critical.
Fiscal year 2010 was a year of changes and challenges in the area of credit ratings. A major industry recalibration of municipal credit ratings combined with general pressure on the State’s credit rating due to an economic downturn and related fi scal and budget issues worked together to make for an active year. These factors caused the State’s credit ratings and credit outlooks to change during the year, but by the end of the fi scal year, the State’s General Obligation credit rating had settled at solid “AA” credit ratings with Stable Outlooks from all three credit rating agencies. The Division communicated throughout the year with the credit rating agencies and the investment community to provide frequent and timely updates regarding the State budget and the economy.

82 FISCAL YEAR 2010 ANNUAL REPORT
DEBT MANAGEMENTGeneral Fund Debt Service Appropriation as a Percent of the General Fund Appropriation
Figure 13-1
DEBT MANAGEMENTTotal Debt Outstanding ($ in millions) at June 30, 2010
Figure 13-2
DEBT MANAGEMENTBond Issuance ($ in millions) fi scal years 2001 - 2010
Figure 13-3
0%
2%
4%
6%
8%
10%
12%
10090807060504030201
Fiscal Year
9.3%9.9%
9.5%
10.3%
8.8%9.0%
9.5%9.0%
8.7%8.5%
EconomicRecovery Notes
$916Clean Water$822
Other$279
UConn 2000$877
General ObligationTeachers' Retirement
Fund Bonds$2,277
Special Tax Obligation$3,030
Bradley Airport$232
General Obligation$10,741
$0
$500
$1000
$1500
$2000
$2500
$3000
$3500
$4000
EconomicRecovery Notes
Other
Rate Reduction
Bradley Airport
UConn 2000
Clean Water Fund
Special Tax Obligation
General Obligation Teachers'Retirement Fund Bonds
General Obligation
10090807060504030201
DEBT MANAGEMENT DIVISION

OFFICE OF THE STATE TREASURER, DENISE L. NAPPIER 83
2010Division Overview
The Cash Management Division is responsible for managing the state’s cash movements, banking relationships and short-term investments. The Cash Management Division is responsible for:
Maintaining maximum investment balances by ensuring more timely deposits, controlling disburse-• ments, minimizing banking costs and providing accurate cash forecasts;
Earning the highest current income level in the Short-Term Investment Fund (STIF) consistent, fi rst, • with the safety of principal and, second, the provision of liquidity;
Providing responsive services to STIF investors;•
Prudently investing more stable fund balances for longer periods and higher yields, including banks • that meet standards for fi nancial strength and community support;
Protecting State deposits through well-controlled internal operations and use of high quality • banks;
Improving operating effi ciency by more use of electronic data communication and processing; • and
Providing State agencies with technical assistance on cash management and banking issues.•
Under the administration of an Assistant Treasurer, the 21 employees of the Division are organized into four Treasury units.
The Bank Control and Reconciliation unit maintains accountability of the state’s annual internal and external cash fl ow. The unit tracks the fl ow of funds through 20 Treasury bank accounts and authorizes the release of state payroll, retirement and vendor checks. More than three million transactions are accounted for and reconciled annually. The unit also processes stop payments and check reissues.
The Cash Control unit on a daily basis, forecasts available cash, funds disbursement accounts, concen-trates cash from depository banks, sweeps available cash into short-term investment vehicles to maximize investment balances, and executes electronic transfers. The unit also prepares annual cash fl ow projec-tions for various State and bond rating agencies and the primary retirement funds, and monitors actual cash receipts and disbursements. During fi scal year 2010, the unit controlled movement of $27.3 billion to and from state bank accounts and investment vehicles.
The Short-Term Investments unit invests STIF assets, monitors custodian activity, and prepares quar-terly and annual performance reports on the Fund. During fi scal year 2010, the unit invested an average of $4.7 billion in short-term money market instruments. As of June 30, 2010, the unit administered 1,123 active STIF accounts for 64 state agencies and authorities and 267 municipalities and local entities. In addition, the unit manages the Grant Express program that enables municipalities to deposit certain grant payments directly into their STIF accounts, and the Debt Express and Clean Water Fund Express programs that allow towns to make debt payments automatically from their STIF accounts. The unit makes longer-term investments for balances that are expected to be available on a more stable basis in our STIF Plus and Extended Investment Portfolio programs, and, pursuant to CGS 3-24k, the Community Bank and Credit Union Initiative, in which we support Connecticut-based banks and credit unions with assets not exceeding $500 million through the investment in institutions’ certifi cates of deposit.
The Client Services unit works with state agencies to speed the deposit of funds and identify mecha-nisms to reduce banking costs. The unit also reviews state agencies’ requests to open new bank accounts, maintains records of the state’s bank accounts held by individual banks, reviews bank invoices and com-pensation, and manages the division’s procurement efforts for new bank services. The Client Services unit also manages the insurance collateral program in conjunction with the Department of Insurance, which requires companies writing insurance policies in the state to deposit securities and funds totaling a fi xed
cash management division

84 FISCAL YEAR 2010 ANNUAL REPORT
CASH MANAGEMENT DIVISION
percentage of the policies’ value. At June 30, 2010, approximately $359 million in securities was pledged to the program.
The Year in ReviewHighlights of the Division’s accomplishments and important initiatives in fi scal year 2010 include:
Completed procurement of new banking services for the Department of Labor to allow it to make • unemployment benefi t payments by direct deposit or via debit cards. That initiative will save the state in excess of $4 million annually in administrative costs;
Provided support to state agencies to access Internet-based systems provided by the banks for • account balance inquiry, stop payments, electronic fund transfers, and check status queries;
Expanded with the Comptroller’s Offi ce a system for making electronic payments to municipalities • and vendors, which totaled $5.8 billion during the year;
Held our fi fteenth annual meeting of STIF investors in concert with our third Public Finance Outlook • conference attended by over 160 state, local government, and private fi nance professionals;
Added payments fl owing through the Debt Service Express, in which participating towns have debt • service payments deducted from their STIF accounts by their bond paying agent;
Continued to develop and test a multi-level business continuity and disaster recovery system to • support daily cash operations;
Expanded the process of depositing checks through the internet via remote deposit, allowing for • faster depositing and reduction of banking costs;
Assisted the Probate Court administration in centralizing the fi nancial operations of the restructured • court system; and
Worked with state agencies to expand the ability to collect fees via electronic checks or credit card • payments over Internet-based systems.
2010 Division PerformanceThe Cash Management Division successfully realized many achievements throughout the 2010 fi scal
year including:
Total annual return of 0.34 percent in STIF. This exceeded its primary benchmark by 25 basis points, • resulting in $11.9 million in additional interest income for Connecticut governments and their taxpay-ers, while adding $4.7 million to its reserves. Over the past ten years STIF has earned an additional $144 million, while adding $28.7 million to its reserves during this period. (The next section of this report provides a detailed discussion of STIF.);
STIF’s Comprehensive Annual Financial Report (CAFR) was awarded the Certifi cate of Achieve-• ment for Excellence in Financial Reporting for 2009 by the Government Finance Offi cers Association (GFOA);
STIF’s credit rating of AAAm – the highest available — was maintained and affi rmed by Standard & • Poor’s (S&P), the leading rating agency of money market funds and local government investment pools;
The addition of 48 local government STIF accounts with $69 million of assets;•
Investment of $93.5 million with community fi nancial institutions under the Connecticut Community • Bank and Credit Union Initiative at an average awarded annualized interest rate of 0.34 percent;

OFFICE OF THE STATE TREASURER, DENISE L. NAPPIER 85
CASH MANAGEMENT DIVISION
STIF Plus and the Extended Investment Portfolio, longer-term investment portfolios, earned 6.23 • percent and 0.49 percent respectively, thereby adding $5.0 million in incremental state income;
Aggressively managed bank account balances to maximize investment income, thereby adding • $1,530,000 to investment income;
The identifi cation and recapture of $183,000 in annualized bank overcharges;•
Expansion of Grant Express program, in which certain state grants are deposited directly into mu-• nicipal STIF accounts. Since the inception of this program, $17.5 billion has been deposited into municipal STIF accounts, thereby accelerating the availability of municipal funds; and
Designed and implemented new statements for STIF investors that offer a number of enhancements • and are produced in Connecticut.

86 FISCAL YEAR 2010 ANNUAL REPORT
2010
Description of the FundThe Treasurer’s Short-Term Investment Fund (“STIF” or the “Fund”) is an AAAm rated investment pool
of high-quality, short-term money market instruments managed by the Treasurer’s Cash Management Division. Created in 1972, it serves as an investment vehicle for the operating cash of the State Treasury, State agencies and authorities, municipalities, and other political subdivisions of the State. (See fi gure 15-1.) STIF’s objective is to provide as high a level of current income as is consistent with, fi rst, the safety of principal and, second, the provision of liquidity to meet participants’ daily cash fl ow requirements. During the 2010 fi scal year, STIF’s portfolio averaged $4.7 billion.
STIF employs a top-down approach to developing its investment strategy for the management of its assets. Starting with the objectives of the Fund, STIF considers constraints outlined in its investment policy, which include among other parameters: liquidity management, limitations on the portfolio’s weighted average maturity (see fi gure 15-2), and permissible investment types. Next, an asset allocation is developed to identify securities that are expected to perform well in the current market environment. Over the long-term, STIF continually analyzes expectations of future interest rate movements and changes in the shape of the yield curve to ensure the most prudent and effective short-term money management for its clients. Ongoing credit analysis enables STIF to enhance its yield by identifying high-quality credits in undervalued sectors of the economy.
STIF pays interest monthly based on the daily earnings of the Fund less Fund expenses and an allocation to the Fund’s Designated Surplus Reserve. The daily reserve allocations equal one-tenth of one percent of the Fund’s daily balances divided by the number of days in the year, until the reserve totals one percent of the Fund’s daily balance. The reserve on June 30, 2010, totaled $38.5 million.
To help the Fund and its investors evaluate performance, STIF compares its returns to three benchmarks. The fi rst is iMoneyNet Money Fund AverageTM - Rated First Tier Institutional Average (MFR) Index. This index represents an average of institutional money market mutual funds rated AAAm that invest primarily in fi rst-tier (securities rated A-1, P-1) taxable securities. While STIF’s investment policy allows for somewhat greater fl exibility than these SEC-registered funds, the MFR Index is the most appropriate benchmark against which to judge STIF’s performance. During the past year, STIF’s actual investment strategy has been considerably more restrictive than most private money funds and its own policy would permit. (See fi gure 15-3.)
STIF’s yields are also compared to the average Federal Reserve three-month T-Bill rate and the Federal Reserve three-month CD rate. The former benchmark is used to measure STIF’s effectiveness in achieving yields in excess of a “risk-free” investment. The latter is shown for the benefi t of STIF investors, many of whom invest in bank certifi cates of deposit. In viewing these benchmarks, it is important to keep in mind that yields of the CD index will exceed those of the T-Bill index due to a CD’s slightly higher risk profi le and comparatively lower liquidity. Additionally, it is important to note that the 90-day benchmarks exceed STIF’s shorter average maturity. In order to maintain its AAAm rating, the STIF cannot exceed a 60-day weighted
Fund Facts at June 30, 2010
Investment Strategy/Goals: To provide a safe, liquid and effective investment vehicle for the operating cash of the State, municipalities and other Connecticut political subdivisions.
Performance Objective: As high a level of current income as is consistent with, fi rst, the safety of principal and, second, the provision of liquidity.
Benchmarks:iMoneyNet Money Fund AverageTM - Rated First Tier Institutional Average (MFR) Index, Federal Reserve Three-Month CD, Federal Reserve Three-Month T-Bill.
Date of Inception: 1972 Total Net Assets: $4.6 billion
Internally Managed External Management Fees: None
Expense Ratio: Less than 3 basis points (includes internal management and personnel salaries)
short-term investment fund
OFFICE OF THE STATE TREASURER, DENISE L. NAPPIER 87
CASH MANAGEMENT DIVISION
average maturity (WAM) limit. Furthermore, these benchmarks are “unmanaged” and are not affected by management fees or operating expenses. (See fi gure 15-6.)
Among the Fund’s several achievements during the 2010 fi scal year was the reaffi rmation and continuation of its AAAm rating by Standard & Poor’s. In S&P’s view, “a fund rated ‘AAAm’ has extremely strong capacity to maintain principal stability and to limit exposure to principal losses due to credit, market and/or liquidity risks.”
Portfolio CharacteristicsFiscal year 2010 saw a continuation of the cautious strategy that began in the fi rst half of fi scal year 2008.
This strategy was taken in response to the highly unsettled fi nancial markets which were a direct result of the unwinding of the sub-prime real estate market. STIF’s more conservative investment practices include increased liquidity, short average portfolio maturity, holdings of securities guaranteed or insured by the U.S. government and federal agencies, and signifi cantly restricted investments in corporate securities.
Accordingly, at year-end STIF held 72 percent of fund assets in overnight investments or investments that are available on a same-day basis. During the fi scal year, the Fund’s weighted average maturity increased from nine to 19 days. Forty-eight percent of STIF’s assets were invested in securities issued, insured or guaranteed by the U.S. government or federal agencies, in repurchase agreement backed by such securi-ties, or in money funds comprised of such securities.
The Fund ended the year with a 79 percent concentration in investments with short-term ratings of A-1+ or long-term ratings of AAA (the highest ratings of Standard & Poor’s). Eighty-eight percent of the Fund was invested in securities with maturities, or interest rate reset dates for adjustable rate securities, of less than 30 days, versus 95 percent at the previous year-end. The Fund’s three largest security weightings included deposit instruments (40.5 percent), federal agency securities (24.4 percent) and Bank Commercial Paper (10.4 percent). (See Figure 1-5.)
Market ReviewWhat a difference a year can make. During fi scal year 2009 we witnessed the collapse of Lehman
Brothers, the purchase of Bear Stearns, Merrill Lynch and Wachovia by other banks, and the bankruptcies of both Chrysler and General Motors. The Reserve Fund broke the buck, the U.S. government bailed out numerous fi nancial companies including AIG, and in addition, Fannie Mae and Freddie Mac were placed into conservatorship by the federal government.
Fiscal year 2010, on the contrary, proved to be a year in which the U.S. economy steadied itself and grew in each of the four quarters, with growth rates ranging from 1.6 percent to 5.0 percent annualized. However, despite the fact that economic conditions improved over the previous fi scal year, the Federal Reserve main-tained its target range for federal funds at 0 - .25 percent where it has held since December 2008.
The overall economic picture is one of slow growth for an extended period of time with GDP not expected to surpass three percent annually until at least 2012. Unemployment, reaching the highest levels since 1982, ranged during the fi scal year from a low of 9.4 percent in July to a high of 10.1 percent in October ending the fi scal year at 9.5 percent. Economists do not expect much improvement in the rate of unemployment until at least calendar year 2012 when they expect the rate to decline rather modestly and average 8.0 percent during the year.
Performance SummaryFor the one-year period ending June 30, 2010, STIF reported an annual total return of 0.34 percent, net
of operating expenses and $4.7 million in allocations to Fund reserves. Annual total return measures the total investment income a participant would earn with monthly compounding at the Fund’s monthly net earned rate

88 FISCAL YEAR 2010 ANNUAL REPORT
during the year. This fi gure exceeded that achieved by its benchmark, the MFR Index, which equaled 0.09 percent, by 25 basis points. In addition, STIF performance handily exceeded that of three-month T-Bills, which yielded 0.12 percent and performed well against three-month CDs, which yielded 0.29 percent. STIF’s relative performance was also directly affected by the fund’s more cautious investment strategy for most of the fi scal year that, while prudent under diffi cult market conditions, resulted in reductions in STIF’s yield.
The principal reasons for STIF’s strong performance despite its more cautious strategy for most of the year was its low overall expenses which give the Fund a risk-free advantage over other money funds.
Over the long-term, STIF has performed exceptionally well. For the trailing three-, fi ve-, seven-, and ten-year periods, STIF’s compounded annual total return was 1.97 percent, 3.16 percent, 2.75 percent, and 2.95 percent, net of operating expenses and contributions to reserves, exceeding returns of each of its benchmarks for all time periods. Viewed on a dollar-for-dollar basis, had one invested $10 million in STIF ten years ago, that investment would have been worth $13.4 million at June 30, 2010, versus $13 million for a hypothetical investment in the MFR Index. (See Figure 1-6.) During the past 10 years, STIF has earned $144 million above its benchmark while adding $28.7 million to its reserves.
As noted in the 2008 and 2009 annual reports, $24 million was transferred from the reserves effective June 30, 2008, to cover a reduction in value of our Cheyne Finance (now Gryphon) securities, without affecting the $1.00 per share net asset value or any loss of principal to any investors.
Risk Profi leSTIF is considered extremely low risk for several reasons. First, its portfolio is comprised of high-quality,
highly liquid securities, which insulate the Fund from default and liquidity risk. (See fi gure 15-4.) Second, its relatively short average maturity reduces the Fund’s price sensitivity to changes in market interest rates. Third, STIF has a strong degree of asset diversifi cation by security type and issuer, as required by its invest-ment policy, strengthening its overall risk profi le. And fi nally, STIF’s reserve is available to protect against security defaults or the erosion of security values due to dramatic and unforeseen market changes. As the primary short-term investment vehicle for the operating cash of the State, STIF has the ultimate confi dence of the State government.
While STIF is managed diligently to protect against losses from credit and market changes, the Fund is not insured or guaranteed by any government. Therefore, the maintenance of capital cannot be fully as-sured.
CASH MANAGEMENT DIVISION

OFFICE OF THE STATE TREASURER, DENISE L. NAPPIER 89
CASH MANAGEMENT DIVISION
SHORT-TERM INVESTMENT FUNDOwnership Analysis at June 30, 2010 ($ in millions)
Figure 15-1 Figure 15-2
SHORT-TERM INVESTMENT FUNDMaturity Analysis
Figure 15-3 Figure 15-4
SHORT-TERM INVESTMENT FUNDDistribution by Security Type at June 30, 2010
Figure 15-5
SHORT-TERM INVESTMENT FUNDQuarterly Yield vs. Benchmark
Figure 15-6
SHORT-TERM INVESTMENT FUNDDistribution by Quality Rating at June 30, 2010Based on Investments in Securities, at Value
SHORT-TERM INVESTMENT FUNDPeriod ending June 30, 2010
1 Yr 3 Yrs 5 Yrs 7 Yrs 10 Yrs
Compounded Annual Total Return (%) STIF 0.34 1.97 3.16 2.75 2.95MFR Index* 0.09 1.81 2.90 2.45 2.63Fed. Three-Month T-Bill 0.12 1.16 2.47 2.22 2.40Fed. Three-Month CD 0.29 2.08 3.20 2.80 2.89
Cumulative Total Return (%) STIF 0.34 6.04 16.81 20.91 33.81MFR Index* 0.09 5.52 15.39 18.48 29.60Fed. Three-Month T-Bill 0.12 3.52 13.00 16.62 26.83Fed. Three-Month CD 0.29 6.39 17.09 21.34 32.95
STIF uses a time-weighted linked rate of return formula to calculate rates of return. Represents iMoneyNet Money Fund AverageTM - Rated First Tier Institutional Average (MFR) Index.
Reserve$38.47State
Treasury$1,459.78
State Agenciesand Authorities
$2,352.03
Municipal andLocal Entities
$731.33
0%
20%
40%
60%
80%
100%91+ days
31-90 days
0-30 days
0%
1%
2%
3%
4%
5%
6%
MFR
STIF
Jun
-10M
ar-10D
ec-09Sep
-09Ju
n-09
Mar-09
Dec-08
Sep-08
Jun
-08M
ar-08D
ec-07Sep
-07Ju
n-07
Mar-07
Dec-06
Sep-06
AAA/A-1+38.33%
A/A-119.85%
AA/A-1+41.05%
NR0.77%
RepurchaseAgreements
10.03%
StructuredInvestment
Vehicles0.77%
FederalAgency
Securities24.41%
U. S. Government(FDIC) Guaranteed or
Insured Bank Securities4.09% Bank
CommercialPaper
10.37%
DepositInstruments
40.50%
Government Money Funds
9.83%

90 FISCAL YEAR 2010 ANNUAL REPORT
2010unclaimed property division
Division OverviewThe primary mission of the Division is to locate rightful owners or heirs of unclaimed property in accor-
dance with state law and return those assets. Another core responsibility is to receive and record all property received from holders of unclaimed property. All Division goals support the principal mission of unclaimed property as a consumer protection service, safeguarding the fi nancial assets of Connecticut citizens until such time as they may claim their property.
The division receives and maintains a permanent record of reports of unclaimed property fi led annually by holders of such property. Holders include banks, insurance companies, brokerage fi rms, utility compa-nies and businesses that are required to relinquish this property to the State Treasurer following a loss of contact with the owner of record, generally three years. The division prescribes the form of holder reports, and is responsible for monitoring holder reporting. To determine whether a holder is complying with its du-ties under the law unclaimed property is permitted to conducted examinations of company records. If the Treasurer, in his or her discretion, determines that securities or mutual funds transferred to the Treasurer as unclaimed property should be sold, the division is responsible for carrying out the sale, in accordance with the requirements of law, and retaining the proceeds of the sale for the benefi t of the owner of the property. The division is also responsible for preparing monthly, quarterly and annual fi nancial statements.
The division processes claims of persons asserting ownership of property that has been abandoned and delivered to the Treasurer’s Offi ce. The division provides claim forms and provides instruction on the documentation required to prove ownership of the various types of property that have been transferred to the Treasurer. Claims are reviewed and if ownership is proven, the division is responsible for issuing checks to the rightful owner. In order to attempt to locate the owners of abandoned property transferred to the Treasurer, at least biennially, the Treasurer publishes a list of abandoned property reported and transferred to the Treasurer in the previous calendar year [since the last publication].
The Year in ReviewDuring fi scal year 2010, the Unclaimed Property Division returned $33.4 million to rightful owners, an
accomplishment representing the largest dollar amount returned by the Division. During the same time period the Division received $71 million in unclaimed property receipts voluntarily reported by holders.
2010 Division PerformanceThe Division returned $33.4 million to rightful owners who fi led just under 17,360 claims.•
The Division returned 346,728.23 shares to rightful owners at an estimated value of $2.7 million. •
The Division received $71 million in unclaimed property receipts voluntarily reported by holders.•
The Division sold 17.2 million shares that brought $151.2 million into the general fund until rightful • owners come forward to claim the property.
The Division maintains a website with $532.8 million in escheated property for 922,917 rightful • owners
Connecticut General Statute section 3-69a (a) (2), requires the Unclaimed Property Division to deposit • a portion of its receipts into the Citizen’s Election Fund and the balance into the General Fund. For fi scal year 2010, the division deposited $18,191,261 million into the Citizens’ Election Fund.
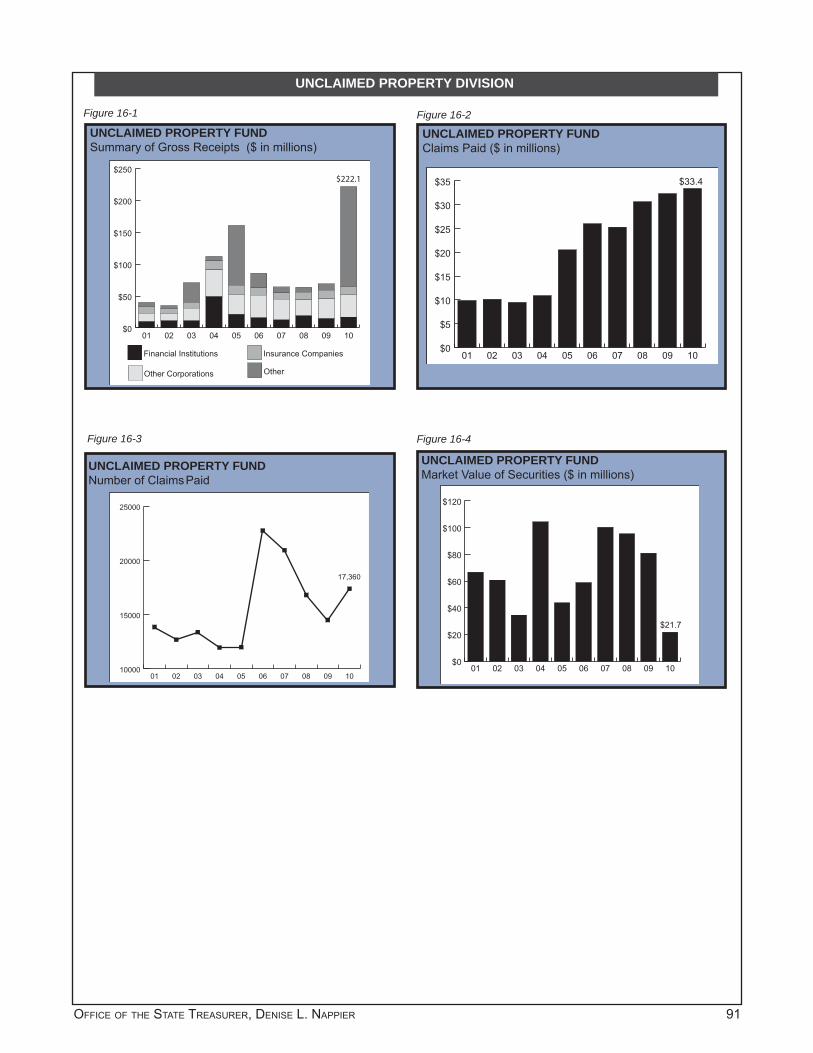
OFFICE OF THE STATE TREASURER, DENISE L. NAPPIER 91
UNCLAIMED PROPERTY DIVISION
Figure 16-1 Figure 16-2
UNCLAIMED PROPERTY FUNDNumber of Claims Paid
Figure 16-3
UNCLAIMED PROPERTY FUNDSummary of Gross Receipts ($ in millions)
Figure 16-4
UNCLAIMED PROPERTY FUNDClaims Paid ($ in millions)
UNCLAIMED PROPERTY FUNDMarket Value of Securities ($ in millions)
$0
$50
$100
$150
$200
$250
Other
Insurance Companies
Other Corporations
Financial Institutions
10090807060504030201
$222.1
$0
$5
$10
$15
$20
$25
$30
$35
10090807060504030201
$33.4
10000
15000
20000
25000
10090807060504030201
17,360
$0
$20
$40
$60
$80
$100
$120
10090807060504030201
$21.7

92 FISCAL YEAR 2010 ANNUAL REPORT
2010second injury fund
DIVISION OVERVIEWThe State Treasurer is the Custodian of the Second Injury Fund (“SIF” or “the Fund”), a state operated
workers’ compensation insurance fund established in 1945 to discourage discrimination against veterans and encourage the assimilation of workers with a pre-existing injury into the workforce. Prior to July 1, 1995, the Fund provided relief to employers where a worker, who already had a pre-existing injury or condition, was hurt on the job and that second injury was made “materially and substantially” worse by the fi rst injury. Such employers transferred liability for these workers’ compensation claims to the Fund after 104 weeks, if certain criteria were met under the Connecticut Workers’ Compensation Act (thus the term “Second Injury Fund”).
The Fund continues to be liable for claims involving uninsured employers, for reimbursement of cost of living adjustments for certain injuries involving payment of total disability or dependent widow’s benefi ts and, on a pro rata basis, reimbursement claims to employers of any worker who had more than one em-ployer at the time of the injury. In addition the Fund is still responsible for “second injury claims” which were transferred to the Fund prior to July 1, 1999.
The mission of the Second Injury Fund is to provide quality service both to the injured workers and employers of Connecticut, whom we jointly serve. The Fund accomplishes this by adjudicating qualifying workers’ compensation claims fairly and in accordance with applicable law, industry standards and best practices. Where possible, the Second Injury Fund seeks to return injured workers to gainful employment or seeks settlement of claims, which will ultimately reduce the burden of Second Injury Fund liabilities on Connecticut taxpayers and businesses.
The Assistant Deputy Treasurer maintains general oversight over the division which includes a manage-ment team, a claims unit, an accounting and collections unit, an investigations unit, and other administra-tive support functions. The Second Injury Fund works closely with the Offi ce of the Attorney General who represents the Fund before the Workers’ Compensation Commission, the Chief State’s Attorney’s offi ce and other state agencies in the fulfi llment of its mission.
HistoryThe Fund’s responsibilities were expanded over the years through judicial and legislative reform. In ad-
dition to payments for “second injury” claims, the Fund assumed other statutory obligations such as: Group health insurance reimbursements; Benefi t payments pending appeals; Cost of Living reimbursements for death benefi ts; Cost of Living reimbursements for total disabilities; Acknowledgment of Physical Defects claims; Concurrent employment claims; and Uninsured employer claims.
The Fund experienced minimal growth during its fi rst 30 years. However in the two decades preced-ing the 1995 Reform Act, the Fund experienced annual claim growth in excess of 20% for the period 1970 to 1995. While there were many explanations for the rapid acceleration of the Fund’s liabilities during this period, (i.e., higher benefi t levels, medical infl ation, etc.) the primary reasons for its exponential growth can be attributed to the impact of a 1974 Connecticut Supreme Court decision in the Jacques case. In summary, cases could be transferred to the Fund based on a pre-existing “condition” as well as a prior injury, regard-less of whether the condition was manifest or not. Thus the Jacques case opened the door for a myriad of latent conditions such as arthritis, disc disease and compromised cardiac function.
After 50 years, the Fund had become the largest disburser of workers’ compensation benefi ts in the State and over time, its annual benefi t payout increased seven fold, peaking at $120 million in fi scal year 1994. An actuarial analysis projected the Fund’s future liability at $6.2 billion as of June 30, 1994. Its operations, which are fi nanced by assessments on Connecticut employers, reached a dollar value high of $146.5 million in 1995. In response the Connecticut General Assembly closed the Fund to new “second injury” claims sustained on or after July 1, 1995.

OFFICE OF THE STATE TREASURER, DENISE L. NAPPIER 93
SECOND INJURY FUND
Legislative ReformsThe Workers’ Compensation Reform Act of 1993 was responsible for signifi cantly reducing Connecticut
employers’ cost of business. However, legislation that had the greatest impact on the Fund was enacted in 1995, 1996 and 2005. Highlights are listed below:
Public Act 95-277Closed the Fund to new “second injury” claims for injuries sustained on or after 7/1/95 and expanded • enforcement, fi nes and penalties against employers who fail to provide workers’ compensation coverage.
Public Act 96-242Imposed a July 1, 1999 deadline for transfer of all eligible “second injury” claims to the Fund and • authorized the issuance of up to $750 million in bonds to fi nance settlement of claims against the Fund.
Public Act 05-199 (Effective 07/01/06)This bill, drafted with the assistance of a task force convened by Treasurer Nappier clarifi ed the • language of the SIF statutes regarding assessments and eased the process by which the Fund can reach settlements with injured workers of uninsured employers.
AssessmentsThe Second Injury Fund operations are fi nanced by assessments on all Connecticut employers. The
Treasurer as Custodian of the Fund, establishes the assessment rate on or before May 1st of each year. Treasurer Nappier is the fi rst Connecticut State Treasurer to formalize an assessment audit program to ensure uniform methods of reporting.
Insured employers pay a surcharge on their workers’ compensation insurance policies based on “stan-dard premiums” calculated and issued by insurance companies who also collect and remit this assessment to the Fund. Effective 7/1/06, insured employers paid based on a Second Injury Fund Surcharge. The as-sessment for self-insured employers is based on “paid losses” for medical and indemnity benefi ts incurred in the prior calendar year.
There were 4 assessments made in FY10 on insured employers of $23.3 million. Self insured employ-ers were assessed 4 times during FY10 at $6.2 million, bringing the total assessment on all Connecticut employers to $29.5 million for FY10.
Assessment rates, which are used to determine how much Connecticut businesses will pay to the Fund, have either been reduced or maintained over the last eleven years. The implementation of management reforms and stricter oversight allowed Treasurer Nappier to reduce rates charged to Connecticut businesses for assessments paid to the Treasury’s Second Injury Fund. For FY10, rates for insured employers is 2.75% and for self-insured employers, the assessment rate is 3.84%.
The Year in ReviewFiscal Year 2010 Highlights
The Second Injury Funds’ major achievements during the past year have continued the implementation of Treasurer Nappier’s management reforms. Highlights for fi scal year 2010 include:
Provided $38.1 million in indemnity, medical and settlement payments to injured workers. The number • of injured workers receiving bi-weekly benefi ts is now 326 compared to 349 a year ago.
Achieved a total of 202 settlements at a cost of $10.3 million. Through June 30, 2010, the Fund has • paid 15 injured workers receiving bi-weekly benefi ts settlements at a cost of $2.8 million with an estimated future net savings of $7.8 million.

94 FISCAL YEAR 2010 ANNUAL REPORT
SECOND INJURY FUND
A total savings of $1.8 million in medical costs was realized using the services and Preferred Provider • Organization Networks offered by our contracted medical vendors. The Fund worked in conjunction with the nurse consultant to review all bills for causal relation, contract compliance and duplicate payments.
Continued to implement the General Assembly’s 1996 mandate to reduce the fi nancial impact of the • Fund on Connecticut’s businesses:
As of June 30, 2010 the Fund’s open claim inventory was 2,534. (See fi gure 17-1) ♦
Reserves (estimated unfunded liability) for all open claims were $426.8 million, a reduction of ♦$10.8 million (2.5%) from a year ago. (See fi gure 17-2)
Worked with the Second Injury Fund Advisory Board to help the Fund carry out its mission.•
SECOND INJURY FUNDOpen Claims by Statute as of 06/30/2010
Figure 17-1 Figure 17-2
SECOND INJURY FUNDValue of Reserves by Statute as of 6/30/2010($ in millions)
355(638)
349(562)
310(1,008)
307(124)
306(202) 355
($47.7)
349($255.8)
310($15.4)
307($27.0)
306($80.9)

OFFICE OF THE STATE TREASURER, DENISE L. NAPPIER 95
2010connecticut higher education trust
Description of the TrustThe Connecticut Higher Education Trust (“CHET” or “Trust”) is a Qualifi ed State Tuition Program pursuant
to Section 529 of the Internal Revenue Code, which was unanimously approved by the Connecticut General Assembly in Public Act No. 97-224 (the “Act”) and signed into law by the Governor in July 1997. The program began operating on January 1, 1998. While the Trust is considered an instrumentality of the State, the assets of the Trust do not constitute property of the State, and the Trust shall not be construed to be a department, institu-tion or agency of the State.
CHET is a trust, available for families to save and invest for higher education expenses, that is privately managed under the supervision of the State Treasurer. Current Internal Revenue Service regulations provide that total contributions to an individual account may not exceed the amount determined by actuarial estimates as is necessary to pay tuition, required fees, and room and board expenses of the designated benefi ciary for fi ve years of undergraduate enrollment at the highest cost institution allowed by the program. While money is invested in CHET, there are no federal or state taxes on earnings. Amounts may be withdrawn to pay for tuition, room and board, fees, books, supplies and equipment required by the benefi ciary for enrollment or attendance at any eligible public or private educational institution. Earnings withdrawn for qualifi ed education expenses are exempt from Federal and Connecticut State Income Taxes. Earnings withdrawn for non-qualifi ed expenses are taxable income to the account owner, and incur an additional federal tax penalty of 10 percent.
The state income tax deduction for CHET, which became effective on July 1, 2006, provides Connecticut taxpayers with the ability to deduct program contributions of up to $5,000 for single fi lers or $10,000 for joint fi lers per year from their Connecticut adjusted gross income. CHET contributions made after January 1, 2006 were eligible for this deduction. In addition, the passage of the federal 2006 Pension Protection Act made federal tax benefi ts permanent and settled the uncertainty regarding long term 529 plan federal tax benefi ts which had been set to expire on December 31, 2010.
TIAA-CREF Tuition Financing, Inc. (“TFI”), a wholly-owned subsidiary of Teachers Insurance and Annuity Association of America (“TIAA”), and the Treasurer of the State of Connecticut have entered into a Management Agreement under which TFI serves as Program Manager. In 2009, the Treasurer issued an RFP for manage-ment of the CHET program soliciting proposals for both the current Direct Sold program, as well as for an Advisor Sold Plan. In 2010, the Treasurer entered into a Management Agreement again with TFI for a contract period ending in March 2015. As of June 30, 2010, the Treasurer was in negotiations with another bidder to award the development and operation of an Advisor Sold Plan. The Program is operated in a manner such that it is exempt from registration as an investment company under the Investment Company Act of 1940.
Under the Direct Sold Plan, an individual participating in the Program establishes an Account in the name of a Benefi ciary. Contributions may be allocated among eight investment options: the Managed Allocation Option, the Aggressive Managed Allocation Option, the High Equity Option, the 100% Equity Index Option, the Social Choice Option, the 100% Fixed Income Option, the Money Market Option and the Principal Plus Interest Option. These options provide Connecticut families the opportunity to save for future college expenses, with the fl exibility to choose investment vehicles which meet their particular risk tolerance and fi nancial need. Under the new Man-agement Agreement with TFI, additional investment options will be offered, beginning in the fall of 2010.
The program’s core Managed Allocation Option offers an age based investment approach, utilizing a total of six individual age bands, structured as groups of benefi ciaries born within the same three-year period. As the age band group approaches college age, each Fund’s assets are moved from more aggressive to more conser-vative investments in accordance with the Trust’s investment policy. The Managed Allocation Age Band Funds are comprised of underlying investments in up to six TIAA-CREF institutional mutual funds, which as of June 30, 2010 consisted of an institutional domestic equity index fund, an international equity index fund, a bond fund, an infl ation linked bond fund, a real estate securities fund and a money market fund.
The Aggressive Managed Allocation Option introduced in November 2007 also invests in the same underlying Funds as the Managed Allocation Option; however, the contributions to this investment option are more heavily invested in equities and real estate than in the Managed Allocation Option in all age bands.

96 FISCAL YEAR 2010 ANNUAL REPORT
CONNECTICUT HIGHER EDUCATION TRUST
The High Equity Option invests in a combination of TIAA-CREF institutional equity mutual funds, and bond funds. As of June 30, 2010, the High Equity Option was comprised of the following underlying equity and fi xed income funds: Institutional S&P 500 Index, Small Cap Equity, Mid Cap Value, Mid Cap Growth, International Equity Index, Infl ation Linked Bond and Bond Funds.
The 100% Equity Index Option invests among a combination of equity index mutual funds to provide the op-portunity for long-term capital growth while avoiding the uncertainty associated with actively managed portfolios. As of June 30, 2010, the 100% Equity Index Option was comprised of two underlying TIAA-CREF institutional mutual funds, the Institutional Equity Index and the Institutional International Equity Index.
The Social Choice Option introduced in November 2007 invests in the TIAA-CREF Institutional Social Choice Equity Fund, which invests primarily in equity securities of companies that meet certain social criteria, such as product safety, corporate citizenship, human rights and environmental performance.
The 100% Fixed-Income option seeks to provide preservation of capital along with a moderate rate of return through a diversifi ed mix of fi xed income investments. As of June 30, 2010, the 100% Fixed-Income Option was comprised of two underlying TIAA-CREF institutional mutual funds, the Institutional Bond Fund and the Institutional Infl ation Linked Bond Fund.
The Money Market Option introduced in February 2008 seeks to provide high current income consistent with preserving capital. This investment option invests in the TIAA-CREF Institutional Money Market Fund.
The Principal Plus Interest Option provides a more conservative and stable offering designed for investors who for a variety of reasons and investment timelines tolerate very limited risk. The assets in the Principal Plus Interest Option are allocated to a funding agreement issued by TIAA-CREF Life Insurance Company, a subsidiary of TIAA, which offers a guarantee to the Trust of principal and an annual rate of return. The rate of return was set to 2.75% from July 1, 2009 to June 30, 2010.
In June 2006, the Treasurer approved an increase in CHET’s account balance limit for contributions from its previous level of $235,000, which had remained level since program inception, to $300,000. This increased contribution limit was made to keep pace with increasing college tuition costs and has more closely aligned CHET with maximum levels in other state plans.
Program features include a low minimum account opening balance of $25 ($15 if using payroll deduction), and the convenience of automated payroll and bank Electronic Funds Transfers (EFT) for contributions. Account funds can be used at thousands of eligible (accredited) college and higher education institutions nationwide and abroad. The program allows for transferability of account funds to other eligible members of the original benefi -ciary’s family without penalty. In addition, over 500 employers currently offer payroll deduction in the state.
The Year in ReviewCHET continued its aggressive push to educate, build awareness and grow new accounts by promoting
CHET as the offi cial state-sponsored 529 college plan for Connecticut families of all demographic and socio-economic groups. During fi scal year 2010, the number of new accounts grew from 86,559 (June 2009) to 94, 886 (June 2010), with 89.4% of those accounts coming from state residents. At the end of June 2010, program equity of account holders was $1.265 billion. That compares with just over 4,000 accounts and $18 million in assets when the Treasurer took offi ce in 1999.
As a low-cost, direct-sold 529 college saving plan, CHET’s annual fees are among the lowest in the country. These annualized fees consist of underlying mutual fund expenses and program manager fees, plus a 0.01% state oversight fee. As of June 30, 2010, total fees were 0.60% of average daily net assets for all investment options, except for the Principal Plus Interest option which has a total 0.01% fee. There are no additional charges or penalties imposed by or payable to the Program in connection with opening or maintaining accounts under any of the Investment Options.
CHET offers customers eight different investment options. At the end of the 2010 fi scal year, the Managed Allocation Option remained the most actively utilized investment option in the CHET program capturing 57.8% of total program assets, while 15.6% of assets were invested in the High Equity, 13.7% in the Principal Plus Interest Option, 4.6% in the 100% Equity Index Option, 4.7% in the Aggressive Managed Allocation Option and 3.6% combined in the 100% Fixed-Income, Money Market and Social Choice Equity Options.

OFFICE OF THE STATE TREASURER, DENISE L. NAPPIER 97
The American Recovery and Reinvestment Act of 2009, or “Stimulus Bill” expanded the defi nition of qualifi ed higher education expenses to include computer technology and equipment for section 529 col-lege savings accounts in 2009 and in 2010. This includes internet access and software, but excludes non-educational software for sports, games or hobbies.
The State Treasurer’s Offi ce works closely with TFI to strengthen public awareness and increase un-derstanding of CHET. Each year an annual marketing plan is developed outlining strategies and tactics that build awareness of and educates all Connecticut families about the benefi ts and affordability of saving for college early via CHET. In 2009/2010, CHET utilized a series of integrated direct marketing campaigns (direct mail, e-mail and online advertising), community events, promotions, radio, television, print ads as well as public and media relations. CHET spreads this important message to prospective account owners across the state, to all socio-economic groups. Existing account owners are reminded of the importance of making regular contributions in order to meet their college saving’s objectives. CHET also schedules educational seminars and webinars; and, distributes CHET information to schools, libraries, fi nancial infl uencers and top employers.
Major marketing milestones in fi scal year 2010 include the launch of outdoor advertising (billboards and bus ads) in an effort to enhance brand awareness of the program, executing an award winning essay and drawing promotion (CHET Dream Big! Competition), launching a Summer Reading Promotion in libraries throughout the state, expanding educational activities and promotions targeting low-to-moderate income families and developing new events and activities targeting Hispanic/Latino families.
The current contract with TIAA-CREF Tuition Financing, Inc. (TFI) expires March 12, 2015 having se-lected TFI to continue as program manager after a competitive bid evaluation.
CONNECTICUT HIGHER EDUCATION TRUST

98 FISCAL YEAR 2010 ANNUAL REPORT
CHET Advisory CommitteeThere is a statutorily established CHET Advisory Committee, which meets annually. The Committee
met on December 3, 2009.
The Connecticut Higher Education Trust Advisory Committee consists of the State Treasurer, the Com-missioner of Higher Education, the Secretary of the Offi ce of Policy and Management and the co-chairpersons and ranking members of the joint standing committees of the General Assembly having cognizance of mat-ters relating to education and fi nance, revenue and bonding, or their designees, and one student fi nancial aid offi cer and one fi nance offi cer at a public institution of higher education in the state, each appointed by the Board of Governors of Higher Education, and one student fi nancial aid offi cer and one fi nance offi cer at an independent institution of higher education in the state, each appointed by the Connecticut Conference of Independent Colleges.
The statutory members of the CHET Advisory Committee as of the December 3, 2009 annual meeting were:
DENISE L. NAPPIER, State Treasurer
ROBERT L. GENUARIO, Secretary Offi ce of Policy and Management, Designee: John Mengacci
MICHAEL MEOTTI, Commissioner, Department of Higher Education, Designee: Nancy Brady
SEN. THOMAS GAFFEY, Senate Chair, Education Committee, Designee: Robert Lockert
REP ANDREW M. FLEISCHMANN, House Chair, Education Committee
SEN. KEVIN WITKOS, Senate Ranking Member, Education Committee, Designee: Gregg Cogswell
REP. DEBRALEE HOVEY, House Ranking Member, Education Committee
SEN. EILEEN M. DAILY, Senate Chair, Finance, Revenue and Bonding Committee, Designee: Chatam Pordner
REP. CAMERON STAPLES, House Chair, Finance, Revenue and Bonding Committee, Designee: Rep. Andres Ayala
REP. CHRIS PERONE, House Ranking Member, Finance, Revenue and Bonding Committee
SEN. ANDREW RORABACK, Senate Ranking Member, Finance, Revenue and Bonding Committee, Designee: Jamie Makus
REP. VINCENT CANDELORA, House Ranking Member, Finance, Revenue and Bonding Committee, Designee: Dave Williams
MARGARET WOLF, Director of Financial Aid, Capitol Community College
JAMES BLAKE, Executive Vice President of Finance & Administration, Southern Connecticut State University
WILLIAM LUCAS, Vice President Finance, Fairfi eld University, Designee: Ray Bordeau
JULIE SAVINO, Dean of Student Financial Assistance, Sacred Heart University, Designee: Silvie Hangan
CONNECTICUT HIGHER EDUCATION TRUST

Financial Statements


OFFICE OF THE STATE TREASURER, DENISE L. NAPPIER F-1
Reserved for certifi cation by Auditors of Public Accounts and State Comptroller
CERTIFICATION BY AUDITORS OF PUBLIC ACCOUNTS AND STATE COMPTROLLER
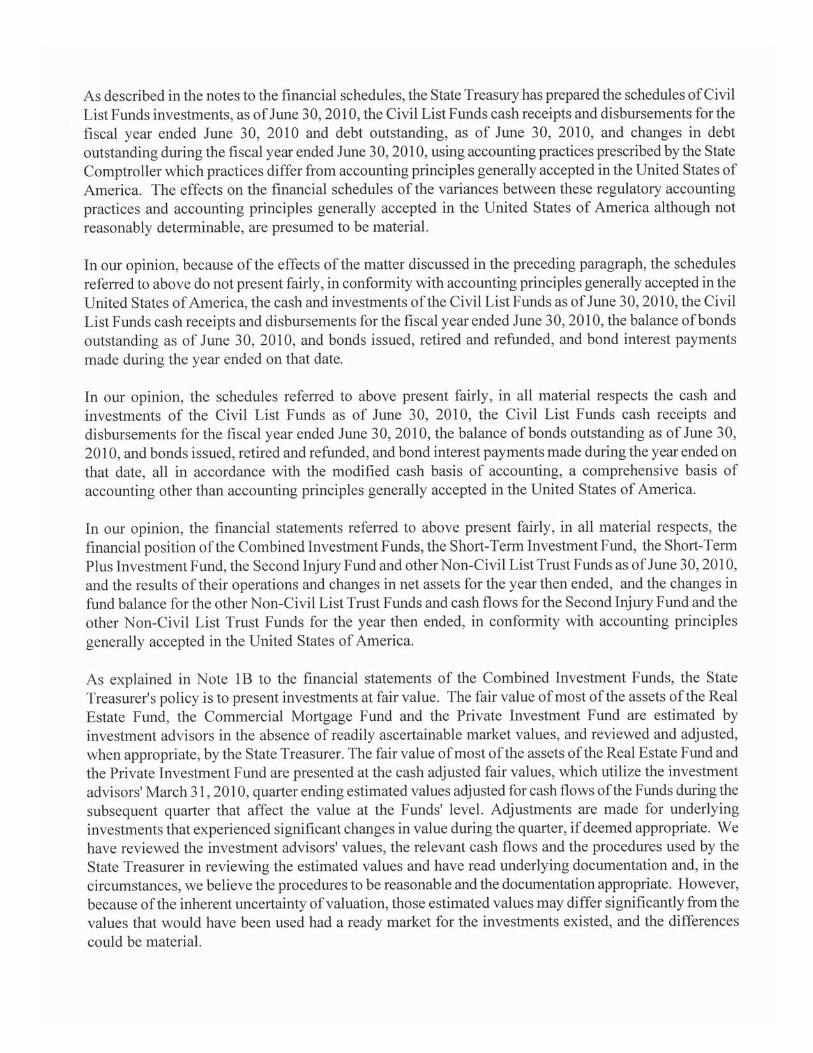
F-2 FISCAL YEAR 2010 ANNUAL REPORT
Reserved for certifi cation by Auditors of Public Accounts and State Comptroller
CERTIFICATION BY AUDITORS OF PUBLIC ACCOUNTS AND STATE COMPTROLLER

OFFICE OF THE STATE TREASURER, DENISE L. NAPPIER F-3
Reserved for certifi cation by Auditors of Public Accounts and State Comptroller
CERTIFICATION BY AUDITORS OF PUBLIC ACCOUNTS AND STATE COMPTROLLER
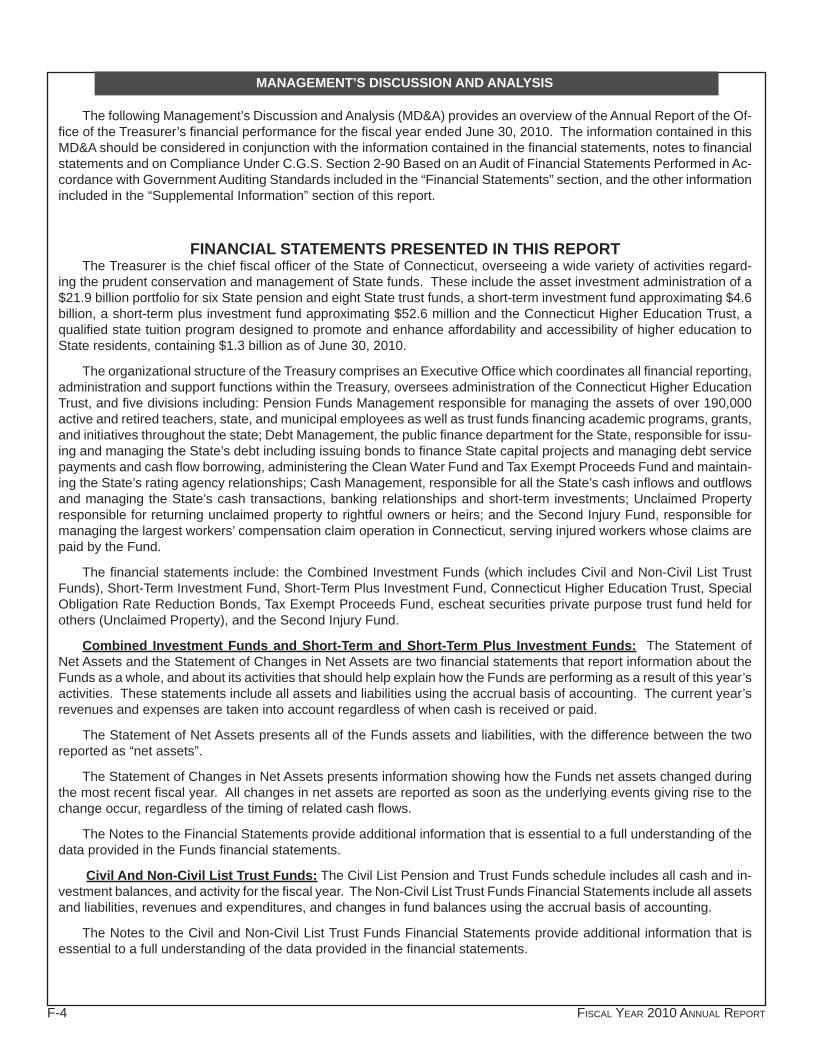
F-4 FISCAL YEAR 2010 ANNUAL REPORT
MANAGEMENT’S DISCUSSION AND ANALYSIS
The following Management’s Discussion and Analysis (MD&A) provides an overview of the Annual Report of the Of-fi ce of the Treasurer’s fi nancial performance for the fi scal year ended June 30, 2010. The information contained in this MD&A should be considered in conjunction with the information contained in the fi nancial statements, notes to fi nancial statements and on Compliance Under C.G.S. Section 2-90 Based on an Audit of Financial Statements Performed in Ac-cordance with Government Auditing Standards included in the “Financial Statements” section, and the other information included in the “Supplemental Information” section of this report.
FINANCIAL STATEMENTS PRESENTED IN THIS REPORTThe Treasurer is the chief fi scal offi cer of the State of Connecticut, overseeing a wide variety of activities regard-
ing the prudent conservation and management of State funds. These include the asset investment administration of a $21.9 billion portfolio for six State pension and eight State trust funds, a short-term investment fund approximating $4.6 billion, a short-term plus investment fund approximating $52.6 million and the Connecticut Higher Education Trust, a qualifi ed state tuition program designed to promote and enhance affordability and accessibility of higher education to State residents, containing $1.3 billion as of June 30, 2010.
The organizational structure of the Treasury comprises an Executive Offi ce which coordinates all fi nancial reporting, administration and support functions within the Treasury, oversees administration of the Connecticut Higher Education Trust, and fi ve divisions including: Pension Funds Management responsible for managing the assets of over 190,000 active and retired teachers, state, and municipal employees as well as trust funds fi nancing academic programs, grants, and initiatives throughout the state; Debt Management, the public fi nance department for the State, responsible for issu-ing and managing the State’s debt including issuing bonds to fi nance State capital projects and managing debt service payments and cash fl ow borrowing, administering the Clean Water Fund and Tax Exempt Proceeds Fund and maintain-ing the State’s rating agency relationships; Cash Management, responsible for all the State’s cash infl ows and outfl ows and managing the State’s cash transactions, banking relationships and short-term investments; Unclaimed Property responsible for returning unclaimed property to rightful owners or heirs; and the Second Injury Fund, responsible for managing the largest workers’ compensation claim operation in Connecticut, serving injured workers whose claims are paid by the Fund.
The fi nancial statements include: the Combined Investment Funds (which includes Civil and Non-Civil List Trust Funds), Short-Term Investment Fund, Short-Term Plus Investment Fund, Connecticut Higher Education Trust, Special Obligation Rate Reduction Bonds, Tax Exempt Proceeds Fund, escheat securities private purpose trust fund held for others (Unclaimed Property), and the Second Injury Fund.
Combined Investment Funds and Short-Term and Short-Term Plus Investment Funds: The Statement of Net Assets and the Statement of Changes in Net Assets are two fi nancial statements that report information about the Funds as a whole, and about its activities that should help explain how the Funds are performing as a result of this year’s activities. These statements include all assets and liabilities using the accrual basis of accounting. The current year’s revenues and expenses are taken into account regardless of when cash is received or paid.
The Statement of Net Assets presents all of the Funds assets and liabilities, with the difference between the two reported as “net assets”.
The Statement of Changes in Net Assets presents information showing how the Funds net assets changed during the most recent fi scal year. All changes in net assets are reported as soon as the underlying events giving rise to the change occur, regardless of the timing of related cash fl ows.
The Notes to the Financial Statements provide additional information that is essential to a full understanding of the data provided in the Funds fi nancial statements.
Civil And Non-Civil List Trust Funds: The Civil List Pension and Trust Funds schedule includes all cash and in-vestment balances, and activity for the fi scal year. The Non-Civil List Trust Funds Financial Statements include all assets and liabilities, revenues and expenditures, and changes in fund balances using the accrual basis of accounting.
The Notes to the Civil and Non-Civil List Trust Funds Financial Statements provide additional information that is essential to a full understanding of the data provided in the fi nancial statements.

OFFICE OF THE STATE TREASURER, DENISE L. NAPPIER F-5
Connecticut Higher Education Trust: The Statement of Assets and Liabilities and Statement of Operations are two fi nancial statements that report information about the Connecticut Higher Education Trust Program as of June 30.
The Notes to the Financial Statements provide additional information that is essential to a full understanding of the data provided in the Connecticut Higher Education Trust Program fi nancial statements.
Special Obligation Rate Reduction Bonds: The Statement of Net Assets, Statement of Revenues, Expenses and Changes in Net Assets, and Statement of Cash Flows are fi nancial statements that report information about the Special Obligation Rate Reduction Bonds.
The Notes to the Financial Statements provide additional information that is essential to a full understanding of the data provided in the Special Obligation Rate Reduction Bonds fi nancial statements.
Tax Exempt Proceeds Fund: The Statement of Assets and Liabilities, Statement of Operations and Statement of Changes in Net Assets are fi nancial statements that report information about the Tax Exempt Proceeds Fund.
The Notes to the Financial Statements provide additional information that is essential to a full understanding of the data provided in the Tax Exempt Proceeds Fund fi nancial statements.
The Second Injury Fund: The Statement of Net Assets and Statement of Revenues, Expenses and Changes in Fund Balance are fi nancial statements that report information about the Second Injury Fund.
The Notes to the Financial Statements provide additional information that is essential to a full understanding of the data provided in the Second Injury Fund’s fi nancial statements.
FINANCIAL HIGHLIGHTS OF FISCAL YEAR 2010At June 30, 2010, the Combined Investment Funds reported investment balances of $21.9 billion. The Short-Term
Investment Fund reported a fund balance of $4.6 billion. These two funds account for 99% of the investments in the fi duciary funds managed by the Offi ce of the Treasurer.
The Connecticut Retirement Plans and Trust Funds fi scal 2010 performance produced a net return (after all ex-penses) of 12.88%. Pension and Trust assets were $20.4 billion at June 30, 2009 and were $21.9 billion at June 30, 2010 as a result of 2010 positive funds performance.
The Short Term Investment Fund achieved an annual return of 0.34%, exceeding its benchmark by 25 basis points, resulting in $11.9 million in additional interest income for the state, state agencies and municipalities and their taxpayers while also adding $4.7 million to its reserves. At the end of the 2010 fi scal year, the Short Term Investment Fund had more than $4.6 billion in assets under management.
The Short Term Plus Investment Fund, at the end of the 2010 fi scal year, had $52.6 million in assets under manage-ment and an annual return of 6.23%.
The Treasury issued $460 million of refunding of various bonds providing future debt service savings of $49 mil-lion.
The Connecticut Higher Education Trust Investments held 94,886 accounts with total assets of $1.265 billion at the end of the 2010 fi scal year compared to 86,559 accounts and $1.049 billion in assets in the prior fi scal year.
The Offi ce of the Treasurer recovered $5.8 million in the fi scal year from class action lawsuits.
CONDENSED FINANCIAL INFORMATIONCombined Investment Funds rrepresent the pension funds of the State employees and teachers, municipal em-
ployees, as well as academic programs, grants and initiatives throughout the State.
Net Assets and Changes in Net Assets Net Assets - The net assets of the Combined Investment Funds at the close of the 2010 fi scal year were $21.9
billion, an increase of $1.5 billion from the previous year. The change in net assets resulted from net investment gains
MANAGEMENT’S DISCUSSION AND ANALYSIS

F-6 FISCAL YEAR 2010 ANNUAL REPORT
from operations of $2.6 billion and $1.1 billion of net cash outfl ows to the Connecticut Retirement Plans and Trust Funds. The net cash outfl ow of $1.1 billion was comprised of distributions to the plans and trusts.
The net assets of the Combined Investment Funds at the close of the 2009 fi scal year were $20.4 billion, a decrease of $5.5 billion from the previous year. The change in net assets resulted from net investment losses from operations of $4.5 billion and $1.0 billion of net cash outfl ows to the Connecticut Retirement Plans and Trust Funds. The net cash outfl ow of $1.0 billion was comprised of pension payments to benefi ciaries of $1.5 billion that were offset by net contribu-tions from unit holders of $0.5 billion.
Operating Income – Favorable performance results achieved a return of 12.88%, net of all management fees and expenses, resulting in an increase in net assets from operations in the 2010 fi scal year, compared to a negative return of -17.37%, net of all expenses for the previous fi scal year. Returns were positive in the Funds investment classes ex-cept for the Real Estate Fund in fi scal year 2010 due to the solid U.S. economic recovery following two years of market volatility related to credit market tightening around the world.
Unfavorable performance results achieved a negative return of -17.37%, net of all management fees and expenses, resulting in a decrease in net assets from operations in the 2009 fi scal year, compared to a negative return of -4.71%, net of all expenses for the previous fi scal year. Returns were negative in the Funds investment classes in fi scal year 2009 due to continuing market volatility related to credit market tightening around the world.
Table 1 - Net Assets
Assets 2010 Increase (Decrease) 2009 Increase (Decrease) 2008Investments at Fair Value $21,784,939,405 $1,353,759,257 $20,431,180,148 $(5,697,980,362) $26,129,160,510Cash, Receivables and Other 7,494,616,324 (4,025,732,123) 11,520,348,447 (4,364,299,273) 15,884,647,720Total Assets 29,279,555,729 (2,671,972,866) 31,951,528,595 (10,062,279,635) 42,013,808,230Liabilities (7,409,965,367) 4,159,396,944 (11,569,362,311) 4,572,623,241 (16,141,985,552)Net Assets $21,869,590,362 $1,487,424,078 $20,382,166,284 $(5,489,656,394) $25,871,822,678
Table 2 - Changes in Net AssetsAdditions 2010 Increase (Decrease) 2009 Increase (Decrease) 2008Dividends $417,408,272 $17,548,252 $399,860,020 $(250,235,550) $650,095,570Interest 324,045,018 (34,875,299) 358,920,317 (101,106,945) 460,027,262Securities Lending & Other Income 29,034,334 (45,853,028) 74,887,362 (87,569,314) 162,456,676Total Investment Income 770,487,624 (63,180,075) 833,667,699 (438,911,809) 1,272,579,508Total Investment Expenses 83,801,294 6,071,663 89,872,957 111,975,929 201,848,886Net Investment Income 686,686,330 (57,108,412) 743,794,742 (326,935,880) 1,070,730,622Net Realized Gain/(Loss) 214,424,589 3,156,785,285 (2,942,360,696) (3,617,993,995) 675,633,299Net Change in Unrealized Gains on Investments 1,737,661,123 4,071,262,087 (2,333,600,964) 670,720,903 (3,004,321,867)Net Increase (Decrease) in Net Assets resulting from operations 2,638,772,042 7,170,938,960 (4,532,166,918) (3,274,208,972) (1,257,957,946)Purchase of Units by Participants 3,647,050,210 (2,952,232,462) 6,599,282,672 (1,585,243,282) 8,184,525,954Total Additions 6,285,822,252 4,218,706,498 2,067,115,754 (4,859,452,254) 6,926,568,008
DeductionsAdministrative Expense 3,835,777 (442,484) 3,393,293 (154,702) 3,238,591Distribution of Income to Unit Owners 579,288,269 128,352,904 707,641,173 264,764,948 972,406,121Redemption of Units by Participants 4,215,274,128 2,630,463,556 6,845,737,682 (838,346,131) 6,007,391,551Total Deductions 4,798,398,174 2,758,373,976 7,556,772,148 (573,735,885) 6,983,036,263
Change in Net Assets 1,487,424,078 6,977,080,472 (5,489,656,394) (5,433,188,139) (56,468,255)Beginning Net Assets 20,382,166,284 (5,489,656,394) 25,871,822,678 (56,468,255) 25,928,290,933Ending Net Assets $21,869,590,362 $1,487,424,078 $20,382,166,284 $(5,489,656,394) $25,871,822,678
Short-Term Investment Fund represents an investment pool of short-term money market instruments serving the State and State agencies, authorities, municipalities and other public subdivisions of the State.
MANAGEMENT’S DISCUSSION AND ANALYSIS

OFFICE OF THE STATE TREASURER, DENISE L. NAPPIER F-7
Net Assets and Changes in Net AssetsNet Assets - The net assets under management in the Short-Term Investment Fund at the close of the 2010 fi scal
year were $4.6 billion, a $0.1 billion increase from the previous year. The principal reason for the increase was an increase in State Agencies and Authorities STIF investments of $0.42 billion partly offset by a decrease of $0.39 billion in State Treasury and Municipal and Local entities.
The net assets under management in the Short-Term Investment Fund at the close of the 2009 fi scal year were $4.5 billion, a decrease of $0.5 billion from the previous year. The principal reasons for the decrease was an overall decrease of $0.67 billion in State Treasury and Municipal and Local entities offset partly by an increase in State Agen-cies and Authorities STIF investments of $0.17 billion.
Operating Income - General fi nancial market conditions produced an annual total return of 0.34%, net of operating expenses and allocations to Fund reserves in fi scal 2010, compared to an annual total return of 1.49%, net of operating expenses and allocations to Fund reserves in the previous fi scal year. The annual total return exceeded that achieved by its benchmark, which equaled 0.09%, by 25 basis points, resulting in $11.9 million in additional interest income for Connecticut governments and their taxpayers while also adding $4.7 million to its reserves.
General fi nancial market conditions produced an annual total return of 1.49%, net of operating expenses and al-locations to Fund reserves in fi scal 2009, compared to an annual total return of 4.13%, net of operating expenses and allocations to Fund reserves in the previous fi scal year. The annual total return exceeded that achieved by its bench-mark, which equaled 1.30%, by 19 basis points, resulting in $8.7 million in additional interest income for Connecticut governments and their taxpayers while also adding $4.6 million to its reserves.
Table 3 - Net AssetsAssets 2010 Increase (Decrease) 2009 Increase (Decrease) 2008Investments in Securities, at Amortized Cost $4,579,765,770 $33,032,434 $4,546,733,336 $(501,562,084) $5,048,295,420Receivables and Other 2,859,419 (1,081,804) 3,941,223 (11,257,209) 15,198,432Total Assets 4,582,625,189 31,950,630 4,550,674,559 (512,819,293) 5,063,493,852Liabilities (1,036,174) 1,113,394 (2,149,568) 6,822,629 (8,972,197)Net Assets $4,581,589,015 $33,064,024 $4,548,524,991 $(505,996,664) $5,054,521,655
Table 4 - Changes in Net AssetsAssets 2010 Increase (Decrease) 2009 Increase (Decrease) 2008Net Interest Income $21,244,054 $(53,695,119) $74,939,173 $(133,233,331) $208,172,504Net Realized Gains 284,196 (322,507) 606,703 563,207 43,496Net Decrease in Fair Value of Investments - - - 24,000,000 (24,000,000)Total Increase from Operations 21,528,250 (54,017,626) 75,545,876 (108,670,124) 184,216,000Purchase of Units by Participants 14,549,690,761 (1,036,715,340) 15,586,406,101 1,130,764,398 14,455,641,703Total Additions 14,571,219,011 (1,090,732,966) 15,661,951,977 1,022,094,274 14,639,857,703
Deductions Distribution of Income to Participants 15,572,194 (54,126,804) 69,698,998 (135,485,806) 205,184,804Redemption of Units by Participants 14,521,369,298 (1,575,618,016) 16,096,987,314 1,713,898,098 14,383,089,216Operating Expenses 1,213,495 (48,834) 1,262,329 104,544 1,157,785Total Deductions 14,538,154,987 (1,629,793,654) 16,167,948,641 1,578,516,836 14,589,431,805 Change in Net Assets 33,064,024 539,060,688 (505,996,664) (556,422,562) 50,425,898Total net assets – beginning 4,548,524,991 (505,996,664) 5,054,521,655 50,425,898 5,004,095,757Total net assets - ending $4,581,589,015 $33,064,024 $4,548,524,991 $(505,996,664) $5,054,521,655
Short-Term Plus Investment Fund is intended for the investment of funds that are not needed for immediate liquidity and are not likely to be needed for at least several months.
MANAGEMENT’S DISCUSSION AND ANALYSIS

F-8 FISCAL YEAR 2010 ANNUAL REPORT
Net Assets Net Assets - The net assets under management in the Short-Term Plus Investment Fund at the close of the 2010
fi scal year were $52.6 million, lower than the prior year due to redemption of investments.
Net Assets - The net assets under management in the Short-Term Plus Investment Fund at the close of the 2009 fi scal year were $88.9 million, lower than the prior year due to redemption of investments.
Table 5 - Net Assets
Assets 2010 Increase (Decrease) 2009 Increase (Decrease) 2008Investments in Securities, at Fair Value $52,542,927 $(36,311,336) $88,854,263 $(220,699,371) $309,553,634Receivables and Other 56,213 (127,587) 183,800 (1,361,490) 1,545,290Total Assets 52,599,140 (36,438,923) 89,038,063 (222,060,861) 311,098,924Liabilities (32,274) 119,005 (151,279) 633,611 (784,890)Net Assets $52,566,866 $(36,319,918) $88,886,784 $(221,427,250) $310,314,034
Table 6 - Changes in Net Assets
Additions 2010 Increase (Decrease) 2009 Increase (Decrease) 2008Net Interest Income $618,864 $(6,296,068) $6,914,932 $(7,098,244) $14,013,176Net Realized Gains 40,014 45,440 (5,426) (39,828) 34,402Total Investment Income 658,878 (6,250,628) 6,909,506 (7,138,072) 14,047,578Purchase of Units by Participants 755,456 (6,711,457) 7,466,913 (7,087,588) 14,554,501Total Additions 1,414,334 (12,962,085) 14,376,419 (14,225,660) 28,602,079
DeductionsDistribution of Income to Participants 636,452 6,196,850 6,833,302 7,153,190 13,986,492Redemption of Units by Participants 41,324,707 184,975,293 226,300,000 (221,300,000) 5,000,000Operating Expenses 22,426 53,778 76,204 (15,118) 61,086Net Change in Unrealized Loss (4,249,333) 6,843,496 2,594,163 623,246 3,217,409Total Deductions 37,734,252 198,069,417 235,803,669 (213,538,682) 22,264,987
Change in Net Assets (36,319,918) 185,107,332 (221,427,250) (227,764,342) 6,337,092Total net assets – beginning 88,886,784 (221,427,250) 310,314,034 6,337,092 303,976,942Total net assets - ending $52,566,866 $(36,319,918) $88,886,784 $(221,427,250) $310,314,034
Connecticut Higher Education TrustNet Assets and Changes in Net Assets
Net Assets – Net Assets of the Connecticut Higher Education Trust at the close of the current fi scal year were $1.265 billion, an increase of $216 million from the previous year.
Net assets of the Connecticut Higher Education Trust at the close of the 2009 fi scal year were $1.049 billion, a decrease of $27 million from the previous year.
Changes in Net Assets – The change in net assets of the Connecticut Higher Education Trust increased by $216 million in fi scal year 2010 resulting from $103 of net realized and unrealized appreciation on investments including net investment income in addition to $113 million of contributions to active accounts, net of redemptions.
The change in net assets of the Connecticut Higher Education Trust decreased by $27 million in fi scal year 2009 resulting from $127 of net realized and unrealized losses on investments including net investment income partly offset by $100 million of contributions to active accounts, net of redemptions.
MANAGEMENT’S DISCUSSION AND ANALYSIS
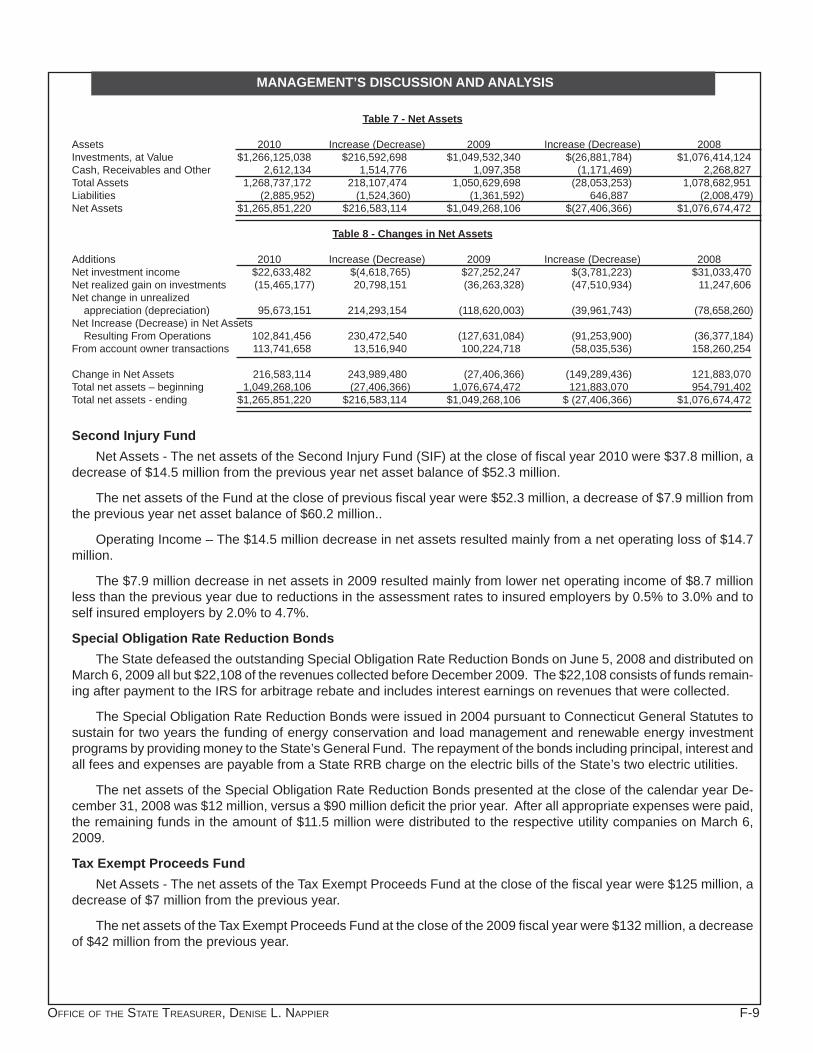
OFFICE OF THE STATE TREASURER, DENISE L. NAPPIER F-9
MANAGEMENT’S DISCUSSION AND ANALYSIS
Table 7 - Net Assets
Assets 2010 Increase (Decrease) 2009 Increase (Decrease) 2008Investments, at Value $1,266,125,038 $216,592,698 $1,049,532,340 $(26,881,784) $1,076,414,124Cash, Receivables and Other 2,612,134 1,514,776 1,097,358 (1,171,469) 2,268,827Total Assets 1,268,737,172 218,107,474 1,050,629,698 (28,053,253) 1,078,682,951Liabilities (2,885,952) (1,524,360) (1,361,592) 646,887 (2,008,479)Net Assets $1,265,851,220 $216,583,114 $1,049,268,106 $(27,406,366) $1,076,674,472
Table 8 - Changes in Net Assets
Additions 2010 Increase (Decrease) 2009 Increase (Decrease) 2008Net investment income $22,633,482 $(4,618,765) $27,252,247 $(3,781,223) $31,033,470Net realized gain on investments (15,465,177) 20,798,151 (36,263,328) (47,510,934) 11,247,606Net change in unrealized appreciation (depreciation) 95,673,151 214,293,154 (118,620,003) (39,961,743) (78,658,260)Net Increase (Decrease) in Net Assets Resulting From Operations 102,841,456 230,472,540 (127,631,084) (91,253,900) (36,377,184)From account owner transactions 113,741,658 13,516,940 100,224,718 (58,035,536) 158,260,254 Change in Net Assets 216,583,114 243,989,480 (27,406,366) (149,289,436) 121,883,070Total net assets – beginning 1,049,268,106 (27,406,366) 1,076,674,472 121,883,070 954,791,402Total net assets - ending $1,265,851,220 $216,583,114 $1,049,268,106 $ (27,406,366) $1,076,674,472
Second Injury FundNet Assets - The net assets of the Second Injury Fund (SIF) at the close of fi scal year 2010 were $37.8 million, a
decrease of $14.5 million from the previous year net asset balance of $52.3 million.
The net assets of the Fund at the close of previous fi scal year were $52.3 million, a decrease of $7.9 million from the previous year net asset balance of $60.2 million..
Operating Income – The $14.5 million decrease in net assets resulted mainly from a net operating loss of $14.7 million.
The $7.9 million decrease in net assets in 2009 resulted mainly from lower net operating income of $8.7 million less than the previous year due to reductions in the assessment rates to insured employers by 0.5% to 3.0% and to self insured employers by 2.0% to 4.7%.
Special Obligation Rate Reduction BondsThe State defeased the outstanding Special Obligation Rate Reduction Bonds on June 5, 2008 and distributed on
March 6, 2009 all but $22,108 of the revenues collected before December 2009. The $22,108 consists of funds remain-ing after payment to the IRS for arbitrage rebate and includes interest earnings on revenues that were collected.
The Special Obligation Rate Reduction Bonds were issued in 2004 pursuant to Connecticut General Statutes to sustain for two years the funding of energy conservation and load management and renewable energy investment programs by providing money to the State’s General Fund. The repayment of the bonds including principal, interest and all fees and expenses are payable from a State RRB charge on the electric bills of the State’s two electric utilities.
The net assets of the Special Obligation Rate Reduction Bonds presented at the close of the calendar year De-cember 31, 2008 was $12 million, versus a $90 million defi cit the prior year. After all appropriate expenses were paid, the remaining funds in the amount of $11.5 million were distributed to the respective utility companies on March 6, 2009.
Tax Exempt Proceeds FundNet Assets - The net assets of the Tax Exempt Proceeds Fund at the close of the fi scal year were $125 million, a
decrease of $7 million from the previous year.
The net assets of the Tax Exempt Proceeds Fund at the close of the 2009 fi scal year were $132 million, a decrease of $42 million from the previous year.

F-10 FISCAL YEAR 2010 ANNUAL REPORT
MANAGEMENT’S DISCUSSION AND ANALYSIS
Changes in Net Assets – The total decreases in net assets of the Tax Exempt Proceeds Fund in fi scal years 2010 and 2009 were the result of a net decrease of fund investments.
REQUIRED SUPPLEMENTARY INFORMATIONFollowing the Financial Statements section of this annual report is a Supplemental Information section that further
explains and supports the fi nancial information and includes additional schedules for the Combined Investment Funds, debt schedules, cash management activities including Civil List Funds, and information on Unclaimed Property and fi scal year division expenses for the Offi ce of the Treasurer.
DEBT ADMINISTRATIONLong-term debt obligations of the State consist of general obligation bonds and revenue dedicated bonded debt.
General obligation bonds, issued by the State, are backed by the full faith and credit of the State. Dedicated revenue debt payments are made from legally restricted revenues.
At June 30, 2010, the State had $19.2 billion in bonds and notes outstanding versus $17.9 billion at June 30, 2009, an increase of $1.3 billion. Outstanding debt at June 30, 2010 was issued to fund local school construction projects, state grants and economic development initiatives, Clean Water Fund loans, improvements to state universities and transportation projects.
The following table presents total outstanding debt for the State distinguished by bond fi nancing type.
Outstanding Debt as of June 30,Bond Type 2010 Increase (Decrease) 2009 Increase (Decrease) 2008General obligation – Tax supported $10,159,003,817 $211,723,492 $9,947,280,325 $308,702,800 $9,638,577,525 Bond Anticipation Notes 581,245,000 0 581,245,000 581,245,000 0 Teachers Retirement Fund 2,276,578,271 0 2,276,578,271 0 2,276,578,271 Economic Recovery Notes 915,795,000 915,795,000 0 0 0 Revenue supported 1,060,000 (530,461) 1,590,461 (530,430) 2,120,891 Transportation 0 0 0 (723,286) 723,286Special Tax Obligation 3,030,485,000 213,470,000 2,817,015,000 27,670,000 2,789,345,000Bradley International Airport 188,785,000 (10,145,000) 198,930,000 (9,605,000) 208,535,000Clean Water Fund 821,950,000 (63,250,000) 885,200,000 390,580,000 494,620,000UCONN 2000 877,492,441 32,547,726 844,944,715 81,531,360 763,413,355CDA Increment Financing 27,550,000 (2,525,000) 30,075,000 (2,430,000) 32,505,000CDA Government Lease revenue 2,915,000 (620,000) 3,535,000 (580,000) 4,115,000CHEFA Childcare Facilities program 68,240,000 (1,360,000) 69,600,000 15,895,000 53,705,000Bradley Parking operations 43,005,000 (1,650,000) 44,655,000 (1,550,000) 46,205,000CT Juvenile Training school 16,080,000 (440,000) 16,520,000 (420,000) 16,940,000CHFA Special Needs Housing Bonds 61,775,000 (1,980,000) 63,755,000 37,840,000 25,915,000CCEDA Bonds 102,680,000 (2,435,000) 105,115,000 20,850,000 84,265,000Total $19,174,639,529 $1,288,600,757 $17,886,038,772 $1,448,475,444 $16,437,563,328
During fi scal year 2010, the State issued $1.7 billion of new money bonds, $0.9 billion of Economic Recovery Notes and $0.3 billion of bond anticipation notes to fund state programs and issued refunding bonds totaling $0.5 billion to refi nance amounts outstanding on previously issued bonds as interest rates continued at relatively low levels during the year. The $3.4 billion of issued bonds were offset by bonds retired of $1.7 billion and bonds refunded of $0.5 bil-lion resulting in a net increase of $1.2 billion in bonds outstanding. Since 1999, debt refunding and defeasances have produced $0.645 billion in debt savings to taxpayers.
Moody’s Investors Service, Standard & Poor’s Corporation, and Fitch Investors Service rate the State’s general obligations AA with Stable Outlooks from all three credit rating agencies.
More detailed information about outstanding bonds and other long-term debt can be found in the Supplemental and Statistical Sections of this report.

OFFICE OF THE STATE TREASURER, DENISE L. NAPPIER F-11
ECONOMIC CONDITIONS AND OUTLOOKAfter an extended run of dismal performance, the equity markets fi nally returned to positive territory. As Fiscal Year
2010 began, The S&P 500 turned positive after a string of fi ve consecutive quarters of negative performance. Buoyed by improving liquidity conditions and signs that the worst of the downturn and fi nancial crisis may now be over, stocks posted solid gains across most regions and sectors. The Federal Open Market Committee (FOMC) maintained its zero-to-25 basis point target in the federal funds rate. However in response to the improving economic outlook and record Treasury issuance, interest rates rose signifi cantly during the fi rst half of 2010.
After starting the fi scal year off with generally rising prices, U.S. and global equity markets underwent a correc-tion in the last half of the fi scal year. During Fiscal Year 2010, indications of long-term strength in the domestic and global economies continued. Corporate profi ts were strong. The European Union responded effectively to the sov-ereign debt crisis. Infl ation in developed counties remained under control. Emerging economies grew, as did large developed economies of the U.S., Germany and China. Nevertheless, the Dow ended the fi scal year at 9,774, 15.7% better than the 8,447 level it was at when the fi scal year began, but down from 11,204 reached in April 2010. Most analysts attributed the decline in stock prices to investor doubts about European debt, the sustainability of recovery, fi scal policy in Europe and China, and the consequences of the oil spill in the Gulf of Mexico. The percent of the U.S. labor force that is unemployed remained at 9.5 percent at the end of the fi scal year 2010, unchanged from 2009. The percent of the Connecticut labor force that is unemployed rose to 8.9 percent for the fi scal year ended June 2010. Throughout this period the Fed’s FOMC has continued to employ all available tools to promote economic recovery and to preserve price stability. While the FOMC expects that the economic recovery is proceeding and that the labor market is improving gradually, at its June 2010 meeting the Committee maintained the target range for the federal funds rate at 0 to ¼ percent for an extended period in 2010.
CONTACTING THE OFFICE OF THE TREASURERThis fi nancial report is designed to provide a general overview of the Offi ce of the Treasurer’s fi nances and to show
the Offi ce’s accountability for the money it receives. Questions about this report or requests for additional information should be addressed to:
Connecticut State Treasury55 Elm Street
Hartford, CT 06106-1773Telephone (860) 702-3000
www.state.ct.us/ott
MANAGEMENT’S DISCUSSION AND ANALYSIS

F-12 FISCAL YEAR 2010 ANNUAL REPORT
MANAGEMENT’S REPORT
December 30, 2010
To the Honorable M. Jodi Rell, Governor of Connecticut Denise L. Nappier, Treasurer of Connecticut Members of the Connecticut General Assembly And Citizens of the State of Connecticut
This report was prepared by the Offi ce of the Treasurer, which is responsible for the accuracy of the data, the completeness and fairness of the presentation and all disclosures. We present the fi nancial statements and data as being accurate in all material respects and prepared in conformity with generally accepted ac-counting principles and such fi nancial statements are audited annually by the State of Connecticut Auditors of Public Accounts.
To carry out this responsibility, the Offi ce of the Treasurer maintains fi nancial policies, procedures, ac-counting systems and internal controls that management believes provide reasonable, but not absolute, assur-ance that accurate fi nancial records are maintained and investments and other assets are safeguarded.
It is our belief that the contents of this Annual Report make evident the State of Connecticut Offi ce of the Treasurer support of the safe custody and conscientious stewardship of the State’s property and money including Trusts and Custodial accounts held by the State Treasurer. In addition, the Offi ce of the Treasurer has sought to maximize earnings on the assets held by the State Treasurer within the boundaries of prudent investment guidelines authorized by Article Four, Section 22 of the Connecticut Constitution and in Title 3 of the Connecticut General Statutes, thereby stabilizing taxpayer costs and securing the safety of benefi t commitments established by various General Statutes covering the State retirement systems and other retirement systems administered by the State.
The State of Connecticut also issues a Comprehensive Annual Financial Report (the “CAFR”) avail-able from the State Comptroller’s Offi ce. The material presented herein is intended to expand on, but not to confl ict with, the State’s CAFR.
In management’s opinion, the internal control structure of the Offi ce of the Treasurer is adequate to ensure that the fi nancial information in this report presents fairly the fi nancial condition and results of opera-tions of the funds that follow.
Sincerely,
Howard G. RifkinDeputy Treasurer

OFFICE OF THE STATE TREASURER, DENISE L. NAPPIER F-13

F-14 FISCAL YEAR 2010 ANNUAL REPORT
COMBINED INVESTMENT FUNDSSTATEMENT OF NET ASSETS
JUNE 30, 2010
TOTALASSETS Investments in Securities, at Fair Value Liquidity Fund $ - Cash Equivalents 1,640,653,567 Asset Backed Securities 91,299,042 Government Securities 2,823,711,217 Government Agency Securities 834,378,865 Mortgage Backed Securities 323,166,587 Corporate Debt 1,603,717,186 Convertible Securities 42,184,097 Common Stock 10,344,453,334 Preferred Stock 68,897,290 Real Estate Investment Trust 98,855,754 Mutual Fund 1,010,283,472 Limited Liability Corporation 4,238,959 Trusts 2,708,893 Limited Partnerships 2,896,391,142 Annuities - Total Investments in Securities, at Fair Value 21,784,939,405 Cash 40,214,066 Receivables - Foreign Exchange Contracts 4,248,215,036 Interest Receivable 77,124,682 Dividends Receivable 19,811,134 Due from Brokers 284,542,369 Foreign Taxes 10,668,171 Securities Lending Receivable 1,032,633 Reserve for Doubtful Receivables (2,324,597)Total Receivables 4,639,069,428 Invested Securities Lending Collateral 2,811,954,840 Other Funds on Deposit - Prepaid Expenses 3,377,990 Total Assets 29,279,555,729 LIABILITIES Payables Foreign Exchange Contracts 4,181,944,637 Due to Brokers 388,858,600 Income Distribution 84,688 Other Payable 11,311,177 Total Payables 4,582,199,102 Securities Lending Collateral 2,811,954,840 Accrued Expenses 15,811,425 Total Liabilities 7,409,965,367 NET ASSETS HELD IN TRUST FOR PARTICIPANTS $ 21,869,590,362
The accompanying notes are an integral part of these fi nancial statements.
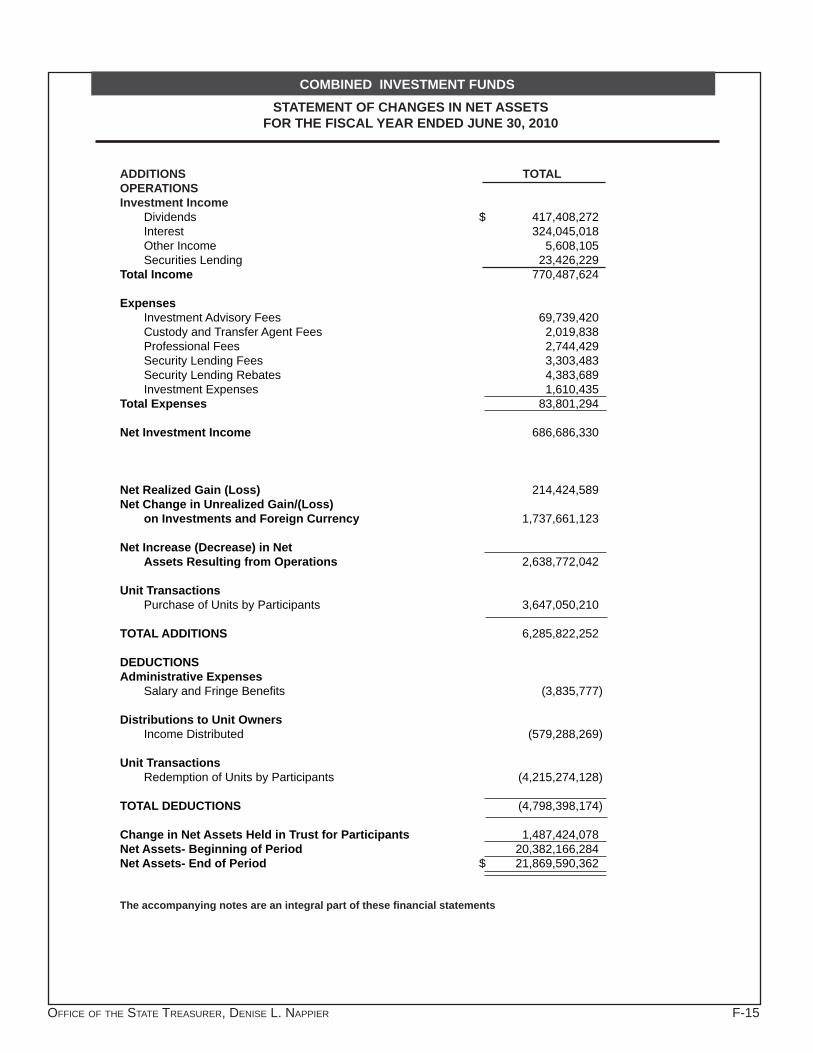
OFFICE OF THE STATE TREASURER, DENISE L. NAPPIER F-15
COMBINED INVESTMENT FUNDSSTATEMENT OF CHANGES IN NET ASSETS
FOR THE FISCAL YEAR ENDED JUNE 30, 2010
ADDITIONS TOTALOPERATIONSInvestment Income Dividends $ 417,408,272 Interest 324,045,018 Other Income 5,608,105 Securities Lending 23,426,229 Total Income 770,487,624 Expenses Investment Advisory Fees 69,739,420 Custody and Transfer Agent Fees 2,019,838 Professional Fees 2,744,429 Security Lending Fees 3,303,483 Security Lending Rebates 4,383,689 Investment Expenses 1,610,435 Total Expenses 83,801,294 Net Investment Income 686,686,330 Net Realized Gain (Loss) 214,424,589 Net Change in Unrealized Gain/(Loss) on Investments and Foreign Currency 1,737,661,123 Net Increase (Decrease) in Net Assets Resulting from Operations 2,638,772,042 Unit Transactions Purchase of Units by Participants 3,647,050,210 TOTAL ADDITIONS 6,285,822,252 DEDUCTIONS Administrative Expenses Salary and Fringe Benefi ts (3,835,777) Distributions to Unit Owners Income Distributed (579,288,269) Unit Transactions Redemption of Units by Participants (4,215,274,128) TOTAL DEDUCTIONS (4,798,398,174) Change in Net Assets Held in Trust for Participants 1,487,424,078 Net Assets- Beginning of Period 20,382,166,284 Net Assets- End of Period $ 21,869,590,362
The accompanying notes are an integral part of these fi nancial statements

F-16 FISCAL YEAR 2010 ANNUAL REPORT
COMBINED INVESTMENT FUNDSSTATEMENT OF CHANGES IN NET ASSETS
FOR THE FISCAL YEAR ENDED JUNE 30, 2009
ADDITIONS TOTALOPERATIONSInvestment Income Dividends $ 399,860,020 Interest 358,920,317 Other Income 8,701,607 Securities Lending 66,185,755 Total Income 833,667,699 Expenses Investment Advisory Fees 55,934,969 Custody and Transfer Agent Fees 1,748 Professional Fees 2,517,327 Security Lending Fees 6,251,980 Security Lending Rebates 24,212,508 Investment Expenses 954,425 Total Expenses 89,872,957 Net Investment Income 743,794,742 Net Realized Gain (Loss) (2,942,360,696)Net Change in Unrealized Gain/(Loss) on Investments and Foreign Currency (2,333,600,964) Net Increase (Decrease) in Net Assets Resulting from Operations (4,532,166,918) Unit Transactions Purchase of Units by Participants 6,599,282,672 TOTAL ADDITIONS 2,067,115,754 DEDUCTIONS Administrative Expenses: Salary and Fringe Benefi ts (3,393,293) Distributions to Unit Owners: Income Distributed (707,641,173) Unit Transactions Redemption of Units by Participants (6,845,737,682) TOTAL DEDUCTIONS (7,556,772,148) Change in Net Assets Held in Trust for Participants (5,489,656,394) NET ASSETS HELD IN TRUST FOR PARTICIPANTSNet Assets- Beginning of Period 25,871,822,678 Net Assets- End of Period $ 20,382,166,284
The accompanying notes are an integral part of these fi nancial statements

OFFICE OF THE STATE TREASURER, DENISE L. NAPPIER F-17
COMBINED INVESTMENT FUNDS
NOTES TO FINANCIAL STATEMENTS
NOTE 1: SUMMARY OF SIGNIFICANT ACCOUNTING POLICIES The Combined Investment Funds (the “Funds”) are separate legally defi ned funds, which have been created by the
Treasurer of the State of Connecticut (the “Treasurer”) under the authority of the Connecticut General Statutes (CGS) Section 3-31b. The Funds are open-end, unitized portfolios consisting of the Liquidity Fund, Mutual Equity Fund, Core Fixed Income Fund, Infl ation Linked Bond Fund, Emerging Market Debt Fund, High Yield Fund, Developed Market International Stock Fund, Emerging Market International Stock Fund, Real Estate Fund, Commercial Mortgage Fund and the Private Investment Fund. The Funds were established to provide a means for investing pension and other trust fund assets entrusted to the Treasurer in a variety of investment classes. The units of the Funds are owned by these pension and trust funds. For fi nancial reporting purposes of the State of Connecticut, the Funds are considered to be internal investment pools and are not reported in the State’s combined fi nancial statements. Instead, each fund type’s investment in the fund is reported as “equity in combined investment funds” in the State’s combined balance sheet.
The Treasurer, as sole fi duciary of the Funds, is authorized to invest in a broad range of fi xed income and equity securities, as well as real estate properties, mortgages and private equity. This authority is restricted only by statute. Such limitations include prohibitions against investment in companies doing business in Iran and those doing business in Northern Ireland, but who have failed to implement the MacBride Principles (CGS Section 3–13h). Other legislation restricts the maximum aggregate investment in equity securities to 60% of the fair value of the Trust Funds.
The Funds are not subject to regulatory oversight and are not registered with the Securities and Exchange Com-mission as an investment company.
The following is a summary of signifi cant accounting policies consistently followed by the Funds in the preparation of their fi nancial statements.
A. NEW PRONOUNCEMENTSThe fi nancial statements and corresponding footnotes include the application of GASB 53, “Accounting and Finan-
cial Reporting for Derivative Instruments.” This Statement requires that the fair value of fi nancial arrangements called derivatives or derivative instruments be reported in the fi nancial statements. The provisions of this Statement are ef-fective for periods beginning after June 15, 2009.
B. SECURITY VALUATIONInvestments are stated at fair value for each of the Funds as described below. For the Commercial Mortgage Fund,
the investments listed on the Statement of Net Assets, other than the amounts invested in the Liquidity Fund, are shown at fair values provided to the Fund by the investment advisor, and adjusted, when appropriate, by the Treasurer’s staff. For the Real Estate and Private Investment Funds substantially all of the investments, other than those in the Liquidity Fund, are shown at values that are estimated by the Treasurer’s staff. Such estimations utilize the investment advi-sors’ prior quarter end estimated fair value, plus or minus the appropriate related cash fl ows as described later in this section. The Treasurer’s staff reviews the valuations for all investments in these alternative asset classes (Commercial Mortgage, Real Estate, and Private Investment Funds) to see that they are reasonable and consistent. Due to the inherent uncertainty of valuation, those estimated values may differ signifi cantly from the values that would have been used had a ready market for the securities existed and the differences could be material.
Liquidity FundExisting money market vehicles are valued at amortized cost on a daily basis, which approximates fair value. A
standard price hierarchy is utilized in the daily valuation of the Liquidity Fund.
The Liquidity Fund at times may utilize foreign currency contracts to facilitate transactions in foreign securities and to manage the Funds’ currency exposure. Contracts to buy are used to acquire exposure to foreign currencies, while contracts to sell are used to hedge the Funds’ investments against currency fl uctuations. Also, a contract to buy or sell can offset a previous contract. Losses may arise from changes in the value of the foreign currency or failure of the counterparties to perform under the contracts’ terms.
Investing in forward currency contracts may increase the volatility of the Funds’ performance. Price movements of currency contracts are infl uenced by, among other things, international trade, fi scal, monetary, and exchange control programs and policies; national and international political and economic events; and changes in worldwide interest

F-18 FISCAL YEAR 2010 ANNUAL REPORT
COMBINED INVESTMENT FUNDSNOTES TO FINANCIAL STATEMENTS (Continued)
rates. Governments from time to time intervene in the currency markets with the specifi c intent of infl uencing currency prices. Such intervention may cause certain currency prices to move rapidly. Additionally, the currency markets may be particularly sensitive to interest rate fl uctuations.
The U. S. dollar value of forward foreign currency contracts is determined using forward currency exchange rates supplied by a quotation service.
Investments are valued based on quoted market prices when available. For securities that have no quoted market value, fair value is estimated based on yields currently available on comparable securities of issuers with similar credit ratings.
When-issued securities held are fully collateralized by U.S Government securities and such collateral is in the pos-session of the Fund’s custodian. The collateral is evaluated daily to ensure its market value exceeds the current market value of the instruments including accrued interest
The Liquidity Fund invests in Mortgage Backed Securities (MBSs) and Asset Backed Securities (ABSs), which are included in the Statement of Net Assets. These are bonds issued by a special purpose trust that collects payments on an underlying collateral pool of mortgage or other loans and remits payments to bondholders. The bonds are structured in a series of classes or tranches, each with a different coupon rate and stated maturity date. Interest payments to the bondholders are made in accordance with the trust indentures and amounts received from borrowers in excess of interest payments and expenses are used to amortize the principal on the bonds. Such principal payments are made to retire the tranches of bonds in order of their stated maturity. Because mortgage prepayments are largely dependent on market interest rates, the ultimate maturity date of the bonds is unpredictable and is sensitive to changes in market interest rates, but is generally prior to the stated maturity date. At June 30, 2010, the Fund held MBSs of $10,124,847 and ABSs of $42,554,779.
Repurchase Agreements held are collateralized at 100 percent of the securities’ value. Such transactions are only entered into with primary government securities dealers who report directly to the Federal Reserve Bank of New York. The collateral is evaluated daily to ensure its fair value exceeds the current fair value of the repurchase agreements including accrued interest.
Mutual Equity FundSecurities traded on securities exchanges are valued at the last reported sales price on the last business day of
the fi scal year. Corporate bonds and certain over-the-counter stocks are valued at the mean of bid and asked prices as furnished by broker-dealers.
Core Fixed Income FundInvestments are valued based on quoted market prices when available. For securities that have no quoted market
value, fair value is estimated based on yields currently available on comparable securities of issuers with similar credit ratings.
When-issued securities held are fully collateralized by U.S Government securities and such collateral is in the pos-session of the Fund’s custodian. The collateral is evaluated daily to ensure its market value exceeds the current market value of the instruments including accrued interest.
The Core Fixed Income Fund invests in Mortgage Backed Securities (MBSs) and Asset Backed Securities (ABSs), which are included in the Statement of Net Assets. These are bonds issued by a special purpose trust that collects payments on an underlying collateral pool of mortgage or other loans and remits payments to bondholders. The bonds are structured in a series of classes or tranches, each with a different coupon rate and stated maturity date. Interest payments to the bondholders are made in accordance with the trust indentures and amounts received from borrowers in excess of interest payments and expenses are used to amortize the principal on the bonds. Such principal payments are made to retire the tranches of bonds in order of their stated maturity. Because mortgage prepayments are largely dependent on market interest rates, the ultimate maturity date of the bonds is unpredictable and is sensitive to changes in market interest rates, but is generally prior to the stated maturity date. At June 30, 2010, the Fund held MBSs of $304,081,637 and ABSs of $32,251,192.
Interest-only stripped mortgage backed securities (IOs), a specialized type of Collateralized Mortgage Obligation (CMO), are included as Mortgage Backed Securities on the statement of Net Assets. The cash fl ow on these invest-

OFFICE OF THE STATE TREASURER, DENISE L. NAPPIER F-19
COMBINED INVESTMENT FUNDSNOTES TO FINANCIAL STATEMENTS (Continued)
ments is derived from the interest payments on the underlying mortgage loans. Prepayments on the underlying loans curtail these interest payments, reducing the value of the IOs and, as such, these instruments are extremely sensitive to changes in interest rates, which encourage or discourage such prepayments. At June 30, 2010 the Fund’s holdings had a fair value of $709,218 and a cost of $7.9 million. The valuations were provided by the custodian.
Investments in non-U.S. fi xed income securities are utilized on an opportunistic basis. Certain advisors within the Core Fixed Income Fund are authorized to invest in global fi xed income securities.
Infl ation Linked Bond FundInvestments are valued based on quoted market prices when available. For securities that have no quoted market
value, fair value is estimated based on yields currently available on comparable securities of issuers with similar credit ratings.
When-issued securities held are fully collateralized by U.S Government securities and such collateral is in the pos-session of the Fund’s custodian. The collateral is evaluated daily to ensure its market value exceeds the current market value of the instruments including accrued interest.
Investments in non-U.S. fi xed income securities are utilized on an opportunistic basis. Certain advisors within the Infl ation Linked Bond Fund are authorized to invest in global fi xed income securities.
Emerging Market Debt FundInvestments are valued based on quoted market prices when available. For securities that have no quoted market
value, fair value is estimated based on yields currently available on comparable securities of issuers with similar credit ratings.
When-issued securities held are fully collateralized by U.S Government securities and such collateral is in the pos-session of the Fund’s custodian. The collateral is evaluated daily to ensure its market value exceeds the current market value of the instruments including accrued interest.
The Emerging Market Debt Fund invests in Mortgage Backed Securities (MBSs), which are included in the State-ment of Net Assets. These are bonds issued by a special purpose trust that collects payments on an underlying col-lateral pool of mortgage or other loans and remits payments to bondholders. The bonds are structured in a series of classes or tranches, each with a different coupon rate and stated maturity date. Interest payments to the bondholders are made in accordance with the trust indentures and amounts received from borrowers in excess of interest payments and expenses are used to amortize the principal on the bonds. Such principal payments are made to retire the tranches of bonds in order of their stated maturity. Because mortgage prepayments are largely dependent on market interest rates, the ultimate maturity date of the bonds is unpredictable and is sensitive to changes in market interest rates, but is generally prior to the stated maturity date. At June 30, 2010, the Fund held MBSs of $202,701.
Investments in non-U.S. fi xed income securities are utilized on an opportunistic basis. Certain advisors within the Emerging Market Debt Fund are authorized to invest in global fi xed income securities.
High Yield Debt FundInvestments are valued based on quoted market prices when available. For securities that have no quoted market
value, fair value is estimated based on yields currently available on comparable securities of issuers with similar credit ratings.
When-issued securities held are fully collateralized by U.S Government securities and such collateral is in the pos-session of the Fund’s custodian. The collateral is evaluated daily to ensure its market value exceeds the current market value of the instruments including accrued interest.
The High Yield Fund invests in Mortgage Backed Securities (MBSs) and Asset Backed Securities (ABSs), which are included in the Statement of Net Assets. These are bonds issued by a special purpose trust that collects payments on an underlying collateral pool of mortgage or other loans and remits payments to bondholders. The bonds are structured in a series of classes or tranches, each with a different coupon rate and stated maturity date. Interest payments to the bondholders are made in accordance with the trust indentures and amounts received from borrowers in excess of interest payments and expenses are used to amortize the principal on the bonds. Such principal payments are made to retire the tranches of bonds in order of their stated maturity. Because mortgage prepayments are largely dependent on market interest rates, the ultimate maturity date of the bonds is unpredictable and is sensitive to changes in market

F-20 FISCAL YEAR 2010 ANNUAL REPORT
COMBINED INVESTMENT FUNDSNOTES TO FINANCIAL STATEMENTS (Continued)
interest rates, but is generally prior to the stated maturity date. At June 30, 2010, the Fund held MBSs of $8,564,348 and ABSs of $16,493,071.
Investments in non-U.S. fi xed income securities are utilized on an opportunistic basis. Certain advisors within the High Yield Fund are authorized to invest in global fi xed income securities.
Developed Market International Stock FundInvestments in securities listed on security exchanges are valued at the last reported sales price on the last busi-
ness day of the fi scal year; securities traded in the over-the-counter market and listed securities for which no sale was reported on that date are valued at the mean of the last reported bid and asked prices.
Certain cash held in non-U.S. dollar denominated trading accounts is non-interest bearing.
Emerging Market International Stock FundInvestments in securities listed on security exchanges are valued at the last reported sales price on the last busi-
ness day of the fi scal year; securities traded in the over-the-counter market and listed securities for which no sale was reported on that date are valued at the mean of the last reported bid and asked prices.
Certain cash held in non-U.S. dollar denominated trading accounts is non-interest bearing.
Real Estate FundInvestments in securities not listed on security exchanges and investments in trusts, limited partnerships, and an-
nuities, which comprise substantially all of the Fund’s investments, are carried at the cash adjusted fair value. The cash adjusted fair value utilizes the prior calendar quarter end fair value as estimated by the investment advisor, (i) plus cash fl ows relating to capitalized expenses and principal contributions disbursed from and (ii) minus amounts received by the Real Estate Fund, to estimate the current fair value. The Treasurer’s staff reviews the prior quarter estimated fair values provided by the investment advisors for reasonableness. In those instances where an advisor’s value appears to be overstated, this estimated fair value is adjusted accordingly. Additionally, the staff monitors the estimated cash adjusted fair values against the estimated values subsequently reported by the investment advisors. In the event of signifi cant total Fund-level differences between the cash adjusted estimates and the investment advisors’ estimated values, adjust-ments to the reported cash adjusted fair values are made to prevent overstatement. At June 30, 2010, the estimated investment values provided by the investment advisors, net of the adjustments noted above, exceeded cash adjusted fair values reported on the Statement of Net Assets by approximately $19 million. Consistent with the cash adjusted fair value presentation this increase will be considered for the next quarter’s adjustment.
Commercial Mortgage FundThis Fund invests in commercial mortgage loans and mortgage backed securities generally through indirect own-
ership vehicles such as trusts and corporations. The value of the Fund’s interest in these entities is based on the fair value of the underlying commercial loan portfolio or securities held. Fair value for the mortgage portfolio is computed by discounting the expected cash fl ows of the loans at a rate commensurate with the risk inherent in the loans. The discount rate is determined using the yield on U.S. Treasury securities of comparable remaining maturities plus an appropriate market spread for credit and liquidity risk. The Fund does not record fair values in excess of amounts at which the bor-rower could settle the obligation, giving effect to any prepayment premiums. In the event that the fair value of the loan collateral, based on an appraisal, is less than the outstanding principal balance, the collateral value is used as fair value. These calculations are performed by the investment advisor and reviewed by Treasury personnel.
Private Investment FundThe Private Investment Fund is comprised of investments in various limited partnerships, limited liability companies
and securities. The general partner or managing member is the investment advisor and is compensated on a fee basis for management services in addition to its participation in partnership profi ts and losses. These investments are carried at their cash adjusted fair values. The cash adjusted fair value utilizes the prior quarter fair value as estimated by the investment advisor, (i) plus cash fl ows relating to capitalized expenses and principal contributions disbursed from and (ii) minus amounts received by the Private Investment Fund, to estimate the current fair value. The Treasurer’s staff reviews the prior quarter estimated fair values provided by the investment advisors for reasonableness. In those in-stances where an advisor’s value appears to be overstated, the estimated fair value is adjusted accordingly. Additionally, the staff monitors the estimated cash adjusted fair values against the estimated values subsequently reported by the investment advisors. In the event of signifi cant total Fund-level differences between the cash adjusted estimates and the investment advisors’ estimated values, adjustments of reported cash adjusted values are made to prevent overstate-
OFFICE OF THE STATE TREASURER, DENISE L. NAPPIER F-21
COMBINED INVESTMENT FUNDSNOTES TO FINANCIAL STATEMENTS (Continued)
ment. At June 30, 2010, the estimated investment values provided by the investment advisors, net of the adjustments noted above, exceeded cash adjusted fair values reported on the Statement of Net Assets by approximately $35 mil-lion. Consistent with the cash adjusted fair value presentation this increase will be considered for the next quarter’s adjustment. Securities traded on securities exchanges are valued at the last reported sales price on the last business day of the fi scal year. Corporate bonds and certain over-the-counter stocks are valued at the mean of bid and asked prices as furnished by broker-dealers.
Fair values of the underlying investments are generally represented by cost unless there has been an additional arms-length indication of value, such as a public offering or a new investment by a third party.
C. INVESTMENT TRANSACTIONS AND RELATED INCOME Investment transactions are accounted for on a trade date basis. Dividend income is recognized as earned on the
ex-dividend date. Interest income is recorded on the accrual basis as earned. Realized gains and losses are computed on the basis of the average cost of investments sold. Such amounts are calculated independent of and are presented separately from the Net Change in Unrealized Gains and Losses on the Statement of Operations and the Statement of Changes in Net Assets. Realized gains and losses on investments held more than one fi scal year and sold in the cur-rent year were included as a change in the fair value of investments reported in the prior year(s) and the current year. Unrealized gains and losses represent the difference between the fair value and the cost of investments. The increase (decrease) in such difference is accounted for as a change in unrealized gain (loss). In the Funds’ cost basis records, premiums are amortized using the straight-line method that approximates the interest method.
Dividends earned by the Private Investment, Real Estate, Commercial Mortgage Funds relate to investments that are not listed on security exchanges. Such dividends are recognized as income when received, generally net of ad-visory fees.
D. FOREIGN CURRENCY TRANSLATIONThe value of investments, assets and liabilities denominated in currencies other than U.S. dollars are translated
into U.S. dollars based upon appropriate fi scal year end foreign exchange rates. Purchases and sales of foreign invest-ments and income and expenses are converted into U.S. dollars based on currency exchange rates prevailing on the respective dates of such transactions. The Funds do not isolate that portion of the results of operations arising from changes in the exchange rates from that portion arising from changes in the market prices of securities.
E. SHARE TRANSACTIONS AND PRICINGAll unit prices are determined at the end of each month based on the net asset value of each fund divided by the
number of units outstanding. Purchases and redemptions of units are based on the prior month end price and are generally processed on the fi rst business day of the month.
F. EXPENSESExpenses of the funds are recognized on the accrual basis and are deducted in calculating net investment income
and net asset value on a monthly basis. Fees and expenses of the Real Estate Fund are generally recognized when paid, by netting them against dividends received. Each of the funds bears its direct expenses, such as investment advisory fees, and, in addition, each of the funds is allocated a portion of the overhead expenses of the Pension Funds Management Division of the Offi ce of the State Treasurer, which services the funds. These expenses include salary and fringe benefi t costs and other administrative expenses. Certain of these costs are allocated among the Funds based on relative net asset values. Other costs are charged directly based on the specifi c duties of personnel.
G. DISTRIBUTIONSNet investment income earned by the Combined Investment Funds is distributed monthly to the unit owners of the
funds, generally in the following month.

F-22 FISCAL YEAR 2010 ANNUAL REPORT
COMBINED INVESTMENT FUNDSNOTES TO FINANCIAL STATEMENTS (Continued)
H. DERIVATIVE FINANCIAL INSTRUMENTSGASB Statement Number 53 Accounting and Financial Reporting for Derivative Instruments, requires that the fair
value of fi nancial arrangements called derivatives or derivative instruments be reported in the fi nancial statements. GASB defi nes a derivative instrument as a fi nancial instrument or other contract with all of the following characteristics: a) It has one or more reference rates and (2) one or more notional amounts or payment provisions or both. b) It requires no initial net investment or an initial net investment that is smaller than would be required for other types of contracts that would be expected to have a similar response to changes in market factors. c) Its terms require or permit net settle-ment, it can readily be settled net by a means outside the contract, or it provides for delivery of an asset that puts the recipient in a position not substantially different from net settlement.
For the fi scal year ended June 30, 2010, the funds maintained positions in a variety of such securities that are all reported at fair value on the statement of net assets. The Liquidity Fund held adjustable rate securities with a fair value of $684,901,790 and cost of $684,749,050, asset backed securities with a fair value of $42,554,779 and a cost of $42,695,795, and mortgage backed securities net of CMOs with a fair value of $ 9,628,140 and a cost of $9,654,805 and CMOs with a fair value and cost of $496,708 and TBAs with a fair value of $4,333,905 and a cost of $4,302,812. The Core Fixed Income Fund held adjustable rate securities with a fair value of $329,785,107 and a cost of $331,955,243, asset backed securities with a fair value of $32,251,192 and a cost of $32,075,020, mortgage backed securities net of CMOs with a fair value of $91,352,516 and a cost of $93,016,705 and CMOs with a fair value of $212,729,121 and a fair value $217,205,099, TBAs with a fair value of $97,064,046 and a cost of $96,673,956, and IOs securities with a fair value of $ 709,218 and a cost of $7,860,727. The Emerging Market Debt Fund held adjustable rate securities with a fair value of $77,186,197 and a cost of $72,885,655, mortgage backed securities with a fair value of $202,701 and a cost of $204,120. The Emerging Market Debt Fund also held futures with a notional cost of $11,541,279 and an unre-alized gain of $306,103 reported in the Due From Brokers in the Statement of Net Assets. The High Yield Fund held adjustable rate securities with a fair value of $18,135,922 and a cost of $18,226,992, mortgage backed securities net of CMOs with a fair value of $8,564,348 and a cost of $8,606,191, and CMOs with a fair value of $16,493,071 and a cost of $14,402,118. The Developed Market International Stock held adjustable rate securities with a fair value of $48,420 and a cost of $47,305 and option securities with a fair value of $942,566 and a cost of $786,600. The Developed Market International Stock also held futures with a notional cost of $30,870,542 and an unrealized gain of $3,425,619 reported in the Due From Brokers and an unrealized loss of $5,836,114 reported in the Due to Brokers in the Statement of Net Assets.
The Liquidity Fund, Core Fixed Income Fund, Emerging Market Debt Fund, High Yield Debt Fund, Developed Market International Stock Fund and Emerging Market International Stock Fund, and were invested in foreign exchange con-tracts. The specifi c nature of these investments is discussed more fully in the foreign exchange contract note for each respective fund, where appropriate. These fi nancial instruments are utilized for trading and other purposes. Those that are used for other than trading purposes are foreign exchange contracts, which can be used to facilitate trade settle-ments, and may serve as foreign currency hedges. The credit exposure resulting from such contracts is limited to the recorded fair value of the contracts on the Statement of Net Assets.
The remaining such securities are utilized for trading purposes and are intended to enhance investment returns. All positions are reported at fair value and changes in fair value are refl ected in income as they occur. The funds’ credit exposure resulting from such investments is limited to the recorded fair value of the derivative fi nancial instruments.
The Mutual Equity Fund, Core Fixed Income Fund, Emerging Market Debt Fund, Developed International Stock Fund, and the Emerging Market International Stock Fund also utilize derivatives indirectly through participation in mutual funds. These mutual funds may hold derivatives from time to time. Such derivatives may be used for hedging, invest-ment and risk management purposes. These transactions subject the investor to credit and market risk.
I. COMBINATION/ELIMINATION ENTRYThe fi nancial statements depict a full presentation of each of the Combined Investment Funds. However, one of
these funds, the Liquidity Fund, is owned both directly by the pension plans and trust funds which have accounts in the Fund, and also indirectly because each of the other Combined Investment Funds has an account with the Liquidity Fund. As a result, elimination entries are presented for the purpose of netting out balances and transactions relating to the ownership of the Liquidity Fund by the other Combined Investment Funds. The combined presentation totals to the overall net assets owned by the pension plans and trust funds.
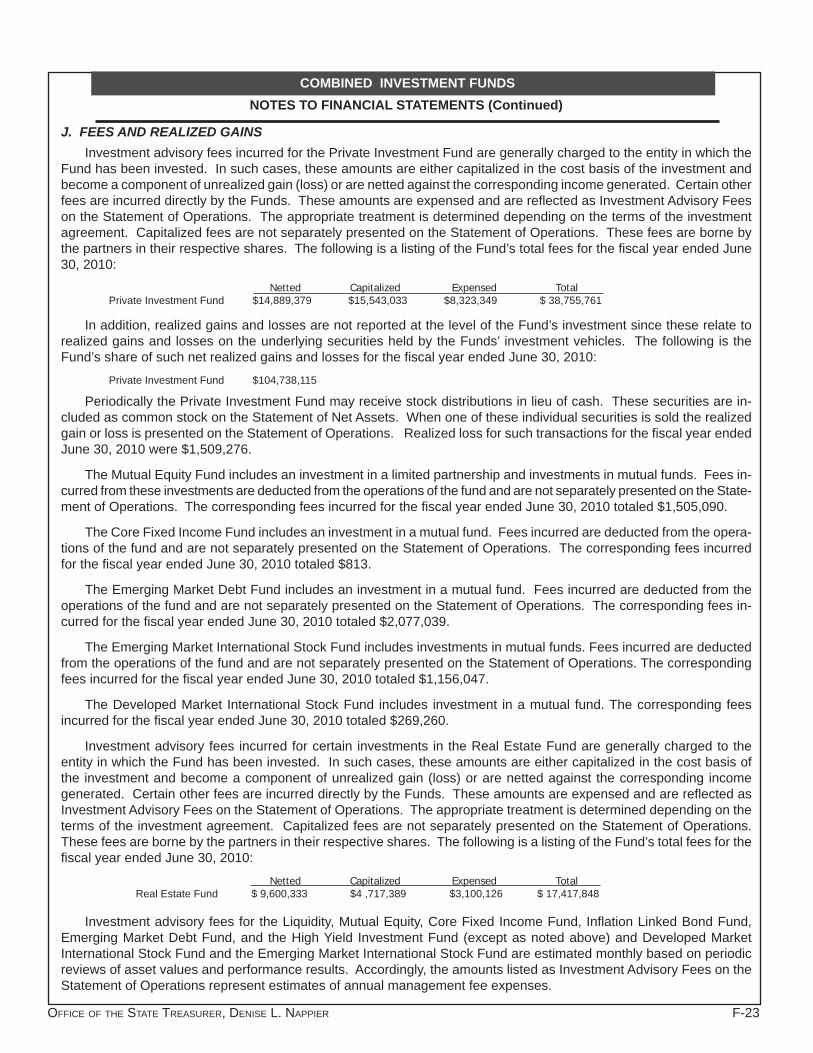
OFFICE OF THE STATE TREASURER, DENISE L. NAPPIER F-23
COMBINED INVESTMENT FUNDSNOTES TO FINANCIAL STATEMENTS (Continued)
J. FEES AND REALIZED GAINSInvestment advisory fees incurred for the Private Investment Fund are generally charged to the entity in which the
Fund has been invested. In such cases, these amounts are either capitalized in the cost basis of the investment and become a component of unrealized gain (loss) or are netted against the corresponding income generated. Certain other fees are incurred directly by the Funds. These amounts are expensed and are refl ected as Investment Advisory Fees on the Statement of Operations. The appropriate treatment is determined depending on the terms of the investment agreement. Capitalized fees are not separately presented on the Statement of Operations. These fees are borne by the partners in their respective shares. The following is a listing of the Fund’s total fees for the fi scal year ended June 30, 2010:
Netted Capitalized Expensed Total Private Investment Fund $14,889,379 $15,543,033 $8,323,349 $ 38,755,761
In addition, realized gains and losses are not reported at the level of the Fund’s investment since these relate to realized gains and losses on the underlying securities held by the Funds’ investment vehicles. The following is the Fund’s share of such net realized gains and losses for the fi scal year ended June 30, 2010:
Private Investment Fund $104,738,115
Periodically the Private Investment Fund may receive stock distributions in lieu of cash. These securities are in-cluded as common stock on the Statement of Net Assets. When one of these individual securities is sold the realized gain or loss is presented on the Statement of Operations. Realized loss for such transactions for the fi scal year ended June 30, 2010 were $1,509,276.
The Mutual Equity Fund includes an investment in a limited partnership and investments in mutual funds. Fees in-curred from these investments are deducted from the operations of the fund and are not separately presented on the State-ment of Operations. The corresponding fees incurred for the fi scal year ended June 30, 2010 totaled $1,505,090.
The Core Fixed Income Fund includes an investment in a mutual fund. Fees incurred are deducted from the opera-tions of the fund and are not separately presented on the Statement of Operations. The corresponding fees incurred for the fi scal year ended June 30, 2010 totaled $813.
The Emerging Market Debt Fund includes an investment in a mutual fund. Fees incurred are deducted from the operations of the fund and are not separately presented on the Statement of Operations. The corresponding fees in-curred for the fi scal year ended June 30, 2010 totaled $2,077,039.
The Emerging Market International Stock Fund includes investments in mutual funds. Fees incurred are deducted from the operations of the fund and are not separately presented on the Statement of Operations. The corresponding fees incurred for the fi scal year ended June 30, 2010 totaled $1,156,047.
The Developed Market International Stock Fund includes investment in a mutual fund. The corresponding fees incurred for the fi scal year ended June 30, 2010 totaled $269,260.
Investment advisory fees incurred for certain investments in the Real Estate Fund are generally charged to the entity in which the Fund has been invested. In such cases, these amounts are either capitalized in the cost basis of the investment and become a component of unrealized gain (loss) or are netted against the corresponding income generated. Certain other fees are incurred directly by the Funds. These amounts are expensed and are refl ected as Investment Advisory Fees on the Statement of Operations. The appropriate treatment is determined depending on the terms of the investment agreement. Capitalized fees are not separately presented on the Statement of Operations. These fees are borne by the partners in their respective shares. The following is a listing of the Fund’s total fees for the fi scal year ended June 30, 2010:
Netted Capitalized Expensed Total Real Estate Fund $ 9,600,333 $4 ,717,389 $3,100,126 $ 17,417,848
Investment advisory fees for the Liquidity, Mutual Equity, Core Fixed Income Fund, Infl ation Linked Bond Fund, Emerging Market Debt Fund, and the High Yield Investment Fund (except as noted above) and Developed Market International Stock Fund and the Emerging Market International Stock Fund are estimated monthly based on periodic reviews of asset values and performance results. Accordingly, the amounts listed as Investment Advisory Fees on the Statement of Operations represent estimates of annual management fee expenses.

F-24 FISCAL YEAR 2010 ANNUAL REPORT
COMBINED INVESTMENT FUNDSNOTES TO FINANCIAL STATEMENTS (Continued)
K. RECLASSIFICATIONSCertain prior year amounts have been reclassifi ed to conform to the current year presentation.
L. RELATED PARTY AND OTHER TRANSACTIONSThere were no related party transactions during the fi scal year. Additionally, there were no “soft dollar” transactions.
Soft dollar transactions result from arrangements whereby fi rms doing business with organizations such as the Treasury arrange for third parties to provide other services in lieu of cash payment. These arrangements tend to obscure the true cost of operations and can result in potential overpayment for services. Such transactions have been prohibited by the Treasurer.
M. ESTIMATESThe preparation of fi nancial statements in conformity with generally accepted accounting principles requires man-
agement to make estimates and assumptions that affect the reported amounts of assets and liabilities and disclosures of contingent assets and liabilities at the date of the fi nancial statements and the reported amounts of revenues and expenses during the reporting period. Actual results could differ from those estimates.
NOTE 2: DEPOSITS, INVESTMENTS AND SECURITIES LENDING PROGRAMDeposits:
The Funds minimize custodial credit risk by maintaining certain restrictions set forth in the Investment Policy Statement. Custodial credit risk is risk associated with the failure of a depository fi nancial institution. In the event of a depository fi nancial institution’s failure the Funds would not be able to recover its deposits or collateralized securities that are in the possession of the outside parties. The Funds utilize a Liquidity Account that is a cash management pool investing primarily in highly liquid money market securities such as commercial paper, certifi cates of deposit, bank notes and other cash equivalents, asset backed securities, and fl oating rate corporate bonds. Deposits shall consist of cash instruments generally maturing in less than one year and having a quality rating, by at least one widely recognized rating agency, of A-1 or P-1 and earn interest at a rate equal to or better than the International Business Communications (“IBC”) First Tier Institutions-Only Rated Money Fund Report Index.
At June 30, 2010, the reported amount of Funds deposits were $40,214,066 and the bank balance was $40,214,066. Of the bank amount, $40,214,066 was uncollateralized and uninsured. Through the Securities Lending Program $2,810,567,318 was collateralized with securities held by the counterparty’s trust department or agent but not in the State’s name.Investments:
Pursuant to the Connecticut General Statutes, the Treasurer is the principal fi duciary of the Funds, authorized to invest in a broad range of equity and fi xed income securities, as well as real estate properties, mortgages and private equity. The Funds minimizes credit risk, the risk of loss due to the failure of the security issuer or backer, in accordance with a comprehensive Investment Policy Statement (IPS), as developed by The Offi ce of the Treasurer and the State’s Investment Advisory Council (IAC), that provides policy guidelines for the Funds and includes an asset allocation plan. The asset allocation plan’s main objective is to maximize investment returns over the long term at an acceptable level of risk. There have been no violations of these investment restrictions during the 2010 fi scal year.
The Funds concentration of credit risk, the risk attributed to the magnitude of an investment in a single issuer. There are no restrictions in the amount that can be invested in Government Securities and Government Agency Securities. However, there can be no more than 5% of the total portfolio market value invested in other securities.
The following table provides average credit quality and exposure levels information on the credit ratings associated with Funds investments in debt securities. Fair Percentage Value of Fair Value
Aaa $3,038,954,690 39.81%Aa 300,391,602 3.94%A 410,861,176 5.38%Baa 558,752,848 7.32%Ba 304,202,228 3.99%

OFFICE OF THE STATE TREASURER, DENISE L. NAPPIER F-25
COMBINED INVESTMENT FUNDSNOTES TO FINANCIAL STATEMENTS (Continued)
B 330,842,451 4.33%Caa 139,359,080 1.83%Ca 7,252,325 0.10%C 1,468,633 0.02%MIG 8,259,249 0.11%Prime 1 345,685,399 4.53%Government fi xed income securities (not rated) 374,616,745 4.91%Not Rated 1,812,426,581 23.73% $7,633,073,007 100.00%
The investments in the Private Equity Fund, Real Estate Fund and Commercial Mortgage Fund generally utilize investment vehicles such as annuity contracts, common stocks, limited partnerships and trusts to comply with invest-ment guidelines against direct ownership of such investment assets.
The investments of the Liquidity, Mutual Equity, Core Fixed Income, Infl ation Linked Bond, Emerging Market Debt, High Yield Investment, Developed Market International Stock and the Emerging Market International Stock Funds were securities registered under the State Street Bank and Trust Co. nominee name Pondwave & Co. and held by a designated agency of the Pension Plans and Trust Funds of the State of Connecticut, or bearer and held by a designated agency of the Pension Plans and Trust Funds of the State of Connecticut.
Investments of cash collateral received under securities lending arrangements are registered in the master custodian’s name and are invested in a fund maintained by the master custodian exclusively for the Funds. In cir-cumstances where securities or letters of credit are received as collateral under securities lending arrangements, the collateral is held by the master custodian in a commingled pool in the master custodian’s name, as trustee. When “tri-party” collateral is received, the collateral consists of cash, letters of credit or securities but is held in a commingled pool by a third party master custodian in the Funds’ master custodian’s name. The breakdown of Se-curities Lending is as follows:
Investment Fair Value Government Securities $ 10,384,675 Government Agency Securities 3,068,569 U.S. Corporate Stock 3,467,328 International Equity 980,580 Collateral Securities held by Investment Pools under Securities Lending Arrangements: Other 676,715,661 Corporate Debt 2,115,950,505 Total $ 2,810,567,318
The following table provides information about the interest rate risks associated with the Funds investments. Interest rate risk is the risk that the value of fi xed income securities will decline because of rising interest rates. The prices of fi xed income securities with a longer time to maturity tend to be more sensitive to changes in interest rates and therefore, more volatile than those with shorter maturities. Investment Managers that manage the CRPTF portfolio are given full discretion to manage their portion of CRPTF assets within their respective guidelines and constraints. The guidelines and constraints require each manager to maintain a diversifi ed portfolio at all times. In addition, each core manager is required to maintain a target duration that is similar to its respective benchmark which is typically the Barclays Aggregate – an intermediate duration index.
The investments include certain short-term cash equivalents, various long term items, and restricted assets by maturity in years.
Investment Maturities (in Years) Investment Type Fair Value Less Than 1 1 - 5 6 - 10 More Than 10Cash Equivalents $1,640,653,567 $1,476,783,186 $ - $ - $ 163,870,381Asset Backed Securities 91,299,042 1,441,659 83,311,934 6,545,449 -Government Securities 2,823,711,217 284,301,075 968,336,430 712,400,267 858,673,445Government Agency Securities 834,378,865 1,872,841 44,189,769 57,216,313 731,099,942Mortgage Backed Securities 323,166,587 3,651,038 49,251,865 9,873,919 260,389,765Corporate Debt 1,603,717,186 92,533,128 599,208,355 624,132,111 287,843,592Convertible Debt 42,184,097 2,708,209 24,392,706 2,068,476 13,014,706Mutual Fund 273,962,446 - - - 273,962,446 $7,633,073,007 $1,863,291,136 $1,768,691,059 $1,412,236,535 $2,588,854,277

F-26 FISCAL YEAR 2010 ANNUAL REPORT
COMBINED INVESTMENT FUNDSNOTES TO FINANCIAL STATEMENTS (Continued)
Exposure to foreign currency risk results from investments in foreign currency-denominated equity or fi xed income securities. As a means of limiting its exposure, the CRPTF utilizes a strategic hedge ratio of 50% for the developed market portion of the International Stock Fund. This strategic hedge ratio represents the neutral stance or desired long-term exposure to currency for the ISF. To implement this policy, currency specialists actively manage the currency portfolio as an overlay strategy to the equity investment managers. These specialists may manage the portfolio pas-sively or actively depending on opportunities in the market place. While managers within the fi xed income portion of the portfolio are allowed to invest in non-U.S. dollar denominated securities, managers are required to limit that investment to a portion of their respective portfolios. The following table provides information on deposits and investments held in various foreign currencies, which are stated in U.S. dollars. Fixed Income Securities Equities Real Estate Government Mutual Corporate Convertible Mortgage Asset Common Preferred Investment Foreign Currency Total Cash Securities Funds Debt Securities Backed Backed Stock Stock Trust Argentine Peso $ 1,083,475 $ 76,799 $ 1,006,676 $ - $ - $ - $ - $ - $ - $ - $ -Australian Dollar 258,255,700 308,533 12,197,221 - 17,519,150 - - - 214,960,524 18,502 13,251,770Brazilian Real 179,427,518 3,165,987 50,776,861 - 7,233,544 294,688 - - 76,404,469 41,551,969 -Canadian Dollar 100,681,277 441,703 8,159,577 - - - - - 92,079,997 - -Chilean Peso 1,083,343 685 - - 581,805 - - - 344,522 156,331 -Colombian Peso 16,602,812 - 7,618,816 - 8,983,996 - - - - - -Czech Koruna 15,382,072 211,386 - - - - - - 15,170,686 - -Danish Krone 44,276,777 215,217 - - - - - - 44,061,560 - -Egyptian Pound 21,262,769 238,718 5,989,349 - - - - - 15,034,702 - -Euro Currecny 1,229,218,036 3,988,614 39,039,670 - 6,523,916 - 2,148,965 1,538,434 1,158,611,807 13,634,183 3,732,447Ghana Cedi 239,820 - 239,820 - - - - - - - -Hong Hong Dollar 423,373,365 600,195 - 92,876 - - - - 422,052,344 - 627,950Hungarian Fornit 39,427,421 366,365 8,176,890 - - - - - 30,884,166 - -Iceland Krona 1,862 1,862 - - - - - - - - -Indian Rupee 237,899 - - - 237,899 - - - - - -Indonesian Rupiah 92,501,452 124,687 13,065,967 - 13,082,704 - - - 66,228,094 - -Israleli Shekel 335,876 - - - - - - - 335,876 - -Japanese Yen 889,508,639 4,766,674 4,160,587 - - 361,659 - - 878,276,673 - 1,943,046Kazakhstan Tenge 2,063,073 - - - 2,063,073 - - - - -Malaysian Ringgit 76,138,073 14,984 22,445,128 - 3,679,468 - - - 49,998,493 - -Mexican Peso 96,932,397 1,838,814 41,405,768 - - - - - 53,687,815 - -Moroccan Dirham 430,079 30,364 - - - - - - 399,715 - -New Russian Rubel 3,622,453 70,116 - - 3,552,337 - - - - - -New Taiwan Dollar 64,029,377 473,811 - - - - - - 63,555,566 - -New Zealand Dollar 42,680,958 190,786 32,822,412 48,537 - - - - 9,609,060 - 10,163Nigerian Naria 3,933,903 - - - 3,933,903 - - - - - -Norwegian Krone 32,835,686 110,840 6,430,940 - - - - - 26,293,906 - -Pakistan Rupee 170,269 170,269 - - - - - - - - -Peruvian Nouveau Sol 1,296,066 468 1,295,598 - - - - - - - -Philippine Peso 21,159,849 11,013 - - - - - - 21,148,836 - -Polish Zloty 60,926,632 5,478 33,589,116 - - - - - 27,332,038 - -Pound Sterling 789,570,795 1,744,317 - - - - - - 784,189,355 - 3,637,123Singapore Dollar 79,384,416 512,770 - - - - - - 74,599,610 - 4,272,036South African Rand 115,932,736 982,516 26,424,619 - 96,075 - - - 88,429,526 - -South Korean Won 386,352,790 465,618 5,368,622 - - - - - 369,386,847 11,131,703 -Sri Lanka Rupee 201,651 - - - 201,651 - - - - - -Swedish Krona 93,853,800 1,647,093 - - - - - - 92,206,707 - -Swiss Franc 345,584,385 650,866 - - - - - - 344,933,519 - -Thailand Baht 96,870,986 - 9,468,445 - 995,689 - - - 86,406,852 - -Turkish Lira 111,661,969 308,307 17,446,109 - - - - - 93,907,553 - -Zambian Kwacha 361,670 - - - 361,670 - - - - - - $5,738,894,126 $23,735,855 $347,128,191 $141,413 $69,046,880 $656,347 $2,148,965 $1,538,434 $5,200,530,818 $66,492,688 $27,474,535
Securities Lending:Certain of the Funds engage in securities lending transactions to provide incremental returns to the Funds. The
Funds are permitted to enter into securities lending transactions pursuant to Section 3-13d of the Connecticut General Statutes and Amendment No.2 of the Custodial Contract. The Funds’ master custodian is authorized to lend available securities to authorized broker-dealers and banks subject to a form loan agreement.
During the period ended June 30, 2010, the master custodian lent certain securities of the Client and received cash or other collateral as indicated on the Securities Lending Authorization Agreement. The master custodian did not have the ability to pledge or sell collateral securities delivered therefore absent a borrower default. Borrowers were required to deliver collateral for each loan equal to at least 100% of the market value of the loaned securities.
Pursuant to the Securities Lending Authorization Agreement, the master custodian has an obligation to indemnify the Client in the event any borrower failed to return the loaned securities or pay distributions thereon. There were no such

OFFICE OF THE STATE TREASURER, DENISE L. NAPPIER F-27
failures by any borrowers to return loaned securities or pay distributions thereon during the fi scal year that resulted in a declaration or notice of Default of the Borrower. During the fi scal year, the Client and the borrowers maintained the right to terminate all securities lending transactions upon notice. The cash collateral received on each loan was invested in an individual account known as the State of Connecticut Collateral Investment Trust. On June 30, 2010, the Client had no credit risk exposure to borrowers. The market value of collateral held and the market value of securities on loan for the Funds as of June 30, 2010 was $2,830,292,919 and $ 2,750,910,865 respectively.
Under ordinary circumstances, the average effective duration of the security lending operations will be managed such that it will not exceed 120 days, or fall below 1 day. Under such ordinary circumstances, the net duration, as defi ned by the duration of assets less the duration of liabilities, will not exceed 45 days. In the event that the aver-age effective duration does exceed 120 days, or the net duration does exceed 45 days for any 3-day period, the Trustee shall, (i) notify the Funds within 5 business days and (ii) take appropriate action as is reasonable to return an average effective duration below 120 days or a net duration below 45 days. The average effective duration is calculated using the weighted average effective duration of holdings. The average effective duration of the security lending program at June 30, 2010 was 25.93 days.
The average effective duration is managed to be within 45 days due to the inability to monitor the weighted aver-age duration of liabilities. The weighted average duration of liabilities is assumed to remain at 1 day.
The fair value of collateral held and the fair value of securities on loan are as follows for the Funds as of June 30, 2010:
Fair Value of Fair Value of Fund Collateral Securities Lent
Mutual Equity $ 511,009,406 $ 495,375,649 Core Fixed Income 707,447,138 698,763,725 Infl ation Linked Bond 911,795,306 898,460,346 Emerging Market Debt 46,954,074 46,397,155 High Yield Investment 146,066,280 143,769,407 Developed Market International Stock 348,253,732 332,165,138 Emerging Market International Stock 141,169,029 135,979,445 Total $2,812,694,965 $2,750,910,865
Investments made using the cash collateral received from security loans were included in the Statement of Net Assets. The fair value of these amounts is as follows:
Cash Corporate TotalFund Equivalents Debt Investments Mutual Equity $122,891,920 $384,257,723 $507,149,643Core Fixed Income 167,999,496 525,299,826 693,299,322Infl ation Linked Bond 220,812,310 690,434,618 911,246,928Emerging Market Debt 11,371,014 35,554,821 46,925,835High Yield Investment 35,373,326 110,605,104 145,978,430Developed Market International Stock 84,080,252 262,901,631 346,981,883Emerging Market International Stock 34,187,343 106,896,782 141,084,125Total $676,715,661 $2,115,950,505 $2,792,666,166
These amounts are invested in a pool which is maintained solely on behalf of the Funds, but whose investments are held in the master custodian’s name. The above total amounts were included on the Statement of Net Assets in “Invested Securities Lending Collateral”.
NOTE 3: PURCHASES AND SALES OF INVESTMENT SECURITIESFor the period ended June 30, 2010, the aggregate cost of purchases and proceeds from sales of investment
securities were as follows:
Fund Purchases Sales Mutual Fixed Income $5,830,682,200 $6,821,284,249Core Fixed Income 6,943,432,138 7,303,232,349Infl ation Linked Bond 2,393,378,390 2,216,063,537Emerging Market Debt 1,576,055,994 1,706,265,347High Yield Investment 1,067,119,692 1,237,486,225Developed Market International Stock 4,574,996,572 5,035,185,143
COMBINED INVESTMENT FUNDS
NOTES TO FINANCIAL STATEMENTS (Continued)

F-28 FISCAL YEAR 2010 ANNUAL REPORT
COMBINED INVESTMENT FUNDSNOTES TO FINANCIAL STATEMENTS (Continued)
Emerging Market International Stock 4,078,915,212 3,500,397,136Real Estate 528,633,276 375,913,282Commercial Mortgage 4,138,291 5,403,408Private Investment Fund 921,935,605 880,203,812
The above amounts include the effect of cost adjustments processed during the year.
NOTE 4: UNREALIZED APPRECIATION AND DEPRECIATION ON INVESTMENTS AND FOREIGN EXCHANGE CONTRACTS
At June 30, 2010, the gross appreciation of investment securities and foreign currency in which there was an excess of fair value over cost, the gross depreciation of investment securities and foreign currency in which there was an excess of cost over fair value and the resulting net appreciation (depreciation) by fund were as follows:
Gross Gross Net AppreciationFund Appreciation Depreciation (Depreciation) Mutual Equity $755,093,305 $641,810,486 $113,282,819Core Fixed Income 141,174,375 34,511,735 106,662,640Infl ation Linked Bond 37,233,130 292,698 36,940,432Emerging Market Debt 153,909,581 80,585,039 73,324,542High Yield Investment 33,484,299 36,324,514 (2,840,215)Developed Market International Stock 359,962,263 583,791,146 (223,828,883)Emerging Market International Stock 298,499,867 94,081,585 204,418,282Real Estate 6,216,980 388,452,250 (382,235,270)Commercial Mortgage 48,551 17 48,534Private Investment Fund 322,436,469 168,920,379 153,516,090
NOTE 5: FOREIGN EXCHANGE CONTRACTSFrom time to time the Liquidity, Core Fixed Income, Emerging Market Debt, High Yield Investment, Developed
Market International Stock, Emerging Market International Funds utilize foreign currency contracts to facilitate trans-actions in foreign securities and to manage the Funds’ currency exposure. Contracts to buy are used to acquire exposure to foreign currencies, while contracts to sell are used to hedge the Funds’ investments against currency fl uctuations. Also, a contract to buy or sell can offset a previous contract. Losses may arise from changes in the value of the foreign currency or failure of the counterparties to perform under the contracts’ terms.
The U. S. dollar value of forward foreign currency contracts is determined using forward currency exchange rates supplied by a quotation service.
Investing in forward currency contracts may increase the volatility of the Funds’ performance. Price movements of currency contracts are infl uenced by, among other things, international trade, fi scal, monetary, and exchange control programs and policies; national and international political and economic events; and changes in worldwide interest rates. Governments from time to time intervene in the currency markets with the specifi c intent of infl uencing currency prices. Such intervention may cause certain currency prices to move rapidly. Additionally, the currency markets may be particularly sensitive to interest rate fl uctuations.
At June 30, 2010, the Funds had recorded unrealized gains (losses) from open forward currency contracts as follows:
Liquidity Fund:Foreign Currency Value Unrealized Gain/(Loss)
Contracts to Buy: Brazilian Real $ 362,000 $ 11,870 Chilean Peso 3,401,000 (52,229) Colombian Peso 1,772,000 57,391 Czech Koruna - 4,639 Egyptian Pound 26,423,381 (279,382) Euro Currency 18,573,390 (1,224,529) Ghana Cedi 7,694,740 11,785 Hungarian Forint - (391,979) Indian Rupee 10,231,951 108,967 Indonesian Rupiah 7,250,000 105,398 Israeli Shekel 8,484,824 (73,083) Japanese Yen 18,508,725 673,928 Kazakhstan Tenge 6,398,000 (8,729)

OFFICE OF THE STATE TREASURER, DENISE L. NAPPIER F-29
COMBINED INVESTMENT FUNDSNOTES TO FINANCIAL STATEMENTS (Continued)
Kenyan Shilling 6,917,192 (77,617) Malaysian Ringgit 14,702,557 (23,681) Mexican Peso 23,895,819 (435,435) New Romanian Leu - (809,440) New Russian Ruble 3,010,000 (4,749) New Taiwan Dollar 5,255,710 (77,817) New Zealand Dollar 654,279 (28,947) Norwegian Krone 228,872 (2,828) Philippine Peso 11,309,383 (105,270) Polish Zloty - (235,438) Pound Sterling 9,727,624 (137,692) Serbian Dinar - (86,301) Singapore Dollar 17,018,189 22,768 South Korean Won 17,242,573 (708,732) Swedish Krona 7,892,783 (488,569) Turkish Lira 10,209,000 (23,409) Uganda Shilling 5,704,764 (36,549) Yuan Renminbi 5,477,604 (53,500) Zambian Kwacha 7,012,648 (207,615) $ 255,359,008 $ (4,576,774) Contracts to Sell: Australian Dollar $ 31,958,500 $ 2,429,734 Canadian Dollar 8,615,170 461,267 Colombian Peso 1,783,487 (45,903) Egyptian Pound 13,191,474 14,359 Euro Currency 107,872,365 4,172,697 Ghana Cedi 1,111,265 (1,582) Hungarian Forint 7,895,965 650,316 Indonesian Rupiah 2,071,000 14,490 Israeli Shekel 1,512,157 473 Japanese Yen 12,494,634 (323,073) Kenyan Shilling 1,944,000 16,022 Mexican Peso 19,652,355 366,709 New Romanian Leu 819,118 39,645 New Taiwan Dollar 5,176,492 (1,401) New Zealand Dollar 33,918,255 487,024 Norwegian Krone 6,821,398 244,886 Philippine Peso 1,710,982 (1,624) Polish Zloty 13,502,427 1,814,469 Pound Sterling 2,964 (28) South Korean Won 6,112,898 111,013 Yuan Renminbi 53,269 (443) 278,220,175 10,449,050 Total $ 533,579,183 $ 5,872,276
Financial Statement Amounts: Receivable Payable Net FX Value $ 533,579,183 $ 533,579,183 $ - Unrealized Gain/Loss (4,576,774) 10,449,050 5,872,276 Net $ 529,002,409 $ 523,130,133 $ 5,872,276
Core Fixed Income Fund:Foreign Currency Value Unrealized Gain/(Loss)
Contracts to Sell: Euro Currency $ 8,971,425 $ 214,699 8,971,425 214,699Total $ 8,971,425 $ 214,699
Financial Statement Amounts: Receivable Payable Net FX Value $ 8,971,425 $ 8,971,425 $ - Unrealized Gain/Loss - 214,699 214,699 Net $ 8,971,425 $ 8,756,726 $ 214,699
Emerging Market Debt Fund:Foreign Currency Value Unrealized Gain/(Loss)
Contracts to Buy: Brazilian Real $ 7,906,080 $ 16,454 Chilean Peso 2,937,390 (119,269)

F-30 FISCAL YEAR 2010 ANNUAL REPORT
COMBINED INVESTMENT FUNDSNOTES TO FINANCIAL STATEMENTS (Continued)
Colombian Peso 1,892,802 86,668 Euro Currency 4,602,493 (2,716) Indian Rupee 13,581,783 127,262 Indonesian Rupiah 6,574,781 223,466 Israeli Shekel 4,577,783 (95,801) Malaysian Ringgit 7,583,947 66,550 Mexican Peso 9,605,455 (17,172) New Russian Ruble 4,724,296 (130,175) Peruvian Nouveau Sol 3,494,423 13,926 Philippine Peso 5,276,924 (84,645) Polish Zloty 4,652,859 (274,144) South African Rand 495,593 (3,468) South Korean Won 6,432,518 (72,259) Thailand Baht 2,098,259 (5,398) Turkish Lira 4,897,822 10,128 Yuan Renminbi 24,693,663 (93,462) $ 116,028,871 $ (354,055) Contracts to Sell: Brazilian Real $ 13,070,297 $ (665,539) Chilean Peso 1,319,584 22,360 Colombian Peso 5,026,641 (59,914) Euro Currency 19,620,490 675,896 Hungarian Forint 5,320,128 99,298 Indonesian Rupiah 3,192,034 3,002 Israeli Shekel 4,510,165 27,773 Japanese Yen 4,057,506 (41,875) Mexican Peso 892,268 (4,688) Polish Zloty 4,514,227 86,104 South African Rand 6,781,859 18,215 Thailand Baht 3,792,559 (27,489) Turkish Lira 4,914,355 45,701 Yuan Renminbi 8,136,649 48,820 85,148,762 227,664 Total $ 201,177,633 $ (126,391)
Financial Statement Amounts: Receivable Payable Net FX Value $ 201,177,633 $ 201,177,633 $ - Unrealized Gain/Loss (354,055) 227,664 (126,391) Net $ 200,823,578 $ 200,949,969 $ (126,391)
High Yield Investment Fund:Foreign Currency Value Unrealized Gain/(Loss)
Contracts to Sell: Mexican Peso $ 4,393,045 $ 12,966 4,393,045 12,966 Total $ 4,393,045 $ 12,966
Financial Statement Amounts: Receivable Payable Net FX Value $ 4,393,045 $ 4,393,045 $ - Unrealized Gain/Loss - 12,966 12,966 Net $ 4,393,045 $ 4,380,079 $ 12,966
Developed Market International Stock Fund:Foreign Currency Value Unrealized Gain/(Loss)
Contracts to Buy: Australian Dollar $ 210,719,469 $ (7,447,662) Brazilian Real 475,700 (1,504) Canadian Dollar 334,648 (2,567) Danish Krone 590,768 (3,070) Euro Currency 141,198,501 (3,402,985) Hong Kong Dollar 10,880,454 (16,670) Japanese Yen 177,730,813 3,094,171 New Zealand Dollar 80,120,318 (1,299,633) Norwegian Krone 68,590,609 (1,029,170) Pound Sterling 83,606,954 1,209,825 Singapore Dollar 72,288,268 (607,712) South Korean Won 11,146,379 (417,766)

OFFICE OF THE STATE TREASURER, DENISE L. NAPPIER F-31
COMBINED INVESTMENT FUNDSNOTES TO FINANCIAL STATEMENTS (Continued)
Swedish Krona 68,539,912 311,511 SwIss Franc 113,411,938 2,438,975 $ 1,039,634,731 $ (7,174,257) Contracts to Sell: Australian Dollar $ 258,106,876 $ 6,070,665 Czech Koruna 415,176 (5,071) Danish Krone 21,139,336 1,568,522 Euro Currency 931,986,093 80,271,268 Hong Kong Dollar 90,458,078 298,659 Hungarian Forint 100,872 (1,741) Japanese Yen 529,919,554 (29,169,268) Mexican Peso 498,137 (1,067) New Zealand Dollar 80,439,094 (399,696) Norwegian Krone 28,741,857 1,755,258 Polish Zloty 45,983 (577) Pound Sterling 560,067,843 5,214,329 Singapore Dollar 106,851,250 (72,581) South Korean Won 46,482,397 3,416,347 Swedish Krona 70,992,694 1,497,495 Swiss Franc 272,850,591 2,900,265 2,999,095,831 73,342,807 Total $ 4,038,730,562 $ 66,168,550 Financial Statement Amounts: Receivable Payable Net FX Value $ 4,038,730,562 $ 4,038,730,562 $ - Unrealized Gain/Loss (7,174,257) 73,342,807 66,168,550 Net $ 4,031,556,305 $ 3,965,387,755 $ 66,168,550
Emerging Market International Stock Fund:Foreign Currency Value Unrealized Gain/(Loss)
Contracts to Buy: Brazilian Real $ 85,774 $ (271) Hong Kong Dollar 342,508 (67) Hungarian Forint 1,098,067 6,646 Malaysian Ringgit 15,921 16 Philippine Peso 369,180 (10) South African Rand 15,343 7 Thailand Baht 2,500 1 $ 1,929,293 $ 6,322
Contracts to Sell: Brazilian Real $ 135,044 $ (45) Hungarian Forint 227,623 (3,972) Philippine Peso 10,414 (50) Thailand Baht 2,786 (6) Turkish Lira 159,201 (1,674) 535,068 (5,747) Total $ 2,464,361 $ 575
Financial Statement Amounts: Receivable Payable Net FX Value $ 2,464,361 $ 2,464,361 $ - Unrealized Gain/Loss 6,322 (5,747) 575 Net $ 2,470,683 $ 2,470,108 $ 575
The net unrealized gain has been included in the Statement of Operations as a component of Net Change in Unrealized Gain (Loss) on Investments.

F-32 FISCAL YEAR 2010 ANNUAL REPORT
NOTE 6: COMMITMENTSIn accordance with the terms of the individual investment agreements, the Private Investment Fund and the
Real Estate Fund have outstanding commitments to make additional investments. These commitments will be fulfi lled as suitable investment opportunities become available. Unfunded commitments at June 30, 2010, were as follows:
Cumulative Total Amounts Unfunded Fund Commitment Funded Commitment Real Estate $1,874,303,364 $1,443,464,395 $430,838,969Private Investment $5,929,664,766 $4,279,031,600 $1,650,633,166
NOTE 7: CONTINGENCYThere was no pending or threatened litigation against the Connecticut Retirement Plans and Trust Funds
(“CRPTF”) during the fi scal year ended June 30, 2010.
The CRPTF continues to with investment partners to recover assets lost due to the malfeasance of others. Related to an action against the former general partner of a limited partnership in the Private Investment Fund (“PIF”), members of the advisory committee of the limited partnership entered into a settlement agreement with the partnership’s former law fi rm, having allegedly participated in the actions that lead to losses. The CRPTF led an effort to seek additional compensation for failure to furnish adequate information during the settlement negotia-tions. The majority of the proceeds from the aggregate $6.8 million settlement were distributed. A related action has been initiated by the Philadelphia offi ce of the Securities and Exchange Commission. The SEC has assured the partnership that assets recovered in its action will be turned over to the partnership for distribution to the limited partners. A liquidating trustee was appointed in 2007 to dissolve the partnership and wind up its business activities. The remaining reserve was scheduled to be distributed, on a pro rata basis, in December 2008. The liquidating trustee is waiting for the conclusion of the related SEC action. The SEC has not furnished the liquidating trustee or the limited partners with information concerning its anticipated schedule for completion of its action.
COMBINED INVESTMENT FUNDSNOTES TO FINANCIAL STATEMENTS (Continued)
NOTE 9: COST BASIS OF INVESTMENTSThe aggregate cost values of investments in the Funds are as follows at June 30, 2010:
MUTUAL CORE INFLATION EMERGING LIQUIDITY EQUITY FIXED INCOME LINKED BOND MARKET DEBT FUND FUND FUND FUND FUND Investments in Securities, at CostCash Reserve Fund $ - $ 45,057,017 $ 126,934,505 $ 40,958,353 $ 50,203,094 Cash Equivalents 1,639,611,001 - - - 100,000 Asset Backed Securities 42,695,795 - 32,075,020 - - Government Securities 366,851,679 - 739,197,591 992,762,087 621,517,935 Government Agency Securities 23,073,630 - 765,869,889 - - Mortgage Backed Securities 10,151,513 - 310,221,804 - 204,120 Corporate Debt 136,715,714 - 708,113,323 - 173,352,313 Convertible Securities - - - - - Common Stock - 4,391,546,548 - - - Preferred Stock - - - - - Real Estate Investment Trust - 73,215,549 - - - Mutual Fund - 410,481,217 531,171 - 236,649,609 Limited Liability Corporation - - - - - Trusts - - - - - Limited Partnerships - 255,270,416 - - - Partnerships - - - - - Annuities - - - - - Total Investments in Securities, at cost $2,219,099,332 $5,175,570,747 $2,682,943,303 $1,033,720,440 $1,082,027,071

OFFICE OF THE STATE TREASURER, DENISE L. NAPPIER F-33
COMBINED INVESTMENT FUNDSNOTES TO FINANCIAL STATEMENTS (Continued)
DEVELOPED EMERGINGHIGH YIELD MARKET MARKET REAL COMMERCIAL PRIVATE
DEBT INTERNATIONAL INTERNATIONAL ESTATE MORTGAGE INVESTMENTFUND STOCK FUND STOCK FUND FUND FUND FUND
$ 24,448,850 $ 91,772,233 $ 27,905,931 $ 77,279,240 $ 160,863 $ 108,530,584- 815,707 - - - -
16,402,118 - - - - -4,012,362 - - - - -
- - - - - -8,606,191 - - - 193,054 -
551,485,899 1,530,122 - - - -36,718,841 459,966 - - - -14,765,695 4,361,130,307 1,615,186,015 - 3,415,664 5,311,781
2,276,783 19,857,323 39,825,882 - - -299,200 33,480,704 - - - -
- 43,233,458 177,919,847 - - -- - - - - 4,452,180- - - 8,193,224 - -- - - 1,089,246,027 - 1,741,290,563- - - - - -- - - - - -
$659,015,939 $4,552,279,820 $1,860,837,675 $1,174,718,491 $3,769,581 $1,859,585,108
Additionally, another limited partnership in the PIF invested $15 million in a portfolio company that reported double digit revenue growth. In 2005, the General Partner initiated a sales process expecting to realize signifi cant gain. Lack of cooperation from management challenged the sale process, resulting in legal action from the partnership and other investors in the portfolio company to force a sale. This process uncovered serious fi nancial irregularities in the portfolio company, resulting in the removal and criminal investigation of the CEO and other senior managers. The portfolio company is currently in bankruptcy. In July 2008, the Bankruptcy Court approved the portfolio company’s plan of liquidation. A liquidation trustee was appointed to oversee further liquidation efforts, including investigation and pursuit of potential litigation claims. The liquidation trustee has fi led law suits or arbitration proceedings against certain parties, including the bank that issued the credit facility, the investment bank, an equipment manufacturer, accounting fi rms, and a law fi rm, among others. In January 2009, the liquidation trustee entered into a settlement agreement with the General Partner, exchanging mutual releases for the GP, the fund and its investors. Additionally, the settlement agreement provides for a sharing of recovery from further prosecution of the matter, including any settlement reached with the insurance carrier. Recoveries are anticipated to be quite modest, if at all. In 2009, the bank has fi led a motion under seal which, if granted, may permit the bank to reduce any liability to the liquidation trustee by the proportionate amount that it can attribute to either the minority shareholders (including the fund) or their director designees. Though the fi ling is under seal and the ultimate resolution of this motion cannot be determined at this time, counsel to the GP believes the contribution claims against the GP, if any, should be precluded as to the result of the settlement agreement with the liquidation trustee. Finally, the United States Attorney in Pittsburgh has obtained indictments against fi ve (5) company insiders. The GP’s director designees have and will continue to provide testimony in the liquidation trustee’s various actions.
NOTE 8: SUBSEQUENT EVENTDuring the fi scal year ending June 30, 2010 the Treasurer named fi ve fund of hedge funds managers as preferred
vendors. Contracts for the fi ve managers where in negotiations subsequent to June 30, 2010.

F-34 FISCAL YEAR 2010 ANNUAL REPORT
COMBINED INVESTMENT FUNDSSUPPLEMENTAL SCHEDULE OF FINANCIAL HIGHLIGHTS
LIQUIDITY FUND MUTUAL EQUITY FISCAL YEAR ENDED JUNE 30, 2010 2009 2008 2007 2006 2010 2009 2008 2007 2006PER SHARE DATA Net Asset Value- Beginning of Period $1.00 $1.00 $- $- $- $648.30 $927.68 $1,085.16 $933.70 $858.25
INTRAFUND TRANSFER IN (OUT) - - - - - - - - - -
INCOME FROM INVESTMENT OPERATIONS Net Investment Income (Loss) 0.01 0.02 - - - 10.86 16.89 16.87 18.04 13.66 Net Gains or (Losses) on Securities (Both Realized and Unrealized) - - - - - 79.56 (279.76) (156.38) 151.06 74.43 Total from Investment Operations 0.01 0.02 - - - 90.42 (262.87) (139.51) 169.10 88.09 LESS DISTRIBUTIONSDividends from Net Investment Income (0.01) (0.02) - - - (11.74) (16.51) (17.97) (17.64) (12.64)Net Asset Value - End of Period $1.00 $1.00 $- $- $- $726.98 $648.30 $927.68 $1,085.16 $933.70 TOTAL RETURN 0.98% 1.54% 0.00% 0.00% 0.00% 14.01% -28.68% -12.99% 18.24% 10.27%
RATIOS Net Assets - End of Period ($000,000 Omitted) $2,219 $2,171 $- $- $- $5,289 $5,590 $7,999 $9,818 $8,982Ratio of Expenses to Average Net Assets (excl. sec. lending fees & rebates) 0.15% 0.04% 0.00% 0.00% 0.00% 0.24% 0.14% 0.26% 0.12% 0.32%Ratio of Expenses to Average Net Assets 0.15% 0.04% 0.00% 0.00% 0.00% 0.27% 0.30% 0.80% 0.75% 0.66%Ratio of Net Investment Income ( Loss) to Average Net Assets 0.70% 1.55% 0.00% 0.00% 0.00% 1.58% 2.14% 1.68% 1.83% 1.53%
MUTUAL FIXED INCOME CORE FIXED INCOME FISCAL YEAR ENDED JUNE 30, 2010 2009 2008 2007 2006 2010 2009 2008 2007 2006PER SHARE DATA Net Asset Value- Beginning of Period $- $- $114.53 $112.04 $116.37 $110.56 $113.86 $- $- $-
INTRAFUND TRANSFER IN (OUT) - - (116.90) - - - - - 115.45 - -
INCOME FROM INVESTMENT OPERATIONS Net Investment Income (Loss) - - 2.00 6.23 5.92 4.92 5.30 4.09 - - Net Gains or (Losses) on Securities (Both Realized and Unrealized) - - 2.08 1.53 (4.98) 7.88 (2.44) (1.44) - - Total from Investment Operations - - 4.08 7.76 0.94 12.80 2.86 2.65 - - LESS DISTRIBUTIONSDividends from Net Investment Income - - (1.71) (5.27) (5.27) (5.49) (6.16) (4.24) - - Net Asset Value - End of Period $- $- $- $114.53 $112.04 $117.87 $110.56 $113.86 $- $- TOTAL RETURN 0.00% 0.00% 0.00% 6.92% 0.77% 11.81% 2.84% 5.65% 0.00% 0.00%
RATIOS Net Assets - End of Period ($000,000 Omitted) $- $- $- $7,594 $6,419 $2,701 $3,160 $4,537 $- $- Ratio of Expenses to Average Net Assets (excl. sec. lending fees & rebates) - - - 0.13% 0.13% 0.15% 0.14% 0.20% - - Ratio of Expenses to Average Net Assets - - - 1.01% 0.90% 0.20% 031% 1.30% - - Ratio of Net Investment Income ( Loss) to Average Net Assets - - - 5.19% 5.19% 4.18% 4.62% 8.62% - -
INFLATION LINKED BOND EMERGING MARKET DEBT FISCAL YEAR ENDED JUNE 30, 2010 2009 2008 2007 2006 2010 2009 2008 2007 2006PER SHARE DATA Net Asset Value- Beginning of Period $128.08 $131.19 $- $- $- $108.68 $118.78 $- $- $-
INTRAFUND TRANSFER IN (OUT) - - $120.07 - - - - 121.80 - -
INCOME FROM INVESTMENT OPERATIONSNet Investment Income (Loss) 4.87 2.21 10.41 - - 9.02 10.90 4.34 - - Net Gains or (Losses) on Securities (Both Realized and Unrealized) 7.39 (2.11) 2.15 - - 15.68 (15.89) (5.90) - - Total from Investment Operations 12.26 0.10 12.56 - - 24.70 (4.99) (1.56) - - LESS DISTRIBUTIONSDividends from Net Investment Income (2.90) (3.21) (1.44) - - (4.88) (5.11) (1.46) - - Net Asset Value - End of Period $137.44 $128.08 $131.19 $- $- $128.50 $108.68 $118.78 $- $- TOTAL RETURN 9.48% -0.20% 16.81% 0.00% 0.00% 23.02% -3.62% 5.59% 0.00% 0.00%
RATIOS Net Assets - End of Period ($000,000 Omitted) $1,063 $837 $1,173 $- $- $1,176 $1,132 $1,047 $- $- Ratio of Expenses to Average Net Assets (excl. sec. lending fees & rebates) 0.13% 0.11% 0.07% - - 0.43% 0.32% 0.32% - - Ratio of Expenses to Average Net Assets 0.35% 0.76% 0.55% - - 0.43% 0.35% 0.40% - - Ratio of Net Investment Income ( Loss) to Average Net Assets 3.59% 1.79% 5.45% - - 7.55% 8.93% 5.16% - -
Source: Amounts were derived from custodial records.

OFFICE OF THE STATE TREASURER, DENISE L. NAPPIER F-35
COMBINED INVESTMENT FUNDSSUPPLEMENTAL SCHEDULE OF FINANCIAL HIGHLIGHTS (Continued)
HIGH YIELD DEBT INTERNATIONAL STOCKFISCAL YEAR ENDED JUNE 30, 2010 2009 2008 2007 2006 2010 2009 2008 2007 2006PER SHARE DATANet Asset Value- Beginning of Period $98.48 $112.63 $- $- $- $- $- $442.47 $347.57 $282.09
INTRAFUND TRANSFER IN (OUT) - - $119.44 - - - - (473.81) - -
INCOME FROM INVESTMENT OPERATIONSNet Investment Income (Loss) 9.33 9.72 5.41 - - - - 2.41 9.09 7.91 Net Gains or (Losses) on Securities (Both Realized and Unrealized) 14.19 (15.60) (7.68) - - - - 31.53 92.81 64.29 Total from Investment Operations 23.52 (5.88) (2.27) - - - - 33.94 101.90 72.20 LESS DISTRIBUTIONSDividends from Net Investment Income (8.31) (8.27) (4.54) - - - - (2.60) (7.00) (6.72) Net Asset Value - End of Period $113.69 $98.48 $112.63 $- $- $- $- $0.00 $442.47 $347.57TOTAL RETURN 24.54% -4.59% -1.88% 0.00% 0.00% 0.00% 0.00% 0.00% 29.65% 25.69%
RATIOS Net Assets - End of Period ($000,000 Omitted) $693 $733 $759 $- $- $- $- $- $6,021 $5,357 Ratio of Expenses to Average Net Assets (excl. sec. lending fees & rebates) 0.39% 0.32% 0.45% - - - - - 0.52% 0.53% Ratio of Expenses to Average Net Assets 0.43% 0.48% 1.03% - - - - - 1.19% 1.19%Ratio of Net Investment Income ( Loss) to Average Net Assets 8.92% 9.08% 9.37% - - - - - 2.42% 2.51%
DEVELOPED MARKET INTERNATIONAL EMERGING MARKET INTERNATIONAL STOCKFISCAL YEAR ENDED JUNE 30, 2010 2009 2008 2007 2006 2010 2009 2008 2007 2006PER SHARE DATA Net Asset Value- Beginning of Period $270.69 $384.58 $- $- $- $264.93 $389.39 $- $- $-
INTRAFUND TRANSFER IN (OUT) - - 478.96 - - - - 474.35 - -
INCOME FROM INVESTMENT OPERATIONSNet Investment Income (Loss) 6.97 8.45 9.49 - - 6.05 6.72 18.06 - - (Both Realized and Unrealized) 23.23 (114.67) (97.18) - - 61.21 (126.78) (100.62) - - Total from Investment Operations 30.20 (106.22) (87.69) - - 67.26 (120.06) (82.56) - - LESS DISTRIBUTIONSDividends from Net Investment Income (5.31) (7.67) (6.69) - - (4.44) (4.40) (2.40) - - Net Asset Value - End of Period $295.58 $270.69 $384.58 $- $- $327.75 $264.93 $389.39 $- $- TOTAL RETURN 11.03% -27.98% -14.60% 0.00% 0.00% 25.23% -30.90% 0.19% 0.00% 0.00%
RATIOS Net Assets - End of Period ($000,000 Omitted) $4,435 $4,416 $5,108 $- $- $2,073 $1,147 $1,304 $- $- Ratio of Expenses to Average Net Assets (excl. sec. lending fees & rebates) 0.54% 0.41% 0.54% - - 0.87% 0.59% 0.99% - - Ratio of Expenses to Average Net Assets 0.57% 0.49% 0.96% - - 0.89% 0.67% 1.38% - - Ratio of Net Investment Income ( Loss) to Average Net Assets 2.49% 2.51% 3.92% - - 2.15% 2.08% 9.28% - -
REAL ESTATE COMMERCIAL MORTGAGEFISCAL YEAR ENDED JUNE 30, 2010 2009 2008 2007 2006 2010 2009 2008 2007 2006PER SHARE DATANet Asset Value- Beginning of Period $38.76 $55.48 $55.10 $56.53 $62.31 $49.48 $55.58 $54.86 $59.31 $58.76
INTRAFUND TRANSFER IN (OUT) - - - - - - - - - -
INCOME FROM INVESTMENT OPERATIONSNet Investment Income (Loss) 0.88 0.86 3.41 0.81 0.86 3.76 3.71 4.25 4.18 5.41 Net Gains or (Losses) on Securities (Both Realized and Unrealized) (8.62) (16.51) 0.13 6.98 2.84 (0.51) (5.39) 1.26 (0.88) (0.10)Total from Investment Operations (7.74) (15.65) 3.54 7.79 3.70 3.25 (1.68) 5.51 3.30 5.31 LESS DISTRIBUTIONSDividends from Net Investment Income (0.62) (1.07) (3.16) (9.22) (9.48) (4.22) (4.42) (4.79) (7.75) (4.76)) Net Asset Value - End of Period $30.40 $38.76 $55.48 $55.10 $56.53 $48.51 $49.48 $55.58 $54.86 $59.31 TOTAL RETURN -20.18% -28.66% 6.04% 14.21% 7.09% 6.75% -3.14% 12.05% 8.17% 9.69%
IRATIOS Net Assets - End of Period ($000,000 Omitted) $784 $770 $1,002 $686 $399 $4 $5 $7 $8 $18 Ratio of Expenses to Average Net Assets (excl. sec. lending fees & rebates) 0.51% 0.52% 0.48% 0.25% 0.41% 1.21% 1.53% 1.16% 0.82% 1.03%Ratio of Expenses to Average Net Assets 0.51% 0.52% 0.48% na na 1.21% 1.53% 1.16% na naRatio of Net Investment Income ( Loss) to Average Net Assets 2.54% 1.80% 6.42% 1.45% 1.39% 7.77% 7.09% 7.77% 5.65% 9.23%
Source: Amounts were derived from custodial records.

F-36 FISCAL YEAR 2010 ANNUAL REPORT
COMBINED INVESTMENT FUNDSSUPPLEMENTAL SCHEDULE OF FINANCIAL HIGHLIGHTS (Continued)
PRIVATE INVESTMENT FISCAL YEAR ENDED JUNE 30, 2010 2009 2008 2007 2006PER SHARE DATANet Asset Value- Beginning of Period $44.43 $54.85 $56.43 $55.35 $57.45
INTRAFUND TRANSFER IN (OUT) - - - - -
INCOME FROM INVESTMENT OPERATIONSNet Investment Income (Loss) 2.97 1.83 8.15 8.47 8.69 Net Gains or (Losses) on Securities (Both Realized and Unrealized) 4.59 (9.99) (0.92) 1.29 (2.45)Total from Investment Operations 7.56 (8.16) 7.23 9.76 6.24 LESS DISTRIBUTIONSDividends from Net Investment Income (2.36) (2.26) (8.81) (8.68) (8.34)) Net Asset Value - End of Period $49.63 $44.43 $54.85 $56.43 $55.35 TOTAL RETURN 17.32% -16.36% 13.66% 19.56% 11.74%
IRATIOS Net Assets - End of Period ($000,000 Omitted) $2,014 $1,627 $1,795 $1,564 $1,360 Ratio of Expenses to Average Net Assets (excl. sec. lending fees & rebates) 0.55% 0.54% 0.66% 0.36% 0.43%Ratio of Expenses to Average Net Assets 0.55% 0.54% 0.66% na naRatio of Net Investment Income ( Loss) to Average Net Assets 6.37% 2.76% 14.65% 14.97% 15.32%
Source: Amounts were derived from custodial records.

OFFICE OF THE STATE TREASURER, DENISE L. NAPPIER F-37
SHORT-TERM INVESTMENT FUND
STATEMENT OF NET ASSETSJUNE 30, 2010
ASSETSInvestment in Securities, at Amortized Cost (Note 7) $ 4,579,765,770 Accrued Interest and Other Receivables 2,610,060 Prepaid Assets 249,359 Total Assets 4,582,625,189 LIABILITIES Distribution Payable 1,036,174 Interest Payable - Total Liabilities 1,036,174 NET ASSETS HELD IN TRUST FOR PARTICIPANTS $ 4,581,589,015
See accompanying Notes to the Financial Statements.
June 30, 2010

F-38 FISCAL YEAR 2010 ANNUAL REPORT
SHORT-TERM INVESTMENT FUND
STATEMENTS OF CHANGES IN NET ASSETSFOR THE FISCAL YEARS ENDED JUNE 30, 2010 AND JUNE 30, 2009
2010 2009ADDITIONSOperations Interest Income $ 21,244,054 $ 74,939,173 Net Investment Income 21,244,054 74,939,173Net Realized Gains 284,196 606,703Net Increase Resulting from Operations 21,528,250 75,545,876Share Transactions at Net Asset Value of $1.00 per Share Purchase of Units 14,549,690,761 15,586,406,101TOTAL ADDITIONS 14,571,219,011 15,661,951,977 DEDUCTIONS Distribution to Participants (Notes 2 & 6) Distributions to Participants* (15,572,194) (69,698,998) Total Distributions Paid and Payable (15,572,194) (69,698,998)Share Transactions at Net Asset Value of $1.00 per Share Redemption of Units (14,521,369,298) (16,096,987,314)Operations Operating Expenses (1,213,495) (1,262,329)TOTAL DEDUCTIONS (14,538,154,987) (16,167,948,641)* Net of designated reserve transfer contributions and expenses. CHANGE IN NET ASSETS 33,064,024 (505,996,664) Net Assets Held in Trust for Participants Beginning of Year 4,548,524,991 5,054,521,655 End of Year $ 4,581,589,015 $ 4,548,524,991
See accompanying Notes to the Financial Statements.
OFFICE OF THE STATE TREASURER, DENISE L. NAPPIER F-39
SHORT-TERM INVESTMENT FUND
NOTE 1: INTRODUCTION AND BASIS OF PRESENTATION The Short-Term Investment Fund (“STIF” or the “Fund”) is a money market investment pool managed by the
Treasurer of the State of Connecticut. Section 3-27 of the Connecticut General Statutes (CGS) created STIF. Pursuant to CGS 3-27a - 3-27f, the State, municipal entities, and political subdivisions of the State are eligible to invest in the Fund. Securities in which the State Treasurer is authorized to invest monies of STIF include United States government and agency obligations, certifi cates of deposit, commercial paper, corporate bonds, saving accounts, bankers’ acceptances, repurchase agreements, and asset-backed securities. STIF is authorized to issue an unlimited number of units.
For State of Connecticut fi nancial reporting purposes, STIF is considered to be a mixed investment pool – a pool having external and internal portions. The internal portion (i.e., the portion that belongs to investors that are part of the State’s fi nancial reporting entity) is not displayed in the State’s basic fi nancial statements. Instead, each fund type’s investment in STIF is reported as “cash equivalents” in the statement of net assets. The external portion (i.e., the portion that belongs to investors which are not part of the State’s fi nancial reporting entity) is recorded in an investment trust fund in the basic fi nancial statements.
The Fund is considered a “2a7-like” pool and, as such, reports its investments at amortized cost (which approximates fair value). A 2a7-like pool is not necessarily registered with the Securities and Exchange Commission (SEC) as an investment company, but nevertheless has a policy that it will, and does, operate in a manner consistent with the SEC’s Rule 2a7 of the Investment Company Act of 1940 that allows money market mutual funds to use amortized cost to report net assets.
Related Party Transactions. STIF had no related party transactions during the fi scal year with the State of Connecticut and its component
units including leasing arrangements, the performance of administrative services and the execution of securities transactions.
NOTE 2: SUMMARY OF SIGNIFICANT ACCOUNTING POLICIESFinancial Reporting Entity.
The Fund is a Fiduciary Investment Trust Fund. A fi duciary fund is used to account for governmental activities that are similar to those found in the private sector where the determination of net income is necessary or useful to sound fi nancial administration. The generally accepted accounting principles (“GAAP”) used for fi duciary funds are generally those applicable to similar businesses in the private sector. The Fund uses the accrual basis of accounting.
Security Valuation of Financial Instruments.The assets of the Fund are carried at amortized cost (which approximates fair value) except for Cheyne (Gryphon)
which is refl ected at amortized cost adjusted for reserve transfer (see Note 7and the List of Investments). All premiums and discounts on securities are amortized or accreted on a straight line basis.
Security Transactions. Purchases and sales of investments are recorded on a trade date basis. Gains and losses on investments are
realized at the time of the sales and are calculated on the basis of an identifi ed block or blocks of securities having an identifi ed amortized cost. Bond cost is determined by identifi ed lot.
Interest Income. Interest income, which includes amortization of premiums and accretion of discounts, is accrued as earned.
Expenses. Operating and interest expenses of STIF are accrued as incurred.
Fiscal Year. The fi scal year of STIF ends on June 30.
NOTES TO FINANCIAL STATEMENTS

F-40 FISCAL YEAR 2010 ANNUAL REPORT
SHORT-TERM INVESTMENT FUNDNOTES TO FINANCIAL STATEMENTS (Continued)
Distributions to Investors.Distributions to investors are earned on units outstanding from date of purchase to date of redemption. Income
is calculated daily based upon the actual earnings of the Fund net of administrative expenses and, if applicable, an allocation to the Designated Surplus Reserve. Distributions are paid monthly within two business days of the end of the month, and are based upon actual number of days in a year. Shares are sold and redeemed at a constant $1.00 net asset value per share, which is consistent with the per share net asset value of the Fund, excluding the Designated Surplus Reserve.
Designated Surplus Reserve. While STIF is managed prudently to protect against losses from credit and market changes, the Fund is not
insured or guaranteed by any government. Therefore, the maintenance of capital cannot be fully assured. In order to provide some protection to the shareholders of STIF from potential credit and market risks, the Treasurer has designated that a portion of each day’s net earnings be transferred to the Designated Surplus Reserve (Reserve). Such amounts are restricted in nature and are not available for current distribution to shareholders. The amount transferred daily to the Designated Surplus Reserve is equal to 0.1 percent of end of day investment balance divided by the actual number of days in the year until the reserve account is equal to or greater than 1.0 percent of the daily investment balance. If net losses signifi cant to the aggregate portfolio are realized, the Treasurer is authorized to transfer funds from the Reserve to Participants with Units Outstanding.
As of June 30, 2010, the balance in the Designated Surplus Reserve was $38,470,895 which refl ects $4.7 million in contributions during the year.
Estimates. The preparation of the fi nancial statements in conformity with GAAP requires management to make estimates
and assumptions that affect the reported amounts of assets and liabilities and disclosure of contingent assets and liabilities in the fi nancial statements as well as the reported amounts of revenues and expenses during the reporting period. Actual results could differ from those estimates.
NOTE 3: DEPOSIT AND INVESTMENT DISCLOSURESA formal investment policy (as adopted August 21, 1996, revised June 16, 2008 and April 17, 2009) specifi es
policies and guidelines that provide for the systematic management of STIF and prudent and productive investment of funds. STIF’s investment practice is to invest all cash balances; as such, there was no uninvested cash at June 30, 2010. All securities of STIF are registered under the State Street Bank nominee name, Pond, Tide & Co., for the State of Connecticut nominee name, Conn. STIF & Co., and held by a designated agent of the State.
Custodial Credit Risk – DepositsThe custodial credit risk for deposits is the risk that in the event of a bank failure, the STIF’s deposits may
not be recovered. The STIF follows policy parameters that limit deposits in any one entity to a maximum of ten percent of total assets at the time of purchase. Further, the certifi cates of deposits must be issued from com-mercial banks whose short-term debt is rated at least A-1 by Standard and Poor’s and F-1 by Fitch and whose long-term debt is rated at least A- and its issuer rating is at least “C”.
Certifi cates of Deposit in banks are insured up to $250,000 (through December 31,2013), any amount above this limit is considered uninsured. Additionally, state banking regulation requires all Connecticut public deposito-ries to segregate collateral against public deposits in an amount equal to ten percent of the outstanding deposit. As of fi scal year-end, certifi cates of deposit in the Short-Term Investment Fund totaled $1,855,000,000. Of that amount, $1,668,600,000 was exposed to custodial credit risk representing the portion that was uninsured and uncollateralized. Each of the CD’s had daily put options that would allow STIF to redeem the investments on a same-day basis.

OFFICE OF THE STATE TREASURER, DENISE L. NAPPIER F-41
NOTES TO FINANCIAL STATEMENTS (Continued)SHORT-TERM INVESTMENT FUND
Under the Federal Deposit Insurance Corporation (FDIC) rule for its Transaction Account Guarantee Program, the FDIC provides unlimited deposit insurance coverage for non-interest bearing transaction accounts, including Negotiable Order of Withdrawal (NOW) accounts that pay no more that 0.50 percent interest annually through June 30, 2010. As of fi scal year-end, the Short-Term Investment Fund had $50 million invested in FDIC-insured NOW accounts.
Interest Rate Risk – InvestmentsInterest rate risk is the risk that changes in the general level of interest rates will adversely affect the fair value
of an investment. The STIF’s policy for managing interest rate risk is to limit investments to a very short weighted average maturity, not to exceed 90-days, and to comply with Standard and Poor’s requirement that the weighted average maturity not exceed 60 days. The weighted-average maturity is calculated daily, and reported to Standard and Poor’s weekly to ensure compliance. As of June 30, 2010 the weighted average maturity of the STIF was 19 days. The breakdown of the STIF’s maturity profi le is outlined below.
Investment Maturity in Years Amortized Investments Cost Less than One One - Five
Deposit Instruments: Fixed $1,855,000,000 $1,855,000,000 $ -Floating Rate Notes Corporate Notes - Structured Investment Vehicles 35,323,023 35,323,023 -Federal Agency Securities Fixed 341,340,194 341,340,194 - Floaters 776,454,559 776,454,559 -US Government Guaranteed 187,521,256 177,422,360 10,098,896Government Money Market Funds 450,000,000 450,000,000 -Repurchase Agreements 459,126,000 459,126,000 -Money Market Funds (LMCS) 738 738 -Bank Commercial Paper 475,000,000 475,000,000 -Total $4,579,765,770 $4,569,666,874 10,098,896
Additionally, STIF is allowed by policy to invest in fl oating-rate debt securities. Further, investment in fl oating-rate securities with maturities greater than two years is limited to no more than 20 percent of the overall portfolio. For purposes of the weighted average maturity calculation and classifi cation in the chart above, variable-rate securities are calculated using their interest rate reset dates. Because these securities reset frequently to prevailing market rates, interest rate risk is substantially reduced. As of fi scal year-end, the STIF portfolio held $919 million in variable rate securities.
Credit Risk of Debt SecuritiesCredit risk is the risk that an issuer or other counterparty to an investment will not fulfi ll its obligations. The STIF
manages its credit risk by investing only in debt securities that fall within the highest short-term or long-term rating categories by nationally recognized rating organizations.
Percentage ofCredit Quality Rating Amortized Cost Amortized Cost AAAm $ 450,000,000 9.83% AA / A-1+ 2,339,126,738 51.08A / A-1 450,000,000 9.83N/R* 35,323,023 0.77Federal Agency and U.S. Govt / Govt Guaranteed Securities 1,305,316,009 28.50
Total $4,579,765,770 100.00%
* The security’s credit rating, while in compliance with investment guidelings at time of purchase, fell below guidelines as of June 30, 2010.

F-42 FISCAL YEAR 2010 ANNUAL REPORT
NOTES TO FINANCIAL STATEMENTS (Continued)SHORT-TERM INVESTMENT FUND
Concentration of Credit Risk The Short-Term Investment Fund limits the amount it may invest in any one issuer to an amount not to exceed
10 percent at the time of purchase other than overnight or two-business-day repurchase agreements and U.S. government and agency securities. As of June 30, 2010, the table below lists issuers with concentrations of greater than 5 percent. The three instances in which concentrations on June 30, 2010 exceeded 10 percent resulted from a decline in the overall portfolio size. At the time of purchase, the securities were at or below 10 percent.
Issuer Fair Value Percent of Total PortfolioJP Morgan Chase Bank $480,000,000 10.5US Bank 475,000,000 10.4Wells Fargo Bank 475,000,000 10.4Sovereign Bank 450,000,000 9.8TD Bank 450,000,000 9.8Freddie Mac 401,788,000 8.8RBS Citizens Bank 359,126,000 7.8Federal Farm Credit 337,546,375 7.4Federal Home Loan Bank 296,976,000 6.5Goldman Sachs 253,300,418 5.5
NOTE 4: CUSTODIANState Street Bank was appointed as custodian for STIF effective February 1, 1996. STIF pays a percentage
of the annual rate of $110,600 for the Short-Term Investment Unit. This percentage is calculated annually by determining the STIF fund size relative to that of the total Short-Term Investment Unit.
NOTE 5: ADMINISTRATIONSTIF is managed and administered by employees of the State of Connecticut Treasury. Salaries and fringe
benefi t costs as well as operating expenses are charged directly to the Fund.
NOTE 6: DISTRIBUTIONS TO INVESTORSThe components of the distributions to investors are as follows for the income earned during the twelve
months ended:
Distributions: 2010 2009July $1,804,102 $9,552,900August 1,766,231 10,885,593September 1,652,063 10,020,904October 1,435,864 8,382,261November 1,244,871 6,870,533December 1,348,631 5,624,806January 1,179,381 4,289,444February 936,966 3,477,010March 1,020,218 3,477,312April 1,022,252 2,679,262May 1,125,441 2,592,339June (Payable at June 30) 1,036,174 1,846,634Total Distribution Paid & Payable $15,572,194 $69,698,998

OFFICE OF THE STATE TREASURER, DENISE L. NAPPIER F-43
NOTES TO FINANCIAL STATEMENTS (Continued)SHORT-TERM INVESTMENT FUND
NOTE 7: INVESTMENTS IN SECURITIESThe following is a summary of investments in securities, at amortized cost and fair value as of June 30, 2010:
Investment Amortized Cost Fair Value Deposit Instruments $1,855,000,000 $1,855,000,000Corporate Notes and SIVs 35,323,023 36,928,000Federal Agency Securities 1,117,794,753 1,117,480,960Government Money Market Funds 450,000,000 450,000,000US Government Guaranteed/Insured 187,521,256 187,436,670Repurchase Agreements 459,126,000 459,126,000Bank Commercial Paper 475,000,000 475,000,000Money Market Funds (LMCS) 738 738TOTAL $4,579,765,770 $4,580,972,368
The Gryphon Funding pass-through note was received as a result of the Cheyne Finance restructuring in July 2008, and consists of the securities that were underlying the Cheyne notes. Since the restructuring, the Gryphon note has made monthly principal and interest payments. Due to uncertain market conditions, and because the Gryphon note represents a continuation of the Cheyne notes, we determined that continuation of the previous accounting treatment of applying all cash distributions to amortized cost maximizes recovery of value and, in our view, best protects the fund. During the fi scal year, cash payments totaled $9.1 million, consisting of $8.7 million in principal and $0.4 million in interest. The interest payments are not included in Investment Income or in Distributions to Participants, but recorded against the amortized cost of this investment until such time as the relative principal and interest amounts, and their ultimate effect on the Fund, are known. As discussed in the fi scal year 2008 report, on December 5, 2008, $24 million was transferred from the reserves to cover a reduction in value effective June 30, 2008. Amortized cost refl ects cash distributions of $40.7 million since April 2008 and the reserve transfer. The June 30, 2010, estimated fair value of $36.9 million was provided by the Gryphon custodian and, exceeds security’s amortized cost of $35.3 million by $1.6 million.
Repurchase agreements are agreements to purchase securities from an entity for a specifi ed amount of cash and to resell the securities to the entity at an agreed upon price and time. They are used to enhance returns with minimal risk on overnight cash deposits of the Fund. Such transactions are only entered into with primary government securities dealers who report directly to the Federal Reserve Bank of New York and commercial banks that meet certain quality standards. All repurchase agreements are collateralized at between 100 percent and 102 percent of the securities’ value. As of fi scal year end, STIF held $459 million in repurchase agreements.
In an effort to improve disclosures associated with derivative contracts, the Government Accounting Standards Board (GASB) issued GASB Statement No. 53, Accounting and Financial Reporting for Derivative Instruments, ef-fective for the fi scal years beginning after June 15, 2009. Statement No. 53 provides guidance on derivative disclo-sures, requires that all derivatives be reported on the Statement of Net Assets and defi nes a derivative instrument as a fi nancial instrument or other contract with all three of the following characteristics: a) it has (1) one or more underlyings (a specifi ed interest rate, security price, commodity price, foreign exchange rate, index of prices or rates or other variable) and (2) one or more notional amounts (a number of currency units, shares, bushels, pounds, or other units specifi ed in the contract) b) it requires no initial investment or smaller than would be required for other types of contracts c) its terms require or permit net settlement, it can readily be settled net by a means outside the contract, or it provides for delivery of an asset that puts the recipient in a position not substantially different from net settlement.
For the fi scal year ended June 30, 2010, the Short-Term Investment Fund held adjustable-rate corporate notes and U.S. government agency securities whose interest rates vary directly with short-term money market indices and are reset either daily, weekly, monthly or quarterly. Such securities allow the Fund to earn higher interest rates as market rates increase, thereby increasing fund yields and protecting against the erosion of market values from rising interest rates. These adjustable rate securities have similar exposures to credit and legal risks as fi xed-rate securities from the same issuers.

F-44 FISCAL YEAR 2010 ANNUAL REPORT
NOTES TO FINANCIAL STATEMENTS (Continued)SHORT-TERM INVESTMENT FUND
NOTE 8: CREDIT RATING OF THE FUNDThroughout the year ended June 30, 2010, STIF was rated AAAm, its highest rating, by Standard and Poor’s
Corporation (“S&P”). In October 2009, following a review of the portfolio and STIF’s investment policies, manage-ment and procedures, S&P reaffi rmed STIF’s AAAm rating and has continued to maintain this high rating throughout the current fi scal year. In order to maintain an AAAm rating, STIF adheres to the following guidelines:
Weekly portfolio and market value calculations;•
Maintenance of credit quality standards for portfolio securities with at least 50% of such securities rated A-1+ • or invested in overnight repurchase agreements with dealers or banks rated A-1;
Ensuring adequate portfolio diversifi cation standards with, at the time of purchase, no more than 5% of the • portfolio invested in an individual security and no more than 10% invested in an individual issuer, excluding one and two day repurchase agreements and U.S. government agency securities; and
A limit on the overall portfolio weighted average maturity (currently no more than 60 days). •
It is the Treasurer’s intention to take any and all such actions as are needed from time to time to maintain the AAAm rating.

OFFICE OF THE STATE TREASURER, DENISE L. NAPPIER F-45
LIST OF INVESTMENTS AT JUNE 30, 2010SHORT-TERM INVESTMENT FUND
Security Yield Amortized Fair QualityPar Value (Coupon, Maturity or Reset Date) % Cost Value Asset ID Rating
FEDERAL AGENCY SECURITIES (24.41% OF TOTAL INVESTMENTS) $ 25,000,000 FANNIE MAE - DISCOUNT NOTE, 9/22/10 0.10 $ 24,984,438 $ 24,994,225 313589G72 AAA 25,000,000 FANNIE MAE 6.63, 11/15/10 0.13 25,586,573 25,604,000 31359MGJ6 AAA 20,000,000 FANNIE MAE 1.75, 3/23/11 0.41 20,184,271 20,194,900 31398AVQ2 AAA 10,000,000 FANNIE MAE 5.13, 4/15/11 0.33 10,362,327 10,377,430 31359MM26 AAA 10,000,000 FFC 0.39, 12/1/10 0.22 9,999,581 10,000,290 31331G4T3 AAA 5,000,000 FFC-FLT 0.67, 1/24/11 0.43 5,014,224 5,012,535 31331GFV6 AAA 25,000,000 FFC-FLT 0.43, 4/25/11 0.29 25,000,000 25,025,675 31331GL56 AAA 25,000,000 FFC-FLT 0.18, 5/6/11 0.43 24,982,715 24,946,850 31331G2Z1 AAA 25,000,000 FFC-FLT 0.50, 7/27/11 0.46 25,000,000 25,010,125 31331GC80 AAA 25,000,000 FFC-FLT 0.44, 8/3/11 0.31 24,997,219 25,032,975 31331GF79 AAA 25,000,000 FFC-FLT 0.35, 8/17/11 0.47 24,998,573 24,966,350 31331GH93 AAA 25,000,000 FFC-FLT 0.30, 9/16/11 0.48 24,995,485 24,945,100 31331JHR7 AAA 50,000,000 FFC-FLT 0.33, 11/2/11 0.33 50,000,000 49,995,150 31331G2M0 AAA 23,000,000 FFC-FLT 0.23, 11/4/11 0.51 22,987,452 22,916,050 31331G2V0 AAA 25,000,000 FFC-FLT 0.23, 11/23/11 0.51 24,992,925 24,902,250 31331G4C0 AAA 25,000,000 FFC-FLT 0.26, 1/25/12 0.54 24,988,114 24,893,300 31331JCF8 AAA 25,000,000 FFC-FLT 0.35, 2/6/12 0.54 24,985,854 24,925,675 31331JND1 AAA 25,000,000 FFC-FLT 0.50, 5/2/12 0.56 24,981,466 24,974,050 31331JQL0 AAA 5,000,000 FHLB 1.00, 8/5/10 0.22 5,003,692 5,003,680 3133XTK47 AAA 25,000,000 FHLB 0.28, 11/10/10 0.22 24,993,038 25,005,375 3133XYGZ2 AAA 25,000,000 FHLB 4.75, 12/10/10 0.24 25,485,640 25,497,225 3133XDTA9 AAA 10,000,000 FHLB 0.40, 12/28/10 0.27 9,994,760 10,003,040 3133XVZC8 AAA 10,000,000 FHLB 0.57, 12/29/10 0.28 10,008,682 10,014,380 3133XV5G2 AAA 3,333,333 FHLB 0.50, 3/7/11 0.36 3,333,333 3,333,543 3133XWXX2 AAA 10,000,000 FHLB 3.25, 3/11/11 0.40 10,192,944 10,197,160 3133XPWW0 AAA 10,000,000 FHLB 0.50, 3/14/11 0.36 10,000,000 10,002,150 3133XX4G9 AAA 10,000,000 FHLB 0.50, 4/6/11 0.36 9,992,599 10,003,120 3133XXKZ9 AAA 10,000,000 FHLB 0.70, 4/18/11 0.42 10,013,297 10,022,100 3133XVDM0 AAA 10,000,000 FHLB 0.65, 5/25/11 0.35 10,000,000 10,002,630 3133XYCQ6 AAA 10,000,000 FHLB 0.70, 5/27/11 0.48 10,000,000 10,003,470 3133XYEQ4 AAA 10,000,000 FHLB 0.75, 6/7/11 0.48 10,000,000 10,004,030 3133XYHQ1 AAA 10,000,000 FHLB 0.75, 6/21/11 0.66 10,000,000 10,001,720 3133XYNY7 AAA 10,000,000 FHLB 0.80, 6/24/11 0.81 10,000,000 9,999,310 3133XYQP3 AAA 3,000,000 FHLB-FLT 0.25, 1/14/11 0.42 3,001,623 3,000,900 3133XSVP0 AAA 25,000,000 FHLB-FLT 0.25, 5/25/11 0.44 25,000,000 24,957,875 3133XVVN8 AAA 25,000,000 FHLB-FLT 0.25, 6/21/11 0.45 24,995,083 24,952,675 3133XWCS6 AAA 25,000,000 FHLB-FLT 0.30, 8/19/11 0.47 25,000,000 24,951,950 3133XX3D7 AAA 25,000,000 FHLB-FLT 0.27, 10/13/11 0.46 24,990,368 25,012,450 3133XY2Y0 AAA 25,000,000 FHLB-FLT 0.37, 11/28/11 0.36 25,000,000 25,007,650 3133XYM51 AAA 10,000,000 FREDDIE MAC - DISCOUNT NOTE, 7/29/10 0.03 9,998,444 9,999,770 313397ZY0 AAA 25,000,000 FREDDIE MAC - DISCOUNT NOTE, 10/12/10 0.15 24,980,688 24,989,275 313397K34 AAA 29,043,000 FREDDIE MAC 4.75, 1/18/11 0.34 29,746,159 29,741,978 3134A4VJ0 AAA 7,590,000 FREDDIE MAC 2.75, 4/11/11 0.42 7,723,569 7,727,318 3137EABK4 AAA 8,680,000 FREDDIE MAC 1.63, 4/26/11 0.42 8,756,160 8,765,663 3137EABZ1 AAA 1,400,000 FREDDIE MAC-FLT 0.39, 1/28/11 0.43 1,401,741 1,401,190 3128X8HJ4 AAA 25,000,000 FREDDIE MAC-FLT 0.61, 3/9/11 0.43 25,009,616 25,018,850 3128X8RC8 AAA 60,100,000 FREDDIE MAC-FLT 0.35, 4/1/11 0.43 60,198,512 60,170,858 3128X8UJ9 AAA 25,000,000 FREDDIE MAC-FLT 0.34, 4/7/11 0.43 24,996,164 25,027,775 3128X8VE9 AAA 29,091,000 FREDDIE MAC-FLT 0.25, 5/4/11 0.44 29,107,535 29,112,760 3128X8B92 AAA 25,000,000 FREDDIE MAC-FLT 0.28, 8/5/11 0.45 25,010,542 25,002,500 3128X8E24 AAA 25,000,000 FREDDIE MAC-FLT 0.32, 9/26/11 0.32 24,981,243 24,995,750 3128X93D0 AAA 25,000,000 FREDDIE MAC-FLT 0.35, 10/26/11 0.38 24,986,653 24,989,025 3134G1BL7 AAA 25,000,000 FREDDIE MAC-FLT 0.29, 11/7/11 0.36 24,989,652 24,983,850 3134G1DL5 AAA 25,000,000 FREDDIE MAC-FLT 0.15, 1/25/12 0.38 24,912,954 24,918,600 3128X9WA4 AAA 25,000,000 FREDDIE MAC-FLT 0.27, 2/2/12 0.35 24,975,924 24,966,400 3128X9XN5 AAA 5,000,000 FREDDIE MAC-FLT 0.31, 2/10/12 0.35 4,993,451 4,996,185 3128X9YV6 AAA 25,000,000 FREDDIE MAC-FLT 0.31, 2/16/12 0.35 24,979,470 24,979,850 3128X9ZJ2 AAA$ 1,115,237,333 $ 1,117,794,753 $ 1,117,480,960
DEPOSIT INSTRUMENTS (40.50% OF TOTAL INVESTMENTS)(1) $ 480,000,000 JP MORGAN CHASE 0.43, 12/31/10 0.43 $ 480,000,000 $ 480,000,000 43499K004 A-1+ 450,000,000 SOVEREIGN BANK 0.63, 1/14/11 0.63 450,000,000 450,000,000 846995009 A-1 100,000,000 TD BANK 0.60, 6/14/11 0.60 100,000,000 100,000,000 87899F958 A-1+

F-46 FISCAL YEAR 2010 ANNUAL REPORT
LIST OF INVESTMENTS AT JUNE 30, 2010 (Continued)
SHORT-TERM INVESTMENT FUND
Security Yield Amortized Fair Quality Par Value (Coupon, Maturity or Reset Date) % Cost Value Asset ID Rating
225,000,000 TD BANK 0.60, 6/24/11 0.60 225,000,000 225,000,000 87899F958 A-1+ 40,000,000 TD BANK 0.52, 6/24/11 0.52 40,000,000 40,000,000 87899F958 A-1+ 50,000,000 TD BANK 0.55, 6/28/11 0.55 50,000,000 50,000,000 87899F958 A-1+ 35,000,000 TD BANK 0.52, 6/30/11 0.52 35,000,000 35,000,000 87899F958 A-1+ 475,000,000 WELLS FARGO BANK 0.25, 10/1/10 0.25 475,000,000 475,000,000 92799C006 A-1+$ 1,855,000,000 $ 1,855,000,000 $ 1,855,000,000 STRUCTURED INVESTMENT VEHICLES (0.77% OF TOTAL INVESTMENTS) $ 84,099,830 GRYPHON 0.00, 0.00 $ 35,323,023 $ 36,928,000 40099A9R8 N/R (2) (4) $ 84,099,830 $ 35,323,023 $ 36,928,000 BANK COMMERCIAL PAPER (10.37% OF TOTAL INVESTMENTS) $ 475,000,000 US BANK 0.25, 10/15/10 0.25 $ 475,000,000 $ 475,000,000 90299S000 A-1+$ 475,000,000 $ 475,000,000 $ 475,000,000 MONEY MARKET FUNDS (9.83% OF TOTAL INVESTMENTS) $ 225,000,000 FFI GOVERNMENT FUND 0.02, 12/31/10 0.02 $ 225,000,000 $ 225,000,000 929EAQ000 AAAm 225,000,000 GOLDMAN SACHS GOV’T FUND 0.03, 12/31/10 0.03 225,000,000 225,000,000 03799N9J9 AAAm 738 LMCS 0.01, 07/01/10 0.01 738 738 536991003 A-1$ 450,000,738 $ 450,000,738 $ 450,000,738 REPURCHASE AGREEMENTS (10.03% OF TOTAL INVESTMENTS) $ 100,000,000 BANK OF AMERICA 0.01, 7/1/10 0.01 $ 100,000,000 $ 100,000,000 07399S003 A-1 359,126,000 RBS CITIZENS BANK 0.05, 7/1/10 0.05 359,126,000 359,126,000 75299Y008 A-1 $ 459,126,000 $ 459,126,000 $ 459,126,000 U. S. GOVERNMENT (FDIC) GUARANTEED OR INSURED BANK SECURITIES (4.09% OF TOTAL INVESTMENTS) $ 10,000,000 CITIGROUP FDIC 1.38, 5/5/11 0.45 $ 10,062,441 $ 10,076,530 17313YAB7 AAA 25,000,000 CITIGROUP FDIC 0.49, 6/3/11 0.40 25,000,000 25,010,000 17313YAD3 AAA 10,000,000 CITIGROUP FDIC 1.25, 6/3/11 0.47 10,057,930 10,070,850 17313YAC5 AAA 10,000,000 CITIGROUP FDIC 1.5, 7/12/11 0.60 10,098,896 10,091,530 17314JAK9 AAA 50,000,000 CITIGROUP FDIC 0.41, 11/15/11 0.66 50,000,000 49,878,350 17314JAM5 AAA 30,000,000 FARMINGTON SAVINGS BANK (NOW) 0.25, 12/29/10 0.25 30,000,000 30,000,000 310992003 AAA (3)
4,000,000 GE CAPITAL FDIC 0.62, 3/11/11 0.22 4,003,749 4,008,992 36967HAM9 AAA 3,000,000 GOLDMAN SACHS FDIC 0.62, 11/9/11 0.42 3,011,531 3,014,268 38146FAG6 AAA 25,000,000 GOLDMAN SACHS FDIC 1.15, 12/5/11 0.33 25,286,709 25,286,150 38146FAB7 AAA 20,000,000 HUDSON VALLEY BANK (NOW) 0.25, 12/29/10 0.25 20,000,000 20,000,000 44499J005 AAA (3)
$ 187,000,000 $ 187,521,256 $ 187,436,670
$ 4,625,463,902 TOTAL INVESTMENT IN SECURITIES $ 4,579,765,770 $ 4,580,972,368
(1) Deposit instruments have daily put option.
(2) The Gryphon note was received as a result of the Cheyne Finance restructuring in July 2008. Cash distributions through June 2010 have totaled $40.7 million. $24 million of the reserves were transferred to cover a reduction in value effective June 30, 2008. As discussed in the fi scal year 2008 annual report, the realization of the value reduction and the transfer of reserves occurred on December 5, 2008. The stated market value is based on estimated market values of the portfolio of securities provided by the Gryphon custodian.
(3) Negotiable Order of Withdrawal (NOW) deposits are fully insured by FDIC under the Transaction Account Guarantee Program and have a daily put option.
(4) The security’s credit rating, while in compliance with investment guidelines at time of purchase, fell below guidelines as of June 30, 2010.

OFFICE OF THE STATE TREASURER, DENISE L. NAPPIER F-47
SCHEDULE OF ANNUAL RATES OF RETURNSHORT-TERM INVESTMENT FUND
Year Ended June 30,
2010 2009 2008 2007 2006 2005 2004 2003 2002 2001
STIF Total Rate of Return (%) 0.34 1.49 4.13 5.54 4.38 2.32 1.16 1.64 2.61 6.11
iMoneyNet Money Fund AverageTM Rated First Tier Institutional Average (MFR) Index (%)(1) 0.09 1.30 4.07 5.14 4.01 1.91 0.75 1.20 2.22 5.74
Total Assets in STIF, End of Period ($ - Millions) 4,582 4,548 5,054 5,004 5,430 4,314 3,829 3,280 3,546 4,565
Percent of State Assets in Fund 84 81 83 80 84 84 81 69 67 71
Number of Participant Accounts in Composite, End of Year(2) State Treasury 51 47 39 47 58 84 124 115 112 55 Municipal and Local Entities 656 608 637 578 542 548 556 551 544 496 State Agencies and Authorities 416 367 418 406 406 446 474 440 428 346 Total 1,123 1,022 1,094 1,031 1,066 1,078 1,154 1,106 1,084 897
(1) Represents iMoneyNet Money Fund AverageTM - Rated First Tier Institutional Average (MFR) Index. These Index rates have been taken from published sources.
(2) As of 2006 and going forward, inactive accounts were closed and only active accounts were included in the total number of participant accounts.
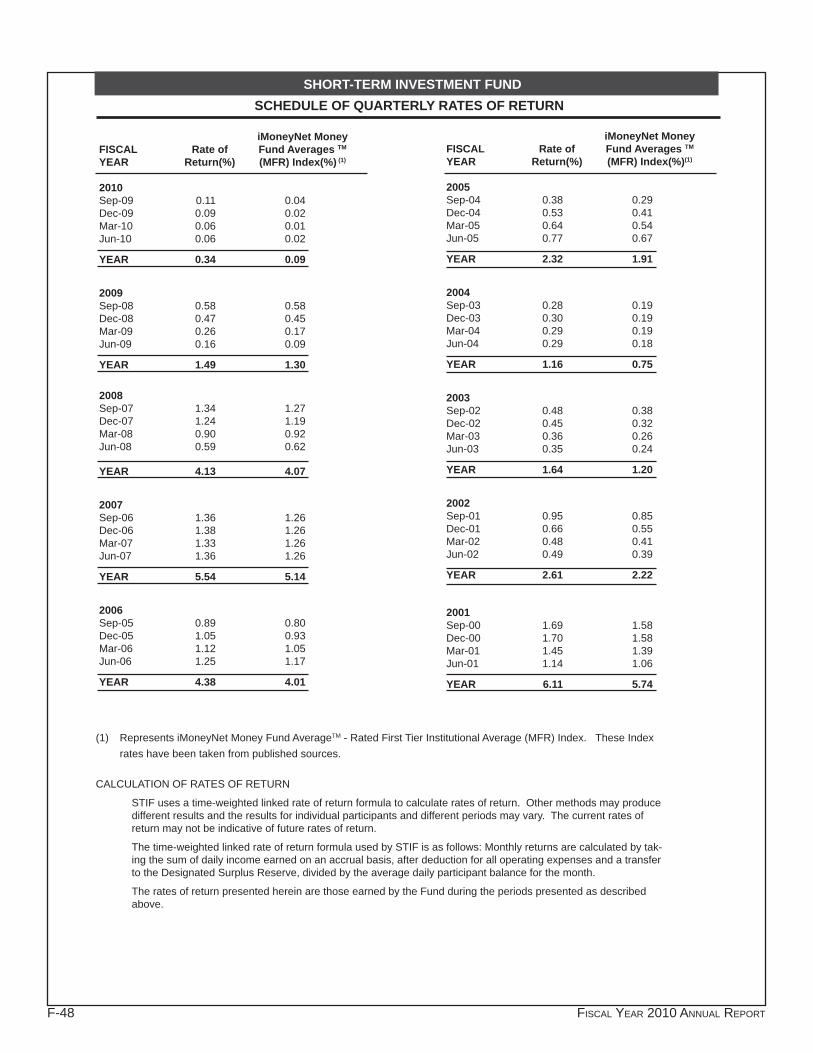
F-48 FISCAL YEAR 2010 ANNUAL REPORT
SCHEDULE OF QUARTERLY RATES OF RETURNSHORT-TERM INVESTMENT FUND
iMoneyNet MoneyFISCAL Rate of Fund Averages TM
YEAR Return(%) (MFR) Index(%) (1)
2010Sep-09 0.11 0.04Dec-09 0.09 0.02Mar-10 0.06 0.01Jun-10 0.06 0.02
YEAR 0.34 0.09
2009Sep-08 0.58 0.58Dec-08 0.47 0.45Mar-09 0.26 0.17Jun-09 0.16 0.09
YEAR 1.49 1.30
2008Sep-07 1.34 1.27Dec-07 1.24 1.19Mar-08 0.90 0.92Jun-08 0.59 0.62
YEAR 4.13 4.07
2007Sep-06 1.36 1.26Dec-06 1.38 1.26Mar-07 1.33 1.26Jun-07 1.36 1.26
YEAR 5.54 5.14
2006Sep-05 0.89 0.80Dec-05 1.05 0.93Mar-06 1.12 1.05Jun-06 1.25 1.17
YEAR 4.38 4.01
iMoneyNet MoneyFISCAL Rate of Fund Averages TM
YEAR Return(%) (MFR) Index(%)(1)
2005Sep-04 0.38 0.29Dec-04 0.53 0.41Mar-05 0.64 0.54Jun-05 0.77 0.67
YEAR 2.32 1.91
2004Sep-03 0.28 0.19Dec-03 0.30 0.19Mar-04 0.29 0.19Jun-04 0.29 0.18
YEAR 1.16 0.75
2003Sep-02 0.48 0.38Dec-02 0.45 0.32Mar-03 0.36 0.26Jun-03 0.35 0.24
YEAR 1.64 1.20
2002Sep-01 0.95 0.85Dec-01 0.66 0.55Mar-02 0.48 0.41Jun-02 0.49 0.39
YEAR 2.61 2.22
2001Sep-00 1.69 1.58Dec-00 1.70 1.58Mar-01 1.45 1.39Jun-01 1.14 1.06
YEAR 6.11 5.74
(1) Represents iMoneyNet Money Fund AverageTM - Rated First Tier Institutional Average (MFR) Index. These Index rates have been taken from published sources.
CALCULATION OF RATES OF RETURN
STIF uses a time-weighted linked rate of return formula to calculate rates of return. Other methods may produce different results and the results for individual participants and different periods may vary. The current rates of return may not be indicative of future rates of return.
The time-weighted linked rate of return formula used by STIF is as follows: Monthly returns are calculated by tak-ing the sum of daily income earned on an accrual basis, after deduction for all operating expenses and a transfer to the Designated Surplus Reserve, divided by the average daily participant balance for the month.
The rates of return presented herein are those earned by the Fund during the periods presented as described above.
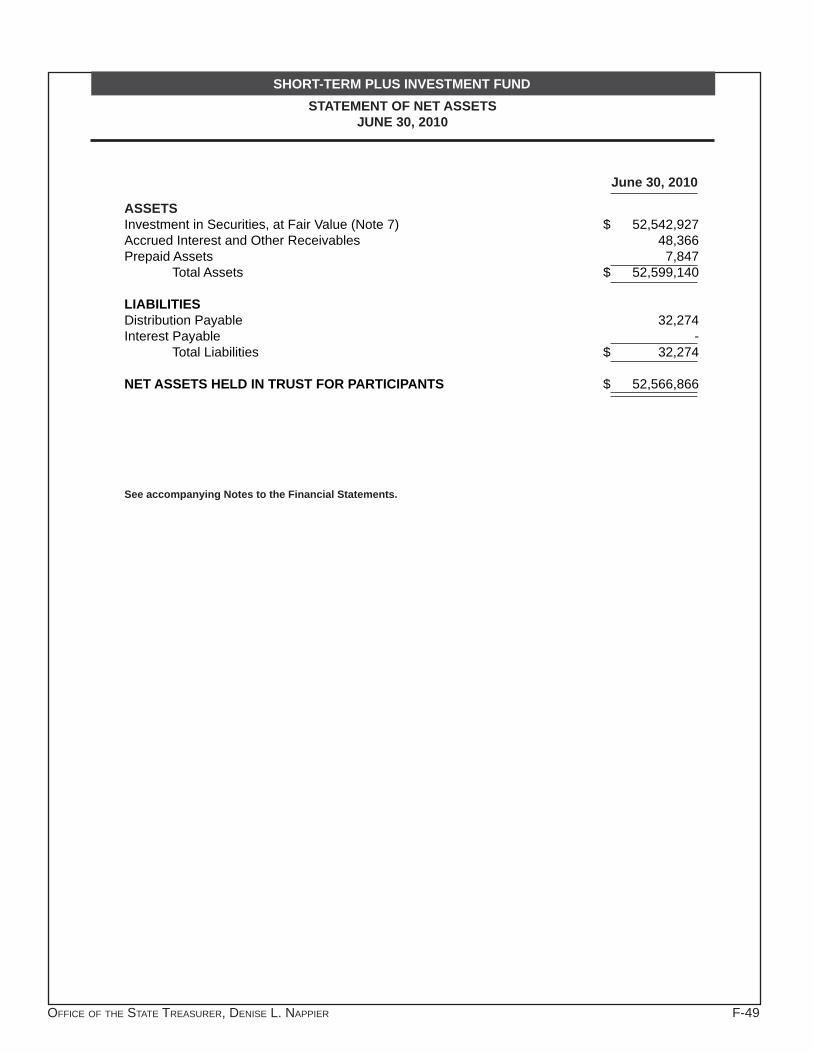
OFFICE OF THE STATE TREASURER, DENISE L. NAPPIER F-49
SHORT-TERM PLUS INVESTMENT FUND
ASSETSInvestment in Securities, at Fair Value (Note 7) $ 52,542,927 Accrued Interest and Other Receivables 48,366 Prepaid Assets 7,847 Total Assets $ 52,599,140 LIABILITIES Distribution Payable 32,274 Interest Payable - Total Liabilities $ 32,274 NET ASSETS HELD IN TRUST FOR PARTICIPANTS $ 52,566,866
See accompanying Notes to the Financial Statements.
STATEMENT OF NET ASSETSJUNE 30, 2010
June 30, 2010

F-50 FISCAL YEAR 2010 ANNUAL REPORT
SHORT-TERM PLUS INVESTMENT FUND
STATEMENTS OF CHANGES IN NET ASSETSFOR THE FISCAL YEARS ENDED JUNE 30, 2010 AND JUNE 30, 2009
2010 2009ADDITIONSOperations Interest Income $ 618,864 $ 6,914,932Net Investment Income 618,864 6,914,932Net Realized Gains (Losses) 40,014 (5,426)Net Increase Resulting from Operations 658,878 6,909,506
Share Transactions at Net Asset Value Purchase of Units 755,456 7,466,913TOTAL ADDITIONS 1,414,334 14,376,419
DEDUCTIONSDistribution to Participants (Notes 2 & 6) Distributions to Participants (636,452) (6,833,302))Total Distributions Paid and Payable (636,452) (6,833,302)
Share Transactions at Net Asset Value Redemption of Units (41,324,707) (226,300,000)
Operations Operating Expenses (22,426) (76,204)Net Change in Unrealized Gain/(Loss) on Investments 4,249,333 (2,594,163)TOTAL DEDUCTIONS (37,734,252) (235,803,669)
CHANGE IN NET ASSETS (36,319,918) (221,427,250)
Net Assets held in Trust for Participants Beginning of Year 88,886,784 310,314,034 End of Year $ 52,566,866 $ 88,886,784
See accompanying Notes to the Financial Statements.

OFFICE OF THE STATE TREASURER, DENISE L. NAPPIER F-51
SHORT-TERM PLUS INVESTMENT FUNDNOTES TO FINANCIAL STATEMENTS
NOTE 1: INTRODUCTION AND BASIS OF PRESENTATION The Medium-Term Investment Fund (“STIF Plus” or the “Fund”) is a money market and short-term bond in-
vestment pool managed by the Treasurer of the State of Connecticut. Section 3-28a of the Connecticut General Statutes (CGS) created STIF Plus. Pursuant to CGS 3-28a, the State, municipal entities, and political subdivisions of the State are eligible to invest in the Fund. The State Treasurer is authorized to invest monies of STIF Plus in United States government and agency obligations, certifi cates of deposit, commercial paper, corporate bonds, saving accounts, bankers’ acceptances, repurchase agreements, asset-backed securities and investment fund comprised of authorized securities. STIF Plus is authorized to issue an unlimited number of units.
For State of Connecticut fi nancial reporting purposes, STIF Plus is considered to be a mixed investment pool – a pool having external and internal portions. The internal portion (i.e., the portion that belongs to investors that are part of the State’s fi nancial reporting entity) is not displayed in the State’s basic fi nancial statements. Instead, each fund type’s investment in STIF Plus is reported as “cash equivalents” in the statement of net assets. The external portion (i.e., the portion that belongs to investors which are not part of the State’s fi nancial reporting entity) is recorded in an investment trust fund in the basic fi nancial statements.
Related Party Transactions. STIF Plus had no related party transactions during the fi scal year with the State of Connecticut and its com-
ponent units including leasing arrangements, the performance of administrative services and the execution of securities transactions.
NOTE 2: SUMMARY OF SIGNIFICANT ACCOUNTING POLICIESFinancial Reporting Entity.
The Fund is a Fiduciary Investment Trust Fund. A fi duciary fund is used to account for governmental activities that are similar to those found in the private sector where the determination of net income is necessary or use-ful to sound fi nancial administration. The generally accepted accounting principles (“GAAP”) used for fi duciary funds are generally those applicable to similar businesses in the private sector. The Fund uses the accrual basis of accounting.
Security Valuation of Financial Instruments.The assets of the STIF Plus are carried at fair value which is the current market value. All premiums and
discounts on securities are amortized or accreted on a straight line basis.
Security Transactions. Purchases and sales of investments are recorded on a trade date basis. Gains and losses on investments
are realized at the time of the sales and are calculated on the basis of an identifi ed block or blocks of securities having an identifi ed amortized cost. Bond cost is determined by identifi ed lot.
Interest Income. Interest income, which includes amortization of premiums and accretion of discounts, is accrued as earned.
Expenses. Operating and interest expenses of STIF Plus are accrued as incurred.
Fiscal Year. The fi scal year of STIF Plus ends on June 30.
Distributions to Investors.Distributions to investors are earned on units outstanding from date of purchase to date of redemption. Income
is calculated daily based upon the actual earnings of STIF Plus net of administrative expenses. Distributions are paid monthly within two business days of the end of the month, and are based upon actual number of days in a year. Shares are sold and redeemed at the current market value per share, which is consistent with the per share net asset value of the Fund.

F-52 FISCAL YEAR 2010 ANNUAL REPORT
SHORT-TERM PLUS INVESTMENT FUNDNOTES TO FINANCIAL STATEMENTS (Continued)
Estimates. The preparation of the fi nancial statements in conformity with (GAAP) requires management to make estimates
and assumptions that affect the reported amounts of assets and liabilities and disclosure of contingent assets and liabilities in the fi nancial statements as well as the reported amounts of revenues and expenses during the reporting period. Actual results could differ from those estimates.
NOTE 3: DEPOSIT AND INVESTMENT DISCLOSURESSTIF Plus’s investment practice is to invest all cash balances; as such, there was no uninvested cash at June
30, 2010. All securities of STIF Plus are registered under the State Street Bank nominee name, Pond, Tide & Co., for the State of Connecticut nominee name, Conn. STIF & Co., and held by a designated agent of the State.
Custodial Credit Risk – DepositsThe custodial credit risk for deposits is the risk that in the event of a bank failure, the STIF Plus’s deposits may
not be recovered. The STIF Plus follows policy parameters that limit deposits in any one entity to a maximum of fi ve percent of total assets at the time of purchase. Further, the certifi cates of deposits must be issued from commercial banks whose short-term debt is rated at least A-1 by Standard and Poor’s and F-1 by Fitch and whose long-term debt is rated at least AA- or which carry an unconditional letter of guarantee from such a bank that meets the short-term debt rating requirements.
Certifi cates of Deposit in banks are insured up to $250,000 (through December 31, 2013), any amount above this limit is considered uninsured. Additionally, state banking regulation requires all Connecticut public depositories to segregate collateral against public deposits in an amount equal to ten percent of the outstanding deposit. As of fi scal year-end, STIF Plus Investment Fund did not hold any certifi cates of deposit investments.
Interest Rate Risk – InvestmentsInterest rate risk that changes in the general level of interest rates will adversely affect the market value of an
investment. STIF Plus’s policy for managing interest rate risk is to perform, on a quarterly basis, an interest rate sensitivity analysis on the duration and the market value of the portfolio to determine the potential effect of a 200 basis point movement in interest rates. As of June 30, 2010 the weighted average maturity of the STIF Plus was 105 days. The breakdown of the STIF Plus’s maturity profi le is outlined below.
Investment Maturity in Years Investments Fair Value Less than One One - Five
Corporate Notes $44,477,776 $44,477,776 $ -Asset-Backed Securities Fixed 2,490,323 - 2,490,323 Floaters 5,574,256 5,574,256 -Money Market Funds 572 572 -Total $52,542,927 $50,052,604 $2,490,323
Additionally, STIF Plus is allowed by policy to invest in fl oating-rate debt securities. For purposes of the weighted average maturity calculation and classifi cation in the chart above, variable-rate securities are calculated using their interest rate reset dates. Because these securities re-set frequently to prevailing market rates, interest rate risk is substantially reduced. As of fi scal year-end, the STIF Plus portfolio held $50 million in variable rate securities.
Credit Risk of Debt SecuritiesCredit risk is the risk that an issuer or other counterparty to an investment will not fulfi ll its obligations. The STIF
Plus manages its credit risk by investment only in debt securities that fall within the highest short-term or long-term rating categories by nationally recognized rating organizations.

OFFICE OF THE STATE TREASURER, DENISE L. NAPPIER F-53
Investment Type Fair Value A-1+ AAA AA+ AA- A B- CCorporate Notes 44,477,776 - - 10,000,120 7,992,504 26,485,152 - -Asset Backed Securities Fixed 2,490,323 - 2,490,323 - - - - - Floaters 5,574,256 - 2,776,537 - - - 1,584,951 1,212,768Money Market Funds 572 572 - - - Total $52,542,927 $572 $5,266,860 $10,000,120 $7,992,504 $26,485,152 $1,584,951 1,212,768
Concentration of Credit Risk STIF Plus limits the amount it may invest in any single corporate entity to an amount not to exceed 5 percent or
in any single federal agency to an amount not to exceed 15 percent at the time of purchase. As of June 30, 2010, the table below lists issuers with concentrations of greater than 5 percent of the total portfolio.
Issuer Fair Value Percent of Total PortfolioGE Capital Corp $10,000,120 19.0Goldman Sachs 9,830,620 18.7Merrill Lynch 9,712,100 18.5Wells Fargo 7,992,504 15.2Citigroup 6,942,432 13.2
These concentrations result from the reduced size of the portfolio from $88.9 million to $52.5 million during the year. The concentrations were consistent with investment guidelines at the time of purchase.
NOTE 4: CUSTODIANState Street Bank was appointed as custodian for STIF Plus effective October 2, 2006. STIF Plus pays a per-
centage of the annual rate of $110,600 for the Short-Term Investment Unit. This percentage is calculated annually by determining the STIF Plus fund size relative to that of the total Short-Term Investment Unit.
NOTE 5: ADMINISTRATIONSTIF Plus is managed and administered by employees of the State of Connecticut Treasury. Salaries and
fringe benefi t costs as well as operating expenses are charged directly to the Fund.
NOTE 6: DISTRIBUTIONS TO INVESTORSThe components of the distributions to investors are as follows for the income earned during the twelve months
ended:
Distributions: 2010 2009July $91,990 $809,903August 78,180 807,954September 65,702 780,532October 59,642 809,359November 50,713 795,451December 49,053 722,082January 80,812 588,206February 32,178 446,123March 32,855 384,349April 31,573 295,490May 31,479 242,574June (Payable at June 30) 32,275 151,279Total Distribution Paid & Payable $636,452 $6,833,302
SHORT-TERM PLUS INVESTMENT FUNDNOTES TO FINANCIAL STATEMENTS (Continued)

F-54 FISCAL YEAR 2010 ANNUAL REPORT
NOTE 7: INVESTMENTS IN SECURITIESThe following is a summary of investments in securities, at amortized cost and market value as of June 30,
2010:
Investment Amortized Cost Fair Value Asset-Backed Securities $9,250,003 $8,064,579Corporate Notes 45,008,880 44,477,776Money Market Funds 572 572TOTAL $54,259,455 $52,542,927
In an effort to improve disclosures associated with derivative contracts, the Government Accounting Standards Board (GASB) issued GASB Statement No. 53, Accounting and Financial Reporting for Derivative Instruments, effective for the fi scal years beginning after June 15, 2009. Statement No. 53 provides guidance on derivative disclosures, requires that all derivatives be reported on the Statement of Net Assets and defi nes a derivative instrument as a fi nancial instrument or other contract with all three of the following characteristics: a) it has (1) one or more underlyings (a specifi ed interest rate, security price, commodity price, foreign exchange rate, index of prices or rates or other variable) and (2) one or more notional amounts (a number of currency units, shares, bushels, pounds, or other units specifi ed in the contract) b) it requires no initial investment or smaller than would be required for other types of contracts c) its terms require or permit net settlement, it can readily be settled net by a means outside the contract, or it provides for delivery of an asset that puts the recipient in a position not substantially different from net settlement.
For the fi scal year ended June 30, 2010, the Short-Term Plus Investment Fund held adjustable-rate corporate notes, and asset-backed securities whose interest rates vary directly with short-term money market indices and are reset daily, monthly, quarterly or semi-annually. Such securities allow the Fund to earn higher interest rates as market rates increase, thereby increasing fund yields and protecting against the erosion of market values from rising interest rates. These adjustable rate securities have similar exposures to credit and legal risks as fi xed-rate securities from the same issuers.
SHORT-TERM PLUS INVESTMENT FUNDNOTES TO FINANCIAL STATEMENTS (Continued)

OFFICE OF THE STATE TREASURER, DENISE L. NAPPIER F-55
LIST OF INVESTMENTS AT JUNE 30, 2010
SHORT-TERM PLUS INVESTMENT FUND
Security Yield Amortized Fair Quality Par Value (Coupon, Maturity or Reset Date) % Cost Value Asset ID Rating
ASSET-BACKED SECURITIES (15.35% of total investments) $ 1,201,311 ARSI 2004-W10 A2 0.74, 10/25/34 0.74 $ 1,201,310 $ 1,061,771 040104LM1 AAA 1,059,734 BAYV 2006-C 1A1 6.035, 11/28/36 5.62 1,059,734 1,082,254 07325DAB0 AAA 1,464,039 CITI MORT LOAN TR - 2007 AMC2 0.43, 1/25/37 0.43 1,464,038 1,104,580 17311XAA3 B- (1)
1,848,803 GRANM 2007 - 12A1 0.42, 12/20/54 0.42 1,848,803 1,714,765 38741YDF3 AAA 511,997 GSAA 05-15 2A1 0.44, 1/25/36 0.44 511,997 480,371 362341D63 B- (1)
1,277,235 INDB 2006-1 A1 0.42, 7/25/36 0.42 1,277,235 1,039,380 45661JAA1 CCC(1)
418,494 NAA 2006-AF2 1A1 0.45, 8/25/36 0.45 418,493 173,388 65536VAA5 CCC(1)
1,468,395 RAMC 2005-2 AF3 4.49, 8/25/35 5.61 1,468,394 1,408,069 75970NAK3 AAA$ 9,250,008 $ 9,250,003 $ 8,064,579 CORPORATE NOTES (84.65% of total investments) $ 7,000,000 CITIGROUP 0.54, 5/18/11 0.54 $ 7,001,662 $ 6,942,432 172967DL2 A (1)
5,000,000 GE CAPITAL CORP 0.36, 10/18/10 0.36 5,000,201 4,999,650 36962GY32 AA+ 5,000,000 GE CAPITAL CORP 0.35, 10/6/10 0.35 5,000,058 5,000,470 36962GY24 AA+ 5,000,000 GOLDMAN SACHS 0.53, 2/6/12 0.43 5,001,426 4,874,715 38141GEW0 A (1)
5,000,000 GOLDMAN SACHS 0.69, 10/7/11 0.40 5,013,855 4,955,905 38141EJV2 A (1)
10,000,000 MERRILL LYNCH 0.77, 6/5/12 0.40 10,000,841 9,712,100 59018YE72 A (1)
5,000,000 WELLS FARGO 0.39, 1/12/11 0.35 4,996,636 4,997,679 949746NC1 AA- 3,000,000 WELLS FARGO 0.39, 1/12/11 0.35 2,994,201 2,994,825 949746NC1 AA-$ 45,000,000 $ 45,008,880 $ 44,477,776 MONEY MARKET FUNDS (0.00% of total investments) $ 572 GS GOVT FUND 0.03, 07/01/10 0.03 $ 572 $ 572 03799N9J9 A1+$ 572 $ 572 $ 572 $ 54,250,580 TOTAL INVESTMENT IN SECURITIES $ 54,259,455 $ 52,542,927
(1) The security’s credit rating, while in compliance with investment guidelines at time of purchase, was below guidelines as of June 30, 2010.

F-56 FISCAL YEAR 2010 ANNUAL REPORT
SCHEDULE OF CASH AND INVESTMENTS, BALANCES AND ACTIVITY (at Fair Value)FOR THE FISCAL YEAR ENDED JUNE 30, 2010
CIVIL LIST PENSION AND TRUST FUNDS
S
oldi
ers
Pol
ice
&
S
tate
M
unic
ipal
P
roba
te
S
tate
’s
Sai
lors
&
Arts
F
irem
en’s
T
each
ers’
E
mpl
oyee
s’
Em
ploy
ees’
C
ourt
J
udge
s’
Atto
rney
s’
Mar
ines
E
ndow
men
t S
urvi
vor’s
R
etire
men
t R
etire
men
t R
etire
men
t R
etire
men
t R
etire
men
t R
etire
men
t F
und
F
und
F
und
C
ash
$
-
$
-
$
-
$
-
$
-
$
-
$
-
$
-
$
-
In
com
e R
ecei
vabl
e
48,
776
2
8,23
3
6,6
20
310
5
10
7
-
87
7
5 In
tere
st in
Inve
stm
ent F
unds
1
2,27
3,55
5,43
9
7,7
89,6
07,3
02
1,4
70,6
21,0
54
71,
821,
103
1
49,7
75,0
49
990
,782
6
1,69
8,58
3
16,
822,
319
1
9,42
4,96
5 To
tal C
ash
and
Inve
stm
ents
$
12,2
73,6
04,2
15
$7,
789,
635,
535
$1
,470
,627
,674
$
71,8
21,4
13
$14
9,77
5,55
9
$990
,789
$6
1,69
8,58
3 $
16,8
22,4
06
$19,
425,
040
S
ched
ule
of A
ctiv
ity:
Cas
h an
d In
vest
men
ts a
t Jul
y 1,
200
9
$11
,397
,053
,409
$
7,32
1,03
3,01
8
$1,3
45,1
33,7
33
$66
,308
,182
$
148,
171,
455
$8
63,6
13
$56,
722,
207
$15
,662
,739
$1
7,81
5,99
2 S
hare
s P
urch
ased
(Exc
ludi
ng L
iqui
dity
Fun
d)
652
,313
,900
3
91,6
48,5
00
66,
173,
400
4
,229
,200
6
,219
,200
8
,250
-
-
1
50,9
00
Sha
res
Red
eem
ed (E
xclu
ding
Liq
uidi
ty F
und)
(1
,305
,006
,089
) (8
82,9
04,8
22)
(145
,524
,771
) (6
,976
,775
) (2
0,30
3,54
0)
-
-
-
(1,0
03)
Net
Pur
chas
e an
d R
edem
ptio
ns o
f Liq
uidi
ty F
und
3
78,9
14,8
14
212
,549
,322
7
6,82
3,86
6
1,9
53,4
60
1,3
68,6
72
62,
616
4
5,22
6
(82,
565)
5
4,24
5 N
et In
vest
men
t Inc
ome
3
21,3
98,3
81
207
,642
,999
4
0,87
2,49
8
1,9
93,8
99
4,4
07,3
33
33,
791
2
,804
,054
7
67,1
83
666
,138
R
ealiz
ed G
ain
(Los
s) fr
om S
ale
of In
vest
men
ts
502
,466
,817
3
46,4
16,8
72
49,
873,
664
2
,694
,271
5
,696
,288
2
3
1,0
58
2,5
77
786
C
hang
e in
Unr
ealiz
ed G
ain/
(Los
s) o
n In
vest
men
t Fun
ds
648
,184
,236
4
01,0
53,7
18
78,
179,
381
3
,615
,402
8
,626
,627
5
6,34
6
4,9
30,4
47
1,2
40,1
76
1,4
04,6
87
Incr
ease
(Dec
reas
e) in
Rec
eiva
bles
- N
et (1
) (3
22,8
72)
(161
,073
) (3
1,59
9)
(2,3
27)
(3,1
43)
(59)
(3
55)
(521
) (5
67)
Dis
tribu
tions
(3
21,3
98,3
81)
(207
,642
,999
) (4
0,87
2,49
8)
(1,9
93,8
99)
(4,4
07,3
33)
(33,
791)
(2
,804
,054
) (7
67,1
83)
(666
,138
)C
ash
and
Inve
stm
ents
at J
une
30, 2
010
$
12,2
73,6
04,2
15
$7,
789,
635,
535
$1
,470
,627
,674
$
71,8
21,4
13
$14
9,77
5,55
9
$990
,789
$6
1,69
8,58
3 $
16,8
22,4
06
$19,
425,
040
See
Not
es to
Civ
il an
d N
on-C
ivil
List
Tru
st F
und
Fina
ncia
l Sta
tem
ents
.
(1) R
efl e
cts
timin
g di
ffere
nces
in th
e re
cogn
ition
of i
ncom
e by
the
Pla
ns.

OFFICE OF THE STATE TREASURER, DENISE L. NAPPIER F-57
AGRICUL- IDA ANDREW HOPEMEAD MISC. TURAL EATON C. STATE AGENCY SCHOOL COLLEGE COTTON CLARK PARK TRUST FUND FUND FUND FUND TRUST FUND FUNDS
STATEMENT OF CONDITION, at Market
ASSETS Cash & Cash Equivalents $ - $ - $ - $ - $ - $36,972 Interest & Dividends Receivable 38 3 9 4 15 - Investments in Combined Investment Funds, at Fair Value 9,129,167 602,950 2,049,918 964,664 2,527,067 - Total Assets $9,129,205 $602,953 $2,049,927 $964,668 $2,527,082 $36,972 LIABILITIES & FUND BALANCE Due to Other Funds $118,549 $23,419 $79,658 $37,514 $ - $ - Fund Balance 9,010,656 579,534 1,970,269 927,154 2,527,082 36,972 Total Liabilities & Fund Balance $9,129,205 $602,953 $2,049,927 $964,668 $2,527,082 $36,972
FINANCIAL STATEMENTSJUNE 30, 2010
NON-CIVIL LIST TRUST FUNDS
STATEMENT OF REVENUE AND EXPENDITURES
REVENUE Net Investment Income $367,081 $23,419 $79,658 $37,515 $93,661 Realized Gain on Investments 1,036 15 36 27 18 Change in Unrealized Gain (Loss) on Investments 735,524 47,356 161,174 75,725 183,704 Increase (Decrease) in Cash Reserve Fund Income Receivables - (1) (204) (23) (79) (38) (123)Total Revenue $1,103,437 $70,767 $240,789 $113,229 $277,260
EXPENDITURES - - - - - Excess of Revenue over Expenditures $1,103,437 $70,767 $240,789 $113,229 $277,260
STATEMENT OF CHANGES IN FUND BALANCE Fund Balance at July 1, 2009 $8,274,302 $532,186 $1,809,138 $851,440 $2,249,822 $36,848 Excess of Revenue over Expenditures 1,103,437 70,767 240,789 113,229 277,260 - Net Cash Transactions - - - - - - Transfer from Other Funds - - - - - 124 Transfer to Other Funds (381,804) (26,569) (90,359) (42,522) - - Increase in Due to Other Funds 14,721 3,150 10,701 5,007 - Fund Balance at June 30, 2010 $9,010,656 $579,534 $1,970,269 $927,154 $2,527,082 $36,972
See Notes to Civil and Non-Civil List Trust Fund Financial Statements.
See Notes to Civil and Non-Civil List Trust Fund Financial Statements.
(1) Refl ects timing differences in the recognition of income by the Plans and Trusts.
See Notes to Civil and Non-Civil List Trust Fund Financial Statements.

F-58 FISCAL YEAR 2010 ANNUAL REPORT
AGRICUL- IDA ANDREW HOPEMEAD TURAL EATON C. STATE SCHOOL COLLEGE COTTON CLARK PARK FUND FUND FUND FUND TRUST FUND Cash Flows from Operating Activities: Excess of Revenues over Expenditures $1,103,437 $70,767 $240,789 $113,229 $277,260 Realized Gain on Investments (1,036) (15) (36) (27) (18) Change in Unrealized (Gain) Loss on Investments (735,524) (47,356) (161,174) (75,725) (183,704) (Increase) Decrease in Cash Reserve Fund Income Receivables 204 23 79 38 123 Net Cash Provided by Operations $367,081 $23,419 $79,658 $37,515 $93,661 Cash Flows from Non Capital Financing Activities: Operating Transfers - Out to Other Funds (381,804) (26,569) (90,359) (42,522) - Operating Transfers - In from Other Funds - - - - - Net Cash Used for Non-Capital Financing Actvities (381,804) (26,569) (90,359) (42,522) - Cash Flows from Investing Activities: Net Purchase and Redemptions of Cash Reserve Fund 14,723 3,150 10,701 5,007 (93,661) Purchase of Investments - - - - - Proceeds from Sale of Investment - - - - - Net Cash Provided by (Used for) Investing Activities 14,723 3,150 10,701 5,007 (93,661) - Net Increase (Decrease) In Cash - - - - - Cash June 30, 2009 - - - - - Cash June 30, 2010 $ - $ - $ - $ - $ -
See Notes to Civil and Non-Civil List Trust Fund Financial Statements.
STATEMENT OF CASH FLOWSFOR THE FISCAL YEAR ENDED JUNE 30, 2010
NON-CIVIL LIST TRUST FUNDS

OFFICE OF THE STATE TREASURER, DENISE L. NAPPIER F-59
STATEMENT OF CONDITION, AT COSTJUNE 30, 2010
NON-CIVIL LIST TRUST FUNDS
AGRICUL- IDA ANDREW HOPEMEAD MISC. TURAL EATON C. STATE AGENCY SCHOOL COLLEGE COTTON CLARK PARK TRUST FUND FUND FUND FUND TRUST FUND FUNDS
ASSETS Cash & Cash Equivalents $ - $ - $ - $ - $ - $36,972 Interest & Dividends Receivable 38 3 9 4 15 - Investments in Combined Investment Funds 7,040,132 465,688 1,573,566 761,482 2,048,117 - Total Assets $7,040,170 $465,691 $1,573,575 $761,486 $2,048,132 $36,972 LIABILITIES Due to Other Funds $118,549 $23,419 $79,658 $37,514 $ - $ - Fund Balance 6,921,621 442,272 1,493,917 723,972 2,048,132 36,972 Total Liabilities & Fund Balance $7,040,170 $465,691 $1,573,575 $761,486 $2,048,132 $36,972
See Notes to Civil and Non-Civil List Trust Fund Financial Statements.

F-60 FISCAL YEAR 2010 ANNUAL REPORT
CIVIL AND NON-CIVIL LIST TRUST FUNDSNOTES TO FINANCIAL STATEMENTS
NOTE 1. SUMMARY OF SIGNIFICANT ACCOUNTING POLICIES
Civil List and Non-Civil list trust funds (the “trust funds”) are entrusted to the Treasurer for investment pur-poses. Civil List trust funds are mandated by the State Legislature and are administered by the Offi ce of the State Comptroller. Accordingly, the presentation of the Civil List funds in the Treasurer’s Annual Report (see Civil List trust funds cash and investments schedules in the Supplemental Information section of these document) is intended to present only the cash and investments under the Treasurer’s care and does not depict a full fi nancial statement presentation. The Non-Civil List Trust funds are not administered by the Offi ce of the Comptroller. Accordingly, the fi nancial statements presented for the Non-Civil List funds are designed to provide a full set of fi nancial statements for the trusts’ investment assets and provide the necessary detail for the respective Boards that administer these trust funds.
Signifi cant account policies of the trust funds are as follows:
Basis of Presentation: The foregoing Non-Civil List trust fund fi nancial statements represent the fi nancial posi-tion, results of operations and cash fl ows of the investment trust assets of the funds in accordance with generally accepted accounting principles. These fi nancial statements present all of the fi nancial statements of the Non-Civil List funds except for the Second Injury Fund which, due to the unique nature of its operation, is presented separately in this Annual Report. The fi nancial statements do not include a Statement of Revenue and Expen-ditures for the Miscellaneous Agency and Trust Funds because agency funds do not report operations. These statements were prepared on the fair value basis. A Statement of Condition on a cost basis is also presented for informational purposes.
Valuation of Combined Investment Fund Shares: All unit prices are determined at the end of each month based on the fair value of the applicable investment fund.
Expenses: The Non-Civil List trust funds are not charged with any expenses for administration of the trust funds. Investment expenses of the Combined Investment Funds are deducted in calculating net investment income.
Distribution of Net Investment Income: Net investment income earned by the Combined Investment Funds is generally distributed in the following month. Net investment income is comprised of dividends and interest less investment expense.
Purchases and Redemptions of Units: Purchases and redemptions of units are generally processed on the fi rst day of the month based on the prior month end price. Purchases represent cash that has been allocated to a particular investment fund in accordance with directions from the Treasurer’s offi ce. Redemptions represent the return of principal back to the plan. In the case of certain funds, a portion of the redemption can also include a distribution of income.
NOTE 2. STATEMENT OF CASH FLOWS
A statement of cash fl ows is presented for the non-expendable Non-Civil List trust funds. This presentation is in accordance with Governmental Accounting Standards Board (GASB) Statement No. 9. No such statement of cash fl ows is presented for the Miscellaneous Agency and Trust Funds as none is required.
NOTE 3. MISCELLANEOUS AGENCY AND TRUST FUND TRANSFERS
These transactions comprise principal and income transfers to trustees as well as transfers and expenditure payments made on their behalf. Certain of these transfers are made to the General Fund and other Civil List funds as well as various state agencies.

OFFICE OF THE STATE TREASURER, DENISE L. NAPPIER F-61
ASSETS June 30, 2010 June 30, 2009 CURRENT ASSETS: Cash and cash equivalents $ 45,622,057 $ 57,251,127 Receivables, net of allowance for uncollectible accounts - $10,791,669 and $11,558,823 respectively 5,906,527 8,149,741 Other Assets 41,587 16,748 TOTAL CURRENT ASSETS 51,570,171 65,417,616 NONCURRENT ASSETS: Capital assets: Computers 33,093 33,093 Offi ce equipment 18,982 18,982 Less accumulated depreciation (49,144) (46,829) TOTAL NONCURRENT ASSETS 2,931 5,246 TOTAL ASSETS 51,573,102 65,422,862
LIABILITIES CURRENT LIABILITIES: Claims and benefi ts payable 7,615,767 7,623,846 Settlement payable 3,112,332 2,599,426 Accounts payable and other accrued liabilities 1,240,501 1,352,591 Compensated absences 456,558 359,387 TOTAL CURRENT LIABILITIES 12,425,158 11,935,250 NONCURRENT LIABILITIES: Accounts payable and accrued liabilities 1,155,000 1,030,500 Compensated absences 161,605 128,659 TOTAL NONCURRENT LIABILITIES 1,316,605 1,159,159 TOTAL LIABILITIES 13,741,763 13,094,409 NET ASSETS Unrestricted Net Assets 37,831,339 52,328,453 TOTAL NET ASSETS $ 37,831,339 $ 52,328,453
See accompanying Notes to the Financial Statements.
SECOND INJURY FUNDSTATEMENT OF NET ASSETS
JUNE 30, 2010 and 2009

F-62 FISCAL YEAR 2010 ANNUAL REPORT
SECOND INJURY FUND
STATEMENT OF REVENUES, EXPENSES AND CHANGES IN NET ASSETSFOR THE FISCAL YEARS ENDED JUNE 30, 2010 AND JUNE 30, 2009
OPERATING REVENUES 2010 2009Assessment Revenues $29,490,370 $36,465,941 Fund Recoveries 602,702 485,263 Other Income 37,767 35,191 TOTAL OPERATING REVENUES 30,130,839 36,986,395
OPERATING EXPENSES Injured Worker Benefi ts: Settlements 10,782,487 10,117,350 Indemnity Claims Benefi ts 22,056,446 21,269,642 Medical Claims Benefi ts 5,305,199 6,964,852 Total Injured Worker Benefi ts 38,144,132 38,351,844 Administrative Expenses 6,654,720 7,391,435 TOTAL OPERATING EXPENSES 44,798,852 45,743,279 OPERATING INCOME (LOSS) (14,668,013) (8,756,884) NON-OPERATING INCOME Interest Income 170,899 876,695 Change in Net Assets (14,497,114) (7,880,189) NET ASSETS - Beginning of Year 52,328,453 60,208,642 NET ASSETS - End of Year $37,831,339 $52,328,453
See accompanying Notes to the Financial Statements.

OFFICE OF THE STATE TREASURER, DENISE L. NAPPIER F-63
SECOND INJURY FUND
STATEMENT OF CASH FLOWSFOR THE FISCAL YEARS ENDED JUNE 30, 2010 AND JUNE 30, 2009
CASH FLOWS FROM OPERATING ACTIVITIES 2010 2009SOURCE: Assessment revenues $ 31,618,485 $ 38,950,161 Fund recoveries 602,702 501,985 Other income 37,767 35,191 Other assets (28,371) 9,437 Depreciation 2,316 2,316 32,232,899 39,499,090 USE: Injured worker benefi ts (37,514,807) (37,455,772)Administrative expenses (6,521,593) (7,254,880) (44,036,400) (44,710,652) NET CASH PROVIDED BY OPERATING ACTIVITIES (11,803,501) (5,211,562) CASH FLOWS FROM INVESTING ACTIVITIES SOURCE: Interest Income 174,431 896,645 NET CASH PROVIDED BY INVESTING ACTIVITIES 174,431 896,645 NET INCREASE (DECREASE) IN CASH AND CASH EQUIVALENTS (11,629,070) (4,314,917)Cash and cash equivalents, Beginning of Year 57,251,127 61,566,044 CASH AND CASH EQUIVALENTS, End of Year $ 45,622,057 $ 57,251,127 RECONCILIATION OF OPERATING INCOME (LOSS) TO NET CASH PROVIDED BY OPERATING ACTIVITIES OPERATING INCOME (LOSS) $ (14,668,013) $ (8,756,884)Adjustments to reconcile operating income to net cash: Provided by operating activities:- Depreciation expense 2,316 2,316 Decrease (increase) in assets: Decrease in receivables, net 2,243,214 2,190,052 Decrease (increase) in other assets (28,371) 9,437 Increase (decrease) in liabilities Increase (decrease) in accounts payable & accrued expenses 517,237 1,303,183 Increase (decrease) in compensated absences 130,116 40,334 NET CASH PROVIDED BY OPERATING ACTIVITIES $ (11,803,501) $ (5,211,562)
See accompanying Notes to the Financial Statements.

F-64 FISCAL YEAR 2010 ANNUAL REPORT
SECOND INJURY FUNDNOTES TO FINANCIAL STATEMENTS
NOTE 1: INTRODUCTION AND BASIS OF PRESENTATIONThe Second Injury Fund (“SIF” or the “Fund”) is an extension of the Workers’ Compensation Act managed by the
Treasurer of the State of Connecticut and operates under Chapter 568, of the Connecticut General Statutes (C.G.S.). Prior to July 1, 1995, the Fund provided relief to employers where a worker, who already had a preexisting injury or medical condition, was hurt on the job and that second injury was made “materially and substantially” worse by the preexisting injury or medical condition.
In 1995 the Connecticut General Assembly closed the Fund to new “second injury” claims sustained on or after July 1, 1995. However, the Fund will continue to be liable for payment of claims which involve an uninsured or bankrupt employer and, on a pro rata basis, be liable for reimbursement claims to employers of any worker who had more than one employer at the time of the injury.
In addition, the Fund will continue to be liable for and make payments with respect to:
Widow and dependent death benefi ts• Reimbursement for cost of living adjustments on certain claims• Second injury claims transferred to the Fund prior to July 1999 with a date of injury prior to July 1, 1995.•
For State of Connecticut fi nancial reporting purposes, SIF is reported as an Enterprise Fund. (See Note 2)
NOTE 2: SUMMARY OF SIGNIFICANT ACCOUNTING POLICIESFinancial Reporting Entity
The accompanying fi nancial statements of SIF have been prepared in conformity with generally accepted ac-counting principles as prescribed in pronouncements of the Governmental Accounting Standards Board (GASB).
The Fund utilizes the enterprise fund form of reporting. The reporting focuses on the determination of operating income, changes in net assets (or cost recovery), fi nancial position, and cash fl ows. The full accrual form of account-ing is employed, and revenues are recognized when earned, and expenses are recorded when liabilities are incurred without regard to receipt or disbursement of cash. GASB No. 34 has defi ned an enterprise fund as a governmental unit in which the pricing policies of the activity establish fees and charges designed to recover its costs.
Enterprise funds distinguish operating revenues and expenses from non-operating items. Operating revenues and expenses generally result from providing services and producing and delivering goods in connection with an enterprise fund’s principal ongoing operations. Revenues and expenses not meeting this defi nition are reported as non-operating revenues and expenses. The principal operating revenues of the Fund are the monies assessed to Connecticut employers for their share of the Fund’s expenses for managing workers’ compensation claims assigned to the Fund by statute.
Cash and Cash EquivalentsCash consists of funds in bank checking accounts and deposits held by the State General Fund in the Treasury
Business Offi ce account. Cash equivalents include investments in the State of Connecticut Short-Term Investment Fund (STIF). Custodial Credit Risk for Cash and Cash Equivalents is the risk that in the event of a bank failure, the SIF deposits may not be returned to them. STIF Investment Policy ensures strong asset diversifi cation by security type and issuer, comprised of high quality, very liquid securities with a relatively short average maturity. SIF has 99.3% of its cash invested in STIF which is rated AAAm by Standard & Poor’s Corporation (“S&P”). Deposits are presented in the basic fi nancial statements at cost plus accrued interest which is also the market or fair value.Receivables, Net of Allowance for Uncollectible Accounts
Receivables, Net of Allowance for Uncollectible AccountsThe receivables balance is composed of assessment receivables and other receivables.
Assessment receivables are recorded inclusive of interest due and result from amounts billed in accordance with C.G.S. 31-354 Assessments: SIF’s primary source of revenue is from the levying of assessments against self-insured

OFFICE OF THE STATE TREASURER, DENISE L. NAPPIER F-65
SECOND INJURY FUNDNOTES TO FINANCIAL STATEMENTS (Continued)
and insured Connecticut employers. Insurance carriers who insure Connecticut employers are responsible to collect the assessments from employers and submit the revenue to SIF. (See Note 3)
Other receivables are recorded inclusive of interest due and result from amounts billed in accordance with either statute C.G.S. 31-301 or C.G.S.355.
C.G.S. 31-301, Appeal Cases, provides for the payment of indemnity (lost wages) and medical benefi ts to an injured worker while their claims are under appeal. Upon a decision in the appeal, the injured worker (in cases of denial of compensation), or insurer (in cases of award of compensation), must reimburse the SIF for monies expended during the appeal process. This statute was repealed with passage of P.A. 95-277 for ap-peals fi led on injuries occurring after July 1, 1995. During fi scal years 2010 and 2009, there were no benefi ts paid for appeals cases.
C.G.S. 31-355, Non Compliance, mandates that SIF pay indemnity and medical benefi ts for injured workers whose employers fail to or are unable to pay the compensation. The most common examples of these cases involve employers who did not carry worker’s compensation insurance or are bankrupt.
Appeal Cases and Non Compliance transactions are recorded as injured worker benefi ts when paid by the Fund. Concurrently, the Fund seeks recovery of the amounts paid from the party statutorily responsible and a receivable is established. The receivable is offset by a credit to Allowance for Uncollectible Accounts. Recoveries are recorded as revenue when cash is received.
The Fund records other receivables for penalties and citations and certain other payments made under other statutes where the Fund has a right to seek reimbursement. The receivable is offset by a credit to Allowance for Uncollectible Accounts. Recoveries are recorded as revenue when cash is received. Revenue is recorded for these receivables when cash is received.
The allowance for uncollectible account represents those amounts estimated to be uncollectible as of the balance sheet date. The Fund fully reserves for the other receivable balances. (See Note 4)
Capital AssetsThe category of capital assets consists of computers and offi ce equipment. The Fund is recording these
capital assets at cost with a useful life of 5 years on a straight-line method. In the year of acquisition of the capital asset, the Fund has elected to take a half a year depreciation expense.
Claims Benefi ts PayableThis category of liability includes indemnity and medical benefi ts to injured workers as claims and widow and
depeThis category of liability includes indemnity and medical benefi ts to injured workers as claims and widow and dependent death benefi ts that will not be submitted to the Fund well as reimbursements to insurance companies and self-insured employers for widow claims and dependent death benefi ts in addition to concurrent employment cases incurred as at the balance sheet date. The long-term portion of claims benefi ts payable represents an esti-mate of the amount of liability of as June 30, 2010 and June 30, 2009 of the concurrent employment until a year or more for reimbursement. (See Note 5)
Settlements PayableSettlements are negotiated agreements for resolving the Fund’s future exposure on injured worker claims.
An accrual is made for all settlements committed as of the balance sheet date. (See Note 5)
Accounts Payable and Other Accrued LiabilitiesAccounts payable and other accrued liabilities represent administrative expenses of the Fund outstanding as
of June 30, 2010 and June 30, 2009 as well as assessments owed to Connecticut Workers’ Compensation and other Connecticut employers. (See Note 5)
Compensated AbsencesVacation and sick policy is as follows: Employees hired on or before June 30, 1977 can accumulate up to a
maximum of 120 vacation days. Employees hired after that date can accumulate up to a maximum of 60 days. Upon termination or death, the employee is entitled to be paid for the full amount of vacation days owed. No limit

F-66 FISCAL YEAR 2010 ANNUAL REPORT
SECOND INJURY FUNDNOTES TO FINANCIAL STATEMENTS (Continued)
is placed on the number of sick days that an employee can accumulate. However, the employee is entitled to pay-ment for accumulated sick time only upon retirement, or after ten years of service upon death, for an amount equal to one-fourth of his/her accrued sick leave up to a maximum payment equivalent of sixty days. (See Note 5)
NOTE 3: ASSESSMENTSThe assessment method for carriers paying on behalf of insured employers is on an actual premium basis. The
premium surcharge, which is paid by insured employers through their worker’s compensation insurance carrier within 45 days of the close of a quarter, is the premium surcharge rate multiplied by the employer’s “SIF’s surcharge base” premium on all policies with an effective date for that quarter. “SIF’s surcharge base” means direct written premium on policies prior to application of any deductible policy premium credits. The premium surcharge is set yearly based on the Fund’s budgetary needs prior to the start of the fi scal year. The annual insured employers’ assessment rate for the fi scal year ending June 30, 2010 was 2.75% and for the fi scal year ending June 30, 2009 was 3.00%.
The method of assessment for self-insured employers is a quarterly billing based on the previous calendar year’s paid losses. The annual assessment rate for self-insured employers for the fi scal year ending June 30, 2010 was 3.84% and for the fi scal year ending June 30, 2009 was 4.7%.
NOTE 4: RECEIVABLESThe following is an analysis of the changes in the Fund receivable balances:
As of June 30, 2010: Amount Allowance Beginning Cash Ending Due Within for Balance Additions Receipts Write-Offs Balance One Year Uncollectible
Assessments $9,713,402 $61,177,185 $63,699,005 $0 $7,191,582 $5,906,527 $1,285,055Non-Compliance 355 9,418,067 2,935,536 313,537 3,031,918 9,008,148 0 9,008,148Other Receivables 577,095 410,202 326,931 161,900 498,466 0 498,466Total Receivables $19,708,564 $64,522,923 $64,339,473 $3,193,818 $16,698,196 $5,906,527 $10,791,669
As of June 30, 2009: Amount Allowance Beginning Cash Ending Due Within for Balance Additions Receipts Write-Offs Balance One Year Uncollectible
Assessments $11,875,202 $58,553,463 $60,715,263 $0 $9,713,402 $8,149,741 $1,563,661Non-Compliance 355 8,282,425 3,746,239 220,581 2,390,016 9,418,067 0 9,418,067Other Receivables 718,432 320,596 313,780 148,153 577,095 0 577,095Total Receivables $20,876,059 $62,620,298 $61,249,624 $2,538,169 $19,708,564 $8,149,741 $11,558,823
NOTE 5: LIABILITES AND COMPENSATED ABSENCESThe following is an analysis of the changes in the Fund liabilities and compensated absence balances:
As of June 30, 2010: Amount Beginning Cash Ending Due Within Balance Additions Disbursements Balance One YearClaims and Benefi ts Payable $8,654,346 $27,486,147 $27,369,726 $8,770,767 $7,615,767Settlements Payable 2,599,426 10,782,487 10,269,581 3,112,332 3,112,332Accounts Payable & Accrued Expenses 1,352,591 7,037,239 7,149,329 1,240,501 1,240,501Compensated Absences 488,046 130,117 - 618,163 456,558Total Liabilities & Compensated Absences $13,094,409 $45,435,990 $44,788,636 $13,741,763 $12,425,158
As of June 30, 2009: Amount Beginning Cash Ending Due Within Balance Additions Disbursements Balance One YearClaims and Benefi ts Payable $7,985,465 $28,298,493 $27,629,612 $8,654,346 $7,623,846Settlements Payable 2,372,237 10,117,350 9,890,161 2,599,426 2,599,426Accounts Payable & Accrued Expenses 945,480 8,077,376 7,670,265 1,352,591 1,352,591Compensated Absences 447,711 40,335 - 488,046 359,387Total Liabilities & Compensated Absences $11,750,893 $46,533,554 $45,190,038 $13,094,409 $11,935,250

OFFICE OF THE STATE TREASURER, DENISE L. NAPPIER F-67
NOTE 6: SETTLEMENTSNegotiations were at various stages of completion for settlements valued and accrued at June 30, 2010 were
$3.1 million and at June 30, 2009 were $2.6 million.
NOTE 7: SUBSEQUENT EVENTSEffective July 1, 2010, the assessment rates for insured employers remains the same of 2.75% on voluntary
policies and on assigned risk policies, the assessment rates have remained the same of 2.2%. The assessment rate for self-insured employers decreased from 3.84% to 3.25% effective January 1, 2011.
SECOND INJURY FUNDNOTES TO FINANCIAL STATEMENTS (Continued)
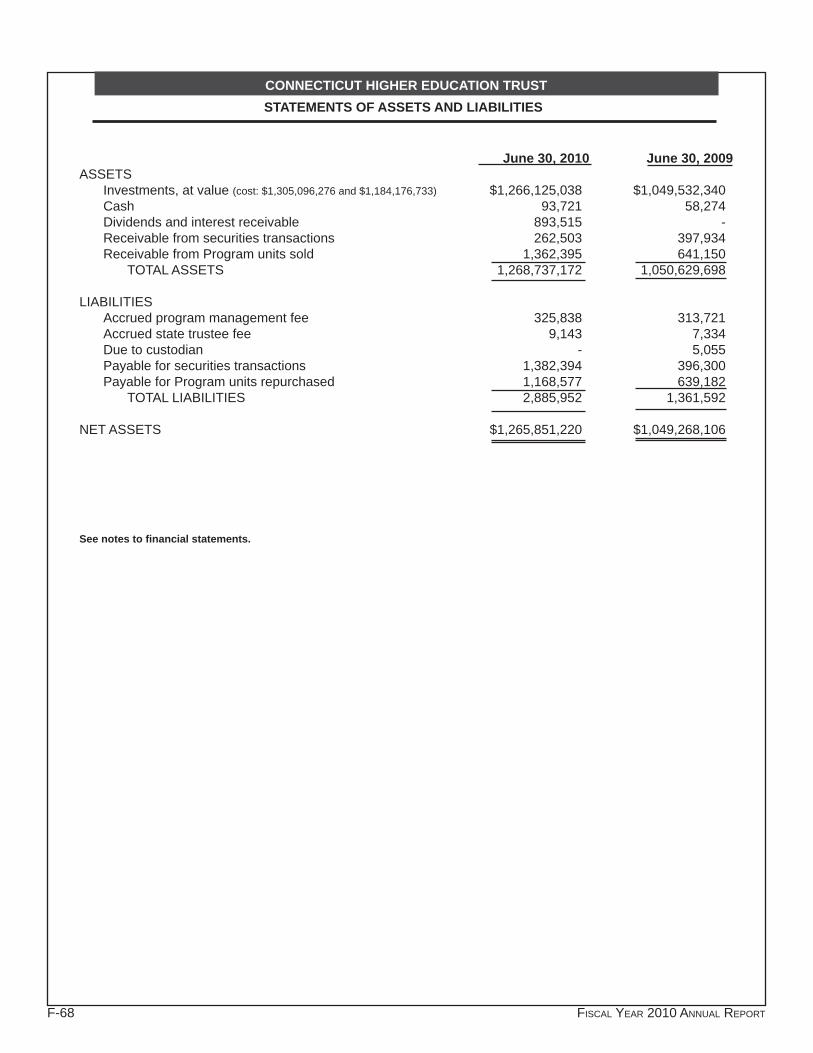
F-68 FISCAL YEAR 2010 ANNUAL REPORT
CONNECTICUT HIGHER EDUCATION TRUSTSTATEMENTS OF ASSETS AND LIABILITIES
June 30, 2010 June 30, 2009ASSETS Investments, at value (cost: $1,305,096,276 and $1,184,176,733) $1,266,125,038 $1,049,532,340 Cash 93,721 58,274 Dividends and interest receivable 893,515 - Receivable from securities transactions 262,503 397,934 Receivable from Program units sold 1,362,395 641,150 TOTAL ASSETS 1,268,737,172 1,050,629,698
LIABILITIES Accrued program management fee 325,838 313,721 Accrued state trustee fee 9,143 7,334 Due to custodian - 5,055 Payable for securities transactions 1,382,394 396,300 Payable for Program units repurchased 1,168,577 639,182 TOTAL LIABILITIES 2,885,952 1,361,592
NET ASSETS $1,265,851,220 $1,049,268,106
See notes to fi nancial statements.

OFFICE OF THE STATE TREASURER, DENISE L. NAPPIER F-69
CONNECTICUT HIGHER EDUCATION TRUSTSTATEMENTS OF OPERATIONS
FOR THE YEARS ENDED JUNE 30,
2010 2009INVESTMENT INCOME Interest $4,340,106 $4,632,715 Dividends 22,710,556 26,255,410 TOTAL INCOME 27,050,662 30,888,125
EXPENSES Program management fees 4,313,321 3,550,511 State trustee fees 103,859 85,367 TOTAL EXPENSES 4,417,180 3,635,878
NET INVESTMENT INCOME 22,633,482 27,252,247
REALIZED AND UNREALIZED GAIN (LOSS) ON INVESTMENTS Net realized gain (loss) on investments in underlying fund shares (15,465,177) (36,287,390) Realized gain distributions from underlying funds - 24,062 Net change in unrealized appreciation (depreciation) on investments in underlying shares 95,673,151 (118,620,003) NET REALIZED AND UNREALIZED GAIN (LOSS) ON INVESTMENTS 80,207,974 (154,883,331)
NET INCREASE (DECREASE) IN NET ASSETS RESULTING FROM OPERATIONS $102,841,456 $(127,631,084)
See notes to fi nancial statements.

F-70 FISCAL YEAR 2010 ANNUAL REPORT
CONNECTICUT HIGHER EDUCATION TRUSTSTATEMENTS OF CHANGES IN NET ASSETS
FOR THE YEARS ENDED JUNE 30,
OPERATIONS 2010 2009 Net Investment income $22,633,482 $27,252,247 Net realized gain (loss) on total investments (15,465,177) (36,263,328) Net change in unrealized appreciation (depreciation) on investments 95,673,151 (118,620,003) NET INCREASE (DECREASE) FROM OPERATIONS 102,841,456 (127,631,084)
ACCOUNT OWNER TRANSACTIONS Subscriptions 474,430,020 415,250,132 Redemptions (360,688,362) (315,025,414) NET INCREASE (DECREASE) FROM ACCOUNT OWNER TRANSACTIONS 113,741,658 100,224,718
NET INCREASE (DECREASE) IN NET ASSETS 216,583,114 (27,406,366)
NET ASSETS: Beginning of year 1,049,268,106 1,076,674,472 End of year $1,265,851,220 $1,049,268,106
See notes to fi nancial statements.

OFFICE OF THE STATE TREASURER, DENISE L. NAPPIER F-71
CONNECTICUT HIGHER EDUCATION TRUST
NOTES TO FINANCIAL STATEMENTS
NOTE 1—ORGANIZATION AND SIGNIFICANT ACCOUNTING POLICIESThe Connecticut Higher Education Trust Program (the “Program”) was formed on July 1, 1997 by Connecticut law,
to help people save for the costs of education after high school. The Program is administered by the Treasurer of the State of Connecticut, as trustee (the “Trustee”) of the Connecticut Higher Education Trust (the “Trust”). The Trustee has the authority to enter into contracts for program management services, adopt regulations for the administration of the Program and establish investment policies for the Program. TIAA-CREF Tuition Financing, Inc. (“TFI”), a wholly-owned subsidiary of Teachers Insurance and Annuity Association of America (“TIAA”), and the Trustee have entered into a Management Agreement under which TFI serves as Program Manager. The Program is intended to meet the requirements of a qualifi ed tuition program under Section 529 of the Internal Revenue Code and was established pursuant to the Connecticut Annotated Statues Sections 3-22f to 3-22o. Investment options and allocations, as ap-proved by the Trustee, are described in the current Disclosure Booklet for the Program.
The assets in the Principal Plus Interest Option are allocated to a funding agreement issued by TIAA-CREF Life Insurance Company (“TIAA-CREF Life”), a subsidiary of TIAA. The Funding Agreement guarantees to the Trust a return of principal plus a minimum rate of interest and provides the opportunity for additional interest as declared periodically by TIAA-CREF Life.
Teachers Advisors, Inc. (“Advisors”), an affi liate of TFI, is registered with the Securities and Exchange Commis-sion as an investment adviser and provides investment advisory services to the TIAA-CREF Funds.
The accompanying fi nancial statements were prepared in accordance with accounting principles generally ac-cepted in the United States of America (“U.S. GAAP”) which may require the use of estimates made by management and the evaluation of subsequent events through September 15, 2010. Actual results may differ from those estimates. The following is a summary of the signifi cant accounting policies consistently followed by the Program.
Security valuation: All investments are recorded at their estimated fair value as described in the valuation of investments note to the fi nancial statements.
Accounting for investments: Securities transactions are accounted for as of the trade date for fi nancial re-porting purposes. Interest income is recorded as earned. Dividend income and capital gain distributions from the TIAA-CREF Funds are recorded on the exdividend date. Realized gains and losses are based upon the specifi c identifi cation method.
Federal and state income tax: No provision for federal income tax has been made. The Program is designed to constitute a qualifi ed tuition program under Section 529 of the Internal Revenue Code and does not expect to have any unrelated business income subject to tax.
Units: The benefi cial interests for each account owner in the investment options are represented by Program units. Subscriptions and redemptions are recorded upon receipt of account owner’s instructions in good order, based on the next determined net asset value per unit (“Unit Value”). Unit Values for each investment option are determined at the close of business of the New York Stock Exchange.
There are no distributions of net investment gains or net investment income to the investment option’s account owners or benefi ciaries.
NOTE 2—VALUATION OF INVESTMENTSAll investments are valued at fair value utilizing various valuation methods. U.S. GAAP establishes a hierarchy
that prioritizes market inputs to valuation methods. The three levels of inputs are:
Level 1 – quoted prices in active markets for identical securities•
Level 2 – other signifi cant observable inputs (including quoted prices for similar securities, interest rates, • credit risk, etc.)
Level 3 – signifi cant unobservable inputs (including the Program’s own assumptions in determining the fair • value of investments)

F-72 FISCAL YEAR 2010 ANNUAL REPORT
CONNECTICUT HIGHER EDUCATION TRUSTNOTES TO FINANCIAL STATEMENTS (Continued)
The availability of observable inputs can vary from security to security and is affected by a wide variety of factors, including, for example, the type of security, whether the security is new and not yet established in the marketplace, the liquidity of markets, and other characteristics particular to the security. To the extent that valuation is based on models or inputs that are less observable or unobservable in the market, the determination of fair value requires more judgment. Accordingly, the degree of judgment exercised in determining fair value is greatest for instruments categorized in Level 3. The inputs or methodology used for valuing securities are not necessarily an indication of the risk associated with investing in those securities.
A description of the valuation techniques applied to the Program’s major categories of assets and liabilities measured at fair value follows:
Investments in registered investment companies: These investments are valued at their net asset value on the valuation date. These investments are categorized in Level 1 of the fair value hierarchy.
Principal Plus Interest Option: The TIAA-CREF Life Funding Agreement, to which the Principal Plus Interest Option allocates assets, is valued at fair value by discounting the related cash fl ows based on current yields of similar instruments with comparable durations considering the credit-worthiness of TIAA-CREF Life. The Funding Agree-ment has a fl oating rate of interest that resets annually based on a projected rate of return. The Funding Agreement is categorized in Level 3 of the fair value hierarchy.
Transfers between levels are recognized at the end of the reporting period. As of June 30, 2010, there were no signifi cant transfers between levels by the Program options.
As of June 30, 2010, all of the investments in the Managed Allocation Option, the Aggressive Managed Allocation Option, the High Equity Option, the 100% Equity Index Option, the 100% Fixed-Income Option, the Social Choice Option, the Money Market Option, and the Administrative Account were valued based on Level 1 inputs.
As of June 30, 2010, all investments in the Principal Plus Interest Option were categorized in Level 3 of the fair value hierarchy.
The following is a reconciliation of investments in which signifi cant unobservable inputs (Level 3) were used in determining value:
Principal Plus Interest OptionBalance as of 06/30/09 $ 154,483,968Realized Gain/Loss -Change in Unrealized Appreciation/Depreciation -Gross Purchases 57,905,730Gross Sales (38,949,298)Balance as of 06/30/10 $ 173,440,400
NOTE 3—MANAGEMENT AGREEMENTSFor its services as Program Manager with respect to the Managed Allocation Option, the Aggressive Managed
Allocation Option, the 100% Equity Index Option, the 100% Fixed-Income Option, the Social Choice Option, the Money Market Option and the High Equity Option, TFI is paid an annual aggregate Program management fee of 0.24% to 0.49% of the average daily net assets of the Program, invested in such investment options. In addition, Advisors is paid investment management fees on the underlying investments in the TIAA-CREF Funds. The Program management fee plus the weighted average expenses of each of the underlying mutual funds in the aforementioned investment options will not exceed 0.59% of the average daily net assets of the Program invested in such invest-ment options.
No fee is charged on the assets invested in the Principal Plus Interest Option; however a fee is paid to TFI by TIAA-CREF Life for distribution, administrative and other reasonable expenses.
Prior to May 15, 2010, for its services as Program Manager with respect to the Managed Allocation Option, the Aggressive Managed Allocation Option, the 100% Equity Index Option, the 100% Fixed-Income Option, the Social

OFFICE OF THE STATE TREASURER, DENISE L. NAPPIER F-73
CONNECTICUT HIGHER EDUCATION TRUST
NOTES TO FINANCIAL STATEMENTS (Continued)
Choice Option, the Money Market Option and the High Equity Option, TFI was paid an annual aggregate Program management fee of 0.315% to 0.56% of the average daily net assets of the Program, invested in such investment options. In addition, Advisors was paid investment management fees on the underlying investments in the TIAA-CREF Funds. The Program management fees plus the weighted average expenses of each of the underlying mutual funds in the aforementioned investment options did not exceed 0.64% of the average daily net assets of the Program invested in such investment options.
The Trustee collects a state trustee fee of 0.01% of the average daily net assets of the Program annually to pay for expenses related to the oversight of the Program. The Trustee is authorized to withdraw a state fee of up to 0.02% of the average daily net assets of the Program. The state trustee fee is not charged on the assets invested in the Principal Plus Interest Option.
For the period ended June 30, 2010, TFI received total Program management fees of $4,313,322. Total under-lying fund fee expenses for the TIAA-CREF Funds during the period were $2,262,048. The Program management fees and the state trustee fees charged to each investment option are disclosed in the Statement of Operations.
NOTE 4—INVESTMENTSAs of June 30, 2010, net unrealized appreciation (depreciation) of portfolio investments was $(38,971,238)
consisting of gross unrealized appreciation of $22,193,300 and gross unrealized depreciation of $(61,164,538).
Purchases and sales of non-government portfolio securities for the year ended June 30, 2010 were $239,285,305 and $121,865,375, respectively.
An account owner has an investment in an investment option and not a direct investment in any underlying mutual fund or other investment vehicle.
As of June 30, 2010, the Program’s investments consist of the following:
TIAA-CREF Mutual Funds (Institutional Class): SHARES COST VALUE Infl ation-Linked Bond Fund 10,998,498 $ 113,666,232 $ 120,543,535 Equity Index Fund 36,829,383 300,799,737 287,269,186 International Equity Index Fund 7,255,126 119,790,774 97,726,549 Bond Fund 31,636,547 316,551,377 331,867,373 Money Market Fund 97,349,562 97,349,562 97,349,562 Real Estate Securities Fund 3,672,057 34,603,158 30,441,352 S&P 500 Index Fund 7,965,809 108,982,480 93,199,971 Mid-Cap Growth Fund 688,263 10,625,855 10,048,647 Small-Cap Equity Fund 1,028,268 14,355,751 11,465,185 Mid-Cap Value Fund 706,384 11,663,273 9,571,509 Social Choice Equity Fund 310,166 2,817,078 2,751,170TIAA-CREF Mutual Funds (Retail Class): Money Market Fund* 450,599 450,599 450,599TIAA-CREF Life Insurance Company: Funding Agreement 173,440,400 173,440,400 $1,305,096,276 $1,266,125,038* Represents the assets of the administrative account.
NOTE 5 – ACCOUNTING PRONOUNCEMENTIn January 2010, the Financial Accounting Standards Board issued authoritative guidance that improves dis-
closures about fair value measurements thereby increasing transparency in fi nancial reporting. Some of the new disclosure requirements are effective for interim and annual reporting periods beginning after December 15, 2009. The remaining disclosure requirements are effective for fi scal years beginning after December 15, 2010, and for interim periods within those fi scal years. Management has evaluated the new disclosure requirements and has determined that the new requirements will not have a material impact on the Program’s fi nancial statements.

F-74 FISCAL YEAR 2010 ANNUAL REPORT
CONNECTICUT HIGHER EDUCATION TRUSTREPORT OF INDEPENDENT AUDITORS
To the Trustee of the Connecticut Higher Education Trust Program and Account Owners:
In our opinion, the accompanying statement of assets and liabilities and the related statements of operations and of changes in net assets and the fi nancial highlights present fairly, in all material respects, the fi nancial position of nineteen portfolios constituting the Connecticut Higher Education Trust Program (hereafter referred to as the “Program”) at June 30, 2010, the results of each of their operations, the changes in each of their net assets and each of their fi nancial highlights for the year then ended, in conformity with accounting principles generally accepted in the United States of America. These fi nancial statements and fi nancial highlights (hereafter referred to as “fi nancial statements”) are the responsibility of TIAA-CREF Tuition Financing, Inc (hereafter referred to as the “Program Manager”); our responsibility is to express an opinion on these fi nancial statements based on our audit. We conducted our audit of these fi nancial statements in accordance with auditing standards generally accepted in the United States of America. Those standards require that we plan and perform the audit to obtain reasonable assurance about whether the fi nancial statements are free of material misstatement. An audit includes examining, on a test basis, evidence supporting the amounts and disclosures in the fi nancial statements, assessing the accounting principles used and signifi cant estimates made by the Program Manager, and evaluating the overall fi nancial statement presentation. We believe that our audit, which included confi rmation of securities at June 30, 2010 by correspondence with the transfer agent, provides a reasonable basis for our opinion.
Boston, MASeptember 15, 2010

OFFICE OF THE STATE TREASURER, DENISE L. NAPPIER F-75
STATE OF CONNECTICUT SPECIAL OBLIGATION RATE REDUCTION BONDSSTATEMENT OF NET ASSETS
FOR THE YEARS ENDED DECEMBER 31,
ASSETS 2009 2008Current assets: Cash and cash equivalents $ 22,108 $ 11,989,868 Receivables - - Total current assets 22,108 11,989,868 Noncurrent assets: Trustee cash and cash equivalents - - Total noncurrent assets - - Total Assets $ 22,108 $ 11,989,868 LIABILITIES Current liabilities: Special obligation bonds payable - current portion $ - $ - Accounts payable and accrued liabilities - - Interest payable - - Total current liabilities - - Noncurrent liabilities: Special obligation bonds payable - - Premium on special obligation bonds, net of amortization - - Total noncurrent liabilities - - Total Liabilities $ - $ - NET ASSETS Restricted for debt service - - Unrestricted defi cit 22,108 11,989,868 Total Net Assets (Defi cit) $ 22,108 $ 11,989,868
See accompanying Notes to the Financial Statements.

F-76 FISCAL YEAR 2010 ANNUAL REPORT
STATE OF CONNECTICUT SPECIAL OBLIGATION RATE REDUCTION BONDS
STATEMENTS OF REVENUES, EXPENSES, AND CHANGES IN NET ASSETSFOR THE YEARS ENDED DECEMBER 31,
Operating Revenues Utilities revenues $ - $ 17,725,057 Operating Expenses Administrative expenses 161,902 230,095 Operating income (161,902) 17,494,963 Non-Operating Revenues (Expenses) Interest income 22,689 594,085 Cash defeasance cost (516,875) IRS payment (370,418) - Distribution to utilities (11,458,130) - Total non-operating revenues (expenses) (11,805,859) 77,210 Net income before special and extraordinary items (11,967,761) 17,572,173 Special and Extraordinary Items Bonds issued - - Deferred revenue - - Capital contribution - 85,000,000 Total special and extraordinary items - 85,000,000 Change in net assets (11,967,761) 102,572,173 Net Assets, beginning 11,989,868 (90,582,304) Net Assets, ending $ 22,108 $ 11,989,868
See accompanying Notes to the Financial Statements.
2009 2008

OFFICE OF THE STATE TREASURER, DENISE L. NAPPIER F-77
STATE OF CONNECTICUT SPECIAL OBLIGATION RATE REDUCTION BONDSSTATEMENTS OF CASH FLOWS
FOR THE YEARS ENDED DECEMBER 31,
Cash Flows from Operating Activities 2009 2008Source: Collection revenues $ - $ 17,725,058 Trustee cash - - - 17,725,058 Use: Administrative expenses (161,902) (230,095) Net cash provided by operating activities (161,902) 17,494,963
Cash Flows from Noncapital Financing Activities Distribution to utilities 11,458,130 Payment to IRS 370,418 Cash defeasance of Special Obligation Bonds 110,990,000 Cash defeasance expense 516,875 Asset contribution to cash defeasance (16,734,519) Capital contribution to cash defeasance from general fund (85,000,000)Net cash used from noncapital fi nancing activities 11,828,548 9,772,356 Cash Flows from Investing Activities Interest income (22,689) (594,085)Net cash used by investing activities (22,689) (594,085)
Net Increase (Decrease) in cash and cash equivalents (11,967,761) 8,316,692 Cash and cash equivalents, December 31, 2008 11,989,868 3,673,176 Cash and cash equivalents, December 31, 2009 $ 22,108 $ 11,989,868
Reconciliation of Operating Income to Net Cash Provided by Operating Activities
Operating income $ (161,902) $ 17,494,963 Adjustments to reconcile operating income to net cash: Decrease (increase) in assets Decrease in trustee cash 161,902 - Increase in receivables Increase (decrease) in liabilities - - Increase in accounts payable & accrued expenses - - Net Cash provided by Operating Activities $ 0 $ 17,494,963
See accompanying Notes to the Financial Statements.

F-78 FISCAL YEAR 2010 ANNUAL REPORT
STATE OF CONNECTICUT SPECIAL OBLIGATION RATE REDUCTION BONDS
NOTES TO FINANCIAL STATEMENTS
NOTE 1: INTRODUCTION AND BASIS OF PRESENTATION The Rate Reduction Bond Fund (the “Fund”) was established in 2004 to account for the trustee-held assets,
receipts, and expenses associated with State of Connecticut Special Obligation Rate Reduction Bonds. The Special Obligation Rate Reduction Bonds were issued in 2004 to sustain for two years the funding of energy conservation and load management and renewable energy investment programs by providing money to the State’s General Fund.
The bonds were issued pursuant to Connecticut General Statutes Sections 16-245e through 16-245k, 16-245m and 16-245n, as amended. The statutes authorize the Connecticut Department of Public Utility Control to issue a fi nancing order authorizing a nonbypassable State RRB charge on the electric bills of the State’s two investor-owned electric utilities: The Connecticut Light and Power Company (CL&P) and The United Illuminating Company (UI). The charge is calculated, billed, and collected by the two utilities pursuant to servicing agreements with the State. Collections from the State RRB charge are remitted to the bond trustee in an aggregate amount suffi cient to cover principal, interest, and other fees associated with the bonds.
The State of Connecticut, acting through the Offi ce of the Treasurer, was authorized to issue the bonds. Re-payment of the bonds including principal and interest, servicing fees, trustee fees, rating agency fees, legal and accounting fees and other related fees and expenses are payable solely from the State RRB charge. The State RRB charge is to be used exclusively for this purpose until the bonds have matured on June 30, 2011. Neither the full faith and credit nor the taxing power of the State is pledged to the bonds.
A cash defeasance of the bonds was done on June 5, 2008. Therefore, there is $0 of outstanding principal and interest remaining. State RRB revenue recognized during calendar year 2009 is $0.
For State of Connecticut fi nancial reporting purposes, the RRB Fund is reported as an enterprise fund. (See Notes 2 and 4.)
NOTE 2: SUMMARY OF SIGNIFICANT ACCOUNTING POLICIESFinancial Reporting Entity
The accompanying fi nancial statements of the Fund have been prepared in conformity with generally accepted ac-counting principles as prescribed in pronouncements of the Governmental Accounting Standards Board (GASB).
In June 1999, the Government Accounting Standards Board (GASB) issued Statement No. 34, Basic Financial Statements and Management’s Discussion and Analysis for State and Local Governments. The Fund implemented GASB No. 34 effective July 1, 2004. GASB No. 34, Paragraph 67, requires the Fund to utilize the enterprise fund form of reporting. The reporting focuses on the determination of operating income, changes in net assets (or cost recovery), fi nancial position, and cash fl ows. The full accrual form of accounting is employed and revenues are rec-ognized when earned and expenses are recorded when liabilities are incurred without regard to receipt or disburse-ment of cash. GASB No. 34 has defi ned an enterprise fund as a governmental unit in which the activity is fi nanced with debt that is secured solely by a pledge of the revenues from fees and charges of an activity. In addition, if the long-term debt is to be serviced by the Fund, then it is accounted for by the Fund.
Enterprise funds distinguish operating revenues and expenses from nonoperating items. Operating revenues and expenses generally result from providing services and producing and delivering goods in connection with an enterprise fund’s principal ongoing operations. Revenues and expenses not meeting this defi nition are reported as nonoperating revenues and expenses. The principal operating revenues of the Fund are the monies assessed against each customer and applied equally to each company’s retail customers of the same class. Companies are defi ned as CL&P and UI, who service the Transition Property and collect the State RRB charge.
ReceivablesThe receivables balance is composed of collection receivables.

OFFICE OF THE STATE TREASURER, DENISE L. NAPPIER F-79
Trustee Cash and Cash Equivalents Trustee cash and cash equivalents consist of funds in various accounts held by U.S. Bank National Associa-
tion as required by the Indenture of Trust dated June 23, 2004, covering the 2004 Series A Special Obligation Rate Reduction Bonds. These accounts include a Collection Account, Bond Account, Reserve Account, Rebate Account, and Cost of Issuance Account.
Bond Premiums The premium on the revenue bonds is being amortized over the term of the bonds on a straight-line basis,
which yields results equivalent to the interest method. The initial amount of premium received on the Special Ob-ligation Rate Reduction Bonds was $12,266,194.80. As of December 31, 2009 and 2008, the amount of premium remaining is $0.00 and $0.00 respectively.
NOTE 3: SPECIAL ASSESSMENT REVENUE BONDSThe Special Obligation Rate Reduction Bonds were issued to sustain for two years the funding of energy con-
servation and load management and renewable energy investment programs by providing money to the State’s General Fund. The bonds were payable entirely from the State RRB charge, and the State of Connecticut has no contingent obligation either directly or indirectly for the payment of such bonds.
Public Act No. 07-1 of the June 2007 Special Session, Sections 21 and 134 authorized the use of 2007 fi scal year General Fund surplus in the amount of $85,000,000 to be used for the purpose of defeasing or purchasing some or all of the 2004 Series A Special Obligation Rate Reduction Bonds maturing after December 30, 2007.
On April 30, 2008, the DPUC issued its Decision in Docket No. 03-09-08RE01 approving the defeasance of the Bonds and the application of unexpended funds by the Trustee. The State defeased the outstanding Bonds on June 5, 2008, with the $85,000,000 of surplus funds authorized and moneys held in the Collection Account and Reserve Account.
A summary of the beginning and ending balances of the bonds is presented below:
Balance at Balance Amount due 12/31/2008 Increases Decreases at 12/31/2009 within one year
$0 $0 $0 $0 $0
Balance at Balance Amount due 12/31/2007 Increases Decreases at 12/31/2008 within one year
$110,990,000 $0 $110,990,000 $0 $0
Bonds were issued on June 23, 2004, for $205,345,000. The outstanding maturities of the remaining 2004 bond issue mature on June 30 and December 30 of each year through 2011 and bear fi xed interest rates ranging from 2.50% to 5.00%.
The Trustee for these bonds is U.S. Bank National Association, successor in interest to Wachovia Bank Na-tional Association, and holds the accounts as required by the Bond Indenture. Collections are wire transferred to the Trustee daily by CL&P and UI in accordance with the servicing agreements.
At December 31, 2009 and 2008, the Trustee Accounts included the following:
2009 2008Reserve Account $ - $ 40,606 Collection Account 10,779 11,567,523 Rebate Account 11,329 381,709 Total Trustee Accounts $22,108 $11,989,838
STATE OF CONNECTICUT SPECIAL OBLIGATION RATE REDUCTION BONDS
NOTES TO FINANCIAL STATEMENTS (Continued)

F-80 FISCAL YEAR 2010 ANNUAL REPORT
STATE OF CONNECTICUT SPECIAL OBLIGATION RATE REDUCTION BONDS
NOTES TO FINANCIAL STATEMENTS (Continued)
Pursuant to the DPUC Order No. 2 in Docket No. 03-09-08RE01 it is expected that a fi nal disbursement of residual Distributable Funds will be made in the future and the $22,108 will be distributed to the REI Fund and the C&LM Funds.
NOTE 4: PREMIUM ON SPECIAL ASSESSMENT REVENUE BONDSDue to the cash defeasance of the bonds on June 5, 2008, there is no longer any premium to be amortized.
However, the original schedule of the premium received on the 2004 Series A Special Obligation Rate Reduction Bonds was to be amortized over the term of the bonds as shown in the table below.
Semi-Annual Bond Premium Premium Balance
09/23/2004 $12,266,194.8012/30/2004 $876,156.77 11,390,038.0306/30/2005 876,156.77 10,513,881.2612/30/2005 876,156.77 9,637,724.4906/30/2006 876,156.77 8,761,567.7112/30/2006 876,156.77 7,885,410.9406/30/2007 876,156.77 7,009,254.1712/30/2007 876,156.77 6,133,097.4006/30/2008 876,156.77 5,256,940.6312/30/2008 876,156.77 4,380,783.8606/30/2009 876,156.77 3,504,627.0912/30/2009 876,156.77 2,628,470.3106/30/2010 876,156.77 1,752,313.5412/30/2010 876,156.77 876,156.7706/30/2011 876,156.77 0.00
NOTE 5: CASH DEPOSITS - CUSTODIAL CREDIT RISKCustodial credit risk is the risk that, in the event of a bank failure, the Fund deposits may not be returned to it.
The Fund deposits cash in various accounts held by U.S. Bank National Association, as successor to Wachovia Bank National Association, as required by the Indenture of Trust dated June 23, 2004, covering the 2004 Series A Special Obligation Rate Reduction Bonds. Deposits in banks are insured up to $100,000; any amount above this limit is considered uninsured. Additionally, State banking law requires all fi nancial institutions that accept State of Connecticut deposits to segregate collateral against these deposits in an amount equal to 10 percent of the out-standing deposit. As of December 31, 2009 and 2008, $0 and $0 respectively of the Fund balance was exposed to custodial credit risk representing the portion that was uninsured and collateral held by the pledging bank not in the name of the State of Connecticut.
NOTE 6: INVESTMENTSAs of December 31, 2009, the Fund’s investments consisted of the following:
Investment Maturities (In Years) Fair Less Value Than 1 1 to 5 6 to 10 Securities Short-Term Investment Fund $10,779 $10,779 $0 $0 U.S. Treasury Money Market Fund $11,329 $11,329 $0 $0

OFFICE OF THE STATE TREASURER, DENISE L. NAPPIER F-81
STATE OF CONNECTICUT SPECIAL OBLIGATION RATE REDUCTION BONDS
NOTES TO FINANCIAL STATEMENTS (Continued)
As of December 31, 2008, the Fund’s investments consisted of the following:
Investment Maturities (In Years) Fair Less Value Than 1 1 to 5 6 to 10 Securities Short-Term Investment Fund $11,553,568 $11,553,568 $0 $0 U.S. Treasury Money Market Fund $395,664 $395,664 $0 $0
Restricted investments held by the Trustee in the collection account and the debt service reserve accounts are invested pursuant to the Indenture.
Interest Rate RiskThe Fund’s investment policies are delineated in Section 509 of the Indenture of Trust dated June 23, 2004.
Credit RiskThe Fund’s investments in securities were rated by Standard and Poor’s as of December 31, 2009, as fol-
lows:
Fair Securities Value AAA Short-Term Investment Fund $11,553,568 AAAm U.S. Treasury Money Market Fund $395,664 AAAm
Concentrations of Credit Risk
The Fund places no limit on the amount of investment in any one issuer. The Fund’s investment policies are delineated in Section 509 of the Indenture of Trust dated June 23, 2004. In addition, in accordance with Con-necticut General Statutes, allowable investments include: 1) obligations, securities, and investments set forth in subsection (f) of Section 3-20 of the Connecticut General Statutes and 2) participation certifi cates in the State’s Short-Term Investment Fund created under Section 3-27a of the Connecticut General Statutes.

F-82 FISCAL YEAR 2010 ANNUAL REPORT
STATE OF CONNECTICUT SPECIAL OBLIGATION RATE REDUCTION BONDS

OFFICE OF THE STATE TREASURER, DENISE L. NAPPIER F-83
TAX EXEMPT PROCEEDS FUND, INC.STATEMENT OF ASSETS AND LIABILITIES
JUNE 30, 2010
ASSETS
Investments in securities, at amortized cost (Note 2) ............................................. $ 127,123,196Receivable for securities sold ................................................................................. 3,520,000Receivable for shares sold ..................................................................................... 57,519Accrued interest receivable .................................................................................... 91,684 Total assets ................................................................................................. 130,792,399LIABILITIESPayable for securities purchased ........................................................................... 1,530,566Due to custodian ..................................................................................................... 4,075,488Payable to affi liate (Note 3) .................................................................................... 27,374 Total liabilities ............................................................................................ 5,633,428Net assets ............................................................................................................... $ 125,158,971
SOURCES OF NET ASSETSNet capital paid in on shares of capital stock (Note 5) ............................................ $ 125,158,971Accumulated net realized gain (losses) .................................................................. —Net assets ............................................................................................................... $ 125,158,971
Net Asset Value, per share (applicable to 125,160,974 shares outstanding) (Note 5) $ 1.00
The accompanying notes are an integral part of these fi nancial statements.

F-84 FISCAL YEAR 2010 ANNUAL REPORT
TAX EXEMPT PROCEEDS FUND, INC.SCHEDULE OF INVESTMENTS
JUNE 30, 2010
The accompanying notes are an integral part of these fi nancial statements.
Ratings (a) Face Maturity Interest Value StandardAmount Date Rate (Note 1) Moody’s & Poor’s
Tax Exempt Commercial Paper (6.39%)$ 4,000,000 Harris County, TX – Series C 08/12/10 0.35% $ 4,000,000 P-1 A-1+
4,000,000 Long Island Power Authority, NY LOC State Street Bank & Trust Company 08/04/10 0.32 4,000,000 P-1 A-1+ 8,000,000 Total Tax Exempt Commercial Paper 8,000,000
Tax Exempt General Obligation Notes and Bonds (10.23%)$ 4,000,000 Concord School District, NH BAN 01/21/11 0.75% $ 4,003,303 MIG1
1,670,000 Manitowoc County, WI Note Anticipation Notes 10/01/10 0.80 1,675,028 MIG1
2,000,000 Oconomowoc Area School District, Dodge, Jefferson and Waukesha Counties, WI Tax and Revenue Anticipation Promissory Notes 08/23/10 0.75 2,002,880 MIG1
1,695,000 Reedsville School District, Manitowic and Brown Counties, WI BAN 07/01/10 0.55 1,695,000 SP-1+
1,900,000 School District of New Berlin, Waukesha County, WI Tax and Revenue Anticipation Promissory Notes 08/25/10 0.75 1,901,419 MIG1
1,525,000 Waunakee Community School District, Dane County, WI BAN 11/01/10 0.65 1,530,566 MIG1
12,790,000 Total Tax Exempt General Obligation Notes and Bonds 12,808,196
Tax Exempt Variable Rate Demand Instruments (b) (84.95%)$ 3,000,000 City of Cohasset, MN RB (Minnesota Power & Light Company Project) – Series 1997A LOC LaSalle National Bank N.A. 06/01/20 0.30% $ 3,000,000 A-1+
1,400,000 City of Newport, KY Kentucky League of Cities Funding Trust Lease Program RB – Series 2002 LOC US Bank, N. A. 04/01/32 0.29 1,400,000 VMIG1
7,000,000 City of Santa Clara, CA Subordinated Electric Revenue Bonds – Series 2008B LOC Dexia CLF 07/01/27 0.28 7,000,000 A-1
2,900,000 Colorado Health Facilities Authority HRB (Boulder Community Hospital Project) – Series 2000 LOC JPMorgan Chase Bank, N.A. 10/01/30 0.26 2,900,000 VMIG1 A-1+

OFFICE OF THE STATE TREASURER, DENISE L. NAPPIER F-85
TAX EXEMPT PROCEEDS FUND, INC.SCHEDULE OF INVESTMENTS (Continued)
JUNE 30, 2010
The accompanying notes are an integral part of these fi nancial statements.
Ratings (a) Face Maturity Interest Value StandardAmount Date Rate (Note 1) Moody’s & Poor’s
Tax Exempt Variable Rate Demand Instruments (b) (Continued)
$ 5,000,000 Columbus, OH Regional Airport Authority Capital Funding RB (Oasbo Expanded Asset Pooled Financing Program) – Series 2006 LOC U.S. Bank N.A. 12/01/36 0.30% $5,000,000 VMIG1
1,100,000 Commonwealth of Puerto Rico Public Improvement Refunding Bonds – Series 2007A-8 LOC Wachovia Bank, N.A. 07/01/34 0.25 1,100,000 VMIG1 A-1+
1,835,000 Connecticut State Development Authority RB (Pierce Memorial Baptist Home, Inc. Project 1999 Refunding Series) LOC LaSalle National Bank N.A. 10/01/28 0.20 1,835,000 A-1+
4,500,000 Dormitory Authority of the State of New York Blythedale Childrens HRB Series 2009 LOC TD Bank, N.A. 12/01/36 0.27 4,500,000 VMIG1
3,600,000 East Baton Rouge Parish, LA PCRB (Exxon Mobile Project) 11/01/19 0.10 3,600,000 P-1 A-1+
2,000,000 Florida Housing Finance Corporation Multifamily Housing Revenue Refunding Bonds (Charleston Landing Apartments) 2001 Series I-A Guaranteed by Federal Home Loan Mortgage Corporation 07/01/31 0.30 2,000,000 A-1+
2,250,000 Florida Housing Finance Corporation Multifamily Housing Revenue Refunding Bonds (Island Club Apartments) 2001 Series J-A Guaranteed by Federal Home Loan Mortgage Corporation 07/01/31 0.30% 2,250,000 A-1+
1,525,000 HEFA of the State of Missouri RB Educational Facilities RB (Ranken Technical College) – Series 2007 LOC Northern Trust Company 11/15/31 0.16 1,525,000 A-1+
3,400,000 Illinois Development Finance Authority RB (Glenwood School For Boys) – Series 1998 LOC Harris Trust & Savings Bank 02/01/33 0.32 3,400,000 A-1+
2,225,000 Illinois Finance Authority RB (Riverside Health System) - Series 2004 LOC JPMorgan Chase Bank, N.A. 11/15/29 0.23 2,225,000 VMIG1 A-1+
2,800,000 Iowa Higher Education Loan Authority Private College Facility RB (University of Dubuque Project) – Series 2007 LOC Northern Trust Company 04/01/35 0.16 2,800,000 A-1+

F-86 FISCAL YEAR 2010 ANNUAL REPORT
TAX EXEMPT PROCEEDS FUND, INC.SCHEDULE OF INVESTMENTS (Continued)
JUNE 30, 2010
The accompanying notes are an integral part of these fi nancial statements.
Ratings (a) Face Maturity Interest Value StandardAmount Date Rate (Note 1) Moody’s & Poor’s
Variable Rate Demand Instruments (b) (Continued)
$ 900,000 Irvine Ranch Water District, Orange County, CA Waterworks Bonds Election 1988 Series A for Improvement District No. 182 LOC Landesbank Hessen Thuringen Girozentrale 11/15/13 0.15% $ 900,000 A-1+
3,000,000 Irvine, CA Assessment District # 89-10 (Orange County) Updates Improvement Bond LOC Bayerische HypoVereins Bank AG 09/02/15 0.16 3,000,000 VMIG1 A-1+
2,100,000 Irvine, CA Assessment District # 97-16 Limited Obligation Improvement Bond LOC State Street Bank & Trust Company 09/02/22 0.16 2,100,000 VMIG1 A-1+
5,950,000 Jackson County, MS Port Facility Refunding RB (Chevron U.S.A. Inc. Project) – Series 1993 06/01/23 0.13 5,950,000 P-1
800,000 Lincoln County, WY PCRB (Exxon Corporation) – Series 1985 08/01/15 0.10 800,000 A-1+
2,000,000 Marion County, FL IDA Multifamily Housing Revenue Refunding Bonds (Chambrel at Pinecastle Project) – Series 2002 Guaranteed by Federal National Mortgage Association 11/15/32 0.31 2,000,000 A-1+
6,000,000 Maryland Health and Higher Educational Facilities Authority RB (University of Maryland Medical System Issue) – Series 2007A LOC Wachovia Bank, N.A. 07/01/34 0.26 6,000,000 VMIG1 A-1+
1,000,000 M-S-R Public Power Agency, CA San Juan Project Subordinate Lien RB Series 2008M LOC Dexia CLF 07/01/22 0.16 1,000,000 A-1
735,000 New Canaan, CT Housing Authority RB (The Village at Waveny Care Center Project) – Series 2002 LOC Bank of America, N.A. 01/01/22 0.23 735,000 A-1+
7,700,000 New Jersey EDA School Facilities Construction Bonds – Series 2006 R-1 LOC Lloyds Bank PLC/ Bank of Nova Scotia 09/01/31 0.12 7,700,000 VMIG1 A-1+
900,000 New Jersey EDA School Facilities Construction Bonds – Series 2006R-3 LOC Lloyds Bank PLC/ Bank of Nova Scotia 09/01/31 0.14 900,000 VMIG1 A-1+

OFFICE OF THE STATE TREASURER, DENISE L. NAPPIER F-87
TAX EXEMPT PROCEEDS FUND, INC.SCHEDULE OF INVESTMENTS (Continued)
JUNE 30, 2010
Ratings (a) Face Maturity Interest Value StandardAmount Date Rate (Note 1) Moody’s & Poor’s
Variable Rate Demand Instruments (b) (Continued)
$ 2,000,000 New Jersey Health Care Facilities Financing Authority RB (Saint Barnabas Health Care System Issue) – Series 2001A LOC JP Morgan Chase Bank, N.A. 07/01/31 0.21% $ 2,000,000 VMIG1 A-1+
1,000,000 New Ulm, MN Hospital Refunding RB (Health Central Systems Project) – Series 1985 LOC Wells Fargo Bank, N.A. 08/01/14 0.35 1,000,000 A-1+
3,500,000 New York City, NY GO Bonds Fiscal 2004 Sub-Series H-2 LOC Bank of New York Mellon 03/01/34 0.15 3,500,000 VMIG1 A-1+
1,700,000 New York City, NY GO Bonds Fiscal 2004 Sub-Series H-7 LOC KBC Bank, N.A. 03/01/34 0.15 1,700,000 VMIG1 A-1
5,000,000 New York, NY GO Bonds Fiscal 1994 Sub-Series A-4 LOC Bayerische Landesbank 08/01/22 0.13 5,000,000 VMIG1 A-1+
1,945,000 North Carolina Capital Facilities Finance Agency Capital Facilities RB (The Mental Health Association in North Carolina, Inc. Project) – Series 2007 LOC Branch Banking & Trust Company 02/01/27 0.34 1,945,000 P-1 A-1+
3,400,000 Palm Beach County, FL Educational Facilities Authority RB (Lynn University Project) – Series 2001 LOC Bank of America, N.A. 11/01/21 0.30 3,400,000 P-1 A-1+
1,600,000 Redevelopment Agency of the City of Pittsburg, CA Los Medanos Community Development Project Subordinate Tax Allocation Bonds – Series 2004A LOC State Street Bank & Trust Company/ California State Teachers Retirement System 09/01/35 0.14 1,600,000 A-1+
5,100,000 State of Connecticut HEFA RB (Yale University Issue) – Series V-2 07/01/36 0.08 5,100,000 VMIG1 A-1+
150,000 State of Connecticut HEFA RB (Charlotte Hungerford Hospital Issue) – Series 1998C LOC Bank of America, N.A. 07/01/13 0.45 150,000 VMIG-1
1,000,000 State of Connecticut HEFA RB (Yale-New Haven Hospital Issue) – Series K-2 LOC JPMorgan Chase Bank, N.A. 07/01/25 0.22 1,000,000 VMIG1 A-1+
The accompanying notes are an integral part of these fi nancial statements.

F-88 FISCAL YEAR 2010 ANNUAL REPORT
TAX EXEMPT PROCEEDS FUND, INC.SCHEDULE OF INVESTMENTS (Continued)
JUNE 30, 2010
The accompanying notes are an integral part of these fi nancial statements.
Ratings (a) Face Maturity Interest Value StandardAmount Date Rate (Note 1) Moody’s & Poor’s
Variable Rate Demand Instruments (b) (Continued)
$ 300,000 State of Connecticut HEFA RB Mulberry Gardens Issue, Series E LOC Bank of America, N.A. 07/01/36 0.45% $ 300,000 A-1+
4,000,000 Turlock Irrigation District, CA COP (Capital Improvements and Refunding Project) 2001 Series A LOC Societe Generale 01/01/31 0.12 4,000,000 A-1+
106,315,000 Total Tax Exempt Variable Rate Demand Instruments 106,315,000
Total Investments (101.57%) (Cost $127,123,196†) 127,123,196
Liabilities in Excess of Cash and Other Assets (-1.57%) (1,964,225)
Net Assets (100.00%) $ 125,158,971
† Aggregate cost for federal income tax purposes is identical. All securities are valued at amortized cost and as a result, there is no unrealized appreciation and depreciation.
FOOTNOTES:(a) Unless the securities are assigned their own ratings, the ratings are those of the bank whose letter of credit
guarantees the issue. All letters of credit are irrevocable and direct pay covering both principal and interest. In addition, certain issuers may have either a line of credit, a liquidity facility, a standby purchase agreement or some other fi nancing mechanism to ensure the remarketing of the securities. This is not a guarantee and does not serve to insure or collateralize the issue. Ratings have not been audited by Sanville & Company.
(b) Securities payable on demand at par including accrued interest (usually with one or seven days notice) and where indicated are unconditionally secured as to principal and interest by a bank letter of credit. The interest rates are adjustable and are based on bank prime rates or other interest rate adjustment indices. The rate shown is the rate in effect at the date of this statement.
KEY:BAN = Bond Anticipation Note HRB = Hospital Revenue BondGO = General Obligation IDA = Industrial Development AuthorityCOP = Certifi cate of Participation LOC = Letter of CreditEDA = Economic Development Authority PCRB = Pollution Control Revenue BondHEFA = Health and Educational Facilities Authority RB = Revenue Bond

OFFICE OF THE STATE TREASURER, DENISE L. NAPPIER F-89
TAX EXEMPT PROCEEDS FUND, INC.BREAKDOWN OF PORTFOLIO HOLDINGS BY MATURITY
JUNE 30, 2010
The accompanying notes are an integral part of these fi nancial statements.
Securities Maturing in Value % of PortfolioLess than 31 Days $108,010,000 84.97%31 through 60 Days 11,904,299 9.3661 through 90 Days — —91 through 120 Days 1,675,028 1.32121 through 180 Days 1,530,566 1.20Over 180 Days 4,003,303 3.15Total $127,123,196 100.00%

F-90 FISCAL YEAR 2010 ANNUAL REPORT
TAX EXEMPT PROCEEDS FUND, INC.BREAKDOWN OF PORTFOLIO HOLDINGS BY STATE
JUNE 30, 2010
States Value % of PortfolioCalifornia $ 19,600,000 15.42%Colorado 2,900,000 2.28Connecticut 9,120,000 7.17Florida 9,650,000 7.59Illinois 5,625,000 4.42Iowa 2,800,000 2.20Kentucky 1,400,000 1.10Louisiana 3,600,000 2.83Maryland 6,000,000 4.72Minnesota 4,000,000 3.15Mississippi 5,950,000 4.68Missouri 1,525,000 1.20New Hampshire 4,003,303 3.15New Jersey 10,600,000 8.34New York 18,700,000 14.71North Carolina 1,945,000 1.53Ohio 5,000,000 3.93Puerto Rico 1,100,000 0.87Texas 4,000,000 3.15Wisconsin 8,804,893 6.93Wyoming 800,000 0.63Total $127,123,196 100.00%
The accompanying notes are an integral part of these fi nancial statements.

OFFICE OF THE STATE TREASURER, DENISE L. NAPPIER F-91
TAX EXEMPT PROCEEDS FUND, INC.STATEMENT OF OPERATIONS
FOR THE YEAR ENDEDJUNE 30, 2010
The accompanying notes are an integral part of these fi nancial statements.
INVESTMENT INCOMEIncome: Interest ................................................................................................................. $ 296,267
Expenses (Note 3) Investment management fee ................................................................................ 428,524
Less: Fees waived (Note 3) .............................................................................. (135,034)
293,490
Net investment income ............................................................................................... 2,777
REALIZED GAIN (LOSS) ON INVESTMENTSNet realized gain (loss) on investments ..................................................................... -0-
Increase in net assets resulting from operations ........................................................ $ 2,777
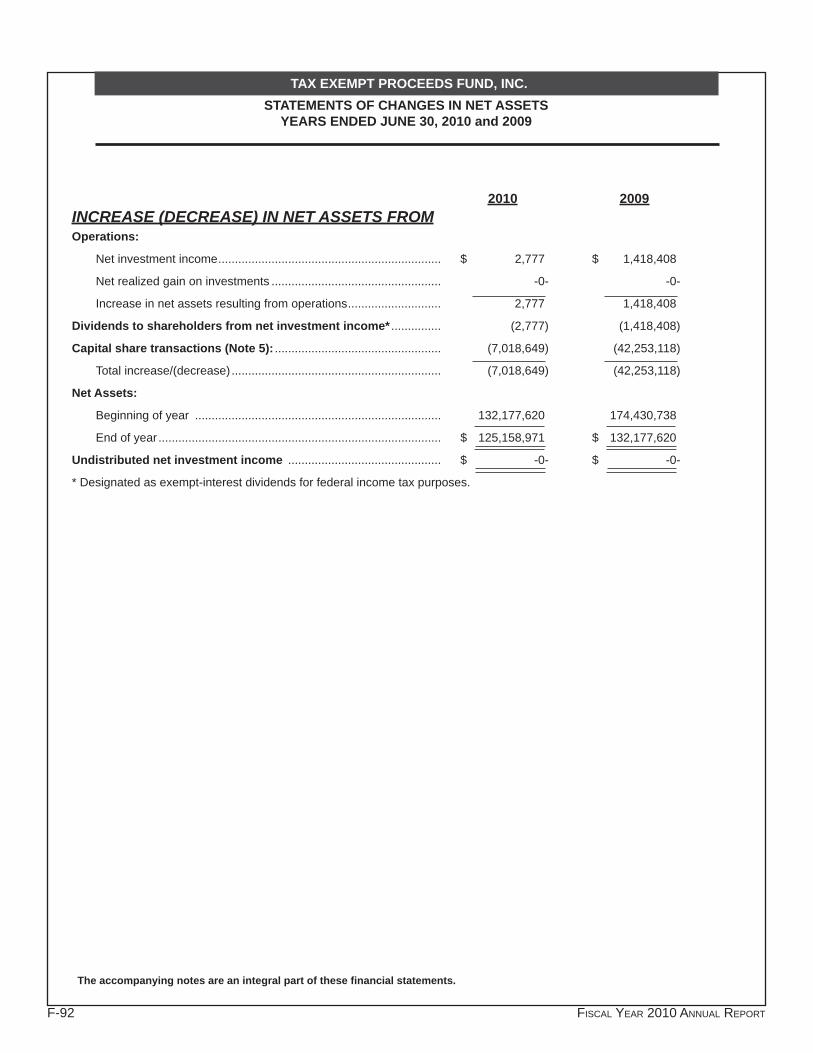
F-92 FISCAL YEAR 2010 ANNUAL REPORT
TAX EXEMPT PROCEEDS FUND, INC.STATEMENTS OF CHANGES IN NET ASSETS
YEARS ENDED JUNE 30, 2010 and 2009
The accompanying notes are an integral part of these fi nancial statements.
2010 2009INCREASE (DECREASE) IN NET ASSETS FROMOperations:
Net investment income ................................................................... $ 2,777 $ 1,418,408
Net realized gain on investments ................................................... -0- -0-
Increase in net assets resulting from operations ............................ 2,777 1,418,408
Dividends to shareholders from net investment income* ............... (2,777) (1,418,408)
Capital share transactions (Note 5): .................................................. (7,018,649) (42,253,118)
Total increase/(decrease) ............................................................... (7,018,649) (42,253,118)
Net Assets:
Beginning of year .......................................................................... 132,177,620 174,430,738
End of year ..................................................................................... $ 125,158,971 $ 132,177,620
Undistributed net investment income .............................................. $ -0- $ -0-
* Designated as exempt-interest dividends for federal income tax purposes.
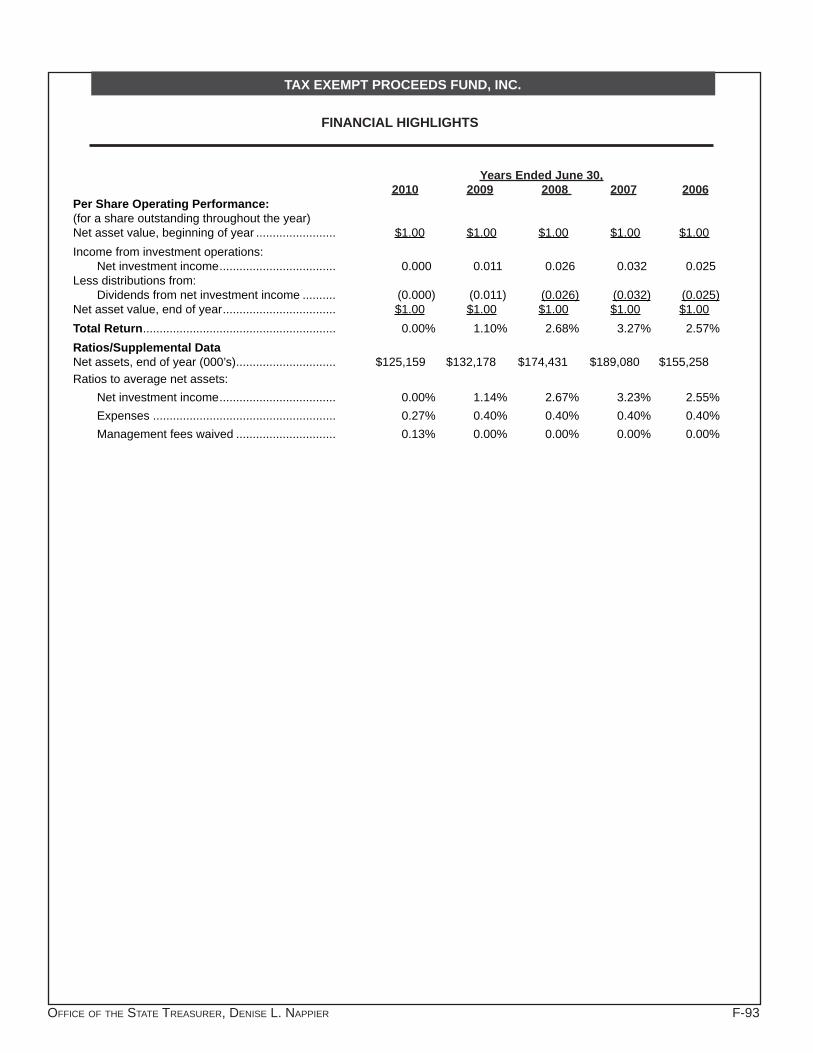
OFFICE OF THE STATE TREASURER, DENISE L. NAPPIER F-93
TAX EXEMPT PROCEEDS FUND, INC.
FINANCIAL HIGHLIGHTS
Years Ended June 30, 2010 2009 2008 2007 2006
Per Share Operating Performance:(for a share outstanding throughout the year)Net asset value, beginning of year ........................ $1.00 $1.00 $1.00 $1.00 $1.00Income from investment operations: Net investment income ................................... 0.000 0.011 0.026 0.032 0.025Less distributions from: Dividends from net investment income .......... (0.000) (0.011) (0.026) (0.032) (0.025)Net asset value, end of year .................................. $1.00 $1.00 $1.00 $1.00 $1.00Total Return .......................................................... 0.00% 1.10% 2.68% 3.27% 2.57%Ratios/Supplemental DataNet assets, end of year (000’s) .............................. $125,159 $132,178 $174,431 $189,080 $155,258Ratios to average net assets: Net investment income ................................... 0.00% 1.14% 2.67% 3.23% 2.55% Expenses ....................................................... 0.27% 0.40% 0.40% 0.40% 0.40% Management fees waived .............................. 0.13% 0.00% 0.00% 0.00% 0.00%

F-94 FISCAL YEAR 2010 ANNUAL REPORT
TAX EXEMPT PROCEEDS FUND, INC.NOTES TO FINANCIAL STATEMENTS
1. OrganizationTax Exempt Proceeds Fund, Inc. (“Fund”) is a no-load, diversifi ed, open-end management investment company registered under the Investment Company Act of 1940 (the “1940 Act”). The Fund is a short term, tax exempt money market fund whose objective is to seek as high a level of current interest income exempt from federal income taxes as is believed to be consistent with the preservation of capital, maintenance of liquidity and stability of principal.
2. Summary of Signifi cant Accounting PoliciesCODIFICATIONThe Financial Accounting Standards Board has issued FASB ASC 105 (formerly FASB Statement No. 168), The “FASB Accounting Standards Codifi cation™” and the Hierarchy of Generally Accepted Accounting Principles (“GAAP”) (“ASC 105”). ASC 105 established the FASB Accounting Standards Codifi cation (“Codifi cation” or “ASC”) as the single source of authoritative GAAP recognized by the FASB to be applied by nongovernmental entities. Rules and interpretive releases of the Securities and Exchange Commission (“SEC”) under authority of federal securities laws are also sources of authoritative GAAP for SEC registrants. The Codifi cation supersedes all existing non-SEC accounting and reporting standards. All other non-grandfathered, non-SEC accounting literature not included in the Codifi cation will become non-authoritative.
Following the Codifi cation, the FASB will not issue new standards in the form of Statements, FASB Staff Positions or Emerging Issues Task Force Abstracts. Instead, it will issue Accounting Standards Updates, which will serve to update the Codifi cation, provide background information about the guidance and provide the basis for conclusions on the changes to the Codifi cation. GAAP is not intended to be changed as a result of the FASB’s Codifi cation project, but it will change the way the guidance is organized and presented. As a result, these changes will have a signifi cant impact on how companies reference GAAP in their fi nancial statements and in their accounting policies for fi nancial statements issued for interim and annual periods ending after September 15, 2009. The Fund has implemented the Codifi cation as of June 30, 2010.
The following is a summary of the signifi cant accounting policies followed by the Fund in the preparation of its fi nancial statements. These policies are in conformity with accounting principles generally accepted in the United States of America.
VALUATION OF SECURITIESInvestments are recorded on the basis of amortized cost, which approximates value, as permitted by Rule 2a-7 under the 1940 Act. Under this method, a portfolio instrument is valued at cost and any discount or premium is amortized on a constant basis to the maturity of the instrument. The maturity of variable rate demand instruments is deemed to be the longer of the period required before the Fund is entitled to receive payment of the principal amount or the period remaining until the next interest rate adjustment. See Note 7 for additional disclosure on valuation of securities.
SECURITIES TRANSACTIONS AND INVESTMENT INCOMESecurities transactions are recorded on a trade date basis. Interest income, adjusted for accretion of discount and amortization of premium, is recorded on the accrual basis from settlement date. Realized gains and losses on sales are computed on the basis of specifi c identifi cation of the securities sold.
FEDERAL INCOME TAXESIt is the Fund’s policy to comply with the requirements of the Internal Revenue Code applicable to regulated investment companies and to distribute all of its tax exempt and taxable (if any) income to its shareholders. As such, the Fund will not be subject to federal income taxes on otherwise taxable income (including net realized capital gain) that is distributed to shareholders. Therefore, no provision for federal income tax is required in the fi nancial statements. The Fund recognizes interest and penalties, if any, related to uncertain tax positions as income tax expense in the Statement of Operations.In addition, GAAP requires management of the Fund to analyze all open tax years, fi scal years 2008-2010, as defi ned by IRS statute of limitations for all major jurisdictions, including federal tax authorities and certain state tax authorities. As of and during the period ended June 30, 2010, the Fund did not have a liability for any unrecognized tax benefi ts. The Fund has no examination in progress and is not aware of any tax positions for which it is reasonably possible that the total tax amounts of unrecognized tax benefi ts will signifi cantly change in the next twelve months.

OFFICE OF THE STATE TREASURER, DENISE L. NAPPIER F-95
TAX EXEMPT PROCEEDS FUND, INC.NOTES TO FINANCIAL STATEMENTS (Continued)
2. Summary of Signifi cant Accounting Policies (continued)DIVIDENDS AND DISTRIBUTIONSDividends from net investment income (excluding capital gains and losses, if any, and amortization of market discount) are declared daily and paid monthly. Net realized capital gains, if any, are distributed at least annually and in no event later than 60 days after the end of the Fund’s fi scal year.
ACCOUNTING ESTIMATESThe preparation of fi nancial statements in conformity with GAAP requires management to make estimates and assumptions that affect the reported amounts of assets and liabilities and disclosure of contingent assets and liabilities at the date of the fi nancial statements and the reported amounts of increases and decreases in net assets from operations during the reporting period. Actual results could differ from those estimates. Management has evaluated the impact of all subsequent events through July 29, 2010, the date the fi nancial statements were issued and has determined that there were no subsequent events requiring recognition of disclosure in these fi nancial statements.
REPRESENTATIONS AND INDEMNIFICATIONSIn the normal course of business the Fund enters into contracts that contain a variety of representations and warranties which provide general indemnifi cations. The Fund’s maximum exposure under these arrangements is unknown, as this would involve future claims that may be made against the Fund that have not yet occurred. However, based on experience, the Fund expects the risk of loss to be remote.
RISKSThe effect on performance from investing in securities issued or guaranteed by companies in the banking and fi nancial services industries will depend to a greater extent on the overall condition of those industries. Financial services companies are highly dependent on the supply of short-term fi nancing. The value of securities of issuers in the banking and fi nancial services industry can be sensitive to changes in government regulation and interest rates and to economic downturns in the United States and abroad.
The value of, payment of interest on, repayment of principal for and the ability to sell a municipal security may be affected by constitutional amendments, legislative enactments, executive orders, administrative regulations, voter initiatives and the economics of the regions in which the issuers are located.
Since many municipal securities are issued to fi nance similar projects, especially those relating to education, housing, health care, transportation and utilities, conditions in those sectors can affect the overall municipal securities market and a Portfolio’s investment in municipal securities.
There is some risk that a portion or all of the interest received from certain tax-free municipal securities could become taxable as a result of determinations by the Internal Revenue Service.
3. Investment Management Fees and Other Transactions with Affi liatesUnder the Investment Management Contract, the Fund pays an investment management fee to the Manager at the annual rate of 0.40 of 1% per annum of the Fund’s average daily net assets up to $250 million; 0.35 of 1% per annum of the average daily net assets between $250 million and $500 million; and 0.30 of 1% per annum of the average daily net assets over $500 million. The Management Contract also provides that the Manager will bear the cost of all other expenses of the Fund.
Therefore, the fee payable under the Management Contract will be the only expense of the Fund. At June 30, 2010, the Fund owed $27,374 to the Manager for these services, which is included in Payable to Affi liates on the Statement of Assets and Liabilities. For the year ended June 30, 2010, the Manager waived $135,034 of management fee.
In a low interest rate environment, such as the environment that existed at June 30, 2010, Reich & Tang Asset Management LLC (“the “Manager”) has historically waived their fees to maintain a minimum non-negative yield for the Fund. The Manager is under no contractual obligation to continue such waiver in the future.
Pursuant to a Distribution Plan adopted under Securities and Exchange Commission Rule 12b-1, the Fund and the Manager have entered into a Distribution Agreement. The Fund’s Board of Directors has adopted the plan in case certain expenses of the Fund are deemed to constitute indirect payments by the Fund for distribution expenses.
Directors of the Fund not affi liated with the Manager receive from the Fund (fee is paid by the Manager from its management fee) an annual retainer of $1,250 and a fee of $450 for each Board of Directors meeting attended and are reimbursed for all out-of-pocket expenses relating to attendance at such meeting.
As of June 30, 2010, no Directors, Offi cers or affi liated entities had investments in the Fund.

F-96 FISCAL YEAR 2010 ANNUAL REPORT
TAX EXEMPT PROCEEDS FUND, INC.NOTES TO FINANCIAL STATEMENTS (Continued)
4. Security Transactions with Affi liated FundsThe Fund is permitted to purchase or sell securities from or to certain other Reich & Tang Funds under specifi ed conditions outlined in procedures adopted by the Board of Directors of the Fund. The procedures have been designed to ensure that any purchase or sale of securities of the Fund from or to another fund or portfolio that is or could be considered an affi liate by virtue of having a common investment advisor (or affi liated investment advisors), common Directors and/or common Offi cers complies with Rule 17a-7 of the 1940 Act. Further, as defi ned under the procedures, each transaction is effected at the current market price. For the year ended June 30, 2010, the Fund engaged in purchases and sales with affi liates, none of which resulted in any gains or losses, which amounted to:
Purchases ............................................................................$119,410,000Sales ..................................................................................... 182,375,000Gains/(Losses)........................................................................................ -0-
5. Capital StockAt June 30, 2010, 20,000,000,000 shares of $.001 par value stock were authorized. Transactions in capital stock, all at $1.00 per share, were as follows: Year Ended Year Ended June 30, 2010 June 30, 2009 Net Assets Shares Net Assets Shares
Sold $ 767,955,845 767,955,845 $ 881,690,681 881,690,681Issued on reinvestment of dividends 3,012 3,012 1,419,718 1,419,718Redeemed (774,977,506) (774,977,506) (925,366,589) (925,366,589)Additional paid-in-capital* -0- -0- 3,072 -0-Net increase (decrease) $ (7,018,649) (7,018,649) $ (42,253,118) (42,256,190)
* During the year ended June 30, 2009, Reich & Tang Services, Inc. (“TA”), allocated amounts to the Fund related to aged items below $50 or for which shareholder data was unavailable.
6. Tax InformationThe tax character of distributions paid during the years ended June 30, 2010 and 2009 was as follows: 2010 2009Tax-exempt income $ 2,777 $ 1,418,408
7. Additional Valuation InformationUnder the provisions of GAAP, fair value is defi ned as the price that would be received to sell an asset or paid to transfer a liability in an orderly transaction between market participants at the measurement date under current market conditions. GAAP establishes a hierarchy that prioritizes the inputs to valuation methods giving the highest priority to readily available unadjusted quotes prices in an active market for identical assets (Level 1) and the lowest priority to signifi cant unobservable inputs (Level 3) generally when market prices are not readily available or are unreliable. Based on the valuation inputs, the securities or other investments are tiered into one of three levels. Changes in valuation methods may result in transfers in or out of an investment’s assigned level:
Level 1 – prices are determined using quoted prices in an active market for identical assets.Level 2 – prices are determined using other signifi cant observable inputs. Observable inputs are inputs that the
other market participants may use in pricing a security. These may include quoted prices for similar securities, interest rates, prepayment speeds, credit risk and others.
Level 3 – prices are determined using signifi cant unobservable inputs. In situations where quoted prices or observable inputs are unavailable (for example, when there is little or no market activity for an investment at the end of the period), unobservable inputs may be used. Unobservable inputs refl ect the Fund’s own assumptions about the factors market participants would use in determining fair value of the securities or instruments and would be based on the best available information.
The following is a summary of the tiered valuation input levels, as of the end of the reporting period, June 30, 2010. The level assigned to the securities valuations may not be an indication of the risk or liquidity associated with investing in those securities. Money market securities may be valued using amortized cost, in accordance with the 1940 Act.
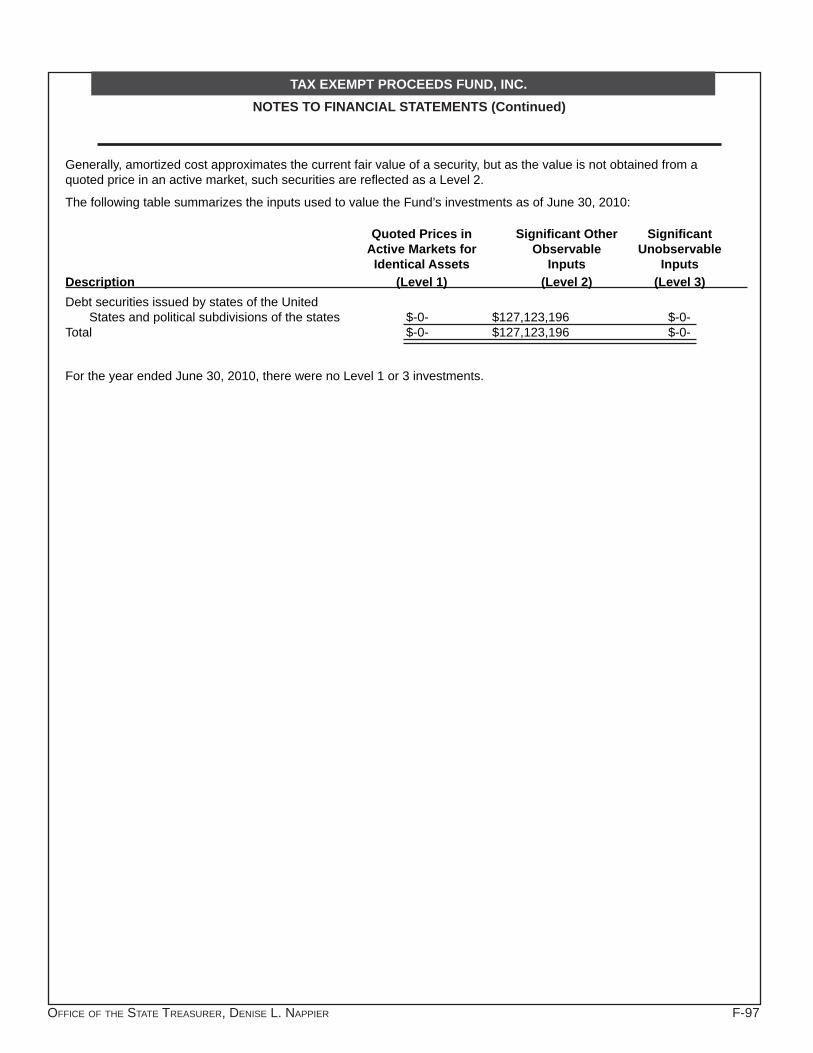
OFFICE OF THE STATE TREASURER, DENISE L. NAPPIER F-97
TAX EXEMPT PROCEEDS FUND, INC.NOTES TO FINANCIAL STATEMENTS (Continued)
Generally, amortized cost approximates the current fair value of a security, but as the value is not obtained from a quoted price in an active market, such securities are refl ected as a Level 2.
The following table summarizes the inputs used to value the Fund’s investments as of June 30, 2010:
Quoted Prices in Signifi cant Other Signifi cant Active Markets for Observable Unobservable Identical Assets Inputs InputsDescription (Level 1) (Level 2) (Level 3)Debt securities issued by states of the United States and political subdivisions of the states $-0- $127,123,196 $-0-Total $-0- $127,123,196 $-0-
For the year ended June 30, 2010, there were no Level 1 or 3 investments.

F-98 FISCAL YEAR 2010 ANNUAL REPORT
TAX EXEMPT PROCEEDS FUND, INC.REPORT OF INDEPENDENT REGISTERED PUBLIC ACCOUNTING FIRM
To the Board of Directors and Shareholders ofTax Exempt Proceeds Fund, Inc.
We have audited the accompanying statement of assets and liabilities of Tax Exempt Proceeds Fund, Inc. (the “Fund”) including the schedule of investments, as of June 30, 2010 and the related statement of operations for the year then ended, the statements of changes in net assets for each of the two years in the period then ended, and the fi nancial highlights for each of the fi ve years in the period then ended. These fi nancial statements and fi nancial highlights are the responsibility of the Fund’s management. Our responsibility is to express an opinion on these fi nancial statements and fi nancial highlights based on our audits.
We conducted our audits in accordance with the standards of the Public Company Accounting Oversight Board (United States). Those standards require that we plan and perform the audit to obtain reasonable assurance about whether the fi nancial statements and fi nancial highlights are free of material misstatement. An audit includes examining, on a test basis, evidence supporting the amounts and disclosures in the fi nancial statements. Our procedures included confi rmation of securities owned as of June 30, 2010 by correspondence with the Fund’s custodian. An audit also includes assessing the accounting principles used and signifi cant estimates made by management, as well as evaluating the overall fi nancial statement presentation. We believe that our audits provide a reasonable basis for our opinion.
In our opinion, the fi nancial statements and fi nancial highlights referred to above present fairly, in all material respects, the fi nancial position of Tax Exempt Proceeds Fund, Inc. as of June 30, 2010, the results of its operations for the year then ended, the changes in its net assets for each of the two years in the period then ended, and the fi nancial highlights for each of the fi ve years in the period then ended, in conformity with accounting principles generally accepted in the United States of America.
Sanville & CompanyNew York, New YorkJuly 29, 2010

SupplementalInformation


OFFICE OF THE STATE TREASURER, DENISE L. NAPPIER S-1
PENSION FUNDS MANAGEMENT DIVISION
COMBINED INVESTMENT FUNDSTOTAL NET ASSET VALUE BY PENSION PLANS AND TRUST FUNDS
JUNE 30, 2010
Retirement Funds Net Asset ValueTeachers’ Retirement Fund $12,273,555,439 State Employees’ Retirement Fund 7,789,607,302 Municipal Employees’ Retirement Fund 1,470,621,054 State Judges’ Retirement Fund 149,775,049 The Probate Court Retirement Fund 71,821,103 State’s Attorneys Retirement Fund 990,782 Non-retirement Trust Funds Soldiers’ Sailors’ & Marines’ Fund 61,698,583 Police & Firemans’ Survivors’ Benefi t Fund 19,424,965 Connecticut Arts Endowment Fund 16,822,319 School Fund 9,129,167 Ida Eaton Cotton Fund 2,049,918 Hopemead Fund 2,527,067 Andrew Clark Fund 964,664 Agricultural College Fund 602,950 TOTAL $21,869,590,362

S-2 FISCAL YEAR 2010 ANNUAL REPORT
COMBINED INVESTMENT FUNDS
SCHEDULE OF NET ASSETS BY INVESTMENT FUNDJUNE 30, 2010
MUTUAL CORE INFLATION EMERGING LIQUIDITY EQUITY FIXED INCOME LINKED BOND MARKET DEBT FUND FUND FUND FUND FUND ASSETS Investments in Securities , at Fair Value Liquidity Fund $ - $45,038,142 $126,859,828 $40,960,160 $50,151,134 Cash Equivalents 1,639,611,001 - - - 100,000 Asset Backed Securities 42,554,779 - 32,251,192 - - Government Securities 361,204,296 - 779,359,724 1,029,700,712 648,990,654 Government Agency Securities 23,140,094 - 811,238,771 - - Mortgage Backed Securities 10,124,847 - 304,081,637 - 202,701 Corporate Debt 137,469,391 - 735,272,491 - 182,486,978 Convertible Securities - - - - - Common Stock - 4,407,035,856 - - - Preferred Stock - - - - - Real Estate Investment Trust - 71,138,098 - - - Mutual Fund - 482,022,115 542,300 - 273,420,146 Limited Liability Corporation - - - - - Trusts - - - - - Limited Partnerships - 283,619,355 - - - Annuities - - - - - Total Investments in Securities, at Fair Value 2,214,104,408 5,288,853,566 2,789,605,943 1,070,660,872 1,155,351,613 Cash 9,233 - - 2,414 6,700,024 Receivables Foreign Exchange Contracts 529,002,409 - 8,971,425 - 200,823,578 Interest Receivable 3,908,398 6,227 22,126,985 8,225,278 16,814,018 Dividends Receivable - 5,214,814 - - - Due from Brokers - 18,216,606 200,605,856 - 4,926,560 Foreign Taxes - 35,996 62,244 - 773,454 Securities Lending Receivable - 156,747 124,013 141,338 10,945 Reserve for Doubtful Receivables - (1,901) (640,030) - (294,154) Total Receivables 532,910,807 23,628,489 231,250,493 8,366,616 223,054,401
Invested Securities Lending Collateral - 510,652,476 698,087,873 917,540,821 47,249,947 Other Funds on Deposit - - - - - Prepaid Expenses - - - - - Total Assets 2,747,024,448 5,823,134,531 3,718,944,309 1,996,570,723 1,432,355,985 LIABILITIES Payables Foreign Exchange Contracts 523,130,133 - 8,756,726 - 200,949,969 Due to Brokers 4,302,812 20,993,419 309,694,880 15,850,448 7,045,386 Income Distribution 26,490 - - - - Other Payable - 120,569 488 - - Total Payables 527,459,435 21,113,988 318,452,094 15,850,448 207,995,355 Securities Lending Collateral - 510,652,476 698,087,873 917,540,821 47,249,947 Accrued Expenses 684,044 2,276,371 958,133 289,954 1,248,315 Total Liabilities 528,143,479 534,042,835 1,017,498,100 933,681,223 256,493,617 NET ASSETS HELD IN TRUST FOR PARTICIPANTS $2,218,880,969 $5,289,091,696 $2,701,446,209 $1,062,889,500 $1,175,862,368 Units Outstanding 2,214,775,395 7,275,474 22,919,294 7,733,564 9,150,803 Net Asset Value and Redemption Price per Unit $1.00 $726.98 $117.87 $137.44 $128.50
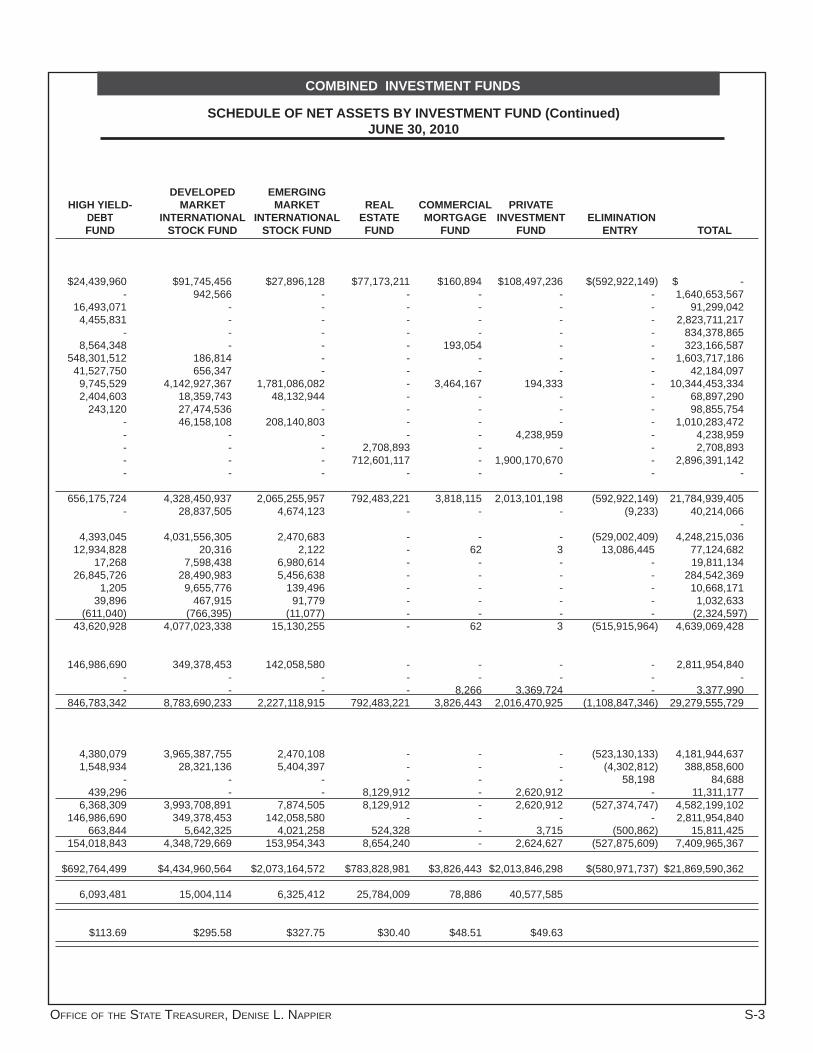
OFFICE OF THE STATE TREASURER, DENISE L. NAPPIER S-3
DEVELOPED EMERGING HIGH YIELD- MARKET MARKET REAL COMMERCIAL PRIVATE
DEBT INTERNATIONAL INTERNATIONAL ESTATE MORTGAGE INVESTMENT ELIMINATION FUND STOCK FUND STOCK FUND FUND FUND FUND ENTRY TOTAL
$24,439,960 $91,745,456 $27,896,128 $77,173,211 $160,894 $108,497,236 $(592,922,149) $ - - 942,566 - - - - - 1,640,653,567 16,493,071 - - - - - - 91,299,042 4,455,831 - - - - - - 2,823,711,217 - - - - - - - 834,378,865 8,564,348 - - - 193,054 - - 323,166,587 548,301,512 186,814 - - - - - 1,603,717,186 41,527,750 656,347 - - - - - 42,184,097 9,745,529 4,142,927,367 1,781,086,082 - 3,464,167 194,333 - 10,344,453,334 2,404,603 18,359,743 48,132,944 - - - - 68,897,290 243,120 27,474,536 - - - - - 98,855,754 - 46,158,108 208,140,803 - - - - 1,010,283,472 - - - - - 4,238,959 - 4,238,959 - - - 2,708,893 - - - 2,708,893 - - - 712,601,117 - 1,900,170,670 - 2,896,391,142 - - - - - - - -
656,175,724 4,328,450,937 2,065,255,957 792,483,221 3,818,115 2,013,101,198 (592,922,149) 21,784,939,405 - 28,837,505 4,674,123 - - - (9,233) 40,214,066 - 4,393,045 4,031,556,305 2,470,683 - - - (529,002,409) 4,248,215,036 12,934,828 20,316 2,122 - 62 3 13,086,445 77,124,682 17,268 7,598,438 6,980,614 - - - - 19,811,134 26,845,726 28,490,983 5,456,638 - - - - 284,542,369 1,205 9,655,776 139,496 - - - - 10,668,171 39,896 467,915 91,779 - - - - 1,032,633 (611,040) (766,395) (11,077) - - - - (2,324,597) 43,620,928 4,077,023,338 15,130,255 - 62 3 (515,915,964) 4,639,069,428
146,986,690 349,378,453 142,058,580 - - - - 2,811,954,840 - - - - - - - - - - - - 8,266 3,369,724 - 3,377,990 846,783,342 8,783,690,233 2,227,118,915 792,483,221 3,826,443 2,016,470,925 (1,108,847,346) 29,279,555,729 4,380,079 3,965,387,755 2,470,108 - - - (523,130,133) 4,181,944,637 1,548,934 28,321,136 5,404,397 - - - (4,302,812) 388,858,600 - - - - - - 58,198 84,688 439,296 - - 8,129,912 - 2,620,912 - 11,311,177 6,368,309 3,993,708,891 7,874,505 8,129,912 - 2,620,912 (527,374,747) 4,582,199,102 146,986,690 349,378,453 142,058,580 - - - - 2,811,954,840 663,844 5,642,325 4,021,258 524,328 - 3,715 (500,862) 15,811,425 154,018,843 4,348,729,669 153,954,343 8,654,240 - 2,624,627 (527,875,609) 7,409,965,367
$692,764,499 $4,434,960,564 $2,073,164,572 $783,828,981 $3,826,443 $2,013,846,298 $(580,971,737) $21,869,590,362 6,093,481 15,004,114 6,325,412 25,784,009 78,886 40,577,585 $113.69 $295.58 $327.75 $30.40 $48.51 $49.63
COMBINED INVESTMENT FUNDS
SCHEDULE OF NET ASSETS BY INVESTMENT FUND (Continued)JUNE 30, 2010

S-4 FISCAL YEAR 2010 ANNUAL REPORT
COMBINED INVESTMENT FUNDS
SCHEDULE OF CHANGES IN NET ASSETS BY INVESTMENT FUNDFOR THE FISCAL YEAR ENDED JUNE 30, 2010
MUTUAL CORE INFLATION EMERGING LIQUIDITY EQUITY FIXED INCOME LINKED BOND MARKET DEBT FUND FUND FUND FUND FUND ADDITIONS OPERATIONS Investment Income Dividends $ - $88,910,121 $37,103 $ - $7,100,299 Interest 18,673,154 955,780 124,264,831 33,200,382 84,874,231 Other Income - 4,709,232 706,117 - - Securities Lending - 6,397,444 3,562,763 4,199,924 197,765 Total Income 18,673,154 100,972,577 128,570,814 37,400,306 92,172,295 Expenses Investment Advisory Fees 2,892,287 10,744,251 3,499,757 901,014 4,544,477 Custody and Transfer Agent Fees - 592,083 240,034 88,901 105,570 Professional Fees 92,550 385,394 151,501 47,887 59,984 Security Lending Fees - 942,176 447,671 494,268 28,462 Security Lending Rebates - 921,876 1,185,704 1,628,574 42,543 Investment Expenses 106,429 35,539 50,550 9,461 46,200 Total Expenses 3,091,266 13,621,319 5,575,217 3,170,105 4,827,236 Net Investment Income 15,581,888 87,351,258 122,995,597 34,230,201 87,345,059 Net Realized Gain (Loss) 1,398,777 146,422,841 (85,671,834) 28,198,333 54,206,617 Net Change in Unrealized Gain/(Loss) on Investments and Foreign Currency 2,448,634 544,793,180 292,061,850 21,323,807 101,685,851 Net Increase (Decrease) in Net Assets Resulting from Operations 19,429,299 778,567,279 329,385,613 83,752,341 243,237,527 Unit Transactions Purchase of Units by Participants 3,308,833,684 - - 162,500,000 - TOTAL ADDITIONS 3,328,262,983 778,567,279 329,385,613 246,252,341 243,237,527 DEDUCTIONS Administrative Expenses Salary and Fringe Benefi ts (189,778) (1,211,943) (348,358) (142,968) (173,529) Distributions to Unit Owners Income Distributed (16,790,887) (93,114,520) (136,994,857) (20,312,559) (47,140,193) Unit Transactions Redemption of Units by Participants (3,263,630,115) (985,500,000) (650,500,000) (150,000) (151,900,000) TOTAL DEDUCTIONS (3,280,610,780) (1,079,826,463) (787,843,215) (20,605,527) (199,213,722) Change in Net Assets Held in Trust for Participants 47,652,203 (301,259,184) (458,457,602) 225,646,814 44,023,805 Net Assets- Beginning of Period 2,171,228,766 5,590,350,880 3,159,903,811 837,242,686 1,131,838,563 Net Assets- End of Period $2,218,880,969 $5,289,091,696 $2,701,446,209 $1,062,889,500 $1,175,862,368 Other Information: Units Purchased 12,644,875,668 - - 1,197,687 - Redeemed (12,603,477,742) (1,347,647) (5,661,321) (1,171) (1,263,797) Net Increase (Decrease) 41,397,926 (1,347,647) (5,661,321) 1,196,516 (1,263,797)

OFFICE OF THE STATE TREASURER, DENISE L. NAPPIER S-5
COMBINED INVESTMENT FUNDS
SCHEDULE OF CHANGES IN NET ASSETS BY INVESTMENT FUND (Continued)FOR THE FISCAL YEAR ENDED JUNE 30, 2010
DEVELOPED EMERGING HIGH YIELD- MARKET MARKET REAL COMMERCIAL PRIVATE
DEBT INTERNATIONAL INTERNATIONAL ESTATE MORTGAGE INVESTMENT ELIMINATION FUND STOCK FUND STOCK FUND FUND FUND FUND ENTRY TOTAL
$282,352 $126,496,894 $46,751,825 $23,136,047 $401,965 $124,291,666 $ - $417,408,272 65,514,621 1,899,449 733,623 561,298 741 1,544,075 (8,177,167) 324,045,018 19,119 159,831 13,806 - - - - 5,608,105 846,690 6,768,954 1,452,689 - - - - 23,426,229 66,662,782 135,325,128 48,951,943 23,697,345 402,706 125,835,741 (8,177,167) 770,487,624 2,544,771 22,085,148 12,333,677 3,100,126 37,125 8,323,349 (1,266,562) 69,739,420 67,120 473,622 210,474 67,787 445 173,802 - 2,019,838 39,049 269,350 98,187 470,006 262 1,170,788 (40,529) 2,744,429 125,269 1,041,161 224,476 - - - - 3,303,483 144,344 344,222 116,426 - - - - 4,383,689 9,828 302,349 1,064,587 12,918 89 19,091 (46,606) 1,610,435 2,930,381 24,515,852 14,047,827 3,650,837 37,921 9,687,030 (1,353,697) 83,801,294 63,732,401 110,809,276 34,904,116 20,046,508 364,785 116,148,711 (6,823,470) 686,686,330 22,294,432 110,381,007 169,221,914 (63,080,704) 419 (168,334,674) (612,539) 214,424,589 80,344,795 302,435,776 173,923,657 (131,384,936) (1,691) 351,373,634 (1,343,434) 1,737,661,123 166,371,628 523,626,059 378,049,687 (174,419,132) 363,513 299,187,671 (8,779,443) 2,638,772,042 - - 575,000,000 202,788,350 - 180,455,000 (782,526,824) 3,647,050,210 166,371,628 523,626,059 953,049,687 28,369,218 363,513 479,642,671 (791,306,267) 6,285,822,252 (123,172) (794,406) (316,026) (311,138) (16,490) (291,075) 83,106 (3,835,777) (56,649,900) (83,870,390) (25,395,091) (13,884,655) (390,812) (92,097,306) 7,352,901 (579,288,269) (150,000,000) (419,900,000) (1,500,000) - (1,267,000) - 1,409,072,987 (4,215,274,128) (206,773,072) (504,564,796) (27,211,117) (14,195,793) (1,674,302) (92,388,381) 1,416,508,994 (4,798,398,174)
(40,401,444) 19,061,263 925,838,570 14,173,425 (1,310,789) 387,254,290 625,202,727 1,487,424,078 733,165,943 4,415,899,301 1,147,326,002 769,655,556 5,137,232 1,626,592,008 (1,206,174,464) 20,382,166,284 $692,764,499 $4,434,960,564 $2,073,164,572 $783,828,981 $3,826,443 $2,013,846,298 $(580,971,737) $21,869,590,362 - - 1,998,863 5,924,671 - 3,970,176 (1,351,154) (1,309,307) (4,199) - (24,940) - (1,351,154) (1,309,307) 1,994,664 5,924,671 (24,940) 3,970,176

S-6 FISCAL YEAR 2010 ANNUAL REPORT
COMBINED INVESTMENT FUNDS
SCHEDULE OF CHANGES IN NET ASSETS BY INVESTMENT FUNDFOR THE FISCAL YEAR ENDED JUNE 30, 2009
MUTUAL CORE INFLATION EMERGING LIQUIDITY EQUITY FIXED INCOME LINKED BOND MARKET DEBT FUND FUND FUND FUND FUND ADDITIONS OPERATIONS Investment Income Dividends $ - $ 136,986,761 $ 2,416,239 $ - $ 25,241,007 Interest 34,435,214 1,094,293 171,793,662 12,472,336 75,342,282 Other Income - 4,740,295 3,584,612 15,149 - Securities Lending - 23,059,408 11,744,830 13,172,181 517,333 Total Income 34,435,214 165,880,757 189,539,343 25,659,666 101,100,622 Expenses Investment Advisory Fees 571,942 7,729,408 4,595,441 944,154 3,241,988 Custody and Transfer Agent Fees 1,000 500 - - - Professional Fees 61,477 428,461 201,704 60,170 53,434 Security Lending Fees - 2,111,513 980,091 1,258,955 40,097 Security Lending Rebates - 8,729,527 5,529,129 5,290,231 261,329 Investment Expenses - 200,046 47,959 - 108,409 Total Expenses 634,419 19,199,455 11,354,324 7,553,510 3,705,257 Net Investment Income 33,800,795 146,681,302 178,185,019 18,106,156 97,395,365 Net Realized Gain (Loss) (118,002) (1,527,195,580) (55,634,344) (33,431,634) (77,667,777) Net Change in Unrealized Gain/(Loss) on Investments and Foreign Currency (1,571,310) (885,144,418) (56,799,550) 6,044,613 (61,696,680) Net Increase (Decrease) in Net Assets Resulting from Operations 32,111,483 (2,265,658,696) 65,751,125 (9,280,865) (41,969,092) Unit Transactions Purchase of Units by Participants 4,262,166,388 - - - 177,000,000 TOTAL ADDITIONS 4,294,277,871 (2,265,658,696) 65,751,125 (9,280,865) 135,030,908 DEDUCTIONS Administrative Expenses Salary and Fringe Benefi ts (143,452) (1,042,522) (403,141) (133,576) (113,176) Distributions to Unit Owners Income Distributed (33,539,341) (142,409,677) (206,684,638) (26,128,284) (45,615,798) Unit Transactions Redemption of Units by Participants (4,251,018,707) - (1,235,821,000) (300,000,000) (4,798,000) TOTAL DEDUCTIONS (4,284,701,500) (143,452,199) (1,442,908,779) (326,261,860) (50,526,974) Change in Net Assets Held in Trust for Participants 9,576,371 (2,409,110,895) (1,377,157,654) (335,542,725) 84,503,934 Net Assets- Beginning of Period 2,161,652,395 7,999,461,775 4,537,061,465 1,172,785,411 1,047,334,629 Net Assets- End of Period $2,171,228,766 $5,590,350,880 $3,159,903,811 $837,242,686 $1,131,838,563 Other Information: Units Purchased 4,262,166,388 - - - 1,650,096 Redeemed (4,251,018,707) - (11,267,665) (2,402,691) (53,227) Net Increase (Decrease) 11,147,681 - (11,267,665) (2,402,691) 1,596,869

OFFICE OF THE STATE TREASURER, DENISE L. NAPPIER S-7
COMBINED INVESTMENT FUNDS
SCHEDULE OF CHANGES IN NET ASSETS BY INVESTMENT FUND (Continued)FOR THE FISCAL YEAR ENDED JUNE 30, 2009
DEVELOPED EMERGING HIGH YIELD- MARKET MARKET REAL COMMERCIAL PRIVATE
DEBT INTERNATIONAL INTERNATIONAL ESTATE MORTGAGE INVESTMENT ELIMINATION FUND STOCK FUND STOCK FUND FUND FUND FUND ENTRY TOTAL
$ 231,436 $ 128,686,192 $ 30,737,495 $ 20,148,337 $ 516,781 $ 54,895,772 $ - $ 399,860,020 68,921,759 1,232,239 420,912 406,674 2,371 1,461,987 (8,663,412) 358,920,317 26,516 330,691 - - - 4,344 - 8,701,607 2,182,786 12,948,255 2,560,962 - - - - 66,185,755 71,362,497 143,197,377 33,719,369 20,555,011 519,152 56,362,103 (8,663,412) 833,667,699 2,321,899 18,200,409 6,970,008 3,567,394 73,500 7,862,719 (143,893) 55,934,969 - 500 - - - - (252) 1,748 38,092 242,176 56,665 468,049 364 922,202 (15,467) 2,517,327 189,237 1,393,473 278,614 - - - - 6,251,980 955,409 2,763,059 683,824 - - - - 24,212,508 990 298,821 87,404 210,782 14 - - 954,425 3,505,627 22,898,438 8,076,515 4,246,225 73,878 8,784,921 (159,612) 89,872,957 67,856,870 120,298,939 25,642,854 16,308,786 445,274 47,577,182 (8,503,800) 743,794,742 (49,939,172) (789,853,210) (211,076,783) (15,921,318) (55) (181,552,509) 29,688 (2,942,360,696) (44,167,904) (659,994,091) (154,148,813) (298,815,024) (600,220) (177,220,802) 513,235 (2,333,600,964) (26,250,206) (1,329,548,362) (339,582,742) (298,427,556) (155,001) (311,196,129) (7,960,877) (4,532,166,918) 58,000,000 746,427,991 200,000,000 86,000,000 - 201,700,000 867,988,293 6,599,282,672 31,749,794 (583,120,371) (139,582,742) (212,427,556) (155,001) (109,496,129) 860,027,416 2,067,115,754 (78,923) (626,374) (141,674) (357,659) (18,085) (370,801) 36,090 (3,393,293) (57,719,321) (108,635,249) (16,708,680) (19,880,236) (508,827) (58,249,143) 8,438,021 (707,641,173) - - - - (1,091,960) - (1,053,008,015) (6,845,737,682) (57,798,244) (109,261,623) (16,850,354) (20,237,895) (1,618,872) (58,619,944) (1,044,533,904) (7,556,772,148)
(26,048,450) (692,381,994) (156,433,096) (232,665,451) (1,773,873) (168,116,073) (184,506,488) (5,489,656,394) 759,214,393 5,108,281,295 1,303,759,098 1,002,321,007 6,911,105 1,794,708,081 (1,021,667,976) 25,871,822,678 $733,165,943 $4,415,899,301 $1,147,326,002 $769,655,556 $5,137,232 $1,626,592,008 $(1,206,174,464) $20,382,166,284 704,073 3,030,577 982,505 1,793,138 - 3,887,834 - - - - (20,527) - 704,073 3,030,577 982,505 1,793,138 (20,527) 3,887,834

S-8 FISCAL YEAR 2010 ANNUAL REPORT
PENSION FUNDS MANAGEMENT DIVISIONCOMBINED INVESTMENT FUNDS
SCHEDULE OF INVESTMENT ACTIVITY BY PENSION PLANFOR THE FISCAL YEAR ENDING JUNE 30, 2010
MUTUAL CORE INFLATION EMERGING LIQUIDITY EQUITY FIXED INCOME LINKED BOND MARKET DEBT FUND FUND FUND FUND FUND Teachers’ Retirement Fund Book Value at June 30, 2009 $601,371,211 $1,065,529,266 $1,585,132,229 $396,310,624 $637,484,209 Market Value at June 30, 2009 $600,827,585 $3,162,911,966 $1,647,520,615 $409,901,381 $623,777,296 Shares Purchased 1,601,014,944 - - 107,820,000 - Shares Redeemed (1,222,100,130) (562,200,000) (326,349,000) (150,000) (76,640,000) Returns of Capital - - - - - Gain/(Loss) on Shares Redeemed 1,324,479 394,390,612 24,091,498 4,972 6,175,641 Net Investment Income Earned 6,749,887 52,653,639 71,846,187 10,140,706 26,258,926 Net Investment Income Distributed (6,749,887) (52,653,639) (71,846,187) (10,140,706) (26,258,926) Changes in Market Value of Fund Shares (777,105) (6,915,587) 76,222,324 31,346,615 102,702,142
Market Value at June 30, 2010 $980,289,773 $2,988,186,991 $1,421,485,437 $548,922,968 $656,015,079
Book Value at June 30, 2010 $981,610,504 $897,719,878 $1,282,874,727 $503,985,596 $567,019,850
Shares Outstanding 978,475,979 4,110,437 12,060,001 3,993,953 5,105,245
Market Value per Share $1.00 $726.98 $117.87 $137.44 $128.50 State Employees’ Retirement Fund Book Value at June 30, 2009 $279,531,124 $612,494,866 $1,058,244,987 $277,633,554 $417,713,694 Market Value at June 30, 2009 $279,284,499 $2,083,109,849 $1,102,708,090 $289,586,326 $414,145,861 Shares Purchased 762,136,222 - - 40,000,000 - Shares Redeemed (549,586,900) (364,300,000) (253,340,000) - (64,750,000) Returns of Capital - - - - - Gain/(Loss) on Shares Redeemed 715,555 269,240,141 19,572,916 - 5,369,559 Net Investment Income Earned 3,577,764 34,703,926 46,961,454 6,862,984 16,918,267 Net Investment Income Distributed (3,577,764) (34,703,926) (46,961,454) (6,862,984) (16,918,267) Changes in Market Value of Fund Shares (272,548) (14,669,781) 46,954,985 21,692,652 65,300,218
Market Value at Jun 30, 2010 $492,276,828 $1,973,380,209 $915,895,991 $351,278,978 $420,065,638
Book Value at June 30, 2010 492,796,001 517,435,007 824,477,903 317,633,554 358,333,253
Shares Outstanding 491,365,983 2,714,507 7,770,538 2,555,899 3,269,037 Market Value per Share $1.00 $726.98 $117.87 $137.44 $128.50 Municipal Employees’ Retirement Fund Book Value at June 30, 2009 $69,668,966 $82,332,337 $284,999,955 $114,224,641 $76,995,683 Market Value at June 30, 2009 $69,606,721 $286,240,301 $294,261,605 $115,978,170 $74,193,368 Shares Purchased 132,938,420 - - 11,500,000 - Shares Redeemed (56,114,554) (50,400,000) (59,796,000) - (8,900,000) Returns of Capital - - - - - Gain/(Loss) on Shares Redeemed 101,515 37,546,297 4,017,314 - 526,394 Net Investment Income Earned 870,335 4,767,885 12,743,670 2,776,266 3,113,843 Net Investment Income Distributed (870,335) (4,767,885) (12,743,670) (2,776,266) (3,113,843) Changes in Market Value of Fund Shares (14,137) (2,519,128) 13,828,276 8,621,089 12,364,258
Market Value at Jun 30, 2010 $146,517,965 $270,867,470 $252,311,195 $136,099,259 $78,184,020
Book Value at June 30, 2010 146,594,347 69,478,634 229,221,269 125,724,641 68,622,077
Shares Outstanding 146,246,866 372,595 2,140,629 990,256 608,444
Market Value per Share $1.00 $726.98 $117.87 $137.44 $128.50

OFFICE OF THE STATE TREASURER, DENISE L. NAPPIER S-9
DEVELOPED EMERGING HIGH YIELD MARKET MARKET REAL COMMERCIAL PRIVATE DEBT INTERNATIONAL INTERNATIONAL ESTATE MORTGAGE INVESTMENT FUND STOCK FUND STOCK FUND FUND FUND FUND TOTAL
$429,429,053 $2,161,823,166 $404,996,878 $644,635,686 $4,237,586 $1,534,511,271 $9,465,461,178 $408,703,567 $2,544,193,415 $645,686,803 $433,701,795 $2,801,732 $916,655,606 $11,396,681,762 - - 326,864,000 113,868,800 - 103,761,100 2,253,328,844 (85,571,095) (251,905,000) (1,500,000) - (690,994) - (2,527,106,219) - - - - - - - 5,785,832 70,381,253 639,458 - (326,928) - 502,466,817 31,467,764 48,147,276 14,305,278 7,809,802 213,140 51,805,776 321,398,381 (31,467,764) (48,147,276) (14,305,278) (7,809,802) (213,140) (51,805,776) (321,398,381) 55,234,627 182,203,312 197,536,983 (106,076,318) 303,037 116,404,206 648,184,236
$384,152,931 $2,544,872,980 $1,169,227,244 $441,494,277 $2,086,847 $1,136,820,912 $12,273,555,439
$349,643,790 $1,980,299,419 $731,000,336 $758,504,486 $3,219,664 $1,638,272,371 $9,694,150,621
3,378,967 8,609,674 3,567,418 14,522,929 43,023 22,906,141 1,056,773,768
$113.69 $295.58 $327.75 $30.40 $48.51 $49.63 $285,750,721 $1,265,854,419 $253,049,266 $416,435,047 $2,969,182 $1,008,857,699 $5,878,534,559 $261,829,983 $1,612,683,866 $414,859,773 $276,024,130 $1,973,645 $584,637,690 $7,320,843,712 - - 212,848,000 74,550,400 - 64,250,100 1,153,784,722 (53,828,060) (146,200,000) - - (486,762) - (1,432,491,722) - - - - - - - 1,733,598 50,011,572 - - (226,469) - 346,416,872 20,232,184 30,767,826 9,208,195 5,006,620 150,143 33,253,636 207,642,999 (20,232,184) (30,767,826) (9,208,195) (5,006,620) (150,143) (33,253,636) (207,642,999) 37,420,267 110,673,467 127,104,836 (68,020,750) 209,651 74,660,721 401,053,718
$247,155,788 $1,627,168,905 $754,812,609 $282,553,780 $1,470,065 $723,548,511 $7,789,607,302
233,656,259 1,169,665,991 465,897,266 490,985,447 2,255,951 1,073,107,799 5,946,244,431
2,173,955 5,504,948 2,303,001 9,294,591 30,307 14,578,993 541,561,761
$113.69 $295.58 $327.75 $30.40 $48.51 $49.63 $51,351,295 $151,603,090 $47,634,043 $75,532,874 $461,805 $178,187,322 $1,132,992,011 $46,996,607 $223,428,802 $74,879,338 $51,106,840 $309,151 $108,094,611 $1,345,095,513 - - 30,814,000 12,562,400 - 11,297,000 199,111,820 (9,102,523) (17,250,000) - - (76,248) - (201,639,325) - - - - - - - 280,933 7,435,895 - - (34,684) - 49,873,664 3,660,713 4,285,338 1,625,631 913,764 23,519 6,091,534 40,872,498 (3,660,713) (4,285,338) (1,625,631) (913,764) (23,519) (6,091,534) (40,872,498) 6,758,334 14,565,993 23,335,533 (12,409,208) 32,052 13,616,319 78,179,381
$44,933,351 $228,180,690 $129,028,871 $51,260,032 $230,271 $133,007,930 $1,470,621,054
42,529,705 141,788,985 78,448,043 88,095,274 350,873 189,484,322 1,180,338,170
395,229 771,968 393,679 1,686,196 4,747 2,680,016 156,290,625
$113.69 $295.58 $327.75 $30.40 $48.51 $49.63
PENSION FUNDS MANAGEMENT DIVISIONCOMBINED INVESTMENT FUNDS
SCHEDULE OF INVESTMENT ACTIVITY BY PENSION PLAN (Continued)FOR THE FISCAL YEAR ENDING JUNE 30, 2010

S-10 FISCAL YEAR 2010 ANNUAL REPORT
PENSION FUNDS MANAGEMENT DIVISIONCOMBINED INVESTMENT FUNDS
SCHEDULE OF INVESTMENT ACTIVITY BY PENSION PLAN (Continued)FOR THE FISCAL YEAR ENDING JUNE 30, 2010
MUTUAL CORE INFLATION EMERGING LIQUIDITY EQUITY FIXED INCOME LINKED BOND MARKET DEBT FUND FUND FUND FUND FUND Probate Court Retirement Fund Book Value at June 30, 2009 $4,685,213 $4,025,351 $13,107,887 $4,550,209 $3,763,953 Market Value at June 30, 2009 $4,680,899 $14,435,746 $13,898,180 $4,634,219 $3,682,044 Shares Purchased 5,453,694 - - 1,660,000 - Shares Redeemed (3,500,234) (2,500,000) (2,364,000) - (470,000) Returns of Capital - - - - - Gain/(Loss) on Shares Redeemed 7,600 1,879,957 214,789 - 33,407 Net Investment Income Earned 42,910 240,404 617,827 124,240 153,436 Net Investment Income Distributed (42,910) (240,404) (617,827) (124,240) (153,436) Changes in Market Value of Fund Shares 3,983 (121,493) 638,318 359,458 603,124
Market Value at June 30, 2010 $6,645,942 $13,694,210 $12,387,287 $6,653,677 $3,848,575
Book Value at June 30, 2010 6,646,273 3,405,308 10,958,676 6,210,209 3,327,360
Shares Outstanding 6,633,642 18,837 105,095 48,412 29,950
Market Value per Share $1.00 $726.98 $117.87 $137.44 $128.50 Judges’ Retirement Fund Book Value at June 30, 2009 $6,598,973 $13,491,385 $32,915,860 $13,389,682 $8,433,783 Market Value at June 30, 2009 $6,593,172 $31,279,920 $33,511,252 $13,563,243 $8,062,467 Shares Purchased 19,376,968 - - 1,520,000 - Shares Redeemed (18,008,296) (6,100,000) (8,651,000) - (1,140,000) Returns of Capital - - - - - Gain/(Loss) on Shares Redeemed 13,035 3,796,838 489,832 - 63,988 Net Investment Income Earned 62,857 519,631 1,394,263 326,615 334,424 Net Investment Income Distributed (62,857) (519,631) (1,394,263) (326,615) (334,424) Changes in Market Value of Fund Shares (7,346) 111,348 1,517,942 1,010,391 1,330,173
Market Value at Jun 30, 2010 $7,967,533 $29,088,106 $26,868,026 $16,093,634 $8,316,628
Book Value\Cost at Jun 30, 2010 7,980,680 11,188,223 24,754,692 14,909,682 7,357,771
Book Value at June 30, 2010 7,952,793 40,012 227,951 117,097 64,722
Market Value per Share $1.00 $726.98 $117.87 $137.44 $128.50 State’s Attorneys’ Retirement Fund Book Value at June 30, 2009 $127,706 $37,049 $435,160 $17,299 $45,435 Market Value at June 30, 2009 $127,589 $141,509 $446,259 $20,732 $46,206 Shares Purchased 70,212 - - - - Shares Redeemed (7,596) - - - - Returns of Capital - - - - - Gain/(Loss) on Shares Redeemed 23 - - - - Net Investment Income Earned 1,309 2,620 22,519 472 2,094 Net Investment Income Distributed (1,309) (2,620) (22,519) (472) (2,094) Changes in Market Value of Fund Shares 225 17,176 29,491 1,516 8,427
Market Value at Jun 30, 2010 $190,453 $158,685 $475,750 $22,248 $54,633
Book Value\Cost at Jun 30, 2010 190,345 37,049 435,160 17,299 45,435
Book Value at June 30, 2010 190,100 218 4,036 162 425
Market Value per Share $1.00 $726.98 $117.87 $137.44 $128.50

OFFICE OF THE STATE TREASURER, DENISE L. NAPPIER S-11
DEVELOPED EMERGING HIGH YIELD MARKET MARKET REAL COMMERCIAL PRIVATE DEBT INTERNATIONAL INTERNATIONAL ESTATE MORTGAGE INVESTMENT FUND STOCK FUND STOCK FUND FUND FUND FUND TOTAL
$2,471,379 $7,312,843 $2,294,710 $3,796,709 $27,599 $7,904,409 $53,940,262 $2,296,081 $11,086,606 $3,722,305 $2,517,226 $18,169 $5,334,070 $66,305,544 - - 1,456,000 605,800 - 507,400 9,682,894 (438,293) (1,200,000) - - (4,482) - (10,477,009) - - - - - - - 19,909 540,760 - - (2,151) - 2,694,271 179,216 210,317 80,250 44,877 1,382 299,040 1,993,899 (179,216) (210,317) (80,250) (44,877) (1,382) (299,040) (1,993,899) 324,202 587,380 1,158,860 (609,396) 2,000 668,966 3,615,402
$2,201,899 $11,014,746 $6,337,165 $2,513,630 $13,536 $6,510,436 $71,821,103
2,052,995 6,653,603 3,750,710 4,402,509 20,966 8,411,809 55,840,418
19,368 37,264 19,335 82,686 279 131,181 7,126,049
$113.69 $295.58 $327.75 $30.40 $48.51 $49.63 $5,543,161 $17,887,599 $5,501,959 $8,294,612 $45,383 $19,288,254 $131,390,652 $4,986,372 $24,506,612 $8,177,783 $5,586,493 $30,457 $11,870,031 $148,167,802 - - 3,018,000 1,041,800 - 639,400 25,596,168 (1,060,029) (3,345,000) - - (7,511) - (38,311,836) - - - - - - - 20,983 1,315,003 - - (3,391) - 5,696,288 387,587 459,633 175,737 96,949 2,317 647,320 4,407,333 (387,587) (459,633) (175,737) (96,949) (2,317) (647,320) (4,407,333) 730,006 1,246,628 2,562,900 (1,327,621) 3,128 1,449,078 8,626,627
$4,677,332 $23,723,243 $13,758,683 $5,300,672 $22,683 $13,958,509 $149,775,049
4,504,115 15,857,602 8,519,959 9,336,412 34,481 19,927,654 124,371,271
41,141 80,259 41,979 174,365 468 281,254 9,022,041
$113.69 $295.58 $327.75 $30.40 $48.51 $49.63 $53,177 $- $- $45,799 $- $- $761,625 $48,447 $- $- $32,805 $- $- $863,547 - - - 8,250 - - 78,462 - - - - - - (7,596) - - - - - - - - - - - - - 23 4,189 - - 588 - - 33,791 (4,189) - - (588) - - (33,791) 7,482 - - (7,971) - - 56,346
$55,929 $- $- $33,084 $- $- $990,782
53,177 - - 54,049 - - 832,514
492 - - 1,088 - - 196,522
$113.69 $- $- $30.40 $- $-
PENSION FUNDS MANAGEMENT DIVISIONCOMBINED INVESTMENT FUNDS
SCHEDULE OF INVESTMENT ACTIVITY BY PENSION PLAN (Continued)FOR THE FISCAL YEAR ENDING JUNE 30, 2010

S-12 FISCAL YEAR 2010 ANNUAL REPORT
PENSION FUNDS MANAGEMENT DIVISIONCOMBINED INVESTMENT FUNDS
SCHEDULE OF INVESTMENT ACTIVITY BY TRUSTFOR THE FISCAL YEAR ENDING JUNE 30, 2010
MUTUAL CORE INFLATION EMERGING LIQUIDITY EQUITY FIXED INCOME LINKED BOND MARKET DEBT FUND FUND FUND FUND FUND Soldiers’ Sailors’ & Marines’ Fund Book Value at June 30, 2009 $606,749 $983,642 $37,929,520 $1,725,943 $4,533,494 Market Value at June 30, 2009 $606,449 $3,992,473 $40,323,946 $2,125,588 $4,737,600 Shares Purchased 3,067,225 - - - - Shares Redeemed (3,021,999) - - - - Returns of Capital - - - - - Gain/(Loss) on Shares Redeemed 1,058 - - - - Net Investment Income Earned 5,442 73,903 2,034,728 48,546 214,564 Net Investment Income Distributed (5,442) (73,903) (2,034,728) (48,546) (214,564) Changes in Market Value of Fund Shares (534) 484,529 2,664,902 155,375 864,021
Market Value at June 30, 2010 $652,199 $4,477,002 $42,988,848 $2,280,963 $5,601,621
Book Value at June 30, 2010 653,033 983,642 37,929,520 1,725,943 4,533,494
Shares Outstanding 650,992 6,158 364,721 16,596 43,593
Market Value per Share $1.00 $726.98 $117.87 $137.44 $128.50 Endowment for the Arts Book Value at June 30, 2009 $1,150,970 $- $11,040,873 $502,392 $1,319,527 Market Value at June 30, 2009 $1,149,949 $- $11,215,770 $591,204 $1,317,599 Shares Purchased 931,182 - - - - Shares Redeemed (1,013,747) - - - - Returns of Capital - - - - - Gain/(Loss) on Shares Redeemed 2,577 - - - - Net Investment Income Earned 8,060 - 565,941 13,503 59,673 Net Investment Income Distributed (8,060) - (565,941) (13,503) (59,673) Changes in Market Value of Fund Shares 1,181 - 741,221 43,213 240,299
Market Value at Jun 30, 2010 $1,071,142 $- $11,956,991 $634,417 $1,557,898
Book Value at June 30, 2010 1,070,982 - 11,040,873 502,392 1,319,527
Shares Outstanding 1,069,156 - 101,444 4,616 12,124
Market Value per Share $1.00 $- $117.87 $137.44 $128.50 Agricultural College Fund Book Value at June 30, 2009 $48,883 $25,364 $302,380 $13,760 $36,140 Market Value at June 30, 2009 $48,838 $105,176 $312,915 $16,495 $36,763 Shares Purchased 24,818 - - - - Shares Redeemed (27,968) - - - - Returns of Capital - - - - - Gain/(Loss) on Shares Redeemed 15 - - - - Net Investment Income Earned 307 1,946 15,790 376 1,665 Net Investment Income Distributed (307) (1,946) (15,790) (376) (1,665) Changes in Market Value of Fund Shares 50 12,766 20,679 1,205 6,703
Market Value at Jun 30, 2010 $45,753 $117,942 $333,594 $17,700 $43,466
Book Value at June 30, 2010 45,748 25,364 302,380 13,760 36,140
Shares Outstanding 45,669 162 2,830 129 338
Market Value per Share $1.00 $726.98 $117.87 $137.44 $128.50

OFFICE OF THE STATE TREASURER, DENISE L. NAPPIER S-13
DEVELOPED EMERGING HIGH YIELD MARKET MARKET REAL COMMERCIAL PRIVATE DEBT INTERNATIONAL INTERNATIONAL ESTATE MORTGAGE INVESTMENT FUND STOCK FUND STOCK FUND FUND FUND FUND TOTAL
$5,301,306 $- $- $- $- $- $51,080,654 $4,935,796 $- $- $- $- $- $56,721,852 - - - - - - 3,067,225 - - - - - - (3,021,999) - - - - - - - - - - - - - 1,058 426,871 - - - - - 2,804,054 (426,871) - - - - - (2,804,054) 762,154 - - - - - 4,930,447
$5,697,950 $- $- $- $- $- $61,698,583
5,301,306 - - - - - 51,126,938
50,119 - - - - - 1,132,180
$113.69 $- $- $- $- $- $1,545,250 $- $- $- $- $- $15,559,012 $1,387,609 $- $- $- $- $- $15,662,131 - - - - - - 931,182 - - - - - - (1,013,747) - - - - - - - - - - - - - 2,577 120,006 - - - - - 767,183 (120,006) - - - - - (767,183) 214,262 - - - - - 1,240,176
$1,601,871 $- $- $- $- $- $16,822,319
1,545,250 - - - - - 15,479,024
14,090 - - - - - 1,201,430
$113.69 $- $- $- $- $- $42,296 $- $- $- $- $- $468,823 $38,542 $- $- $- $- $- $558,729 - - - - - - 24,818 - - - - - - (27,968) - - - - - - - - - - - - - 15 3,335 - - - - - 23,419 (3,335) - - - - - (23,419) 5,953 - - - - - 47,356
$44,495 $- $- $- $- $- $602,950
42,296 - - - - - 465,688
391 - - - - - 49,519
$113.69 $- $- $- $- $-
PENSION FUNDS MANAGEMENT DIVISIONCOMBINED INVESTMENT FUNDS
SCHEDULE OF INVESTMENT ACTIVITY BY TRUST (Continued)FOR THE FISCAL YEAR ENDING JUNE 30, 2010

S-14 FISCAL YEAR 2010 ANNUAL REPORT
PENSION FUNDS MANAGEMENT DIVISIONCOMBINED INVESTMENT FUNDS
SCHEDULE OF INVESTMENT ACTIVITY BY TRUST (Continued)FOR THE FISCAL YEAR ENDING JUNE 30, 2010
MUTUAL CORE INFLATION EMERGING LIQUIDITY EQUITY FIXED INCOME LINKED BOND MARKET DEBT FUND FUND FUND FUND FUND Ida Eaton Cotton Fund Book Value at June 30, 2009 $164,272 $87,363 $1,021,247 $46,470 $122,060 Market Value at June 30, 2009 $164,122 $358,376 $1,064,766 $56,127 $125,093 Shares Purchased 80,018 - - - - Shares Redeemed (90,719) - - - - Returns of Capital - - - - - Gain/(Loss) on Shares Redeemed 36 - - - - Net Investment Income Earned 1,027 6,634 53,729 1,282 5,664 Net Investment Income Distributed (1,027) (6,634) (53,729) (1,282) (5,664) Changes in Market Value of Fund Shares 182 43,495 70,366 4,103 22,814
Market Value at June 30, 2010 $153,639 $401,871 $1,135,132 $60,230 $147,907
Book Value at June 30, 2010 153,607 87,363 1,021,247 46,470 122,060
Shares Outstanding 153,355 553 9,631 438 1,151
Market Value per Share $1.00 $726.98 $117.87 $137.44 $128.50 Andrew Clark Fund Book Value at June 30, 2009 $78,489 $41,101 $495,688 $22,555 $59,240 Market Value at June 30, 2009 $78,416 $167,656 $500,623 $26,388 $58,812 Shares Purchased 50,641 - - - - Shares Redeemed (55,648) - - - - Returns of Capital - - - - - Gain/(Loss) on Shares Redeemed 27 - - - - Net Investment Income Earned 520 3,102 25,262 603 2,663 Net Investment Income Distributed (520) (3,102) (25,262) (603) (2,663) Changes in Market Value of Fund Shares 62 20,348 33,085 1,929 10,724
Market Value at Jun 30, 2010 $73,498 $188,004 $533,708 $28,317 $69,536
Book Value at June 30, 2010 73,509 41,101 495,688 22,555 59,240
Shares Outstanding 73,362 259 4,528 206 541
Market Value per Share $1.00 $726.98 $117.87 $137.44 $128.50 School Fund Book Value at June 30, 2009 $461,575 $384,307 $4,757,413 $216,479 $568,594 Market Value at June 30, 2009 $461,172 $1,576,067 $4,925,234 $259,620 $578,627 Shares Purchased 410,697 - - - - Shares Redeemed (425,420) - - - - Returns of Capital - - - - - Gain/(Loss) on Shares Redeemed 1,036 - - - - Net Investment Income Earned 4,780 29,174 248,525 5,931 26,207 Net Investment Income Distributed (4,780) (29,174) (248,525) (5,931) (26,207) Changes in Market Value of Fund Shares 583 191,275 325,494 18,977 105,527
Market Value at Jun 30, 2010 $448,068 $1,767,342 $5,250,728 $278,597 $684,154
Book Value at June 30, 2010 447,888 384,307 4,757,413 216,479 568,594
Shares Outstanding 447,239 2,431 44,548 2,027 5,324
Market Value per Share $1.00 $726.98 $117.87 $137.44 $128.50

OFFICE OF THE STATE TREASURER, DENISE L. NAPPIER S-15
DEVELOPED EMERGING HIGH YIELD MARKET MARKET REAL COMMERCIAL PRIVATE DEBT INTERNATIONAL INTERNATIONAL ESTATE MORTGAGE INVESTMENT FUND STOCK FUND STOCK FUND FUND FUND FUND TOTAL
$142,819 $- $- $- $- $- $1,584,231 $130,925 $- $- $- $- $- $1,899,409 - - - - - - 80,018 - - - - - - (90,719) - - - - - - - - - - - - - 36 11,322 - - - - - 79,658 (11,322) - - - - - (79,658) 20,214 - - - - - 161,174
$151,139 $- $- $- $- $- $2,049,918
142,819 - - - - - 1,573,566
1,329 - - - - - 166,457
$113.69 $- $- $- $- $- $69,389 $- $- $- $- $- $766,462 $62,024 $- $- $- $- $- $893,919 - - - - - - 50,641 - - - - - - (55,648) - - - - - - - - - - - - - 27 5,365 - - - - - 37,515 (5,365) - - - - - (37,515) 9,577 - - - - - 75,725
$71,601 $- $- $- $- $- $964,664
69,389 - - - - - 761,482
630 - - - - - 79,526
$113.69 $- $- $- $- $- $665,451 $- $- $- $- $- $7,053,819 $606,610 $- $- $- $- $- $8,407,330 - - - - - - 410,697 - - - - - - (425,420) - - - - - - - - - - - - - 1,036 52,464 - - - - - 367,081 (52,464) - - - - - (367,081) 93,668 - - - - - 735,524
$700,278 $- $- $- $- $- $9,129,167
665,451 - - - - - 7,040,132
6,160 - - - - - 507,729
$113.69 $- $- $- $- $-
PENSION FUNDS MANAGEMENT DIVISIONCOMBINED INVESTMENT FUNDS
SCHEDULE OF INVESTMENT ACTIVITY BY TRUST (Continued)FOR THE FISCAL YEAR ENDING JUNE 30, 2010

S-16 FISCAL YEAR 2010 ANNUAL REPORT
PENSION FUNDS MANAGEMENT DIVISIONCOMBINED INVESTMENT FUNDS
SCHEDULE OF INVESTMENT ACTIVITY BY TRUST (Continued)FOR THE FISCAL YEAR ENDING JUNE 30, 2010
MUTUAL CORE INFLATION EMERGING LIQUIDITY EQUITY FIXED INCOME LINKED BOND MARKET DEBT FUND FUND FUND FUND FUND Hopemead Fund Book Value at June 30, 2009 $256,075 $94,338 $1,240,840 $54,187 $142,321 Market Value at June 30, 2009 $255,836 $384,141 $1,254,833 $63,632 $141,816 Shares Purchased 102,517 - - - - Shares Redeemed (8,856) - - - - Returns of Capital - - - - - Gain/(Loss) on Shares Redeemed 18 - - - - Net Investment Income Earned 2,434 7,112 63,318 1,453 6,421 Net Investment Income Distributed (2,434) (7,112) (63,318) (1,453) (6,421) Changes in Market Value of Fund Shares 567 46,618 82,927 4,652 25,865
Market Value at June 30, 2010 $350,082 $430,759 $1,337,760 $68,284 $167,681
Book Value at June 30, 2010 349,754 94,338 1,240,840 54,187 142,321
Shares Outstanding 349,435 593 11,350 497 1,305
Market Value per Share $1.00 $726.98 $117.87 $137.44 $128.50 Police & Fireman’s Survivors’ Benefi t Fund Book Value at June 30, 2009 $1,170,118 $6,467,744 $8,140,446 $370,407 $972,808 Market Value at June 30, 2009 $1,169,055 $5,647,700 $7,959,723 $419,563 $935,011 Shares Purchased 649,304 - - - - Shares Redeemed (595,059) - - - - Returns of Capital - - - - - Gain/(Loss) on Shares Redeemed 1,303 - - - - Net Investment Income Earned 9,693 104,544 401,644 9,582 42,346 Net Investment Income Distributed (9,693) (104,544) (401,644) (9,582) (42,346) Changes in Market Value of Fund Shares 1,754 685,405 526,039 30,665 170,521
Market Value at Jun 30, 2010 $1,226,357 $6,333,105 $8,485,762 $450,228 $1,105,532
Book Value at June 30, 2010 1,225,666 6,467,744 8,140,446 370,407 972,808
Shares Outstanding 1,224,085 8,712 71,994 3,276 8,603
Market Value per Share $1.00 $726.98 $117.87 $137.44 $128.50

OFFICE OF THE STATE TREASURER, DENISE L. NAPPIER S-17
DEVELOPED EMERGING HIGH YIELD MARKET MARKET REAL COMMERCIAL PRIVATE DEBT INTERNATIONAL INTERNATIONAL ESTATE MORTGAGE INVESTMENT FUND STOCK FUND STOCK FUND FUND FUND FUND TOTAL
$166,677 $- $- $- $- $- $1,954,438 $149,426 $- $- $- $- $- $2,249,684 - - - - - - 102,517 - - - - - - (8,856) - - - - - - - - - - - - - 18 12,923 - - - - - 93,661 (12,923) - - - - - (93,661) 23,075 - - - - - 183,704
$172,501 $- $- $- $- $- $2,527,067
166,677 - - - - - 2,048,117
1,517 - - - - - 364,696
$113.69 $- $- $- $- $- $1,140,668 $- $- $985,066 $6,350 $- $19,253,607 $993,954 $- $- $686,267 $4,077 $- $17,815,350 - - - 150,900 - - 800,204 - - - - (1,003) - (596,062) - - - - - - - - - - - (517) - 786 85,962 - - 12,056 311 - 666,138 (85,962) - - (12,056) (311) - (666,138) 153,480 - - (163,661) 484 - 1,404,687
$1,147,434 $- $- $673,506 $3,041 $- $19,424,965
1,140,668 - - 1,135,966 4,830 - 19,458,535
10,093 - - 22,155 63 - 1,348,981
$113.69 $- $- $30.40 $48.51 $-
PENSION FUNDS MANAGEMENT DIVISIONCOMBINED INVESTMENT FUNDS
SCHEDULE OF INVESTMENT ACTIVITY BY TRUST (Continued)FOR THE FISCAL YEAR ENDING JUNE 30, 2010
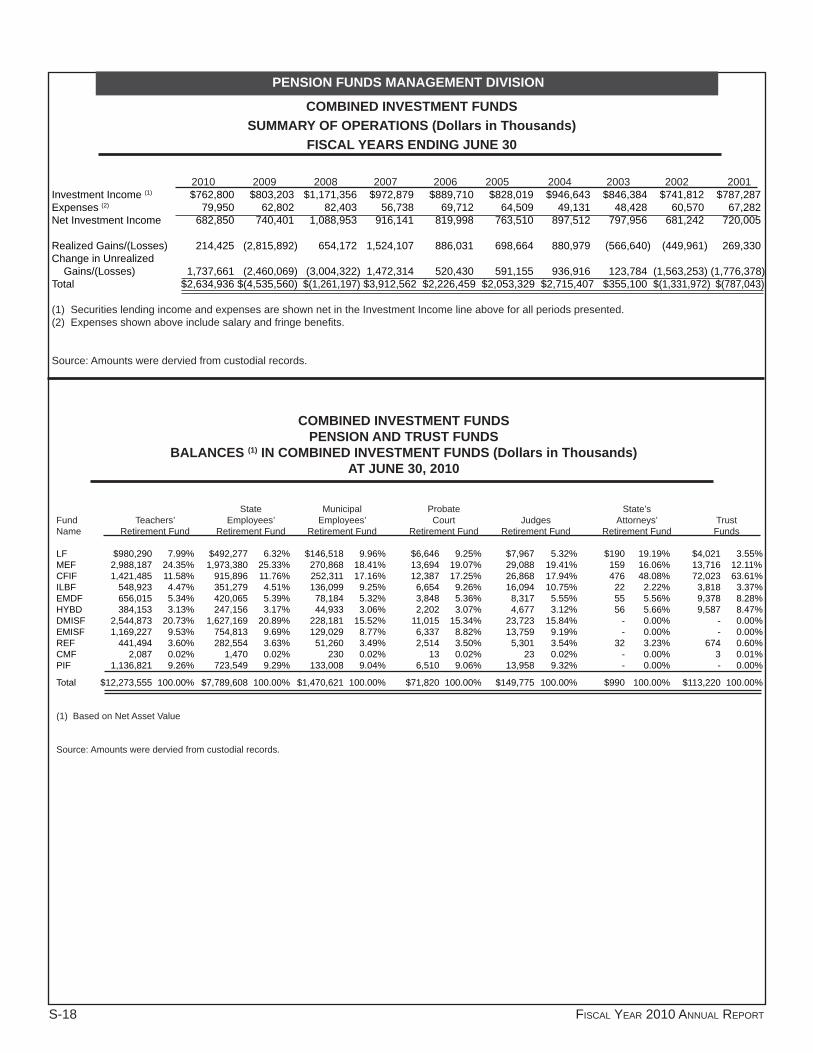
S-18 FISCAL YEAR 2010 ANNUAL REPORT
PENSION FUNDS MANAGEMENT DIVISION
COMBINED INVESTMENT FUNDSSUMMARY OF OPERATIONS (Dollars in Thousands)
FISCAL YEARS ENDING JUNE 30
2010 2009 2008 2007 2006 2005 2004 2003 2002 2001Investment Income (1) $762,800 $803,203 $1,171,356 $972,879 $889,710 $828,019 $946,643 $846,384 $741,812 $787,287 Expenses (2) 79,950 62,802 82,403 56,738 69,712 64,509 49,131 48,428 60,570 67,282Net Investment Income 682,850 740,401 1,088,953 916,141 819,998 763,510 897,512 797,956 681,242 720,005
Realized Gains/(Losses) 214,425 (2,815,892) 654,172 1,524,107 886,031 698,664 880,979 (566,640) (449,961) 269,330Change in Unrealized Gains/(Losses) 1,737,661 (2,460,069) (3,004,322) 1,472,314 520,430 591,155 936,916 123,784 (1,563,253) (1,776,378)Total $2,634,936 $(4,535,560) $(1,261,197) $3,912,562 $2,226,459 $2,053,329 $2,715,407 $355,100 $(1,331,972) $(787,043)
(1) Securities lending income and expenses are shown net in the Investment Income line above for all periods presented. (2) Expenses shown above include salary and fringe benefi ts.
Source: Amounts were dervied from custodial records.
COMBINED INVESTMENT FUNDSPENSION AND TRUST FUNDS
BALANCES (1) IN COMBINED INVESTMENT FUNDS (Dollars in Thousands)AT JUNE 30, 2010
State Municipal Probate State’s Fund Teachers’ Employees’ Employees’ Court Judges Attorneys’ Trust Name Retirement Fund Retirement Fund Retirement Fund Retirement Fund Retirement Fund Retirement Fund Funds
LF $980,290 7.99% $492,277 6.32% $146,518 9.96% $6,646 9.25% $7,967 5.32% $190 19.19% $4,021 3.55%MEF 2,988,187 24.35% 1,973,380 25.33% 270,868 18.41% 13,694 19.07% 29,088 19.41% 159 16.06% 13,716 12.11%CFIF 1,421,485 11.58% 915,896 11.76% 252,311 17.16% 12,387 17.25% 26,868 17.94% 476 48.08% 72,023 63.61%ILBF 548,923 4.47% 351,279 4.51% 136,099 9.25% 6,654 9.26% 16,094 10.75% 22 2.22% 3,818 3.37%EMDF 656,015 5.34% 420,065 5.39% 78,184 5.32% 3,848 5.36% 8,317 5.55% 55 5.56% 9,378 8.28%HYBD 384,153 3.13% 247,156 3.17% 44,933 3.06% 2,202 3.07% 4,677 3.12% 56 5.66% 9,587 8.47%DMISF 2,544,873 20.73% 1,627,169 20.89% 228,181 15.52% 11,015 15.34% 23,723 15.84% - 0.00% - 0.00%EMISF 1,169,227 9.53% 754,813 9.69% 129,029 8.77% 6,337 8.82% 13,759 9.19% - 0.00% - 0.00%REF 441,494 3.60% 282,554 3.63% 51,260 3.49% 2,514 3.50% 5,301 3.54% 32 3.23% 674 0.60%CMF 2,087 0.02% 1,470 0.02% 230 0.02% 13 0.02% 23 0.02% - 0.00% 3 0.01%PIF 1,136,821 9.26% 723,549 9.29% 133,008 9.04% 6,510 9.06% 13,958 9.32% - 0.00% - 0.00%
Total $12,273,555 100.00% $7,789,608 100.00% $1,470,621 100.00% $71,820 100.00% $149,775 100.00% $990 100.00% $113,220 100.00%
(1) Based on Net Asset Value
Source: Amounts were dervied from custodial records.

OFFICE OF THE STATE TREASURER, DENISE L. NAPPIER S-19
PENSION FUNDS MANAGEMENT DIVISION
COMBINED INVESTMENT FUNDSINVESTMENT SUMMARY AT JUNE 30, 2010 (1)
Liquidity Fund (2) Mutual Equity Fund Book Market % of Total Rate of Book Market % of Total Rate of Value Value Fund MV Return Value Value Fund MV Return
2010 $1,626,177,183 $1,621,182,259 7.44% 0.98% $5,175,570,747 $5,288,853,566 24.28% 14.01%2009 952,212,787 $950,605,428 4.65% 1.54% 6,019,782,554 5,588,272,211 27.35% -28.36%2008 1,140,821,830 1,140,821,830 4.36% 4.59% 7,563,373,750 8,017,007,807 30.68% -12.99%2007 236,297,695 236,297,695 0.88% 5.61% 7,628,304,018 9,810,773,724 36.64% 18.24%2006 280,548,978 280,548,978 1.20% 4.51% 7,501,163,477 8,983,043,768 38.25% 10.29%2005 395,948,288 395,948,288 1.84% 2.36% 6,991,797,244 8,284,992,409 38.40% 8.06%2004 363,170,856 363,170,856 1.76% 1.28% 6,544,070,199 7,779,104,677 37.67% 20.86%2003 710,832,993 710,832,993 3.75% 1.80% 6,047,280,312 6,603,061,918 34.77% 0.48%2002 481,664,484 481,664,484 2.46% 3.03% 6,401,472,709 6,688,728,705 34.20% -14.95%2001 391,346,777 391,346,777 1.85% 6.35% 6,649,619,519 7,949,775,481 37.49% -9.55%
Mutual Fixed Income Fund (6) Core Fixed Income Fund (6)
Book Market % of Total Rate of Book Market % of Total Rate of Value Value Fund MV Return Value Value Fund MV Return
2010 $ - $ - - - $2,682,943,303 $2,789,605,943 12.81% 11.81%2009 - - - - $3,400,625,343 $3,215,718,047 15.74% 2.84%2008 - - - - 4,979,684,914 4,851,300,830 18.57% 5.65%2007 8,604,509,537 8,537,943,917 31.89% 6.92% - - - -2006 7,179,817,139 7,052,537,386 30.03% 0.77% - - - -2005 6,567,168,651 6,662,163,634 30.88% 7.70% - - - -2004 6,368,703,625 6,325,884,136 30.63% 2.79% - - - -2003 7,082,889,175 7,308,417,293 38.49% 12.03% - - - -2002 7,412,105,698 7,295,007,838 37.30% 5.64% - - - -2001 7,363,064,249 7,218,746,648 34.04% 8.03% - - - -
Infl ation Linked Bond Fund (6) Emerging Market Debt Fund (6)
Book Market % of Total Rate of Book Market % of Total Rate of Value Value Fund MV Return Value Value Fund MV Return
2010 $1,033,720,440 $1,070,660,872 4.91% 9.48% $1,082,027,071 $1,155,351,613 5.30% 23.02%2009 813,926,651 829,543,021 4.06% -0.20% 1,153,012,696 1,125,226,197 5.51% -3.62%2008 1,152,973,047 1,162,545,028 4.45% 16.81% 1,006,342,436 1,040,295,964 3.98% 5.59%2007 - - - - - - - -2006 - - - - - - - -2005 - - - - - - - -2004 - - - - - - - -2003 - - - - - - - -2002 - - - - - - - -2001 - - - - - - - -

S-20 FISCAL YEAR 2010 ANNUAL REPORT
PENSION FUNDS MANAGEMENT DIVISIONCOMBINED INVESTMENT FUNDS
INVESTMENT SUMMARY AT JUNE 30, 2010 (1) (Continued)
High Yield Debt Fund (6) International Stock Fund (5)
Book Market % of Total Rate of Book Market % of Total Rate of Value Value Fund MV Return Value Value Fund MV Return
2010 $659,015,939 $656,175,724 3.01% 24.54% $ - $ - - -2009 801,755,724 718,563,903 3.52% -4.59% - - - -2008 784,159,491 745,137,049 2.85% -1.88% - - - -2007 - - - - 4,293,498,472 5,940,213,814 22.19% 29.65%2006 - - - - 4,145,802,552 5,392,666,574 22.96% 25.69%2005 - - - - 3,587,545,036 4,372,185,115 20.27% 19.23%2004 - - - - 3,407,481,400 3,995,868,265 19.35% 29.69%2003 - - - - 2,047,590,656 2,026,297,000 10.67% -6.39%2002 - - - - 2,306,936,221 2,272,810,463 11.62% -9.00%2001 - - - - 2,449,711,883 2,466,657,788 11.63% -13.29%
Developed Market International Stock Fund (5) Emerging Market International Stock Fund (5)
Book Market % of Total Rate of Book Market % of Total Rate of Value Value Fund MV Return Value Value Fund MV Return
2010 $4,552,279,820 $4,328,450,937 19.87% 11.03% $1,860,837,675 $2,065,255,957 9.48% 25.23%2009 4,847,669,826 4,464,491,006 21.85% -27.98% 1,110,911,776 1,141,401,975 5.59% -30.90%2008 4,879,325,913 5,077,825,949 19.43% -14.60% 1,111,317,184 1,295,936,888 4.96% 0.19%2007 - - - - - - - -2006 - - - - - - - -2005 - - - - - - - -2004 - - - - - - - -2003 - - - - - - - -2002 - - - - - - - -2001 - - - - - - - -
Real Estate Fund (3) Commercial Mortgage Fund (3)
Book Market % of Total Rate of Book Market % of Total Rate of Value Value Fund MV Return Value Value Fund MV Return
2010 $1,174,718,491 $792,483,221 3.64% -20.18% $3,769,581 $3,818,115 0.02% 6.75%2009 1,021,805,530 770,955,194 3.77% -28.66% 5,084,919 5,135,144 0.02% -3.14%2008 954,279,128 1,002,243,816 3.84% 6.04% 6,255,651 6,906,096 0.03% 12.05%2007 638,511,736 684,741,163 2.56% 14.21% 7,355,621 7,763,461 0.03% 8.17%2006 327,772,520 398,391,108 1.70% 6.87% 17,729,189 18,192,114 0.08% 9.51%2005 309,798,748 399,727,575 1.85% 27.56% 19,796,542 20,267,798 0.09% 6.76%2004 348,015,445 368,546,928 1.78% 0.53% 35,210,421 36,228,371 0.18% 7.83%2003 399,402,161 425,893,012 2.24% 3.30% 69,871,489 71,990,878 0.38% 20.62%2002 417,067,553 471,193,932 2.41% 0.81% 69,553,258 71,468,307 0.37% 1.19%2001 407,455,431 476,011,373 2.24% 14.45% 92,793,153 100,727,402 0.47% 10.88%

OFFICE OF THE STATE TREASURER, DENISE L. NAPPIER S-21
PENSION FUNDS MANAGEMENT DIVISION
COMBINED INVESTMENT FUNDSINVESTMENT SUMMARY AT JUNE 30, 2010 (1) (Continued)
Private Investment Fund (3) Total Fund (4)
Book Market % of Total Rate of Book Market % of Total Rate of Value Value Fund MV Return Value Value Fund MV Return
2010 $1,859,585,108 $2,013,101,198 9.24% 17.32% $21,710,645,358 $21,784,939,405 100.00% 12.88%2009 1,819,125,566 1,621,268,022 7.94% -16.36% 21,945,913,372 20,431,180,148 100.00% -17.37%2008 1,809,775,995 1,789,139,253 6.85% 13.66% 25,388,309,339 26,129,160,510 100.00% -4.71%2007 1,657,888,536 1,556,795,484 5.81% 19.56% 23,066,365,615 26,774,529,258 100.00% 17.34%2006 1,692,805,252 1,357,518,114 5.78% 11.46% 21,145,639,107 23,482,898,042 100.00% 10.55%2005 2,046,726,560 1,437,979,798 6.67% 8.94% 19,918,781,069 21,573,264,617 100.00% 10.46%2004 2,406,829,047 1,781,312,669 8.63% 18.70% 19,473,480,993 20,650,115,902 100.00% 15.23%2003 2,413,582,348 1,842,900,019 9.70% -11.94% 18,771,449,134 18,989,393,113 100.00% 2.49%2002 2,315,048,277 2,276,642,374 11.64% -10.81% 19,403,848,200 19,557,516,103 100.00% -6.39%2001 2,217,285,786 2,601,575,275 12.28% -6.25% 19,571,276,798 21,204,840,744 100.00% -3.68%
(1) All rates of return are net of management fees and division operating expenses.
(2) The market value of the Liquidity Fund for the periods presented represents the market value of the pension and trust balances in the Liquidity Fund only (excluding receivables and payables); the Liquidity Fund balances of the other combined investment funds are shown in the market value of each fund.
(3) Investment returns published for prior years were net of management fees, but were restated in 2008 net of all expenses.
(4) Represents a composite return of the total pension and trust funds. Individual returns for the three primary pension funds (Teachers, State Employees and Minicipal Employees) are separately presented elsewhere due to different asset allocations of each fund.
(5) On November 1, 2007 the International Stock Fund (ISF) was reallocated into two sub portfolios of international equity securities. The reallocation was a result of the modifi cations to the Investment Policy Statement (IPS) as approved by the Investment Advisory Council (IAC) and adopted by the Treasurer in October 2007. The reallocation of assets, outlined in the IPS, was based on an asset liability study that identifi ed the need to reallocate the international stock fund into two components: developed markets international stocks and emerg-ing markets international stocks to allow for greater fl exibility in managing risk and return in the various Connecticut Retirement Plans and Trust Funds.
(6) On November 1, 2007 the Mutual Fixed Income Fund was reallocated into four sub portfolios of fi xed income securities. The realloca-tion was a result of the modifi cations to the Investment Policy Statement (IPS) as approved by the Investment Advisory Council (IAC) and adopted by the Treasurer in October 2007. The reallocation of assets, outlined in the IPS, was based on an asset liability study that identifi ed the need to reallocate the mutual fi xed income fund into four components: core fi xed income, emerging market debt, high yield debt and infl ation-linked bonds to allow for greater fl exibility in managing risk and return in the various Connecticut Retirement Plans and Trust Funds.

S-22 FISCAL YEAR 2010 ANNUAL REPORT
LIQUIDITY FUNDSecurity Name Maturity Date Market Value %Barclays Cap Tri Party C 07/01/2010 $99,245,000.00 4.48%Bank of Nova Scotia 07/14/2010 53,000,000.00 2.39%Westpac Banking Corp 07/12/2010 47,996,186.67 2.16%Deutsche Bank AG NY 07/06/2010 45,000,000.00 2.03%Barclays Capital Repo 07/01/2010 44,000,000.00 1.99%Credit Suisse First Boston Repo 07/01/2010 44,000,000.00 1.99%Barclays Bank PLC 01/07/2011 40,000,000.00 1.81%HSBC Tri Party C 07/01/2010 40,000,000.00 1.81%CSFB Tri Party C 07/01/2010 40,000,000.00 1.81%Deutsche Tri Party C 07/01/2010 40,000,000.00 1.81%Top Ten $493,241,186.67 22.28%
Fair Value LF 2,214,104,408.00
MUTUAL EQUITY FUNDSecurity Name Industry Sector Market Value %Exxon Mobil Corp Energy $117,859,718 2.23%Apple Inc Information Technology 80,523,053 1.52%Microsoft Technology 75,320,543 1.42%Proctor & Gamble Co Consumer Staples 72,737,506 1.37%JP Morgan Chase & Co Financials 64,376,818 1.22%AT&T Inc Telecommunication Svcs 63,320,107 1.20%Johnson & Johnson Health Care 59,811,952 1.13%Wells Fargo & Co Financials 54,879,258 1.04%International Business Machines Information Technology 52,635,202 1.00%Bank of America Corp Financials 51,993,821 0.98%Top Ten $693,457,978 13.11% FAIR VALUE MEF $ 5,288,853,566
CORE FIXED INCOME FUNDSecurity Name Coupon Maturity Security Type Market Value %U.S. Treasury N/B 4.375% 05/15/2040 U.S. Govt Agency $35,747,721 1.28%FNMA TBA Aug 30 Single Fam 4.500% 12/01/2099 U.S. Govt Agency 27,365,490 0.98%U.S. Treasury Bonds 11.250% 02/15/2015 U.S. Govt Agency 25,408,076 0.91%U.S. Treasury N/B 1.000% 08/31/2011 U.S. Govt Agency 24,356,816 0.87%U.S. Treasury N/B 2.250% 10/31/2014 U.S. Govt Agency 21,562,948 0.77%U.S. Treasury N/B 3.500% 05/15/2020 U.S. Govt Agency 21,538,205 0.77%FHLMC TBA Aug 30 Gold Single 5.000% 12/01/2099 U.S. Govt Agency 18,332,466 0.66%FNMA TBA Aug 30 Single Fam 5.000% 12/01/2099 U.S. Govt Agency 18,132,584 0.65%FNMA Pool 745275 5.000% 02/01/2036 U.S. Govt Agency 16,724,202 0.60%FNMA Pool 888876 5.500% 05/01/2033 U.S. Govt Agency 15,272,804 0.55%Top Ten $224,441,312 8.04% FAIR VALUE CFI $2,789,605,943
INFLATION LINKED BOND FUNDSecurity Name Coupon Maturity Security Type Market Value %U.S. Treasury Bonds 2.375% 01/15/2025 U.S. Govt Agency $99,213,493 9.27%U.S. Treasury Bonds 2.000% 01/15/2026 U.S. Govt Agency 87,043,947 8.13%U.S. Treasury Notes 2.000% 01/15/2016 U.S. Govt Agency 84,301,286 7.87%U.S. Treasury Notes 2.375% 04/15/2011 U.S. Govt Agency 72,610,257 6.78%
PENSION FUNDS MANAGEMENT DIVISION
COMBINED INVESTMENT FUNDSTOP TEN HOLDINGS* BY FUND AT JUNE 30, 2010

OFFICE OF THE STATE TREASURER, DENISE L. NAPPIER S-23
PENSION FUNDS MANAGEMENT DIVISIONCOMBINED INVESTMENT FUNDS
TOP TEN HOLDINGS* BY FUND AT JUNE 30, 2010 (Continued)
U.S. Treasury Notes 2.000% 01/15/2014 U.S. Govt Agency 66,797,952 6.24%U.S. Treasury Notes 2.500% 07/15/2016 U.S. Govt Agency 64,307,460 6.01%U.S. Treasury Notes 2.375% 01/15/2017 U.S. Govt Agency 57,903,348 5.41%U.S. Treasury Notes 1.625% 01/15/2015 U.S. Govt Agency 54,088,528 5.05%U.S. Treasury Bonds 3.625% 04/15/2028 U.S. Govt Agency 52,389,083 4.89%U.S. Treasury Notes 3.000% 07/15/2012 U.S. Govt Agency 46,685,398 4.36%Top Ten $685,340,752 64.01% FAIR VALUE ILB $ 1,070,660,872
EMERGING MARKET DEBT FUNDSecurity Name Coupon Maturity Market Value %Russian Federation 1.000% 03/31/2030 $32,278,161 2.79%Nota Tesouro Nacional 10.000% 01/01/2021 19,304,440 1.67%Republic of Argentina 7.000% 03/28/2011 18,368,845 1.59%UBS Glam REF 70325 4.960% 03/05/2011 12,458,890 1.08%UBS Glam REF 70325 7.010% 03/05/2015 12,243,246 1.06%Republic of Indonesia 11.625% 03/04/2019 12,175,625 1.05%UBS Glam REF 70491 8.520% 03/20/2017 10,605,430 0.92%South Africa (Republic) 8.000% 12/21/2018 10,496,341 0.91%Republic of Poland 6.375% 07/15/2019 10,315,502 0.89%Brazil (FED REP) 6.000% 05/15/2045 10,142,666 0.88%Top Ten $148,389,146 12.84% FAIR VALUE EMD $1,155,351,613
HIGH YIELD DEBT FUNDSecurity Name Coupon Maturity Market Value %Borden Inc 7.875% 02/15/2023 $6,832,875 1.04%Toys R Us Inc 7.375% 10/15/2018 6,603,500 1.00%Qwest Capital Funding 6.875% 07/15/2028 6,236,100 0.95%Dynegy Hldgs Inc 8.375% 05/01/2016 5,234,119 0.80%Valeant Pharmaceuticals Intl 4.000% 11/15/2013 5,222,100 0.80%Tenet Healthcare Corp 6.875% 11/15/2031 5,190,900 0.79%AES Corp 8.000% 10/15/2017 5,181,300 0.79%Citibank NA 15.000% 07/02/2010 4,976,173 0.76%Vertex Pharmaceuticals Inc Common Stock 4,908,187 0.75%Aramark Corp 8.500% 02/01/2015 4,545,000 0.69%Top Ten $54,930,254 8.37% FAIR VALUE HYI $656,175,724
DEVELOPED MARKET INTERNATIONAL STOCK FUNDSecurity Name Country Market Value %Nestle SA CHFO.10 REGD Switzerland $77,999,342 1.80%Royal Dutch Shell PLC A Shares Eur .07 United Kingdom 53,794,807 1.24%Roche Holdings AG Genusscheine NPV Switzerland 51,536,598 1.19%HSBC Holdings ORD USD 0.50 UK REG United Kingdom 46,545,054 1.08%Novartis AG CHF 0.50 REGD Switzerland 44,326,091 1.02%Glaxosmithkline ORD GBP 0.25 United Kingdom 40,731,126 0.94%Sanofi Aventis EUR 2.0 France 36,436,956 0.84%Total SA Eur 2.5 Post Division France 35,270,998 0.82%Astrazeneca ORD USD 0.25 United Kingdom 33,785,298 0.78%Vodafone Group ORD USD 0.11428571 United Kingdom 33,235,013 0.77%Top Ten $453,661,283 10.48% FAIR VALUE DM ISF $4,328,450,937

S-24 FISCAL YEAR 2010 ANNUAL REPORT
PENSION FUNDS MANAGEMENT DIVISIONCOMBINED INVESTMENT FUNDS
TOP TEN HOLDINGS* BY FUND AT JUNE 30, 2010 (Continued)
EMERGING MARKET INTERNATIONAL STOCK FUNDSecurity Name Country Market Value %Samsung Electronic KRW 5000 Republic of Korea $54,210,055 2.62%Vale SA Depository Receipts Brazil 53,183,480 2.58%Petroleo Brasileiro SA Sponsored ADR Brazil 51,738,522 2.51%Gazprom ADR OAO Russian Federation 47,943,655 2.32%China Mobile Ltd. HKD 0.10 Hong Kong 47,795,789 2.31%CNOOC Ltd HKD 0.02 Hong Kong 38,764,655 1.88%Lukoil OAO ADR Rub 0.025 Russian Federation 30,949,045 1.50%America Movil ADR Series L Mexico 24,795,570 1.20%Grupo Financiero Banorte NPV Mexico 24,162,107 1.17%Taiwan Semiconductor SP ADR Taiwan 23,838,175 1.15%Top Ten $397,381,053 19.24%
FAIR VALUE EM ISF $2,065,255,957
REAL ESTATE FUNDProperty Name Patnership Type Market Value %Prime Property Fund Core $60,641,800 7.65%WLR IV PPIP Co Invest LP Opportunistic 49,575,756 6.26%Alliance Bernstein Legacy Value-Added 42,887,005 5.41%Cornerstone Patriot Core 42,865,500 5.41%Marathon Legacy Securities PPI Value-Added 33,072,845 4.17%Starwood Opportunity Fund VII Opportunistic 31,755,800 4.01%Blackstone Real Estate VI LP Opportunistic 30,978,400 3.91%Canyon Johnson Urban Fund II Opportunistic 29,275,945 3.69%RLJ Urban Lodging Fund II Opportunistic 28,751,650 3.63%Covenant Apartment Fund V LP Value-Added 24,673,550 3.11%Top Ten $374,478,251 47.25%
FAIR VALUE REF $792,483,221
COMMERCIAL MORTGAGE FUNDProperty Name Location Property Type Market Value %SASCO Various Other $3,464,167 90.73%Yankee Mac Series G 11.125% Various Residential 94,453 2.47%Yankee Mac Series E 11.056% Various Residential 68,224 1.79%Yankee Mac Series F 12.981% Various Residential 28,227 0.74%Yankee Mac Series A 13.075% Various Residential 2,149 0.06%Top Five $3,657,220 95.79%
FAIR VALUE CMF $3,818,115
PRIVATE INVESTMENT FUNDPartnership Name Partnership Type Market Value %Constitution Liquidating Fund Fund of Funds $160,725,705 7.99%Fairview Constitution II LP Fund of Funds 123,187,147 6.12%Carlyle Asia Partners LP International 99,721,385 4.95%Parish Capital Buyout Fund II Fund of Funds 96,260,356 4.78%KKR 2006 Fund Buyout 88,197,715 4.38%Pegasus Partners IV Special Situations 88,133,949 4.38%KKR Millennium Fund Buyout 86,909,736 4.32%Welsh Carson Anderson & Stowe X LP Buyout 84,599,510 4.20%FS Equity Partners V Buyout 78,460,140 3.90%Charterhouse Equity Partners IV Buyout 71,505,266 3.55%Top Ten $977,700,909 48.57%
FAIR VALUE PIF $2,013,101,198 * A complete list of portfolio holdings is available from the Offi ce of the Treasurer.

OFFICE OF THE STATE TREASURER, DENISE L. NAPPIER S-25
PENSION FUNDS MANAGEMENT DIVISION
SCHEDULE OF EXPENSES IN EXCESS OF $5,000 (1)
FISCAL YEAR ENDED JUNE 30, 2010 Aggregate Status at Contract Comp. Paid June 30,Name of Firm Description of Services Date in FY 2010 2010
INVESTMENT ADVISORY SERVICESDomestic Equity Investment Advisory ServicesAXA Rosenberg Institutional Equity Management Equity Advisor Mar-96 $ 817,894 ActiveBlackrock\Barclay’s Global Investors Equity Advisor Mar-96 1,279,650 ActiveBivium Capital Partners, LLC Equity Advisor Jul-05 1,302,624 ActiveCapital Prospects LLC Equity Advisor Jul-05 832,638 ActiveFIS Group Inc. Equity Advisor Jul-05 779,667 ActiveState Street Global Advisors Equity Advisor Mar-96 134,862 ActiveT. Rowe Price Associates Equity Advisor Nov-08 2,052,593 ActiveTCW Asset Management Equity Advisor Mar-96 809,009 Inactive
Total Domestic Equity Advisor Compensation $8,008,937
Core Fixed Income Investment Advisory ServicesBlackrock Financial Management Core Income Advisor Mar-96 $1,055,013 ActiveGoodwin Capital Advisors (Phoenix) Core Income Advisor Nov-97 534,754 ActiveProgress Investment Management Core Income Advisor Jul-05 823,293 ActiveState Street Global Advisors Core Income Advisor Mar-96 250,696 ActiveWellington Asset Management Core Income Advisor Nov-97 449,376 ActiveWestern Asset Management Core Income Advisor Nov-97 425,920 Inactive
Total Core Fixed Income Advisor Compensation $3,539,052
Infl ation Linked Bond Investment Advisory ServicesHartford Investment Management Co. Infl ation Income Advisor May-05 $399,253 ActiveBrown Brother Harriman & Co Infl ation Income Advisor May-05 973,728 Active
Total Infl ation Linked Bond Advisor Compensation $1,372,981
Emerging Market Debt Investment Advisory ServicesING Investment Management Co Emerging Market Income Advisor May-09 $598,270 ActivePyramis Global Advisors Emerging Market Income Advisor Oct-07 978,290 ActiveStone Harbor Investment Partners Emerging Market Income Advisor Oct-07 1,102,088 ActiveUBS Global Asset Management Co Emerging Market Income Advisor Oct-07 1,229,146 Active
Total Emerging Market Debt Advisor Compensation $3,907,794
High Yield Debt Advisory ServicesLoomis Sayles & Co., Inc. High Yield Income Advisor Mar-96 $511,590 ActiveOaktree Capital Management High Yield Income Advisor Mar-96 613,714 ActiveShenkman Capital Management High Yield Income Advisor Dec-07 826,854 ActiveStone Harbor Investment Partners High Yield Income Advisor Oct-07 526,281 Active
Total High Yield Debt Advisor Compensation $2,478,439
Liquidity Fund Advisory ServicesAmbassador Capital Management Cash Reserve Account Advisor May-09 $107,885 ActivePacifi c Investment Management Cash Reserve Account Advisor Mar-09 263,309 ActivePayden & Rygel Cash Reserve Account Advisor Mar-09 118,006 ActiveColchester Global Investors Cash Reserve Account Advisor May-09 373,734 ActiveLazard Asset Management Cash Reserve Account Advisor Aug-09 987,397 ActiveState Street Global Advisors Cash Reserve Account Advisor Mar-96 314,126 Active
Total Liquidity Fund Advisor Compensation $2,164,457
Developed Market International Equity Investment Advisory ServicesAcadian Asset Management International Equity Advisor Sep-06 $1,145,707 ActiveAQR Capital Management, LLC International Equity Advisor Sep-06 2,501,900 ActiveArtio Global Asset Management International Equity Advisor Sep-06 1,981,372 ActiveBlackrock (Merrill Lynch) International Equity Advisor Aug-03 824,192 ActiveDimensional Fund Advisors International Equity Advisor Mar-09 1,349,548 Active
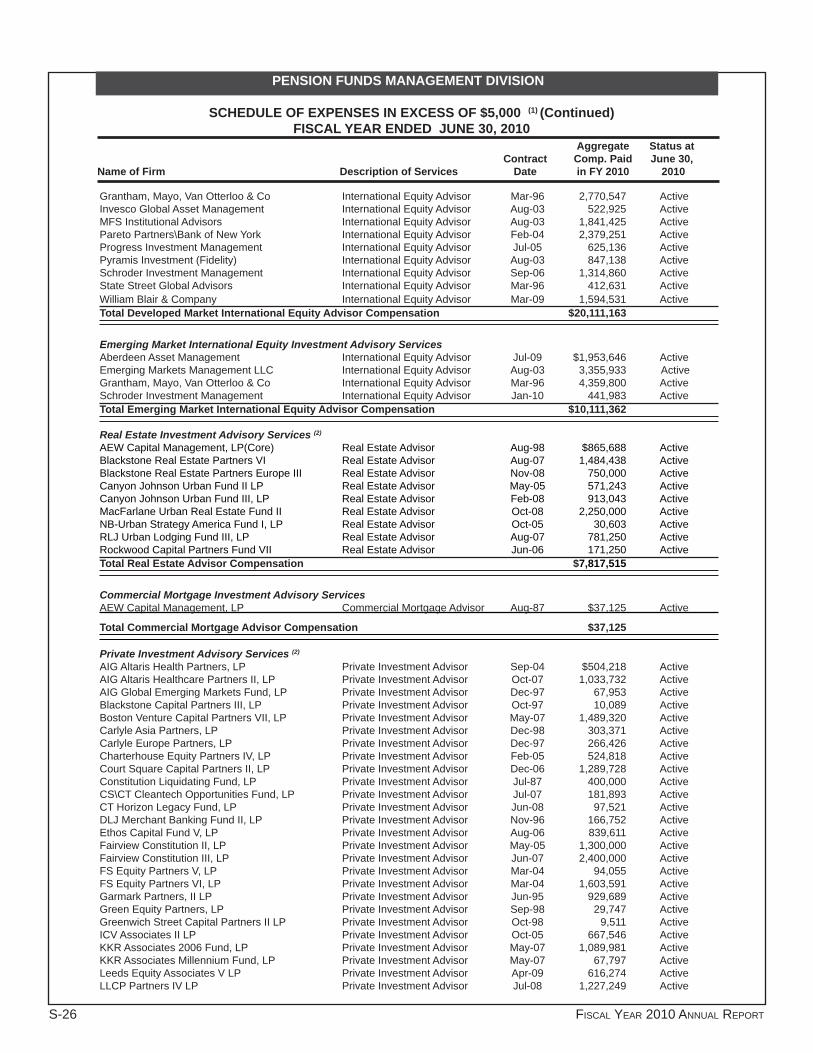
S-26 FISCAL YEAR 2010 ANNUAL REPORT
PENSION FUNDS MANAGEMENT DIVISION
SCHEDULE OF EXPENSES IN EXCESS OF $5,000 (1) (Continued)FISCAL YEAR ENDED JUNE 30, 2010
Aggregate Status at Contract Comp. Paid June 30,Name of Firm Description of Services Date in FY 2010 2010
Grantham, Mayo, Van Otterloo & Co International Equity Advisor Mar-96 2,770,547 ActiveInvesco Global Asset Management International Equity Advisor Aug-03 522,925 ActiveMFS Institutional Advisors International Equity Advisor Aug-03 1,841,425 ActivePareto Partners\Bank of New York International Equity Advisor Feb-04 2,379,251 ActiveProgress Investment Management International Equity Advisor Jul-05 625,136 ActivePyramis Investment (Fidelity) International Equity Advisor Aug-03 847,138 ActiveSchroder Investment Management International Equity Advisor Sep-06 1,314,860 ActiveState Street Global Advisors International Equity Advisor Mar-96 412,631 ActiveWilliam Blair & Company International Equity Advisor Mar-09 1,594,531 ActiveTotal Developed Market International Equity Advisor Compensation $20,111,163
Emerging Market International Equity Investment Advisory ServicesAberdeen Asset Management International Equity Advisor Jul-09 $1,953,646 ActiveEmerging Markets Management LLC International Equity Advisor Aug-03 3,355,933 ActiveGrantham, Mayo, Van Otterloo & Co International Equity Advisor Mar-96 4,359,800 ActiveSchroder Investment Management International Equity Advisor Jan-10 441,983 ActiveTotal Emerging Market International Equity Advisor Compensation $10,111,362
Real Estate Investment Advisory Services (2)
AEW Capital Management, LP(Core) Real Estate Advisor Aug-98 $865,688 ActiveBlackstone Real Estate Partners VI Real Estate Advisor Aug-07 1,484,438 ActiveBlackstone Real Estate Partners Europe III Real Estate Advisor Nov-08 750,000 ActiveCanyon Johnson Urban Fund II LP Real Estate Advisor May-05 571,243 ActiveCanyon Johnson Urban Fund III, LP Real Estate Advisor Feb-08 913,043 ActiveMacFarlane Urban Real Estate Fund II Real Estate Advisor Oct-08 2,250,000 ActiveNB-Urban Strategy America Fund I, LP Real Estate Advisor Oct-05 30,603 ActiveRLJ Urban Lodging Fund III, LP Real Estate Advisor Aug-07 781,250 ActiveRockwood Capital Partners Fund VII Real Estate Advisor Jun-06 171,250 ActiveTotal Real Estate Advisor Compensation $7,817,515
Commercial Mortgage Investment Advisory Services AEW Capital Management, LP Commercial Mortgage Advisor Aug-87 $37,125 Active
Total Commercial Mortgage Advisor Compensation $37,125
Private Investment Advisory Services (2) AIG Altaris Health Partners, LP Private Investment Advisor Sep-04 $504,218 ActiveAIG Altaris Healthcare Partners II, LP Private Investment Advisor Oct-07 1,033,732 ActiveAIG Global Emerging Markets Fund, LP Private Investment Advisor Dec-97 67,953 ActiveBlackstone Capital Partners III, LP Private Investment Advisor Oct-97 10,089 ActiveBoston Venture Capital Partners VII, LP Private Investment Advisor May-07 1,489,320 ActiveCarlyle Asia Partners, LP Private Investment Advisor Dec-98 303,371 ActiveCarlyle Europe Partners, LP Private Investment Advisor Dec-97 266,426 ActiveCharterhouse Equity Partners IV, LP Private Investment Advisor Feb-05 524,818 ActiveCourt Square Capital Partners II, LP Private Investment Advisor Dec-06 1,289,728 ActiveConstitution Liquidating Fund, LP Private Investment Advisor Jul-87 400,000 ActiveCS\CT Cleantech Opportunities Fund, LP Private Investment Advisor Jul-07 181,893 ActiveCT Horizon Legacy Fund, LP Private Investment Advisor Jun-08 97,521 ActiveDLJ Merchant Banking Fund II, LP Private Investment Advisor Nov-96 166,752 ActiveEthos Capital Fund V, LP Private Investment Advisor Aug-06 839,611 ActiveFairview Constitution II, LP Private Investment Advisor May-05 1,300,000 ActiveFairview Constitution III, LP Private Investment Advisor Jun-07 2,400,000 ActiveFS Equity Partners V, LP Private Investment Advisor Mar-04 94,055 ActiveFS Equity Partners VI, LP Private Investment Advisor Mar-04 1,603,591 ActiveGarmark Partners, II LP Private Investment Advisor Jun-95 929,689 ActiveGreen Equity Partners, LP Private Investment Advisor Sep-98 29,747 ActiveGreenwich Street Capital Partners II LP Private Investment Advisor Oct-98 9,511 ActiveICV Associates II LP Private Investment Advisor Oct-05 667,546 ActiveKKR Associates 2006 Fund, LP Private Investment Advisor May-07 1,089,981 ActiveKKR Associates Millennium Fund, LP Private Investment Advisor May-07 67,797 ActiveLeeds Equity Associates V LP Private Investment Advisor Apr-09 616,274 ActiveLLCP Partners IV LP Private Investment Advisor Jul-08 1,227,249 Active
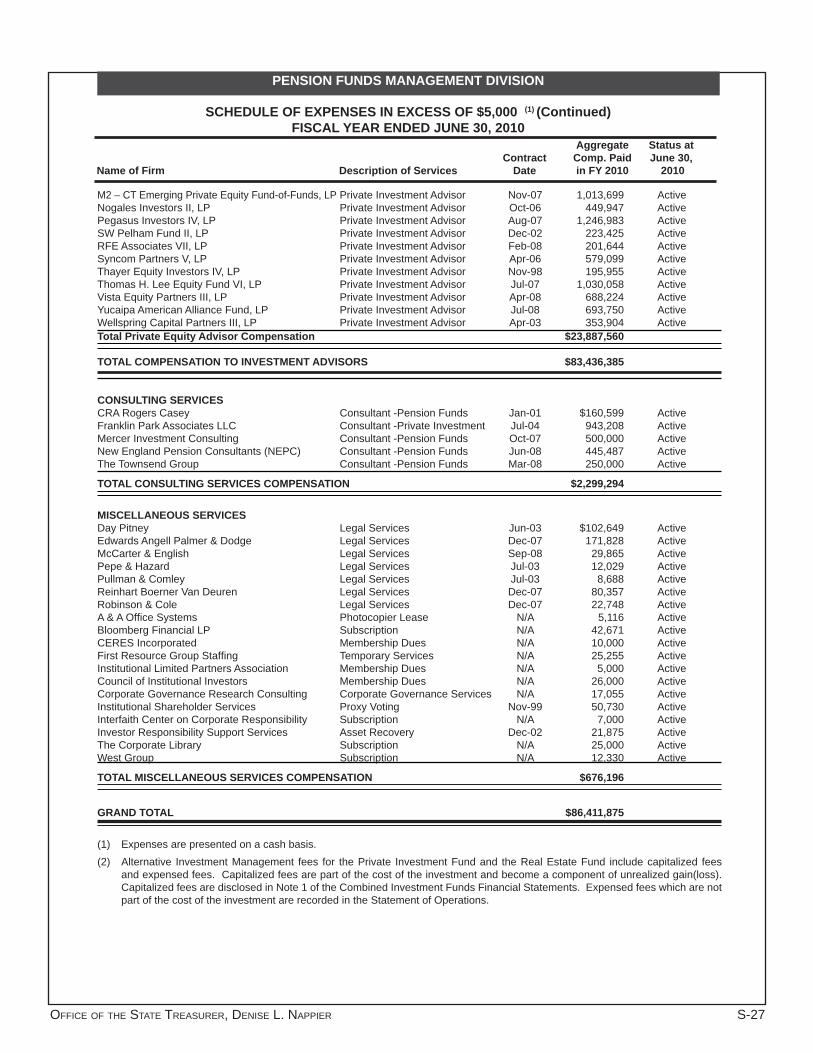
OFFICE OF THE STATE TREASURER, DENISE L. NAPPIER S-27
PENSION FUNDS MANAGEMENT DIVISION
SCHEDULE OF EXPENSES IN EXCESS OF $5,000 (1) (Continued)FISCAL YEAR ENDED JUNE 30, 2010
Aggregate Status at Contract Comp. Paid June 30,Name of Firm Description of Services Date in FY 2010 2010
M2 – CT Emerging Private Equity Fund-of-Funds, LP Private Investment Advisor Nov-07 1,013,699 ActiveNogales Investors II, LP Private Investment Advisor Oct-06 449,947 ActivePegasus Investors IV, LP Private Investment Advisor Aug-07 1,246,983 ActiveSW Pelham Fund II, LP Private Investment Advisor Dec-02 223,425 ActiveRFE Associates VII, LP Private Investment Advisor Feb-08 201,644 ActiveSyncom Partners V, LP Private Investment Advisor Apr-06 579,099 ActiveThayer Equity Investors IV, LP Private Investment Advisor Nov-98 195,955 ActiveThomas H. Lee Equity Fund VI, LP Private Investment Advisor Jul-07 1,030,058 ActiveVista Equity Partners III, LP Private Investment Advisor Apr-08 688,224 ActiveYucaipa American Alliance Fund, LP Private Investment Advisor Jul-08 693,750 ActiveWellspring Capital Partners III, LP Private Investment Advisor Apr-03 353,904 ActiveTotal Private Equity Advisor Compensation $23,887,560
TOTAL COMPENSATION TO INVESTMENT ADVISORS $83,436,385
CONSULTING SERVICES CRA Rogers Casey Consultant -Pension Funds Jan-01 $160,599 ActiveFranklin Park Associates LLC Consultant -Private Investment Jul-04 943,208 ActiveMercer Investment Consulting Consultant -Pension Funds Oct-07 500,000 ActiveNew England Pension Consultants (NEPC) Consultant -Pension Funds Jun-08 445,487 ActiveThe Townsend Group Consultant -Pension Funds Mar-08 250,000 Active
TOTAL CONSULTING SERVICES COMPENSATION $2,299,294
MISCELLANEOUS SERVICES Day Pitney Legal Services Jun-03 $102,649 ActiveEdwards Angell Palmer & Dodge Legal Services Dec-07 171,828 ActiveMcCarter & English Legal Services Sep-08 29,865 ActivePepe & Hazard Legal Services Jul-03 12,029 ActivePullman & Comley Legal Services Jul-03 8,688 ActiveReinhart Boerner Van Deuren Legal Services Dec-07 80,357 ActiveRobinson & Cole Legal Services Dec-07 22,748 ActiveA & A Offi ce Systems Photocopier Lease N/A 5,116 ActiveBloomberg Financial LP Subscription N/A 42,671 ActiveCERES Incorporated Membership Dues N/A 10,000 ActiveFirst Resource Group Staffi ng Temporary Services N/A 25,255 ActiveInstitutional Limited Partners Association Membership Dues N/A 5,000 ActiveCouncil of Institutional Investors Membership Dues N/A 26,000 Active Corporate Governance Research Consulting Corporate Governance Services N/A 17,055 ActiveInstitutional Shareholder Services Proxy Voting Nov-99 50,730 ActiveInterfaith Center on Corporate Responsibility Subscription N/A 7,000 ActiveInvestor Responsibility Support Services Asset Recovery Dec-02 21,875 ActiveThe Corporate Library Subscription N/A 25,000 ActiveWest Group Subscription N/A 12,330 Active
TOTAL MISCELLANEOUS SERVICES COMPENSATION $676,196
GRAND TOTAL $86,411,875
(1) Expenses are presented on a cash basis.(2) Alternative Investment Management fees for the Private Investment Fund and the Real Estate Fund include capitalized fees
and expensed fees. Capitalized fees are part of the cost of the investment and become a component of unrealized gain(loss). Capitalized fees are disclosed in Note 1 of the Combined Investment Funds Financial Statements. Expensed fees which are not part of the cost of the investment are recorded in the Statement of Operations.

S-28 FISCAL YEAR 2010 ANNUAL REPORT
Net Assets Percent Investment Under of FundName of Fund Strategy Management Total
LIQUIDITY (LF) State Street Global Advisors Active $ 1,493,003,644 67.29%Payden & Rygel Active 100,657,036 4.54%PIMCO Active 176,020,927 7.93%Ambassador Capital Management Active 100,240,839 4.52%Lazard Active 172,298,394 7.76%Colchester Global Investors Ltd. Active 176,660,129 7.96%SUBTOTAL LF $ 2,218,880,969 100.00%
MUTUAL EQUITY FUND (MEF) Large Cap $ 3,369,646,357 63.71%BGI Barclays Global Investors, N.A. Enhanced - Index 765,654,045 14.48%T. Rowe Price Associates Enhanced - Index 741,404,050 14.01%State Street Global Advisors Passive - Indexed 1,862,588,262 35.22%Active Extension 762,654,863 14.42%AXA Rosenberg Investment Management Active 187,719,220 3.55%Pyramis Active 291,501,068 5.51%Numeric Active 283,434,575 5.36%All Cap 268,916,132 5.08%Capital Prospects Active 135,861,230 2.57%FIS Group, Inc. Active 133,054,902 2.51%Small/Mid Cap 371,812,347 7.03%AXA Rosenberg Investment Management Enhanced - Index 371,812,347 7.03%Small/Mid Cap 129,038,328 2.44%Bivium Active 129,038,328 2.44%Other (1) 387,023,669 7.32%SUBTOTAL MEF $ 5,289,091,696 100.00% CORE FIXED INCOME FUND (CFIF) State Street Global Advisors Passive $ 1,038,045,975 38.43%BlackRock Financial Management, Inc. Active 662,480,061 24.52%Wellington Active 531,174,461 19.66%Phoenix Active 324,967,803 12.03%Progress Active 131,722,970 4.88%Other (1) 13,054,939 0.48%SUBTOTAL CFIF $ 2,701,446,209 100.00% INFLATION LINKED BOND FUND (ILBF) Brown Brothers Harriman Active $ 600,761,965 56.52%Hartford Investment Mgmt Co. Active 461,830,308 43.45%Other (1) 297,227 0.03%SUBTOTAL ILBF $ 1,062,889,500 100.00% EMERGING MARKET DEBT FUND (EMDF) Ashmore Active $ 275,397,208 23.42%Stone Harbor Investment Partners Active 258,043,051 21.95%ING Investment Management Active 204,085,677 17.36%Pyramis Active 220,008,611 18.71%UBS Global Asset Management Active 216,987,326 18.45%Other (1) 1,340,495 0.11%SUBTOTAL EMDF $ 1,175,862,368 100.00% HIGH YIELD INCOME FUND (HYIF) Loomis Sayles & Co., Inc. Active $ 229,269,448 33.10%Stone Harbor Investment Partners Active 94,233,670 13.60%Shenkman Capital Management Active 226,634,207 32.71%Oaktree Capital Management, L.L.C. Active 137,825,017 19.90%Other (1) 4,802,157 0.69%SUBTOTAL HYIF $ 692,764,499 100.00%
PENSION FUNDS MANAGEMENT DIVISIONCOMBINED INVESTMENT FUNDS
LIST OF INVESTMENT ADVISORS AND NET ASSETS UNDER MANAGEMENTJUNE 30, 2010

OFFICE OF THE STATE TREASURER, DENISE L. NAPPIER S-29
PENSION FUNDS MANAGEMENT DIVISIONCOMBINED INVESTMENT FUNDS
LIST OF INVESTMENT ADVISORS AND NET ASSETS UNDER MANAGEMENT (Continued)JUNE 30, 2010
Net Assets Percent Investment Under of FundName of Fund Strategy Management Total
DEVELOPED MARKET INTERNATIONAL STOCK FUND (DMISF) Index $ 643,899,823 14.52%State Street Global Advisors Index-Passive 643,899,823 14.52%Core 1,427,372,133 32.19%Invesco Global Asset Mgmt. Active 175,522,939 3.96%AQR Capital Management Active 518,387,343 11.69%Acadian Asset Management Active 182,882,308 4.12%Artio Global Active 449,467,939 10.14%Progress Active 101,111,604 2.28%Active-Growth 511,832,524 11.54%MFS Institutional Advisors, Inc. Active 511,832,524 11.54%Active-Value 479,311,240 10.81%Grantham, Mayo, Van Otterloo Active 479,311,240 10.81%Small Cap 644,021,970 14.52%Schroder Investment Mgmt. Active 221,955,384 5.00%Dimensional Fund Advisors Active 201,856,115 4.55%William Blair & Company Active 220,210,471 4.97%Risk Controlled 640,159,768 14.43%BlackRock Active 314,448,922 7.09%Pyramis Active 325,710,846 7.34%Other (1) 88,363,106 1.99%SUBTOTAL DMISF $ 4,434,960,564 100.00% EMERGING MARKET INTERNATIONAL STOCK FUND (EMISF) Aberdeen Asset Management Active $ 511,208,154 24.66%Schroders Investment Mgt Active 415,973,739 20.07%Grantham, Mayo, Van Otterloo Active 579,031,270 27.93%Emerging Markets Management Active 562,542,529 27.13%Other (1) 4,408,880 0.21%SUBTOTAL EMISF $ 2,073,164,572 100.00% REAL ESTATE FUND (REF)1800 E. St. Andrew Place Active $ 18,156,905 2.32%1155 Perimeter Center West Active 26,639,547 3.40%AEW Partners III Active 7,883,709 1.01%AEW 221 Trust Active 2,708,893 0.35%AEW Core Active 481,132 0.06%Alliance Bernstein Legacy Active 42,887,005 5.47%Apollo Real Estate Active 15,223,252 1.94%Blackstone Real Estate VI LP Active 30,978,400 3.95%Blackstone Real Estate Partner Europe III LP Active 2,405,287 0.31%Canyon Johnson Urban Fund II Active 29,275,945 3.73%Canyon Johnson Urban Fund III Active 1,142,460 0.15%Capri Select Income II LLC Active 6,985,650 0.89%Colony Realty Partners II LP Active 18,531,176 2.36%Cornerstone Patriot Active 42,865,500 5.47%Covenant Apartment Fund V LP Active 24,673,550 3.15%Covenant Apartment Fund VI Active 10,103,790 1.29%The Glen at Lafayette Hill Active 12,622,352 1.61%IL & FS India Realty Fund II Active 25,725,591 3.28%Macfarlane Urban Real Estate Fund II LP Active 14,320,948 1.83%Marathon Legacy Securities PPI Active 33,072,845 4.22%Mullica Hill Plaza Active 7,446,307 0.95%North Scottsdale Corporate Center Active 43,404,835 5.54%Prime Property Fund Active 60,641,800 7.74%Rio Hill Shopping Center Active 38,727,058 4.94%RLJ RE Fund III LP Active 8,659,408 1.10%RLJ Urban Lodging Fund II Active 28,751,650 3.67%Rocky Creek Apartments Active 11,896,889 1.52%Rockwood Capital Fund V Active 8,109,795 1.03%Rockwood Capital VI Limited Partnership Active 9,708,590 1.24%Rockwood Capital VII Limited Partnership Active 6,509,793 0.83%

S-30 FISCAL YEAR 2010 ANNUAL REPORT
PENSION FUNDS MANAGEMENT DIVISIONCOMBINED INVESTMENT FUNDS
LIST OF INVESTMENT ADVISORS AND NET ASSETS UNDER MANAGEMENT (Continued)JUNE 30, 2010
Net Assets Percent Investment Under of FundName of Fund Strategy Management TotalStarwood Opportunity Fund VII Active 31,755,800 4.05%Starwood Opportunity Fund VIII Active 10,955,630 1.40%Urban Strategy America Fund LP Active 17,116,204 2.18%Walton Street Real Estate Active 15,366,560 1.96%WLR IV PPIP Co Invest LP Active 49,575,756 6.32%Other (3) Active 68,518,969 8.74%SUBTOTAL REF $ 783,828,981 100.00% COMMERCIAL MORTGAGE FUND (CMF) AEW Capital Management Active $ 3,464,356 90.54%Other (2) 362,087 9.46%SUBTOTAL CMF $ 3,826,443 100.00% PRIVATE INVESTMENT FUND (PIF) Buyout $ 916,118,768 45.49%KKR Millennium Fund Active 86,909,736 4.32%Yucaipa American Alliance Fund II LP Active 52,968,853 2.63%Hicks, Muse Tate & Furst Equity Fund III Active 23,531,328 1.17%Thomas H. Lee Equity Fund VI Active 46,016,032 2.28%Welsh Carson Anderson & Stowe VIII Active 15,962,376 0.79%Wellspring Capital Partners III Active 18,019,745 0.89%SCP Private Equity Partners Active 3,471,924 0.17%Charterhouse Equity Partners IV Active 71,505,266 3.55%Forstmann Little Equity Fund VI Active 735,755 0.04%DLJ Merchant Banking Fund II Active 14,447,823 0.72%KKR 1996 Fund Active 5,973,159 0.30%FS Equity Partners V Active 78,460,140 3.90%FS Equity Partners VI Active 10,679,364 0.53%Blackstone Capital Partners III Active 8,258,510 0.41%Thayer Equity Investors IV Active 14,279,684 0.71%Kelso Investment Associates VI Active 5,181,616 0.26%Green Equity Investors III Active 2,310,785 0.11%Wellspring Capital Partners II Active 2,151,798 0.11%Candover 2008 Fund Active 6,289,922 0.31%Leeds Equity Partners V LP Active 4,855,229 0.24%Welsh Carson Anderson & Stowe XI Active 13,409,239 0.67%AIG Healthcare Partners LP Active 32,643,135 1.62%AIG Altaris Health Partners II Active 11,761,887 0.58%Welsh Carson Anderson & Stowe X LP Active 84,599,510 4.20%Court Square Capital Partners II Active 43,143,342 2.14%Ethos Private Equity Fund V Active 26,590,596 1.32%Boston Ventures VII Active 37,232,513 1.85%KKR 2006 Fund Active 88,197,715 4.38%Nogales Investors Fund II Active 10,213,598 0.51%ICV Partners II LP Active 18,061,711 0.90%Vista Equity Partners Fund III Active 50,354,935 2.50%RFE Investments Partners Active 4,893,452 0.24%RFE Investment Partners VII Active 23,008,090 1.14%Venture Capital 23,340,281 1.16%Conning Capital Partners V Active 1,943,359 0.10%Crescendo World Fund Active 72,584 0.00%Grotech Partners V Active 6,155,241 0.31%Crescendo III Active 2,087,161 0.10%Syndicated Communications Active 13,081,936 0.65%Mezzanine 40,477,895 2.01%SW Pelham Fund Active 3,398,397 0.17%GarMark Partners Active 526,570 0.02%GarMark Partners II LP Active 30,345,402 1.51%SW Pelham Fund II Active 6,207,526 0.31%

OFFICE OF THE STATE TREASURER, DENISE L. NAPPIER S-31
PENSION FUNDS MANAGEMENT DIVISIONCOMBINED INVESTMENT FUNDS
LIST OF INVESTMENT ADVISORS AND NET ASSETS UNDER MANAGEMENT (Continued)JUNE 30, 2010
Net Assets Percent Investment Under of FundName of Fund Strategy Management Total
International 170,876,573 8.49%Compass Partners European Equity Fund Active 16,426,114 0.82%Gilbert Global Equity Partners Active 35,300,379 1.75%Carlyle Europe Partners Active 8,250,076 0.41%AIG Global Emerging Markets Fund Active 11,178,619 0.56%Carlyle Asia Partners Active 99,721,385 4.95%Fund of Funds 550,355,818 27.33%The Constitution Liquidating Fund Active 160,725,704 7.98%Landmark Private Equity Fund VIII Active 23,804,890 1.18%CS/CT Cleantech Opp Fund Active 13,459,707 0.67%CT Emerging Pvt Equity Active 9,121,390 0.45%Fairview Constitution III Active 52,459,954 2.60%Goldman Sachs Private Equity Partners Connecticut Active 8,426,270 0.42%Lexington Capital Partners II Active 4,073,132 0.20%Parish Capital I LP Active 37,666,321 1.87%Parish Capital Buyout Fund II Active 96,260,356 4.78%Fairview Constitution II LP Active 123,187,147 6.12%Connecticut Horizon Legacy Active 7,822,662 0.39%Landmark Equity Partners XIV LP Active 8,968,930 0.45%JP Morgan Nutmeg I Active 4,379,355 0.22%Special Situations 203,240,295 10.09%Welsh Carson Anderson & Stowe Capital Partners III Active 16,209,171 0.80%Levine Leichtman Capital Partners IV LP Active 10,511,435 0.52%Greenwich Street Capital Partners II Active 2,450,819 0.12%Pegasus Partners IV Active 88,133,949 4.38%WLR Recovery Fund IV Active 55,193,279 2.74%KPS Special Situations Fund II Active 30,741,642 1.53%Other (3) 109,436,668 5.43%SUBTOTAL PIF $ 2,013,846,298 100.00%
TOTAL $ 22,450,562,099Adjustments (4) (580,971,737)GRAND TOTAL $ 21,869,590,362
(1) Other represents cash equivalents, other net assets and terminated advisor balances, as well as, currency overlay balances for the DMISF.
(2) Other also includes residential mortgage-backed securities for the Commercial Mortgage Fund.(3) Other represents moneys earmarked for distribution to participants, reinvestment, and expenses as well as terminated advisor
balances.(4) Represents Elimination Entry to the Financial Statements to account for investment of Combined Investment Funds in the Liquidity
Fund.
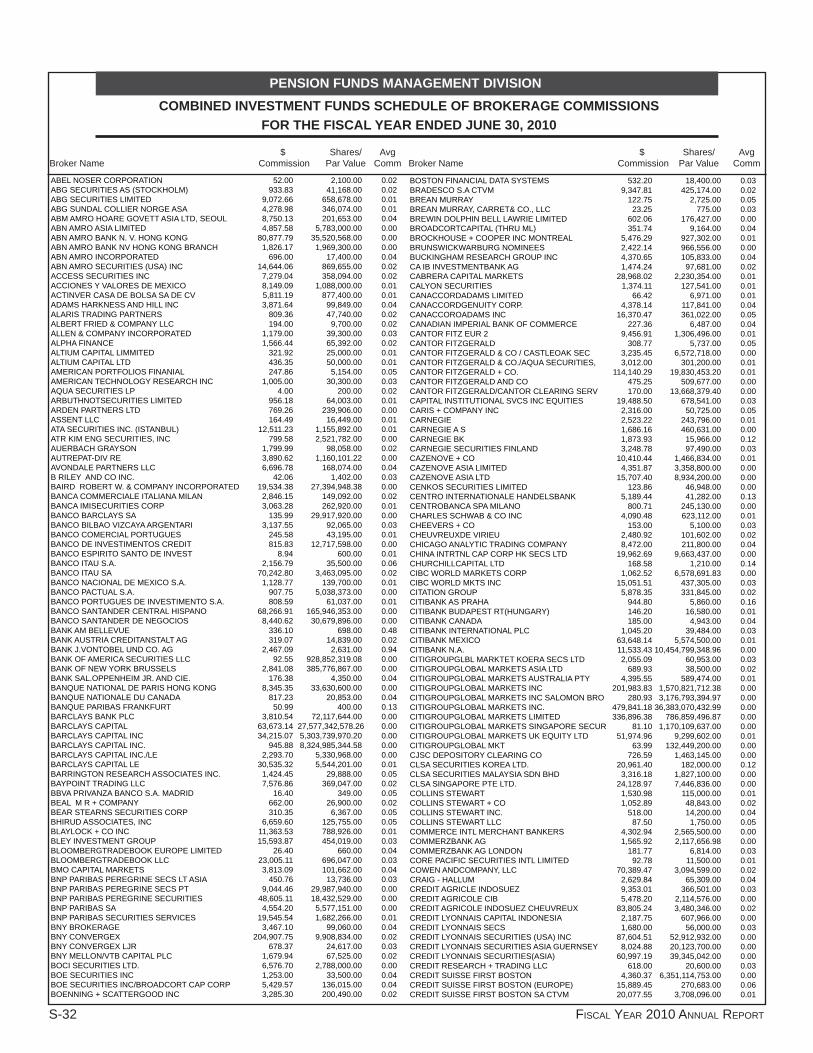
S-32 FISCAL YEAR 2010 ANNUAL REPORT
PENSION FUNDS MANAGEMENT DIVISIONCOMBINED INVESTMENT FUNDS SCHEDULE OF BROKERAGE COMMISSIONS
FOR THE FISCAL YEAR ENDED JUNE 30, 2010
$ Shares/ Avg $ Shares/ Avg Broker Name Commission Par Value Comm Broker Name Commission Par Value Comm
ABEL NOSER CORPORATION 52.00 2,100.00 0.02 ABG SECURITIES AS (STOCKHOLM) 933.83 41,168.00 0.02 ABG SECURITIES LIMITED 9,072.66 658,678.00 0.01 ABG SUNDAL COLLIER NORGE ASA 4,278.98 346,074.00 0.01 ABM AMRO HOARE GOVETT ASIA LTD, SEOUL 8,750.13 201,653.00 0.04 ABN AMRO ASIA LIMITED 4,857.58 5,783,000.00 0.00 ABN AMRO BANK N. V. HONG KONG 80,877.79 35,520,568.00 0.00 ABN AMRO BANK NV HONG KONG BRANCH 1,826.17 1,969,300.00 0.00 ABN AMRO INCORPORATED 696.00 17,400.00 0.04 ABN AMRO SECURITIES (USA) INC 14,644.06 869,655.00 0.02 ACCESS SECURITIES INC 7,279.04 358,094.00 0.02 ACCIONES Y VALORES DE MEXICO 8,149.09 1,088,000.00 0.01 ACTINVER CASA DE BOLSA SA DE CV 5,811.19 877,400.00 0.01 ADAMS HARKNESS AND HILL INC 3,871.64 99,849.00 0.04 ALARIS TRADING PARTNERS 809.36 47,740.00 0.02 ALBERT FRIED & COMPANY LLC 194.00 9,700.00 0.02 ALLEN & COMPANY INCORPORATED 1,179.00 39,300.00 0.03 ALPHA FINANCE 1,566.44 65,392.00 0.02 ALTIUM CAPITAL LIMMITED 321.92 25,000.00 0.01 ALTIUM CAPITAL LTD 436.35 50,000.00 0.01 AMERICAN PORTFOLIOS FINANIAL 247.86 5,154.00 0.05 AMERICAN TECHNOLOGY RESEARCH INC 1,005.00 30,300.00 0.03 AQUA SECURITIES LP 4.00 200.00 0.02 ARBUTHNOTSECURITIES LIMITED 956.18 64,003.00 0.01 ARDEN PARTNERS LTD 769.26 239,906.00 0.00 ASSENT LLC 164.49 16,449.00 0.01 ATA SECURITIES INC. (ISTANBUL) 12,511.23 1,155,892.00 0.01 ATR KIM ENG SECURITIES, INC 799.58 2,521,782.00 0.00 AUERBACH GRAYSON 1,799.99 98,058.00 0.02 AUTREPAT-DIV RE 3,890.62 1,160,101.22 0.00 AVONDALE PARTNERS LLC 6,696.78 168,074.00 0.04 B RILEY AND CO INC. 42.06 1,402.00 0.03 BAIRD ROBERT W. & COMPANY INCORPORATED 19,534.38 27,394,948.38 0.00 BANCA COMMERCIALE ITALIANA MILAN 2,846.15 149,092.00 0.02 BANCA IMISECURITIES CORP 3,063.28 262,920.00 0.01 BANCO BARCLAYS SA 135.99 29,917,920.00 0.00 BANCO BILBAO VIZCAYA ARGENTARI 3,137.55 92,065.00 0.03 BANCO COMERCIAL PORTUGUES 245.58 43,195.00 0.01 BANCO DE INVESTIMENTOS CREDIT 815.83 12,717,598.00 0.00 BANCO ESPIRITO SANTO DE INVEST 8.94 600.00 0.01 BANCO ITAU S.A. 2,156.79 35,500.00 0.06 BANCO ITAU SA 70,242.80 3,463,095.00 0.02 BANCO NACIONAL DE MEXICO S.A. 1,128.77 139,700.00 0.01 BANCO PACTUAL S.A. 907.75 5,038,373.00 0.00 BANCO PORTUGUES DE INVESTIMENTO S.A. 808.59 61,037.00 0.01 BANCO SANTANDER CENTRAL HISPANO 68,266.91 165,946,353.00 0.00 BANCO SANTANDER DE NEGOCIOS 8,440.62 30,679,896.00 0.00 BANK AM BELLEVUE 336.10 698.00 0.48 BANK AUSTRIA CREDITANSTALT AG 319.07 14,839.00 0.02 BANK J.VONTOBEL UND CO. AG 2,467.09 2,631.00 0.94 BANK OF AMERICA SECURITIES LLC 92.55 928,852,319.08 0.00 BANK OF NEW YORK BRUSSELS 2,841.08 385,776,867.00 0.00 BANK SAL.OPPENHEIM JR. AND CIE. 176.38 4,350.00 0.04 BANQUE NATIONAL DE PARIS HONG KONG 8,345.35 33,630,600.00 0.00 BANQUE NATIONALE DU CANADA 817.23 20,853.00 0.04 BANQUE PARIBAS FRANKFURT 50.99 400.00 0.13 BARCLAYS BANK PLC 3,810.54 72,117,644.00 0.00 BARCLAYS CAPITAL 63,673.14 27,577,342,578.26 0.00 BARCLAYS CAPITAL INC 34,215.07 5,303,739,970.20 0.00 BARCLAYS CAPITAL INC. 945.88 8,324,985,344.58 0.00 BARCLAYS CAPITAL INC./LE 2,293.70 5,330,968.00 0.00 BARCLAYS CAPITAL LE 30,535.32 5,544,201.00 0.01 BARRINGTON RESEARCH ASSOCIATES INC. 1,424.45 29,888.00 0.05 BAYPOINT TRADING LLC 7,576.86 369,047.00 0.02 BBVA PRIVANZA BANCO S.A. MADRID 16.40 349.00 0.05 BEAL M R + COMPANY 662.00 26,900.00 0.02 BEAR STEARNS SECURITIES CORP 310.35 6,367.00 0.05 BHIRUD ASSOCIATES, INC 6,659.60 125,755.00 0.05 BLAYLOCK + CO INC 11,363.53 788,926.00 0.01 BLEY INVESTMENT GROUP 15,593.87 454,019.00 0.03 BLOOMBERGTRADEBOOK EUROPE LIMITED 26.40 660.00 0.04 BLOOMBERGTRADEBOOK LLC 23,005.11 696,047.00 0.03 BMO CAPITAL MARKETS 3,813.09 101,662.00 0.04 BNP PARIBAS PEREGRINE SECS LT ASIA 450.76 13,736.00 0.03 BNP PARIBAS PEREGRINE SECS PT 9,044.46 29,987,940.00 0.00 BNP PARIBAS PEREGRINE SECURITIES 48,605.11 18,432,529.00 0.00 BNP PARIBAS SA 4,554.20 5,577,151.00 0.00 BNP PARIBAS SECURITIES SERVICES 19,545.54 1,682,266.00 0.01 BNY BROKERAGE 3,467.10 99,060.00 0.04 BNY CONVERGEX 204,907.75 9,908,834.00 0.02 BNY CONVERGEX LJR 678.37 24,617.00 0.03 BNY MELLON/VTB CAPITAL PLC 1,679.94 67,525.00 0.02 BOCI SECURITIES LTD. 6,576.70 2,788,000.00 0.00 BOE SECURITIES INC 1,253.00 33,500.00 0.04 BOE SECURITIES INC/BROADCORT CAP CORP 5,429.57 136,015.00 0.04 BOENNING + SCATTERGOOD INC 3,285.30 200,490.00 0.02
BOSTON FINANCIAL DATA SYSTEMS 532.20 18,400.00 0.03 BRADESCO S.A CTVM 9,347.81 425,174.00 0.02 BREAN MURRAY 122.75 2,725.00 0.05 BREAN MURRAY, CARRET& CO., LLC 23.25 775.00 0.03 BREWIN DOLPHIN BELL LAWRIE LIMITED 602.06 176,427.00 0.00 BROADCORTCAPITAL (THRU ML) 351.74 9,164.00 0.04 BROCKHOUSE + COOPER INC MONTREAL 5,476.29 927,302.00 0.01 BRUNSWICKWARBURG NOMINEES 2,422.14 966,556.00 0.00 BUCKINGHAM RESEARCH GROUP INC 4,370.65 105,833.00 0.04 CA IB INVESTMENTBANK AG 1,474.24 97,681.00 0.02 CABRERA CAPITAL MARKETS 28,968.02 2,230,354.00 0.01 CALYON SECURITIES 1,374.11 127,541.00 0.01 CANACCORDADAMS LIMITED 66.42 6,971.00 0.01 CANACCORDGENUITY CORP. 4,378.14 117,841.00 0.04 CANACCOROADAMS INC 16,370.47 361,022.00 0.05 CANADIAN IMPERIAL BANK OF COMMERCE 227.36 6,487.00 0.04 CANTOR FITZ EUR 2 9,456.91 1,306,496.00 0.01 CANTOR FITZGERALD 308.77 5,737.00 0.05 CANTOR FITZGERALD & CO / CASTLEOAK SEC 3,235.45 6,572,718.00 0.00 CANTOR FITZGERALD & CO./AQUA SECURITIES, 3,012.00 301,200.00 0.01 CANTOR FITZGERALD + CO. 114,140.29 19,830,453.20 0.01 CANTOR FITZGERALD AND CO 475.25 509,677.00 0.00 CANTOR FITZGERALD/CANTOR CLEARING SERV 170.00 13,668,379.40 0.00 CAPITAL INSTITUTIONAL SVCS INC EQUITIES 19,488.50 678,541.00 0.03 CARIS + COMPANY INC 2,316.00 50,725.00 0.05 CARNEGIE 2,523.22 243,796.00 0.01 CARNEGIE A S 1,686.16 460,631.00 0.00 CARNEGIE BK 1,873.93 15,966.00 0.12 CARNEGIE SECURITIES FINLAND 3,248.78 97,490.00 0.03 CAZENOVE + CO 10,410.44 1,466,834.00 0.01 CAZENOVE ASIA LIMITED 4,351.87 3,358,800.00 0.00 CAZENOVE ASIA LTD 15,707.40 8,934,200.00 0.00 CENKOS SECURITIES LIMITED 123.86 46,948.00 0.00 CENTRO INTERNATIONALE HANDELSBANK 5,189.44 41,282.00 0.13 CENTROBANCA SPA MILANO 800.71 245,130.00 0.00 CHARLES SCHWAB & CO INC 4,090.48 623,112.00 0.01 CHEEVERS + CO 153.00 5,100.00 0.03 CHEUVREUXDE VIRIEU 2,480.92 101,602.00 0.02 CHICAGO ANALYTIC TRADING COMPANY 8,472.00 211,800.00 0.04 CHINA INTRTNL CAP CORP HK SECS LTD 19,962.69 9,663,437.00 0.00 CHURCHILLCAPITAL LTD 168.58 1,210.00 0.14 CIBC WORLD MARKETS CORP 1,062.52 6,578,691.83 0.00 CIBC WORLD MKTS INC 15,051.51 437,305.00 0.03 CITATION GROUP 5,878.35 331,845.00 0.02 CITIBANK AS PRAHA 944.80 5,860.00 0.16 CITIBANK BUDAPEST RT(HUNGARY) 146.20 16,580.00 0.01 CITIBANK CANADA 185.00 4,943.00 0.04 CITIBANK INTERNATIONAL PLC 1,045.20 39,484.00 0.03 CITIBANK MEXICO 63,648.14 5,574,500.00 0.01 CITIBANK N.A. 11,533.43 10,454,799,348.96 0.00 CITIGROUPGLBL MARKTET KOERA SECS LTD 2,055.09 60,953.00 0.03 CITIGROUPGLOBAL MARKETS ASIA LTD 689.93 38,500.00 0.02 CITIGROUPGLOBAL MARKETS AUSTRALIA PTY 4,395.55 589,474.00 0.01 CITIGROUPGLOBAL MARKETS INC 201,983.83 1,570,821,712.38 0.00 CITIGROUPGLOBAL MARKETS INC SALOMON BRO 280.93 3,176,793,394.97 0.00 CITIGROUPGLOBAL MARKETS INC. 479,841.18 36,383,070,432.99 0.00 CITIGROUPGLOBAL MARKETS LIMITED 336,896.38 786,859,496.87 0.00 CITIGROUPGLOBAL MARKETS SINGAPORE SECUR 81.10 1,170,109,637.00 0.00 CITIGROUPGLOBAL MARKETS UK EQUITY LTD 51,974.96 9,299,602.00 0.01 CITIGROUPGLOBAL MKT 63.99 132,449,200.00 0.00 CJSC DEPOSITORY CLEARING CO 726.59 1,463,145.00 0.00 CLSA SECURITIES KOREA LTD. 20,961.40 182,000.00 0.12 CLSA SECURITIES MALAYSIA SDN BHD 3,316.18 1,827,100.00 0.00 CLSA SINGAPORE PTE LTD. 24,128.97 7,446,836.00 0.00 COLLINS STEWART 1,530.98 115,000.00 0.01 COLLINS STEWART + CO 1,052.89 48,843.00 0.02 COLLINS STEWART INC. 518.00 14,200.00 0.04 COLLINS STEWART LLC 87.50 1,750.00 0.05 COMMERCE INTL MERCHANT BANKERS 4,302.94 2,565,500.00 0.00 COMMERZBANK AG 1,565.92 2,117,656.98 0.00 COMMERZBANK AG LONDON 181.77 6,814.00 0.03 CORE PACIFIC SECURITIES INTL LIMITED 92.78 11,500.00 0.01 COWEN ANDCOMPANY, LLC 70,389.47 3,094,599.00 0.02 CRAIG - HALLUM 2,629.84 65,309.00 0.04 CREDIT AGRICLE INDOSUEZ 9,353.01 366,501.00 0.03 CREDIT AGRICOLE CIB 5,478.20 2,114,576.00 0.00 CREDIT AGRICOLE INDOSUEZ CHEUVREUX 83,805.24 3,480,346.00 0.02 CREDIT LYONNAIS CAPITAL INDONESIA 2,187.75 607,966.00 0.00 CREDIT LYONNAIS SECS 1,680.00 56,000.00 0.03 CREDIT LYONNAIS SECURITIES (USA) INC 87,604.51 52,912,932.00 0.00 CREDIT LYONNAIS SECURITIES ASIA GUERNSEY 8,024.88 20,123,700.00 0.00 CREDIT LYONNAIS SECURITIES(ASIA) 60,997.19 39,345,042.00 0.00 CREDIT RESEARCH + TRADING LLC 618.00 20,600.00 0.03 CREDIT SUISSE FIRST BOSTON 4,360.37 6,351,114,753.00 0.00 CREDIT SUISSE FIRST BOSTON (EUROPE) 15,889.45 270,683.00 0.06 CREDIT SUISSE FIRST BOSTON SA CTVM 20,077.55 3,708,096.00 0.01

OFFICE OF THE STATE TREASURER, DENISE L. NAPPIER S-33
PENSION FUNDS MANAGEMENT DIVISION
COMBINED INVESTMENT FUNDS SCHEDULE OF BROKERAGE COMMISSIONS (Continued)FOR THE FISCAL YEAR ENDED JUNE 30, 2010
$ Shares/ Avg $ Shares/ Avg Broker Name Commission Par Value Comm Broker Name Commission Par Value Comm
CREDIT SUISSE SECURITIES (EUROPE) LTD 184,016.72 2,976,809,604.67 0.00 CREDIT SUISSE SECURITIES (USA) LLC 875,270.14 5,279,159,755.54 0.00 CREDIT USA 834.18 53,876.00 0.02 CRESTCO LTD 671.65 91,811.00 0.01 CS FIRST BOSTON (HONG KONG) LIMITED 70,407.72 39,005,854.00 0.00 CS SECURITIES EUROPE LTD 16.60 901,660,065.00 0.00 CSFB AUSTRALIA EQUITIES LTD 10,019.52 1,411,849.00 0.01 CSI US INSTITUTIONAL DESK 1,044.00 26,100.00 0.04 CUSTOM EQUITY RESEARCH DBA SUMMER ST RES 39,018.88 1,989,379.00 0.02 D CARNEGIE AG 5,016.91 134,977.00 0.04 DAEWOO SECURITIES CO LTD 23,170.10 422,311.00 0.05 DAHLMAN ROSE + COMPANY LLC 1,506.00 44,000.00 0.03 DAISHIN SECURITIES CO. LTD. 1,988.07 94,815.00 0.02 DAIWA SECURITIES (HK) LTD. 9,039.38 2,994,072.00 0.00 DAIWA SECURITIES AMERICA INC 34,845.01 3,775,434.00 0.01 DANSKE BANK A.S. 6,707.37 92,022.00 0.07 DAVENPORT& CO. OF VIRGINIA, INC. 886.04 25,776.00 0.03 DAVIDSON D.A. + COMPANY INC. 5,949.48 146,937.00 0.04 DAVY STOCKBROKERS 1,958.74 199,838.00 0.01 DBS VICKERS (HONG KONG) LIMITED 4,516.47 1,380,000.00 0.00 DBS VICKERS SECURITIES (SINGAPORE) 5,978.23 2,036,800.00 0.00 DBS VICKERS SECURITIES(THAILAND) 3,050.44 1,048,000.00 0.00 DEAGROATT+ CAMPBELL SDN BHD 16,643.33 7,007,910.00 0.00 DENIZ YATIRIM MENKUL DEGERLER A.S. 4,048.85 1,431,214.00 0.00 DEPOSITORY CLEARING COMPANY 54.98 7,620.00 0.01 DEUTSCHE BANK AG JAKARTA 66.79 27,500.00 0.00 DEUTSCHE BANK AG LONDON 91,170.39 3,506,667,479.15 0.00 DEUTSCHE BANK ALEX BROWN 3,339.55 84,452.00 0.04 DEUTSCHE BANK SECURITIES 225.78 412.00 0.55 DEUTSCHE BANK SECURITIES INC 496,108.84 8,299,080,542.08 0.00 DEUTSCHE MORGAN GRENFELL SECS 12,945.36 1,665,635.00 0.01 DEUTSCHE SECURITIES ASIA LIMITED 44,280.18 21,248,046.00 0.00 DEUTSCHE SECURITIES ASIA LTD 6,602.41 88,158.00 0.07 DG BANK, DEUTSCHE GENOSSENSCHAFTSBA 901.07 6,014.00 0.15 DIRECT ACCESS PARTNERS LLC 1,554.70 83,980.00 0.02 DIRECT TRADING INSTITUTIONAL INC 4,490.70 384,728.00 0.01 DIVINE CAPITAL MARKETS LLC 72,317.80 3,288,396.00 0.02 DNB NOR MARKETS CUSTODY DNB NORBANK ASA 561.67 1,763.00 0.32 DONGWON SECURITIES 9,390.21 56,100.00 0.17 DOUGHERTYCOMPANY 3,225.42 94,708.00 0.03 DOWLING &PARTNERS 19,670.50 678,900.00 0.03 DRESDNER BANK AG, LONDON BRANCH 339.29 28,735.00 0.01 DUNDAS UNLU SECURITIES INC. 32,888.77 6,071,265.00 0.01 DUPONT GILBERT SA 2,223.83 49,964.00 0.04 E. OHMAN JOB FONDKOMMISSION AB 128.70 3,200.00 0.04 E.L.AND C. BAILLIEU LTD 308.45 914,372.00 0.00 EMERGING GROWTH EQUITIES LTD 1,154.30 115,430.00 0.01 ERSTE BANK DER OESTERREICHISCHEN 3,691.65 70,534.00 0.05 ESN NORTHAMERICA, INC. 1,784.20 600,991.00 0.00 EUROCLEARBANK S.A N.V. 133.84 52,601,597.40 0.00 EUROCLEARBANK SA NV 143.25 169,775.00 0.00 EUROMOBILIARE SIM S.P.A. 6,983.93 1,594,754.00 0.00 EVLI SECURITIES LTD 387.23 10,532.00 0.04 EVOLUTIONBEESON GREGORY LIMITED 3,181.52 261,186.00 0.01 EXANE S.A. 30,085.48 1,093,304.00 0.03 EXECUTION(HONG KONG) LIMITED 21,544.72 15,685,000.00 0.00 EXECUTIONLIMITED 5,019.90 1,043,015.00 0.00 FATOR - DORIA ATHERINO S.A CV 1,426.55 31,100.00 0.05 FIDELITY CAPITAL MARKETS 51,310.82 2,835,996.00 0.02 FIG PARTNERS LLC 482.52 12,063.00 0.04 FINANCIALBROKERAGE GROUP (FBG) 35,994.16 2,528,481.00 0.01 FINANCIERA SAN PEDRO-PERU 111.00 3,700.00 0.03 FIRST ANALYSIS SECURITIES CORP 1,403.18 30,794.00 0.05 FIRST CLEARING, LLC 130.24 3,256.00 0.04 FIRST SECURITIES ASA 2,020.94 333,925.00 0.01 FIRST SOUTHWEST COMPANY 5,827.20 145,680.00 0.04 FOKUS BANK ASA 78.20 6,455.00 0.01 FORSYTH BARR LTD 188.34 152,034.00 0.00 FORTIS BANK (NEDERLAND) N.V. 464.81 5,138.00 0.09 FOX PITT KELTON INC 3,130.55 75,151.00 0.04 FOX PITT KELTON LTD 6,567.62 816,877.00 0.01 FRIEDMAN BILLINGS + RAMSEY 23,018.68 899,398.00 0.03 G TRADE SERVICES LTD 1,392.64 377,980.00 0.00 GALATA SECURITIES INC 1,261.25 256,020.00 0.00 GARBAN EQUITIES LIMITED LONDON 477.27 651,000.00 0.00 GARDNER RICH & CO 4,329.12 155,254.00 0.03 GBM INTERNATIONAL INC. 1,803.50 257,688.00 0.01 GFI SECURITIES LLC 1,625.00 65,000.00 0.03 GK GOH SECURITIES (HK) LTD. 833.76 136,000.00 0.01 GLOBAL EQUITIES 848.29 25,386.00 0.03 GMP SECURITIES LTD. 2,133.99 56,601.00 0.04 GOLDMAN SACHS (ASIA) LLC 27,807.11 108,856.00 0.26 GOLDMAN SACHS + CO 379,485.70 2,066,750,074.56 0.00 GOLDMAN SACHS DO BRASIL BANCO MULTI AVEN 41.44 1,900.00 0.02 GOLDMAN SACHS DO BRASIL CORRETORA 2,449.49 37,943.00 0.06 GOLDMAN SACHS INTERNATIONAL 217,683.39 21,319,594.00 0.01
GOODBODY STOCKBROKERS 4,838.83 622,132.00 0.01 GORDON HASKETT 78.00 3,900.00 0.02 GREEN STREET ADVISORS 518.00 15,300.00 0.03 GREENTREEBROKERAGE SERVICES INC 2,246.20 84,255.00 0.03 GRIFFITHSMCBURNEY + PARTNERS 879.00 28,600.00 0.03 GRISWOLD COMPANY 115.40 5,770.00 0.02 GUZMAN + CO 22,918.44 1,581,466.00 0.01 HC ISTANBUL 32,865.08 6,687,520.00 0.00 HEDGING GRIFFO COR DE VAL S.A 1,209.13 38,625.00 0.03 HEEVERS &CO. INC. 3,390.04 101,818.00 0.03 HEFLIN + CO LLC 98,387.34 5,146,763.00 0.02 HELVEA SA 190.80 110.00 1.73 HIBERNIA SOUTHCOAST CAPITAL INC 2,090.56 48,967.00 0.04 HONGKONG + SHANGHAI BANKING 6,172.25 1,191,248.00 0.01 HONGKONG AND SHANGHAI BANKING CORP 41,476.01 13,726,000.00 0.00 HOWARD WEIL DIVISION LEGG MASON 4,985.40 101,172.00 0.05 HSBC BANKBRASIL SA BANCO MULTIPLO 2,004.65 10,993,151.00 0.00 HSBC BANKPLC 56,324.29 1,534,023,846.00 0.00 HSBC BROKERAGE (USA) INC. 1,761.84 44,046.00 0.04 HSBC JAMES CAPEL SEOUL 3,881.86 43,285.00 0.09 HSBC SECURITIES (USA) INC. 33,642.76 27,612,908,917.00 0.00 HSBC SECURITIES (USA), INC. 4,264.79 193,975.00 0.02 HVB CAPITAL MARKETS, INC 4,994.81 44,503.00 0.11 HYUNDAI SECURITIES CO. LTD. 28,014.74 803,111.00 0.03 ICAP CORPORATES LLC 7,014.92 187,523.00 0.04 ICAP DO BRASIL DTVM LTDA 852.18 76,113.00 0.01 ICAP SECURITIES LTD 9,367.19 269,957,151.00 0.00 ING BANK N V 43,659.14 91,117,709.00 0.00 ING FINANCIAL MARKETS LLC 70,404.93 27,543,282.00 0.00 INSTINET 266,473.49 10,072,931.00 0.03 INSTINET AUSTRALIA CLEARING SRVC PTY LTD 934.81 1,453,358.00 0.00 INSTINET CANADA 4.55 949.00 0.00 INSTINET LLC 4,819.70 424,409.00 0.01 INSTINET PACIFIC LIMITED 47,935.22 61,199,533.00 0.00 INSTINET SINGAPORE SERVICES PT 2,280.49 1,094,010.00 0.00 INSTINET U.K. LTD 83,430.75 22,613,417.00 0.00 INTERDIN BOLSA S.V.B., S.A. 926.22 47,078.00 0.02 INTERMONTE SEC SIM SPA 402.18 45,559.00 0.01 INVERLAT INTERNATIONAL 2,541.47 272,403.00 0.01 INVESTEC HENDERSON CROSTHWAITE 821.16 80,393.00 0.01 INVESTEC SECURITIES 4,542.54 624,582.00 0.01 INVESTMENT TECHNOLOGY GROUP INC. 211,022.13 19,011,502.00 0.01 INVESTMENT TECHNOLOGY GROUP LTD 38,355.44 6,673,616.00 0.01 ISI GROUPINC 37,532.43 1,768,798.00 0.02 ISLAND TRADER SECURITIES INC 213.32 21,332.00 0.01 ITG AUSTRALIA LTD. 3,115.17 2,817,115.00 0.00 ITG CANADA 826.66 48,600.00 0.02 ITG INC 785.92 103,917.00 0.01 ITG INC. 524.96 40,671.00 0.01 ITG SECURITIES (HK) LTD 30,964.28 10,771,666.00 0.00 IVY SECURITIES, INC. 177.00 5,900.00 0.03 J AND E DAVY 2,419.56 150,154.00 0.02 J B WERE AND SON 4,269.71 11,899,435.00 0.00 J P MORGAN SECURITIES INC 189,747.79 12,032,528,511.34 0.00 J.P. MORGAN CLEARING CORP. 152,802.45 149,776,875.07 0.00 J.P. MORGAN SECURITIES INC. 135,798.11 8,486,942.00 0.02 J.P. MORGAN SECURITIES LIMITED 9,553.07 1,267,809.00 0.01 J.P.MORGAN SECURITIES(FAR EAST)LTD SEOUL 28,779.21 277,408.00 0.10 JACKSON PARTNERS + ASSOCIATES INC 108.00 2,700.00 0.04 JACKSON SECURITIES 136,797.30 7,344,144.00 0.02 JANNEY MONTGOMERY, SCOTT INC 1,579.00 35,040.00 0.05 JB WERE AND SON (NZ) LTD 844.28 81,570.00 0.01 JEFFERIES+ COMPANY INC 539,434.16 98,992,089.42 0.01 JEFFERIESINTERNATIONAL LTD 7,353.67 3,220,242.00 0.00 JMP SECURITIES 11,112.43 257,352.00 0.04 JOH BERENBERG GOSSLER AND CO 22,791.90 386,190.00 0.06 JOHNSON RICE + CO 5,421.58 118,853.00 0.05 JONESTRADING INSTITUTIONAL SERVICES LLC 103,564.43 5,110,920.00 0.02 JP MORGANSECURITIES 2,934.75 13,914,692.00 0.00 JP MORGANSECURITIES AUSTRALIA LTD 19,749.94 3,433,717.00 0.01 JP MORGANSECURITIES LIMITED 150,406.64 184,202,405,873.30 0.00 JP MORGANSECURITIES SA 75.20 6,100.00 0.01 JPMORGAN CHASE BANK 4,646.46 19,519,579,904.90 0.00 JPMORGAN CHASE BANK N.A. LONDON 280.86 12,456.00 0.02 JPMORGAN SECURITIES(ASIA PACIFIC)LTD 74,180.43 31,226,452.00 0.00 KAS-ASSOCIATIE N.V. 5,148.31 210,032.00 0.02 KAUFMAN BROTHERS 591.43 25,253.00 0.02 KBC FINANCIAL PRODUCTS UK LTD 11,888.34 128,726.00 0.09 KBC PEEL HUNT LTD 5,830.62 1,446,470.00 0.00 KEEFE BRUYETTE + WOODS INC 19,138.45 754,856.00 0.03 KEEFE BRUYETTE AND WOOD LIMITED 6,695.61 1,644,154.00 0.00 KELLOGG PARTNERS 473.85 15,795.00 0.03 KEMPEN + CO N.V. 603.44 58,016.00 0.01 KEPLER EQUITIES 66.93 3,980.00 0.02 KEPLER EQUITIES FRANKFURT BRANCH 3,096.05 34,105.00 0.09 KEPLER EQUITIES PARIS 8,766.04 126,505.00 0.07

S-34 FISCAL YEAR 2010 ANNUAL REPORT
PENSION FUNDS MANAGEMENT DIVISION
COMBINED INVESTMENT FUNDS SCHEDULE OF BROKERAGE COMMISSIONS (Continued)FOR THE FISCAL YEAR ENDED JUNE 30, 2010
$ Shares/ Avg $ Shares/ Avg Broker Name Commission Par Value Comm Broker Name Commission Par Value Comm
KEPLER EQUITIES SUCURSAL EN ESPANA 1,325.15 61,557.00 0.02 KEPLER EQUITIES ZURICH 1,730.84 76,370.00 0.02 KEPPLER CAPITAL MARKETS 166.94 7,850.00 0.02 KEYBANC CAPITAL MARKETS INC 11,898.80 2,437,875.00 0.00 KIM ENG SECURITIES 13,867.69 10,373,410.00 0.00 KIM ENG SECURITIES, P.T. 586.91 133,500.00 0.00 KING, CL,& ASSOCIATES, INC 15,481.80 436,543.00 0.04 KNIGHT CLEARING SERVICES LLC 50.40 1,260.00 0.04 KNIGHT DIRECT LLC 36.00 4,614.00 0.01 KNIGHT SECURITIES 91,835.02 5,581,232.00 0.02 KNIGHT SECURITIES INTERNATIONAL 1,294.92 4,082,200.00 0.00 KNIGHT SECURITIES L.P. 6,591.94 2,680,670.00 0.00 LABRANCHEFINANCIAL SERVICES L 36,542.03 1,845,657.00 0.02 LADENBURGTHALMAN + CO 1,365.00 39,000.00 0.04 LANDESBANK BADEN WUERTTEMBERG 87.26 896.00 0.10 LARRAIN VIAL 9,198.33 653,221.00 0.01 LAZARD ASSET MANAGEMENT 5,931.34 633,204.00 0.01 LAZARD CAPITAL MARKETS LLC 4,229.39 304,127.00 0.01 LEERINK SWANN AND COMPANY 4,952.86 117,712.00 0.04 LEGENT CLEARING LLC 41.75 1,075.00 0.04 LIGHTHOUSE FINANCIAL GROUP LLC 3,012.73 86,367.00 0.03 LINK S.A CCTVM 419.43 31,374.00 0.01 LIQUIDNETASIA LIMITED 3,579.52 1,574,106.00 0.00 LIQUIDNETAUSTRALIA PTY LTD 103.08 26,192.00 0.00 LIQUIDNETEUROPE LIMITED 323.40 92,359.00 0.00 LIQUIDNETINC 27,555.77 1,334,660.00 0.02 LOOP CAPITAL MKTS LLC 47,933.11 1,932,881.00 0.02 M M WARBURG 550.82 6,366.00 0.09 M RAMSEY KING SECURITIES INC 11,703.04 408,768.00 0.03 MACQUARIEBANK LIMITED 49,581.79 3,389,411.00 0.01 MACQUARIECAPITAL (EUROPE) LTD 6,845.31 1,517,412.00 0.00 MACQUARIEEQUITIES LIMITED (SYDNEY) 28,356.83 7,170,445.00 0.00 MACQUARIEEQUITIES NEW YORK 2,599.33 97,210.00 0.03 MACQUARIEEQUITIES NEW ZEALAND 565.10 100,296.00 0.01 MACQUARIESEC NZ LTD 39.13 21,289.00 0.00 MACQUARIESECURITIES (SINGAPORE) 15,780.04 28,912,930.00 0.00 MACQUARIESECURITIES (USA) INC 727.55 16,431.00 0.04 MACQUARIESECURITIES LIMITED 150,138.78 86,558,550.00 0.00 MACQUARIESECURITIES LTD SEOUL 12,247.82 281,588.00 0.04 MAGAVCEO LEE + CO 1,345.80 44,860.00 0.03 MAGNA SECURITIES CORP 101,834.64 5,109,167.00 0.02 MEDIOBANCA SPA 6,505.42 749,196.00 0.01 MELVIN SECURITIES LLC 543.71 21,515.00 0.03 MERRILL LYNCH 7.42 29,738,706.00 0.00 MERRILL LYNCH (SINGAPORE) PTE LTD 631.91 876,000.00 0.00 MERRILL LYNCH AND CO INC 1,349.65 262,920.00 0.01 MERRILL LYNCH INTERNATIONAL 243,091.03 44,242,861.00 0.01 MERRILL LYNCH PEIRCE FENNER AND S 274,510.88 110,149,078.00 0.00 MERRILL LYNCH PIERCE FENNER + SMITH INC 144,284.07 102,863,490.55 0.00 MERRILL LYNCH PIERCE FENNER AND SMITH 4,766.74 953,342.00 0.01 MERRILL LYNCH PROFESSIONAL CLEARING CORP 2,821.61 68,785.00 0.04 MERRILL LYNCH, PIERCE FENNER SMITH 52.60 1,315.00 0.04 MERRIMAN CURHAN FORD + CO 1,114.45 24,966.00 0.04 MERRION CAPITAL GROUP 264.13 8,785.00 0.03 MF GLOBALUK LIMITED 10,925.12 693,950.00 0.02 MIDWEST RESEARCH SECURITIES 741.16 23,258.00 0.03 MIRAE ASSET HONG KONG LIMITED 302.48 68,000.00 0.00 MIRAE ASSET INVESTMENT MANAGEMENT CO LTD 2,566.98 4,363.00 0.59 MISCHLER FINANCIAL GROUP, INC-EQUITIES 38,061.30 1,831,848.00 0.02 MITSUBISHI UFJ SECURITIES (USA) 6,305.85 360,497.00 0.02 MITSUBISHI UFJ SECURITIES INT PLC 308.73 19,900.00 0.02 MIZUHO SEC ASIA LTD 4,224.34 597,300.00 0.01 MIZUHO SECURITIES USA INC 21,155.81 772,157.00 0.03 MKM PARTNERS 720.00 14,400.00 0.05 ML PROFESSIONAL CLEARING CORP 752.00 18,800.00 0.04 MONNESS, CRESPI, HARDT & CO. INC 40.80 816.00 0.05 MONTECITOADVISORS 29.60 740.00 0.04 MONTROSE SECURITIES EQUITIES 65,803.11 3,353,905.00 0.02 MONUMENT SECURITIES LIMITED 130.07 67,313.00 0.00 MORGAN KEEGAN & CO INC 9,036.32 4,786,600.00 0.00 MORGAN STANLEY 1,113.46 1,781,770.00 0.00 MORGAN STANLEY & CO. INCORPORATED/RETAIL 5,291.70 111,619,525.00 0.00 MORGAN STANLEY AND CO INTERNATIONAL 8,763.00 290,157.00 0.03 MORGAN STANLEY AND CO. INTERNATIONAL 71,133.13 50,833,475.57 0.00 MORGAN STANLEY CO INCORPORATED 806,365.27 1,383,729,190.05 0.00 MORGAN STANLEY DEAN WITTER AUSTRALIA 213.96 50,326.00 0.00 MORGAN STANLEY INTERNATIONAL LTD 123.70 5,500.00 0.02 MORGAN STANLEY SECURITIES LIMITED 6,210.90 703,292.00 0.01 MR BEAL &COMPANY 28,824.60 1,014,113.00 0.03 MSDWOR MORGAN ST CO INTL PLC 16.82 15,000.00 0.00 MULTITRADE SECURITIES LLC 488.26 12,375.00 0.04 MURIEL SIEBERT & CO, INC. 48.00 1,200.00 0.04 NATEXIS BLEICHROEDER INC 16,363.81 630,977.00 0.03 NATIONAL FINANCIAL SERVICES CORP. 19,705.73 8,558,717.00 0.00 NATIXIS SECURITIES 1,104.63 86,963.00 0.01 NBC CLEARING SERVICES INCORPORATED 4,997.37 132,005.00 0.04
NCB STOCKBROKERS LTD 924.06 176,923.00 0.01 NEEDHAM +COMPANY 8,757.39 192,963.00 0.05 NESBITT BURNS 4,081.13 5,034,860.00 0.00 NEUE ZURCHER BANK 1,098.26 2,011.00 0.55 NOMURA FINANCIAL AND INVESTMEN 1,076.62 24,270.00 0.04 NOMURA INTERNATIONAL (HONG KONG) LTD 1,981.53 4,282,000.00 0.00 NOMURA INTERNATIONAL PLC 83,268.51 11,171,902.00 0.01 NOMURA INTL (HK) LTD, SEOUL BR 7,863.62 232,561.00 0.03 NOMURA SECURITIES INTERNATIONAL INC 137,838.94 65,648,116.00 0.00 NORDEA BANK NORGE ASA 621.61 7,600.00 0.08 NORDIC PARTNERS 1,125.77 42,893.00 0.03 NORTH SOUTH CAPITAL LLC 57.80 1,410.00 0.04 NOVA CAPITAL MARKETS LLC 79.00 1,580.00 0.05 NUMIS SECURITIES INC. 21,938.75 2,078,407.00 0.01 NUMIS SECURITIES LIMITED 1,805.63 554,633.00 0.00 NUTMEG SECURITIES 2,054.00 89,900.00 0.02 NYFIX TRANSACTION SERVICES #2 1,089.39 210,924.00 0.01 NZB NEUE ZUERCHER BANK 7,843.32 87,674.00 0.09 NZB NEUE ZURCHER BANK 3,871.79 31,236.00 0.12 O NEIL, WILLIAM AND CO. INC/BCC CLRG 8,963.02 224,994.00 0.04 ODDO FINANCE 7,645.26 138,636.00 0.06 OIEN SECURITIES, INC 15,810.41 794,405.00 0.02 OLIVETREESECURITIES LIMITED 192.87 6,486.00 0.03 OPPENHEIM, SAL.,JR UND CIE KOELN 3,044.77 55,119.00 0.06 OPPENHEIMER + CO. INC. 22,841.43 4,466,302.63 0.01 ORIEL SECURITIES LTD 575.56 50,526.00 0.01 OYAK MENKUL DEGERELER A S 330.44 54,670.00 0.01 PACIFIC AMERICAN SECURITIES, LLC 91,638.24 4,487,252.00 0.02 PACIFIC CREST SECURITIES 6,612.30 190,795.00 0.03 PANMURE GORDON AND CO LTD 2,512.95 279,648.00 0.01 PAREL 5,096.41 67,868.00 0.08 PARIBAS SECURITIES INC 35,484.44 5,253,280.00 0.01 PCS DUNBAR SECURITIES 2,532.35 50,647.00 0.05 PENSERRA SECURITIES LLC 3,690.71 291,371.00 0.01 PENSON FINANCIAL SERVICES CANADA INC 15,719.94 550,562.00 0.03 PENSON FINANCIAL SERVICES INC 1,845.08 59,036.00 0.03 PERCIVAL FINANCIAL PARTNERS LTD. 5,860.00 146,500.00 0.04 PERSHING DLJ S L 155,583.82 49,961,089.00 0.00 PERSHING LLC 35,783.70 102,039,757.31 0.00 PERSHING SECURITIES LIMITED 46,019.38 1,698,525.00 0.03 PETERCAM S.A. 5,627.64 85,755.00 0.07 PICKERINGENERGY PARTNERS, INC 688.90 13,778.00 0.05 PIPELINE TRADING SYSTEMS LLC 2,658.92 454,571.00 0.01 PIPER JAFFRAY 18,610.61 6,415,286.00 0.00 PODESTA +CO 170.50 3,950.00 0.04 PRITCHARDCAPITAL PARTNERS LLC 461.00 9,220.00 0.05 PULSE TRADING LLC 57,998.54 3,039,172.00 0.02 RABOBANK INTL 395.97 5,196.00 0.08 RASHID HUSSAIN SECURITIES SDN 2,338.00 1,704,900.00 0.00 RAYMOND JAMES + ASSOCIATES INC 418.35 6,320.00 0.07 RAYMOND JAMES AND ASSOCIATES INC 24,534.05 769,768.92 0.03 RAYMOND JAMES TRUST COMPANY 5,012.61 1,575,691.00 0.00 RBC CAPITAL MARKETS 59,841.72 193,473,666.73 0.00 RBC DOMINION SECURITIES INC. 7,205.35 6,936,164.00 0.00 RBS EQUITIES (AUSTRALIA) LIMITED 4,709.57 513,007.00 0.01 RBS SECURITIES INC 22,219.09 2,297,894.00 0.01 REDBURN PARTNERS LLP 904.25 22,000.00 0.04 RENAISSANCE CAPITAL GROUP 1,133.79 36,510.00 0.03 RENAISSANCE CAPITAL LTD 224.27 75,518.00 0.00 REYNDERS,GRAY + COMPANY,INC 10,975.76 200,891.00 0.05 RIDGE CLEARING + OUTSOURCING SOLUTIONS 34,188.57 11,243,929.92 0.00 RIDGE CLEARING AND OUTSOURCING SOLUTIONS 2,239.77 1,320,790.00 0.00 ROBERTS +RYAN INVESTMENTS INC 103,575.65 5,303,372.00 0.02 ROCHDALE SEC CORP.(CLS THRU 443) 66,129.96 3,208,558.00 0.02 RODMAN & RENSHAW LLC 182.50 6,325.00 0.03 ROSENBLATT SECURITIES LLC 22,057.90 1,102,895.00 0.02 ROTH CAPITAL PARTNERS LLC 1,657.10 33,515.00 0.05 SALOMON BROS INC 216.00 1,002,500.00 0.00 SAMSUNG SECURITIES CO LTD 14,032.20 550,282.00 0.03 SAMUEL A RAMIREZ & COMPANY INC 17,513.27 1,284,713.00 0.01 SANDERS MORRIS HARRIS 4,548.60 113,050.00 0.04 SANDLER ONEILL + PART LP 345.00 11,500.00 0.03 SANFORD C. BERNSTEIN LTD 57,395.50 10,024,728.00 0.01 SANFORD CBERNSTEIN CO LLC 45,292.25 2,977,289.00 0.02 SANTANDERCENTRAL HISPANO BOLSA 320.82 14,200.00 0.02 SANTANDERINVESTMENT SECURITIES INC 53.85 10,001,077.00 0.00 SCOTIA CAPITAL (USA) INC 3,448.90 2,366,406.00 0.00 SCOTIA CAPITAL MKTS 11,087.72 371,864.00 0.03 SCOTT & STRINGFELLOW, INC 28,319.99 8,114,410.12 0.00 SEI FINANCIAL SER CO 972.00 24,300.00 0.04 SEI INVESTMENTS DISTRIBUTION CO 576.00 14,400.00 0.04 SG AMERICAS SECURITIES LLC 4,381.47 316,854.00 0.01 SG SECURITIES HK 13,713.09 6,626,298.00 0.00 SHAW STOCKBROKING LTD (SYDNEY) 210.66 171,332.00 0.00 SHORE CAPITAL STOCKBROKERS LTD 161.45 5,325.00 0.03 SIDOTI + COMPANY LLC 5,273.82 114,871.00 0.05

OFFICE OF THE STATE TREASURER, DENISE L. NAPPIER S-35
PENSION FUNDS MANAGEMENT DIVISION
COMBINED INVESTMENT FUNDS SCHEDULE OF BROKERAGE COMMISSIONS (Continued)FOR THE FISCAL YEAR ENDED JUNE 30, 2010
$ Shares/ Avg Broker Name Commission Par Value Comm
SIMMONS +COMPANY INTERNATIONAL 1,272.00 40,025.00 0.03 SKANDINAVISKA ENSKILDA BANK 538.97 57,215.00 0.01 SKANDINAVISKA ENSKILDA BANKEN LONDON 8,336.70 430,057.00 0.02 SOCIETE GENERALE 17,975.95 1,378,815.00 0.01 SOCIETE GENERALE BANK AND TRUST 487.55 5,270.00 0.09 SOCIETE GENERALE LONDON BRANCH 78,493.07 3,280,123.00 0.02 SOLEIL SECURITIES 5,866.75 146,775.00 0.04 SOUTHERN CROSS EQUITIES 211.62 21,877.00 0.01 SOUTHWESTSECURITIES 696.99 2,879,392.00 0.00 SOUTHWESTSECURITIES, INC. 2,086.00 17,089,834.40 0.00 SPEAR, LEEDS AND KELLOGG 148.88 25,766.00 0.01 STANDARD CHARTERED BANK (HONG KONG) LIMI 12,034.83 2,662,400.00 0.00 STANLEY (CHARLES) + CO LIMITED 186.95 92,752.00 0.00 STATE STREET BANK + TRUST CO LONDON 143,044.91 9,508,972.00 0.02 STATE STREET GLOBAL MARKETS 101,740.00 5,415,000.00 0.02 STATE STREET GLOBAL MARKETS, LLC 19,353.70 1,139,148.00 0.02 STEPHENS,INC. 3,887.22 11,055,754.90 0.00 STERNE AGEE & LEACH INC. 1,618.71 1,202,480.00 0.00 STIFEL NICOLAUS + CO INC 29,592.47 29,239,726.36 0.00 STUART FRANKEL + CO INC 14,377.07 751,602.00 0.02 STUDNESS RESEARCH 1,029.00 37,400.00 0.03 STURDIVANT + CO INC 309.00 10,300.00 0.03 SUNTRUST CAPITAL MARKETS, INC. 11,796.48 425,116.00 0.03 SVENSKA HANDELSBANKEN 15,245.61 818,736.00 0.02 SVENSKA HANDELSBANKEN LONDON BRANCH 4,626.78 161,827.00 0.03 SWAP BROKER 7,336.72 85,074,843.00 0.00 SWEDBANK 2,698.37 104,828.00 0.03 TD WATERHOUSE CDA 2,220.03 11,411,708.00 0.00 TEB YATIRIM MENKUL DEGERLER A.S. 1,374.64 122,500.00 0.01 THE BENCHMARK COMPANY, LLC 413.65 8,613.00 0.05 THE ROYALBANK OF SCOTLAND N.V.UK EQUITI 50,781.57 7,517,675.00 0.01 THEMIS TRADING LLC 47,467.87 2,482,760.00 0.02 THINKEQUITY PARTNERS LLC 4,724.19 103,666.00 0.05 THINKEQUITY PARTNERS, LLC 60.00 2,000.00 0.03 THOMAS WEISEL PARTNERS LLC 47,062.40 1,979,036.00 0.02 TORONTO DOMINION BANK 1,108.30 610,709.00 0.00 TROIKA DIALOG USA, INC 2,108.54 163,525.00 0.01 UBS AG 299,451.32 152,822,570.63 0.00 UBS AG LONDON 84,592.90 167,067,287.00 0.00 UBS SECS LLC/EQUITIES,NY 2,480.73 5,550.00 0.45 UBS SECURITIES ASIA LTD 139,851.66 70,470,362.00 0.00 UBS SECURITIES CANADA INC 2,544.03 96,780.00 0.03 UBS SECURITIES LLC 219,901.87 299,667,475.22 0.00 UBS SECURITIES PTE.LTD., SEOUL 32,280.01 195,179.00 0.17 UBS SECURITIES SINGAPORE PTE 6,767.42 12,748,190.00 0.00 UBS WARBURG (HONG KONG) LIMITED 2,180.57 233,200.00 0.01 UBS WARBURG AUSTRALIA EQUITIES 406.44 12,203.00 0.03 UBS WARBURG LLC 81,464.27 6,086,179.00 0.01 UNICREDITSPA 38.83 1,833.00 0.02 UNX INC. 9,670.31 507,601.00 0.02 UOB KAY HIAN (HONG KONG) LTD 858.66 879,670.00 0.00 UOB KAY HIAN PTE LIMITED 9,797.16 1,039,597.00 0.01 UOB KAY HIAN SECURITIES 5,977.12 1,888,850.00 0.00 UOB KAY HIAN SECURITIES PT 4,897.93 11,230,000.00 0.00 UTENDAHL CAPITAL PARTNERS 188.00 4,700.00 0.04 VANDHAM SECURITIES CORP 8,297.64 207,441.00 0.04 VICKERS BALLAS TAMARA PT 2,586.66 9,450,000.00 0.00 VTB BANK EUROPE PLC 1,653.87 475,969.00 0.00 W.J. BONFANTI INC 3.08 154.00 0.02 WACHOVIACAPITAL MARKETS, LLC 36,999.27 11,815,244.00 0.00 WEDBUSH MORGAN SECURITIES INC 9,944.19 16,508,400.73 0.00 WEEDEN + CO. 119,168.71 8,248,490.00 0.01 WELLS FARGO INVT LLC 574.75 10,703.00 0.05 WILLIAM BLAIR & COMPANY L.L.C 19,791.97 461,508.00 0.04 WILLIAMS CAPITAL GROUP LP (THE) 51,338.93 2,571,276.00 0.02 WINTERFLOOD SECURITIES LTD 237.71 50,000.00 0.00 WOOD AND COMPANY 3,444.60 46,627.00 0.07 WOORI INVESTMENT SECURITIES 7,130.59 120,800.00 0.06 YAMNER & CO INC (CLS THRU 443) 6,425.09 641,573.00 0.01 YUANTA CORE PACIFIC SECURITIES 338.18 84,000.00 0.00 ZANNEX SECURITIES 117.78 19,586.00 0.01
TOTAL $14,385,489.29

S-36 FISCAL YEAR 2010 ANNUAL REPORT
Agency Securities – Securities, usually bonds, issued by U.S. Government agencies. These securities have high credit ratings but are not backed by the full faith and credit of the U.S. Government.
Alpha - A coeffi cient which measures risk-adjusted performance, factoring in the risk due to the specifi c security, rather than the overall market. A high value for alpha implies that the stock or mutual fund has performed better than would have been expected given its beta (volatility).
Asset - Anything owned that has economic value; any interest in property, tangible or intangible, that can be used for payment of debts.
Asset Backed Security- Bonds or notes collateralized by one or more types of assets including real property, mortgages, and receivables.
Banker’s Acceptance (BA) - A high-quality, short-term negotiable discount note, drawn on and accepted by banks which are obligated to pay the face amount at maturity.
Basis Point (bp) - The smallest measure used in quoting yields or returns. One basis point is 0.01% of yield, 100 basis points equals 1%. For example, a yield that changed from 8.75% to 9.50% has increased by 75 basis points.
Benchmark - A standard unit used as the basis of comparison; a universal unit that is identifi ed with suffi cient detail so that other similar classifi cations can be compared as being above, below, or comparable to the benchmark.
Beta - A quantitative measure of the volatility of a given stock, mutual fund or portfolio relative to the overall market.Book Value (BV) - The value of individual assets, calculated as actual cost minus accumulated depreciation. Book value may be more
or less than current market value.Capital Gain (Loss) - Also known as capital appreciation (depreciation), capital gain (loss) measures the increase (decrease) in value
of an asset over time. Certifi cates of Deposit (CDs) - A debt instrument issued by banks, usually paying interest, with maturities ranging from 3 months to
six years.Citigroup Broad Investment-Grade Bond Index (CBIG) - A market value-weighted index composed of over 4,000 individually priced
securities with a quality rating of at least BBB. Each issue has a minimum maturity of one year with an outstanding par amount of at least $25 million.
Citigroup World Government Bond Index Non-U.S. (CWGBI) - An unhedged index measuring government issues of 12 major industrialized countries.
Coeffi cient of Determination (R2) - A statistic which indicates the amount of variability in a dependent variable, such as Fund returns, which may be explained by an independent variable, such as market returns, in a regression model. The coeffi cient of determination is denoted R2 and ranges from 0 to 1.0. If the statistic measures 0, the independent variable offers no explanation of the dependent variable. If the statistic measures 1.0, the independent variable fully explains the dependent variable.
Collateral – Assets pledged by a borrower to secure a loan or other credit, and subject to seizure in the event of default.Collateralized Mortgage Obligation (CMO) – A mortgage-backed, investment-grade bond that separates mortgage pools into different
maturity classes. CMO payment obligations are backed by mortgage-backed securities with a fi xed maturity. Commercial Paper - Short-term obligations with maturities ranging from 2 to 270 days. An unsecured obligation issued by a corporation
or bank to fi nance its short-term credit needs. Compounded Annual Total Return - Compounded annual total return measures the implicit annual percentage change in value of
an investment, assuming reinvestment of dividends, interest, and realized capital gains, including those attributable to currency fl uctuations. In effect, compounded annual total return “smoothes” fl uctuations in long-term investment returns to derive an implied year-to-year annual return.
Consumer Price Index (CPI) - A measure of change in the cost of a fi xed basket of products and services as determined by a monthly survey of the U.S. Bureau of Labor Statistics. Components of the CPI include housing costs, food, transportation, and electricity.
Cumulative Rate of Return - A measure of the total return earned for a particular time period. This calculation measures the absolute percentage change in value of an investment over a specifi ed period, assuming reinvestment of dividends, interest income, and realized capital gains. For example, if a $100 investment grew to $120 in a two-year period, the cumulative rate of return would be 20%.
Current Yield - The relationship between the stated annual interest or dividend rate and the market price of a security. In calculating current yield, only income payments are considered; no consideration is given to capital gain/loss.
Derivative - Derivatives are generally defi ned as contracts whose value depend on, or derived from, the value of an underlying asset, reference rate, or index. For example, an option is a derivative instrument because its value derives from an underlying stock, stock index, or future.
Discount Rate - The interest rate that the Federal Reserve charges banks for loans, using government securities or eligible paper as collateral.
PENSION FUNDS MANAGEMENT DIVISION
GLOSSARY OF INVESTMENT TERMS

OFFICE OF THE STATE TREASURER, DENISE L. NAPPIER S-37
Diversifi cation – A portfolio strategy designed to reduce exposure to risk by putting assets in several different securities or categories of investments.
Duration - A measure of the average time to receipt of all bond cash fl ows. Duration is used to determine the percentage change in price of a fi xed income security for a given change in the security’s yield to maturity. Duration is stated in terms of time periods, generally years. (See Modifi ed and Macaulay duration).
Equity - The ownership interest possessed by shareholders in a corporation in the form of common stock or preferred stock.ERISA (Employee Retirement Income Security Act) - The 1974 federal law which established legal guidelines for private pension
plan administration and investment practices. Expense Ratio – Operating costs (including management fees) expressed as a percentage of the fund’s average net assets for a given
time period. Fair Value - The amount at which a fi nancial instrument could be exchanged in a current transaction between willing parties, other than
in a forced or liquidation sale.Federal Funds Rate - The interest rate that banks charge each other for the use of Federal Funds. This rate changes daily and is a
sensitive indicator of general interest rate trends. Federal Reserve Board – The 7- member Board of Governors that oversees Federal Reserve Banks, establishes monetary policy and
monitors the economic health of the economy. Fiduciary - A person, company, or association holding assets in trust for a benefi ciary. The fi duciary is charged with the responsibility
to invest the money prudently for the benefi ciary’s benefi t.Fitch Investor Services - A fi nancial services rating agency.Floating Rate Note - A fi xed principal instrument which has a long or even indefi nite life and whose yield is periodically reset relative to
a reference index rate to refl ect changes in short- or intermediate-term interest rates.Gross Domestic Product - Total fi nal value of goods and services produced in the United States over a particular period or time, usually
one year. The GDP growth rate is the primary indicator of the health of the economy.Hedge - An investment in assets which serves to reduce the risk of adverse price movements in a security, by taking an offsetting position
in a related security, such as an option or short sale. Index - A benchmark used in executing investment strategy which is viewed as an independent representation of market performance.
Example: S&P 500 index.Index Fund – A passively managed fund that tries to mirror the performance of a specifi c index, such as the S&P 500.Infl ation – The overall general upward price movement of goods and services in an economy, usually as measured by the Consumer
Price Index and the Producer Price Index.Investment Income - The equity dividends, bond interest, and/or cash interest paid on an investment.J-Curve - An economic theory stating that a policy designed to have one effect will initially have the opposite effect. With regard to
closed end commingled fund investments, this generally refers to the impact on returns of contributions made in the early portion of a fund’s existence. Invested capital is used to pay fees and organizational costs as well as to make investments in non-income producing enterprises. Such uses negatively impact returns in early periods but are expected to generate increasing income and valuations in the late periods as the previously non-income producing entities start producing income and the relative size of fees and other costs diminish relative to the value of invested capital.
JP Morgan Emerging Markets Bond Index Plus (EMBI+) - An index which tracks total returns for traded external debt instruments in the emerging markets. The instruments include external-currency-denominated Brady bonds, loans and Eurobonds, as well as U.S. dollar local markets instruments. The EMBI+ expands upon Morgan’s original Emerging Markets Bond Index, which was introduced in 1992 and covers only Brady bonds.
LB Aggregate Index - An index made up of Government, Corporate, Mortgage Backed, and Asset Backed securities, all rated investment grade. Returns are market value weighted inclusive of interest. Issues must have at least one year to maturity and an outstanding par value of at least $200 million.
Letter of Credit - An instrument or document issued by a bank, guaranteeing the payment of a customer’s drafts up to a stated amount for a specifi ed period. It substitutes the bank’s credit for the buyer’s and eliminates the seller’s risk.
Liability - The claim on the assets of a company or individual - excluding ownership equity. An obligation that legally binds an individual or company to settle a debt.
Leverage - The use of borrowed funds to increase purchasing power and, ideally, to increase profi tability of an investment transaction or business.
Macaulay Duration - The weighted-average term to maturity of a bond’s cash fl ows. The weighting is based on the present value of each cash fl ow divided by price.
Market Value – A security‘s last reported sale price or its current bid and ask prices. The price as determined dynamically by buyers and sellers in an open market.
PENSION FUNDS MANAGEMENT DIVISION
GLOSSARY OF INVESTMENT TERMS (Continued)
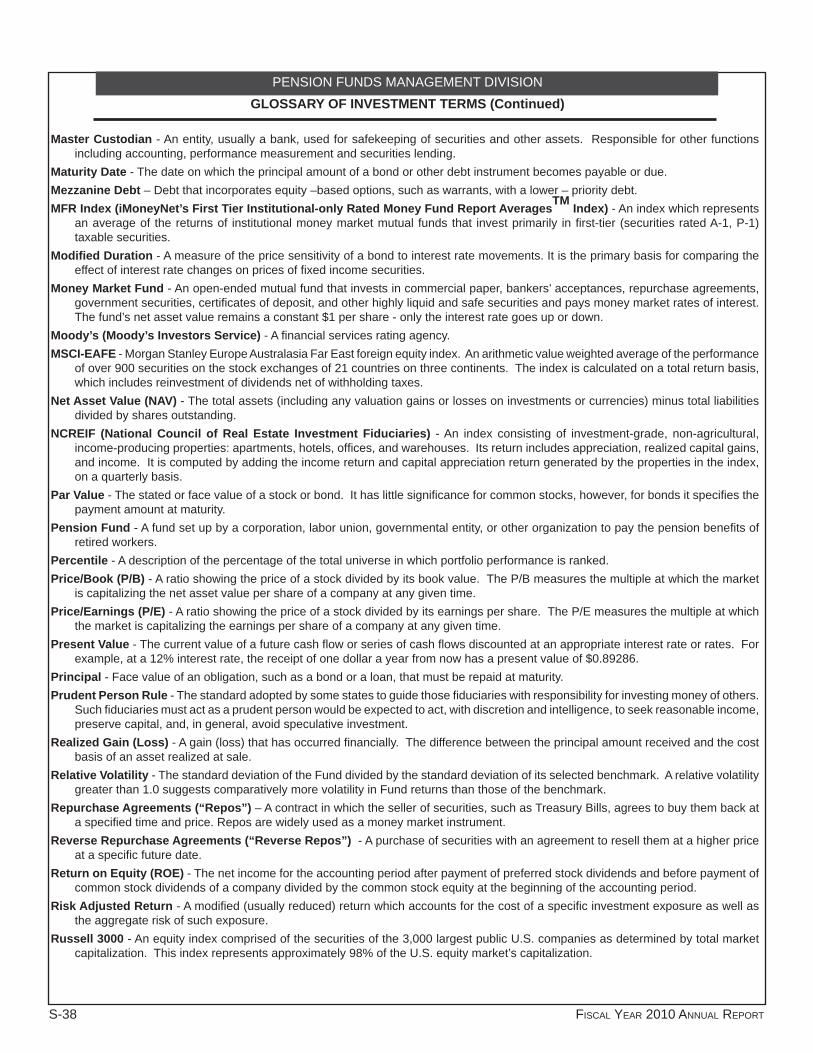
S-38 FISCAL YEAR 2010 ANNUAL REPORT
PENSION FUNDS MANAGEMENT DIVISIONGLOSSARY OF INVESTMENT TERMS (Continued)
Master Custodian - An entity, usually a bank, used for safekeeping of securities and other assets. Responsible for other functions including accounting, performance measurement and securities lending.
Maturity Date - The date on which the principal amount of a bond or other debt instrument becomes payable or due.Mezzanine Debt – Debt that incorporates equity –based options, such as warrants, with a lower – priority debt. MFR Index (iMoneyNet’s First Tier Institutional-only Rated Money Fund Report AveragesTM Index) - An index which represents
an average of the returns of institutional money market mutual funds that invest primarily in fi rst-tier (securities rated A-1, P-1) taxable securities.
Modifi ed Duration - A measure of the price sensitivity of a bond to interest rate movements. It is the primary basis for comparing the effect of interest rate changes on prices of fi xed income securities.
Money Market Fund - An open-ended mutual fund that invests in commercial paper, bankers’ acceptances, repurchase agreements, government securities, certifi cates of deposit, and other highly liquid and safe securities and pays money market rates of interest. The fund’s net asset value remains a constant $1 per share - only the interest rate goes up or down.
Moody’s (Moody’s Investors Service) - A fi nancial services rating agency.MSCI-EAFE - Morgan Stanley Europe Australasia Far East foreign equity index. An arithmetic value weighted average of the performance
of over 900 securities on the stock exchanges of 21 countries on three continents. The index is calculated on a total return basis, which includes reinvestment of dividends net of withholding taxes.
Net Asset Value (NAV) - The total assets (including any valuation gains or losses on investments or currencies) minus total liabilities divided by shares outstanding.
NCREIF (National Council of Real Estate Investment Fiduciaries) - An index consisting of investment-grade, non-agricultural, income-producing properties: apartments, hotels, offi ces, and warehouses. Its return includes appreciation, realized capital gains, and income. It is computed by adding the income return and capital appreciation return generated by the properties in the index, on a quarterly basis.
Par Value - The stated or face value of a stock or bond. It has little signifi cance for common stocks, however, for bonds it specifi es the payment amount at maturity.
Pension Fund - A fund set up by a corporation, labor union, governmental entity, or other organization to pay the pension benefi ts of retired workers.
Percentile - A description of the percentage of the total universe in which portfolio performance is ranked.Price/Book (P/B) - A ratio showing the price of a stock divided by its book value. The P/B measures the multiple at which the market
is capitalizing the net asset value per share of a company at any given time.Price/Earnings (P/E) - A ratio showing the price of a stock divided by its earnings per share. The P/E measures the multiple at which
the market is capitalizing the earnings per share of a company at any given time.Present Value - The current value of a future cash fl ow or series of cash fl ows discounted at an appropriate interest rate or rates. For
example, at a 12% interest rate, the receipt of one dollar a year from now has a present value of $0.89286.Principal - Face value of an obligation, such as a bond or a loan, that must be repaid at maturity.Prudent Person Rule - The standard adopted by some states to guide those fi duciaries with responsibility for investing money of others.
Such fi duciaries must act as a prudent person would be expected to act, with discretion and intelligence, to seek reasonable income, preserve capital, and, in general, avoid speculative investment.
Realized Gain (Loss) - A gain (loss) that has occurred fi nancially. The difference between the principal amount received and the cost basis of an asset realized at sale.
Relative Volatility - The standard deviation of the Fund divided by the standard deviation of its selected benchmark. A relative volatility greater than 1.0 suggests comparatively more volatility in Fund returns than those of the benchmark.
Repurchase Agreements (“Repos”) – A contract in which the seller of securities, such as Treasury Bills, agrees to buy them back at a specifi ed time and price. Repos are widely used as a money market instrument.
Reverse Repurchase Agreements (“Reverse Repos”) - A purchase of securities with an agreement to resell them at a higher price at a specifi c future date.
Return on Equity (ROE) - The net income for the accounting period after payment of preferred stock dividends and before payment of common stock dividends of a company divided by the common stock equity at the beginning of the accounting period.
Risk Adjusted Return - A modifi ed (usually reduced) return which accounts for the cost of a specifi c investment exposure as well as the aggregate risk of such exposure.
Russell 3000 - An equity index comprised of the securities of the 3,000 largest public U.S. companies as determined by total market capitalization. This index represents approximately 98% of the U.S. equity market’s capitalization.

OFFICE OF THE STATE TREASURER, DENISE L. NAPPIER S-39
PENSION FUNDS MANAGEMENT DIVISION
GLOSSARY OF INVESTMENT TERMS (Continued)
Securities Lending - A carefully collateralized process of loaning portfolio positions to custodians, dealers, and short sellers who must make physical delivery of positions. Securities lending can reduce custody costs or enhance annual returns by a full percentage point or more in certain market environments.
Soft Dollars - The value of research or other services that brokerage houses and other service entities provide to a client “free of charge” in exchange for the client’s brokerage.
S&P 500 (Standard & Poor’s) – A basket of 500 stocks considered to be widely held. The performance of this index is thought to be representative of the stock market as a whole. The index selects its constituents based upon their market size, liquidity and sector. S&P 500 stocks are considered to be the leading large (to mid) cap corporations in a given sector.
S&P Credit Ratings Service - A fi nancial services rating agency.Standard Deviation - A statistical measure showing the deviation of an individual value in a probability distributed from the mean
(average) of the distribution. The greater the degree of dispersion from the mean rate of return, the higher the standard deviation; therefore, the higher the risk.
Total Fund Benchmark - A hybrid benchmark customized to refl ect the CRPTF’s asset allocation and performance objectives. This benchmark is comprised of 36% Russell 3000 Index; 18% International Stock Fund benchmark; 29% Mutual Fixed Income benchmark; 5% Russell 3000 Index; 11% S&P 500 Index; and 1% MFR First Tier Rated Index. The International Stock Fund benchmark is comprised of 83% Citigroup Europe, Pacifi c, Asia Composite Broad Market Index (50% Hedged) and 17% MSCI Emerging Market Free Index. The Mutual Fixed Income benchmark consists of 73% Lehman Brothers U. S. Aggregate Index, 17% S&P/Citigroup High Yield Market Index, and 10% JPM Emerging Markets Bond Index.
Treasury Bill (T-Bill) - Short-term, highly liquid government securities issued at a discount from the face value and returning the face amount at maturity.
Treasury Bond or Note - Debt obligations of the Federal government that make semiannual coupon payments and are sold at or near par value in denominations of $1,000 or more.
Trust - A fi duciary relationship in which a person, called a trustee, holds title to property for the benefi t of another person, called a benefi ciary.
TUCS - Trust Universe Comparison Service. TUCS is based upon a pooling of quarterly trust accounting data from participating banks and other organizations that provide custody for trust assets.
Turnover - Security purchases or sales divided by the fi scal year’s beginning and ending market values for a given portfolio.Unrealized Gain (Loss) - A profi t (loss) that has not been realized through the sale of a security. The gain (loss) is realized when a
security or futures contract is actually sold or settled.Variable Rate Note - Floating rate notes with a coupon rate adjusted at set intervals, such as daily, weekly, or monthly, based on
different interest rate indices, such as LIBOR, Fed Funds, and Treasury Bills.Volatility - A statistical measure of the tendency of a market price or yield to vary over time. Volatility is said to be high if the price,
yield, or return typically changes dramatically in a short period of time.Yield - The return on an investor’s capital investment.Yield Curve - A graph showing the term structure of interest rates by plotting the yields of all bonds of the same quality with maturities
ranging from the shortest to the longest possible. The Y-axis represents the interest rate and the X-axis represents time, generally with a normal curve that is convex in shape.
Zero Coupon Bond - A bond paying no interest that sells at a discount and returns principal only at maturity.

S-40 FISCAL YEAR 2010 ANNUAL REPORT
PENSION FUNDS MANAGEMENT DIVISION
UNDERSTANDING INVESTMENT PERFORMANCE
IntroductionThis section discusses the Treasury’s approach to measuring performance, including risk and return of the Connecticut
Retirement Plans and Trust Funds (CRPTF).
Understanding PerformanceTo measure success in achieving the primary objective of the Asset Allocation Plan, the Fund’s performance is evaluated
in two principal areas: risk and return. The results of these reviews, coupled with information on portfolio characteristics, are used to monitor and improve the performance of the Fund’s external investment advisors.
To bring accountability and perspective to Fund performance and measurements of risk and return, The Connecticut Retirement Plans and Trust Funds are compared to those of similarly structured peer groups and indices. These com-parisons enable plan participants, the Treasurer and the Investment Advisory Council, to determine whether and by how much Fund returns exceeded or fell short of the benchmarks. Each Fund’s benchmark is selected on the basis of portfolio composition, investment style, and objectives.
Comparative performance is reviewed over both the near-term and the long-term for two reasons. First, pension management is, by its very nature, a long-term process. While both young and old employees comprise the pool of plan benefi ciaries, the average age of plan participants is relatively low and requires that plan assets be managed for the long term. Second, as experience has shown, results attained in the short term are not necessarily an indicator of results to be achieved over the long term. Performance must be viewed in a broader context.
Overall performance is measured by calculating monthly returns and linking them to provide one-, three-, fi ve- and ten-year histories of overall investment performance. Short-term performance is measured by total return over one-month, quarter-end, and trailing one-year time periods. Risk is also measured over both short- and the long-term periods.
RiskThe measurement of risk is a critical component in investment management. It is the basis for both strategic decision-making and investment evaluation. As an investment tool, investors assume risk to enhance portfolio returns. These enhancements, viewed as returns in excess of those available on “risk-free” investments, such as Treasury Bills, vary in magnitude according to the degree of risk assumed. Many investors focus on the negative aspects of risk and in doing so forego substantial upside potential, which can signifi cantly enhance long-term returns. Thus, while risk can never be completely eliminated from a portfolio, the prudent management of risk can maximize investment returns at acceptable levels of risk.
Risk can take several forms and include: market risk, the risk of fl uctuations in the overall market for securities; company risk, the risk of investing in any single company’s stock or bonds; currency-exchange risk, the risk that a foreign country’s currency may appreciate or depreciate relative to the U.S. dollar, thus impacting the value of foreign investments; and political risk, risk incurred through investing in foreign countries with volatile economies and political systems.
With respect to fi xed income investments, investors also assume: reinvestment risk, the risk that cash fl ows received from a security will be reinvested at lower rates due to declining interest rates; credit or default risk, the risk that the issuer of a fi xed income security may fail to make principal and interest payments on the security; interest rate risk, the risk that prices of fi xed coupon bonds will decline in the event of rising market interest rates; and infl ation or purchasing power risk, the risk that the real value of a security and its cash fl ows may be reduced by infl ation. The level of risk incurred in fi xed income investing increases as the investment time horizon is lengthened. This is demonstrated by the comparatively higher yields available on “long bonds,” or bonds maturing in 20 to 30 years, versus those available on short-term fi xed income securities.
In the alternative investment category, risks are signifi cantly greater than those of publicly traded investments. Assess-ment of progress is more tenuous and valuation judgments are more complex. The investor assumes not only manage-ment, product, market, and operations risk, similar to equity investing, but also assumes liquidity risk, the risk that one’s investment cannot be immediately liquidated at other than substantially discounted value.

OFFICE OF THE STATE TREASURER, DENISE L. NAPPIER S-41
PENSION FUNDS MANAGEMENT DIVISION
UNDERSTANDING INVESTMENT PERFORMANCE (Continued)
VolatilityTo measure the effects of risk on the portfolio, the volatility of returns is calculated over time. Volatility, viewed as de-viation of returns from an average of these returns over time, is measured statistically by standard deviation. Standard deviation is one of the most widely accepted and descriptive risk measures used by investment professionals today. Funds with high standard deviations are considered riskier than those with low standard deviations.
To evaluate the signifi cance of the Funds’ standard deviation, each Fund’s relative volatility, or the ratio of the Fund’s standard deviation to that of the benchmark is calculated. A relative volatility greater than 1.0 indicates that the Fund is more volatile than the benchmark while a measure less than 1.0 indicates less volatility. A relative volatility of 1.0 signifi es an equal degree of volatility between the Fund and the benchmark.
As an extension of standard deviation, each Fund’s beta, or a measure of the relative price fl uctuation of the Fund to its benchmark, is also calculated. The measurement of beta allows one to evaluate the sensitivity of Fund returns to given movements in the market and/or its benchmark. A beta greater than 1.0 compared to the selected market benchmark signifi es greater price sensitivity while a beta less than 1.0 indicates less sensitivity.
To measure the degree of correlation between Fund returns and the benchmark, the Division calculates the coef-fi cient of determination, or R2. This calculation, which is used in conjunction with beta, allows one to evaluate how much of the volatility in Fund returns is explained by returns in the selected market benchmark. An R2 of 1.0 indicates that Fund returns are perfectly explained by returns of the benchmark, while a value less than 1.0 indicates that the returns of the benchmark explain only a portion of the fund return.
Finally, to evaluate how well each of the above measures actually predicted returns of the Fund, a calculation is per-formed on the Fund’s alpha. This calculation measures the absolute difference between the Fund’s monthly return and that predicted by its beta. Used together, these measures provide a comprehensive view of a Fund’s relative risk profi le.
ReturnThe Pension and Trust Funds are managed for maximum return with minimal risk. Return, viewed in this context, includes realized and unrealized gains in the market value of a security, including those attributable to currency fl uctua-tions, as well as income distributed from a security such as dividends and interest. Return is measured through two calculations: compounded annual total return and cumulative total return.
Compounded Annual Total Return - This return measure evaluates performance over the short and long-term. Compounded annual total return measures the implicit annual percentage change in value of an investment, assuming reinvestment of dividends, interest, and realized and unrealized capital gains, including those attributable to currency fl uctuations. In effect, compounded annual total return “smoothes” fl uctuations in long-term investment returns to derive an implied year-to-year annual return.
Cumulative Total Return - This calculation measures the absolute percentage change in value of an investment over a specifi ed period, assuming reinvestment of dividends, interest income, and realized capital gains. While this calcula-tion does not “smooth” year-to-year fl uctuations in long-term returns to derive implied annual performance, cumulative total return allows one to see on an absolute basis the percentage increase in the total Fund’s value over a specifi ed time. Viewed graphically, cumulative total return shows one what a $10 million investment in the CRPTF a set number of years ago would be worth today.
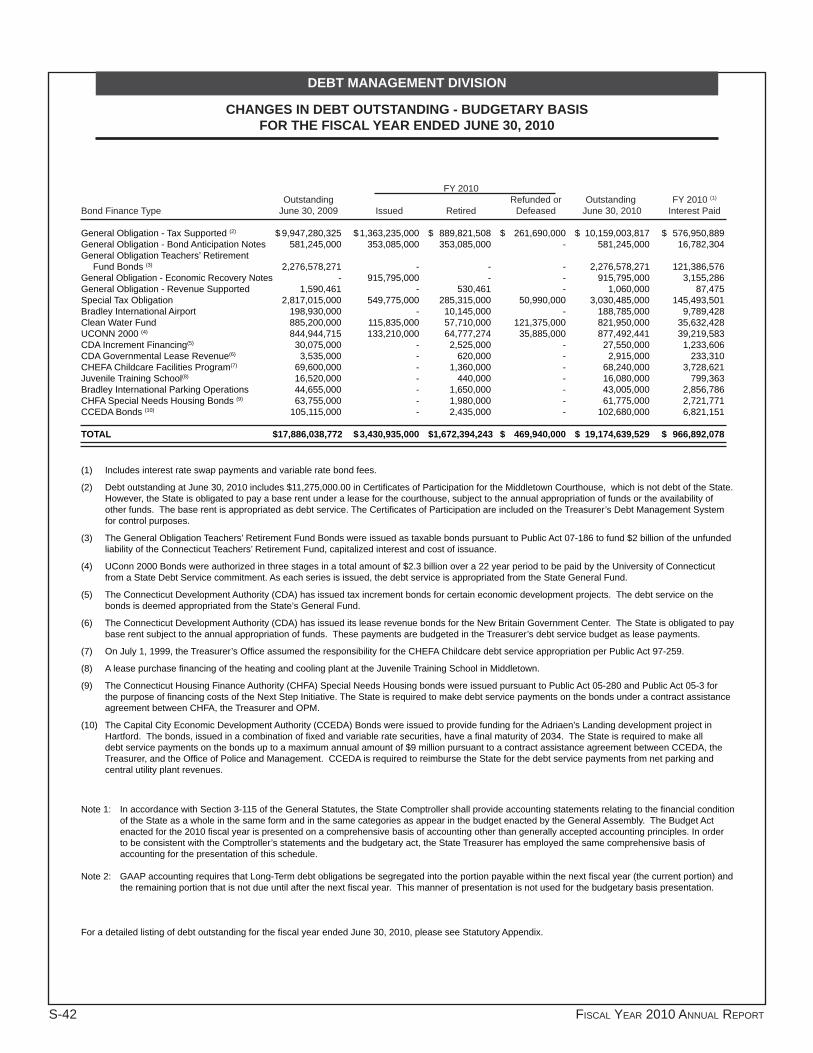
S-42 FISCAL YEAR 2010 ANNUAL REPORT
FY 2010 Outstanding Refunded or Outstanding FY 2010 (1)
Bond Finance Type June 30, 2009 Issued Retired Defeased June 30, 2010 Interest Paid
General Obligation - Tax Supported (2) $ 9,947,280,325 $ 1,363,235,000 $ 889,821,508 $ 261,690,000 $ 10,159,003,817 $ 576,950,889General Obligation - Bond Anticipation Notes 581,245,000 353,085,000 353,085,000 - 581,245,000 16,782,304General Obligation Teachers’ Retirement Fund Bonds (3) 2,276,578,271 - - - 2,276,578,271 121,386,576General Obligation - Economic Recovery Notes - 915,795,000 - - 915,795,000 3,155,286General Obligation - Revenue Supported 1,590,461 - 530,461 - 1,060,000 87,475Special Tax Obligation 2,817,015,000 549,775,000 285,315,000 50,990,000 3,030,485,000 145,493,501Bradley International Airport 198,930,000 - 10,145,000 - 188,785,000 9,789,428Clean Water Fund 885,200,000 115,835,000 57,710,000 121,375,000 821,950,000 35,632,428UCONN 2000 (4) 844,944,715 133,210,000 64,777,274 35,885,000 877,492,441 39,219,583CDA Increment Financing(5) 30,075,000 - 2,525,000 - 27,550,000 1,233,606CDA Governmental Lease Revenue(6) 3,535,000 - 620,000 - 2,915,000 233,310CHEFA Childcare Facilities Program(7) 69,600,000 - 1,360,000 - 68,240,000 3,728,621Juvenile Training School(8) 16,520,000 - 440,000 - 16,080,000 799,363Bradley International Parking Operations 44,655,000 - 1,650,000 - 43,005,000 2,856,786CHFA Special Needs Housing Bonds (9) 63,755,000 - 1,980,000 - 61,775,000 2,721,771CCEDA Bonds (10) 105,115,000 - 2,435,000 - 102,680,000 6,821,151 TOTAL $ 17,886,038,772 $ 3,430,935,000 $ 1,672,394,243 $ 469,940,000 $ 19,174,639,529 $ 966,892,078
(1) Includes interest rate swap payments and variable rate bond fees.
(2) Debt outstanding at June 30, 2010 includes $11,275,000.00 in Certifi cates of Participation for the Middletown Courthouse, which is not debt of the State. However, the State is obligated to pay a base rent under a lease for the courthouse, subject to the annual appropriation of funds or the availability of other funds. The base rent is appropriated as debt service. The Certifi cates of Participation are included on the Treasurer’s Debt Management System for control purposes.
(3) The General Obligation Teachers’ Retirement Fund Bonds were issued as taxable bonds pursuant to Public Act 07-186 to fund $2 billion of the unfunded liability of the Connecticut Teachers’ Retirement Fund, capitalized interest and cost of issuance.
(4) UConn 2000 Bonds were authorized in three stages in a total amount of $2.3 billion over a 22 year period to be paid by the University of Connecticut from a State Debt Service commitment. As each series is issued, the debt service is appropriated from the State General Fund.
(5) The Connecticut Development Authority (CDA) has issued tax increment bonds for certain economic development projects. The debt service on the bonds is deemed appropriated from the State’s General Fund.
(6) The Connecticut Development Authority (CDA) has issued its lease revenue bonds for the New Britain Government Center. The State is obligated to pay base rent subject to the annual appropriation of funds. These payments are budgeted in the Treasurer’s debt service budget as lease payments.
(7) On July 1, 1999, the Treasurer’s Offi ce assumed the responsibility for the CHEFA Childcare debt service appropriation per Public Act 97-259.
(8) A lease purchase fi nancing of the heating and cooling plant at the Juvenile Training School in Middletown.
(9) The Connecticut Housing Finance Authority (CHFA) Special Needs Housing bonds were issued pursuant to Public Act 05-280 and Public Act 05-3 for the purpose of fi nancing costs of the Next Step Initiative. The State is required to make debt service payments on the bonds under a contract assistance agreement between CHFA, the Treasurer and OPM.
(10) The Capital City Economic Development Authority (CCEDA) Bonds were issued to provide funding for the Adriaen’s Landing development project in Hartford. The bonds, issued in a combination of fi xed and variable rate securities, have a fi nal maturity of 2034. The State is required to make all debt service payments on the bonds up to a maximum annual amount of $9 million pursuant to a contract assistance agreement between CCEDA, the Treasurer, and the Offi ce of Police and Management. CCEDA is required to reimburse the State for the debt service payments from net parking and central utility plant revenues.
Note 1: In accordance with Section 3-115 of the General Statutes, the State Comptroller shall provide accounting statements relating to the fi nancial condition of the State as a whole in the same form and in the same categories as appear in the budget enacted by the General Assembly. The Budget Act enacted for the 2010 fi scal year is presented on a comprehensive basis of accounting other than generally accepted accounting principles. In order to be consistent with the Comptroller’s statements and the budgetary act, the State Treasurer has employed the same comprehensive basis of accounting for the presentation of this schedule.
Note 2: GAAP accounting requires that Long-Term debt obligations be segregated into the portion payable within the next fi scal year (the current portion) and the remaining portion that is not due until after the next fi scal year. This manner of presentation is not used for the budgetary basis presentation.
For a detailed listing of debt outstanding for the fi scal year ended June 30, 2010, please see Statutory Appendix.
DEBT MANAGEMENT DIVISION
CHANGES IN DEBT OUTSTANDING - BUDGETARY BASISFOR THE FISCAL YEAR ENDED JUNE 30, 2010

OFFICE OF THE STATE TREASURER, DENISE L. NAPPIER S-43
DEBT MANAGEMENT DIVISION
RETIREMENT SCHEDULE OF IN-SUBSTANCE DEFEASED DEBT OUTSTANDING (1) - BUDGETARY BASIS
JUNE 30, 2010
Amount of Last Payment MarketDate Escrow Principal Date on Value ofEstablished Outstanding Refunded Debt Escrow Investment Profi le of Escrow Account
BOND TYPE: GENERAL OBLIGATION11/15/1999 $ 781,460 06/01/2013 $ 1,046,668 State & Local Government Series Bonds11/20/2001 - 06/15/2010 3,466 Cash09/05/2002 17,480,000 12/15/2010 17,784,818 FNMA/FHLMC04/08/2004 522,370,000 11/15/2012 548,594,133 FNMA/FHLB/Cash04/27/2005 274,045,000 11/15/2012 279,442,838 State & Local Government Series Bonds11/09/2006 278,420,000 10/15/2013 286,861,802 State & Local Government Series Bonds05/10/2007 170,140,000 10/15/2013 174,357,087 State & Local Government Series Bonds06/23/2010 261,690,000 12/01/2021 287,871,998 State & Local Government Series BondsSUBTOTAL $ 1,524,926,460 $ 1,595,962,810
BOND TYPE: SPECIAL TRANSPORTATION FUND 01/23/2003 $ 108,820,000 10/01/2011 $ 113,204,296 State and Local Government Series Bonds12/02/2004 60,005,000 12/01/2012 66,503,181 US Treasury Strips, RefCorps and Cash11/10/2009 22,790,000 09/01/2010 23,579,109 State and Local Government Series BondsSUBTOTAL $ 191,615,000 $ 203,286,586
BOND TYPE: CLEAN WATER FUND 07/10/2003 $ 60,220,000 10/01/2011 $ 64,386,018 US Treasury Bonds, Notes & Strips06/30/2008 18,545,000 10/01/2012 19,371,010 FNMA/FHLB/FHLMC/CashSUBTOTAL $ 78,765,000 $ 83,757,028
BOND TYPE: UCONN 2000 01/29/2004 $ 56,430,000 04/01/2012 $ 57,667,810 State and Local Government Series Bonds03/15/2006 15,745,000 04/01/2012 16,929,863 State and Local Government Series Bonds04/12/2007 46,695,000 02/15/2013 47,851,476 State and Local Government Series Bonds05/25/2010 26,885,000 02/15/2021 29,613,103 State and Local Government Series BondsSUBTOTAL $ 145,755,000 $ 152,062,252
BOND TYPE: RATE REDUCTION BONDS 04/30/2008 $ 33,655,000 06/30/2011 $ 34,218,215 State & Local Government Series BondsSUBTOTAL $ 33,655,000 $ 34,218,215
BOND TYPE: SECOND INJURY FUND 06/20/2002 $ 28,465,000 01/01/2011 $ 28,930,862 State & Local Government Series Bonds06/25/2003 18,385,000 01/01/2011 18,941,796 State & Local Government Series Bonds06/25/2004 8,290,000 01/01/2011 8,371,967 State & Local Government Series Bonds06/24/2005 1,560,000 01/01/2011 1,580,921 State & Local Government Series BondsSUBTOTAL $ 56,700,000 $ 57,825,546 TOTAL $ 2,031,416,460 $ 2,127,112,437
(1) Represents bonds which have been refunded with proceeds of other bond issues and bonds which have been defeased using budget surplus. Although the State is still legally responsible for principal and interest payments on the refunded bonds, the refunded bonds are not carried as a liability of the State since they have been “in-substance” defeased. Investments adequate to meet all payments have been irrevocably deposited in escrow accounts with an independent agent for the sole purpose of satisfying principal and interest. The adequacy of each escrow account to meet debt service payments has been verifi ed by an independent accounting fi rm.
Note 1: In accordance with Section 3-115 of the General Statutes, the State Comptroller shall provide accounting statements relating to the fi nancial
condition of the State as a whole in the same form and in the same categories as appear in the budget enacted by the General Assembly. The Budget is presented on a comprehensive basis of accounting other than generally accepted accounting principles. In order to be consistent with the Comptroller’s statements and the budgetary act, the State Treasurer has employed the same comprehensive basis of accounting for the presentation of this schedule.
Note 2: GAAP accounting requires that Long-Term debt obligations be segregated into the portion payable within the next fi scal year (the current portion) and
the remaining portion that is not due until after the next fi scal year. This manner of presentation is not used for the budgetary basis presentation.

S-44 FISCAL YEAR 2010 ANNUAL REPORT
DEBT MANAGEMENT DIVISION
SCHEDULE OF EXPENSES IN EXCESS OF $5,000 (1)
FISCAL YEAR ENDED JUNE 30, 2010
Aggregate Compensation Paid Status asName of Firm Description of Services in FY 2010 of 06/30/10 A.C. Advisory, Inc. Financial Advisor $ 65,490 ActiveAcacia Financial Group, Inc. Financial Advisor 94,195 ActiveAMTEC Arbitrage Calculation/Verifi cation Agent Fees 38,600 ActiveBank of America/Merrill Lynch Liquidity/Remarketing Fees 219,413 ActiveBarclay’s Capital (fka Lehman Brothers) Remarketing Fees 49,863 ActiveBayerische Landesbanke Liquidity Fees 80,728 ActiveBloomberg Subscription 7,065 ActiveCarlin, Charron & Rosen, LLP Auditor 74,864 ActiveCitigroup Global Markets, Inc. Management Fees 100,000 ActiveDay Pitney, LLP Bond/Disclosure Counsel 1,069,009 ActiveDexia Public Finance Bank Liquidity Fees 329,324 ActiveEdwards Angell Palmer & Dodge LLP Bond Counsel 321,835 ActiveFinn Dixon & Herling LLP Disclosure/Tax Counsel 105,661 ActiveFirst Southwest Company Financial Advisor 95,581 ActiveFitch Ratings Rating Agency 277,500 N/AGoldman Sachs Remarketing/Management Fees 76,164 ActiveHardwick Law Firm, LLC Bond Counsel 104,325 ActiveHawkins, Delafi eld & Wood, LLP Arbitrage Calculation Fees 235,032 ActiveImageMaster Financial Printer 60,349 ActiveIRS Arbitrage Rebate Payments 198,120 N/AJP Morgan Chase Securities Remarketing/Management Fees 101,300 ActiveLamont Financial Services Financial Advisor 196,575 ActiveLandesbank Hessen-Thuringen Liquidity Fees 112,193 ActiveLewis & Munday Bond Counsel 219,496 ActiveM.R. Beal & Co. Management Fees 90,000 ActiveMoody’s Investors Service Rating Agency 407,063 N/AMorgan Stanley & Co, Inc. Management Fees 85,000 ActiveOrrick, Herrington & Sutcliffe, LLP (BondLogistix) Arbitrage Calculation Fees 12,600 ActiveP.G. Corbin & Co. Financial Advisor 71,278 ActivePublic Resources Advisory Group Financial Advisor 180,491 ActivePullman & Comley, LLC Bond Counsel 318,593 ActiveRobinson & Cole Bond/Tax Counsel 324,709 ActiveSeward and Monde Auditor 48,000 ActiveShipman & Goodwin, LLP Bond Counsel 258,522 ActiveSiebert Brandford Shank & Co. Management Fees 75,000 ActiveSoeder & Associates Tax/Disclosure Counsel 183,260 ActiveSquire, Sanders & Dempsey Bond Counsel 102,106 ActiveStandard & Poor’s Rating Service Rating Agency 383,275 N/AThe Bank of New York Mellon Administrative/Trustee Fees 6,800 ActiveU. S. Bank Administrative/Escrow/Trustee Fees 194,020 ActiveUpdike, Kelly & Spellacy Bond Counsel 216,824 ActiveWells Fargo National Association Management Fees 85,000 ActiveWilmington Trust Company Auction Agent/Broker/Dealer Fees 49,060 Active Total $ 7,324,283
(1) Expenses are presented on a cash basis. Debt Management expenses are comprised of payments to vendors made through the Treasury Business Offi ce, fees netted at bond closings, and fees and expenses paid from Cost of Issuance accounts. Unless listed in the description, the amounts shown do not include bond issuance expenses paid on behalf of the State or sales charges which are distributed by agreement of the underwriters.

OFFICE OF THE STATE TREASURER, DENISE L. NAPPIER S-45
CASH MANAGEMENT DIVISION
ACTIVITY STATEMENT FISCAL YEAR ENDED JUNE 30, 2010
Description Total INFLOWSRECEIPTS: DEPOSITS $ 25,682,042,443.02 (1)
BAD CHECKS (7,761,234.84) (2)
TREASURY INITIATED TRANSFERS 2,167,456,383.35 (3)
TOTAL RECEIPTS 27,841,737,591.53 TRANSFERS: 10,572,143,448.71 (4)
OTHER INFLOWS: INTERNAL BANK TRANSFERS 31,240,147,282.45 (5)
INTERBANK TRANSFERS 20,453,494,206.29 (6)
TOTAL OTHER INFLOWS 51,693,641,488.74 TOTAL INFLOWS $ 90,107,522,528.98 OUTFLOWS DISBURSEMENTS: VENDOR $ 23,306,858,416.22 (7)
PAYROLL 3,936,764,940.57 (8)
TOTAL DISBURSEMENTS 27,243,623,356.79 TRANSFERS: 11,086,041,634.45 (4)
OTHER OUTFLOWS: INTERNAL BANK TRANSFERS 31,240,147,282.45 (5)
INTERBANK TRANSFERS 20,453,494,206.29 (6)
TOTAL OTHER OUTFLOWS 51,693,641,488.74 TOTAL OUTFLOWS $ 90,023,306,479.98
(1) Deposits - revenue received from taxes, licenses, lottery fees, federal grants and other sources.
(2) Bad Checks - checks issued with insuffi cient funds in the originator’s bank account.
(3) Treasury Initiated Transfers - To record debt service payments to the proper bank account and transfer of investment income to the proper fund.
(4) Transfers - income earned from short and long-term investments, transfers of cash from one fund to the other, investment activity, and Certifi cates of Deposit purchased and sold with Connecticut banks under the Treasurer’s Community Bank and Credit Union Initiative.
(5) Internal Bank Transfers - transfers of money from concentration accounts to zero balance accounts with the same depository institution to provide funds to cover authorized disbursements and invest excess cash.
(6) Interbank Transfers - transfers of state moneys between banks to invest excess cash or to cover authorized disbursements.
(7) Vendor - expenditures for goods and services provided to the State by vendors.
(8) Payroll - expenditures for the State’s personnel and retirement payrolls.

S-46 FISCAL YEAR 2010 ANNUAL REPORT
Other Adjusted Cash Balance FY 2010 FY 2010 Net Cash BalanceFund Name July 1, 2009 Receipts Disbursements Transfers Adjustments (2) June 30, 2010
TOTAL FUNDS $(314,874,661.21) $27,841,737,591.53 $27,243,623,356.79 $(513,898,185.74) $78,590,162.11 $(152,068,450.10)
(1) Detailed information on activity within each individual fund (formerly provided in the Statutory Appendix) can be obtained from the Comptroller’s Annual Report.
(2) Other Net Adjustments have been included to bring the Treasurer’s cash balance presentation into conformance with the Comptroller’s cash bal-ance presentation.
These adjustments include the following: - Cash held in agency checking accounts. - Petty cash balance. - Deposit coded incorrectly: to be corrected in fi scal year 2011.
(3) In accordance with Section 3-115 of the General Statutes, the State Comptroller shall provide accounting statements relating to the fi nancial condition of the State as a whole in the same form and in the same categories as appears in the Budget Act enacted by the General Assembly. The Budget Act enacted for the 2010 fi scal year is presented on a comprehensive basis of accounting other than general accepted accounting principals. In order to be consistent with the Comptroller’s statements and the Budgetary Act, the State Treasurer has employed the same compre-hensive basis of accounting for the presentation of the Civil List Funds Summary Schedule of Cash Receipts and Disbursements.
(4) GAAP accounting requires that investment balances be presented to include the accrued interest earned. This manner of presentation is not used for the budgetary basis presentation.
CASH MANAGEMENT DIVISION
CIVIL LIST FUNDSSUMMARY SCHEDULE OF CASH RECEIPTS AND DISBURSEMENTS (1)
FISCAL YEAR ENDED JUNE 30, 2010PRESENTED UNDER BUDGETARY BASIS OF ACCOUNTING (3) (4)

OFFICE OF THE STATE TREASURER, DENISE L. NAPPIER S-47
CASH MANAGEMENT DIVISION
CIVIL LIST FUNDSSUMMARY SCHEDULE OF CASH AND INVESTMENTS (1)
FISCAL YEAR ENDED JUNE 30, 2010PRESENTED UNDER BUDGETARY BASIS OF ACCOUNTING (2) (3)
Description Total All FundsGeneral Investments Cash $ (152,068,450.10)STIF 2,595,122,398.50TEPF 16,202,609.58 Investments with Treasurer as Trustee Short-Term 2,327,787,992.38 Long-Term 20,215,985,967.89 Investments with Others as Trustee Short-Term 373,560,543.06 Long-Term 315,843,901.03 Total $ 25,692,434,962.34 Reconcilation Between Treasurer & Comptroller (4)
Offi ce of the Comptroller Cash and STIF June 30, 2010 (Annual Statutory Report) $ 3,817,328,173.00 Agency Fiduciary Funds (14,003,714.00)Reporting Adjustment (0.32)Tax Exemp Bond Proceeds Fund #11000 187,584.31 Tax Exemp Bond Proceeds Fund #12052 2,763,410.81 Tax Exemp Bond Proceeds Fund #12059 44,446.90 Tax Exemp Bond Proceeds Fund #13048 1,035,764.28 Tax Exemp Bond Proceeds Fund #17001 463,362.63 Tax Exemp Bond Proceeds Fund #17891 205.98 Short-Term Investment Fund #12010 22.24 Short-Term Investment Fund #21010 0.03 Cash and invest with Trustee Fund #12052 (2,763,410.81)Cash and invest with Trustee Fund #12059 (44,446.90)Cash and invest with Trustee Fund #13048 (1,035,764.28)Cash and invest with Trustee Fund #14005 587,649,981.87 Cash and invest with Trustee Fund #17001 (463,362.63)Cash and invest with Trustee Fund #17891 (205.98)Cash and invest with Trustee Fund #21008 7,905,324.01 Cash and invest with Trustee Fund #21009 123,821,768.56 Cash and invest with Trustee Fund #21014 245.19 Cash and invest with Trustee Fund #21015 196,612,087.06 Cash and invest with Trustee Fund #21018 67,532,680.78 Cash and invest with Trustee Fund #21020 10,397.63 Total $ 4,787,044,550.36 Offi ce of the Treasurer Cash $ (152,068,450.10)STIF 2,595,122,398.50 TEPF 16,202,609.58 STIF/Investment with Treasurer as Trustee 2,327,787,992.38 Total $ 4,787,044,550.36
(1) For a detailed listing of the Civil List Investments for the Fiscal Year Ending June 30, 2010, please see Statutory Appendix.(2) In accordance with Section 3-115 of the General Statutes, the State Comptroller shall provide accounting statements relating to the fi nancial
condition of the State as a whole in the same form and in the same categories as appears in the budget act enacted by the General As-sembly. The Budget Act enacted for the 2010 fi scal year is presented on a comprehensive basis of accounting other than general accepted accounting principals. In order to be consistent with the Comptroller’s statements and the budgetary act, the State Treasurer has employed the same comprehensive basis of accounting for the presentation of the Summary Schedule of Cash and Investments.
(3) GAAP accounting requires that investment balances be presented to include the accrued investment earnings. This manner of presentation is not used for the budgetary basis presentation.
(4) Reconciliation of Cash Equivalents Per Comptroller’s Books to Cash and General Investments and Short-Term Investments Per Treasury Books..

S-48 FISCAL YEAR 2010 ANNUAL REPORT
CASH MANAGEMENT DIVISIONCIVIL LIST FUNDS
INTEREST CREDIT PROGRAM (1)
FISCAL YEAR ENDED JUNE 30, 2010
Interest EarnedFund Participant Department SID During the Year
12004 Insurance Fund INSURANCE FUND DOI37500 10010 $22,465.56Total 22,465.56 12007 Workers Compensation ADMINISTRATION FUND WCC42000 10010 69,111.06Total 69,111.06 12014 Criminal Injuries Compensation Fund VICTIM SERVICES JUD95000 12047 15,508.64Total 15,508.64 12015 Vending Facilities Operators Fringe Benefi ts VENDING FACILITY PROGRAM - FEDERAL INCOME ESB65000 40012 59.78Total 59.78 12017 University of Connecticut Operating Fund OPERATING FUND UOC67000 40001 735,824.55Total 735,824.55 12018 University Health Center Operating Fund OPERATING FUND UHC72000 40001 116,935.97 STUDENT SCHOLARSHIPS AND LOANS UHC72000 40014 17,064.70Total 134,000.67 12019 State University Operating Fund STATE UNIVERSITIES CSU83000 40001 580,344.43 CENTRAL CONNECTICUT STATE UNIVERSITY CSU84000 6,942.97 EASTERN CONNECTICUT STATE UNIVERSITY CSU85500 11,390.09Total 598,677.49 12020 Regional Community/Technical Colleges Operating Fund (Tuition Account) BOARD FOR REGIONAL COMM-TECH COLLEGE CCC78000 40001 301,183.62Total 301,183.62 12022 University of Connecticut Research Foundation RESEARCH UOC67000 40001 73,909.81Total 73,909.81 12031 Employment Security - Administration PENALTY & INTEREST DOL40000 40213 32,950.36 TITLE XII EXCESS FUNDS DOL40000 40214 3,950.55Total 36,900.91 12037 Tobacco Settlement Fund TOBACCO SETTLEMENT FUND OPM20000 7,028.78Total 7,028.78 12060 GENERAL FUND RESEARCH IN PLANT SCIENCE AES48000 30099 1,662.57 ADMINISTRATION OF GRANTS AES48000 30116 376.03 BOARD FOR STATE ACADEMIC AWARD BAA77000 35186 7,515.25 CT DISTANCE LEARNING CONSORTIUM BAA77000 35289 2,481.27 OFFICE OF TOURISM CAT45200 30207 180.10 CONN STATE LIBRARY ACCOUNT CSL66000 30082 151.25 CT LIBRARY & MUSEUM FUND CSL66000 30093 7,001.54 HISTORIC DOCUMENTS PRESERVATION ACCOUNT CSL66000 35150 1,546.69 CHILDREN’S TRUST FUND CTF94000 30219 840.30 RICHARD A. FORESTER MEMORIAL FUND DCF91000 30084 43.74 GEARUP SCHOLARSHIP TRUST FUND DHE66500 22133 7,902.92 WEISMAN TEACHER SCHOLARSHIP FUND DHE66500 30405 205.90 FINANCIAL LITERACY INITIATIVES DHE66500 30432 1,196.59 PRIVATE OCCUPATIONAL STUDENT PROTECTION FUND DHE66500 35135 12,684.16

OFFICE OF THE STATE TREASURER, DENISE L. NAPPIER S-49
CASH MANAGEMENT DIVISIONCIVIL LIST FUNDS
INTEREST CREDIT PROGRAM (1) (Continued)FISCAL YEAR ENDED JUNE 30, 2010
CONNECTICUT FUTURES ACCOUNT DHE66500 35151 8,205.35 BOARD OF PAROLE’S ASSET FORFEITURE ACCOUNT DOC88000 20127 294.52 CORRECTIONAL MEMORIAL FUND DOC88000 30015 94.42 CORRECTION GENERAL WELFARE FUND DOC88000 35137 1,466.29 COOPERATIVE/COMMUNITY POLICING PROGRAM DPS32000 20270 204.75 FEDERAL ASSET FORFEITURE DPS32000 20493 2,866.84 ENHANCED 911 TELECOMMUNICATIONS FUND DPS32000 35190 72,715.19 CHILDREN,S TRUST FUND DSS60000 30219 845.82 BRAIN INJURY PREVENTION AND SERVICE ACCOUNT DSS60000 35308 452.94 NVRLF SEQUESTERED ACCOUNT ECD46000 30459 2,510.61 JOB INCENTIVE ACCOUNT ECD46000 35146 0.00 MRD ESCROW ACCT. ECD46000 35170 107.02 MRS ESCROW ACCT. ECD46000 35173 21.00 CITIZENS ELECTION FUND RESERVE ACCT ELE13500 30422 401.87 CITIZEN ELECTION FUND ELE13500 35333 -3,670.22 CITIZEN ELECTION FUND GRANTS ELE13500 35339 162,660.66 FAUCHTSWANGER FUND ESB65000 30030 28.57 FRAUENHOFER FUND ESB65000 30042 68.87 MISCELLANEOUS GRANTS ESB65000 30070 59.30 SARA BROWN FUND ESB65000 30092 814.45 CHARLES PRECOURT MEMORIAL FUND ESB65000 30104 13.63 ANN COROTEAU MEMORIAL FUND ESB65000 30113 18.07 VENDING FACILITIES PROGRAM-STATE AND LOCAL INCOME ESB65000 35149 2,565.97 LAW LIBRARY-DONATED COPIER RECEIPTS JUD95000 30238 11.31 DERBY COURTHOUSE MAINTENANCE RESERVE JUD95000 35188 3,027.47 MERIDEN COURTHOUSE MAINTENANCE RESERVE JUD95000 35195 2,990.72 CRIMINAL VIOLENCE VICTIMS ESCROW ACCT. JUD95000 35203 0.89 CLIENT SECURITY FUND JUD95000 35205 31,294.58 MILFORD COURTHOUSE RESERVE ACCOUNT JUD95000 35371 3,308.62 DMHAS-COMMUNITY MENTAL HEALTH STRATEGIC INVESTMENT MHA53000 35160 78.80 DMHAS-COMMISSIONER’S OFFICE PRE-TRIAL ACCOUNT MHA53000 35166 16,111.93 DRUG ASSET FORFEITURE PROGRAM MIL36000 35112 160.22 EXXON OVERCHARGE OPM20000 20488 228.87 STRIPPER WELL OVERCHARGE OPM20000 20492 4,305.87 JUVENILE ACCOUNTABLIITY INCENTIVE BLOCK OPM20000 21672 4,856.39 JUSTICE ASSISTANCE GRANT OPM20000 21921 23,884.17 JUSTICE ASSISTANCE GRANT OPM20000 26015 358.44 JUSTICE ASSISTANCE GRANT OPM20000 29002 32,911.03 INVESTMENT FUND OTT14000 35101 30,101.79 SECOND INJURY OTT14000 35105 5,214.88 SECOND INJURY STIPULATION & REIMBURSEMENT OTT14000 35111 9,316.04 MUNICIPAL PARTICIPATION FUND OTT14000 35269 244.89 WALLACE FOUNDATION GRANT SDE64000 30256 75.87 DIV. OF FINANCE AND INTERNAL OPERATIONS SDE64000 35351 1,026.00 FINANCIAL LITERACY UBS SDE64000 35358 1,222.58 FINANCIAL LITERACY SDE64000 35380 707.91 HELP AMERICA VOTE SOS12500 21465 14,749.57Total 482,723.07 21009 Bradley International Airport Operations BRADLEY ENTERPRISE FUND DOT57000 40001 50,220.54Total 50,220.54 21019 Stadium Facility Enterprise Fund STADIUM ENTERPRISE FUND OPM20000 2,567.90Total 2,567.90 22001 Correction Industries CORRECTIONAL COMMISSARY FUND DOC88000 42304 6,703.66Total 6,703.66
Interest EarnedFund Participant Agency SID During the Year

S-50 FISCAL YEAR 2010 ANNUAL REPORT
CASH MANAGEMENT DIVISION
CIVIL LIST FUNDSINTEREST CREDIT PROGRAM (1) (Continued)
FISCAL YEAR ENDED JUNE 30, 2010
31001 State Employees’ Retirement System STATE EMPLOYEES RETIREMENT FUND OSC15000 40001 -6,822.25Total -6,822.25 31006 Teacher’s Retirement System TEACHER’S RETIREMENT BOARD OPERATING FUND TRB77500 40001 -27,939.23Total -27,939.23 31008 Municipal Employees Retirement - Fund B MUNICIPAL EMPOLYEES RETIREMENT FUND OSC15000 40001 3,661.70Total 3,661.70 31011 OPEB Fund OPEB FUND OSC15000 40001 176,503.73Total 176,503.73 31012 Teacher’s Retirement System TEACHER’S RETIREMENT BOARD TRB77500 42358 244,380.96Total 244,380.96 35001 Connecticut Health Club Guaranty Fund HEALTH CLUB GUARANTEE FUND DCP39500 40001 1,182.24Total 1,182.24 35002 Real Estate Guaranty REAL ESTATE GUARANTEE FUND DCP39500 40001 1,720.86Total 1,720.86 35003 Home Improvement Guaranty Fund HOME IMPROVEMENT GUARANTEE FUND DCP39500 40001 1,256.15Total 1,256.15 35006 New Home Construction Guaranty Fund NEW HOME CONSTRUCTION GUARANTY DCP39500 40001 2,096.68Total 2,096.68 35007 Tobacco and Health Trust Fund TOBACCO HEALTH TRUST FUND OPM20000 40001 32,611.04Total 32,611.04 35008 Biomedical Research Trust Fund BIOMEDICAL RESEARCH FUND DPH48500 36,774.71Total 36,774.71 35009 Endowed Chair Investment Fund ENDOWED CHAIR INVESTMENT FUND DHE66500 40001 19,026.08Total 19,026.08 35012 Various Treasurer’s Trust Funds IRWIN LEPOW TRUST FUND CME49500 42354 87.04 R. GRAEME SMITH DPS32000 42353 23.16 FITCH FUND DVA21000 42352 0.03 FITCH FUND DVA21000 42356 137.69 JOHN H. KING JUD95000 42355 601.94 WHITE FUND JUD95000 42357 5.78Total 855.64 Grand Total $2,721,010.73
Interest EarnedFund Participant Agency SID During the Year
(1) Interest is earned at the monthly simple interest rate of the Treasurer’s Short-Term Investment Fund. Interest is calculated on the average monthly balance of the fund or account, and credited to the fund or account on a quarterly basis.
(2) Interest is earned by the participant and allocated to the constituent units.

OFFICE OF THE STATE TREASURER, DENISE L. NAPPIER S-51
CASH MANAGEMENT DIVISIONSCHEDULE OF EXPENSES IN EXCESS OF $5,000 (1)
FISCAL YEAR ENDED JUNE 30, 2010
Aggregate Status Contract Compensation Paid As ofName of Firm Description of Services Date in FY 2010 6/30/10 Bank of America Banking Services Various $ 3,058,060 ActiveWebster Bank Banking Services Jun-98 284,075 ActivePeople’s Bank Banking Services Mar-97 191,553 (2) ActiveUS Bank National Assn Bond Trustee & Paying Agent Jul-06 144,305 ActiveState Street Bank & Trust STIF Custodian Fees Jul-05 110,600 ActiveWachovia Bank National Assn Banking Services Feb-97 58,106 (2) ActiveMcGraw-Hill Companies, Inc. Subscription & Rating N/A 36,500 ActiveRogersCasey, Inc. Investment Consulting Services Dec-07 18,750 ActiveBloomberg Financial LP Subscription N/A 18,747 ActiveMoodys Investors Services Subscription & Research N/A 17,160 ActiveFitch Information Inc. Credit Research N/A 12,650 ActiveiMoney Net Inc. Subscription N/A 9,555 ActiveUHY AIMR Attestation Services Sep-07 9,500 Terminated
TOTAL $ 3,969,561
(1) Expenses are presented on a cash basis. (2) Includes compensation realized through bank balances and fees.

S-52 FISCAL YEAR 2010 ANNUAL REPORT
UNCLAIMED PROPERTY DIVISION
SCHEDULE OF EXPENSES IN EXCESS OF $5,000 (1)
FISCAL YEAR ENDED JUNE 30, 2010
Aggregate Status Contract Compensation As ofName of Firm Description of Services Date Paid in FY 2010 6/30/10
A & A Offi ce Systems, Inc. Photocopier Lease N/A $ 6,706 ActiveACS Unclaimed Property Clearinghouse Securities Services & Claims Processing July-06 808,035 ActiveACS Unclaimed Property Clearinghouse Identifi cation & Collection of Property August-94 1,541,504 ActiveAudit Services US LLC Identifi cation & Collection of Property May-06 144,933 ActiveBlackRock Investment Management LLC Security Commission Expense May-09 144,994 ActiveBloomberg Financial LP Subscription N/A 14,310 ActiveConnecticut Post LP Advertising N/A 13,924 ActiveIron Mountain Off-Site Data Protection Storage & Retrieval of Files N/A 5,216 ActiveNew Haven Register Advertising N/A 7,059 ActiveRepublican American Advertising N/A 5,885 ActiveSuburban Stationers Inc. Offi ce Supplies N/A 10,165 ActiveThe Hartford Courant Advertising N/A 136,422 Terminated
TOTAL $ 2,839,153
(1) Expenses are presented on a cash basis.

OFFICE OF THE STATE TREASURER, DENISE L. NAPPIER S-53
UNCLAIMED PROPERTY DIVISION
FIVE YEAR SELECTED FINANCIAL INFORMATION
Fiscal Year Ended June 30, 2010 2009 2008 2007 2006
Receipts (Net of fees) (1) (4) $ 222,107,523 $ 69,496,494 $ 64,037,656 $ 64,567,697 $ 84,735,321Fees netted from proceeds 0 0 0 0 1,225,874Gross Receipts 222,107,523 69,496,494 64,037,656 64,567,697 85,961,195 Claims Paid 33,408,124 32,341,525 30,626,832 25,280,243 25,990,877Transfer to Citizens Election Fund (4) 18,191,261 17,940,100 17,300,000 16,000,000 17,000,000Administrative Expenses: Salaries & Fringe benefi ts 3,771,592 3,646,721 3,396,050 3,896,514 3,154,315 Data processing & hardware 2,514,603 2,170,581 3,018,137 2,826,339 3,237,913 All Other 431,564 119,645 449,575 220,355 266,173Fees netted from proceeds (1) 0 0 0 0 1,225,874Total Disbursements 58,317,144 56,218,572 54,790,595 48,223,450 50,875,152 Excess of Receipts over Disbursements (2) $ 163,790,379 $ 13,277,922 $ 9,247,061 $ 16,344,247 $ 35,086,043
Approximate Market Value of Securities at Fiscal Year End: Total Securities Inventory $ 22,097,989 $ 88,297,207 $ 95,399,474 $ 99,761,769 $ 59,295,118Securities liquidated $ 151,166,311 $ 1,142,461 $ 0 $ 0 $ 13,617,580Number of claims paid 17,360 14,481 16,787 20,930 22,732
(1) Fees include amounts for liquidation of securities, property recovered in out-of-state audits and appraisal and auction of safe deposit box contents. As of July 1, 2006, there is no netting of fees and amounts are now included in data processing and hardware costs under Administrative Expenses.
(2) Excess of receipts over disbursements is remitted to the General Fund, however, amounts collected remain liabilities of the State until returned to rightful owners.
(3) The amounts disclosed above as “receipts” and “claims paid” represent actual cash fl ows and do not include the value of the marketable securities received by the Unclaimed Property Division , nor the value of the securities returned to owners. However, the amounts disclosed above as fi scal year end market values of securities help provide a general indication of the relative net activity in such assets over time. Receipts net of fees, include the proceeds from securities liquidated in a given year.
(4) Per P.A. 05-5, October 25, 2005 special session, required Unclaimed Property Division to deposit certain funds into the Citizens’ Election Fund and the balance is deposited into the General Fund.
Summary of Gross ReceiptsFiscal Year Ended June 30, 2010
Financial institutions $17,155,456 Other corporations 34,870,582Insurance companies 12,643,672Govern agency/ public authorities 3,752,850Dividends on securities held 1,031,952Estates 131,667Securities tendered 464,770Securities sold 151,166,311Sale of property lists, copying and other charges 39,505Reciprocal exchange program with other states 850,758Refunds 0Total Gross Receipts $222,107,523

S-54 FISCAL YEAR 2010 ANNUAL REPORT
STATE BOND COMMISSION (§ 3-20(c) CGS)As authorized by the General Assembly, all projects and grants funded from State bonds, as well as the issuance of
the bonds, must be authorized by the State Bond Commission. The members of the Commission include the Governor, Treasurer, Comptroller, Attorney General, Secretary of the Offi ce of Policy and Management (OPM), Commissioner of Public Works, and the Cochairpersons and the ranking minority members of the joint standing committee of the General Assembly having cogniznace of matters relating to fi nance, revenue and bonding.
INVESTMENT ADVISORY COUNCIL (§ 3-13b(a) CGS)The Investment Advisory Council advises on investment policy and guidelines, and also reviews the assets and
performance of the pension funds. Additionally, the Council advises the Treasurer with respect to the hiring of outside investment advisors and on the appointment of the Chief Investment Offi cer. The Investment Advisory Council consists of the Treasurer, the Secretary of OPM and ten appointees of the Governor and State Legislature.
BANKING COMMISSION (§ 36a-70(h)(1) CGS)The Banking Commission approves all applications for the creation of state banks or trust companies. As part of this
process, the Commission holds public hearings on applications prior to granting approval. The Commission members are the Treasurer, Comptroller and Banking Commissioner.
FINANCE ADVISORY COMMITTEE (§ 4-93 CGS)The Finance Advisory Committee approves budget transfers recommended by the Governor and has other such
powers over the State budget when the General Assembly is not in session. The Committee members are the Governor, Lieutenant Governor, Treasurer, Comptroller, two Senate members who are members of the Legislature’s Appropriations Committee and three House members who are members of the Legislature’s Appropriations Committee.
CONNECTICUT LOTTERY CORPORATION BOARD OF DIRECTORS (§ 12-802(b) CGS)The Connecticut Lottery Corporation manages the State lottery and is responsible to introduce new lottery games
and maximize the effi ciency of operations in order to provide a greater return to the general fund. The thirteen mem-ber Board of Directors includes the Treasurer, the Secretary of OPM, as well as appointees by the Governor and State Legislature.
CONNECTICUT HIGHER EDUCATION TRUST(CHET) ADVISORY COMMITTEE (§ 3-22e(a) CGS)This committee advises the Treasurer on policies concerning CHET. The Connecticut Higher Education Trust al-
lows families to make tax deferred investments for higher education costs. The Commissioner of Higher Education, the Secretary of OPM, the Cochairpersons and ranking members of the Legislature’s education committee, and fi nance, revenue and bonding committees, and four representatives of private higher education and the public serve with the Treasurer on this board.
COUNCIL OF FISCAL OFFICERS (By Charter)The purpose of the Council of Fiscal Offi cers is to provide a forum for discussion and participation in the develop-
ment of State fi nancial policies, practices and systems. Membership is open to all State offi cials or employees, elected or appointed, classifi ed or unclassifi ed, serving in a fi scal management position. The Treasurer is one of four permanent members of the Executive Board.
THE STANDARDIZATION COMMITTEE (§ 4a-58(a) CGS)The standardization committee approves or grants waivers to existing purchasing regulations when it is in the best
interests of the State to do so. The members of this committee include the Treasurer, Comptroller, Commissioner of Administrative Services, and such administrative heads of State departments as are designated for that duty by the Governor.
EXECUTIVE OFFICE
EX-OFFICIO DUTIES OF THE STATE TREASURERBOARDS, COMMITTEES AND COMMISSIONS

OFFICE OF THE STATE TREASURER, DENISE L. NAPPIER S-55
EXECUTIVE OFFICEEX-OFFICIO DUTIES OF THE STATE TREASURER (Continued)
BOARDS, COMMITTEES AND COMMISSIONS
INFORMATION AND TELECOMMUNICATION SYSTEMS (IT) EXECUTIVE STEERING COMMITTEE (§ 4d-12(b) CGS)
The IT Executive Steering Committee directs the planning, development, implementation and maintenance of State information and telecommunication systems. The Committee consists of the Treasurer, Comptroller, Secretary of OPM, Commissioner of Administrative Services, and the Chief Information Offi cer.
CONNECTICUT DEVELOPMENT AUTHORITY (CDA) (§ 32-11a(c) CGS)The Connecticut Development Authority administers programs that support the State’s economic development efforts.
CDA has two basic types of loan programs: direct loans and loan guarantees (of bank loans). The Board membership includes the Treasurer, Commissioner of Economic and Community Development, Secretary of OPM, four members ap-pointed by the Governor, and four members appointed by legislative leaders.
CONNECTICUT HOUSING FINANCE AUTHORITY (CHFA) (§ 8-244(a) CGS)CHFA was created to increase the supply of, and encourage and assist in the purchase, development and construction
of, housing for low and moderate-income families and persons throughout the State. It provides mortgages for single family homeowners at below market rates, mortgages for multi-family developers, and construction fi nancing. The members of the board include the Treasurer, Commissioner of Economic and Community Development, Secretary of OPM, Banking Commissioner, seven members appointed by the Governor, and four members appointed by legislative leaders.
CONNECTICUT HEALTH AND EDUCATIONAL FACILITIES AUTHORITY (CHEFA) BOARD OF DIRECTORS (§ 10a-179(a) CGS)
CHEFA is a conduit bond issuer for hospitals, nursing homes, private universities, private secondary schools and day care facilities. The board members include the Treasurer, Secretary of OPM, and eight members appointed by the Governor.
CONNECTICUT HIGHER EDUCATION SUPPLEMENTAL LOAN AUTHORITY (CHESLA) BOARD OF DIRECTORS (§ 10a-224(a) CGS)
CHESLA fi nances supplemental student loans and issues bonds every two years. The Board consists of eight members including the Treasurer, Commissioner of Higher Education, Secretary of OPM, and fi ve additional members appointed by the Governor.
STUDENT FINANCIAL AID INFORMATION COUNCIL (§ 10a-161b CGS)The council develops procedures to improve student fi nancial aid policy and increase resources, develops methods
to improve fi nancial aid awareness, especially amoung middle and high school students and their families, and coordi-nates fi nancial aid delivery. The council is assisted in their responsibilities by the Department of Higher Education and the Connecticut Association of Professional Financial Aid Administrators. The Council consists of the Commissioners of Higher Education, the Treasurer, four members appointed by the Governor, and four members appointed by the legisla-tive leadership.
CONNECTICUT STUDENT LOAN FOUNDATION (§10a-201)The Student Loan Foundation is a non-profi t corporation created to improve educational opportunity and promote
repayment of loans. The corporation is governed by a board of directors consisting of fourteen members including the chairperson of the Board of Governors of Higher Education and the Commissioner of Higher Education; six public members appointed by the Governor; four members with knowledge of business or fi nance appointed by the legislature leadership; and the Treasurer.

S-56 FISCAL YEAR 2010 ANNUAL REPORT
EXECUTIVE OFFICETOTAL ADMINISTRATION EXPENDITURES
FISCAL YEARS ENDED JUNE 30,
Fiscal Years Ended June 30, 2010 % 2009 % 2008 % 2007 % 2006 %GENERAL FUNDPersonal Services $3,210,145 3.66% $3,602,754 3.80% $3,513,197 4.11% $3,607,677 3.89% $3,485,301 4.10%Other Expenses 155,429 0.18% 239,594 0.25% 305,232 0.36% 285,592 0.31% 285,532 0.34%Capital Equipment - 0.00% - 0.00% 100 0.00% 100 0.00% 100 0.00% TOTAL 3,365,574 3.83% 3,842,348 4.05% 3,818,529 4.47% 3,893,369 4.20% 3,770,933 4.44% PENSION FUNDS Personal Services $3,992,849 4.55% $3,581,005 3.78% $3,394,051 3.97% $3,250,644 3.50% $3,088,226 3.63%Other Expenses 65,105,625 74.17% 72,325,071 76.29% 62,672,093 73.29% 69,572,587 74.97% 62,116,512 73.11%Capital Equipment - 0.00% 7,388 0.01% 2,763 0.00% 28,007 0.03% 5,756 0.01% TOTAL 69,098,474 78.72% 75,913,464 80.07% 66,068,907 77.26% 72,851,238 78.50% 65,210,494 76.75% SECOND INJURY FUND Personal Services $6,203,425 7.07% $6,523,771 6.88% $6,031,570 7.05% $6,535,640 7.04% $6,690,597 7.87%Other Expenses 597,001 0.68% 672,593 0.71% 834,908 0.98% 712,690 0.77% 760,058 0.89%Capital Equipment - 0.00% 10,242 0.01% 27,048 0.03% 54,784 0.06% 4,881 0.01% TOTAL 6,800,426 7.75% 7,206,606 7.60% 6,893,526 8.06% 7,303,114 7.87% 7,455,536 8.78% UNCLAIMED PROPERTY FUND Personal Services $3,771,596 4.30% 3,646,721 3.85% $3,396,090 3.97% $3,896,514 4.20% $3,154,315 3.71%Other Expenses 2,946,163 3.36% 2,282,854 2.41% 3,441,613 4.02% 3,017,579 3.25% 3,502,759 4.12%Capital Equipment - 0.00% 7,372 0.01% 26,059 0.03% 29,115 0.03% 1,328 0.00% TOTAL 6,717,759 7.65% 5,936,947 6.26% 6,863,762 8.03% 6,943,208 7.48% 6,658,402 7.84% SHORT-TERM INVESTMENT FUND Personal Services $1,007,303 1.15% 994,643 1.05% $913,106 1.07% $1,008,349 1.09% $1,094,906 1.29%Other Expenses 262,867 0.30% 312,325 0.33% 365,873 0.43% 205,828 0.22% 236,446 0.28%Capital Equipment - 0.00% 1,733 0.00% 863 0.00% 8,291 0.01% 349 0.00% TOTAL 1,270,170 1.45% 1,308,701 1.38% 1,279,842 1.50% 1,222,468 1.32% 1,331,701 1.57% Other Financing Sources (1) $522,873 0.60% $595,201 0.63% $587,610 0.69% $589,270 0.63% $533,321 0.63% TOTAL AGENCY $87,775,276 100.00% $94,803,267 100.00% $85,512,176 100.00% $92,802,667 100.00% $84,960,387 100.00%
(1) Other Financing Sources include: Clean Water Fund; Special Transportation Fund; and the Capital Equipment Fund.

OFFICE OF THE STATE TREASURER, DENISE L. NAPPIER S-57
Aggregate Compensation Contract Paid StatusName of Firm Description of Services Date in FY 2010 As of 6/30/10
A & A Offi ce Systems Photocopier Lease N/A $ 9,623 ActiveCERES, Inc. Dues N/A 10,000 ActiveCorporate Governance Research Consulting, LLC Corporate Governance Services Mar-07 17,055 ActiveCouncil of Institutional Investors Dues N/A 26,000 ActiveInterfaith Center on Corporate Responsibility Subscription N/A 7,000 ActiveInvestor Responsibility Support Services Proxy Voting Services Dec-02 27,083 ActiveJP Morgan Chase Bank Purchasing Card Expenditures N/A 5,316 ActiveSuburban Stationers Inc. Offi ce Supplies N/A 8,870 ActiveThe Corporate Library Subscription N/A 25,000 ActiveNational Assocation Of StateTreasurer Dues N/A 7,100 ActiveWest Group Subscription N/A 12,330 Active
TOTAL $ 155,377 (1) Expenses are presented on a cash basis.
EXECUTIVE DIVISION
SCHEDULE OF EXPENSES IN EXCESS OF $5,000 (1)
FISCAL YEAR ENDED JUNE 30, 2010

S-58 FISCAL YEAR 2010 ANNUAL REPORT
SECOND INJURY FUNDSCHEDULE OF EXPENSES IN EXCESS OF $5,000 (1)
FISCAL YEAR ENDED JUNE 30, 2010
Aggregate Contract Compensation StatusName of Firm Description of Services Date Paid in FY 2010 As of 6/30/10 A & A Offi ce Systems Inc. Photocopier Lease N/A $ 8,944 ActiveAegis International Inc. Surveillance Services January-06 35,176 ActiveAutomatic Data Processing Inc. Check Processing June-06 17,576 ActiveCoventry Healthcare Workers Compensation Inc. Provider Bill Audit Services February-06 217,718 ActiveIron Mountain Off-Site Data Protection Records Management Services N/A 8,815 ActiveMCMC, LLC IME/Case Mgmt./Job Placement January-06 41,745 ActiveSecurity Services of Connecticut Inc. Surveillance Services January-06 39,817 ActiveSuburban Stationers Inc. Offi ce Supplies N/A 10,039 Active TOTAL $ 379,830
(1) Expenses are presented on a cash basis. This schedule only includes services that were retained directly by the Fund and does not include medical services ordered by Workers Compensation Commissioners, claimants or their treating physicians.

StatutoryAppendix


OFFICE OF THE STATE TREASURER, DENISE L. NAPPIER O-1
DEB
T M
AN
AG
EMEN
T D
IVIS
ION
SCH
EDU
LE O
F D
EBT
OU
TSTA
ND
ING
(1) -
BU
DG
ETA
RY B
ASI
SJU
NE
30, 2
010
In
tere
st
Inte
rest
FY
201
0
Low
H
igh
Nex
t La
st
Acc
rete
d Pa
idIs
sue
Out
stan
ding
R
efun
ded
or
Out
stan
ding
Rat
e R
ate
Mat
urity
M
atur
ity
Thro
ugh
Dur
ing
Dat
e Ju
ne 3
0, 2
009
Issu
ed
Ret
ired
Def
ease
d Ju
ne 3
0, 2
010
(%
) (%
) D
ate
Dat
e FY
201
0 (2
) FY
201
0(3)
BO
ND
TYP
E: G
ENER
AL
OB
LIG
ATIO
N -
TAX
SUPP
OR
TED
11/1
4/19
89
$
16,4
25,7
65
$ -
$ 16,
425,
765
$ -
$ -
11
/04/
2009
$
- $ 4
8,43
9,23
605
/15/
1990
12,
002,
165
-
12,
002,
165
-
-
05
/15/
2010
-
3
8,47
0,83
6 11
/20/
1990
7,4
49,3
83
-
1,80
3,49
4
-
5,64
5,88
9
7.35
2 7.
352
11/1
5/20
10
11/1
5/20
10
17,
618,
586
5
,325
,506
01
/01/
1991
2,5
46,2
43
-
1,30
5,62
1
-
1,24
0,62
1
6.75
3 6.
753
07/0
1/20
10 0
1/01
/201
1
-
15
0,23
2 05
/16/
1991
7,0
30,7
83
-
1,69
7,47
6
-
5,33
3,30
7
7.00
0 7.
000
05/1
5/20
11
05/1
5/20
11
14,
545,
197
4,
597,
524
12/1
2/19
91
7
,686
,965
-
1,
934,
350
-
5,
752,
615
6.
701
6.72
7 12
/15/
2010
12/
15/2
011
13,
813,
718
4,
385,
650
01/2
1/19
92
4
,918
,977
-
1,
607,
289
-
3,
311,
688
6.
034
6.03
4 08
/01/
2010
02/
01/2
012
-
272
,683
05
/14/
1992
7,0
73,0
07
-
1,79
7,72
3
-
5,27
5,28
4
6.77
7 6.
795
05/1
5/20
11
05/1
5/20
12
12,4
07,1
21
4,
142,
277
11/1
7/19
92
6
,913
,864
-
2
,114
,131
-
4
,799
,733
6.
358
6.40
2 11
/15/
2010
11
/15/
2012
9,71
3,02
5
4,0
16,8
69
03/1
5/19
93
2
6,01
0,00
0
-
8,67
0,00
0
-
17,
340,
000
5.
500
5.50
0 03
/15/
2011
03
/15/
2012
-
1,43
0,55
0 03
/15/
1993
20,
680,
000
-
10,
395,
000
-
10
,285
,000
5.
500
5.50
0 09
/15/
2010
09/
15/2
010
-
846,
340
05/1
9/19
93
9
,204
,176
-
3,
052,
236
-
6,
151,
940
5.
923
5.94
4 06
/15/
2011
06
/15/
2012
10
,582
,522
5,25
6,76
4 10
/01/
1993
22,
440,
000
-
-
-
22
,440
,000
6.
000
6.00
0 03
/15/
2012
03/
15/2
012
-
1,34
6,40
0 11
/16/
1993
10,
045,
356
-
2,
046,
995
-
7,
998,
361
5.
341
5.38
3 12
/01/
2010
12/
01/2
012
11
,295
,269
2,69
0,00
5 03
/15/
1994
16,
249,
539
-
5,
329,
539
-
10
,920
,000
5.
650
5.65
0 03
/15/
2012
03/
15/2
012
-
910,
105
05/2
6/19
94
1
0,73
1,95
2
-
1,85
5,87
6
-
8,87
6,07
6
6.37
1 6.
414
06/0
1/20
11
06/0
1/20
13
15,5
70,6
80
3,
177,
124
11/2
2/19
94
1
3,46
3,07
6
-
3,03
8,47
3
-
1
0,42
4,60
3
6.26
6 6.
398
12/1
5/20
10 1
2/15
/201
3 1
7,18
5,57
4
4,61
0,52
7 03
/28/
1996
3,0
96,5
56
-
387,
500
-
2,
709,
056
5.
030
5.03
0 11
/01/
2010
05
/01/
2018
-
150,
900
05/1
4/19
97
5
0,00
0,00
0
-
1
0,00
0,00
0
-
40,0
00,0
00
4.25
0 4.
250
05/1
5/20
11
05/1
5/20
14
-
21
0,91
3 09
/01/
1997
10,
906,
857
-
89
6,45
5
-
10,0
10,4
02
5.08
1 5.
081
03/0
1/20
11
03/0
1/20
20
-
55
4,17
7 09
/30/
1997
1,9
80,0
00
-
255,
000
-
1,
725,
000
5.
081
5.08
1 03
/01/
2011
03
/01/
2020
-
100,
604
08/0
1/19
98 (4
) 1
3,79
0,00
0
-
2,51
5,00
0
-
11,2
75,0
00
4.60
0 4.
750
12/1
5/20
10 1
2/15
/201
3
-
58
4,08
0 05
/01/
1999
12,
340,
800
-
77
2,56
0
-
11,5
68,2
40
4.63
3 4.
633
09/0
1/20
10 0
9/01
/202
2
-
55
3,85
3 05
/06/
1999
3,1
15,0
00
-
320,
000
-
2,
795,
000
4.
633
4.63
3 09
/01/
2010
09/
01/2
022
-
136,
905
06/1
5/19
99
4
,675
,000
-
-
-
4,
675,
000
5.
250
5.25
0 06
/15/
2014
06/
15/2
014
-
245,
438
11/0
1/19
99
1
2,25
0,00
0
-
1
2,25
0,00
0
-
-
11/0
1/20
09
-
306,
250
04/1
5/20
00
7
,500
,000
-
7,
500,
000
-
-
04/1
5/20
10
-
38
2,50
0 06
/15/
2000
22,
500,
000
-
22,
500,
000
-
-
06/1
5/20
10
-
1,
163,
010
12/1
5/20
00
6
6,00
0,00
0
-
3
3,00
0,00
0
-
33,
000,
000
4.
600
5.37
5 12
/15/
2010
12/
15/2
010
-
2,50
0,22
6 02
/22/
2001
100
,000
,000
-
-
-
100,
000,
000
4.
250
4.25
0 02
/15/
2018
02/
15/2
021
-
469,
496
06/1
2/20
01
2
,480
,000
-
22
5,00
0
-
2,25
5,00
0
4.65
0 4.
650
10/0
1/20
10 1
0/01
/202
2
-
11
2,76
3 06
/12/
2001
7,7
29,8
61
-
478,
859
-
7
,251
,002
4.
652
4.65
2 10
/01/
2010
10/
01/2
022
-
348,
440
06/1
5/20
01
3
73,1
95,0
00
-
6
0,54
0,00
0
-
312,
655,
000
4.
400
5.50
0 12
/15/
2010
12/
15/2
016
-
18,
568,
728
06/1
5/20
01
4
0,00
0,00
0
-
2
0,00
0,00
0
-
20,0
00,0
00
4.25
0 4.
250
06/1
5/20
11
06/1
5/20
11
-
1,67
5,00
0 06
/15/
2001
20,
000,
000
-
-
-
20,0
00,0
00
4.33
0 4.
330
06/1
5/20
12 0
6/15
/201
2
-
86
6,00
0 11
/15/
2001
81,
165,
000
-
9,
000,
000
5
2,91
5,00
0
19,2
50,0
00
3.70
0 5.
000
11/1
5/20
10
11/1
5/20
11
-
3,57
3,96
1 11
/15/
2001
198
,865
,000
-
4,
025,
000
-
19
4,84
0,00
0
5.00
0 5.
125
11/1
5/20
10
11/1
5/20
19
-
1
0,00
4,04
4 12
/15/
2001
65,
000,
000
-
22,
000,
000
-
43
,000
,000
4.
100
5.00
0 12
/15/
2010
12/
15/2
011
-
2,49
2,01
5 04
/15/
2002
62,
860,
000
-
14,
250,
000
20,1
10,0
00
28
,500
,000
4.
150
5.25
0 04
/15/
2011
04
/15/
2012
-
3,
001,
020
06/1
5/20
02
5
8,29
5,00
0
-
11,2
00,0
00
19,
180,
000
27
,915
,000
3.
950
4.50
0 06
/15/
2011
06
/15/
2013
-
2,46
7,79
3 06
/15/
2002
51,
075,
000
-
16,
605,
000
-
34
,470
,000
5.
000
5.50
0 12
/15/
2011
12
/15/
2018
-
2,23
5,22
5

O-2 FISCAL YEAR 2010 ANNUAL REPORT
DEB
T M
AN
AG
EMEN
T D
IVIS
ION
SCH
EDU
LE O
F D
EBT
OU
TSTA
ND
ING
(1) -
BU
DG
ETA
RY B
ASI
S (C
ontin
ued)
JUN
E 30
, 201
0
Inte
rest
In
tere
st
FY 2
010
Lo
w
Hig
h N
ext
Last
A
ccre
ted
Paid
Issu
e O
utst
andi
ng
Ref
unde
d or
O
utst
andi
ng
R
ate
Rat
e M
atur
ity
Mat
urity
Th
roug
h D
urin
gD
ate
June
30,
200
9 Is
sued
R
etire
d D
efea
sed
June
30,
201
0
(%)
(%)
Dat
e D
ate
FY 2
010
(2)
FY 2
010(3
)
08/1
5/20
02
1
39,1
25,0
00
-
2
0,83
5,00
0
24,
875,
000
93
,415
,000
3.
500
5.25
0 11
/15/
2010
11
/15/
2022
-
5,
970,
723
08/1
5/20
02
2
24,2
50,0
00
-
1
1,90
0,00
0
-
212,
350,
000
4.
000
5.50
0 11
/15/
2010
11
/15/
2015
-
11,
754,
950
11/0
1/20
02
1
11,2
85,0
00
-
11,8
40,0
00
43,
340,
000
56
,105
,000
3.
500
5.00
0 10
/15/
2010
10/
15/2
022
-
5,00
1,92
8 04
/15/
2003
142
,785
,000
-
15,
000,
000
3
9,65
5,00
0
88,1
30,0
00
3.60
0 5.
000
04/1
5/20
11
04/1
5/20
23
-
6,62
2,61
8 04
/15/
2003
35,
800,
000
-
9,
000,
000
-
26
,800
,000
5.
750
5.75
0 04
/30/
2011
04
/30/
2013
-
263,
132
05/0
1/20
03
1
27,3
05,0
00
-
1
6,02
5,00
0
38,
485,
000
72
,795
,000
3.
300
5.00
0 05
/01/
2011
05
/01/
2023
-
5,77
9,74
8 08
/20/
2003
61,
580,
000
-
29,
155,
000
-
32
,425
,000
5.
000
5.00
0 08
/01/
2010
08/
01/2
010
-
2,3
50,1
25
10/0
1/20
03
1
19,8
95,0
00
-
1
0,00
0,00
0
8,
610,
000
10
1,28
5,00
0
3.00
0 5.
000
08/1
5/20
10 0
8/15
/202
3
-
4,
906,
476
11/1
3/20
03
8
2,52
5,00
0
-
1
0,52
5,00
0
-
72,0
00,0
00
2.87
5 5.
250
10/1
5/20
10 1
0/15
/202
3
-
3,
336,
269
12/1
8/20
03
4
3,13
5,00
0
-
2
1,76
5,00
0
-
21,3
70,0
00
5.00
0 5.
000
03/1
5/20
11
03/1
5/20
11
-
2,15
6,75
0 03
/01/
2004
225
,000
,000
-
15,
000,
000
1
4,52
0,00
0
195,
480,
000
2.
750
5.00
0 03
/01/
2011
03
/01/
2024
-
1
0,35
1,36
5 04
/08/
2004
973
,585
,000
-
28,
820,
000
-
94
4,76
5,00
0
2.75
0 5.
000
12/0
1/20
10 0
6/01
/202
0
-
47
,794
,119
05
/04/
2004
205
,000
,000
-
30,
000,
000
-
17
5,00
0,00
0
3.30
0 5.
000
04/0
1/20
11
04/0
1/20
24
-
10,
058,
881
12/2
2/20
04
2
20,0
00,0
00
-
1
5,00
0,00
0
-
205,
000,
000
2.
900
5.00
0 12
/01/
2010
12/
01/2
024
-
1
0,08
0,17
0 03
/16/
2005
280
,000
,000
-
-
-
280,
000,
000
5.
000
5.00
0 03
/01/
2016
03/
01/2
023
-
9,70
6,91
3 04
/27/
2005
275
,860
,000
-
-
-
275,
860,
000
4.
375
5.25
0 06
/01/
2017
06/
01/2
021
-
1
4,40
9,93
8 04
/27/
2005
15,
620,
000
-
-
-
15,6
20,0
00
3.99
0 3.
990
06/0
1/20
16 0
6/01
/201
6
-
62
3,23
8 04
/27/
2005
20,
000,
000
-
-
-
20
,000
,000
5.
070
5.07
0 06
/01/
2017
06/
01/2
017
-
1,01
4,00
0 04
/27/
2005
20,
000,
000
-
-
-
20,0
00,0
00
5.20
0 5.
200
06/0
1/20
20 0
6/01
/202
0
-
1,
040,
000
06/0
1/20
05
2
52,0
00,0
00
-
1
5,75
0,00
0
-
236,
250,
000
4.
000
5.00
0 06
/01/
2011
06
/01/
2025
-
11,
088,
000
06/0
1/20
05
3
6,00
0,00
0
-
6,00
0,00
0
-
30,0
00,0
00
4.30
0 4.
450
06/0
1/20
11
06/0
1/20
15
-
1,
569,
000
11/1
5/20
05
2
55,0
00,0
00
-
1
5,00
0,00
0
-
240,
000,
000
4.
000
5.00
0 11
/15/
2010
11
/15/
2025
-
11
,722
,500
03
/09/
2006
246
,500
,000
-
14,
500,
000
-
23
2,00
0,00
0
3.50
0 5.
000
12/1
5/20
10 1
2/15
/202
5
-
10,
444,
830
05/0
1/20
06
1
70,0
00,0
00
-
1
0,00
0,00
0
-
160,
000,
000
3.
700
5.00
0 05
/01/
2011
05
/01/
2026
-
7,65
5,38
5 06
/01/
2006
199
,750
,000
-
11
,750
,000
-
18
8,00
0,00
0
3.60
0 5.
000
06/0
1/20
11
06/0
1/20
26
-
9,
560,
208
11/0
9/20
06
2
95,0
00,0
00
-
-
-
295,
000,
000
4.
000
5.00
0 11
/01/
2012
11
/01/
2026
-
14,
096,
500
11/0
9/20
06
3
07,0
05,0
00
-
-
-
30
7,00
5,00
0
4.00
0 5.
000
12/1
5/20
15 1
2/15
/202
2
-
14,
895,
375
12/1
4/20
06
3
27,0
00,0
00
-
2
2,00
0,00
0
-
305,
000,
000
3.
500
5.00
0 12
/01/
2010
12/
01/2
021
-
1
4,38
4,74
4 12
/14/
2006
8,0
00,0
00
-
8,00
0,00
0
-
-
12
/01/
2009
-
192,
000
05/1
0/20
07
1
78,2
00,0
00
-
1
0,96
0,00
0
-
167,
240,
000
4.
000
5.00
0 05
/01/
2011
05
/01/
2027
-
7,77
9,92
5 05
/10/
2007
173
,055
,000
-
25
,000
-
17
3,03
0,00
0
4.00
0 5.
000
05/0
1/20
11
05/0
1/20
22
-
8,
474,
900
06/1
4/20
07
2
13,3
00,0
00
-
1
0,79
0,00
0
-
202,
510,
000
3.
750
5.00
0 06
/01/
2011
06
/01/
2027
-
9,7
88,9
78
12/1
9/20
07
1
78,3
85,0
00
-
3
0,38
5,00
0
-
148,
000,
000
3.
500
5.00
0 03
/15/
2011
03
/15/
2015
-
8,74
8,25
0 12
/19/
2007
36,
000,
000
-
10,
000,
000
-
26
,000
,000
3.
950
4.29
0 12
/01/
2010
12/
01/2
012
-
1,26
8,90
0 12
/19/
2007
285
,000
,000
-
15,
000,
000
-
27
0,00
0,00
0
3.50
0 5.
000
12/0
1/20
10 1
2/01
/202
7
-
12,
230,
950
04/3
0/20
08
3
7,50
0,00
0
-
1
2,50
0,00
0
-
25,0
00,0
00
3.50
0 3.
500
05/0
1/20
11
05/0
1/20
12
-
57
5,85
3 06
/26/
2008
380
,000
,000
-
20,
000,
000
-
36
0,00
0,00
0
3.00
0 5.
000
04/1
5/20
11
04/1
5/20
28
-
16,
334,
716
06/2
6/20
08
3
69,5
50,0
00
-
1
9,45
0,00
0
-
350,
100,
000
3.
000
5.00
0 04
/15/
2011
04
/15/
2028
-
1
7,48
7,96
0 11
/06/
2008
500
,000
,000
-
25,
000,
000
-
47
5,00
0,00
0
3.50
0 5.
750
11/0
1/20
10
11/0
1/20
28
-
2
3,70
1,54
6 02
/26/
2009
400
,000
,000
-
15,
000,
000
-
38
5,00
0,00
0
2.00
0 5.
000
02/1
5/20
11
02/1
5/20
29
-
1
6,65
2,64
7 03
/26/
2009
72,
595,
000
-
28,
300,
000
-
44
,295
,000
2.
000
5.00
0 03
/01/
2011
03
/01/
2018
-
1,
870,
928
03/2
6/20
09
1
55,0
00,0
00
-
1
2,75
0,00
0
-
142,
250,
000
2.
000
5.00
0 03
/01/
2011
03
/01/
2023
-
5,57
1,84
1 03
/26/
2009
80,
000,
000
-
8,
000,
000
-
72
,000
,000
3.
080
5.46
0 03
/01/
2011
03
/01/
2019
-
3,52
7,92
2

OFFICE OF THE STATE TREASURER, DENISE L. NAPPIER O-3
DEB
T M
AN
AG
EMEN
T D
IVIS
ION
SCH
EDU
LE O
F D
EBT
OU
TSTA
ND
ING
(1) -
BU
DG
ETA
RY B
ASI
S (C
ontin
ued)
JUN
E 30
, 201
0
Inte
rest
In
tere
st
FY 2
010
Lo
w
Hig
h N
ext
Last
A
ccre
ted
Paid
Issu
e O
utst
andi
ng
Ref
unde
d or
O
utst
andi
ng
R
ate
Rat
e M
atur
ity
Mat
urity
Th
roug
h D
urin
gD
ate
June
30,
200
9 Is
sued
R
etire
d D
efea
sed
June
30,
201
0
(%)
(%)
Dat
e D
ate
FY 2
010
(2)
FY 2
010(3
)
12/0
3/20
09
-
165,
750,
000
-
-
16
5,75
0,00
0
5.00
0 5.
000
01/0
1/20
12 0
1/01
/201
4
-
64
4,58
3 12
/23/
2009
-
45
0,00
0,00
0
-
-
450,
000,
000
4.
950
5.63
2 12
/01/
2020
12/
01/2
029
-
1
0,68
9,13
9 04
/28/
2010
-
18
4,25
0,00
0
-
-
184,
250,
000
4.
407
5.25
7 04
/01/
2019
04/
01/2
026
-
-
04/2
8/20
10
-
105,
000,
000
-
-
10
5,00
0,00
0
2.50
0 5.
000
04/0
1/20
15 0
4/01
/201
8
-
-
06
/23/
2010
-
20
0,00
0,00
0
-
-
200,
000,
000
1.
500
5.00
0 06
/01/
2011
12
/01/
2018
-
-
06/2
3/20
10
-
258,
235,
000
-
-
25
8,23
5,00
0
2.00
0 5.
000
12/0
1/20
12 1
2/01
/202
1
-
-
SU
B-T
OTA
L $
9,94
7,28
0,32
5 $
1,36
3,23
5,00
0 $ 8
89,8
21,5
07
$ 261
,690
,000
$ 1
0,15
9,00
3,81
7
$ 122
,731
,692
$ 5
76,9
50,8
89
BO
ND
TYP
E: G
ENER
AL
OB
LIG
ATIO
N -
BO
ND
AN
TIC
IPAT
ION
NO
TES
04/2
9/20
09
$ 22
8,16
0,00
0
$ -
$ -
$ -
$ 22
8,16
0,00
0
2.00
0 4.
000
06/0
1/20
11
06/0
1/20
11
$ -
$ 9,
740,
220
04/2
9/20
09
3
53,0
85,0
00
-
3
53,0
85,0
00
-
-
04/2
8/20
10
-
7,
042,
084
04/2
8/20
10
-
353
,085
,000
-
-
353,
085,
000
2.
000
2.00
0 05
/19/
2011
05
/19/
2011
-
- SU
B-T
OTA
L $
581,
245,
000
$
353,
085,
000
$ 353
,085
,000
$
- $
581,
245,
000
$
- $ 1
6,78
2,30
4
B
OD
Y TY
PE: G
ENER
AL
OB
LIG
ATIO
N T
EAC
HER
S’ R
ETIR
EMEN
T FU
ND
BO
ND
S (5
)
04/3
0/20
08
$ 2,0
89,6
75,0
00
$ -
$ -
$ -
$ 2,0
89,6
75,0
00
4.20
0 5.
850
03/1
5/20
14 0
3/15
/203
2 $
- $ 1
20,8
57,0
76
04/3
0/20
08
1
76,3
13,2
71
-
-
-
17
6,31
3,27
1
5.40
4 6.
270
03/1
5/20
14 0
3/15
/202
5 2
4,94
4,04
7
-
04/3
0/20
08
1
0,59
0,00
0
-
-
-
10
,590
,000
5.
000
5.00
0 03
/15/
2028
03/
15/2
028
-
52
9,50
0 SU
B-T
OTA
L $ 2
,276
,578
,271
$
- $
- $
- $ 2
,276
,578
,271
$
24,9
44,0
47
$ 121
,386
,576
B
ON
D T
YPE:
EC
ON
OM
IC R
ECO
VERY
NO
TES
12/0
3/20
09
$ -
$ 91
5,79
5,00
0
$ -
$ -
$ 91
5,79
5,00
0
2.00
0 5.
000
01/0
1/20
12 0
1/01
/201
6 $
- $
3,15
5,28
6 SU
B-T
OTA
L $
- $
915,
795,
000
$
- $
- $
915,
795,
000
$
- $
3,15
5,28
6
BO
ND
TYP
E: G
ENER
AL
OB
LIG
ATIO
N -
REV
ENU
E SU
PPO
RTE
D
03/1
5/19
93
$ 1,
590,
000
$
- $
530,
000
$
- $
1,06
0,00
0
5.50
0 5.
500
03/1
5/20
11
03/1
5/20
12 $
-
$ 87
,450
03
/15/
1994
461
-
461
-
-
03/1
5/20
10
-
2
5 SU
B-T
OTA
L $
1,59
0,46
1
$ -
$ 53
0,46
1
$ -
$ 1,
060,
000
$
- $
87,4
75
BO
ND
TYP
E: S
PEC
IAL
TAX
OB
LIG
ATIO
N
05/1
5/19
90
$ 22
,750
,000
$
- $ 2
2,75
0,00
0
$ -
$ -
06/0
1/20
10 $
-
$ 1
,620
,938
12
/19/
1990
43,0
00,0
00
-
2
0,80
0,00
0
-
22
,200
,000
6.
171
6.17
1 12
/01/
2010
12/
01/2
010
-
2,02
2,19
0 09
/15/
1991
77,6
55,0
00
-
-
-
77
,655
,000
6.
500
6.50
0 10
/01/
2010
10/
01/2
012
-
5,04
7,57
5 09
/01/
1992
82,8
60,0
00
-
1
8,85
0,00
0
-
64,0
10,0
00
6.12
5 6.
125
09/0
1/20
10 0
9/01
/201
2
-
4,
500,
250
10/0
1/19
96
23
,940
,000
-
23,
940,
000
-
-
10/0
1/20
09
-
71
8,20
0 04
/15/
1998
175,
440,
000
-
2
2,30
5,00
0
16,
100,
000
13
7,03
5,00
0 5.
500
5.50
0 10
/01/
2010
10/
01/2
013
-
8,54
5,05
6 09
/15/
1998
62,9
25,0
00
-
11,2
75,0
00
-
51,6
50,0
00
5.50
0 5.
500
11/0
1/20
10
11/0
1/20
13
-
3,15
0,81
3 11
/15/
1999
19,7
35,0
00
-
7,63
5,00
0
12,
100,
000
-
12/0
1/20
09
-
19
5,48
8 07
/15/
2000
43,1
10,0
00
-
9,88
0,00
0
22,
790,
000
10
,440
,000
5.
250
5.25
0 09
/01/
2010
09/
01/2
010
-
1,40
7,88
1 09
/15/
2001
39,2
05,0
00
-
-
-
39
,205
,000
4.
000
5.37
5 10
/01/
2010
10/
01/2
014
-
1,74
1,75
0 09
/15/
2001
270,
125,
000
-
5
2,52
5,00
0
-
217,
600,
000
5.37
5 5.
375
10/0
1/20
10 1
0/01
/201
5
-
12,
868,
835
05/0
1/20
02
55
,145
,000
-
-
-
55,1
45,0
00
4.00
0 5.
375
07/0
1/20
10 0
7/01
/202
2
-
2,
611,
264

O-4 FISCAL YEAR 2010 ANNUAL REPORT
DEB
T M
AN
AG
EMEN
T D
IVIS
ION
SCH
EDU
LE O
F D
EBT
OU
TSTA
ND
ING
(1) -
BU
DG
ETA
RY B
ASI
S (C
ontin
ued)
JUN
E 30
, 201
0
Inte
rest
In
tere
st
FY 2
010
Lo
w
Hig
h N
ext
Last
A
ccre
ted
Paid
Issu
e O
utst
andi
ng
Ref
unde
d or
O
utst
andi
ng
R
ate
Rat
e M
atur
ity
Mat
urity
Th
roug
h D
urin
gD
ate
June
30,
200
9 Is
sued
R
etire
d D
efea
sed
June
30,
201
0
(%)
(%)
Dat
e D
ate
FY 2
010
(2)
FY 2
010(3
)
11/0
1/20
02
13
3,25
0,00
0
-
5,
305,
000
-
12
7,94
5,00
0 3.
300
5.25
0 12
/01/
2010
12/
01/2
022
-
6,20
2,44
4 07
/01/
2003
58,2
90,0
00
-
4
5,39
0,00
0
-
12,9
00,0
00
3.00
0 5.
000
09/0
1/20
10 0
9/01
/201
0
-
1,
553,
563
11/1
5/20
03
16
3,84
0,00
0
-
7,
895,
000
-
15
5,94
5,00
0 3.
000
5.00
0 01
/01/
2011
01
/01/
2024
-
7,74
8,60
4 11
/15/
2004
174,
170,
000
-
7,3
65,0
00
-
166,
805,
000
3.50
0 5.
000
07/0
1/20
10 0
7/01
/202
4
-
8,
371,
810
11/1
5/20
04
89
,725
,000
-
2
65,0
00
-
89,4
60,0
00
3.00
0 5.
250
07/0
1/20
10 0
7/01
/201
9
-
4,
306,
262
12/1
5/20
05
22
7,10
5,00
0
-
8,
725,
000
-
218,
380,
000
4.50
0 5.
000
07/0
1/20
10 0
7/01
/202
5
-
10,
834,
650
10/2
5/20
07
24
2,02
0,00
0
-
8
,345
,000
-
23
3,67
5,00
0 3.
500
5.00
0 08
/01/
2010
08/
01/2
027
-
11,0
15,2
70
10/0
1/20
08
97
,690
,000
-
-
-
97,6
90,0
00
3.00
0 5.
000
02/0
1/20
12 0
2/01
/202
2
-
3,
812,
050
12/1
0/20
08
30
0,00
0,00
0
-
9,
460,
000
-
29
0,54
0,00
0 3.
000
5.00
0 11
/01/
2010
11
/01/
2028
-
14,
042,
581
01/2
9/20
09
41
5,03
5,00
0
-
2,
605,
000
-
41
2,43
0,00
0 2.
000
5.00
0 02
/01/
2011
02
/01/
2022
-
18,
798,
107
11/1
0/20
09
-
195,
970,
000
-
-
195,
970,
000
2.50
0 5.
000
12/0
1/20
10 1
2/01
/202
9
-
4,
184,
275
11/1
0/20
09
-
304,
030,
000
-
-
30
4,03
0,00
0 4.
855
5.74
0 12
/01/
2020
12/
01/2
029
-
9,30
3,70
4 11
/10/
2009
-
49
,775
,000
-
-
49
,775
,000
2.
000
5.00
0 12
/01/
2010
12/
01/2
014
-
889,
941
SUB-
TOTA
L $
2,81
7,01
5,00
0
$ 54
9,77
5,00
0
$ 285
,315
,000
$
50,9
90,0
00
$ 3,
030,
485,
000
$
- $
145,
493,
501
BO
ND
TYP
E: B
RA
DLE
Y IN
TER
NAT
ION
AL
AIR
POR
T03
/01/
2001
$
170,
880,
000
$
- $
4,60
0,00
0
$ -
$ 16
6,28
0,00
0
4.30
0 5.
250
10/0
1/20
10 1
0/01
/203
1 $
- $
8,65
0,55
0 03
/01/
2001
17,
335,
000
-
30
5,00
0
-
17,0
30,0
00
4.20
0 4.
300
10/0
1/20
10 1
0/01
/201
2
-
7
34,1
28
07/0
8/20
04
1
0,71
5,00
0
-
5,24
0,00
0
-
5,47
5,00
0
5.00
0 5.
000
10/0
1/20
10 1
0/01
/201
0
-
4
04,7
50
SUB
-TO
TAL
$ 19
8,93
0,00
0
$ -
$ 10,
145,
000
$
- $
188,
785,
000
$
- $
9,78
9,42
8
B
ON
D T
YPE:
CLE
AN
WAT
ER F
UN
D07
/01/
2003
$
101,
180,
000
$
- $
4,65
0,00
0
$ -
$ 96
,530
,000
2.
375
5.00
0 10
/01/
2010
10/
01/2
025
$ -
$ 4,
404,
646
07/0
1/20
03
8
9,68
0,00
0
-
7
,975
,000
-
81
,705
,000
2.
375
5.00
0 10
/01/
2010
10/
01/2
015
-
4,12
0,43
1 07
/10/
2003
55,
000,
000
-
-
5
5,00
0,00
0
-
07/0
1/20
09
-
2
1,76
2 07
/10/
2003
66,
375,
000
-
-
6
6,37
5,00
0
-
07
/03/
2009
-
27,2
64
07/2
7/20
06
1
42,1
15,0
00
-
5,8
80,0
00
-
136,
235,
000
3.
750
5.00
0 07
/01/
2010
07/
01/2
027
-
6,15
3,91
3 07
/27/
2006
15,
655,
000
-
7
,290
,000
-
8,
365,
000
3.
800
5.00
0 07
/01/
2010
07/
01/2
012
-
561
,150
08
/06/
2008
171
,195
,000
-
21,
375,
000
-
149,
820,
000
3.
000
5.00
0 02
/01/
2011
02
/01/
2018
-
7,49
2,22
5 06
/25/
2009
199
,440
,000
-
2
,795
,000
-
196
,645
,000
2.
000
5.00
0 06
/01/
2011
06
/01/
2027
-
8,2
65,8
57
06/2
5/20
09
4
4,56
0,00
0
-
7,
745,
000
-
36,8
15,0
00
2.00
0 5.
000
06/0
1/20
11
06/0
1/20
15
-
1
,384
,098
07
/30/
2009
-
11
5,83
5,00
0
-
-
11
5,83
5,00
0
1.50
0 5.
000
10/0
1/20
10 1
0/01
/202
2
-
3
,201
,082
SU
B-T
OTA
L $
885,
200,
000
$
115,
835,
000
$ 5
7,71
0,00
0
$ 121
,375
,000
$ 8
21,9
50,0
00
$ -
$ 35,
632,
428
BO
ND
TYP
E: U
CO
NN
200
0 (6
) 02
/21/
1996
$
4,36
9,71
5
$ -
$ 2,
247,
274
$
- $
2,12
2,44
1
5.10
0 5.
100
02/0
1/20
11
02/0
1/20
11
$ 2,
251,
527
$
2,25
7,72
6 03
/01/
1999
13,
000,
000
-
4,
000,
000
9,00
0,00
0
-
04
/01/
2010
-
572
,000
03
/01/
2000
6,5
50,0
00
-
6,55
0,00
0
-
-
03/0
1/20
10
-
3
27,5
00
03/1
5/20
01
2
0,67
5,00
0
-
4,74
5,00
0
10,
970,
000
4,9
60,0
00
4.00
0 4.
000
04/0
1/20
11
04/0
1/20
11
-
906
,248
04
/01/
2002
15,
000,
000
-
5,
000,
000
-
10
,000
,000
4.
200
5.00
0 04
/01/
2011
04
/01/
2012
-
653
,944
03
/01/
2003
37,
205,
000
-
4,72
5,00
0
6
,885
,000
25,
595,
000
3.
200
5.25
0 02
/15/
2011
02
/15/
2023
-
1,59
5,09
0 01
/15/
2004
73,
370,
000
-
4,89
5,00
0
9
,030
,000
59,4
45,0
00
2.75
0 5.
000
01/1
5/20
11
01/1
5/20
24
-
3
,015
,160
01
/15/
2004
203
,080
,000
-
11
,240
,000
-
19
1,84
0,00
0
3.90
0 5.
000
01/1
5/20
11
01/1
5/20
20
-
10,
149,
105

OFFICE OF THE STATE TREASURER, DENISE L. NAPPIER O-5
DEB
T M
AN
AG
EMEN
T D
IVIS
ION
SCH
EDU
LE O
F D
EBT
OU
TSTA
ND
ING
(1) -
BU
DG
ETA
RY B
ASI
S (C
ontin
ued)
JUN
E 30
, 201
0
Inte
rest
In
tere
st
FY 2
010
Lo
w
Hig
h N
ext
Last
A
ccre
ted
Paid
Issu
e O
utst
andi
ng
Ref
unde
d or
O
utst
andi
ng
R
ate
Rat
e M
atur
ity
Mat
urity
Th
roug
h D
urin
gD
ate
June
30,
200
9 Is
sued
R
etire
d D
efea
sed
June
30,
201
0
(%)
(%)
Dat
e D
ate
FY 2
010
(2)
FY 2
010(3
)
03/1
6/20
05
7
6,87
0,00
0
-
4,90
0,00
0
-
71,
970,
000
3.
375
5.00
0 02
/15/
2011
02
/15/
2025
-
3,3
72,0
71
03/1
5/20
06
6
5,57
0,00
0
-
3,86
0,00
0
-
61,7
10,0
00
3.45
0 5.
000
02/1
5/20
11
02/1
5/20
26
-
2
,890
,310
03
/15/
2006
59,
555,
000
-
-
-
59
,555
,000
4.
750
5.00
0 02
/15/
2013
02/
15/2
020
-
2,97
0,88
8 04
/12/
2007
78,
815,
000
-
5,
270,
000
-
73
,545
,000
3.
600
5.00
0 04
/01/
2011
04
/01/
2027
-
3,21
2,37
5 04
/12/
2007
46,
030,
000
-
-
-
46
,030
,000
5.
000
5.00
0 04
/01/
2016
04/
01/2
022
-
2,
301,
500
04/1
6/20
09
1
44,8
55,0
00
-
7,34
5,00
0
-
137,
510,
000
2.
000
5.00
0 02
/15/
2011
02
/15/
2029
-
4,99
5,66
6 05
/25/
2010
-
97
,115
,000
-
-
97
,115
,000
2.
000
5.00
0 02
/15/
2011
02
/15/
2030
-
- 05
/25/
2010
-
36
,095
,000
-
-
36
,095
,000
2.
000
5.00
0 02
/15/
2011
02
/15/
2021
-
- SU
B-T
OTA
L $
844,
944,
715
$
133,
210,
000
$ 6
4,77
7,27
4
$ 35,
885,
000
$
877,
492,
441
$
2,25
1,52
7
$ 39,
219,
583
BO
ND
TYP
E: C
DA
INC
REM
ENT
FIN
AN
CIN
G (7
) 01
/01/
1997
$
985,
000
$
- $
985,
000
$
- $
-
05/0
1/20
10 $
-
$ 52
,944
10
/05/
2004
7,2
25,0
00
-
340
,000
-
6,
885,
000
3.
000
5.00
0 10
/15/
2010
10/
15/2
024
-
284,
489
10/0
5/20
04
4
,765
,000
-
62
0,00
0
-
4,14
5,00
0
3.00
0 3.
500
12/1
5/20
10 1
2/15
/201
5
-
14
1,69
4 10
/05/
2004
8,3
70,0
00
-
-
-
8
,370
,000
5.
000
5.12
5 05
/01/
2011
05
/01/
2017
-
423,
413
12/2
0/20
06
8
,730
,000
-
58
0,00
0
-
8,15
0,00
0
3.75
0 4.
000
12/1
5/20
10 1
2/15
/202
0
-
3
31,0
66
SUB
-TO
TAL
$
30,0
75,0
00
$
- $
2,52
5,00
0
$ -
$ 27
,550
,000
$
- $
1,23
3,60
6
B
ON
D T
YPE:
CD
A G
OVE
RN
MEN
TAL
LEA
SE R
EVEN
UE
(8)
12/1
5/19
94
$ 3,
535,
000
$
- $
620,
000
$
- $
2,91
5,00
0
6.60
0 6.
600
06/1
5/20
11
06/1
5/20
14 $
-
$ 23
3,31
0 SU
B-T
OTA
L $
3,53
5,00
0
$ -
$ 62
0,00
0
$ -
$ 2,
915,
000
$
- $
233,
310
BO
ND
TYP
E: C
HEF
A C
HIL
DC
AR
E FA
CIL
ITIE
S PR
OG
RA
M (9
) 04
/15/
1998
$
4,87
0,00
0
$ -
$ 12
0,00
0
$ -
$ 4,
750,
000
6.
750
6.75
0 07
/01/
2010
07/
01/2
028
$ -
$ 32
4,67
5 11
/01/
1998
6,8
95,0
00
-
205
,000
-
6
,690
,000
4.
400
5.00
0 07
/01/
2010
07/
01/2
028
-
3
32,8
38
09/0
1/19
99
1
4,95
0,00
0
-
510
,000
-
1
4,44
0,00
0
5.00
0 5.
625
07/0
1/20
10 0
7/01
/202
9
-
8
07,8
29
08/0
1/20
00
3
,430
,000
-
9
0,00
0
-
3,3
40,0
00
4.87
5 5.
500
07/0
1/20
10 0
7/01
/203
0
-
1
83,4
34
04/0
1/20
01
3
,415
,000
-
8
5,00
0
-
3,3
30,0
00
4.25
0 5.
000
07/0
1/20
10 0
7/01
/203
1
-
1
65,4
19
12/2
0/20
06
1
9,16
5,00
0
-
350
,000
-
1
8,81
5,00
0
3.62
5 5.
000
07/0
1/20
10 0
7/01
/203
6
-
9
22,1
38
10/2
3/20
08
1
6,87
5,00
0
-
-
-
16,
875,
000
4.
000
6.00
0 07
/01/
2010
07/
01/2
038
-
992
,288
SU
B-T
OTA
L
$69
,600
,000
$
- $
1,36
0,00
0
$ -
$ 68
,240
,000
$
- $
3,72
8,62
1
B
ON
D T
YPE:
JU
VEN
ILE
TRA
ININ
G S
CH
OO
L (1
0)
02/1
5/20
01
$ 16
,520
,000
$
- $
440,
000
$
- $
16,0
80,0
00
4.25
0 5.
250
12/1
5/20
10 1
2/15
/203
0 $
- $
799,
363
SUB
-TO
TAL
$ 16
,520
,000
$
- $
440,
000
$
- $
16,0
80,0
00
$ -
$ 79
9,36
3
B
ON
D T
YPE:
BR
AD
LEY
INTE
RN
ATIO
NA
L PA
RK
ING
OPE
RAT
ION
S03
/15/
2000
$
44,6
55,0
00
$ -
$ 1,
650,
000
$
- $
43,0
05,0
00
6.12
5 6.
600
07/0
1/20
10 0
7/01
/202
4 $
- $
2,85
6,78
6 SU
B-T
OTA
L $
44,6
55,0
00
$ -
$ 1,
650,
000
$
- $
43,0
05,0
00
$ -
$ 2,
856,
786

O-6 FISCAL YEAR 2010 ANNUAL REPORT
DEB
T M
AN
AG
EMEN
T D
IVIS
ION
SCH
EDU
LE O
F D
EBT
OU
TSTA
ND
ING
(1) -
BU
DG
ETA
RY B
ASI
S (C
ontin
ued)
JUN
E 30
, 201
0
Inte
rest
In
tere
st
FY 2
010
Lo
w
Hig
h N
ext
Last
A
ccre
ted
Paid
Issu
e O
utst
andi
ng
Ref
unde
d or
O
utst
andi
ng
R
ate
Rat
e M
atur
ity
Mat
urity
Th
roug
h D
urin
gD
ate
June
30,
200
9 Is
sued
R
etire
d D
efea
sed
June
30,
201
0
(%)
(%)
Dat
e D
ate
FY 2
010
(2)
FY 2
010(3
)
BO
ND
TYP
E: C
HFA
SPE
CIA
L N
EED
S H
OU
SIN
G B
ON
DS
(11)
09/1
3/20
07
$ 25
,045
,000
$
- $
910,
000
$
- $
24,1
35,0
00
4.00
0 5.
000
06/1
5/20
11
06/1
5/20
27 $
-
$ 1,
197,
687
05/1
9/20
09
3
6,55
0,00
0
-
-
-
36
,550
,000
2.
375
5.00
0 06
/15/
2011
06
/15/
2029
-
1,47
2,27
5 05
/19/
2009
2,1
60,0
00
-
1,07
0,00
0
-
1,09
0,00
0
2.29
9 2.
299
06/1
5/20
11
06/1
5/20
11
-
51,8
09
SUB
-TO
TAL
$ 63
,755
,000
$
- $
1,9
80,0
00
$ -
$ 61
,775
,000
$
- $
2,72
1,77
1
B
ON
D T
YPE:
CC
EDA
BO
ND
S (1
2)
07/2
1/20
04
$ 10
,760
,000
$
- $
1,31
5,00
0
$ -
$ 9,
445,
000
3.
300
5.00
0 06
/15/
2011
06
/15/
2016
$
- $
416,
100
07/2
1/20
04
5
7,47
0,00
0
-
-
-
5
7,47
0,00
0
3.96
0 3.
960
06/1
5/20
17 0
6/15
/203
4
-
4,
517,
314
08/0
4/20
05
1
4,38
5,00
0
-
635,
000
-
1
3,75
0,00
0
5.00
0 5.
000
06/1
5/20
11
06/1
5/20
29
-
71
9,25
0 12
/16/
2008
22,
500,
000
-
48
5,00
0
-
22,
015,
000
3.
500
5.75
0 06
/15/
2011
06
/15/
2034
-
1,16
8,48
7 SU
B-T
OTA
L $
105,
115,
000
$
- $
2,43
5,00
0
$ -
$ 10
2,68
0,00
0
$ -
$ 6,
821,
151
TOTA
L $ 1
7,88
6,03
8,77
2
$ 3,
430,
935,
000
$ 1
,672
,394
,243
$ 46
9,94
0,00
0
$ 19,
174,
639,
529
$ 1
49,9
27,2
66
$ 966
,892
,078

OFFICE OF THE STATE TREASURER, DENISE L. NAPPIER O-7
DEB
T M
AN
AG
EMEN
T D
IVIS
ION
SCH
EDU
LE O
F D
EBT
OU
TSTA
ND
ING
(1) -
BU
DG
ETA
RY B
ASI
S (C
ontin
ued)
JUN
E 30
, 201
0
(1)
Incl
udes
all
outs
tand
ing
debt
issu
ed b
y th
e S
tate
of C
onne
ctic
ut a
s of
Jun
e 30
, 201
0.
(2)
Incl
udes
inte
rest
acc
rete
d on
Cap
ital A
ppre
ciat
on B
onds
(CA
Bs)
onl
y. I
nter
est o
n C
AB
s ac
cret
es o
ver t
he li
fe o
f the
bon
d an
d is
pai
d at
mat
urity
. Th
is a
mou
nt is
not
incl
uded
in th
e co
lum
n sh
own
as o
utst
andi
ng J
une
30, 2
010.
(3)
Incl
udes
inte
rest
rate
sw
ap p
aym
ents
and
var
iabl
e ra
te b
ond
fees
.(4
) D
ebt o
utst
andi
ng a
t Jun
e 30
, 201
0 in
clud
es $
11,2
75,0
00.0
0 in
Cer
tifi c
ates
of P
artic
ipat
ion
for t
he M
iddl
etow
n C
ourth
ouse
, whi
ch is
not
deb
t of t
he S
tate
. H
owev
er, t
he S
tate
is o
blig
ated
to
pay
a b
ase
rent
und
er a
leas
e fo
r the
cou
rthou
se, s
ubje
ct to
the
annu
al a
ppro
pria
tion
of fu
nds
or th
e av
aila
bilit
y of
oth
er fu
nds.
The
bas
e re
nt is
app
ropr
iate
d as
deb
t ser
vice
. The
C
ertifi
cat
es o
f Par
ticip
atio
n ar
e in
clud
ed o
n th
e Tr
easu
rer’s
Deb
t Man
agem
ent S
yste
m fo
r con
trol p
urpo
ses.
(5)
The
Teac
hers
’ Ret
irem
ent F
und
Bon
ds w
ere
issu
ed a
s ta
xabl
e bo
nds
purs
uant
to P
ublic
Act
07-
186
to fu
nd $
2 bi
llion
of t
he u
nfun
ded
liabi
lity
of th
e C
onne
ctic
ut T
each
ers’
Ret
irem
ent
Fund
, cap
italiz
ed in
tere
st a
nd c
ost o
f iss
uanc
e.(6
) U
Con
n 20
00 B
onds
wer
e au
thor
ized
in tw
o st
ages
, in
a to
tal a
mou
nt o
f $2.
3 bi
llion
ove
r a 2
0 ye
ar p
erio
d to
be
paid
by
the
Uni
vers
ity o
f Con
nect
icut
from
a S
tate
Deb
t Ser
vice
co
mm
itmen
t. A
s ea
ch s
erie
s is
issu
ed, t
he d
ebt s
ervi
ce is
app
ropr
iate
d fro
m th
e S
tate
Gen
eral
Fun
d.(7
) Th
e C
onne
ctic
ut D
evel
opm
ent A
utho
rity
has
issu
ed ta
x in
crem
ent b
onds
for c
erta
in e
cono
mic
dev
elop
men
t pro
ject
s. T
he d
ebt s
ervi
ce o
n th
e bo
nds
is d
eem
ed a
ppro
pria
ted
from
the
S
tate
’s G
ener
al F
und.
(8)
The
Con
nect
icut
Dev
elop
men
t Aut
horit
y is
sued
its
leas
e re
venu
e bo
nds
for t
he N
ew B
ritai
n G
over
nmen
t Cen
ter.
The
Sta
te is
obl
igat
ed to
pay
bas
e re
nt s
ubje
ct to
the
annu
al
appr
opria
tion
of fu
nds.
The
se p
aym
ents
are
bud
gete
d in
the
Trea
sure
r’s d
ebt s
ervi
ce b
udge
t as
leas
e pa
ymen
ts.
(9)
On
July
1, 1
999,
the
Trea
sure
r’s O
ffi ce
ass
umed
the
resp
onsi
bilit
y fo
r the
CH
EFA
Chi
ldca
re d
ebt s
ervi
ce a
ppro
pria
tion
per P
ublic
Act
97-
259.
(10)
A le
ase
purc
hase
fi na
ncin
g of
the
heat
ing
and
cool
ing
plan
t at t
he J
uven
ile T
rain
ing
Sch
ool i
n M
iddl
etow
n.(1
1) T
he C
onne
ctic
ut H
ousi
ng F
inan
ce A
utho
rity
(CH
FA) S
peci
al N
eeds
Hou
sing
bon
ds w
ere
issu
ed p
ursu
ant t
o P
ublic
Act
05-
280
and
Pub
lic A
ct 0
5-3
for t
he p
urpo
se o
f fi n
anci
ng c
osts
of
the
Nex
t Ste
p In
itiat
ive.
The
Sta
te is
requ
ired
to m
ake
debt
ser
vice
pay
men
ts o
n th
e bo
nds
unde
r a c
ontra
ct a
ssis
tanc
e ag
reem
ent b
etw
een
CH
FA, t
he T
reas
urer
and
OP
M.
(12)
The
Cap
ital C
ity E
cono
mic
Dev
elop
men
t Aut
horit
y (C
CE
DA
) Bon
ds w
ere
issu
ed to
pro
vide
fund
ing
for A
dria
en’s
Lan
ding
Dev
elop
men
t pro
ject
in H
artfo
rd.
The
bond
s, is
sued
in a
co
mbi
natio
n of
fi xe
d an
d va
riabl
e ra
te s
ecur
ities
, hav
e a
fi nal
mat
urity
of 2
034.
The
Sta
te is
requ
ired
to m
ake
all d
ebt s
ervi
ce p
aym
ents
on
the
bond
s up
to a
max
imum
ann
ual a
mou
nt
of $
9 m
illio
n pu
rsua
nt to
a c
ontra
ct a
ssis
tanc
e ag
reem
ent b
etw
een
CC
ED
A, t
he T
reas
urer
, and
OP
M. C
CE
DA
is re
quire
d to
reim
burs
e th
e S
tate
for t
he d
ebt s
ervi
ce p
aym
ents
from
net
pa
rkin
g an
d ce
ntra
l util
ity p
lant
reve
nues
.
NO
TE 1
: In
acc
orda
nce
with
Sec
tion
3-11
5 of
the
Gen
eral
Sta
tute
s, th
e S
tate
Com
ptro
ller s
hall
prov
ide
acco
untin
g st
atem
ents
rela
ting
to th
e fi n
anci
al c
ondi
tion
of th
e S
tate
as
a w
hole
in th
e sa
me
form
and
in th
e sa
me
cate
gorie
s as
app
ear i
n th
e bu
dget
ena
cted
by
the
Gen
eral
Ass
embl
y. T
he B
udge
t Act
ena
cted
for t
he 2
010
fi sca
l yea
r is
pres
ente
d on
a c
ompr
ehen
sive
bas
is o
f acc
ount
ing
prin
cipl
es.
In o
rder
to b
e co
nsis
tent
with
the
Com
ptro
ller’s
sta
tem
ents
and
the
budg
etar
y ac
t, th
e S
tate
Tre
asur
er h
as e
mpl
oyed
the
sam
e co
mpr
ehen
sive
bas
is o
f acc
ount
ing
for t
he p
rese
ntat
ion
of th
is s
ched
ule.
NO
TE 2
: G
AA
P ac
coun
ting
requ
ires
that
Lon
g-Te
rm d
ebt o
blig
atio
ns b
e se
greg
ated
into
the
porti
on p
ayab
le w
ithin
the
next
fi sc
al y
ear (
the
curr
ent p
ortio
n) a
nd th
e re
mai
ning
por
tion
that
is n
ot d
ue u
ntil
afte
r the
nex
t fi s
cal y
ear.
Thi
s m
anne
r of p
rese
ntat
ion
is n
ot u
sed
for t
he b
udge
tary
bas
is p
rese
ntat
ion.

O-8 FISCAL YEAR 2010 ANNUAL REPORT
DEB
T M
AN
AG
EMEN
T D
IVIS
ION
SCH
EDU
LE O
F A
UTH
OR
IZED
AN
D IS
SUED
DEB
T O
UTS
TAN
DIN
G (1
)
JUN
E 30
, 201
0
CO
RE
Lega
cy
Ince
ptio
n to
Dat
e Pr
inci
pal
Inte
rest
O
utst
andi
ng In
cl.
Fund
Fu
nd
A
mou
nt
Am
ount
O
utst
andi
ng
Acc
rete
d Th
roug
h A
ccre
ted
Inte
rest
No.
N
o.
Nam
e A
utho
rized
Is
sued
Ju
ne 3
0, 2
010
Fisc
al Y
ear 2
010(2
) Ju
ne 3
0, 2
010
BO
ND
TYP
E: G
ENER
AL
OB
LIG
ATIO
N-T
AX
SUPP
OR
TED
1203
3 15
01
EC
ON
OM
IC D
EV
ELO
PM
EN
T FU
ND
$
157,
430,
000
$
109,
430,
000
$
-
$
-
$
-
1203
4 15
02
EC
ON
OM
IC D
EV
ELO
PM
EN
T A
SS
ISTA
NC
E
716
,800
,000
6
24,0
62,4
41
116
,723
,148
-
1
16,7
23,1
48
1203
6 15
04
EC
ON
OM
IC S
TAB
ILIZ
ATIO
N F
UN
D
95,
000,
000
8
6,46
2,70
6
-
-
- 12
040
3775
C
ON
GR
EG
ATE
HO
US
ING
FO
R E
LDE
RLY
3
23,1
26,5
94
323
,126
,594
5
,183
,307
1
4,13
6,11
1
19,
319,
418
1204
0 38
04
ELD
ER
LY H
OU
SIN
G P
RO
JEC
T 3
,000
,000
3
,000
,000
1
50,0
00
409
,086
5
59,0
86
1205
0 18
70
LOC
AL
CA
PIT
AL
IMP
RO
VE
ME
NT
FUN
D
615
,000
,000
5
85,0
00,0
00
160
,205
,000
-
1
60,2
05,0
00
1205
1 18
72
CA
PIT
AL
EQ
UIP
ME
NT
PU
RC
HA
SE
FU
ND
3
84,9
90,0
00
321
,213
,428
3
8,90
0,00
0
-
38,
900,
000
1205
2 18
73
GR
AN
TS T
O L
OC
AL
GO
VTS
. & O
THE
RS
2
,249
,449
,508
1
,376
,732
,272
1
85,4
73,1
47
17,
185,
574
2
02,6
58,7
21
1205
3 18
74
EC
ON
OM
IC D
EV
ELO
PM
EN
T &
OTH
ER
GR
AN
TS
104
,193
,324
1
01,1
93,9
48
5,7
52,6
15
13,
813,
719
1
9,56
6,33
4 12
055
1879
H
OU
SIN
G H
OM
ELE
SS
PE
RS
ON
S
8,1
00,0
00
7,0
95,6
96
1,0
54,4
36
-
1,0
54,4
36
1205
8 19
61
SP
EC
IAL
CO
NTA
MIN
ATE
D P
RO
P R
EM
& IN
S F
UN
D
6,0
00,0
00
3,0
00,0
00
-
-
- 12
059
1971
H
AR
TFO
RD
RE
DE
VE
LOP
ME
NT
500
,000
,000
4
75,8
10,0
00
156
,305
,000
-
1
56,3
05,0
00
1206
3 18
00
HO
US
ING
BO
ND
S
562
,477
,506
5
01,9
25,2
35
7,7
74,7
43
5,2
22,4
39
12,
997,
182
1206
6 20
66
DE
CD
- H
OU
SIN
G T
RU
ST
FUN
D
110
,000
,000
4
0,00
0,00
0
20,
000,
000
-
2
0,00
0,00
0 13
007
3080
E
LIM
INAT
ION
OF
WAT
ER
PO
LLU
TIO
N
398
,000
,000
3
97,9
65,8
61
-
-
- 13
009
3089
S
CH
OO
L C
ON
STR
UC
TIO
N
1,8
10,8
39,5
00
1,8
10,8
39,5
00
33,
578,
903
1
8,47
9,95
1
52,
058,
854
1301
0 30
90
MA
GN
ET
SC
HO
OLS
6
,002
,530
,770
5
,985
,029
,694
4
,297
,005
,000
-
4
,297
,005
,000
13
015
3783
A
GR
ICU
LTU
RA
L LA
ND
PR
ES
ER
VATI
ON
1
20,2
50,0
00
114
,498
,716
3
1,00
0,00
0
-
31,
000,
000
1301
9 37
95
GR
AN
TS F
OR
UR
BA
N A
CTI
ON
1
,172
,487
,544
1
,041
,148
,354
2
78,1
01,8
52
-
278
,101
,852
13
048
3048
C
SU
S 2
020
FUN
D IN
FRA
STR
UC
TUR
E P
RO
GR
AM
1
90,0
00,0
00
92,
280,
000
3
7,66
0,00
0
-
37,
660,
000
1700
1 30
01
GE
NE
RA
L S
TATE
PU
RP
OS
ES
3
02,5
34,3
89
290
,134
,149
1
02,2
83,8
89
-
102
,283
,889
17
011
3011
G
EN
ER
AL
STA
TE P
UR
PO
SE
S
585
,577
,595
4
93,5
45,4
94
269
,554
,662
-
2
69,5
54,6
62
1702
1 30
21
GE
NE
RA
L S
TATE
PU
RP
OS
ES
4
49,9
60,4
90
439
,134
,446
3
42,3
52,5
38
-
342
,352
,538
17
041
3041
G
EN
ER
AL
STA
TE P
UR
PO
SE
S
255
,236
,871
1
90,8
97,9
76
182
,500
,878
-
1
82,5
00,8
78
1705
1
G
EN
ER
AL
STA
TE P
UR
PO
SE
S
202
,822
,361
1
72,5
00,0
00
162
,507
,350
-
1
62,5
07,3
50
1706
1
G
EN
ER
AL
STA
TE P
UR
PO
SE
S
177
,381
,115
1
18,0
80,2
91
112
,080
,291
-
1
12,0
80,2
91
1707
1
G
EN
ER
AL
STA
TE P
UR
PO
SE
S
424
,020
,739
1
72,2
58,7
77
168
,511
,427
-
1
68,5
11,4
27
1708
1
G
EN
ER
AL
STA
TE P
UR
PO
SE
S
244
,530
,361
5
5,00
0,00
0
55,
000,
000
-
5
5,00
0,00
0 17
091
GE
NE
RA
L S
TATE
PU
RP
OS
ES
1
1,60
0,00
0
11,
600,
000
1
1,60
0,00
0
-
11,
600,
000
1710
1
G
EN
ER
AL
STA
TE P
UR
PO
SE
S
25,
066,
316
-
-
-
-
1783
1
C
AP
ITA
L IM
PR
OV
EM
EN
TS
88,
295,
310
8
6,80
2,04
1
-
-
- 17
851
CA
PIT
AL
IMP
RO
VE
ME
NTS
1
16,6
86,6
68
113
,336
,252
-
-
-
1786
1 38
61
CA
PIT
AL
IMP
RO
VE
ME
NTS
1
19,8
59,9
26
119
,463
,359
8
,664
,114
-
8
,664
,114
17
871
3871
C
AP
ITA
L IM
PR
OV
EM
EN
TS
521
,848
,335
5
09,8
53,7
06
2,0
74,3
81
-
2,0
74,3
81
1789
1 38
91
GE
NE
RA
L S
TATE
PU
RP
OS
ES
4
16,5
58,0
89
411
,978
,686
1
,405
,000
-
1
,405
,000
17
901
3901
G
EN
ER
AL
STA
TE P
UR
PO
SE
S
533
,894
,091
5
28,2
20,9
42
10,
445,
622
2
7,33
1,61
0
37,
777,
232
1791
1 39
11
GE
NE
RA
L S
TATE
PU
RP
OS
ES
1
48,4
79,8
44
142
,314
,891
7
,429
,580
1
0,58
2,52
1
18,
012,
101
1792
1 39
21
GE
NE
RA
L S
TATE
PU
RP
OS
ES
3
22,1
35,5
63
320
,382
,563
1
7,34
0,00
0
-
17,
340,
000
1793
1 39
31
GE
NE
RA
L S
TATE
PU
RP
OS
ES
6
28,2
54,0
36
615
,735
,971
9
,421
,076
1
5,57
0,68
0
24,
991,
756
1795
1 39
51
GS
P/U
CO
NN
BA
BB
IDG
E L
IBR
AR
Y &
PLA
ZA D
EC
K
207
,907
,527
2
05,9
50,0
03
11,
442,
805
-
1
1,44
2,80
5 17
961
3961
G
EN
ER
AL
STA
TE P
UR
PO
SE
S
265
,384
,447
2
59,0
71,8
13
54,
726,
981
-
5
4,72
6,98
1

OFFICE OF THE STATE TREASURER, DENISE L. NAPPIER O-9
DEB
T M
AN
AG
EMEN
T D
IVIS
ION
CO
RE
Lega
cy
Ince
ptio
n to
Dat
e Pr
inci
pal
Inte
rest
O
utst
andi
ng In
cl.
Fund
Fu
nd
A
mou
nt
Am
ount
O
utst
andi
ng
Acc
rete
d Th
roug
h A
ccre
ted
Inte
rest
No.
N
o.
Nam
e A
utho
rized
Is
sued
Ju
ne 3
0, 2
010
Fisc
al Y
ear 2
010(2
) Ju
ne 3
0, 2
010
SCH
EDU
LE O
F A
UTH
OR
IZED
AN
D IS
SUED
DEB
T O
UTS
TAN
DIN
G (1
) (C
ontin
ued)
JUN
E 30
, 201
0
1797
1 39
71
GE
NE
RA
L S
TATE
PU
RP
OS
ES
1
95,2
85,5
81
188
,557
,040
6
,287
,947
-
6
,287
,947
17
981
3981
G
EN
ER
AL
STA
TE P
UR
PO
SE
S
208
,069
,445
2
06,8
44,6
56
106
,400
,693
-
1
06,4
00,6
93
1799
1 39
91
GE
NE
RA
L S
TATE
PU
RP
OS
ES
3
05,4
71,3
79
251
,123
,848
3
9,08
1,31
4
-
39,
081,
314
2100
4 60
24
CO
NN
EC
TIC
UT
INN
OVA
TIO
NS
, IN
C.
114
,800
,500
1
14,3
00,3
19
10,
000
-
1
0,00
0 21
014
6864
C
LEA
N W
ATE
R F
UN
D
954
,036
,534
7
10,2
53,8
84
233
,656
,118
-
2
33,6
56,1
18
2101
6 68
66
CLE
AN
WAT
ER
FU
ND
-LO
NG
ISLA
ND
SO
UN
D
71,
993,
466
6
4,10
2,78
2
13,
600,
000
-
1
3,60
0,00
0 35
013
7202
IN
DU
STR
IAL
BU
ILD
ING
MO
RTG
AG
E IN
S F
D
26,
000,
000
5
,550
,000
-
-
-
59
99
G.O
. BO
ND
AN
TIC
IPAT
ION
NO
TES
(3)
-
353
,085
,000
3
53,0
85,0
00
3
53,0
85,0
00
99
86
G.O
. RE
FUN
DIN
G B
ON
DS
OC
TOB
ER
199
3 (4
) -
2
59,1
25,0
00
22,
440,
000
-
2
2,44
0,00
0
9989
G
.O. R
EFU
ND
ING
BO
ND
S M
AR
CH
199
3 B
(4)
-
157
,745
,000
1
0,28
5,00
0
-
10,
285,
000
99
72
MID
DLE
TOW
N C
OU
RT
HO
US
E 1
998
RE
FUN
DIN
G (4
) (5)
-
34,
375,
000
1
1,27
5,00
0
-
11,
275,
000
99
70
G.O
. RE
FUN
DIN
G B
ON
DS
200
1 S
ER
IES
C (4
) -
5
04,5
75,0
00
312
,655
,000
-
3
12,6
55,0
00
99
66
G.O
. RE
FUN
DIN
G B
ON
DS
200
1 S
ER
IES
E A
ND
F (4
) -
4
32,8
35,0
00
194
,840
,000
-
1
94,8
40,0
00
99
65
G.O
. RE
FUN
DIN
G B
ON
DS
200
2 S
ER
IES
C (4
) -
1
55,5
00,0
00
34,
470,
000
-
3
4,47
0,00
0
9964
G
.O. R
EFU
ND
ING
BO
ND
S 2
002
SE
RIE
S E
(4)
-
256
,375
,000
2
12,3
50,0
00
-
212
,350
,000
9960
G
.O. R
EFU
ND
ING
BO
ND
S 2
003
SE
RIE
S D
(4)
-
215
,580
,000
3
2,42
5,00
0
-
32,
425,
000
99
59
G.O
. RE
FUN
DIN
G B
ON
DS
200
3 S
ER
IES
G (4
) -
1
65,9
95,0
00
21,
370,
000
-
2
1,37
0,00
0
9956
G
.O. R
EFU
ND
ING
BO
ND
S 2
004
SE
RIE
S B
(4)
-
1,0
30,3
75,0
00
944
,765
,000
-
9
44,7
65,0
00
99
52
G.O
. RE
FUN
DIN
G B
ON
DS
200
5 S
ER
IES
B (4
) -
3
35,5
50,0
00
331
,480
,000
-
3
31,4
80,0
00
99
51
G.O
. RE
FUN
DIN
G B
ON
DS
200
6 S
ER
IES
E (4
) -
3
08,4
00,0
00
307
,005
,000
-
3
07,0
05,0
00
99
50
G.O
. RE
FUN
DIN
G B
ON
DS
200
7 S
ER
IES
B (4
) -
1
73,3
00,0
00
173
,030
,000
-
1
73,0
30,0
00
99
49
G.O
. RE
FUN
DIN
G B
ON
DS
200
7 S
ER
IES
E (4
) -
1
81,0
85,0
00
148
,000
,000
-
1
48,0
00,0
00
99
48
G.O
. TA
XA
BLE
RE
FUN
DIN
G B
ON
DS
200
8 S
ER
IES
C (4
) -
5
0,00
0,00
0
25,
000,
000
-
2
5,00
0,00
0
9945
G
.O. R
EFU
ND
ING
BO
ND
S 2
009
SE
RIE
S C
(4)
-
74,
215,
000
4
4,29
5,00
0
-
44,
295,
000
99
43
G.O
. RE
FUN
DIN
G B
ON
DS
201
0 S
ER
IES
C (4
) -
2
58,2
35,0
00
258
,235
,000
-
2
58,2
35,0
00
SUB
TOTA
L
$23,
453,
365,
724
$
25,7
43,1
58,3
34
$10
,740
,248
,817
$
122,
731,
690
$
10,8
62,9
80,5
07
B
ON
D T
YPE:
GEN
ERA
L O
BLI
GAT
ION
TEA
CH
ERS’
RET
IREM
ENT
FUN
D B
ON
DS
(6)
3100
6 31
06
TEA
CH
ER
’S R
ETI
RE
ME
NT
FUN
D
TA
XA
BLE
G.O
. BO
ND
S 2
008
$
2,27
6,57
8,27
1
$2,
276,
578,
271
$
2,27
6,57
8,27
1
$24
,944
,047
$
2,30
1,52
2,31
8 SU
BTO
TAL
$
2,27
6,57
8,27
1
$2,
276,
578,
271
$
2,27
6,57
8,27
1
$24
,944
,047
$
2,30
1,52
2,31
8
BO
ND
TYP
E: E
CO
NO
MIC
REC
OVE
RY N
OTE
S
20
30
EC
ON
OM
IC R
EC
OV
ER
Y N
OTE
S
$
2,25
7,52
3,50
4
$2,
198,
440,
000
$
915,
795,
000
$
-
$
915,
795,
000
SUB
TOTA
L
$2,
257,
523,
504
$
2,19
8,44
0,00
0
$91
5,79
5,00
0
$
-
$91
5,79
5,00
0
BO
ND
TYP
E: G
ENER
AL
OB
LIG
ATIO
N -
REV
ENU
E SU
PPO
RTE
D
12
029
1302
C
ON
N S
TUD
EN
T LO
AN
FO
UN
DAT
ION
$
5
,000
,000
$
-
$
- $
-
$
-

O-10 FISCAL YEAR 2010 ANNUAL REPORT
DEB
T M
AN
AG
EMEN
T D
IVIS
ION
CO
RE
Lega
cy
Ince
ptio
n to
Dat
e Pr
inci
pal
Inte
rest
O
utst
andi
ng In
cl.
Fund
Fu
nd
A
mou
nt
Am
ount
O
utst
andi
ng
Acc
rete
d Th
roug
h A
ccre
ted
Inte
rest
No.
N
o.
Nam
e A
utho
rized
Is
sued
Ju
ne 3
0, 2
010
Fisc
al Y
ear 2
010(2
) Ju
ne 3
0, 2
010
SCH
EDU
LE O
F A
UTH
OR
IZED
AN
D IS
SUED
DEB
T O
UTS
TAN
DIN
G (1
) (C
ontin
ued)
JUN
E 30
, 201
0
1304
2 38
76
UN
IV.&
STA
TE U
NIV
ER
SIT
Y FA
CIL
ITIE
S
1
04,3
63,2
66
104
,192
,153
1
,060
,000
-
1
,060
,000
SU
BTO
TAL
$
109,
363,
266
$
104,
192,
153
$
1,06
0,00
0
$
-
$1,
060,
000
B
ON
D T
YPE:
SPE
CIA
L TA
X O
BLI
GAT
ION
1303
3 38
42
INFR
AS
TRU
CTU
RE
IMP
RO
VE
ME
NT
$9,
618,
852,
104
$
6,69
6,65
0,75
2
$2,
013,
595,
000
$
-
$2,
013,
595,
000
1400
5 99
75
STO
199
8 S
ER
IES
A R
EFU
ND
ING
BO
ND
S(4
) -
1
97,5
00,0
00
137
,035
,000
-
1
37,0
35,0
00
1400
5 99
67
STO
200
1 S
ER
IES
B R
EFU
ND
ING
BO
ND
S(4
) -
5
33,3
35,0
00
217
,600
,000
-
2
17,6
00,0
00
1400
5 99
61
STO
200
3 S
ER
IES
A R
EFU
ND
ING
BO
ND
S(4
) -
3
38,6
10,0
00
12,
900,
000
-
1
2,90
0,00
0 14
005
9953
S
TO 2
004
SE
RIE
S B
RE
FUN
DIN
G B
ON
DS
(4)
-
89,
725,
000
8
9,46
0,00
0
-
89,
460,
000
1400
5 99
47
STO
200
8 S
ER
IES
1 R
EFU
ND
ING
BO
ND
S(4
) -
9
7,69
0,00
0
97,
690,
000
-
9
7,69
0,00
0 14
005
9946
S
TO 2
009
SE
RIE
S 1
RE
FUN
DIN
G B
ON
DS
(4)
-
415
,035
,000
4
12,4
30,0
00
-
412
,430
,000
14
005
9944
S
TO 2
009
SE
RIE
S C
RE
FUN
DIN
G B
ON
DS
(4)
-
49,
775,
000
4
9,77
5,00
0
-
49,
775,
000
SUB
TOTA
L
$9,
618,
852,
104
$
8,41
8,32
0,75
2
$3,
030,
485,
000
$
-
$3,
030,
485,
000
B
ON
D T
YPE:
BR
AD
LEY
INTE
RN
ATIO
NA
L A
IRPO
RT
21
012
6310
B
RA
DLE
Y R
EV
EN
UE
BO
ND
S
$19
4,00
0,00
0
$19
4,00
0,00
0
$16
6,28
0,00
0
$
- $
166,
280,
000
99
54
BR
AD
LEY
AIR
PO
RT
GE
N. R
EV
RE
FUN
DIN
G B
ON
DS
(4)
-
30,
640,
000
5
,475
,000
-
5
,475
,000
9969
B
RA
DLE
Y A
IRP
OR
T R
EV
EN
UE
RE
FUN
DIN
G 2
001B
(4)
-
19,
180,
000
1
7,03
0,00
0
-
17,
030,
000
SUB
TOTA
L
$19
4,00
0,00
0
$24
3,82
0,00
0
$18
8,78
5,00
0
$
-
$
188,
785,
000
B
ON
D T
YPE:
CLE
AN
WAT
ER F
UN
D
21
015
6865
C
LEA
N W
ATE
R F
UN
D -
FED
. AC
CT.
$
1,74
5,73
1,37
5
$1,
349,
430,
253
$
553,
085,
000
$
-
$55
3,08
5,00
0 21
018
6868
D
WF
FED
ER
AL
RE
VO
LVIN
G
87,
668,
625
5
9,28
9,74
7
26,
145,
000
-
2
6,14
5,00
0
9983
C
LEA
N W
ATE
R R
EFU
ND
ING
(4)
-
476
,070
,000
2
42,7
20,0
00
-
242
,720
,000
SU
BTO
TAL
$
1,83
3,40
0,00
0
$1,
884,
790,
000
$
821,
950,
000
$
-
$82
1,95
0,00
0
BO
ND
TYP
E: U
CO
NN
200
0 (7
)
1304
5 39
52
UC
ON
N 2
000
$1,
419,
062,
147
$
1,41
9,06
2,14
7
$54
3,97
2,44
1
$2,
251,
527
$
546,
223,
968
99
58
UC
ON
N 2
000
RE
FUN
DIN
G B
ON
DS
(4)
-
360
,095
,000
3
33,5
20,0
00
-
333
,520
,000
SU
BTO
TAL
$
1,41
9,06
2,14
7
$1,
779,
157,
147
$
877,
492,
441
$
2,25
1,52
7
$87
9,74
3,96
8
BO
ND
TYP
E: C
DA
INC
REM
ENT
FIN
AN
CIN
G (8
)
88
004
8004
C
AB
ELA
’S IN
C. -
TA
X IN
CR
EM
EN
TAL
FIN
AN
CIN
G
$9,
950,
000
$
9,82
5,00
0
$8,
150,
000
$
-
$8,
150,
000
8810
0 81
00
CD
A - T
AX
INC
RE
ME
NTA
L FI
NA
NC
ING
3
,470
,000
-
-
-
-
99
55
CD
A R
EFU
ND
ING
BO
ND
S S
ER
IES
A, B
AN
D C
(4)
-
22,
435,
000
1
9,40
0,00
0
-
19,
400,
000
SUB
TOTA
L
$13
,420
,000
$
32,2
60,0
00
$27
,550
,000
$
-
$27
,550
,000

OFFICE OF THE STATE TREASURER, DENISE L. NAPPIER O-11
DEB
T M
AN
AG
EMEN
T D
IVIS
ION
CO
RE
Lega
cy
Ince
ptio
n to
Dat
e Pr
inci
pal
Inte
rest
O
utst
andi
ng In
cl.
Fund
Fu
nd
A
mou
nt
Am
ount
O
utst
andi
ng
Acc
rete
d Th
roug
h A
ccre
ted
Inte
rest
No.
N
o.
Nam
e A
utho
rized
Is
sued
Ju
ne 3
0, 2
010
Fisc
al Y
ear 2
010(2
) Ju
ne 3
0, 2
010
SCH
EDU
LE O
F A
UTH
OR
IZED
AN
D IS
SUED
DEB
T O
UTS
TAN
DIN
G (1
) (C
ontin
ued)
JUN
E 30
, 201
0
B
ON
D T
YPE:
CD
A G
OVE
RN
MEN
TAL
LEA
SE R
EVEN
UE
(9)
88
500
8500
N
EW
BR
ITA
IN G
OV
ER
NM
EN
T C
EN
TER
$
9,27
5,00
0
$9,
275,
000
$
2,91
5,00
0
$
-
$
2,91
5,00
0 SU
BTO
TAL
$
9,27
5,00
0
$9,
275,
000
$
2,91
5,00
0
$
-
$
2,91
5,00
0
BO
ND
TYP
E: C
HEF
A C
HIL
DC
AR
E FA
CIL
ITIE
S PR
OG
RA
M (1
0)
77
800
7800
C
HE
FA C
HIL
DC
AR
E-N
OW
$
-
$5,
375,
000
$
4,75
0,00
0
$
-
$
4,75
0,00
0 77
802
7802
C
HIL
DC
AR
E P
OO
L 1
SE
RIE
S A
-
1
0,17
5,00
0
6,6
90,0
00
-
6,6
90,0
00
7780
4 78
04
CH
EFA
CH
ILD
CA
RE
-SE
RIE
S C
-
1
8,69
0,00
0
14,
440,
000
-
1
4,44
0,00
0 77
805
7805
C
HE
FA C
HIL
DC
AR
E S
ER
IES
D
-
3,9
40,0
00
3,3
40,0
00
-
3,3
40,0
00
7780
6 78
06
CH
EFA
CH
ILD
CA
RE
SE
RIE
S E
-
3
,865
,000
3
,330
,000
-
3
,330
,000
77
807
7807
C
HE
FA C
HIL
DC
AR
E S
ER
IES
F
-
19,
165,
000
1
8,81
5,00
0
-
18,
815,
000
7780
8 78
08
CH
EFA
CH
ILD
CA
RE
FA
CIL
ITIE
S P
RO
GR
AM
SE
RIE
S G
-
1
6,87
5,00
0
16,
875,
000
-
1
6,87
5,00
0 SU
BTO
TAL
$
-
$78
,085
,000
$
68,2
40,0
00
$
-
$
68,2
40,0
00
B
ON
D T
YPE:
JU
VEN
ILE
TRA
ININ
G S
CH
OO
L (1
1)
88
800
8800
C
T JU
VE
NIL
E T
RA
ININ
G S
CH
OO
L E
NE
RG
Y C
EN
TER
$
- $
19,1
65,0
00
$16
,080
,000
$
-
$16
,080
,000
SU
BTO
TAL
$
-
$19
,165
,000
$
16,0
80,0
00
$
-
$
16,0
80,0
00
B
ON
D T
YPE:
BR
AD
LEY
INTE
RN
ATIO
NA
L PA
RK
ING
OPE
RAT
ION
S (1
2)
21
008
6299
B
RA
DLE
Y IN
TER
NAT
ION
AL
PAR
KIN
G O
PE
RAT
ION
S
$55
,000
,000
$
53,8
00,0
00
$43
,005
,000
$
-
$43
,005
,000
SU
BTO
TAL
$
55,0
00,0
00
$53
,800
,000
$
43,0
05,0
00
$
-
$
43,0
05,0
00
B
ON
D T
YPE:
CH
FA S
PEC
IAL
NEE
DS
HO
USI
NG
BO
ND
S (1
3)
12
060
7500
C
HFA
SU
PP
OR
TIV
E H
OU
SIN
G B
ON
DS
$
70,0
00,0
00
$65
,755
,000
$
61,7
75,0
00
$
-
$
61,7
75,0
00
SUB
TOTA
L
$70
,000
,000
$
65,7
55,0
00
$61
,775
,000
$
-
$61
,775
,000
BO
ND
TYP
E: C
CED
A B
ON
DS
(14)
12
060
7300
C
APIT
AL C
ITY
ECO
NO
MIC
DEV
ELO
PMEN
T AU
THO
RIT
Y $
-
$
110,
000,
000
$
102,
680,
000
$
-
$10
2,68
0,00
0 SU
BTO
TAL
$
-
$
110,
000,
000
$
102,
680,
000
$
-
$10
2,68
0,00
0
GR
AN
D T
OTA
L
$41
,309
,840
,016
$
43,0
16,7
96,6
57
$19
,174
,639
,529
$
149,
927,
264
$
19,3
24,5
66,7
93

O-12 FISCAL YEAR 2010 ANNUAL REPORT
DEB
T M
AN
AG
EMEN
T D
IVIS
ION
SCH
EDU
LE O
F A
UTH
OR
IZED
AN
D IS
SUED
DEB
T O
UTS
TAN
DIN
G (1
) (C
ontin
ued)
JUN
E 30
, 201
0
(1)
Incl
udes
all
outs
tand
ing
debt
issu
ed b
y th
e S
tate
of C
onne
ctic
ut a
s of
Jun
e 30
, 201
0. A
ll de
bt e
xcep
t ref
undi
ng is
sues
is a
utho
rized
by
the
Gen
eral
Ass
embl
y an
d th
e S
tate
Bon
d C
omm
issi
on p
rior t
o is
suan
ce.
(2)
Incl
udes
inte
rest
acc
rete
d on
Cap
ital A
ppre
ciat
ion
Bon
ds (C
AB
s) o
nly.
Int
eres
t on
CA
Bs
accr
etes
ove
r the
life
of t
he b
ond
and
is p
aid
at m
atur
ity. T
his
amou
nt is
not
incl
uded
in th
e co
lum
n sh
own
as o
utst
andi
ng J
une
30, 2
010.
(3)
On
Apr
il 28
, 200
9 th
e S
tate
issu
ed $
581,
245,
000
Bon
d A
ntic
ipat
ion
Not
es (B
AN
s) S
erie
s A
and
Ser
ies
B.
On
Apr
il 28
, 201
0 $
353,
085,
000
Bon
d A
ntic
ipat
ion
Not
es (B
AN
s) w
ere
issu
ed to
pay
dow
n th
e 20
09 S
erie
s A
BA
Ns
mat
urin
g on
Apr
il 28
, 201
0. N
o ne
w a
utho
rizat
ion
was
requ
ired.
(4)
Ref
undi
ng is
sues
. Pro
ceed
s us
ed to
refu
nd o
ther
bon
ds re
duci
ng o
vera
ll de
bt s
ervi
ce e
xpen
se.
(5)
Deb
t out
stan
ding
at J
une
30, 2
010
incl
udes
$11
,275
,000
in C
ertifi
cat
es o
f Par
ticip
atio
n fo
r the
Mid
dlet
own
Cou
rthou
se w
hich
is n
ot d
ebt o
f the
Sta
te.
How
ever
, the
Sta
te is
obl
igat
ed
to p
ay a
bas
e re
nt u
nder
a le
ase
for t
he C
ourth
ouse
, sub
ject
to th
e an
nual
app
ropr
iatio
n of
fund
s or
the
avai
labi
lity
of o
ther
fund
s; th
eref
ore,
the
base
rent
is a
ppro
pria
ted
as d
ebt
serv
ice.
Th
e C
ertifi
cat
es o
f Par
ticip
atio
n ar
e in
clud
ed in
the
Trea
sure
r’s D
ebt M
anag
emen
t Sys
tem
for c
ontro
l pur
pose
s.
(6)
The
Gen
eral
Obl
igat
ion
Teac
hers
’ Ret
irem
ent F
und
Bon
ds w
ere
issu
ed a
s ta
xabl
e bo
nds
purs
uant
to P
ublic
Act
07-
186
to fu
nd $
2 bi
llion
of t
he u
nfun
ded
liabi
lity
of th
e C
onne
ctic
ut
Teac
hers
’ Ret
irem
ent F
und,
cap
italiz
ed in
tere
st a
nd c
ost o
f iss
uanc
e.
(7)
UC
onn
2000
Bon
ds w
ere
auth
oriz
ed in
two
stag
es in
a to
tal a
mou
nt o
f $2.
3 bi
llion
ove
r a 2
0 ye
ar p
erio
d to
be
paid
by
the
Uni
vers
ity o
f Con
nect
icut
from
a S
tate
Deb
t Ser
vice
co
mm
itmen
t. A
s ea
ch s
erie
s is
issu
ed, t
he d
ebt s
ervi
ce is
val
idly
app
ropr
iate
d fro
m th
e S
tate
Gen
eral
Fun
d.
(8)
The
Con
nect
icut
Dev
elop
men
t Aut
horit
y ha
s is
sued
tax
incr
emen
t bon
ds fo
r cer
tain
eco
nom
ic d
evel
opm
ent p
roje
cts.
The
deb
t ser
vice
on
the
bond
s is
dee
med
app
ropr
iate
d fro
m th
e S
tate
’s G
ener
al F
und.
(9)
The
Con
nect
icut
Dev
elop
men
t Aut
horit
y ha
s is
sued
its
leas
e re
venu
e bo
nds
for t
he N
ew B
ritai
n G
over
nmen
t Cen
ter.
The
Sta
te is
obl
igat
ed to
pay
bas
e re
nt s
ubje
ct to
the
annu
al
appr
opria
tion
of fu
nds.
The
se p
aym
ents
are
bud
gete
d in
the
Trea
sure
r’s d
ebt s
ervi
ce b
udge
t as
leas
e pa
ymen
ts.
(10)
O
n Ju
ly 1
, 199
9, th
e Tr
easu
rer’s
Offi
ce a
ssum
ed th
e re
spon
sibi
lity
for t
he C
HE
FA C
HIL
DC
AR
E d
ebt s
ervi
ce a
ppro
pria
tion
per P
ublic
Act
97-
259.
(11)
A
leas
e-pu
rcha
se fi
nanc
ing
of th
e he
atin
g an
d co
olin
g pl
ant a
t the
Juv
enile
Tra
inin
g S
choo
l in
Mid
dlet
own.
(12)
In
clud
es B
radl
ey In
tern
atio
nal A
irpor
t Spe
cial
Obl
igat
ion
Par
king
Rev
enue
Bon
ds, 2
000
Ser
ies
A $4
3,00
5,00
0.
(13)
Th
e C
onne
ctic
ut H
ousi
ng F
inan
ce A
utho
rity
(CH
FA) S
peci
al N
eeds
Hou
sing
bon
ds w
ere
issu
ed p
ursu
ant t
o P
ublic
Act
05-
280
and
Pub
lic A
ct 0
5-3
for t
he p
urpo
se o
f fi n
anci
ng c
osts
of
the
Nex
t Ste
p In
itiat
ive.
The
Sta
te is
requ
ired
to m
ake
debt
ser
vice
pay
men
ts o
n th
e bo
nds
unde
r a c
ontra
ct a
ssis
tanc
e ag
reem
ent b
etw
een
CH
FA, t
he T
reas
urer
and
OP
M.
(14)
Th
e C
apita
l City
Eco
nom
ic D
evel
opm
ent A
utho
rity
(CC
ED
A) B
onds
wer
e is
sued
to p
rovi
de fu
ndin
g fo
r the
Adr
iaen
’s L
andi
ng d
evel
opm
ent p
roje
ct in
Har
tford
. Th
e bo
nds,
issu
ed in
a
com
bina
tion
of fi
xed
and
varia
ble
rate
sec
uriti
es, h
ave
a fi n
al m
atur
ity o
f 203
4. T
he S
tate
is re
quire
d to
mak
e al
l deb
t ser
vice
pay
men
ts o
n th
e bo
nds
up to
a m
axim
um a
nnua
l am
ount
of $
9 m
illio
n pu
rsua
nt to
a c
ontra
ct a
ssis
tanc
e ag
reem
ent b
etw
een
CC
ED
A, t
he T
reas
urer
, and
OP
M.
CC
ED
A is
requ
ired
to re
imbu
rse
the
Sta
te fo
r the
deb
t ser
vice
pa
ymen
ts fr
om n
et p
arki
ng a
nd c
entra
l util
ity p
lant
reve
nues
.

OFFICE OF THE STATE TREASURER, DENISE L. NAPPIER O-13
Tax
Exem
pt
Inve
stm
ents
with
Inve
stm
ents
with
ST
IF
Proc
eeds
Fun
d Tr
easu
rer a
s Tr
uste
e
Oth
ers
as T
rust
ee
Lega
l G
AA
P In
vest
men
ts
Inve
stm
ents
Sh
ort-T
erm
Lo
ng-T
erm
Sh
ort-T
erm
Lo
ng-T
erm
N
o.
Type
N
o.
Type
Fu
nd N
ame
6/30
/10
6/30
/10
6/30
/10
6/30
/10
6/30
/10
6/30
/10
Tota
l
GEN
ERA
L FU
ND
(3)
1100
0 G
en. F
und
1100
Gen
.Fun
d G
ener
al F
und
$35
3,83
6,68
4.85
$689
,020
,162
.45
(16)
$
1,04
2,85
6,84
7.30
SU
BTO
TAL
GEN
ERA
L FU
ND
$35
3,83
6,68
4.85
$
-
$68
9,02
0,16
2.45
$
-
$-
$
-
$1,
042,
856,
847.
30
SPEC
IAL
REV
ENU
E FU
ND
S12
001
Spe
c.R
ev.
1201
Spe
c.R
ev.
Tran
spor
tatio
n $
53,4
45,6
93.4
5
$
53,4
45,6
93.4
5 12
005
Spe
c.R
ev.
1215
Spe
c.R
ev.
Pro
bate
Cou
rt A
dmin
istra
tion
4,49
2,18
7.41
4,4
92,1
87.4
1 12
010
Spe
c.R
ev.
1209
Spe
c.R
ev.
Sol
dier
s, S
ailo
rs a
nd M
arin
es
595
.23
595
.23
1201
2 S
pec.
Rev
. 12
15 S
pec.
Rev
. M
unic
ipal
Em
p. R
etire
men
t Adm
inis
tratio
n 9
52,9
35.0
5
9
52,9
35.0
5 12
013
Spe
c.R
ev.
1208
Spe
c.R
ev.
Reg
iona
l Mar
ket O
pera
tion
965
,606
.12
965
,606
.12
1201
6 S
pec.
Rev
. 12
13 S
pec.
Rev
. R
ecre
atio
n an
d N
atur
al H
erita
ge T
rust
Fun
d -
$
1,87
3,17
2.09
1
,873
,172
.09
1201
8 S
pec.
Rev
. 21
07 E
nter
pris
e U
nive
rsity
Hea
lth C
ente
r Ope
ratin
g Fu
nd
90,
626.
96
9
0,62
6.96
12
021
Spe
c.R
ev.
1215
Spe
c.R
ev.
Gra
nts
- Tax
Exe
mpt
Pro
ceed
s -
4,60
9,35
9.07
4
,609
,359
.07
1202
3 S
pec.
Rev
. 21
07 E
nter
pris
e U
niv
Hea
lth C
ente
r Res
earc
h Fo
unda
tion
37,
627,
555.
50
3
7,62
7,55
5.50
12
032
Spe
c.R
ev.
1210
Spe
c.R
ev.
Em
ploy
men
t Sec
urity
- S
peci
al A
dmin
5
2,65
8.18
52,
658.
18
1203
4 S
pec.
Rev
. 12
12 S
pec.
Rev
. E
cono
mic
Ass
ista
nce
Bon
d Fu
nd
2,5
37,3
90.3
1
2
,537
,390
.31
1203
5 S
pec.
Rev
. 12
12 S
pec.
Rev
. E
cono
mic
Ass
ista
nce
Rev
olvi
ng F
und
4
,445
,966
.11
4
,445
,966
.11
1203
8 S
pec.
Rev
. 12
12 S
pec.
Rev
. In
divi
dual
Dev
elop
men
t Acc
t Res
erve
Fun
d
$43
7,22
1.69
4
37,2
21.6
9 12
047
Spe
c.R
ev.
1212
Spe
c.R
ev.
Chi
ld C
are
Faci
litie
s 2
24,1
32.1
8
2
24,1
32.1
8 12
051
Spe
c.R
ev.
1215
Spe
c.R
ev.
Cap
ital E
quip
men
t Pur
chas
e Fu
nd
11,
553,
453.
74
1
1,55
3,45
3.74
12
052
Spe
c.R
ev.
1212
Spe
c.R
ev.
Gra
nts
to L
ocal
Gov
ernm
ents
and
Oth
ers
127
,051
,592
.86
127
,051
,592
.86
1205
3 S
pec.
Rev
. 12
13 S
pec.
Rev
. E
cono
mic
Dev
elop
men
t and
Oth
er G
rant
s 7
59,8
24.6
1
7
59,8
24.6
1 12
059
Spe
c.R
ev.
1212
Spe
c.R
ev.
Har
tford
Dow
ntow
n R
edev
elop
men
t 1
,519
,444
.78
1,5
19,4
44.7
8 12
060
Spe
c R
ev.
1211
Spe
c.R
ev.
Fede
ral A
nd O
ther
Res
trict
ed A
ccou
nts
441
,738
.96
2
91,3
78.2
1
733
,117
.17
1206
2 S
pec
Rev
. 12
11 S
pec.
Rev
. Tr
ansp
orta
tion
Gra
nts
& R
estri
cted
Acc
ts
117
,168
.07
117
,168
.07
1206
5 S
pec.
Rev
. 12
14 S
pec.
Rev
. H
ousi
ng A
ssis
t. B
ond
Fund
- Ta
x E
xem
pt
5,5
60,9
35.4
7
5
,560
,935
.47
1206
6 S
pec.
Rev
. 12
14 S
pec.
Rev
. H
ousi
ng T
rust
Fun
d 5
,504
,879
.85
5,5
04,8
79.8
5 SU
BTO
TAL
SPEC
IAL
REV
ENU
E FU
ND
S $
252,
898,
418.
73
$11
,219
,875
.48
$
-
$43
7,22
1.69
$
-
$-
$
264,
555,
515.
90
CA
PITA
L PR
OJE
CTS
FU
ND
S13
009
Cap
. Pro
j. 12
12 S
pec.
Rev
. S
choo
l Con
stru
ctio
n $3
,962
,237
.74
$3,9
62,2
37.7
4 13
010
Cap
. Pro
j. 12
12 S
pec.
Rev
. S
choo
l Con
stru
ctio
n - M
agne
t Sch
ools
1
98,8
48,9
64.9
7
1
98,8
48,9
64.9
7 13
015
Cap
. Pro
j. 12
12 S
pec.
Rev
. A
gric
ultu
ral L
and
Pre
serv
atio
n 2
3,44
3,83
9.79
23,
443,
839.
79
1301
9 C
ap. P
roj.
1212
Spe
c.R
ev.
Com
mun
ity C
onse
rvat
ion
& D
evel
opm
ent
66,
869,
224.
01
6
6,86
9,22
4.01
13
021
Cap
. Pro
j. 13
01 C
ap.P
roj.
Sta
te U
nive
rsity
Fac
ilitie
s 1
3,49
8.82
13,
498.
82
1302
2 C
ap. P
roj.
1303
Cap
.Pro
j. R
amp
Con
stru
ctio
n -
$
11,6
12.0
1
11,
612.
01
1303
3 C
ap. P
roj.
1302
Cap
.Pro
j. In
frast
ruct
ure
Impr
ovem
ent F
und
186
,800
,409
.00
186
,800
,409
.00
1303
6 C
ap. P
roj.
1301
Cap
.Pro
j. U
nive
rsity
and
Sta
te U
nive
rsity
Fac
ilitie
s -
468
.00
4
68.0
0 13
037
Cap
. Pro
j. 13
01 C
ap.P
roj.
Uni
vers
ity a
nd S
tate
Uni
vers
ity F
acili
ties
139
,913
.90
139
,913
.90
1304
2 C
ap. P
roj.
1301
Cap
.Pro
j. U
nive
rsity
and
Sta
te U
nive
rsity
Fac
ilitie
s 1
,487
,414
.67
1,4
87,4
14.6
7 13
048
Cap
. Pro
j. 13
01 C
ap.P
roj.
CS
US
202
0 7
9,53
8,25
8.41
79,
538,
258.
41
1700
1 C
ap. P
roj.
1301
Cap
.Pro
j. C
apita
l Im
prov
emen
ts &
Oth
er P
urpo
ses
6,4
86,6
31.5
7
6
,486
,631
.57
1702
1 C
ap. P
roj.
1301
Cap
.Pro
j. C
apita
l Im
prov
emen
ts &
Oth
er P
urpo
ses
33,
997,
110.
71
3
3,99
7,11
0.71
17
041
Cap
. Pro
j. 13
01 C
ap.P
roj.
Cap
ital I
mpr
ovem
ents
& O
ther
Pur
pose
s 2
0,41
0,05
8.85
20,
410,
058.
85
1705
1 C
ap. P
roj.
1301
Cap
.Pro
j. C
apita
l Im
prov
emen
ts &
Oth
er P
urpo
ses
11,
742,
126.
90
1
1,74
2,12
6.90
17
061
Cap
. Pro
j. 13
01 C
ap.P
roj.
Cap
ital I
mpr
ovem
ents
& O
ther
Pur
pose
s 6
7,55
6,26
4.66
67,
556,
264.
66
1707
1 C
ap. P
roj.
1301
Cap
.Pro
j. C
apita
l Im
prov
emen
ts &
Oth
er P
urpo
ses
83,
012,
327.
68
8
3,01
2,32
7.68
17
081
Cap
. Pro
j. 13
01 C
ap.P
roj.
Cap
ital I
mpr
ovem
ents
& O
ther
Pur
pose
s 4
5,16
2,00
9.43
45,
162,
009.
43
1708
6 C
ap. P
roj.
1301
Cap
.Pro
j. C
apita
l Im
prov
emen
ts &
Oth
er P
urpo
ses
46,
393.
41
4
6,39
3.41
17
091
Cap
. Pro
j. 13
01 C
ap.P
roj.
Cap
ital I
mpr
ovem
ents
& O
ther
Pur
pose
s 4
0,32
1.54
40,
321.
54
1777
1 C
ap. P
roj.
1301
Cap
.Pro
j. C
apita
l Im
prov
emen
ts &
Oth
er P
urpo
ses
1,8
96,2
04.9
5
1
,896
,204
.95
1780
1 C
ap. P
roj.
1301
Cap
.Pro
j. C
apita
l Im
prov
emen
ts &
Oth
er P
urpo
ses
2,6
27,8
78.2
9
2
,627
,878
.29
CA
SH M
AN
AG
EMEN
T D
IVIS
ION
CIV
IL L
IST
FUN
DS
SCH
EDU
LE O
F IN
VEST
MEN
TS (1
) (2)
FISC
AL
YEA
R E
ND
ED J
UN
E 30
, 201
0PR
ESEN
TED
UN
DER
BU
DG
ETA
RY B
ASI
S O
F A
CC
OU
NTI
NG
(4) (
5)

O-14 FISCAL YEAR 2010 ANNUAL REPORT
CA
SH M
AN
AG
EMEN
T D
IVIS
ION
CIV
IL L
IST
FUN
DS
SCH
EDU
LE O
F IN
VEST
MEN
TS (1
) (2)
FISC
AL
YEA
R E
ND
ED J
UN
E 30
, 201
0PR
ESEN
TED
UN
DER
BU
DG
ETA
RY B
ASI
S O
F A
CC
OU
NTI
NG
(4) (
5)
Tax
Exem
pt
Inve
stm
ents
with
Inve
stm
ents
with
ST
IF
Proc
eeds
Fun
d Tr
easu
rer a
s Tr
uste
e
Oth
ers
as T
rust
ee
Lega
l G
AA
P In
vest
men
ts
Inve
stm
ents
Sh
ort-T
erm
Lo
ng-T
erm
Sh
ort-T
erm
Lo
ng-T
erm
N
o.
Type
N
o.
Type
Fu
nd N
ame
6/30
/10
6/30
/10
6/30
/10
6/30
/10
6/30
/10
6/30
/10
Tota
l
1783
1 C
ap. P
roj.
1301
Cap
.Pro
j. C
apita
l Im
prov
emen
ts &
Oth
er P
urpo
ses
3,0
38,2
48.8
6
3
,038
,248
.86
1784
1 C
ap. P
roj.
1301
Cap
.Pro
j. C
apita
l Im
prov
emen
ts &
Oth
er P
urpo
ses
2,2
75,6
17.3
3
2
,275
,617
.33
1785
1 C
ap. P
roj.
1301
Cap
.Pro
j. C
apita
l Im
prov
emen
ts &
Oth
er P
urpo
ses
2,6
43,2
66.0
2
2
,643
,266
.02
1786
1 C
ap. P
roj.
1301
Cap
.Pro
j. C
apita
l Im
prov
emen
ts &
Oth
er P
urpo
ses
8,0
95,6
89.4
7
8
,095
,689
.47
1787
1 C
ap. P
roj.
1301
Cap
.Pro
j. C
apita
l Im
prov
emen
ts &
Oth
er P
urpo
ses
127
,897
.37
127
,897
.37
1789
1 C
ap. P
roj.
1301
Cap
.Pro
j. C
apita
l Im
prov
emen
ts &
Oth
er P
urpo
ses
328
,616
.50
328
,616
.50
1790
1 C
ap. P
roj.
1301
Cap
.Pro
j. C
apita
l Im
prov
emen
ts &
Oth
er P
urpo
ses
969
,704
.27
969
,704
.27
1791
1 C
ap. P
roj.
1301
Cap
.Pro
j. C
apita
l Im
prov
emen
ts &
Oth
er P
urpo
ses
111
,625
.67
111
,625
.67
1792
1 C
ap. P
roj.
1301
Cap
.Pro
j. C
apita
l Im
prov
emen
ts &
Oth
er P
urpo
ses
1,6
30,4
38.9
1
1
,630
,438
.91
1795
1 C
ap. P
roj.
1301
Cap
.Pro
j. C
apita
l Im
prov
emen
ts &
Oth
er P
urpo
ses
2,8
29,9
09.8
8
2
,829
,909
.88
1796
1 C
ap. P
roj.
1301
Cap
.Pro
j. C
apita
l Im
prov
emen
ts &
Oth
er P
urpo
ses
2,9
20,1
70.8
1
2
,920
,170
.81
1797
1 C
ap. P
roj.
1301
Cap
.Pro
j. C
apita
l Im
prov
emen
ts &
Oth
er P
urpo
ses
1,2
29,5
23.0
4
1
,229
,523
.04
1799
1 C
ap. P
roj.
1301
Cap
.Pro
j. C
apita
l Im
prov
emen
ts &
Oth
er P
urpo
ses
2,9
20,6
18.0
7
2
,920
,618
.07
SUB
TOTA
L C
API
TAL
PRO
JEC
TS F
UN
DS
$86
3,20
2,41
5.50
$
12,0
80.0
1
$-
$
-
$-
$
-
$86
3,21
4,49
5.51
DEB
T SE
RVI
CE
FUN
DS
1400
1 D
ebt S
ervi
ce 2
106
Ent
erpr
ise
Uni
vers
ity B
ond
Liqu
idat
ion
$1,
893,
809.
91
$
1,89
3,80
9.91
14
002
Deb
t Ser
vice
210
9 E
nter
pris
e S
tate
Uni
vers
ity D
orm
itory
4
3,56
8,71
2.90
43,
568,
712.
90
1400
5 D
ebt S
ervi
ce 1
401
Deb
t Ser
vice
Tr
ansp
orta
tion
Fund
Res
erve
5
87,6
49,9
81.8
7 (6
)
$10
0,10
1,56
3.27
(6)
6
87,7
51,5
45.1
4 SU
BTO
TAL
DEB
T SE
RVI
CE
FUN
DS
$
633,
112,
504.
68
$-
$
-
$-
$
100,
101,
563.
27
$-
$
733,
214,
067.
95
ENTE
RPR
ISE
FUN
DS
2100
5 E
nter
pris
e 12
15 S
pec.
Rev
. A
uto
Em
issi
ons
Insp
ectio
n $
1,25
9,64
2.16
$1,2
59,6
42.1
6 21
008
Ent
erpr
ise
2110
Ent
erpr
ise
Bra
dley
Inte
rnat
iona
l Par
king
Ope
ratio
ns
7,9
05,3
24.0
1 (7
)
4,5
07,6
30.0
0
12,
412,
954.
01
2100
9 E
nter
pris
e 21
01 E
nter
pris
e B
radl
ey In
tern
atio
nal A
irpor
t Ope
ratio
ns
123
,821
,768
.56
(8)
5
0.00
(8)
13,
257,
960.
01 (8
) 1
37,0
79,7
78.5
7 21
010
Ent
erpr
ise
1212
Spe
c.R
ev.
Loca
l Brid
ge R
evol
ving
Fun
d - B
ond
Fina
nced
$4,
970,
654.
09
4,9
70,6
54.0
9 21
011
Ent
erpr
ise
1212
Spe
c.R
ev.
Loca
l Brid
ge R
evol
ving
Fund
- Re
venu
e Fi
nanc
ed
341
,369
.17
341
,369
.17
2101
4 E
nter
pris
e 12
13 S
pec.
Rev
. C
lean
Wat
er F
und
- Sta
te
18,
017,
889.
35 (9
)
1,4
65,0
00.0
0 (9
) 6
,355
,000
.00
(9)
25,
837,
889.
35
2101
5 E
nter
pris
e 21
05 N
on.-E
xp.
Cle
an W
ater
Fun
d - F
eder
al
264
,155
,176
.05
(12)
6
2,20
7,12
5.98
(10)
270,
941,
079.
37 (1
0)
597
,303
,381
.40
2101
6 E
nter
pris
e 12
13 S
pec.
Rev
. C
lean
Wat
er F
und
- Lon
g Is
land
Sou
nd
869
,756
.03
869
,756
.03
2101
8 E
nter
pris
e 21
11 S
pec.
Rev
. D
rinki
ng W
ater
Fun
d - F
ed R
evol
ving
Loa
n 6
8,50
7,23
7.53
(12)
1,0
78,2
22.2
0 (1
1)
25,
289,
861.
65 (1
1)
94,
875,
321.
38
2102
0 E
nter
pris
e 12
16 S
pec.
Rev
. R
ate
Red
uctio
n B
ond
Ope
ratio
ns
10,
397.
63 (1
3)
1
1,32
8.75
(13)
2
1,72
6.38
SU
BTO
TAL
ENTE
RPR
ISE
FUN
DS
$
484,
888,
560.
49
$4,
970,
654.
09
$-
$
-
$69
,269
,356
.93
$
315,
843,
901.
03
$87
4,97
2,47
2.54
FID
UC
IARY
FU
ND
S31
001
Pen
sion
31
03 P
ensi
on
Sta
te E
mpl
oyee
s’ R
etire
men
t Fun
d
$
492,
796,
001.
17
$7,
296,
811,
294.
92 (1
4)
$7,
789,
607,
296.
09
3100
2 P
ensi
on
3105
Pen
sion
S
tate
Atto
rney
s’ R
etire
men
t Fun
d
1
90,3
44.2
6
800
,437
.43
(14)
990
,781
.69
3100
3 P
ensi
on
3105
Pen
sion
G
ener
al A
ssem
bly
Ret
irem
ent F
und
$16,
809.
28
1
6,80
9.28
31
004
Pen
sion
31
06 P
ensi
on
Judg
es &
Com
p C
omm
issi
oner
s’ R
etrm
t Fun
d
7
,980
,681
.46
1
41,7
94,3
65.4
6 (1
4)
149
,775
,046
.92
3100
5 P
ensi
on
3105
Pen
sion
P
ublic
Def
ende
rs R
etire
men
t Fun
d 2
17,1
34.6
4
2
17,1
34.6
4 31
006
Pen
sion
31
04 P
ensi
on
Teac
hers
’ Ret
irem
ent F
und
981
,610
,504
.64
1
1,29
1,94
4,93
0.40
(14)
12,
273,
555,
435.
04
3100
8 P
ensi
on
3107
Pen
sion
M
unic
ipal
Em
ploy
ees’
Ret
irem
ent -
Fun
d B
1
46,5
94,3
47.0
5
1,3
24,0
26,7
01.5
1 (14)
1,4
70,6
21,0
48.5
6 31
009
Othe
r Em.
Bene
fi ts 31
02 A
genc
y P
olic
emen
& F
irem
en S
urvi
vors
’ Ben
efi t
Fund
1,
225,
667.
12
18,
199,
297.
53 (1
4)
19,
424,
964.
65
3101
0 P
ensi
on
3108
Pen
sion
Pr
obat
e Ju
dges
& E
mpl
oyee
s R
etire
men
t Fun
d
6
,646
,268
.91
6
5,17
4,83
3.30
(14)
71,
821,
102.
21
3501
0 Fi
duci
ary
1502
Per
man
ent
Con
nect
icut
Arts
End
owm
ent F
und
1,0
70,9
81.8
8
15,
751,
336.
58 (1
4)
16,
822,
318.
22
3501
1 Fi
duci
ary
1501
Non
.-Exp
. S
oldi
ers,
Sai
lors
and
Mar
ines
Tru
st F
und
653
,033
.44
6
1,04
5,54
9.07
(14.
)
6
1,69
8,58
2.51
35
014
Fidu
ciar
y 21
03 E
xp.T
rust
U
nem
ploy
men
t Com
pens
atio
n Fu
nd
$20
4,18
9,62
2.86
(15)
2
04,1
89,6
22.4
6 35
015
Fidu
ciar
y 21
07 E
nter
pris
e Jo
hn D
emps
ey H
ospi
tal M
alpr
actic
e Tr
ust F
und
6,94
9,87
0.33
6,9
49,8
70.3
3 SU
BTO
TAL
FID
UC
IARY
FU
ND
S
$7,
183,
814.
25
$-
$
1,63
8,76
7,82
9.93
$
20,2
15,5
48,7
46.2
0
$20
4,18
9,62
2.86
$
-
$22
,065
,690
,013
.24
TOTA
L C
IVIL
LIS
T FU
ND
S
$2,
595,
122,
398.
50
$16
,202
,609
.58
$2,
327,
787,
992.
38
$20
,215
,985
,967
.89
$
373,
560,
543.
06
$31
5,84
3,90
1.03
$
25,8
44,5
03,4
12.4
4
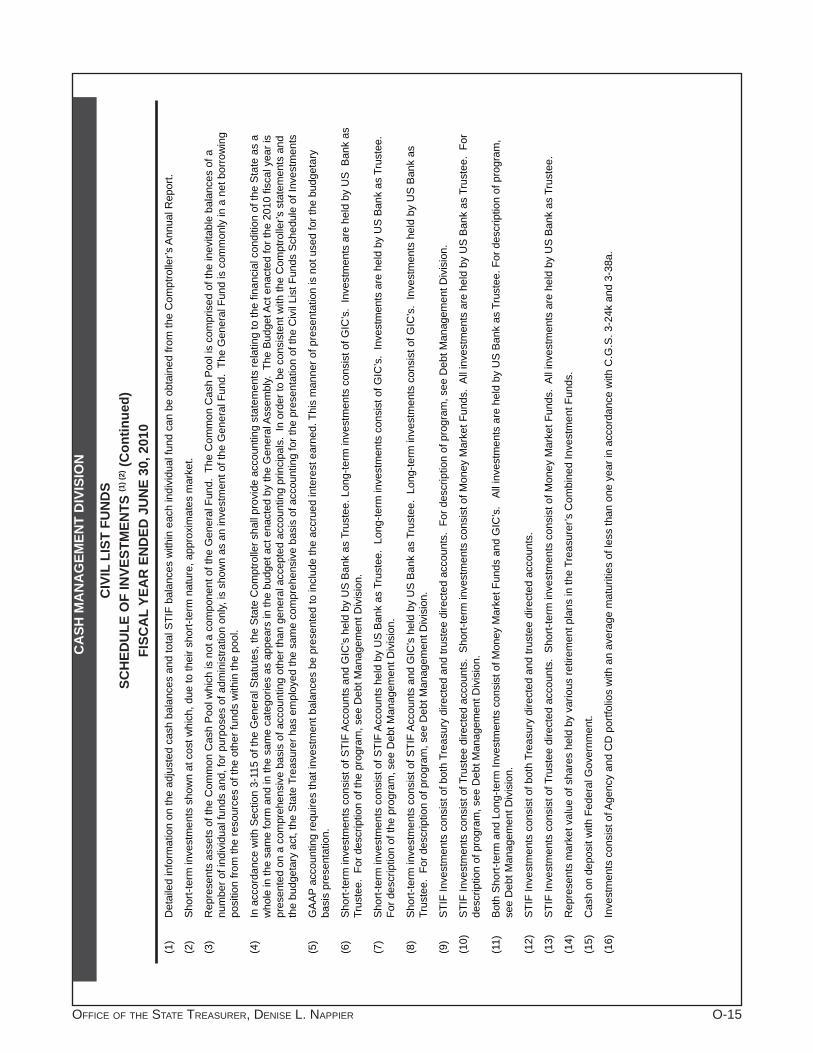
OFFICE OF THE STATE TREASURER, DENISE L. NAPPIER O-15
CA
SH M
AN
AG
EMEN
T D
IVIS
ION
CIV
IL L
IST
FUN
DS
SCH
EDU
LE O
F IN
VEST
MEN
TS (1
) (2) (C
ontin
ued)
FISC
AL
YEA
R E
ND
ED J
UN
E 30
, 201
0
(1)
Det
aile
d in
form
atio
n on
the
adju
sted
cas
h ba
lanc
es a
nd to
tal S
TIF
bala
nces
with
in e
ach
indi
vidu
al fu
nd c
an b
e ob
tain
ed fr
om th
e C
ompt
rolle
r’s A
nnua
l Rep
ort.
(2)
Sho
rt-te
rm in
vest
men
ts s
how
n at
cos
t whi
ch, d
ue to
thei
r sho
rt-te
rm n
atur
e, a
ppro
xim
ates
mar
ket.
(3)
Rep
rese
nts
asse
ts o
f the
Com
mon
Cas
h P
ool w
hich
is n
ot a
com
pone
nt o
f the
Gen
eral
Fun
d. T
he C
omm
on C
ash
Poo
l is
com
pris
ed o
f the
inev
itabl
e ba
lanc
es o
f a
num
ber o
f ind
ivid
ual f
unds
and
, for
pur
pose
s of
adm
inis
tratio
n on
ly, is
sho
wn
as a
n in
vest
men
t of t
he G
ener
al F
und.
The
Gen
eral
Fun
d is
com
mon
ly in
a n
et b
orro
win
g po
sitio
n fro
m th
e re
sour
ces
of th
e ot
her f
unds
with
in th
e po
ol.
(4)
In a
ccor
danc
e w
ith S
ectio
n 3-
115
of th
e G
ener
al S
tatu
tes,
the
Sta
te C
ompt
rolle
r sha
ll pr
ovid
e ac
coun
ting
stat
emen
ts re
latin
g to
the
fi nan
cial
con
ditio
n of
the
Sta
te a
s a
who
le in
the
sam
e fo
rm a
nd in
the
sam
e ca
tego
ries
as a
ppea
rs in
the
budg
et a
ct e
nact
ed b
y th
e G
ener
al A
ssem
bly.
The
Bud
get A
ct e
nact
ed fo
r the
201
0 fi s
cal y
ear i
s pr
esen
ted
on a
com
preh
ensi
ve b
asis
of a
ccou
ntin
g ot
her t
han
gene
ral a
ccep
ted
acco
untin
g pr
inci
pals
. In
ord
er to
be
cons
iste
nt w
ith th
e C
ompt
rolle
r’s s
tate
men
ts a
nd
the
budg
etar
y ac
t, th
e S
tate
Tre
asur
er h
as e
mpl
oyed
the
sam
e co
mpr
ehen
sive
bas
is o
f acc
ount
ing
for t
he p
rese
ntat
ion
of th
e C
ivil
List
Fun
ds S
ched
ule
of In
vest
men
ts
(5)
GA
AP
acco
untin
g re
quire
s th
at in
vest
men
t bal
ance
s be
pre
sent
ed to
incl
ude
the
accr
ued
inte
rest
ear
ned.
Thi
s m
anne
r of p
rese
ntat
ion
is n
ot u
sed
for t
he b
udge
tary
ba
sis
pres
enta
tion.
(6)
Sho
rt-te
rm in
vest
men
ts c
onsi
st o
f STI
F A
ccou
nts
and
GIC
’s h
eld
by U
S B
ank
as T
rust
ee. L
ong-
term
inve
stm
ents
con
sist
of G
IC’s
. In
vest
men
ts a
re h
eld
by U
S B
ank
as
Trus
tee.
For
des
crip
tion
of th
e pr
ogra
m, s
ee D
ebt M
anag
emen
t Div
isio
n.
(7)
Sho
rt-te
rm in
vest
men
ts c
onsi
st o
f STI
F A
ccou
nts
held
by
US
Ban
k as
Tru
stee
. Lo
ng-te
rm in
vest
men
ts c
onsi
st o
f GIC
’s.
Inve
stm
ents
are
hel
d by
US
Ban
k as
Tru
stee
. Fo
r des
crip
tion
of th
e pr
ogra
m, s
ee D
ebt M
anag
emen
t Div
isio
n.
(8)
S
hort-
term
inve
stm
ents
con
sist
of S
TIF
Acc
ount
s an
d G
IC’s
hel
d by
US
Ban
k as
Tru
stee
. Lo
ng-te
rm in
vest
men
ts c
onsi
st o
f GIC
’s.
Inve
stm
ents
hel
d by
US
Ban
k as
Tr
uste
e. F
or d
escr
iptio
n of
pro
gram
, see
Deb
t Man
agem
ent D
ivis
ion.
(9)
STI
F In
vest
men
ts c
onsi
st o
f bot
h Tr
easu
ry d
irect
ed a
nd tr
uste
e di
rect
ed a
ccou
nts.
For
des
crip
tion
of p
rogr
am, s
ee D
ebt M
anag
emen
t Div
isio
n.
(10)
S
TIF
Inve
stm
ents
con
sist
of T
rust
ee d
irect
ed a
ccou
nts.
Sho
rt-te
rm in
vest
men
ts c
onsi
st o
f Mon
ey M
arke
t Fun
ds.
All
inve
stm
ents
are
hel
d by
US
Ban
k as
Tru
stee
. Fo
r de
scrip
tion
of p
rogr
am, s
ee D
ebt M
anag
emen
t Div
isio
n.
(11)
B
oth
Sho
rt-te
rm a
nd L
ong-
term
Inve
stm
ents
con
sist
of M
oney
Mar
ket F
unds
and
GIC
’s.
All
inve
stm
ents
are
hel
d by
US
Ban
k as
Tru
stee
. For
des
crip
tion
of p
rogr
am,
see
Deb
t Man
agem
ent D
ivis
ion.
(12)
S
TIF
Inve
stm
ents
con
sist
of b
oth
Trea
sury
dire
cted
and
trus
tee
dire
cted
acc
ount
s.
(13)
S
TIF
Inve
stm
ents
con
sist
of T
rust
ee d
irect
ed a
ccou
nts.
Sho
rt-te
rm in
vest
men
ts c
onsi
st o
f Mon
ey M
arke
t Fun
ds.
All
inve
stm
ents
are
hel
d by
US
Ban
k as
Tru
stee
.
(14)
R
epre
sent
s m
arke
t val
ue o
f sha
res
held
by
vario
us re
tirem
ent p
lans
in th
e Tr
easu
rer’s
Com
bine
d In
vest
men
t Fun
ds.
(15)
C
ash
on d
epos
it w
ith F
eder
al G
over
nmen
t.
(16)
In
vest
men
ts c
onsi
st o
f Age
ncy
and
CD
por
tfolio
s w
ith a
n av
erag
e m
atur
ities
of l
ess
than
one
yea
r in
acco
rdan
ce w
ith C
.G.S
. 3-2
4k a
nd 3
-38a
.

O-16 FISCAL YEAR 2010 ANNUAL REPORT
Par Amount Market Name of Insurance Company of Collateral Value The following securities are on deposit with the State Treasurer for the Insurance Department under Sec 38a-83: ACE Life Insurance Company $ 5,000,000.00 $ 5,473,964.00 Aetna Better Health, Inc. 500,000.00 535,820.00 Aetna Health Inc. (CT) 525,000.00 528,979.50 Aetna Health and Life Insurance Company 2,075,000.00 2,184,085.75 Aetna Insurance Company Of Connecticut 2,550,000.00 2,686,272.00 Aetna Life Insurance Company 1,500,000.00 1,724,726.00 Allianz Global Risks US Insurance Company 681,000.00 788,257.50 American Centennial Insurance Company 50,000.00 64,713.29 American Equity Specialty Insurance Company 2,600,000.00 2,712,303.51 American Maturity Life Insurance Company 5,700,000.00 5,958,267.00 American Phoenix Life & Reassurance Company 5,650,000.00 6,262,990.00 American Security Insurance Company 35,000.00 38,376.80 AmeriChoice of Connecticut, Inc. 500,000.00 505,820.00 Anthem Health Plans, Inc. 500,000.00 540,625.00 Arbella Protection Insurance Company 50,000.00 64,226.50 Associated Indemnity Corporation 300,000.00 345,267.00 Automobile Insurance Company of Hartford (The) 4,050,000.00 4,349,475.25 AXIS Specialty Insurance Company 2,800,000.00 2,882,348.00 Beazley Insurance Company, Inc. 2,500,000.00 2,535,937.50 C.M. Life Insurance Company 1,600,000.00 1,723,376.00 California Insurance Company 1,850,000.00 1,910,570.00 Carolina Casualty Insurance Company 200,000.00 238,678.27 Charter Oak Fire Insurance Company (The) 4,525,000.00 4,883,952.00 Chicago Title Insurance Company 100,000.00 111,367.00 CIGNA Healthcare of Connecticut, Inc. 525,000.00 613,614.75 CIGNA Health and Life Insurance Company 2,500,000.00 2,517,100.00 Cologne Reinsurance Company Of America 3,505,000.00 3,675,167.75 Connecticare, Inc. 500,000.00 555,740.00 Connecticut Attorneys Title Insurance Company 210,000.00 237,432.30 Connecticut General Life Insurance Company 1,710,000.00 1,825,713.20 Covenant Insurance Company 600,000.00 754,601.00 Electric Insurance Company 60,000.00 69,829.20 Employers’ Fire Insurance Company 655,000.00 801,490.82 Executive Risk Specialty Insurance Company 3,110,000.00 3,509,851.60 Fairfi eld Insurance Company 2,510,000.00 2,641,125.20 Farmington Casualty Company 3,000,000.00 3,333,900.00 Finial Reinsurance Company 3,550,000.00 3,823,740.50 Fireman’s Fund Insurance Company 9,459,000.00 10,984,864.61 First State Insurance Company 2,200,000.00 2,444,244.00 First Trenton Indemnity Company 100,000.00 142,469.00 Fitchburg Mutual Insurance Company 50,000.00 52,937.50 General Re Life Corporation 1,500,000.00 2,137,035.00 General Star Indemnity Company 2,975,000.00 3,347,734.25 Genesis Insurance Company 3,000,000.00 3,438,420.00 Genworth Mortgage Ins Corporation of North Carolina 60,000.00 66,688.80 Gulf Underwriters Insurance Company 3,000,000.00 3,143,213.88 Harbor Point Reinsurance U.S., Inc. 3,025,000.00 3,247,544.00 Harleysville Worcester Insurance Company 9,065,000.00 9,485,586.05 Hartford Accident & Indemnity Company 3,500,000.00 3,722,880.00 Hartford Fire Insurance Company 3,300,000.00 3,467,508.00 Hartford Insurance Company of the Southeast 200,000.00 210,544.00 Hartford International Life Reassurance Corp. 5,645,000.00 6,131,365.90 Hartford Life Insurance Company 2,350,000.00 2,484,749.00 Hartford Life & Accident Insurance Company 1,915,000.00 2,043,241.60 Hartford Life & Annuity Insurance Company 2,860,000.00 3,114,704.70 Hartford Steam Boiler Inspection & Insurance Company 4,000,000.00 4,106,240.00
CASH MANAGEMENT DIVISIONSECURITIES HELD IN TRUST FOR POLICYHOLDERS
JUNE 30, 2010

OFFICE OF THE STATE TREASURER, DENISE L. NAPPIER O-17
CASH MANAGEMENT DIVISIONSECURITIES HELD IN TRUST FOR POLICYHOLDERS (Continued)
JUNE 30, 2010
Par Amount Market Name of Insurance Company of Collateral Value Hartford Steam Boiler Inspection & Ins Co of CT 3,100,000.00 3,182,336.00 Hartford Underwriters Insurance Company 3,250,000.00 3,429,010.00 Health Net of Connecticut, Inc. 500,000.00 501,815.00 Homesite Insurance Company 2,500,000.00 2,553,700.00 IdeaLife Insurance Company 1,500,000.00 1,572,825.00 ING Life Insurance & Annuity Company 3,600,000.00 3,456,252.00 Insurance Company of the West 100,000.00 145,813.00 Integon National Insurance Company 75,000.00 86,812.50 Integon Preferred Insurance Company 75,000.00 80,349.75 Knights of Columbus 2,000,000.00 1,960,000.00 Liberty Mutual Insurance Company 50,000.00 53,730.50 Massachusetts Mutual Life Insurance Company 1,600,000.00 2,290,256.00 MEMBERS Life Insurance Company 350,000.00 449,585.50 MetLife Insurance Company of Connecticut 10,125,000.00 10,404,072.25 Middlesex Mutual Assurance Company 1,525,000.00 1,678,462.00 MML Bay State Life Insurance Company 1,500,000.00 1,615,665.00 Munich American Reassurance Company 40,000.00 44,459.20 National Liability & Fire Insurance Company 2,750,000.00 2,758,607.50 New England Insurance Company 2,945,000.00 3,311,252.90 New England Reinsurance Corporation 3,225,000.00 4,439,406.00 New London County Mutual Insurance Company 600,000.00 641,388.00 Northern Assurance Company of America 2,165,000.00 2,784,918.76 Nutmeg Insurance Company 3,000,000.00 3,278,900.00 Odyssey America Reinsurance Corporation 5,000,000.00 5,307,300.00 OneBeacon America Insurance Company 6,185,000.00 7,977,598.83 Oxford Health Plans (CT), Inc. 500,000.00 505,820.00 Pacifi c Insurance Company, Limited 2,820,000.00 3,205,773.40 Patrons Mutual Insurance Company of Connecticut 120,000.00 128,484.00 PHL Variable Insurance Company 5,070,000.00 5,370,792.00 Phoenix Insurance Company (The) 4,635,000.00 5,216,826.30 Phoenix Life & Annuity Company 5,650,000.00 6,073,476.50 Prudential Annuities Life Assurance Corporation 1,500,000.00 1,504,695.00 Prudential Retirement Insurance & Annuity Company 5,015,000.00 5,582,544.65 PXRE Reinsurance Company 7,430,000.00 7,461,949.00 R.V.I. America Insurance Company 2,540,000.00 2,389,381.60 R.V.I. National Insurance Company 2,550,000.00 2,728,797.00 Safeco Surplus Lines Insurance Company 100,000.00 109,883.00 Seneca Insurance Company, Inc. 260,000.00 269,838.40 Sentinel Insurance Company, Ltd. 3,405,000.00 3,415,000.00 Sequoia Insurance Company 125,000.00 131,288.75 Sparta Insurance Company 3,070,000.00 3,082,170.80 Standard Fire Insurance Company (The) 4,000,000.00 4,206,720.00 Sun Life and Health Insurance Company (U.S.) 5,000,000.00 6,181,250.00 Swiss Re Life & Health America, Inc. 5,290,000.00 5,872,939.20 Thames Insurance Company, Inc. 200,000.00 213,796.00 T.H.E. Insurance Company 300,000.00 310,691.00 TIG Indemnity Company 100,000.00 99,987.00 TIG Insurance Company 3,800,000.00 4,062,048.00 Tower National Insurance Company 50,000.00 50,181.50 TravCo Insurance Company 4,875,000.00 5,503,076.50 Travelers Auto Insurance Company of New Jersey 100,000.00 101,820.00 Travelers Casualty & Surety Company 3,000,000.00 3,214,760.00 Travelers Casualty & Surety Company of America 3,180,000.00 3,388,360.20 Travelers Casualty Company of Connecticut 2,500,000.00 2,588,187.00 Travelers Casualty Insurance Company of America 3,400,000.00 4,843,946.00 Travelers Commercial Casualty Company 3,200,000.00 3,476,544.00 Travelers Commercial Insurance Company 2,125,000.00 2,351,245.00 Travelers Excess & Surplus Lines Company 2,500,000.00 2,586,125.00 Travelers Home & Marine Insurance Company (The) 5,125,000.00 5,719,398.50 Travelers Indemnity Company (The) 6,630,000.00 7,266,032.80 Travelers Indemnity Company of America (The) 3,565,000.00 3,749,239.20

O-18 FISCAL YEAR 2010 ANNUAL REPORT
CASH MANAGEMENT DIVISIONSECURITIES HELD IN TRUST FOR POLICYHOLDERS (Continued)
JUNE 30, 2010
Par Amount Market Name of Insurance Company of Collateral Value Travelers Indemnity Company of Connecticut (The) 3,000,000.00 3,133,285.50 Travelers Personal Insurance Company 5,500,000.00 6,911,460.00 Travelers Personal Security Insurance Company 4,100,000.00 4,388,178.00 Travelers Property Casualty Company of America 3,005,000.00 4,469,361.90 Travelers Property Casualty Insurance Company 2,050,000.00 2,274,365.00 Trenwick America Reinsurance Corporation 6,275,000.00 6,309,153.75 Truck Insurance Exchange 370,000.00 402,881.90 Trumbull Insurance Company 2,580,000.00 2,766,176.90 United Guaranty Residential Insurance Company of NC 50,000.00 51,204.50 UnitedHealthcare Insurance Company 1,510,000.00 1,626,556.90 United Illuminating Company 214,000.00 214,903.08 United States Fidelity and Guaranty Company 6,000,000.00 6,431,640.00 Vantis Life Insurance Company 1,550,000.00 1,652,106.50 Vision Service Plan Insurance Company 2,600,000.00 2,780,050.00 Wellcare of CT, Inc. 525,000.00 527,375.00 Western National Life Insurance Company 100,000.00 110,469.00 Zenith Insurance Company 1,111,000.00 1,201,613.16 TOTAL $ 328,510,000.00 $ 359,400,038.56

OFFICE OF THE STATE TREASURER, DENISE L. NAPPIER O-19
The Act which established Unemployment Compensation provides that contributions from employ-ers be collected by the Labor Commissioner as Administrator of the Act and be deposited with the State Treasurer. (Chapter 2, Public Act, Special Session 1936). These funds are then sent to the Secretary of the Treasury of the United States. The Administrator requests withdrawals as needed to pay benefi ts to employees.
BALANCE at JUNE 30, 2009 $ 243,628,581.41 Deposits $ 679,572,000.00 Combined Wage Transfers to Connecticut 16,586,981.97 Earnings 1,982,823.24 Extended Benefi ts 123,650,000.00 Federal Employee & Ex-Servicemen Contributions 11,974,000.00 Extended Unemployment Compensation 08 1,148,665,000.00 Federal Additional Compensation 195,572,000.00 Federal Unemployment Account 498,452,705.05 2,676,455,510.26 TOTAL CASH AVAILABLE $ 2,920,084,091.67 Reed Act Withdrawals for Benefi ts $ 103,325,769.81 Reed Act Withdrawal for Administration 448,673.88 Federal Employee & Ex-Servicemen Withdrawals 11,974,000.00 Withdrawals for Benefi t Payments 2,600,146,025.12 2,715,894,468.81 BALANCE at JUNE 30, 2010 $ 204,189,622.86
UNEMPLOYMENT COMPENSATION FUNDOn Account with the Secretary of the Treasury of the United States as Trustee of the Unemployment Compensation Fund
CASH MANAGEMENT DIVISION

O-20 FISCAL YEAR 2010 ANNUAL REPORT

Offi ce of the State Treasurer LIST OF PRINCIPAL OFFICIALS AND PHONE NUMBERS
Denise L. NappierTreasurer, State of Connecticut
Tel: (860) 702-3001Fax: (860) 702-3043
Howard G. RifkinDeputy Treasurer
Tel: (860) 702-3292Fax: (860) 728-1290
Linda D. HershmanAssistant Deputy Treasurer and Chief of Staff
Tel: (860) 702-3012Fax: (860) 728-1290
M. Timothy Corbett Maria M. Greenslade Chief Investment Offi cer Assistant Deputy Treasurer Pension Funds Management Second Injury Fund and Unclaimed Property Tel: (860) 702-3005 Tel: (860) 702-3125 Fax: (860) 702-3042 Fax: (860) 702-3021
Meredith A. Miller Sarah K. Sanders Assistant Treasurer Assistant Treasurer Policy Debt Management Tel: (860) 702-3294 Tel: (860) 702-3288 Fax: (860) 728-1290 Fax: (860) 702-3034
Lawrence A. Wilson Assistant Treasurer Cash Management Tel: (860) 702-3126 Fax: (860) 702-3041

CONNECTICUT STATE TREASURY
55 Elm StreetHartford, CT 06106-1773
Tel: (860) 702-3000 www.state.ct.us/ott


![[2A1]Line은 어떻게 글로벌 메신저 플랫폼이 되었는가](https://img.dokumen.tips/doc/110x75/5888a5a61a28ab264b8b6a0f/2a1line-.jpg)