Embed Size (px)
Citation preview

Growth, processing, and opticalproperties of epitaxial Er2O3 on silicon
C. P. Michael,1,† H. B. Yuen,2 V. A. Sabnis,2 T. J. Johnson,1 R. Sewell,2
R. Smith,2 A. Jamora,2 A. Clark,2 S. Semans,2 P. B. Atanackovic,2 andO. Painter1
1Department of Applied Physics, California Institute of Technology, Pasadena, CA 911252Translucent, Inc., 952 Commercial St., Palo Alto, CA 94303
† Corresponding author: [email protected]
Abstract: Erbium-doped materials have been investigated for generatingand amplifying light in low-power chip-scale optical networks on silicon,but several effects limit their performance in dense microphotonic applica-tions. Stoichiometric ionic crystals are a potential alternative that achievean Er3+ density 100× greater. We report the growth, processing, materialcharacterization, and optical properties of single-crystal Er 2O3 epitaxiallygrown on silicon. A peak Er3+ resonant absorption of 364 dB/cm at 1535 nmwith minimal background loss places a high limit on potential gain. Usinghigh-quality microdisk resonators, we conduct thorough C/L-band radiativeefficiency and lifetime measurements and observe strong upconvertedluminescence near 550 and 670 nm.
© 2008 Optical Society of AmericaOCIS codes: (160.4760) Materials – optical properties; (160.5690) Rare-earch-doped materi-als; (190.7220) Upconversion; (230.5750) Resonators
References and links1. L. Pavesi and D. J. Lockwood, eds., Silicon Photonics (Springer-Verlag, Berlin, 2004).2. J. V. Gates, A. J. Bruce, J. Shmulovich, Y. H. Wong, G. Nykolak, M. R. X. Barros, and R. N. Ghosh, “Fabrication
of Er doped glass films as used in planar optical waveguides,” Mater. Res. Soc. Symp. Proc. 392, 209–216 (1995).3. Y. C. Yan, A. J. Faber, H. de Waal, P. G. Kik, and A. Polman, “Erbium-doped phosphate glass waveguide on
silicon with 4.1 dB/cm gain at 1.535 μm,” Appl. Phys. Lett. 71, 2922–2924 (1997).4. P. G. Kik, M. J. A. de Dood, K. Kikoin, and A. Polman, “Excitation and deexcitation of Er3+ in crystalline
silicon,” Appl. Phys. Lett. 70, 1721–1723 (1997).5. R. D. Kekatpure, A. R. Guichard, and M. L. Brongersma, “Free-carrier absorption in Si nanocrystals probed
by microcavity photoluminescence,” in Conference on Lasers and Electro-Optics (CLEO), p. CTuJ3 (OpticalSociety of America, San Jose, CA, 2008).
6. J. D. Meindl, J. A. Davis, P. Zarkesh-Ha, C. S. Patel, K. P. Martin, and P. A. Kohl, “Interconnect opportunitiesfor gigascale integration,” IBM J. Res. & Dev. 46, 245–263 (2002).
7. M. J. Kobrinsky, B. A. Block, J.-F. Zheng, B. C. Barnett, E. Mohammed, M. Reshotko, F. Roberton, S. List,I. Young, and K. Cadien, “On-chip optical interconnects,” Intel Tech. Jour. 8, 129–141 (2004).
8. R. Soref and J. Larenzo, “All-silicon active and passive guided-wave components for λ = 1.3 and 1.6 μm,” IEEEJ. Quantum Electron. 22, 873–879 (1986).
9. A. Liu, R. Jones, L. Liao, D. Samara-Rubio, D. Rubin, O. Cohen, R. Nicolaescu, and M. Paniccia, “A high-speedsilicon optical modulator based on a metal-oxide-semiconductor capacitor,” Nature 427, 615–618 (2004).
10. M. A. Foster, A. C. Turner, J. E. Sharping, B. S. Schmidt, M. Lipson, and A. L. Gaeta, “Broad-band opticalparametric gain on a silicon photonic chip,” Nature (London) 441, 960–963 (2006).
11. L. Colace, G. Masini, F. Galluzzi, G. Assanto, G. Capellini, L. D. Gaspare, E. Palange, and F. Evangelisti,“Metal–semiconductor–metal near-infrared light detector based on epitaxial Ge/Si,” Appl. Phys. Lett. 72, 3175–3177 (1998).
12. Y.-H. Kuo, Y. K. Lee, Y. Ge, S. Ren, J. E. Roth, T. I. Kamins, D. A. B. Miller, and J. S. Harris, “Strongquantum-confined Stark effect in germanium quantum-well structures on silicon,” Nature (London) 437, 1334–1336 (2005).
(C) 2008 OSA 24 November 2008 / Vol. 16, No. 24 / OPTICS EXPRESS 19649#100542 - $15.00 USD Received 25 Aug 2008; revised 6 Nov 2008; accepted 8 Nov 2008; published 12 Nov 2008

13. A. W. Fang, H. Park, O. Cohen, R. Jones, M. J. Paniccia, and J. E. Bowers, “Electrically pumped hybridAlGaInAs-silicon evanescent laser,” Opt. Express 14, 9203–9210 (2006).
14. H. Park, A. W. Fang, R. Jones, O. Cohen, O. Raday, M. N. Sysak, M. J. Paniccia, and J. E. Bowers, “A hybridAlGaInAs-silicon evanescent waveguide photodetector,” Opt. Express 15, 6044–6052 (2007).
15. A. Kasuya and M. Suezawa, “Resonant excitation of visible photoluminescence form an erbium-oxide overlayeron Si,” Appl. Phys. Lett. 71, 2728–2730 (1997).
16. H. Isshiki, M. J. A. de Dood, A. Polman, and T. Kimura, “Self-assembled infrared-luminescent Er–Si–O crystal-lites on silicon,” Appl. Phys. Lett. 85, 4343–4345 (2004).
17. K. Masaki, H. Isshiki, and T. Kimura, “Erbium-Silicon-Oxide crystalline films prepared by MOMBE,” Opt.Mater. 27, 876–879 (2004).
18. S. Saini, K. Chen, X. Duan, J. Michel, L. C. Kimerling, and M. Lipson, “Er2O3 for high-gain waveguide ampli-fiers,” J. Electron. Mater. 33, 809–814 (2004).
19. A. M. Grishin, E. V. Vanin, O. V. Tarasenko, S. I. Khartsev, and P. Johansson, “Strong broad C-band room-temperature photoluminescence in amorphous Er2O3 film,” Appl. Phys. Lett. 89, 021114 (2006).
20. K. Suh, J. H. Shin, S.-J. Seo, and B.-S. Bae, “Large-scale fabrication of single-phase Er2SiO5 nanocrystal aggre-gates using Si nanowires,” Appl. Phys. Lett. 89, 223102 (2006).
21. E. Desurvire, Erbium-doped Fiber Amplifiers: Principles and Applications (John Wiley & Sons, Inc., New York,2002).
22. P. B. Atanackovic, “Rare earth-oxides, rare earth-nitrides, rare earth-phosphides, and ternary alloys with silicon,”U.S. Patent 7199015 (Dec. 28, 2004).
23. R. Xu, Y. Y. Zhu, S. Chen, F. Xue, Y. L. Fan, X. J. Yang, and Z. M. Jiang, “Epitaxial growth of Er2O3 films onSi(001),” J. Cryst. Growth 277, 496–501 (2005).
24. J. B. Gruber, J. R. Henderson, M. Muramoto, K. Rajnak, and J. G. Conway, “Energy levels of single-crystalerbium oxide,” J. Chem. Phys. 45, 477–482 (1966).
25. N. C. Chang, J. B. Gruber, R. P. Leavitt, and C. A. Morrison, “Optical spectra, energy levels, and crystal-fieldanalysis of tripositive rare earth ions in Y2O3. I. Kramers ions in C2 sites,” J. Chem. Phys. 76, 3877–3889 (1982).
26. R. P. Leavitt, J. B. Gruber, N. C. Chang, and C. A. Morrison, “Optical spectra, energy levels, and crystal-fieldanalysis of tripositive rare-earth ions in Y2O3. II. Non-Kramers ions in C2 sites,” J. Chem. Phys. 76, 4775–4788(1982).
27. H. J. Osten, E. Bugiel, M. Czernohorsky, Z. Elassar, O. Kirfel, and A. Fissel, “Molecular Beam Epitaxy ofRare-Earth Oxides,” in Rare Earth Oxide Thin Films, M. Fanciulli and G. Scarel, eds. (Springer-Verlag, Berlin,2007).
28. The Er2O3(111) orientation is rotated 180◦ about the Si(111) surface normal.29. The short wavelengths (S), conventional (C), and long wavelengths (L) telecommunications windows (bands)
are relative to the region of lowest optical loss in silica fiber (λ ≈ 1550 nm) and occur at 1460–1530 nm, 1530–1565 nm, and 1565–1625 nm, respectively. These designations are not strictly applied in this report as that theabsorption extends into the E-band (extended, 1360–1460 nm) and the emission in Fig. 8 continues through theU-band (ultralong wavelengths, 1625–1675 nm).
30. H. Isshiki, T. Ushiyama, and T. Kimura, “Demonstration of ErSiO superlattice crystal waveguide toward opticalamplifiers and emitters,” Phys. Stat. Sol. A 205, 52–55 (2008).
31. H. Ono and T. Katsumata, “Interfacial reactions between thin rare-earth-metal oxide films and Si substrates,”Appl. Phys. Lett. 78(13), 1832–1834 (2001).
32. B. J. Ainslie, “A Review of the fabrication and properties of Erbium-doped fibers for optical amplifiers,” IEEE J.Lightwave Technol. 9, 220–227 (1991).
33. M. Borselli, T. J. Johnson, and O. Painter, “Beyond the Rayleigh scattering limit in high-Q silicon microdisks:theory and experiment,” Opt. Express 13, 1515 (2005).
34. C. P. Michael, M. Borselli, T. J. Johnson, C. Chrystal, and O. Painter, “An optical fiber-taper probe for wafer-scalemicrophotonic device characterization,” Opt. Express 15(8), 4745–4752 (2007).
35. K. Srinivasan, A. Stintz, S. Krishna, and O. Painter, “Photoluminescence measurements of quantum-dot-containing semiconductor microdisk resonators using optical fiber taper waveguides,” Phys. Rev. B 72, 205318(2005).
36. J. B. Gruber, K. L. Nash, D. K. Sardar, U. V. Valiev, N. Ter-Gabrielyan, and L. D. Merkle, “Modeling opticaltransitions of Er3+(4f11) in C2 and C3i sites in polycrystalline Y2O3,” J. Appl. Phys. 104(2), 023101 (2008).
37. J. B. Gruber, R. P. Leavitt, C. A. Morrison, and N. C. Chang, “Optical spectra, energy levels, and crystal-fieldanalysis of tripositive rare-earth ions in Y2O3. IV. C3i sites,” J. Chem. Phys. 82, 5373–5378 (1985).
38. The intrinsic loss rate (γi) and loss coefficient (αi) are related through the material- and device-dependent groupvelocity (vg): αi = γi/vg.
39. M. J. Weber, “Radiative and multiphonon relaxation of rare-earth ions in Y2O3,” Phys. Rev. 171, 283–291 (1968).40. L. A. Riseberg and M. J. Weber, “Relaxation phenomena in rare-earth luminescence,” in Progress in Optics, vol.
XIV, E. Wolf, ed. (North-Holland, Amsterdam, 1976).41. L. A. Riseberg and H. W. Moos, “Multiphonon orbit-lattice relaxation of excited states of rare-earth ions in
crystals,” Phys. Rev. 174, 429–438 (1968).
(C) 2008 OSA 24 November 2008 / Vol. 16, No. 24 / OPTICS EXPRESS 19650#100542 - $15.00 USD Received 25 Aug 2008; revised 6 Nov 2008; accepted 8 Nov 2008; published 12 Nov 2008

42. G. Schaack and J. A. Koningstein, “Phonon and electronic Raman spectra of cubic rare-earth oxides and isomor-phous yttrium oxide,” J. Opt. Soc. Am. 60, 1110–1115 (1970).
43. L. G. V. Uitert and L. F. Johnson, “Energy transfer between rare-earth ions,” J. Chem. Phys. 44, 3514–3522(1966).
44. D. L. Dexter and J. H. Schulman, “Theory of concentration quenching in inorganic phosphors,” J. Chem. Phys.22, 1063–1070 (1954).
45. W. B. Gandrud and H. W. Moos, “Rare-earth infrared lifetimes and exciton migration rates in trichloride crystals,”J. Chem. Phys. 49, 2170–2182 (1968).
46. M. J. Weber, “Luminescence decay by energy migration and transfer: Observation of diffusion-limited relax-ation,” Phys. Rev. B 4, 2932–2939 (1971).
47. J. P. van der Ziel, L. Kopf, and L. G. Van Uitert, “Quenching of Tb3+ luminescence by direct transfer andmigration in aluminum garnets,” Phys. Rev. B 6, 615–623 (1972).
48. R. J. Birgeneau, “Mechanisms of energy transport between rare-earth ions,” Appl. Phys. Lett. 13, 193–195 (1968).49. E. Okamoto, M. Sekita, and H. Masui, “Energy transfer between Er3+ ions in LaF3,” Phys. Rev. B 11, 5103–5111
(1975).50. N. Nikonorov, A. Przhevuskii, M. Prassas, and D. Jacob, “Experimental determination of the upconversion rate
in erbium-doped silicate glasses,” Appl. Opt. 38, 6284–6291 (1999).51. P. G. Kik and A. Polman, “Cooperative upconversion as the gain-limiting factor in Er doped miniature Al2O3
optical waveguide amplifiers,” J. Appl. Phys. 93, 5008–5012 (2003).52. S. A. Pollack, D. B. Chang, and N. L. Moise, “Upconversion-pumped infrared erbium laser,” J. Appl. Phys. 60,
4077–4086 (1986).53. P. Xie and S. C. Rand, “Continuous-wave, pair-pumped laser,” Opt. Lett. 15, 848–850 (1990).54. P. Xie and S. C. Rand, “Visible cooperative upconversion laser in Er:LiYF4,” Opt. Lett. 17, 1198–1200 (1992).55. M. Borselli, T. J. Johnson, and O. Painter, “Accurate measurement of scattering and absorption loss in micropho-
tonic devices,” Opt. Lett. 32, 2954–2956 (2007).56. K. Srinivasan, O. Painter, A. Stintz, and S. Krishna, “Single quantum dot spectroscopy using a fiber taper
waveguide near-field optic,” Appl. Phys. Lett. 91, 091102 (2007).57. K. Srinivasan and O. Painter, “Optical fiber taper coupling and high-resolution wavelength tuning of microdisk
resonators at cryogenic temperatures,” Appl. Phys. Lett. 90, 031114 (2007).58. C. Zinoni, B. Alloing, C. Monat, V. Zwiller, L. H. Li, A. Fiore, L. Lunghi, A. Gerardino, H. de Riedmatten,
H. Zbinden, and N. Gisin, “Time-resolved and antibunching experiments on single quantum dots at 1300 nm,”Appl. Phys. Lett. 88, 131102 (2006).
59. B. E. Little and S. T. Chu, “Estimating surface-roughness loss and output coupling in microdisk resonators,” Opt.Lett. 21, 1390–1392 (1996).
60. J. E. Heebner, T. C. Bond, and J. S. Kallman, “Generalized formulation for performance degradations due tobending and edge scattering loss in microdisk resonators,” Opt. Express 15, 4452–4473 (2007).
61. H. A. Haus, Waves and Fields in Optoelectronics (Prentice-Hall, Inc., Englewood Cliffs, New Jersey, 1984).62. D. S. Weiss, V. Sandoghdar, J. Hare, V. Lefevre-Seguin, J.-M. Raimond, and S. Haroche, “Splitting of high- Q
Mie modes induced by light backscattering in silica microspheres,” Opt. Lett. 20, 1835–1837 (1995).63. M. L. Gorodetsky, A. D. Pryamikov, and V. S. Ilchenko, “Rayleigh scattering in high-Q microspheres,” J. Opt.
Soc. Am. B 17, 1051–1057 (2000).64. K. Srinivasan and O. Painter, “Mode coupling and cavity-quantum-dot interactions in a fiber-coupled microdisk
cavity,” Phys. Rev. A 75, 023814 (2007).65. S. M. Spillane, T. J. Kippenberg, O. J. Painter, and K. J. Vahala, “Ideality in a fiber-taper-coupled microresonator
system for application to cavity quantum electrodynamics,” Phys. Rev. Lett. 91, 043902 (2003).66. C. P. Michael, K. Srinivasan, T. J. Johnson, O. Painter, K. H. Lee, K. Hennessy, H. Kim, and E. Hu, “Wavelength-
and material-dependent absorption in GaAs and AlGaAs microcavities,” Appl. Phys. Lett. 90, 051108 (2007).67. M. Borselli, K. Srinivasan, P. E. Barclay, and O. Painter, “Rayleigh scattering, mode coupling, and optical loss
in silicon microdisks,” Appl. Phys. Lett. 85, 3693 (2004).68. S. Strauf, K. Hennessy, M. T. Rakher, Y.-S. Choi, A. Badolato, L. C. Andreani, E. L. Hu, P. M. Petroff, and
D. Bouwmeester, “Self-tuned quantum dot gain in photonic crystal lasers,” Phys. Rev. Lett. 96, 127404 (2006).69. The higher order quasi-TE modes have large bending losses (Q < 100) and are poorly phase-matched to the taper
waveguide. Since they cannot be observed in transmission or taper-collected PL, all necessary parameters areobtained through finite element simulations.
70. P. C. Becker, N. A. Olsson, and J. R. Simpson, Erbium-Doped Fiber Amplifiers: Fundementals and Technology,Optics and Photonics (Academic Press, San Diego, 1999).
Significant progress in the last decade has been made developing passive and active siliconoptical components; however, efficient generation of light within a Si platform remains a techni-cal and commercial challenge [1]. Efforts to incorporate Er 3+ into the Si material system, witherbium’s emission in the 1550-nm telecommunications band, have met with limited success.
(C) 2008 OSA 24 November 2008 / Vol. 16, No. 24 / OPTICS EXPRESS 19651#100542 - $15.00 USD Received 25 Aug 2008; revised 6 Nov 2008; accepted 8 Nov 2008; published 12 Nov 2008
Amorphous Er3+-doped glass waveguides on Si provide insufficient gain (<4 dB/cm [2,3]) fordense photonic integration, while doped silicon allotropes are limited by other effects such asAuger recombination [4] and free-carrier absorption [5]. Here we describe the characterizationof stoichiometric single-crystal Er2O3-on-Si (EOS) grown by atomic layer epitaxy. We mea-sure a peak resonant absorption of 364 dB/cm at 1535 nm and negligible background absorption(<3 dB/cm). The observed radiative efficiency from 1520–1650nm is 0.09% with cooperativeupconversion producing strong green and red emission for Er 3+ excitation levels as low as 2%.Further development of EOS as multi-component rare-earth oxides, and their superlattices withSi, may allow for tailored emission spectra, controlled upconversion, and electrically injectedlight emission.
Spurred by the growing power consumption of high-speed electrical interconnects for multi-core processors [6], optical networks have become an attractive option to achieve Tb/s on-chipbandwidth [7]. Following the initial demonstration of silicon waveguide devices [8], there hasbeen significant development in adding optical functionality to silicon microelectronics and,similarly, applying the efficiency and infrastructure of modern CMOS processing to opticaltelecommunication components. While silicon exhibits low loss across the 1300-nm and 1550-nm telecommunication windows, unstrained silicon lacks any significant Pockels coefficientand produces little emission from its 1.1 eV indirect bandgap [1]. Free-carrier dispersion andfour-wave mixing provide some inherent active functionality such as modulation with ratesexceeding 1 GHz [9] and wavelength conversion [10], but considerable research, especiallyconcerning light emission and detection, has focused on integrating silicon with other opticalmaterials such as SiGe [11, 12] and the III-Vs [13, 14]. In this work we describe the growth,processing, and optical properties of single-crystal Er 2O3-on-Si (EOS). Similar to stoichiomet-ric polycrystalline Er3+ materials [15–20], EOS allows for a 100-fold increase in Er 3+ con-centration over conventional Er-doped glasses [21], making it an attractive material for on-chipemission and amplification in the 1550-nm wavelength band. Developed simultaneously foroptoelectronic [22] and high-κ dielectric [23] applications, epitaxially grown Er 2O3 films canbe incorporated into precisely controlled heterostructures and superlattices, which may alsoallow for efficient electrical injection. Oxides incorporating multiple cation species provide ad-ditional flexibility in designing the emission spectrum and dynamics as a number of rare-earthions (Er3+, Yb3+, Nd3+, Dy3+, etc.) are interchangeable in the (RE)2O3 lattice [24–26]. Be-yond application to chip-based optical networks, the strong cooperative upconversion withinthese films may also be used for visible light generation in solid-state lighting and displays andinfrared-to-visible energy conversion in photovolatics.
1. Growth
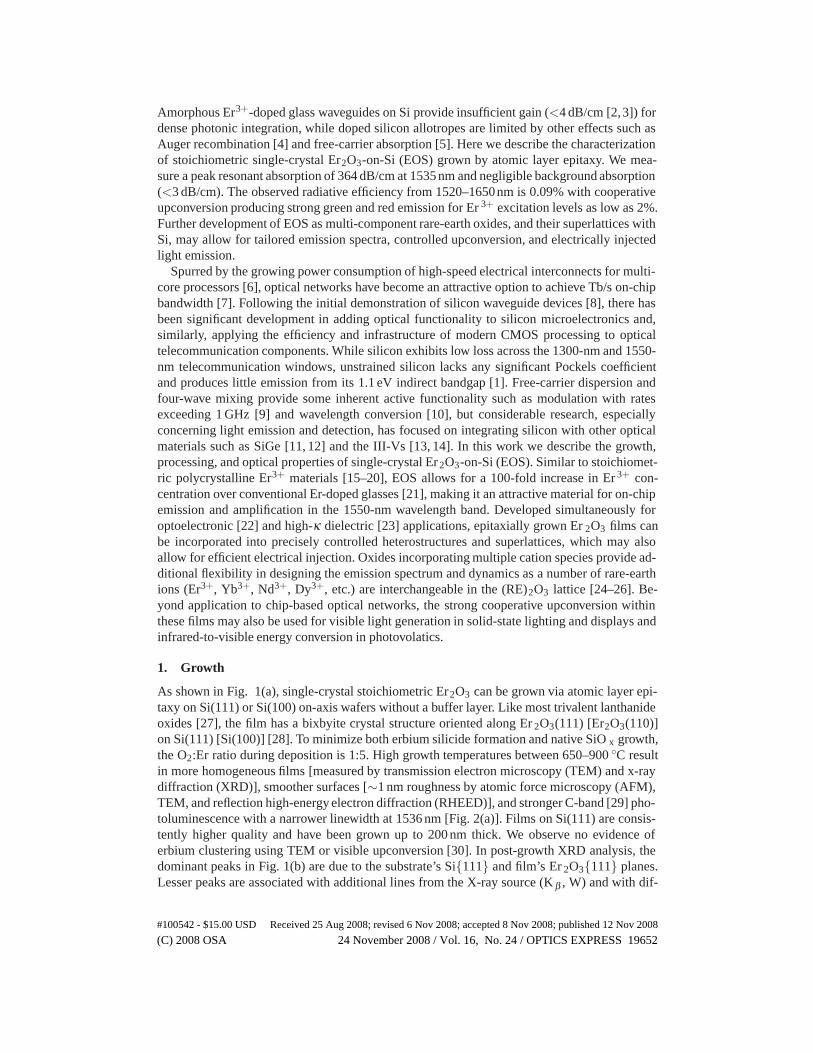
As shown in Fig. 1(a), single-crystal stoichiometric Er2O3 can be grown via atomic layer epi-taxy on Si(111) or Si(100) on-axis wafers without a buffer layer. Like most trivalent lanthanideoxides [27], the film has a bixbyite crystal structure oriented along Er 2O3(111) [Er2O3(110)]on Si(111) [Si(100)] [28]. To minimize both erbium silicide formation and native SiO x growth,the O2:Er ratio during deposition is 1:5. High growth temperatures between 650–900 ◦C resultin more homogeneous films [measured by transmission electron microscopy (TEM) and x-raydiffraction (XRD)], smoother surfaces [∼1 nm roughness by atomic force microscopy (AFM),TEM, and reflection high-energy electron diffraction (RHEED)], and stronger C-band [29] pho-toluminescence with a narrower linewidth at 1536 nm [Fig. 2(a)]. Films on Si(111) are consis-tently higher quality and have been grown up to 200 nm thick. We observe no evidence oferbium clustering using TEM or visible upconversion [30]. In post-growth XRD analysis, thedominant peaks in Fig. 1(b) are due to the substrate’s Si{111} and film’s Er 2O3{111} planes.Lesser peaks are associated with additional lines from the X-ray source (K β , W) and with dif-
(C) 2008 OSA 24 November 2008 / Vol. 16, No. 24 / OPTICS EXPRESS 19652#100542 - $15.00 USD Received 25 Aug 2008; revised 6 Nov 2008; accepted 8 Nov 2008; published 12 Nov 2008

2θ − ω (degrees)
Inte
nsi
ty (c
ou
nts
/sec
)
Si(111) reference Er2O3 on Si(111)
Er2O
3(422
)*
Kβ W
W
Si(1
11)
Si(2
22) Si(3
33)
Er2O
3(222
)
Er2O
3(444
)
Er2O
3(666
)
Er2O
3(211
)*
Er2O
3(442
)*
Er2O
3(822
)*
Er2O
3(844
)*
20 30 40 50 60 70 80 90 100 110102
104
106
108
5 nm(a)
(b)
Er2O3
Si(111)
500 nm(c)
Si(111)
SiNx Er2O3
Kβ
Kβ
2 μm(d)
Si(100)
Er2O3
SiOx
Fig. 1. Er2O3 Growth and Processing. (a) TEM image of Er2O3-Si interface. (b) XRDspectrum for Er2O3 on Si(111) and a reference Si(111) sample; the (�) peaks designatestrained layers (see §A.1). (c) SEM image of Er2O3 microdisk edge prior to the SF6 under-cut. (d) Hybrid Er2O3-Si microdisk (78 nm Er2O3, 188 nm Si, 1 μm SiOx) after the finalHF undercut of the buried oxide.
fraction from minority Er2O3 phases; there is no XRD evidence of erbium silicates or silicidesat the Er2O3-Si interface [23,31]. The {211}, {442}, and {822} families of peaks correspond toslightly strained volumes with surfaces nearly parallel to the dominant (111) surface. Given theEOS films’ homogeneous TEM cross sections and the relative intensities of the secondary XRDpeaks, the minority phases compose a small fraction of the material. In addition to growth ofEr2O3 on Si substrates, we have also demonstrated growth on the top Si device layer of (100)-oriented silicon-on-insulator substrates, as shown in Fig. 1(d).
2. Processing
Chip-based photonics require a number of micron- and sub-micron-scale elements, such aswaveguides and resonators. These resonators can be used to form on-chip lasers and filtersor, as in this work, to sensitively and accurately determine the optical properties of a givenmaterial. Here we are interested in low-loss microdisk cavities in which the light “whispers”around the disk’s periphery—i.e. whispering gallery modes (WGMs). To minimize scattering inthese devices, processing techniques must be developed that produce little surface roughness.At room temperature, we have found Er2O3 is nearly impervious to HF (49% by wt.), KOH(30% by wt.), Piranha, HCl (37% by wt.), and reactive ion etching (RIE) using C 4F8:SF6. At70◦C, concentrated HCl, H2SO4, and KOH etch Er2O3, but they leave ragged edges and appear
(C) 2008 OSA 24 November 2008 / Vol. 16, No. 24 / OPTICS EXPRESS 19653#100542 - $15.00 USD Received 25 Aug 2008; revised 6 Nov 2008; accepted 8 Nov 2008; published 12 Nov 2008

to be slightly anisotropic. Reactive ion dry etching with a Cl2-catalyzed plasma will etch thematerial but not remove it from the surface—droplets of involatile etch byproducts form on thewafer. Because these deposits do not sublimate at process temperatures (≤205 ◦C) but are watersoluble, we believe these droplets are erbium chlorides, which are known to have a low vaporpressure [32]. Rather than chemically etching the Er 2O3 device layer, we use ion milling withhigh Ar+ flux and high DC bias.
To fabricate Er2O3 microdisk resonators, a 400-nm low-stress SiNx hard mask is grown onthe Er2O3-Si wafer by plasma enhanced chemical vapor deposition. The microdisk patterns aredefined using electron-beam lithography and resist reflow [33] and then are transferred to theSiNx using a C4F8:SF6 RIE. We then mill the Er2O3 with an Ar+ plasma. The Ar+ mill exhibitsapproximately 1:1 selectivity with the SiNx hard mask; the resulting side walls [Fig. 1(c)] fea-ture mild striations due to magnification of residual roughness in the EOS. Finally, an isotropicSF6 dry etch simultaneously partially undercuts the silicon substrate and removes the remain-ing SiNx mask. Processing hybrid Er2O3-Si resonators from Er2O3-SOI wafers, as in Fig. 1(d),employs the same SiNx hard mask and Ar+ mill. With the Er2O3 layer acting as a mask, weetch the silicon device layer with an anisotropic C4F8:SF6 RIE and undercut the buried oxidewith concentrated HF. Many samples are prepared to optimize the process parameters at eachstep in order to minimize the microdisk side wall roughness. The measurements described hereconcern ∼150-nm thick Er2O3 on Si(111) and Er2O3 microdisks with a radius of ∼20 μm.
3. Optical properties
Once the SiNx is removed and the disks are undercut, the emission and absorption properties ofEr2O3 are investigated using dimpled fiber taper waveguides [34]. Mounted to a three-axis 50-nm encoded stage, placing the taper in the near field of the disk produces controllable and stablecavity-waveguide coupling. A bank of tunable diode lasers (spanning 963–993nm and 1420–1625 nm, linewidth <300 kHz) were used to characterize the disks’ WGMs and excite the Er 3+
optical transitions. The fiber taper also offers high photoluminescence collection efficiency [35].Once fiber coupled, the pump and emission can be easily demuxed for sensitive pump-probeand pulsed measurements. Extensive details are available in §A.2–A.3.
3.1. 4I13/2→4I15/2 absorption and emission spectra
Since the crystal fields are needed to mix states of opposite parity for electric-dipole transitions,ions on the low-symmetry lattice sites (C2, 24 of 32 sites/unit cell) are optically active whilethe remaining high-symmetry sites (C3i) experience weaker magnetic-dipole transitions [24].To observe the Stark-split structure for the 4I13/2→4I15/2 transitions in this crystalline host,we measure both the room temperature photoluminescence (PL) and absorption spectra. Weobtain the emission spectrum by placing the fiber taper in contact with an undercut part ofthe film and pumping at λ = 981.4 nm. The fiber-collected luminescence [Fig. 2(a)] displayslittle inhomogeneous broadening of the Er 3+ transitions compared to amorphous hosts, andis qualitatively similar to the spectrum reported for polycrystalline Er 2O3 deposited by pulsed-laser ablation [19]. In comparison to large crystals of Er 2O3 and dilute Er-doped Y2O3 producedby flame fusion [24, 36], the low temperature PL spectrum of EOS exhibits more broadening,also shown in Fig. 2(a).
The absorption spectrum can be determined by fitting the low-power intrinsic loss rateof many fundamental WGMs (one radial antinode of the electric field). While this WGM-linewidth method gives a digital rather than continuous spectrum, it involves measuring spectralwidths rather than intensity changes (see §A.3), and coupling losses are insignificant and eas-ily calculated from cavity-waveguide loading. The resulting spectrum [Fig. 2(b)] again reflectsthe weak inhomogeneous broadening of the Er 3+ transitions and qualitatively agrees with the
(C) 2008 OSA 24 November 2008 / Vol. 16, No. 24 / OPTICS EXPRESS 19654#100542 - $15.00 USD Received 25 Aug 2008; revised 6 Nov 2008; accepted 8 Nov 2008; published 12 Nov 2008

0
200
400
600
800
1000
PL
(arb
. un
its)
1420 1440 1460 1480 1500 1520 1540 1560 1580 1600 1620
50100150200250
Ab
sorp
tio
nRa
te (G
Hz)
Wavelength (nm)
0
T = 300 K
T = 8 K(a)
(b)
2.3x10³ 1.3x10⁴
Fig. 2. Emission and absorption spectra. (a) Thin-film PL spectrum at 300 K and 8 K whilepumping at 981 nm. The dominant peaks at 8 K are presented off the scale to make smallerfeatures more visible. Emission is observed for ions on both C2 and C3i sites; the peaksat 1535.8 nm and 1548.6 nm correspond to the transition between the lowest Stark levelsof the 4I13/2 and 4I15/2 manifolds on the C2 and C3i sites, respectively [24, 36, 37]. (b)Composite absorption spectrum. Different color ×’s correspond to the intrinsic linewidthsfor modes of different microdisks; the �’s correspond to absorption peaks inferred fromnon-Lorentzian cavity resonances (see §A.3).
peaks’ positions and widths in the PL spectrum. Accounting for material and modal dispersionwith scattering losses bound at <1% of the peak values, the absorption maxima of 267.0 GHz at1535 nm and 175.4 GHz at 1479 nm correspond to 83.9 cm −1 and 56.2 cm−1, respectively [38].The narrow peaks and low losses in the tails further indicate there is little background ab-sorption, and all 83.9 cm−1 (364 dB/cm) can be attributed to resonant 4I15/2→4I13/2 excitation,which sets a high maximum value for potential gain.
3.2. Upconversion behavior
While the 1450–1650nm band is most useful for hybrid Er 3+-silicon optical networks, upcon-version into visible transitions is also present and has been partly investigated for polycrys-talline EOS [15, 18]. We determine the upconversion spectrum by transferring a small piece(∼2 μm2 × 150 nm) of Er2O3 onto the fiber taper and pumping with <3 mW at 1536.7 nm.The taper-collected PL is then measured in a spectrometer with a silicon CCD camera. The vis-ible PL contains emission from many levels with significant emission near 550 nm and 670 nmand exhibits little inhomogeneous broadening, as in Fig. 2(a). The pump-power dependence[Fig. 3(c)] of the three primary upconversion bands provides insight into the specific upconver-sion mechanism [Fig. 3(d)]. The nearly quadratic dependence of the 800 nm emission suggestspair-wise upconversion out of the 4I13/2 multiplet followed by excited-state absorption or asecond upconversion event (4I9/2 + 4I13/2→2H11/2) to produce the nearly cubic dependence at550 nm and 670 nm. Subsequent absorption or energy transfer then connects 2H11/2/4S3/2 toeven higher levels with energies in the near UV.
3.3. Effective 4I13/2 lifetime
Depopulation of 4I13/2 by cooperative upconversion adds an additional complication tomeasuring the 4I13/2 → 4I15/2 lifetime. To mitigate the upconversion effects, fluorescence de-
(C) 2008 OSA 24 November 2008 / Vol. 16, No. 24 / OPTICS EXPRESS 19655#100542 - $15.00 USD Received 25 Aug 2008; revised 6 Nov 2008; accepted 8 Nov 2008; published 12 Nov 2008

300 350 400 450 500 550 6000
10
20
30
650 700 750 800 850 900 950 10000
5
10
15
Wavelength (nm)
Co
un
t Ra
te (1
03 /s)
10-2 10-1
Pump Power (mW)
Integ
rated C
ou
nt Rate (arb
. un
its)
100
102
103
104
105
106
107
550 nm670 nm800 nm
(c) (d)
pairwisecooperative
upconversion
excited stateabsorption
orsecond
upconversion
4I15/2
4I13/2
4I11/2
4I9/2
4F9/2
2H11/24S3/2(a)
4I11/24I9/2
4F9/2
(b) x1 x25 x200
40
20
2H11/2 & 4S3/2
4F7/24F5/2
2H9/24G11/2
2K13/2
x100 x50 x1
2G5/2
2P1/24G7/22D5/2
∝P2.62
∝P2.74
∝P1.84
x1
x1
x100
Fig. 3. Upconversion behavior. (a,b) Fiber-taper collected Er2O3 upconversion spectrumwhile pumping at 1536.7 nm; spectroscopic identifications are made by comparison toknown Er3+ transitions back to 4I15/2 [24]. NB: the scale is varied across the spectrumto make weaker transitions more visible. The relative intensities in (a,b) may not reflectthe actual strength of each transition because we are unable to correct for the unknowntaper collection efficiency across the visible range. (c) Pump-power dependence for the in-tegrated PL in the 550 nm, 670 nm, and 800 nm bands. The data sets are offset verticallyfor clarity. (d) Proposed upconversion path.
cay measurements are performed by uniformly exciting a fundamental WGM at 1473.4 nmwith 10-ns square pulses and a peak absorbed power of 21.7 μW. Because of the weak PLsignal, we apply a pulse-delay technique and a single photon counter to sample the C/L-bandfluorescence decay curve [Fig. 4]. To reduce dark counts, InGaAs/InP avalanche photodiodes(APDs) are only gated above the breakdown voltage for a short time (∼50 ns), which is notsuitable for decay curves with 10−6–10−2 s lifetimes. To circumvent the APD’s narrow gatewidth, we use the 50-ns window to discretely sample the decay curve. Centering the arrival ofa pump pulse in the detection window simultaneously acquires the PL’s rise and initial decaydue to the Nth pulse along with the decay associated with the (N −1)th pulse. The appearanceof the Nth pulse serves as a marker for sampling the (N−1)th decay curve at a fixed delay—i.e.the pulse period separates the (N − 1)th peak from its tail just before the Nth pulse. Severalhistograms (128 ps/bin resolution) with varying delays are used to construct the fluorescencedecay in Fig. 4. As the pulse period approaches the PL lifetime, the data deviates from a singleexponential curve because decay from multiple pulses contributes to the PL tail prior to the N th
pulse’s arrival. Data at longer periods is limited by a constant noise floor linked to the smallportion of pump laser spontaneous emission that is not blocked by the filters. For τ eff ≈ 10 μs,probabilistic simulation suggests that a fitting region of 10–20 μs gives the greatest confidenceunbiased estimate of the decay lifetime. Fitting the points in this range gives an effective life-time of 5.7±0.9 μs for a peak excitation of 21.7 μW and ±2σ uncertainty. With the effectivelifetime much lower than the measured 8±0.5 ms (7.8±2.2 ms calculated) radiative lifetime inlightly Er3+-doped bulk Y2O3 [39], nonradiative relaxation is a major concern.
The nonradiative decay of rare-earth ions was extensively investigated during the early devel-opment of inorganic gain crystals for solid-state lasers, and accurate phenomenological modelshave been established to describe the two principal mechanisms: multiphonon relaxation andcooperative relaxation (also known as concentration quenching) [40]. For multiphonon emis-sion, the high yield of the 4I13/2→4I15/2 transition in low Er3+-density samples is because the0.8 eV (6500 cm−1) energy gap is too large for fast depopulation. Using parameters from Er 3+
(C) 2008 OSA 24 November 2008 / Vol. 16, No. 24 / OPTICS EXPRESS 19656#100542 - $15.00 USD Received 25 Aug 2008; revised 6 Nov 2008; accepted 8 Nov 2008; published 12 Nov 2008

101
Co
un
t Ra
te (H
z/b
in)
Pump Pulse Period (µs)
100
10-1
−20 −10 0 10 20 300
4
8
Time (ns)
0 5 10 15 20 25 30 35
Nth pulse(N -1)th decay Nth decay
Co
un
t Ra
te
Fig. 4. Measurement of 4I13/2 lifetime. Pulse period measurement of the lifetime for C/L-band emission. Fitting the data in the shaded area gives a lifetime of 5.7±0.9 μs; this un-certainty and the dashed curves mark ±2σ confidence for the fit. Inset: sample histogramfor a pulse period of 9.89 μs (101.1 kHz repetition rate).
relaxation in Y2O3 at low temperature [39, 41] and the close similarity of the Er 2O3 and Y2O3
vibrational spectra [42], we estimate an effective lifetime of 4.2 s for relaxation at 300 K viaemission of 12 phonons (∼550 cm−1). Cooperative relaxation encompasses several decay andsensitizing mechanisms where the excitation is nonradiatively transfered between ions throughmultipole or exchange interactions—we will limit the discussion to processes involving a sin-gle ion species. Self-quenching, where a donor ion decays to an intermediate level by excitinga low-level transition in another, is significant for higher levels in Er 3+ (e.g. 4S3/2) [43], but itis inactive for the first excited level (4I13/2). The most probable relaxation path in Er2O3 is theloss of energy to quenching (acceptor) sites either from direct transfer or from resonant exci-tation migration through multiple ions [44]. Acceptors are usually nonluminescent impurities(1–10 ppm of Fe, W, and Re and >10 ppm of Ta are present in the erbium source, impuritylevels in the final Er2O3 films are unknown) and/or perturbed electronic states near surfaces ordislocations. At time scales shorter than the radiative lifetime in high purity crystals at 300 K,diffusion via electric dipole-dipole interactions becomes extremely rapid and >10 5 transfersare possible before reaching an acceptor [45,46]. Although transfer through (Y 1−xTbx)3Al5O12
(0.1 ≤ x ≤ 1.0) was consistent with dipole-dipole coupling [47], high donor concentrations, asin Er2O3, may further the increase migration rate through short-range exchange and/or electricquadrupole-quadrupole interactions [48]. This transfer rate and the nonradiative relaxation canbe slowed by increasing the mean Er–Er separation. Assuming the decay is diffusion-limiteddue to a low density of acceptors and conservatively assuming dipole-dipole interactions, thenonradiative decay rate is proportional to the Er 3+ concentration [46, 49].
3.4. Power-dependent radiative efficiency
The C/L-band radiative efficiency (ηobs) for emission into the observed WGMs can be accu-rately determined by integrating the collected PL, correcting for collection losses, and dividingby the absorbed CW power (see §A.4). We analyze the power-dependence of η obs for several
(C) 2008 OSA 24 November 2008 / Vol. 16, No. 24 / OPTICS EXPRESS 19657#100542 - $15.00 USD Received 25 Aug 2008; revised 6 Nov 2008; accepted 8 Nov 2008; published 12 Nov 2008

5x10⁻⁵
Absorbed Power (W)
Ob
serv
ed C
avit
y Ef
ficie
ncy
(ηo
bs)
10-5
10-9 10-8 10-7 10-6 10-5 10-4 10-3 10-2
observed ≈ 3.4x10⁻⁵
Overall Efficien
cy (ηscl )
2x10⁻⁴
overall ≈ 9.0x10⁻⁴
taper
Er2O3 disk edgeSi pedestal edge
10-3
10 µm
Fig. 5. Radiative efficiency of the 4I13/2 → 4I15/2 transition vs. absorbed pump power.The marker color indicates the pump-mode wavelength from blue (1460.9 nm) to dark red(1494.5 nm) while (◦) and (+) designate first- and second-order radial pump modes, re-spectively. Black markers represent data from devices on another wafer processed withwet chemical etching and using first- and second-order pump modes (spanning 1437.6–1490.9 nm). The inset shows green upconverted luminescence from a fundamental cavitymode.
pump modes across the S-band on two different samples. In Fig. 5, η obs decreases as upcon-version becomes the dominant path for depopulating 4I13/2; at 204±47 μW there are equalrates for nonradiative relaxation and cooperative upconversion. We use the pump power depen-dence of ηobs and the 5.7±0.9 μs fitted lifetime to give a zero-power effective 4I13/2 lifetime ofτo = 7.2±1.2 μs. Since the radiative lifetime (τrad) in these Er2O3 films should be very similarto the 8 ms lifetime in Y2O3 [39], τo can be related to the overall emission efficiency acrossthe S/C/L-bands (ηscl) and the observed spontaneous emission coupling-factor (β obs) for thechosen cavity resonances:
τo/τrad = ηscl = ηobs/βobs. (1)
With τo = 8 ms and ηobs = 3.4×10⁻⁵, we find ηscl = 9.0×10⁻⁴ and βobs = 0.038, which isconsistent with estimates of βobs based on the cavity mode spectrum and negligible Purcellenhancement of τrad (see §A.5). Finally, at 204 μW, upconversion reduces the lifetime to τ eff =12 τo and gives ∼3×10²⁰ ions/cm3 in 4I13/2. Based on the more rigorous analysis of Nikonorovet al. [50], we estimate the cooperative upconversion coefficient (C up) to be
Cup =2hcV
λpτ2o Pup
= (5.1±2.1)×10−16 cm3/s, (2)
where V = 20.1 μm3 is the volume of Er2O3 excited by the cavity mode, λp ≈ 1480 nm is thepump wavelength, and Pup = 204±47 μW is the power when the nonradiative and upconversionrates are equal. This upconversion coefficient is extremely large and similar to that found in co-sputtered Er2O3/Al2O3 [51].
4. Conclusions
Due to upconversion and nonradiative relaxation, rate equation estimates suggest significantpower is required to invert the 4I15/2 manifold in these 20-μm microdisk cavities (see §A.6).
(C) 2008 OSA 24 November 2008 / Vol. 16, No. 24 / OPTICS EXPRESS 19658#100542 - $15.00 USD Received 25 Aug 2008; revised 6 Nov 2008; accepted 8 Nov 2008; published 12 Nov 2008

Since the large upconversion rate prevents transparency in the C-band until most of the electronsare sequestered in higher states, individual upper levels (e.g. 2H11/2) may be the first to invertrelative to the ground state, making Er2O3 upconversion green lasers a possibility [52–54].EOS might also be developed into an incoherent visible emitter—rough estimates based on thecamera’s sensitivity give a green radiative efficiency on the order of 5% for an absorbed powerdensity of 0.15 mW/μm3. Additionally, we are investigating the potential of Er2O3 to upconvertinfrared radiation into the visible spectrum for use in multijunction silicon solar cells.
To achieve technological maturity for its original application to waveguide amplifiers andlasers for on-chip optical networks, we are working to address the material’s optical inefficien-cies (upconversion and nonradiative relaxation) and to develop methods for electrical injection.We are exploring the growth of ternary alloys with Y and Gd to slow the upconversion andnonradiative processes by increasing the inter-ion separation—e.g. (Y 0.9Er0.1)2O3 may exhibitresonant absorption on the order of 36 dB/cm with significantly improved C/L-band radiativeefficiency. Detailed studies (as in Ref. [49]) of high quality Er 2O3 and (Y1−xErx)2O3 films willbe necessary to characterize the energy migration and quenching sites, but this information isnecessary to optimize the Er3+ concentration for performance of on-chip amplifiers (gain, effi-ciency, etc.). We are also working to grow (RE)2O3-Si superlattices and to determine how theEr3+ 4 f -levels align relative to the Si bands. As in III-V systems, high quality epitaxy will be-come crucial in controlling the material’s structure and optical properties while moving towardCMOS-compatible electroluminescence and photodetection.
A. Appendix
This document contains details for (A.1) x-ray diffraction analysis, (A.2) fiber-taper measure-ments of microdisk cavity transmission and photoluminescence while (de)muxing the pumpand emission wavelengths, (A.3) fitting cavity loss rates and non-Lorentzian resonances, (A.4)determining the radiative efficiency for cavity-mode coupled emission using measured para-meters, (A.5) estimating the ratio of free-space and cavity-coupled emission, and (A.6) our toythree-state rate equation model.
A.1. X-ray diffraction analysis
We employ two configurations for XRD analysis using a standard Cu K α source: (1) a lowangular resolution configuration that is sensitive to more material phases and (2) a high angularresolution configuration. The low-resolution setup utilizes a mirror to provide a wider angulardivergence and higher intensity (shorter integration times) for the X-rays. With the 〈110〉 waferflat of the Si(111) substrate 30◦ misaligned from the X-ray beam, this measurement is sensitiveto more secondary material phases as in Fig. 1(b). The high resolution setup aligns the wafer flatparallel to the X-ray beam and uses a monochromator to narrow the beam’s angular divergence.High-resolution XRD spectra only include the Si{111} and Er 2O3{111} peaks.
A.2. Experimental setups for taper-based measurements
All the major optical measurements in this work are diagramed in Fig. 6. While these configu-rations are fairly self-evident, there are a few points that may need clarification.
• Two complementary VOAs are used to maintain a constant optical power at the pho-todetector (to give a constant electronic noise level) while the power at the device canbe varied over 60 dB [55]. To avoid any nonlinear effects or absorption saturation whileacquiring transmission spectra, the lasers are usually attenuated to give ∼200 nW at thetaper, of which ∼10% is coupled into the microdisk cavity.
• We employ a fiber-based MZI for sub-picometer calibration of narrow cavity linewidths.
(C) 2008 OSA 24 November 2008 / Vol. 16, No. 24 / OPTICS EXPRESS 19659#100542 - $15.00 USD Received 25 Aug 2008; revised 6 Nov 2008; accepted 8 Nov 2008; published 12 Nov 2008

1420-1495 nm Tunable Laser
1495-1565 nm Tunable Laser
1565-1625 nm Tunable Laser
VOA FPC
Disk
Taper PDTrans
PDRef
10%
VOA10 : 90splitter
MZ I
Visible Spectrometer
Si CCD
(a)
OSA
1420-1495 nm Tunable Laser
FPC
Disk
Taper PDTrans
VOAVOA
CM
R
P
SPF
CM
R
P
LPF
CM
R
P
LPF
IR Spectrometer
InGaAsCCD
(b)
OSA
1420-1495 nm Tunable Laser
FPC
Disk
Taper
VOA
CM
R
P
SPF
CM
R
P
LPF
CM
R
P
LPF
FPC EOM
10 : 90splitter
DCA10%
Histogrammer
1
0
Pulse GeneratorSYNC OUT
VariableDelay APD
(c)
Fig. 6. Testing arrangements for measuring (a) cavity transmission spectra and vis-ible upconversion, (b) C/L-band photoluminescence and radiative efficiency, and (c)4I13/2→4I15/2 effective lifetime. Abbreviations: variable optical attenuator (VOA), fiberpolarization controller (FPC), Mach-Zehnder interferometer (MZI), photodetector (PD),short-pass filter (SPF, pass 1460–1500 nm, reflect 1527–1610 nm), long-pass filter (LPF,pass 1527–1610 nm, reflect 1455–1500 nm), optical spectrum analyzer (OSA), digital com-munications analyzer (DCA), electro-optic modulator (EOM), and InGaAs/InP avalanchephotodiode (APD). Black lines represent optical fiber; blue lines designate coaxial cable.Dashed lines correspond to alternative connections.
(C) 2008 OSA 24 November 2008 / Vol. 16, No. 24 / OPTICS EXPRESS 19660#100542 - $15.00 USD Received 25 Aug 2008; revised 6 Nov 2008; accepted 8 Nov 2008; published 12 Nov 2008

• A fourth laser (spanning 1480–1580nm) is used to study any resonances at the bound-aries of the primary lasers’ sweep ranges (i.e. near 1495 nm and 1565 nm).
• Utilizing wide band-pass filters, S-band transmission and C/L-band emission can be ob-served simultaneously [Fig. 6(b)]—all cavity-based PL measurements are pumped onresonance with a WGM. The long-pass and short-pass filters separate their pass bands(P ↔ CM ports) and reflection bands (R ↔ CM ports) with high directivity (>55 dB)and low insertion loss (<1 dB). By collecting and filtering PL in the cavity’s “reflec-tion” channel, we achieve >100 dB isolation at the pump wavelength. Some residualspontaneous emission from the laser diode does bleed through the filters and produces a∼10 pW signal at 1519 nm with our pump near maximum power.
• Previous work has demonstrated that the total collection efficiency for the taperwaveguide and WGMs is on the order of 10% [35]. While in contact with unpatternedundercut films, the taper collects ∼0.1% [56]. We use an optical spectrum analyzer tomeasure the PL at peak powers �10 pW and a spectrometer with a liquid-N 2 cooledInGaAs detector array at lower powers.
• For cryogenic experiments, the fiber-taper waveguide and the sample are mounted onpiezo-electric stages within a continuous flow 4He cryostat [57].
• During pulsed emission measurements in Fig. 6(c), two polarization controllers areneeded to independently match the polarizations of the EOM and the cavity resonance.To optimize the modulator bias voltage and input polarization, we constantly monitorour extinction ratio (>35 dB) and pulse shape (square pulse, 100 ps rise time, 120 ps falltime) with an OSA and a DCA.
• A variable electronic delay is necessary to synchronize the APD with the arrival of thePL pulse and to avoid effects associated with ringing in the gate voltage as in Ref. [58].
A.3. Cavity mode spectra and lineshapes
The whispering gallery mode spectrum for microdisk optical resonators can be modeled semi-analytically using an effective index approximation [33, 59, 60] or numerically using finite-element simulations. A radius of ∼20 μm and thickness of 150 nm are chosen to give minimalbending loss across the S/C/L-bands and well separated first- and second-order radial modes,as in Fig. 7(a). Conveniently, these cavity modes and the taper waveguide are almost phasematched, which gives near critical coupling for a wide range (1450–1560nm) when the taperis placed in contact with the disk edge. The shallower transmission features near 1535 nm and1549 nm are attributed to single-pass absorption in the waveguide-cavity coupling region.
The cavity-waveguide coupling is commonly described using coupled mode theory [61].Since the Er3+ absorption dominates coherent backscattering [62, 63], we restrict our analysisto a single traveling-wave whispering gallery mode. Adopting the phase convention of Ref. [64],the equation of motion for the clock-wise mode amplitude a cw is
ddt
acw = −iΔωacw − 12(γi + γe)acw + κs (3)
where Δω = ω −ω0 is the detuning; γi = γa + γss + γrad+. . . is the intrinsic power loss ratedue to the sum of losses from absorption (γa), surface scattering (γss), radiation (γrad), etc.; γe
is the extrinsic coupling rate to the waveguide; and s is the amplitude of the waveguide field.The intrinsic and loaded cavity quality factor (Qi and Ql) are given by ω0/γi and ω0/(γi + γe),respectively. Under a weak coupling approximation, time reversal symmetry and conservation
(C) 2008 OSA 24 November 2008 / Vol. 16, No. 24 / OPTICS EXPRESS 19661#100542 - $15.00 USD Received 25 Aug 2008; revised 6 Nov 2008; accepted 8 Nov 2008; published 12 Nov 2008

1440 1460 1480 1500 1520 1540 1560 1580 1600 1620N
orm
. Tra
ns.
Wavelength (nm)
1.0
0.8
0.6
0.4
0.2
0.0
1620.775 1620.875 1620.9750.880.900.920.940.960.981.00
Wavelength (nm)
No
rm. T
ran
s.
δλ = 22.17 pm
Qi = 73,100
γi = 2.53 GHzγe = 0.072 GHz
1461.5 1462.5 1463.5 1464.50.80
0.84
0.88
0.92
0.96
1.00
Wavelength (nm)
0
100
200
300
Ab
sorp
tion
Rate (GH
z)
No
rm. T
ran
s.
Peak = 203 GHzFWHM = 1.97 nm
(a)
(b)
(c)
1420
Fig. 7. (a) Microdisk transmission spectrum for quasi-TE modes; the fundamental radial-order WGMs are highlighted (grey). (b) Sample Lorentzian fit. (c) Sample non-Lorentzianfit (solid line) of an asymmetric cavity resonance. The inferred absorption peak and aLorentzian fit (dashed line) to the same data are also included.
of power require the coupling coefficient (κ) to satisfy κ = i√γe. Ignoring any parasitic load-
ing [65], the normalized cavity-waveguide transmission (Tcav) in steady state is
Tcav =∣∣∣∣1+ i
√γe
(acw
s
)∣∣∣∣
2
=∣∣∣∣1− γe
iΔω + 12 (γi + γe)
∣∣∣∣
2
. (4)
To obtain the best estimate for γi, we weakly load the cavity (∼10% contrast) and fit the datawith Eq. (4) to find {ω0,γi,γe}, as in Fig. 7. For a fixed taper position, WGMs across theS/C/L bands exhibit different coupling depths because of the Er 3+ absorption spectrum. Onthe edges of the absorption band (near 1420 nm and 1620 nm), γ i � γe, and the resonances aresignificantly over coupled. In the center of the band, γ i ≈ γe, and the modes are near criticalcoupling.
Since there are several loss mechanisms that contribute to γ i, radiation and surface scatteringlosses must be accounted for when using cavity modes to determine the absorption spectrum(similar to [66]). By choosing appropriate cavity dimensions, the calculated γ rad is negligiblefor the fundamental modes: γrad < 82 MHz = 0.026 cm−1. Since Rayleigh scattering increasestowards longer wavelengths [59,67], scattering losses can be bounded as less than the minimumintrinsic loss rate near 1625 nm: γss � min(γi) = 2.5 GHz = 0.79 cm−1. This 2.5 GHz likelyhas a small absorption component as 4I13/2→4I15/2 emission into WGMs is observed out to∼1660 nm. Therefore scattering accounts for less than 1% of the peaks, and γ i ≈ γa except inthe spectral tails. The second-order microdisk resonances exhibit slightly greater γ i’s due tomode coupling between the Er2O3 WGMs and the lossy WGMs of the Si pedestal. Because weare unable to bound this additional loss rate, the second-order modes are not used to establishthe 4I15/2→4I13/2 absorption spectrum.
Due to the small inhomogeneous broadening of the Er 3+ transitions, it is possible for anunderlying absorption peak to change appreciably across a cavity linewidth. In this case, theresulting non-Lorentzian cavity resonance can be fit [Fig. 7(c)] using Eq. (4) and including a
(C) 2008 OSA 24 November 2008 / Vol. 16, No. 24 / OPTICS EXPRESS 19662#100542 - $15.00 USD Received 25 Aug 2008; revised 6 Nov 2008; accepted 8 Nov 2008; published 12 Nov 2008
Lorentzian absorption profile
γi ≈ γa(ω) =γ0(δωa/2)2
(ω −ωa)2 +(δωa/2)2 (5)
where ωa, δωa, and γ0 are the center, full width at half-maximum, and amplitude of the ab-sorption peak. For the observed resonances, it has been unnecessary to include the absorptionpeak’s effect on the real part of the refractive index through the Kramers-Kronig relation. Theinferred absorption peaks from fitting these asymmetric resonances around 1457.3, 1462.8,1478.8, 1545.6, and 1556.9 nm agree well with the data from nearby Lorentzian resonances.
A.4. Radiative efficiency measurement
Because the fiber taper offers adjustable waveguide coupling and a low-loss method for PLexcitation and collection [35], the efficiency for emission into the cavity modes can be empiri-cally determined. The cavity-coupled radiative efficiency (η obs) is given by the ratio of the totalpower emitted into the cavity modes divided by the absorbed pump power. This measurementrequires careful characterization of the pump mode along with all modes in the desired emis-sion band. For these c-Er2O3 microdisks, surface scattering and radiation losses are negligiblecompared to the Er3+ absorption, and the absorbed power (Pa) is nearly equal to the droppedpower (Pd)
Pa =γa
γiPd ≈ Pd = (1−Tcav)
Pin√Tt
(6)
where Tcav is the cavity-waveguide transmission at the pump wavelength, Tt is the end-to-endfiber taper transmission, and Pin is the pump power measured at the fiber taper input. Equa-tion (6) assumes the taper’s loss is symmetric about the taper-device coupling region. Whiletransmission loss in fiber tapers is usually dominated by bending loss in the taper mount whichis symmetric about the coupling region, small bits of dust on the taper will scatter light from thefundamental mode and produce asymmetric loss. In this case,
√Tt is replaced by the one-sided
waveguide transmission (T1), which can be found from Tt and the ratio of another quantity thatdepends on Pd (e.g. thermo-optic wavelength shift, peak PL yield, etc.) when using either endof the waveguide as the input. For these measurements, Tt = 0.68 with symmetric losses. Usingthe collected emission [P(λ )] spectrum as in Fig. 8, the total power emitted into the cavitymodes (Pcav) is given by
Pcav =2
δλrbw√
Tt
[
∑n
(γi,n + γe,n
γe,n
)∫
Pn(λ )Tf(λ )
dλ]
(7)
where the summation is over the cavity modes at λ > 1520 nm and δλ rbw is the resolutionbandwidth of the detector. The factor of 2 compensates for equal emission into the degenerateclockwise and counter-clockwise traveling-wave modes of the disk and hence into the forwardand backward propagating modes of the waveguide. While the C/L-band transmission [T f(λ )]is fairly flat for the filters used to (de)mux the PL and the pump beam, the transmission doesslowly decrease at longer wavelengths. In the emission band, Tt = 0.66 with symmetric loss.To establish and correct for the fraction of the PL in the WGMs that is collected by the taper,we find the total cavity loss rate for each cavity mode in the emission band by measuring theγi,n under weak loading and γe,n at the fixed taper position used during PL collection. Then thefraction of Pcav coupled into the forward propagating mode is the ratio of the loss rate into thewaveguide (γe,n) over the loss rate into all channels (γ i,n + γe,n), which gives a correction factorof (γi,n + γe,n)/γe,n. Since the ratio of the intensity of individual WGMs over the total emittedpower is constant at Pd � 4 mW, the total integrated PL is proportional to the intensity of the
(C) 2008 OSA 24 November 2008 / Vol. 16, No. 24 / OPTICS EXPRESS 19663#100542 - $15.00 USD Received 25 Aug 2008; revised 6 Nov 2008; accepted 8 Nov 2008; published 12 Nov 2008

Wavelength (nm)C
olle
cted
PL
(pW
)1520 1540 1560 1580 1600 1620 1640 1660 1680 17000
80
120
160
40
200
Pump Mode:1st order2nd order
Fig. 8. Observed cavity-coupled photoluminescence spectrum for the device in Fig. 7(a);the fundamental WGMs are highlighted (grey).
strongest emission line. Using this proportionality, the radiative efficiency measurement can beextended to excitation levels low enough that the largest PL peak is just above the noise floor.
A.5. β -factor calculation
In laser physics, the β -factor is the ratio near the lasing threshold of the spontaneous emissioninto the lasing mode to the emission into all modes, and it can range from 10 −6–10−5 for largegas lasers to nearly 100 for few quantum-dot microcavity lasers [68]. In this work, we modifythis definition so β is the ratio of emitted power into a chosen subset of modes (P ′
c,T ) over thetotal power emitted into free-space (Pf s,T ) and cavity modes (Pc,T ):
β =P′
c,T
Pf s,T +Pc,T. (8)
From Fermi’s Golden rule, the total emitted power (PT ) in a given spectral range is approxi-mately
PT =2π�
∫
ρ f∣∣〈ψ f |Hint |ψi〉
∣∣2
NEr�ωidωi (9)
where ρ f is the density of final states and NEr is the number of excited Er3+ ions. We expressthe final density of states as a product of the density of electronic states (ρ e) per energy perion and the density of emission modes (ρm) per unit frequency. Using a semiclassical electric-dipole interaction Hint = −q�E ·�r and averaging over all polarizations and wave vectors for afixed dipole orientation, PT can be expressed as
PT =2π3�
∫
ρ f∣∣〈�E(ωi)〉
∣∣2∣∣�μ(ωi)
∣∣2
NEr�ωidωi (10)
where 〈�E(ωi)〉 is the time-averaged electric-field strength per emitted photon and �μ(ωi) =−q〈ψ f |�x|ψi〉 is the |ψi〉→|ψ f 〉 transition’s dipole moment. For emission into free-space modes,ρm and 〈�E(ωi)〉 are given by
ρm = ρ f s(ωi) =Vbω2
i n3
π2c3 (11)
|〈�E(ωi)〉| =√
�ωi
2n2εoVb(12)
where Vb is the volume of the “box” containing the free-space modes and n ≈ 2.0 is therefractive index of Er2O3. Since Eq. (10) for the free-space modes is proportional to the
(C) 2008 OSA 24 November 2008 / Vol. 16, No. 24 / OPTICS EXPRESS 19664#100542 - $15.00 USD Received 25 Aug 2008; revised 6 Nov 2008; accepted 8 Nov 2008; published 12 Nov 2008

measured photoluminescence spectrum from the unpatterned film, the spectral dependence ofρe(ωi)|�μ(ωi)|2 is known without obtaining its explicit form.
For emission into the microdisk cavity modes, ρm is
ρm = ρc(ωi) = ∑j
2L(ωi,ω j,δω j) (13)
where L(ωi,ω j,δω j) is a lorentzian with a center at the jth cavity mode (ω j) and full-width athalf-max (δω j) given by the mode’s loaded linewidth (γ e + γi); L(ωi,ω j,δω j) is normalizedsuch that
∫ +∞−∞ L(ωi)dωi = 1. The factor of 2 accounts for the degenerate clockwise and counter-
clockwise traveling wave modes. Since the cavity field is not spatially uniform, the average fieldstrength per photon in the jth cavity mode experienced by the ions is
|〈�E(ωi)〉 j| =√
�ωiϑ j
2n2εoVc, j(14)
where Vc, j is the cavity mode volume and ϑ j accounts for the overlap between the j th emissionmode and the distribution of excited ions. Because the excited ion distribution depends on theintensity of the pump mode and Eq. (10) includes |〈�E(ωi)〉 j|2, ϑ j is a scalar integral over thecavity volume
ϑ j =∫ |�Ej|2|�Ep|2dV
max(|�Ej|2)∫ |�Ep|2dV
(15)
with the field components of the pump mode (�Ep) and jth emission mode (�Ej) computed withfinite-element models.
Using the thin film PL data and the cavity mode parameters, the β -factor can be calculated forany individual or collection of modes. While Pc,T in Eq. (8) includes a summation over all cavitymodes (both observed and unobserved [69]), the ϑ j/Vc, j factor heavily weights the contributionof the modes with low radial order. In this analysis we include the quasi-TE modes of the first8 radial families; the quasi-TM modes are poorly confined and have little overlap with theEr3+ ions. For first and second radial-order emission modes at λ > 1520 nm as in the radiativeefficiency measurement, we estimate βobs = 0.091 which is in reasonable agreement with theexperimental value of 0.038. Increasing the sum to include all observed modes across the S/C/L-bands (Fig. 7) gives β12 = 0.127. By including all the cavity modes in P ′
c,T , βT = 0.227 is thefraction of the total 4I13/2→4I15/2 photoluminescence that is emitted into the microdisk WGMs.
A.6. Three-state rate equation model
To model the upconversion and nonradiative relaxations of the 4I13/2 population, we solve athree-state system of rate equations in the steady state:
N1 = NEr −N2 −N3 (16)dN2
dt= −N2
τo−CupN2
2 + sΦ(N1 − rN2) (17)
dN3
dt= −N3
τo+
12
CupN22 . (18)
The populations {N1,N2,N3} represent densities for ions in the {4I15/2,4I13/2,
4I9/2} states,respectively; higher states are neglected because we lack reasonable estimates for the ap-propriate upconversion and/or excited-state absorption coefficients. For simplicity, the Stark-split structure for all levels is ignored. The total ion density on C2 lattice sites (NEr) is
(C) 2008 OSA 24 November 2008 / Vol. 16, No. 24 / OPTICS EXPRESS 19665#100542 - $15.00 USD Received 25 Aug 2008; revised 6 Nov 2008; accepted 8 Nov 2008; published 12 Nov 2008

2.0×1022 cm−3, and we use our estimated value for the cooperative upconversion coefficientCup = 5.1×10⁻¹⁶ cm−3/s. We assume the 4I13/2 and 4I9/2 lifetimes are approximately equal(τo = 7.2 μs) because both transitions to the ground state are dipole forbidden and likely sub-ject to similar nonradiative relaxation—spontaneous and stimulated emission are both excludedfrom this analysis. The pump photon flux within the cavity is given by Φ, and r is the ratio ofthe emission and absorption cross sections at the pump wavelength. For Er 3+-doped silica,r ≈ 1/3 at 1480 nm [70]. The adjustable parameter s = 2.5×10⁻¹² encompasses a number offactors including the value of the absorption cross section; it is set to give N2 ≈ 2.0×1020 cm−3
at Pd = 204 μW—corresponding to the inferred values from our radiative efficiency measure-ments. This model for the Er3+ transitions is then applied to a microdisk cavity (20-μm radius,20.1-μm3 active volume).
Solutions to these rate equations give only a rough estimate for the pump powers atwhich N2 ≈ N3 and at which these transitions near transparency. By Pd ≈ 0.6 mW, thereare ∼5×10²⁰ ions/cm3 in both the 4I13/2 and 4I9/2 levels. These microdisks approach trans-parency for 4I9/2→4I15/2 (λ ≈ 800 nm) and 4I13/2→4I15/2 (λ ≈ 1480 nm) with pump pow-ers of Pd ≈ 18 mW and Pd ≈ 130 mW, respectively. To more accurately represent the sys-tem, this model should, at least, include higher energy levels. Since the upconverted lumi-nescence is most intense around λ ≈ 550 nm, the combined upconversion-emission path for4I9/2→2H11/2/
4S3/2→4I15/2 may provide a fast route back to the ground state. A fast greenrelaxation would increase the transparency thresholds and may make the 4I9/2→4I15/2 relax-ation a secondary process. In summary, the upconversion processes close to transparency maybe quick enough to produce substantial populations in every level up to and including 2H11/2,which greatly increases the number of spontaneous and stimulated relaxations that must beconsidered.
Acknowledgments
This work was funded by the DARPA EPIC program. We would like to thank Q. Lin for hisfabrication assistance, and CPM would like to thank the Moore Foundation and the NSF forfellowship support.
(C) 2008 OSA 24 November 2008 / Vol. 16, No. 24 / OPTICS EXPRESS 19666#100542 - $15.00 USD Received 25 Aug 2008; revised 6 Nov 2008; accepted 8 Nov 2008; published 12 Nov 2008


![Structure and functional properties of epitaxial PbZrxTi O3 films...epitaxial films[11][12]. Once the high quality epitaxial PZT films are made these can be used to better understand](https://img.dokumen.tips/doc/110x75/60df425bb5812e17d635303f/structure-and-functional-properties-of-epitaxial-pbzrxti-o3-films-epitaxial.jpg)