Embed Size (px)
Citation preview

Growth Plans and Infrastructure Needsin Tennessee: A Nine-County Analysis
Gibson
Tipton
Williamson
Madison
Rutherford
Meigs
Sullivan
Knox
Giles
A Report for theTennessee Advisory Commissionon Intergovernmental Relations
Mary R. EnglishCory Blad
Sean T. Huss
Energy, Environment and Resources CenterUniversity of Tennessee, Knoxville
600 Henley Street, Suite 311Knoxville, TN 37996-4134
August 2006

TACIRPublication Policy
Staff Information Reports, Staff Briefs, Staff Technical Reports andStaff Working Papers and TACIR Fast Facts are issued to promotethe mission and objectives of the Commission. These reports areintended to share information and research findings relevant toimportant public policy issues in an attempt to promote widerunderstanding.
Only reports clearly labeled as “Commission Reports” represent theofficial position of the Commission. Others are informational.
The Tennessee Advisory Commission on Intergovernmental Relations
226 Capitol Boulevard Building Suite 508 Nashville, Tennessee 37243Phone: 615.741.3012 Fax: 615.532.2443
E-mail: [email protected] Website: www.state.tn.us/tacir

Growth Plans and Infrastructure Needsin Tennessee:
A Nine-County Analysis
Prepared for theTennessee Advisory Commission on Intergovernmental Relations
by
Mary R. EnglishCory Blad
Sean T. Huss
August 2006
Energy, Environment and Resources Center, University of Tennessee, Knoxville600 Henley Street, Suite 311, Knoxville, TN 37996-4134
Questions concerning this report should be directed to Dr. Mary R. English, Research Leader, EERC, 865-974-3825 or [email protected]


TABLE OF CONTENTS
SUMMARY ............................................................................................................................................................................................................... 1
INTRODUCTION .................................................................................................................................................................................................... 5
BACKGROUND ................................................................................................................................................................................... 5
PROJECT PURPOSE ............................................................................................................................................................................... 7
METHODOLOGY ................................................................................................................................................................................... 8
METHODOLOGICAL CONSTRAINTS ......................................................................................................................................... 12
COUNTY-BY-COUNTY ANALYSIS .............................................................................................................................................................. 17
GIBSON COUNTY ................................................................................................................................................................................ 17
GILES COUNTY ................................................................................................................................................................................ 25
KNOX COUNTY ................................................................................................................................................................................ 33
MADISON COUNTY ............................................................................................................................................................................ 43
MEIGS COUNTY ................................................................................................................................................................................ 51
RUTHERFORD COUNTY ................................................................................................................................................................... 59
SULLIVAN COUNTY ............................................................................................................................................................................ 67
TIPTON COUNTY ................................................................................................................................................................................ 75
WILLIAMSON COUNTY .................................................................................................................................................................... 83
COMPARISONS OF THE NINE COUNTIES ......................................................................................................................................... 92
CONCLUSIONS AND RECOMMENDATIONS .................................................................................................................................... 98


Growth Plans and Infrastructure Needs in Tennessee: A Nine-County Analysis
1
SUMMARYTennessee’s Growth Policy Act (Public Chapter 1101, Actsof 1998) required that all of Tennessee’s counties exceptthose with metropolitan forms of government developgrowth plans in concert with their municipalities by July 1,2001. According to Public Chapter 1101, the TennesseeAdvisory Commission on Intergovernmental Relations(TACIR) has a mandate to monitor its implementation. In2002, through Public Chapter 594, TACIR’s monitoringresponsibility was made permanent.
Beginning in 1996, TACIR was required to compile andmaintain inventories of the infrastructure needs of Tennessee’scounties (Public Chapter 817, Acts of 1996). The inventoryobtains information on new and planned, as well asprospectively needed, public infrastructure, which is definedas “capital facilities and land assets under public ownershipor operated or maintained for the public benefit.” To beincluded in the inventory, projects must cost at least $50,000and must not be normal or routine maintenance. As of 2005,five inventories had been completed and compiled intodatabases–the most recent, based on infrastructure needsbeginning in FY 2003.
As directed by Public Chapter 672, Acts of 2000, one ofTACIR’s mandates is to use infrastructure inventoryinformation to monitor implementation of the counties’growth plans. This research project helps to fulfill thatmandate. The project focuses on county-level growth plans,population and economic patterns, and infrastructure needs.By examining nine counties in depth, the project assessesthe effects of growth plan boundaries and of population andeconomic patterns on infrastructure that is underconstruction, planned, or locally identified as needed. Theproject concentrates on the inventory of general publicinfrastructure needs for the period beginning with FY 2003.
Nine counties were chosen to obtain a range of types, usingtwo variables based on US Census information: (1)
Tennessee’s 1998Growth Policy Actrequired counties todevelop growth plans.It also required TACIRto monitor the growthplans’ implementation.Using TACIR’sinfrastructureinventories, thisreport, whichexamines the linkbetween growthplans and publicinfrastructure needs,helps to fulfill thatmandate.

2
Growth Plans and Infrastructure Needs in Tennessee: A Nine-County Analysis
population density as of the 2000 Census and (2) population growth rate from 1990 to2000. The nine counties are:
FINDINGS
1. Counties (together with their municipalities and the coordinating committees thatrecommended growth plans) have approached their growth plans very differently.
2. Counties with high growth rates (1990 to 2000 percent change in population) tendto have relatively young, mobile populations on average.
3. A county’s per capita retail sales correlates weakly with measures of individualprosperity.
4. Within their municipalities, virtually all of the counties examined share certainpopulation characteristics, such as smaller, older, poorer households on averagethan households located elsewhere in the county.
5. Infrastructure needs within the counties examined share certain characteristics.
6. Infrastructure needs within the counties examined tend to be compatible withthe county’s growth plan.
7. Counties that are experiencing rapid population growth rates show some tendencyto have higher estimated costs per capita for their public infrastructure needs.
8. A county’s total estimated costs for public infrastructure needs may be lessinformative than its infrastructure patterns within the county.
Knox County: high density (751/sq. mi.); low growth rate (14%)
Rutherford County: moderately high density (294/sq. mi.); high growth rate (54%)
Sullivan County: moderately high density (370/sq. mi.); low growth rate (7%)
Williamson County: moderately low density (217/sq. mi.); high growth rate (56%)
Madison County: moderately low density (165/sq. mi.); low growth rate (18%)
Tipton County: low density (112/sq. mi.); high growth rate (36%)
Gibson County: low density (80/sq. mi.); low growth rate (4%)
Meigs County: very low density (57/sq. mi.); high growth rate (38%)
Giles County: very low density (48/sq. mi.); low growth rate (14%)

Growth Plans and Infrastructure Needs in Tennessee: A Nine-County Analysis
3
CONCLUSIONS
1. While the public infrastructure needs identified in the 2002 inventory* generallyappear to be compatible with county growth plans, this does not necessarilymean that the growth plans are shaping the infrastructure needs.
2. To better determine whether growth plans are shaping infrastructure needs (notmerely correlated with them), both the growth planning process and theinfrastructure needs process should be examined over time, taking into accountdemographic and economic trends.
RECOMMENDATIONS
1. To tailor the inventory forms for future analysis of infrastructure and growth plans,we offer the following suggestions:
Where possible, exact street addresses should be entered into both the generalneeds inventory form and the existing school needs inventory form. In particular,the zip code area(s) in which the project is located should be given for allprojects except those that are county-wide, in order to enable a correlation ofreported infrastructure needs with business pattern data.
Under item 14a of the general needs inventory form, the respondent shouldbe asked to rank-order the main reasons checked for the project.
A new item should be added following item 22 of the general needs inventoryform, asking about the degree of influence of the county’s growth plan on theinfrastructure need identified (e.g., none, some, a great deal).
Item 23 of the general needs inventory form should be clarified to make surethat each growth plan area type is mutually exclusive: specifically, “UrbanGrowth Boundary of an incorporated area” should be revised to “outside citylimits but within an Urban Growth Boundary of an incorporated area.”
Item B2-a of the existing school inventory form should be revised to distinguishrecent construction projects from recent renovation projects.
A new question should be added to Section B (Campus and Project Information)of the existing school inventory form, to determine the reason for the project as
*The inventory for the five-year period beginning July 1, 2002.

Growth Plans and Infrastructure Needs in Tennessee: A Nine-County Analysis
4
it relates to growth and other needs. This question could ask “What is thereason for the renovation/improvement? … population growth … outdatedfacility … government mandate … other. If more than one reason, please rank-order your responses, with 1 being the most important reason.” Similarly, anew item should be added, asking about the degree of influence of the county’sgrowth plan on the infrastructure need identified.
2. To improve the coordination of infrastructure planning with growth planning, werecommend that infrastructure planning, including annual reviews of theinfrastructure inventory forms for the compatibility of infrastructure needs withgrowth plans, become an activity of the Joint Economic and CommunityDevelopment Boards mandated under Public Chapter 1101.
3. Counties that historically have been sparsely populated but are growing rapidlymay need special technical assistance to coordinate infrastructure planning andgrowth planning. This assistance might be provided by University of Tennessee’sMunicipal Technical Advisory Service or County Technical Assistance Service inconjunction with the Tennessee Department of Economic and CommunityDevelopment’s Local Planning Assistance Division.
Growth Plans and Infrastructure Needs in Tennessee: A Nine-County Analysis
5
INTRODUCTION
BACKGROUND
Tennessee’s Growth Policy Act (Public Chapter 1101, Actsof 1998) required that all of Tennessee’s counties exceptthose with metropolitan forms of government developgrowth plans in concert with their municipalities. Accordingto the Act, the county growth plans were to designate urbangrowth boundaries (UGBs) around existingmunicipalities—boundaries delineating areas contiguousto municipalities where high-density commercial, industrial,and/or residential growth is expected over the next 20years. The county growth plans also could identify plannedgrowth areas (PGAs)—areas outside UGBs where high-or moderate-density growth is expected over the next 20years; as well as rural areas—in effect, all other areas withinthe county. While the Act was motivated largely by a needto address municipal annexation issues, other motivatingideas included minimizing urban sprawl and matching thetiming of development with the provision of public services(T.C.A. § 6-58-102).
County-level coordinating committees, whose compositionwas specified in Public Chapter 1101, were to recommendthe growth plans. Local county and municipal governmentswere to ratify them. If an impasse was reached within thecounty, a dispute resolution process would be pursued,and if that failed, a growth plan would be recommendedby a panel of administrative law judges. Plans were to besubmitted to the state’s Local Government PlanningAdvisory Committee (LGPAC) for approval by July 1,2001. Plans that had been ratified at the local level were,according to the Act, automatically approved. (For asummary of the counties’ progress toward meeting theirmandates under Public Chapter 1101, see TennesseeAdvisory Commission on Intergovernmental Relations,Tennessee’s Growth Policy in 2001: Promises andProgress, June 2002.)
The Growth Policy Actwas fuelled bymunicipal annexationissues, but it had othergoals as well. The Act,known as PublicChapter 1101, aimed tominimize urban sprawland match the timingof new developmentwith the provision ofpublic services.

6
Growth Plans and Infrastructure Needs in Tennessee: A Nine-County Analysis
According to Public Chapter 1101, the Tennessee Advisory Commission onIntergovernmental Relations (TACIR) has a mandate to monitor its implementation. In2002, TACIR’s monitoring responsibility was made on-going (Public Chapter 594, Actsof 2002).
In 1996, TACIR was required to compile and maintain inventories of the infrastructureneeds of Tennessee’s counties (Public Chapter 817, Acts of 1996). The inventorieswere to obtain information on new and planned, as well as prospectively needed, “publicinfrastructure.” Public infrastructure is defined as “capital facilities and land assets underpublic ownership or operated or maintained for the public benefit” (TACIR, BuildingTennessee’s Tomorrow: Anticipating the State’s Infrastructure Needs. March 2004, p.2): for example, transportation and utilities, schools, water and wastewater systems,parks and recreation facilities, industrial parks, government buildings, and so forth. Thestatute stipulates that to be included in the inventory, projects must cost at least $50,000and must not be normal or routine maintenance.
The 1996 Act specified that TACIR is to contract with the state’s nine developmentdistricts for collection of the inventory information. The development districts, in turn,contact local officials–for example, county and city mayors; local planning commissions,public building authorities, and education agencies; utility districts; and county roadsuperintendents. The participation of local officials in the inventory is voluntary. Stateofficials also may be contacted, especially on transportation projects. A 2000 Act (PublicChapter 672, Acts of 2000), directed TACIR to gather and report on infrastructureneeds reported in county growth plans.
After inventory information is collected by Tennessee’s nine development districts, it iscompiled and analyzed by TACIR staff. As of 2006, the following inventory reports hadbeen prepared by TACIR:
Tennessee Public Infrastructure Needs Inventory Assessment of FY 1998.1999. This report compiles the results of an inventory completed in FY 1998of infrastructure needs over the next five years.
Building Tennessee’s Tomorrow: A Survey of Infrastructure Needs. February2001. This report gives the results of an inventory of infrastructure needs forJuly 1999 through June 2004.
Building Tennessee’s Tomorrow: Anticipating the State’s Infrastructure Needs.March 2002. This report gives the results of an inventory of infrastructureneeds for July 2001 through June 2006.

Growth Plans and Infrastructure Needs in Tennessee: A Nine-County Analysis
7
Building Tennessee’s Tomorrow: Anticipating the State’s Infrastructure Needs.March 2004. This report addresses infrastructure needs for July 2002 throughJune 2007.
Building Tennessee’s Tomorrow: Anticipating the State’s Infrastructure Needs.October 2005. This report addresses infrastructure needs for July 2003 throughJune 2008.
The first inventory (completed in FY 1998) used forms from the US General AccountingOffice. In the second and subsequent inventories, forms were customized to meet theneeds of Tennessee, including the requirements of Public Chapter 1101, Acts of 1998,and Public Chapter 672, Acts of 2000. A database on reported infrastructure needs forthe period July 2003 through June 2023 constitutes the most recent inventory to becompleted and processed.
Data are compiled on a project-by-project basis using two different inventory forms:one applying to general public infrastructure needs; the other, to existing K-12 schoolfacility needs. Projects are identified by—among other things—their current stage: i.e.,whether they are in an early, conceptual stage, in planning and design, or underconstruction. If the project was reported in an earlier survey, it is noted as completed orcanceled if it is no longer underway. Beginning with the third inventory, informationwas sought on projects planned over a 20-year time period (not simply a five-year timeperiod), on whether sufficient funds were available to complete the project, and on thelocation of the project by type of growth plan area.
PROJECT PURPOSE
As directed by Public Chapter 672, Acts of 2000, one of TACIR’s mandates is to useinformation from the inventory to monitor implementation of the counties’ growthplans. The research project at hand helps to fulfill that mandate. The project focuses oncounty-level growth plans, population and economic patterns, and infrastructure. Byexamining nine counties in depth, the project assesses the effects of growth planboundaries and of population and economic patterns on the types, scale, location, andtiming of infrastructure that is under construction, planned, or locally identified as needed.
The project concentrates on the general public infrastructure needs inventory for theperiod beginning with FY 2003. During the project, comparable inventory informationon existing school facility needs also was considered, as were past inventories. In theproject, “infrastructure” is limited to the definition used by TACIR in its inventories.

8
Growth Plans and Infrastructure Needs in Tennessee: A Nine-County Analysis
This research project comes at a propitious time. TACIR’s inventory methods have beenrefined over the past years, but they still are open to modification to more directly takeinto account growth plans and trends. The project provides guidance in this regard.
In addition, the project may help to guide counties as they consider possible amendmentsto their growth plans in the coming years. Most of the county growth plans were approvedon or before July 1, 2001. They must remain unchanged for a minimum of three years(i.e., until 2004), at which point they may be amended. While local intergovernmentalpolitics were generally of the highest importance in determining growth boundaries inthe initial round of plans, one of Public Chapter 1101’s stated goals is to “more closelymatch the timing of development and the provision of public services” (T.C.A.§ 6-58-102).
If local governments and infrastructure providers are strapped for funds (and manyare), coordinating the pace and pattern of development with the efficient provision ofpublic services becomes all the more important. In addition, the provision of publicinfrastructure is one of the most powerful tools available to public officials to realizelocal growth plans, but only if that tool is used wisely.
METHODOLOGY
NINE COUNTIES WERE SELECTED FOR INVESTIGATION
Nine counties were chosen to obtain a range of types, using two variables: (1) populationdensity and (2) population growth rate.
In work that the University of Tennessee’s Energy, Environment and Resources Centerdid for TACIR under Contract ED-01-00261 (Mary R. English and Sean T. Huss, CountyGrowth Typology, 2000 Data, August 2002), cluster analysis was used to groupTennessee’s 95 counties into six categories, based on their population densities in 2000:
Cluster analysis was then used to label counties according to their 1990-2000 increase indensity (i.e., their 10-year growth rate). A high growth rate was 36% or more; a moderategrowth rate, 19 to 35%; a low growth rate, less than 19%.
Very High Density (900 or more people/square mile): 2 counties (Shelby and Davidson
High Density (500-899 people/square mile): 2 counties (Knox and Hamilton)
Moderately High Density (272-499 people/square mile): 4 counties
Moderately Low Density (120-271 people/square mile): 14 counties
Low Density (62-119 people/square mile): 26 counties
Very Low Density (fewer than 62 people/square mile): 47 counties
Growth Plans and Infrastructure Needs in Tennessee: A Nine-County Analysis
9
All of the very high density and high density counties had low growth rates during the1990s. Counties in the other four categories (moderately high density to very low density)varied from high to low in their growth rates.
For the project at hand, one county was drawn from Categories 1 and 2 combined(i.e., one of the “Big Four” counties), and one “high growth rate” and one “low growthrate” county from each of the remaining four categories. This resulted in nine countieswith a good spread of county types from the standpoint of both population density andrecent rate of growth.
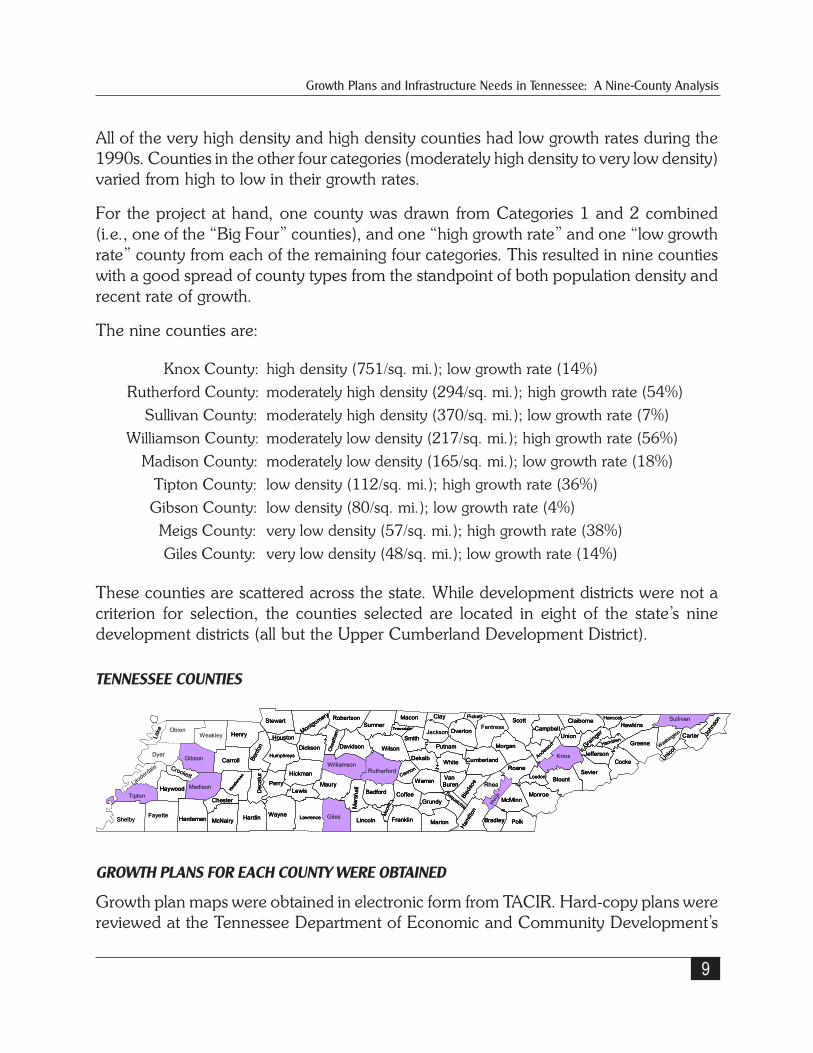
The nine counties are:
These counties are scattered across the state. While development districts were not acriterion for selection, the counties selected are located in eight of the state’s ninedevelopment districts (all but the Upper Cumberland Development District).
TENNESSEE COUNTIES
GROWTH PLANS FOR EACH COUNTY WERE OBTAINED
Growth plan maps were obtained in electronic form from TACIR. Hard-copy plans werereviewed at the Tennessee Department of Economic and Community Development’s
Lake Obion
Weakley Henry
Dyer Gibson Carroll
Lauderdale Crockett
Madison Hende
rson
HaywoodTipton
ShelbyFayette Hardeman
Chester
McNairy
Bent
onD
ecat
ur
Hardin Wayne
Perry
Humphreys
Houston
Stewart
Montgomery Robertson
Dickson
Hickman
Lewis
Lawrence Giles Lincoln
Moo
re
BedfordMaury
Mar
shal
l
WilliamsonRutherford
Che
atha
m
Davidson
Sumner
Wilson
Franklin Marion
Ham
ilton
CoffeeGrundy
Sequatchie
Bled
soe
VanBuren
CannonWhite
Dekalb
PutnamSmith
Jackson
Macon Clay
Trousdale OvertonFentress
ScottPickett
Campbell
Morgan
Cumberland Anderso
n
Roane
Knox
Loudon
Monroe
PolkBradley
McMinn
Rhea
Meig
s
Claiborne HancockHawkins
Sullivan
Union
Grainge
r
BlountSevier
JeffersonCocke
GreeneHamblenWashington Jo
hnso
n
Carter
Unicoi
Warren
Lake
Lake ObionObion
WeakleyWeakley HenryHenry
DyerDyer GibsonGibson CarrollCarroll
Lauderdale
Lauderdale Crockett
MadisonMadison Hende
rson
Hende
rson
HaywoodHaywoodTiptonTipton
ShelbyFayette HardemanHardeman
ChesterChester
McNairyMcNairy
Bent
onBe
nton
Dec
atur
Dec
atur
HardinHardin WayneWayne
PerryPerry
HumphreysHumphreys
HoustonHouston
StewartStewart
Montgomery
Montgomery RobertsonRobertson
DicksonDickson
HickmanHickman
LewisLewis
LawrenceLawrence GilesGiles LincolnLincoln
Moo
reM
oore
BedfordBedfordMauryMaury
Mar
shal
lM
arsh
all
WilliamsonWilliamsonRutherfordRutherford
Che
atha
mC
heat
ham
DavidsonDavidson
SumnerSumner
WilsonWilson
FranklinFranklin MarionMarion
Ham
ilton
Ham
ilton
CoffeeCoffeeGrundyGrundy
Sequatchie
Sequatchie
Bled
soe
Bled
soe
VanBurenVanBuren
CannonCannon
WhiteWhiteDekalbDekalb
PutnamPutnamSmithSmith
Jackson
MaconMacon ClayClay
TrousdaleTrousdale OvertonOvertonFentress
ScottScottPickettPickett
CampbellCampbell
MorganMorgan
CumberlandCumberland Anderso
n
Anderso
n
RoaneRoane
Knox
LoudonLoudon
MonroeMonroe
PolkPolkBradleyBradley
McMinnMcMinn
Rhea
Meig
sM
eigs
ClaiborneClaiborne HancockHancockHawkinsHawkins
Sullivan
UnionUnion
Grainge
r
Grainge
r
BlountBlountSevierSevier
JeffersonJeffersonCockeCocke
GreeneGreeneHamblenHamblen
Washington John
son
John
son
CarterCarter
Unicoi
Unicoi
WarrenWarren
Knox County: high density (751/sq. mi.); low growth rate (14%)
Rutherford County: moderately high density (294/sq. mi.); high growth rate (54%)
Sullivan County: moderately high density (370/sq. mi.); low growth rate (7%)
Williamson County: moderately low density (217/sq. mi.); high growth rate (56%)
Madison County: moderately low density (165/sq. mi.); low growth rate (18%)
Tipton County: low density (112/sq. mi.); high growth rate (36%)
Gibson County: low density (80/sq. mi.); low growth rate (4%)
Meigs County: very low density (57/sq. mi.); high growth rate (38%)
Giles County: very low density (48/sq. mi.); low growth rate (14%)

10
Growth Plans and Infrastructure Needs in Tennessee: A Nine-County Analysis
Local Planning Assistance Division in Nashville, to determine whether the maps wereaccompanied by explanatory information and analysis. They were not. In particular, wewere interested in written analyses of infrastructure accompanying the growth plans.
The county coordinating committees, which developed recommended growth plans, wererequired by Public Chapter 1101 to include—among others—representatives of the twoutilities (one municipally-owned; the other not municipally-owned) serving the largestnumber of customers in the county and a representative of the local education agencywith the largest student enrollment in the county. Thus, oral conversations concerninginfrastructure may well have taken place while the growth plans were being developed,including whether the plan would address the need to “establish an acceptable andconsistent level of public services and community facilities and ensure provision of thoseservices and facilities” (T.C.A. § 6-58-107). However, any such conversations were notrelated in the plans we reviewed.
DEMOGRAPHIC AND ECONOMIC DATA FOR EACH COUNTY WERE ASSEMBLED AND ANALYZED
For each of the counties, we examined data from the 2000 US Census at the block grouplevel for the following variables: total population, white/non-white population composition,percentage of population under age 18, age of householder, percentage of populationclassified as poor, number of housing units, size of households, median household income,median family income, median per capita income, median year housing structure wasbuilt, and median value of single-family, owner-occupied housing. In addition, we examinedintra-county population trends at the census tract level, based on 1990 and 2000 USCensus data.
We encountered several obstacles in this analysis, and also in the analysis of infrastructureinformation. For details, please see “Methodological Constraints” on page 12.
INFRASTRUCTURE INFORMATION FOR EACH COUNTY WAS ASSEMBLED AND ANALYZED
TACIR staff had coded and entered into a database the county-by-county, project-by-project information from the 2003 general public infrastructure needs inventory (i.e.,the inventory for projects needed to be in some stage of development between July 1,2003 and June 30, 2023). We received this database in electronic form for our ninecounties and converted it to Excel spreadsheets, choosing the most relevant items forour research project purpose.
We were particularly interested in where the project would be located. Using informationfrom item 23 of the inventory form (“Identify the Public Chapter 1101 Growth Boundaryin which this project will be located”), we set up four growth plan area types—i.e., within

Growth Plans and Infrastructure Needs in Tennessee: A Nine-County Analysis
11
city limits, within a UGB, within a PGA, and within a rural area. The project might belocated in one or more area types. In addition, the inventory form provides for “this entitydoes not have an official growth plan” and “site location has not been determined.” Wethen matrixed the projects by growth plan area type to the following descriptive information,derived from the inventory form and database:
type of project (projects listed on the inventory form as Type A, includingbusiness district development, community development, fire protection,housing, industrial sites and parks, K-12 new school construction, lawenforcement, local education agency (LEA) system-wide need, libraries andmuseums, navigation, non K-12 education, other facilities, public buildings,public health facilities, recreation, and solid waste; and projects listed on theinventory form as Type B, including other utilities, property acquisition, stormwater, telecommunications, transportation, and water & wastewater)*
project stage at the time of the inventory (completed, if the project was includedin a prior inventory; under construction; in planning and design; or conceptual)
whether the project is a regional project (i.e., serving more than one county)
level of government that will own the project (city; county; state; other, such asa utility district; or joint—i.e., with more than one owner)
whether the project is included in a capital improvement program (CIP)
estimated cost of the project
In some cases, we presented information recorded on the inventory form and enteredinto the TACIR database into a few discrete ranges instead of using the actual number.For example, for estimated costs, we used six categories: $50,000 to $500,000; over$500,000 to $5 million; over $5 million to $20 million; over $20 million to $50 million;over $50 million to $100 million; and over $100 million. Thus, if a project had anestimated cost of $3 million recorded on the inventory form, we entered it into thesecond category (over $500,000 to $5 million) on our spreadsheet.
We considered but rejected using information from item 14a of the inventory form (“Whatis the primary reason for this project?”), because in so many cases multiple reasons were
* In its infrastructure inventory reports, TACIR groups project types into six broad categories: Transportation & Utilities;Education; Health, Safety, & Welfare; Recreation & Culture; Economic Development; and General Government.Transportation & Utilities are Type B projects; the other five categories are mainly Type A projects. (Storm water projectsand water & wastewater projects are the exception: They are Type B projects that are categorized by TACIR as Health,Safety, & Welfare projects.)

12
Growth Plans and Infrastructure Needs in Tennessee: A Nine-County Analysis
listed–e.g., “population growth,” “public health or safety”—and because “public healthand safety,” even if listed alone, could be driven by needs generated by growth. (Forexample, the need for sewer system upgrades could be considered a “public health andsafety” need, but it could be driven by increased population.) We were interested primarilyin how the stated infrastructure needs (types, level of investment, etc.) related to thegrowth plan area types.
INFORMATION FOR EACH COUNTY WAS SUMMARIZED AND ANALYZED
For each of the counties, we prepared a short “fact profile” of the county’s growthtrends, growth plans, and infrastructure trends, as well as the county’s land area, taxablesales, taxable property value, and per capita income. We then qualitatively comparedstatistics that had been assembled on infrastructure needs and demographic andeconomic patterns with the county growth plans. Individual attention was paid toinfrastructure projects that were estimated to cost more than $20 million.
COMPARISONS ACROSS THE NINE COUNTIES WERE MADE
Building upon the cross-county analyses provided in the March 2004 TACIR report,Building Tennessee’s Tomorrow: Anticipating the State’s Infrastructure Needs (July 2002through June 2007), we qualitatively assessed the relative importance of growth plansin determining infrastructure needs.
METHODOLOGICAL CONSTRAINTS
Several major methodological problems were encountered. A number of these arose,directly or indirectly, because locations of infrastructure projects often were noted onlygenerally on the infrastructure inventory forms. These problems included:
Currency of demographic data available. The source of the most recentsub-county demographic information was the 2000 decennial census. In somecounties, population counts have been done subsequently, but not on a detailedbasis. For this reason, we had to rely on 2000 data to get a reasonably currentintra-county picture, and on 1990-2000 comparisons to evaluate the strengthand direction of growth trends within the county.
Currency of infrastructure inventory data available. The most recentinventory available to us was conducted in 2003 and subsequently assembledinto a database by TACIR staff. Thus, the inventory data used, while reasonablycurrent, does not necessarily reflect the infrastructure needs anticipated today

Growth Plans and Infrastructure Needs in Tennessee: A Nine-County Analysis
13
(2005). In addition, the inventory data set had some errors that were caught byTACIR staff too late for us to incorporate the corrected data into our analysis.
Limitations of “existing K-12 school facility needs” data for our purpose.These data are handled as a separate data set from the general publicinfrastructure needs inventory and are based on an inventory form tailored toobtaining information about physical conditions in existing schools as well asinformation relevant to Tennessee’s Education Improvement Act of 1992. Theinventory form does not include sufficiently specific information on the school’slocation or the reason(s) for recent construction or renovation to make it usefulin an analysis of infrastructure and county growth plans. While locationalinformation could have been obtained from TACIR, we still would not haveknown whether recent projects were construction or renovation and whatmotivated them. We thus decided to limit our inquiry to the general publicinfrastructure needs inventory, which includes K-12 new school constructionand LEA system-wide needs.
Imprecise information on locations of infrastructure projects. Item 22 ofthe general public infrastructure needs inventory form requests the location ofthe project. In many cases, however, only vague locations such as names ofcity areas were given, without other identifiers such as street names and numbersand zip codes. For this reason, to identify and group the infrastructure projectsby location, we had to employ the broad “growth plan” area types used initem 23 of the inventory form: i.e., within city limits, within a UGB, within aPGA, within a rural area, or a combination. Even then, we have reason todoubt the accuracy of the information reported. For example, Gibson County,Giles County, and Rutherford County do not have PGAs in their growth plans,yet in all three counties, infrastructure projects were reported as needed in PGAs.
Double-counting of some infrastructure projects. Four sources of double-counting were possible:
(1) If a project geographically spanned more than one “growth plan area type”—that is, within city limits, within a UGB, with a PGA, or within a rural area—itposed the problem of whether to count it only once or more than once in ouranalysis. We chose to do the latter, in order to reflect its spread across areatypes, rather than allocating it to only one area type. The unavoidable drawbackwas that the number of projects and their total costs were correspondinglyinflated. In our discussion of each county, we note the number and types ofprojects that span more than one area type.

14
Growth Plans and Infrastructure Needs in Tennessee: A Nine-County Analysis
(2) In item 23 of the inventory form (“Identify the Public Chapter 1101 GrowthBoundary in which this project will be located”), the first two categories—“existing city limits of an incorporated area” and “Urban Growth Boundary ofan incorporated area”—are not mutually exclusive. We do not know whetherall of the respondents inferred that the latter category referred only to areasoutside the city but within its UGB.
(3) For eight of our nine counties (all but Gibson County), the infrastructureinventory database counts some projects as both Type B and Type A projects(e.g., if a new road supports a new industrial site, it also is recorded as anindustrial site need). For this reason, in our infrastructure tables for all butGibson County, the number of projects for Type A and Type B sum to morethan the total number of projects for a particular area type. Following TACIR’spractice in its database, we use N/A in our infrastructure tables to indicate thenumber of projects not included under the relevant type.
(4) We noticed that a new $38 million public health facility in Knox Countyappeared to be listed twice in the infrastructure inventory database as twoseparate projects. When we checked with TACIR, we learned that this was anerror in the data set. In a data set this large–together, the nine counties hadmore than 1500 general public infrastructure needs projects—other errorseasily could have crept into the database. (For example, some projects inGibson County and Williamson County are recorded as being located in anentity lacking an official growth plan, yet both counties had growth plans inplace at least two years before the inventory was conducted.)
Lack of reliable “pre” and “post” information to analyze the effects ofgrowth plans on infrastructure needs. One way to approach the question ofwhether growth plans are having effects on infrastructure is to compareinfrastructure needs inventoried before the growth plans were adopted withinfrastructure needs inventoried after the growth plans were adopted. Weexplored this possibility. However, we found that making “pre-growth-plan”and “post-growth-plan” comparisons of infrastructure inventories would bedifficult, in part because of the lack of precise locational information forinfrastructure projects. (In the post-growth-plan inventory, we could use item23 of the inventory form as a crude substitute for locational information. Thisitem would, of course, be lacking in a pre-growth-plan inventory.) We thuschose instead to focus on an in-depth analysis of the most recent inventoryinformation, examining whether inventory needs correspond to growth planarea types and/or population and economic patterns.

Growth Plans and Infrastructure Needs in Tennessee: A Nine-County Analysis
15
Difficulty of fitting economic data geographically to other data sets used.To analyze the relationship of a county’s economic patterns to its growth planand infrastructure, we ideally would have used business information providedannually by the US Census Bureau. The County Business Patterns data sethas data by county on the number of business establishments (in total and byclassification), their mid-March employment, and their first-quarter and annualpayroll. Similarly, the ZIP Code Business Patterns has data by zip code on thenumber of business establishments, employment, and payroll. We alsoexplored using data from the Economic Census conducted every five years(most recently in 2002). This information is available at the county and zipcode levels (although 2002 data by zip code will not be released until 2006).Because we could not locate the infrastructure projects by zip code, we wereunable to use these data sets for analysis of economic patterns. Instead, weused as surrogates information available from the decennial census on a blockgroup basis for the following variables: median household income, medianfamily income, per capita income, median year housing structures built, andmedian housing values.
Difficulty of “mapping” census data sets to growth plan areas. The growthplan boundaries are determined by “real world” considerations, not by theirfit with data sets. This presented a problem in analyzing the demographic andeconomic patterns within growth plan areas. While the growth plans havebeen converted to ArcView and census data are available on a GIS basis, theprecise locations of the infrastructure projects were not known. Thus, we couldnot use ArcView as a tool for geographically mapping and analyzing the intra-county relationships between, on the one hand, infrastructure projects and,on the other hand, growth plans, demographic patterns, and economic patterns.We had to fall back on analyzing relationships by grouping relevant dataaccording to the growth plan “area types” (municipality, UGB, PGA, rural).
At the sub-county level, decennial census data are aggregated by census blocks,block groups, and census tracts as well as by zip code areas. None of these fitneatly with the areas identified by county growth plans. The most disaggregatedcensus units (i.e., blocks) would fit the best, but some information is notprovided at the block level. At the other extreme, census tracts may includelarge parts of two or more growth plan areas, especially in sparsely populatedcounties where census tracts are geographically relatively larger.
For the 2000 data, we chose to take the middle path and use census blockgroups, but even then we had to make judgments about how to allocate the

Growth Plans and Infrastructure Needs in Tennessee: A Nine-County Analysis
16
data of block groups that have geographic boundaries straddling two or moregrowth plan area types. This problem was trivial in densely populated countiessuch as Knox County, but—while better than using census tracts—using blockgroups compromised the accuracy of our analysis, especially for sparselypopulated counties such as Meigs and Giles, whose “very low density” type isshared by 45 other Tennessee counties. In particular, using geographicproportions to allocate block group data across its area types—the method wechose to use, for lack of a better one—had the effect of under-countinggeographically small but more densely populated area types, such asmunicipalities.
Decennial demographic data by zip code area would have had the advantageof compatibility with economic census and business pattern data, but—as notedearlier—infrastructure information was not available by zip code. Even then,the lack of close fit of zip codes to growth plan areas would pose a problem. Aswith using census block group data, this problem would be much less troublingin densely populated counties than in sparsely populated counties. (Forexample, Knox County includes approximately 30 zip code areas, whereasGiles County, although larger in land area, includes eight zip code areas.) Inaddition, zip code areas, unlike census block groups and tracts, do not alwaysnest wholly within counties. Despite these drawbacks, zip code informationwould have greatly facilitated analysis of the relationship between infrastructureprojects, demographic and economic patterns, and growth plans.
Limitations in comparing 2000 data with 1990 data. When assessing theintra-county direction and intensity of growth trends by comparing 1990 censusdata with 2000 census data, we encountered a further problem. The numberof block groups within a tract may be adjusted decennially to accommodatechanges in population density. Thus, in many cases there were more blockgroups within a given area type in 2000 than in 1990. This did not present aproblem if the block groups were wholly within the area type, but those thatstraddled two or more area types could not be readily included in a 1990 to2000 statistical comparison. For this reason, we were able to look only at thecensus tract level for intra-county trends occurring during the 1990s. Even atthat larger scale, we encountered problems, because census tracts also maybe altered from one decennial census to the next (although to a lesser extentthan block groups). “Comparability” files between 1990 and 2000 censusdata are available only for population at the census tract level; thus, we lookedonly at population growth trends over the 1990s.

Growth Plans and Infrastructure Needs in Tennessee: A Nine-County Analysis
17
COUNTY-BY-COUNTY ANALYSIS
GIBSON COUNTY
LOW DENSITY, LOW GROWTH RATE
Gibson County, in northwest Tennessee, is predominantlyrural, and its economy relies partly on agriculture. Its largestcity, Milan, had a 2000 census population of slightly lessthan 8,000. The county experienced only a 4% populationgrowth during the 1990s. As of 2000, it had a populationof just over 48,000, with an average density of 80 peopleper square mile.
The county’s average per capita income is lower thanTennessee’s average, but its poverty rate also is lower,suggesting that Gibson is a county without pronouncedextremes of wealth or poverty. Its 2000 per capita retailsales and property value and median value of owner-occupied houses were lower than Tennessee’s, reinforcingthe impression of a somewhat sluggish local economy. Itspopulation is older on average than Tennessee’s and isless likely to change residences. Over a third of its workingresidents commute to work outside the county.
The population ofGibson County grew4% during the 1990s,mainly in itssoutheastern section.Its growth planincludes large ruralareas interlaced withurban growth areasaround its 10municipalities. Itsstated publicinfrastructure needs—especially water &wastewater projects—emphasize the existingmunicipalities.

18
Growth Plans and Infrastructure Needs in Tennessee: A Nine-County Analysis
Gibson County Tennessee 2000 pop. 48,152 5,689,283 % chg in pop 1990-2000 +04% +17% Land area (sq. miles) 603 41,217 2000 density (pop./sq. mi) 80 138 2000 per cap income $16,320 $19,393 2000 families below poverty level 09.4% 10.3% 2000 per cap retail sales $7,212 $11,203 2000 per cap estimated property value $37,957 $51,084 2000 median value, owner-occupied houses $66,300 $93,000 % of pop. 5 years+ living in different house in 1995 41% 46% % of workers 16 years+ commuting out of county 34% 27% % of pop. under age 18 24% 25% % of pop. age 45 years + 41% 36% Largest municipality (2000 pop.) (% of county pop.)
Milan (7,664) (16%)
Other municipalities
Bradford Dyer Gibson Humboldt* Kenton* Medina Rutherford Trenton Yorkville
KEY STATISTICS
Numbers are rounded.* Municipalities located in more than one county.Sources of information:Tennessee Advisory Commission on Intergovernmental Relations, county profiles.Tennessee Department of Economic and Community Development, county profiles.Tennessee State Board of Equalization, 2000 Tax Aggregate Report of Tennessee.United States Census Bureau.University of Tennessee Municipal Technical Advisory Service, cities by county.

Growth Plans and Infrastructure Needs in Tennessee: A Nine-County Analysis
19
GROWTH PLAN
Gibson County’s growth plan, shown below, was approved by LGPAC onJanuary 26, 2000 (TACIR, June 2002). The numbered sections are census tracts forthe 2000 decennial census.
This map is adapted from a map digitized by the Tennessee Department of Economic and Community Developmentand is for informational purposes only.

20
Growth Plans and Infrastructure Needs in Tennessee: A Nine-County Analysis
DEMOGRAPHIC PATTERNS
The following information is derived from 2000 US Census data at the block group level.Where a block group straddles more than one area type, its area in each type has beenestimated and its population distributed accordingly.
GIBSON COUNTY—DEMOGRAPHIC VARIABLES BY PERCENTAGE DISTRIBUTION BY AREA TYPE
As shown in this table, the population of Gibson County is estimated to be fairly evenlydistributed across the three area types in its growth plan: within municipalities, withinurban growth areas, and within rural areas. The population within municipalities tendsto be somewhat older than within the other two area types, with smaller households.Gibson County’s municipalities also have almost half of the households in the countythat are classified as below poverty level, as well as the highest percentage of non-whites.
Gibson County—2000 Total City UGB PGA Rural Population 100 39 29 0 32
White 79 70 84 0 85 Non-White 21 30 16 0 15
Under age 18 24 24 24 0 24
Age 18 and over 76 76 76 0 76 Households 100 39 29 0 32
Age of Householder 15-44 39 37 40 0 40 Age of Householder 45-64 34 33 34 0 34 Age of Householder 65+ 28 30 26 0 26
Of Those Classified as Poor 100 46 24 0 30 Overall Poverty Rate = 12.8 Housing Units 100 39 29 0 32
Occupied Units 93 92 93 0 94 Vacant Units 7 8 7 0 6
Of Occupied Housing Units 100 39 29 0 32
1 to 2 in Household 62 65 60 0 60 3 or More in Household 38 35 40 0 40
Growth Plans and Infrastructure Needs in Tennessee: A Nine-County Analysis
21
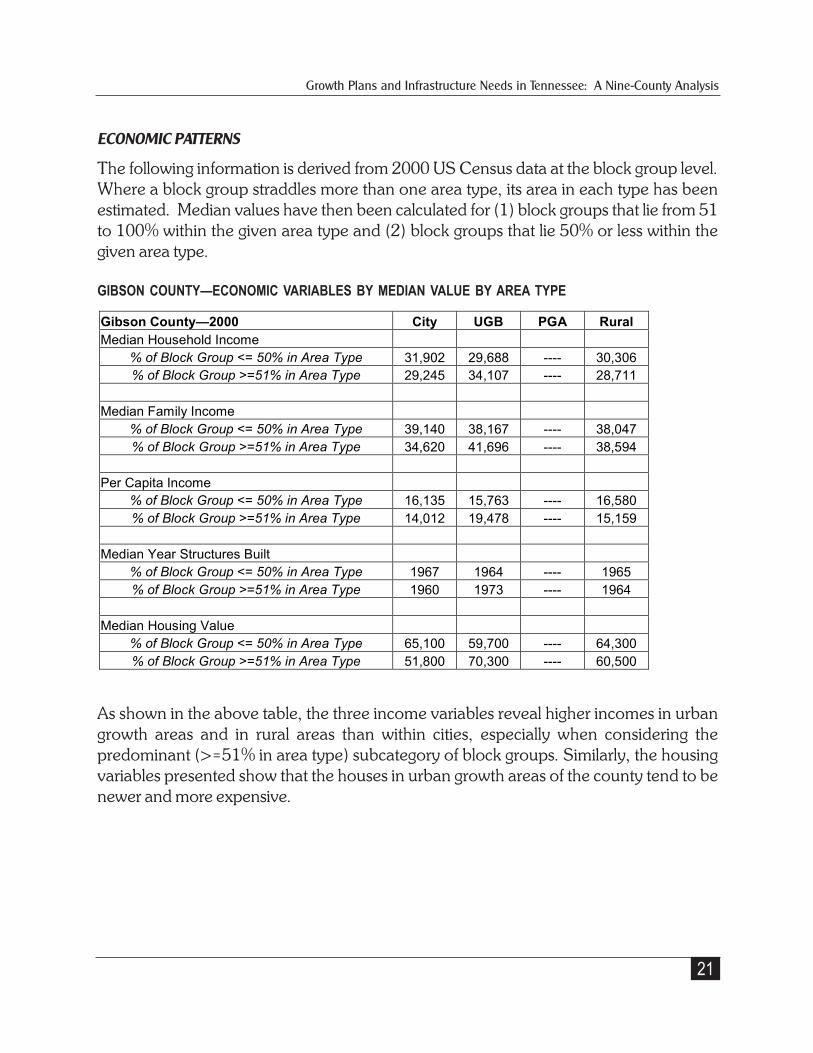
ECONOMIC PATTERNS
The following information is derived from 2000 US Census data at the block group level.Where a block group straddles more than one area type, its area in each type has beenestimated. Median values have then been calculated for (1) block groups that lie from 51to 100% within the given area type and (2) block groups that lie 50% or less within thegiven area type.
GIBSON COUNTY—ECONOMIC VARIABLES BY MEDIAN VALUE BY AREA TYPE
As shown in the above table, the three income variables reveal higher incomes in urbangrowth areas and in rural areas than within cities, especially when considering thepredominant (>=51% in area type) subcategory of block groups. Similarly, the housingvariables presented show that the houses in urban growth areas of the county tend to benewer and more expensive.
Gibson County—2000 City UGB PGA Rural Median Household Income
% of Block Group <= 50% in Area Type 31,902 29,688 ---- 30,306 % of Block Group >=51% in Area Type 29,245 34,107 ---- 28,711
Median Family Income
% of Block Group <= 50% in Area Type 39,140 38,167 ---- 38,047 % of Block Group >=51% in Area Type 34,620 41,696 ---- 38,594
Per Capita Income
% of Block Group <= 50% in Area Type 16,135 15,763 ---- 16,580 % of Block Group >=51% in Area Type 14,012 19,478 ---- 15,159
Median Year Structures Built
% of Block Group <= 50% in Area Type 1967 1964 ---- 1965 % of Block Group >=51% in Area Type 1960 1973 ---- 1964
Median Housing Value
% of Block Group <= 50% in Area Type 65,100 59,700 ---- 64,300 % of Block Group >=51% in Area Type 51,800 70,300 ---- 60,500

22
Growth Plans and Infrastructure Needs in Tennessee: A Nine-County Analysis
POPULATION TRENDS
Intra-county population changes from 1990 to 2000 are shown below, using the 1990census tracts as the unit of analysis. If a tract was not wholly within a single growth planarea type, the percentage allocation across area types was estimated.
GIBSON COUNTY—1990 TO 2000 POPULATION CHANGES BY CENSUS TRACT AND AREA TYPE
As noted above, Gibson County’s population grew by only 4% during the 1990s. However,population growth was strong in the southeastern section of the county in Census Tract9671, which is predominantly within an urban growth area between Milan and Medina.In contrast, population declined in Census Tract 9669, which includes western sectionsof Humboldt as well as a rural area in south central Gibson County.
1990
Tracts
1990
Population
2000
Population
1990 to
2000
Difference
Percent
Change
Percent
City in
2000
Percent
UGB in
2000
Percent
PGA in
2000
Percent
Rural in
2000
9660 2,791 2,897 106 4 23 25 0 52
9661 2,761 2,754 -7 0 35 50 0 15
9662 3,626 3,704 78 2 10 25 0 65
9663 2,316 2,665 349 15 10 55 0 35
9664 4,819 5,151 332 7 45 28 0 27
9665 5,964 6,013 49 1 74 25 0 1
9666 1,464 1,674 210 14 8 60 0 33
9667 6,289 6,256 -33 -1 44 28 0 28
9668 1,445 1,413 -32 -2 0 0 0 100
9669 4,082 3,698 -384 -9 66 8 0 26
9670 6,907 7,212 305 4 76 10 0 14
9671 1,815 2,678 863 48 20 73 0 8
9672 788 784 -4 -1 0 0 0 100
9673 1,248 1,253 5 0 10 20 0 70
9674.98 0 0 0 0 0 0 0 0

Growth Plans and Infrastructure Needs in Tennessee: A Nine-County Analysis
23
INFRASTRUCTURE PROJECTS
The following table is based on data in the 2003 general public infrastructure needsinventory.
GIBSON COUNTY—NUMBER OF INFRASTRUCTURE PROJECTS BY AREA TYPE*
Total Projects 66 1 2 2 21Type A Projects 35 1 0 1 0
Fire Protection 2 0 0 0 0
Housing 1 0 0 0 0
Industrial Sites and Parks 3 0 0 0 0
K-12 New School Construction 1 0 0 0 0
Law Enforcement 4 0 0 0 0
LEA System-wide Need 4 0 0 0 0
Public Buildings 7 0 0 0 0
Recreation 13 1 0 1 0
(N/A)** 31 0 2 1 21Type B Projects 31 0 2 1 21
Telecommunications 1 0 0 0 0
Transportation 13 0 2 1 21
Water and Wastewater 17 0 0 0 0
(N/A)** 35 1 0 1 0Stage
Completed 12 0 0 0 0
Conceptual 31 0 0 1 4
Construction 12 1 0 1 0
Planning & Design 11 0 2 0 17Regional Project
Yes 0 0 0 0 0
No 66 1 2 2 21Level of Government
City 53 0 0 0 0
County 4 1 1 2 3
Other 3 0 0 0 0
State 6 0 1 0 18In CIP
Yes 13 1 0 1 0
No 53 0 2 1 21Estimated Cost
$50,000 to $500,000 41 0 2 1 16
$500,001 to $5,000,000 23 1 0 1 5
$5,000,001 to $20,000,000 1 0 0 0 0
$20,000,001 to $50,000,000 1 0 0 0 0
** N/A indicates the number of projects in the dataset that are not included under the Type.
*Projects that are geographically located in more than one area are repeat-counted for each relevant
area type.
Within
city
Within
rural
No
growth
plan
Within
UGB
Within
PGA

Growth Plans and Infrastructure Needs in Tennessee: A Nine-County Analysis
24
As this table shows, the 92 infrastructure projects identified in the 2003 general needsinventory for Gibson County are split about equally between Type A and Type B projects.None of the projects occurs in more than one area type. Sixty-six projects, or over two-thirds of the total projects, are identified as within either municipalities or their UGBs.
Of the remaining projects in the county, 21 are shown as “this entity does not have anofficial growth plan”—clearly, an error in the information reporting, recording, ordatabase entry, since Gibson County has a growth plan dating to early 2000. All ofthese 21 projects are transportation projects, and most are fairly low-cost, state-ownedprojects in the planning and design stage. In addition, two transportation projects areshown as being within PGAs, but Gibson County’s growth plan does not include PGAs.While none of the 92 projects for Gibson County were reported to span more than onegrowth plan area type, it is possible that some of the transportation projects do. None ofthe projects were reported to be regional (i.e., involving more than Gibson County).
The 66 projects within municipalities or their UGBs emphasize education (one newschool and four LEA system-wide needs), public buildings, recreation, transportation,and water & wastewater systems. Thirty-one projects—mainly transportation andwater & wastewater—are in the conceptual stage, and 24 projects are either completedor under construction.
According to the general needs inventory, Gibson County has one infrastructure projectestimated to cost more than $20 million: a 7.3-mile bypass to the east of Milan. Theproject, estimated at $22 million, is intended to relieve traffic flow through Milan. As of2003, this project was in the planning and design stage, with a start date during FY2004.
RELATIONSHIP OF INFRASTRUCTURE PROJECTS TO GROWTH PLAN, DEMOGRAPHIC PATTERNS,AND ECONOMIC PATTERNS
The infrastructure projects needed for Gibson County, as identified in the 2003 generalneeds inventory, show a strong emphasis on the needs of its existing municipalities. Anumber of these are water & wastewater projects—some in the early, conceptual stage.
Few projects at any stage, including the conceptual stage, were identified for the urbangrowth areas around the municipalities. This is somewhat surprising, given the surge inpopulation between Milan and Medina and the fact that the urban growth areas containlarger, higher-income households on average than the municipalities, as well as nearly30% of the county’s population as of 2000. Rural areas, which also have nearly a thirdof the county’s population, have little infrastructure identified as needed other thantransportation.

Growth Plans and Infrastructure Needs in Tennessee: A Nine-County Analysis
25
GILES COUNTY
VERY LOW DENSITY, LOW GROWTH RATE
Giles County, in south central Tennessee on the Alabamaborder, is a county of high, winding ridges and deep valleys.As of 2000, its largest city, Pulaski, constituted more thana quarter of the county’s population of approximately29,000. The county had a 14% population growth in the1990s—a bit less than Tennessee’s 17% growth rate. Asof 2000, Giles County remained predominately rural, withan average density of only 48 people per square mile. Inseveral respects, its demographic and economiccharacteristics as of 2000 were similar to those of GibsonCounty.
Like Gibson County, its average per capita income, percapita retail sales, per capita property value, and medianhousing value were all lower than Tennessee’s, but so wasits poverty rate. Its people were, on average, older andless likely to change residences but more likely to commuteoutside the county than the Tennessee average.
The population of GilesCounty (2000 census:29,447), in rural south—central Tennessee, grew14% in the 1990s. Inits growth plan, largeswathes of the countyare designated as rural,and these areas have asignificant proportionof the county’spopulation. In theinfrastructure needsinventory, the county’sfive municipalities areemphasized.

26
Growth Plans and Infrastructure Needs in Tennessee: A Nine-County Analysis
Giles County Tennessee 2000 pop. 29,447 5,689,283 % chg in pop 1990-2000 +14% +17% Land area (sq. miles) 611 41,217 2000 density (pop./sq. mi) 48 138 2000 per cap income $17,543 $19,393 2000 families below poverty level 09.0% 10.3% 2000 per cap retail sales $7,691 $11,203 2000 per cap estimated property value $41,926 $51,084 2000 median value, owner-occupied houses $72,900 $93,000 % of pop. 5 years+ living in different house in 1995 37% 46% % of workers 16 years+ commuting out of county 29% 27% % of pop. under age 18 22% 25% % of pop. age 45 years + 39% 36% Largest municipality (2000 pop.) (% of county pop.)
Pulaski (7,871) (27%)
Other municipalities
Ardmore* Elkton Lynnville Minor Hill
KEY STATISTICS
Numbers are rounded.* Municipality located in more than one county.Sources of information:Tennessee Advisory Commission on Intergovernmental Relations, county profiles.Tennessee Department of Economic and Community Development, county profiles.Tennessee State Board of Equalization, 2000 Tax Aggregate Report of Tennessee.United States Census Bureau.University of Tennessee Municipal Technical Advisory Service, cities by county.

Growth Plans and Infrastructure Needs in Tennessee: A Nine-County Analysis
27
GROWTH PLAN
Giles County’s growth plan, shown below, was approved by LGPAC on June 28, 2000(TACIR, June 2002). The numbered sections are census tracts for the 2000 decennialcensus.
This map is adapted from a map digitized by the Tennessee Department of Economic and Community Developmentand is for informational purposes only.

28
Growth Plans and Infrastructure Needs in Tennessee: A Nine-County Analysis
DEMOGRAPHIC PATTERNS
The following information is derived from 2000 US Census data at the block group level.Where a block group straddles more than one area type, its area in each type has beenestimated and its population distributed accordingly.
GILES COUNTY—DEMOGRAPHIC VARIABLES BY PERCENTAGE DISTRIBUTION BY AREA TYPE*
*In Giles County, using geographic proportionality as the basis for allocating population at the block group levelacross area types has resulted in an underestimate of the population within municipalities.
Based on the block group estimates across area types, it appears that a large proportionof the population in Giles County lives in areas designated as rural. Those who live insuch areas tend to be younger and have larger families than those who live eitherwithin city limits or within urban growth areas. Areas within city limits have a somewhathigher proportion of people living in poverty than either urban growth areas or ruralareas, and they also have a higher percentage of non-whites.
Giles County–2000 Total City UGB PGA Rural Population 100 19 12 0 69
White 87 71 86 0 91 Non-White 13 29 14 0 9
Under age 18 22 19 21 0 22
Age 18 and over 78 81 79 0 78 Households 100 21 12 0 67
Age of Householder 15-44 40 38 36 0 41 Age of Householder 45-64 36 31 37 0 37 Age of Householder 65+ 24 31 26 0 22
Of Those Classified as Poor 100 27 12 0 61 Overall Poverty Rate = 11.7 Housing Units 100 21 12 0 67
Occupied Units 89 88 91 0 89 Vacant Units 11 12 9 0 11
Of Occupied Housing Units 100 21 12 0 67
1 to 2 in Household 60 69 66 0 56 3 or More in Household 40 31 34 0 44

Growth Plans and Infrastructure Needs in Tennessee: A Nine-County Analysis
29
ECONOMIC PATTERNS
The following information is derived from 2000 US Census data at the block group level.Where a block group straddles more than one area type, its area in each type has beenestimated. Median values have then been calculated for (1) block groups that lie from 51to 100% within the given area type and (2) block groups that lie 50% or less within thegiven area type.
GILES COUNTY—ECONOMIC VARIABLES BY MEDIAN VALUE BY AREA TYPE
*Rough estimate based on Pulaski.
The above table shows that those living within city limits, especially within the core of thecities, do not fare as well on any of the three income variables as those living in surroundingurban growth areas or in areas designated as rural. Similarly, housing tends to be olderand less expensive within city limits.
Giles County—2000 City UGB PGA Rural Median Household Income
% of Block Group <= 50% in Area Type 36,661 35,703 ---- 28,998 % of Block Group >=51% in Area Type 24,118 ---- ---- 38,184
Median Family Income
% of Block Group <= 50% in Area Type 42,021 41,226 ---- 41,019 % of Block Group >=51% in Area Type 35,481 ---- ---- 42,728
Per Capita Income
% of Block Group <= 50% in Area Type 17,775 17,105 ---- 16,369 % of Block Group >=51% in Area Type 12,412 ---- ---- 17,330
Median Year Structures Built
% of Block Group <= 50% in Area Type 1975 1973 ---- 1967 % of Block Group >=51% in Area Type 1965* ---- ---- 1976
Median Housing Values
% of Block Group <= 50% in Area Type 72,550 71,600 ---- 60,900 % of Block Group >=51% in Area Type 56,650 ---- ---- 72,550

30
Growth Plans and Infrastructure Needs in Tennessee: A Nine-County Analysis
POPULATION TRENDS
Intra-county population changes from 1990 to 2000 are shown below, using the 1990census tracts as the unit of analysis. If a tract was not wholly within a single growth planarea type, the percentage allocation across area types was estimated.
GILES COUNTY—1990 TO 2000 POPULATION CHANGES BY CENSUS TRACT AND AREA TYPE
As noted above, from 1990 to 2000 the population of Giles County grew by 14%. Inparticular, when considering both the numerical and percent change, Census Tracts9801 and 9803 showed strong growth. Tract 9801, in northern Giles County, is almosttotally designated as rural in the county’s growth plan. Tract 9803 includes part ofPulaski.
1990
Tracts
1990
Population
2000
Population
1990 to
2000
Difference
Percent
Change
Percent
City in
2000
Percent
UGB in
2000
Percent
PGA in
2000
Percent
Rural in
2000
9801 2,676 3,373 697 26 3 5 0 93
9802 4,048 4,666 618 15 60 10 0 30
9803 5,251 6,293 1,042 20 35 2 0 63
9804 2,560 2,689 129 5 53 10 0 38
9805 4,555 4,828 273 6 23 45 0 32
9806 2,372 2,837 465 20 8 8 0 85
9807 1,574 1,846 272 17 0 0 0 100
9808 2,705 2,915 210 8 15 20 0 65

Growth Plans and Infrastructure Needs in Tennessee: A Nine-County Analysis
31
INFRASTRUCTURE PROJECTS
The following table is based on data in the 2003 general public infrastructure needs inventory.
GILES COUNTY—NUMBER OF INFRASTRUCTURE PROJECTS BY AREA TYPE*Within
City
Within
UGB
Within
PGA
Within
Rural
Site Not
Det.
No Area
Info
Total Projects 39 4 4 21 1 1Type A Projects 24 1 2 7 1 0
Business District Development 1 0 0 1 0 0
Community Development 5 1 2 4 1 0
Fire Protection 1 0 0 0 0 0
Industrial Sites and Parks 3 0 0 0 0 0
K-12 New School Construction 0 0 0 1 0 0
Law Enforcement 1 0 0 1 0 0
Public Buildings 4 0 0 0 0 0
Recreation 9 0 0 0 0 0
(N/A)** 15 3 2 14 0 1Type B Projects 22 4 4 19 1 1
Property Acquisition 1 0 0 0 0 0
Transportation 7 0 1 7 0 0
Water and Wastewater 14 4 3 12 1 1
(N/A)** 17 0 0 2 0 0Stage
Completed 11 2 1 9 0 0
Conceptual 12 2 2 3 1 0
Construction 6 0 0 3 0 0
Planning & Design 10 0 1 6 0 1Regional Project
Yes 0 0 0 1 1 0
No 39 4 4 20 0 1Level of Government
City 32 2 0 0 0 0
County 4 1 3 7 0 0
Joint 2 1 0 2 1 0
Other 0 0 1 10 0 1
State 1 0 0 2 0 0In CIP
Yes 0 0 0 0 0 0
No 39 4 4 21 1 1Estimated Cost
$50,000 to $500,000 23 3 2 12 0 1
$500,001 to $5,000,000 14 0 1 5 0 0
$5,000,001 to $20,000,000 1 1 1 4 1 0
$20,000,001 to $50,000,000 1 0 0 0 0 0
** N/A indicates the number of projects in the dataset that are not included under the Type.
*Projects that are geographically located in more than one area are repeat-counted for each relevant
area type.

Growth Plans and Infrastructure Needs in Tennessee: A Nine-County Analysis
32
There were 54 projects reported for Giles County. Of these, seven projects span two ormore growth plan area types. (These include some community development, publicbuildings, recreation, and water & wastewater projects.) In addition, two projects werereported as regional. Of the total number of projects for the county when summedacross area type categories—i.e., 70, including repeat-counting—the projects are splitevenly between Type A and Type B.
The municipalities or the county will own most of the projects, and most have estimatedcosts of $50,000 to $5 million. Forty-three are within either municipalities or their UGBs.Nearly half (19) of these 43 projects are completed or under construction. Of theremainder, 10 are in planning and design, while 14 are in the conceptual stage. (Fourprojects were identified as being within PGAs, but Giles County’s growth plan does nothave PGAs.)
Twenty-one projects are within areas designated as rural, with 19 of the 21 eithertransportation or water & wastewater projects. Of the 21 projects, almost all have beencompleted or are in construction or planning and design.
According to the general needs inventory, Giles County has one infrastructure projectthat is estimated to cost more than $20 million: a sewer system to be installed throughoutPulaski, estimated to cost $25 million. As of 2003, the project was in the conceptualstage and was to start in FY 2007.
RELATIONSHIP OF INFRASTRUCTURE PROJECTS TO GROWTH PLAN, DEMOGRAPHIC PATTERNS,AND ECONOMIC PATTERNS
The infrastructure projects needed for Giles County, as identified in the 2003 generalneeds inventory, show an emphasis on the county’s five municipalities. Of these, one isa sewer system to be installed throughout Pulaski, which has over one-quarter of thecounty’s population. The other projects are a mixture of types that may be driven inpart by the needs of municipalities with somewhat lower-income populations relativeto their surrounding areas. Only four projects—all water & wastewater projects—wereidentified for the municipalities’ urban growth areas.
Areas designated as rural in the county’s growth plan contain much of the county’s landarea and appear to have a large proportion of the county’s population. The rural areashave one new K-12 school and a number of transportation and water & wastewaterprojects identified as needed, but little else.

Growth Plans and Infrastructure Needs in Tennessee: A Nine-County Analysis
33
KNOX COUNTY
HIGH DENSITY, LOW GROWTH RATE
Knox County is located in east Tennessee’s Great Valleyat the head of the Tennessee River. Home to the “flagship”campus of the University of Tennessee, Knoxvilleconstitutes nearly one-half of the county’s population,which was just over 382,000 in 2000. The county’spopulation grew 14% in the 1990s—under Tennessee’saverage growth rate, but large in numerical terms andtypical of Tennessee’s most densely populated counties.In 2000, Knox County’s density was 751 people per squaremile.
In 2000, Knox County’s per capita income, per capita retailsales, per capita property value, and median housing valuewere all above Tennessee’s average, and its percentage offamilies below the poverty level was nearly 2% lower thanfor Tennessee as a whole. As of 2000, the percentage ofthe county’s population age 45 and older was the same asfor Tennessee—36%. Its population was slightly more likelyto change residences but considerably less likely tocommute outside the county than for Tennessee as awhole.
The population of KnoxCounty (2000 census:382,032) grew 14% inthe 1990s. Much ofthat growth was in itswestern and northernsections—largely withinareas designated forplanned growth in thecounty’s growth plan,but partly within areasdesignated as rural.The county’s statedinfrastructure needsappear to be drivenmore by populationsurges than by thegrowth plan.

34
Growth Plans and Infrastructure Needs in Tennessee: A Nine-County Analysis
KEY STATISTICS
Numbers are rounded.* Municipality located in more than one county.Sources of information:Tennessee Advisory Commission on Intergovernmental Relations, county profiles.Tennessee Department of Economic and Community Development, county profiles.Tennessee State Board of Equalization, 2000 Tax Aggregate Report of Tennessee.United States Census Bureau.University of Tennessee Municipal Technical Advisory Service, cities by county.
Knox County Tennessee 2000 pop. 382,032 5,689,283 % chg in pop 1990-2000 +14% +17% Land area (sq. miles) 508 41,217 2000 density (pop./sq. mi) 751 138 2000 per cap income $21,875 $19,393 2000 families below poverty level 08.4% 10.3% 2000 per cap retail sales $15,654 $11,203 2000 per cap estimated property value $51,228
$51,084
2000 median value, owner-occupied houses $98,500 $93,000 % of pop. 5 years+ living in different house in 1995 48% 46% % of workers 16 years+ commuting out of county 14% 27% % of pop. under age 18 22% 25% % of pop. age 45 years + 36% 36% Largest municipality (2000 pop.) (% of county pop.)
Knoxville (173,890) (46%)
Other municipalities
Farragut*

Growth Plans and Infrastructure Needs in Tennessee: A Nine-County Analysis
35
GROWTH PLAN
Knox County’s growth plan, shown below, was approved by LGPAC on April 25, 2001(TACIR, June 2002). The numbered sections are census tracts for the 2000 decennialcensus.
This map is adapted from a map digitized by the Tennessee Department of Economic and Community Developmentand is for informational purposes only.

36
Growth Plans and Infrastructure Needs in Tennessee: A Nine-County Analysis
DEMOGRAPHIC PATTERNS
The following information is derived from 2000 US Census data at the block group level.Where a block group straddles more than one area type, its area in each type has beenestimated and its population distributed accordingly.
KNOX COUNTY—DEMOGRAPHIC VARIABLES BY PERCENTAGE DISTRIBUTION BY AREA TYPE
The above table shows that just over half of Knox County’s population falls within citylimits, with over a quarter in planned growth areas. The remainder is split fairly evenlybetween urban growth areas and areas designated as rural. Householders in their mid40s or older with larger families tend to populate the PGAs or rural areas. Of thoseclassified as poor in Knox County, nearly three-quarters live within city limits, and mostof Knox County’s non-white population lives there also.
Knox County—2000 Total City UGB PGA Rural Population 100 51 10 26 13
White 88 81 91 95 97 Non-White 12 19 9 5 3
Under age 18 22 20 23 25 24
Age 18 and over 78 80 77 75 76 Households 100 53 11 25 12
Age of Householder 15-44 47 49 49 45 41 Age of Householder 45-64 33 29 33 38 39 Age of Householder 65+ 20 21 18 17 20
Of Those Classified as Poor 100 74 8 11 8 Overall Poverty Rate = 12.6 Housing Units 100 54 11 24 11
Occupied Units 92 91 92 94 93 Vacant Units 8 9 8 6 7
Of Occupied Housing Units 100 53 11 25 12
1 to 2 in Household 64 69 64 58 57 3 or More in Household 36 31 36 42 43

Growth Plans and Infrastructure Needs in Tennessee: A Nine-County Analysis
37
ECONOMIC PATTERNS
The following information is derived from 2000 US Census data at the block group level.Where a block group straddles more than one area type, its area in each type has beenestimated. Median values have then been calculated for (1) block groups that lie from 51to 100% within the given area type and (2) block groups that lie 50% or less within thegiven area type.
KNOX COUNTY—ECONOMIC VARIABLES BY MEDIAN VALUE BY AREA TYPE
When considering the predominant block group subcategories (>=51% in area type), it isevident that the areas within city limits fare the least well on the three income variablespresented, and the PGAs are the most prosperous. Not surprisingly, the PGAs are alsowhere the newest, most expensive houses are located.
Knox County—2000 City UGB PGA Rural Median Household Income
% of Block Group <= 50% in Area Type 43,229 34,366 31,085 33,165 % of Block Group >=51% in Area Type 26,468 40,479 51,178 41,083
Median Family Income
% of Block Group <= 50% in Area Type 52,321 42,007 38,472 40,855 % of Block Group >=51% in Area Type 34,141 46,429 57,974 47,758
Per Capita Income
% of Block Group <= 50% in Area Type 21,402 18,379 18,023 18,265 % of Block Group >=51% in Area Type 15,749 19,803 23,426 20,500
Median Year Structures Built
% of Block Group <= 50% in Area Type 1978 1968 1966 1967 % of Block Group >=51% in Area Type 1960 1977 1982 1978
Median Housing Values
% of Block Group <= 50% in Area Type 103,800 85,400 82,050 84,300 % of Block Group >=51% in Area Type 73,650 95,200 108,950 99,900

38
Growth Plans and Infrastructure Needs in Tennessee: A Nine-County Analysis
POPULATION TRENDS
Intra-county population changes from 1990 to 2000 are shown below, using the 1990census tracts as the unit of analysis. If a tract was not wholly within a single growth planarea type, the percentage allocation across area types was estimated.
KNOX COUNTY—1990 TO 2000 POPULATION CHANGES BY CENSUS TRACT AND AREA TYPE
1990
Tracts
1990
Population
2000
Population
1990 to
2000
Difference
Percent
Change
Percent
City in
2000
Percent
PGA in
2000
Percent
Rural in
2000
1 1,470 1,300 -170 -12 100 0 0
2 1,284 1,270 -14 -1 100 0 0
3 1,979 1,904 -75 -4 100 0 0
4 725 744 19 3 100 0 0
5 2,602 2,615 13 0 100 0 0
6 3,339 2,747 -592 -18 100 0 0
7 2,041 1,649 -392 -19 100 0 0
8 2,172 3,587 1415 65 100 0 0
9 6,613 7,628 1015 15 100 0 0
10 1,923 1,513 -410 -21 100 0 0
11 3,461 2,614 -847 -24 100 0 0
12 2,489 969 -1520 -61 100 0 0
13 1,479 1,382 -97 -7 100 0 0
14 3,838 3,301 -537 -14 100 0 0
15 3,767 3,538 -229 -6 100 0 0
16 3,118 2,935 -183 -6 100 0 0
17 2,960 2,764 -196 -7 100 0 0
18 2,453 2,317 -136 -6 100 0 0
19 2,045 1,856 -189 -9 100 0 0
20 3,560 3,389 -171 -5 100 0 0
21 2,550 2,561 11 0 75 0 0
22 4,172 4,070 -102 -2 93 0 0
23 3,297 3,232 -65 -2 95 0 0
24 3,793 3,758 -35 -1 75 15 0
25 3,640 3,649 9 0 100 0 0
26 2,260 2,309 49 2 100 0 0
27 2,919 2,585 -334 -11 100 0 0
28 4,362 3,863 -499 -11 100 0 0
29 3,370 3,467 97 3 100 0 0
30 3,924 4,326 402 10 100 0 0
31 2,669 2,880 211 8 100 0 0
32 3,410 3,024 -386 -11 100 0 0
33 2,149 2,190 41 2 100 0 0
34 4,245 3,869 -376 -9 100 0 0
35 3,674 3,905 231 6 25 33 0
36 463 227 -236 -51 100 0 0
37 4,025 3,833 -192 -5 100 0 0
38 5,979 6,834 855 14 100 0 0
39 6,385 6,964 579 9 100 0 0
40 3,335 3,504 169 5 100 0 0
41 4,259 3,969 -290 -7 100 0 00
0
0
0
0
0
0
0
0
43
0
0
0
0
10
0
0
0
0
25
8
5
0
0
0
0
0
0
0
0
0
0
0
0
0
0
0
0
Percent
UGB in
2000
0
0
0

Growth Plans and Infrastructure Needs in Tennessee: A Nine-County Analysis
39
1990
Tracts
1990
Population
2000
Population
1990 to
2000
Difference
Percent
Change
Percent
City in
2000
Percent
PGA in
2000
Percent
Rural in
2000
42 3,443 3,422 -21 -1 100 0 0
43 1,873 2,028 155 8 45 55 0
44.01 4,509 4,665 156 3 55 45 0
44.02 7,171 7,980 809 11 96 4 0
45 5,266 5,696 430 8 100 0 0
46.01 5,646 6,926 1280 23 45 55 0
46.02 11,366 15,606 4240 37 --------------- ------------ --------------
46.03 8,963 9,376 413 5 18 39 0
46.04 4,592 6,264 1672 36 13 13 0
47 3,472 3,760 288 8 83 17 0
48 4,105 4,710 605 15 68 33 0
49 3,536 4,255 719 20 70 30 0
50 3,856 3,956 100 3 93 7 0
51 3,042 4,224 1182 39 70 23 0
52.01 4,002 4,468 466 12 0 17 83
52.02 2,797 2,690 -107 -4 23 70 3
53 6,224 6,816 592 10 5 47 18
54 6,133 6,497 364 6 3 20 60
55 5,823 6,089 266 5 17 23 42
56 40 45 5 13 --------------- ------------ --------------
56.01 5,140 5,510 370 7 8 18 20
56.02 3,108 3,665 557 18 0 0 70
57.01 3,578 4,438 860 24 10 7 83
57.02 13,950 21,521 7571 54 --------------- ------------ --------------
57.03 4,011 5,069 1058 26 17 10 7
58.01 8,457 9,812 1355 16 --------------- ------------ --------------
58.02 9,988 15,567 5579 56 --------------- ------------ --------------
59.01 6,184 7,823 1639 27 12 8 32
59.02 4,918 6,850 1932 39 0 0 60
60 7,753 10,029 2276 29 5 8 0
61.01 7,264 9,329 2065 28 0 7 22
61.02 2,487 4,271 1784 72 5 5 50
62.01 5,039 7,098 2059 41 1 1 25
62.02 2,604 3,701 1097 42 0 0 10
62.03 4,133 4,482 349 8 2 3 0
62.04 5,784 7,490 1706 29 8 13 0
63 5,080 6,170 1090 21 0 0 95
64 6,418 8,646 2228 35 0 0 68
65 5,776 6,013 237 4 0 0 53
5601 14 22 8 57 --------------- ------------ --------------
5702 6 12 6 100 --------------- ------------ --------------Dashed lines indicate tracts that could not be allocated across area types.
47
---------------
---------------
Percent
UGB in
2000
95
80
5
33
72
40
73
90
---------------
48
40
88
0
---------------
67
---------------
18
---------------
55
30
0
3
30
17
0
0
0
7
---------------
44
75
0
0
0
0
0
0
0
During the 1990s, as noted above, Knox County had an overall population growth of14%. The county experienced strong population growth in the western and northernparts of the county, notably in such census tracts as 46.01, 57.02, 57.03, 58.02, 59.01,59.02, 60, 61.01, 61.02, 62.01, 62.02, 62.04, and 64. Most of these tracts are inPGAs but include some areas designated as rural as well.

40
Growth Plans and Infrastructure Needs in Tennessee: A Nine-County Analysis
INFRASTRUCTURE PROJECTS
The following table is based on data in the 2003 general public infrastructure needs inventory.
KNOX COUNTY—NUMBER OF INFRASTRUCTURE PROJECTS BY AREA TYPEWithin
City
Within
UGB
Within
PGA
Within
Rural
Site Not
Det.
No Area
Info
Total Projects 118 36 68 28 2 75Type A Projects 58 10 27 6 1 72
Business District Development 6 0 0 0 0 0
Community Development 3 1 1 1 0 0
Fire Protection 4 0 0 0 0 0
Industrial Sites and Parks 1 1 0 0 0 0
K-12 New School Construction 4 3 5 0 0 0
Law Enforcement 6 0 0 1 0 2
LEA System-wide Need 0 0 0 0 0 3
Libraries and Museums 5 1 4 1 0 1
Non K-12 Education 0 0 0 0 0 44
Other Facilities 0 1 0 0 0 0
Public Buildings 4 0 1 0 0 2
Public Health Facilities 1 0 0 0 0 15
Recreation 23 2 14 2 1 5
Solid Waste 1 1 2 1 0 0
(N/A)** 60 26 41 22 1 3Type B Projects 68 28 46 25 1 3
Property Acquisition 3 0 4 2 0 0
Stormwater 5 1 1 1 0 0
Transportation 45 10 20 7 0 3
Water and Wastewater 15 17 21 15 1 0
(N/A)** 50 8 22 3 1 72Stage
Completed 43 19 24 7 0 0
Conceptual 23 3 13 2 2 45
Construction 29 9 17 11 0 3
Planning & Design 23 5 14 8 0 5
State Agency (Completed/Canceled) 0 0 0 0 0 22Regional Project
Yes 0 0 0 0 0 56
No 118 36 68 28 2 19Level of Government
City 87 0 1 3 0 0
County 17 19 44 12 1 0
Other 6 17 20 12 1 0
State 8 0 3 1 0 75In CIP
Yes 103 35 59 26 2 0
No 15 1 9 2 0 6
Unknown 0 0 0 0 0 69Estimated Cost
$50,000 to $500,000 29 10 26 9 0 25
$500,001 to $5,000,000 59 23 30 18 2 31
$5,000,001 to $20,000,000 26 3 11 1 0 15
$20,000,001 to $50,000,000 3 0 1 0 0 4
$100,000,001 and Over 1 0 0 0 0 0
** N/A indicates the number of projects in the dataset that are not included under the Type.
*Projects that are geographically located in more than one area are repeat-counted for each relevant area type.

Growth Plans and Infrastructure Needs in Tennessee: A Nine-County Analysis
41
There were 283 projects reported for Knox County. Of these, 18 projects span two ormore growth plan area types. (These include a number of higher education projects, aswell as some transportation, storm water, and water & wastewater projects.) In addition,56 projects–mainly higher education projects, as well as some public health projectsand a couple of transportation projects–were identified as regional. Of the total numberof projects for the county when summed across area type categories—i.e., 327, includingrepeat-counting—the projects are split fairly evenly between Type A and Type B.
Over one-quarter of the 327 projects were in the conceptual stage. These include sometransportation projects and various Type A projects, especially those involving highereducation institutions.
According to the general needs inventory, Knox County has several non-state projectsthat are estimated to cost more than $20 million: a $21 million project to construct afour-lane divided road in west Knox County on Ball Camp Pike; a large, on-going $31million project to improve the wastewater collection system; and two downtown projects–a $24 million project for restoration of Market Square, and a $160 million project toconstruct a convention center. As of 2003, the Ball Camp Pike project was in theplanning and design stage and was to start in FY 2004. The convention center is nowcompleted; the other projects, under construction.
RELATIONSHIP OF INFRASTRUCTURE PROJECTS TO GROWTH PLAN, DEMOGRAPHIC PATTERNS,AND ECONOMIC PATTERNS
Of the infrastructure projects needed for Knox County, as identified in the 2003 generalneeds inventory, many are planned for its municipalities. With nearly one-half of thecounty’s population in Knoxville, this would follow. However, the urban growth areasand PGAs, with their larger, more prosperous households, also have a number ofinfrastructure projects identified as needed—especially new K-12 school construction,recreation facilities, transportation projects, and water/wastewater projects. Given thepopulation growth during the 1990s in these areas—especially areas now designatedas PGAs—these infrastructure needs are not surprising.
Significantly, however, areas designated as rural also have a number of infrastructureneeds identified. These include seven transportation projects and 15 water & wastewaterprojects. Because most of these were in planning and design or a more advanced stageas of 2003, it is difficult to determine whether their initial, conceptual stage precededthe adoption of Knox County’s growth plan in April 2001. In any event, they had notbeen cancelled because of the growth plan. Because population growth was strongduring the 1990s in some areas of Knox County subsequently designated as rural, it

Growth Plans and Infrastructure Needs in Tennessee: A Nine-County Analysis
42
appears that infrastructure needs may be responding more to demographic trends than tothe growth plan per se.

Growth Plans and Infrastructure Needs in Tennessee: A Nine-County Analysis
43
MADISON COUNTY
MODERATELY LOW DENSITY, LOW GROWTH RATE
Madison County, in central western Tennessee, isdemographically dominated by its largest city. As of 2000,Jackson made up nearly two-thirds of Madison County’spopulation of approximately 92,000. The county’spopulation grew by 18% during the 1990s, with an averagedensity of 165 people per square mile in 2000.
Many of Madison County’s demographic and economiccharacteristics are similar to Tennessee’s: specifically, itsper capita income, percentage of families below thepoverty level, per capita property value, median housingvalue, percentage of population age 45 years and older,and percentage who changed residences in the past fiveyears. In sharp contrast, however, were, first, its per capitaretail sales figure, which—at nearly $16,000—was thehighest of the nine counties examined; and second, itspercentage of workers commuting outside the county,which—at just 11%—was the lowest of the nine counties.Madison County, which is bisected by I-40, clearly is ahub for the surrounding region.
Madison County’spopulation (2000census: 91,837) grew18% in the 1990s. Tothe north of Jacksonespecially, growth wasexplosive. The county’sgrowth plan featuresan expansive urbangrowth boundaryaround Jackson and afew miniscule plannedgrowth areas.Nevertheless—dueperhaps to confusionabout terminology—many infrastructureneeds were identifiedas located in thecounty’s plannedgrowth areas.

44
Growth Plans and Infrastructure Needs in Tennessee: A Nine-County Analysis
KEY STATISTICS
Numbers are rounded.* Municipality located in more than one county.Sources of information:Tennessee Advisory Commission on Intergovernmental Relations, county profiles.Tennessee Department of Economic and Community Development, county profiles.Tennessee State Board of Equalization, 2000 Tax Aggregate Report of Tennessee.United States Census Bureau.University of Tennessee Municipal Technical Advisory Service, cities by county.
Madison County Tennessee 2000 pop. 91,837 5,689,283 % chg in pop 1990-2000 +18% +17% Land area (sq. miles) 557 41,217 2000 density (pop./sq. mi) 165 138 2000 per cap income $19,389 $19,393 2000 families below poverty level 10.8% 10.3% 2000 per cap retail sales $15,939 $11,203 2000 per cap estimated property value $49,003 $51,084 2000 median value, owner-occupied houses $85,100 $93,000 % of pop. 5 years+ living in different house in 1995 49% 46% % of workers 16 years+ commuting out of county 11% 27% % of pop. under age 18 26% 25% % of pop. age 45 years + 34% 36% Largest municipality (2000 pop.) (% of county pop.)
Jackson (59,643) (65%)
Other municipalities
Humboldt* Medon ThreeWay

Growth Plans and Infrastructure Needs in Tennessee: A Nine-County Analysis
45
GROWTH PLAN
Madison County’s growth plan, shown below, was approved by LGPAC onJanuary 26, 2000 (TACIR, June 2002). The numbered sections are census tracts forthe 2000 decennial census.
This map is adapted from a map digitized by the Tennessee Department of Economic and Community Developmentand is for informational purposes only.

46
Growth Plans and Infrastructure Needs in Tennessee: A Nine-County Analysis
DEMOGRAPHIC PATTERNS
The following information is derived from 2000 US Census data at the block group level.Where a block group straddles more than one area type, its area in each type has beenestimated and its population distributed accordingly.
MADISON COUNTY—DEMOGRAPHIC VARIABLES BY PERCENTAGE DISTRIBUTION BY AREA TYPE
Based on our estimates using block group level information, much of Madison County’spopulation lives within city limits. Most of the remainder live within the county’s expansiveUGBs and only 1% live in the county’s PGAs. The age composition of householdersacross the area types is quite similar, but households within city limits tend to be smaller,with a higher rate of poverty. The proportion of non-white population is much higher(nearly 50/50) within city limits than in the UGAs, PGAs, or rural areas.
Madison County—2000 Total City UGB PGA Rural Population 100 63 26 1 11
White 65 54 85 76 79 Non-White 35 46 15 24 21
Under age 18 26 26 25 26 25
Age 18 and over 74 74 75 74 75 Households 100 63 25 1 11
Age of Householder 15-44 47 48 46 43 42 Age of Householder 45-64 33 31 36 36 38 Age of Householder 65+ 20 21 18 20 20
Of Those Classified as Poor 100 76 15 1 9 Overall Poverty Rate = 14.0 Housing Units 100 64 25 1 11
Occupied Units 93 92 95 95 94 Vacant Units 7 8 5 5 6
Of Occupied Housing Units 100 63 25 1 11
1 to 2 in Household 60 62 56 56 55 3 or More in Household 40 38 44 44 45

Growth Plans and Infrastructure Needs in Tennessee: A Nine-County Analysis
47
ECONOMIC PATTERNS
The following information is derived from 2000 US Census data at the block group level.Where a block group straddles more than one area type, its area in each type has beenestimated. Median values have then been calculated for (1) block groups that lie from 51to 100% within the given area type and (2) block groups that lie 50% or less within thegiven area type.
MADISON COUNTY—ECONOMIC VARIABLES BY MEDIAN VALUE BY AREA TYPE
This table shows that people within city limits tend to fare less well on all of the incomevariables than those living in urban growth areas or areas designated as rural. Similarly,housing within city limits tends to be older and less expensive than in other area types.
Madison County—2000 City UGB PGA Rural Median Household Income
% of Block Group <= 50% in Area Type 39,872 31,464 34,861 33,496 % of Block Group >=51% in Area Type 27,415 40,588 ---- 43,194
Median Family Income
% of Block Group <= 50% in Area Type 45,864 35,978 41,369 40,492 % of Block Group >=51% in Area Type 32,917 46,528 ---- 46,167
Per Capita Income
% of Block Group <= 50% in Area Type 18,122 16,073 17,206 16,628 % of Block Group >=51% in Area Type 15,892 18,552 ---- 17,718
Median Year Structures Built
% of Block Group <= 50% in Area Type 1977 1971 1974 1971 % of Block Group >=51% in Area Type 1968 1975 ---- 1978
Median Housing Values
% of Block Group <= 50% in Area Type 80,150 66,400 70,900 71,400 % of Block Group >=51% in Area Type 56,700 82,900 ---- 68,500

48
Growth Plans and Infrastructure Needs in Tennessee: A Nine-County Analysis
POPULATION TRENDS
Intra-county population changes from 1990 to 2000 are shown below, using the 1990census tracts as the unit of analysis. If a tract was not wholly within a single growth planarea type, the percentage allocation across area types was estimated.
MADISON COUNTY—1990 TO 2000 POPULATION CHANGES BY CENSUS TRACT AND AREA TYPE
During the 1990s, as noted above, Madison County’s population grew by 18%. It hadlarge population growth in Census Tracts 15, 16.01, 16.02. These tracts are all locatedto the north of central Jackson, within its urban growth area. In contrast, Census Tracts8, 9, 10, and 11 in south Jackson within the city limits declined in population.
1990
Tracts
1990
Population
2000
Population
1990 to
2000
Difference
Percent
Change
Percent
City in
2000
Percent
UGB in
2000
Percent
PGA in
2000
Percent
Rural in
2000
1 2,685 3,162 477 18 97 3 0 0
2 6,017 6,274 257 4 100 0 0 0
3 4,669 4,910 241 5 100 0 0 0
4 3,290 3,270 -20 -1 100 0 0 0
5 3,949 4,175 226 6 100 0 0 0
6 2,323 2,387 64 3 100 0 0 0
7 2,878 3,343 465 16 100 0 0 0
8 1,192 1,051 -141 -12 100 0 0 0
9 2,995 2,669 -326 -11 100 0 0 0
10 3,633 3,165 -468 -13 100 0 0 0
11 1,664 1,254 -410 -25 100 0 0 0
12 1,041 1,241 200 19 ------------------------------------------------------------
13 6,009 6,009 0 0 48 52 0 0
14.01 2,119 2,193 74 3 13 87 0 0
14.02 2,122 2,114 -8 0 20 80 0 0
15 6,543 8,628 2,085 32 ------------------------------------------------------------
16.01 11,539 19,272 7,733 67 ------------------------------------------------------------
16.02 4,387 6,981 2,594 59 ------------------------------------------------------------
17 1,849 1,798 -51 -3 0 30 5 65
18 2,892 3,317 425 15 5 28 13 55
19 4,186 4,624 438 10 0 46 0 54

Growth Plans and Infrastructure Needs in Tennessee: A Nine-County Analysis
49
INFRASTRUCTURE PROJECTS
The following table is based on data in the 2003 general public infrastructure needs inventory.
MADISON COUNTY—NUMBER OF INFRASTRUCTURE PROJECTS BY AREA TYPE*
Within
City
Within
UGB
Within
PGA
Within
Rural
No Area
Info
Total Projects 124 6 16 41 1Type A Projects 34 1 3 1 1
Business District Development 3 0 0 0 0
Community Development 1 0 0 0 0
Fire Protection 0 0 0 1 0
Industrial Sites and Parks 1 0 0 0 0
K-12 New School Construction 7 0 0 0 0
Law Enforcement 1 0 0 0 0
LEA System-wide Need 2 0 0 0 0
Libraries and Museums 1 0 0 0 0
Non K-12 Education 5 0 0 0 1
Public Buildings 2 0 3 0 0
Public Health Facilities 3 0 0 0 0
Recreation 7 1 0 0 0
Solid Waste 1 0 0 0 0
(N/A)** 90 5 13 40 0Type B Projects 95 6 14 40 0
Property Acquisition 1 1 1 0 0
Stormwater 1 0 0 0 0
Telecommunications 1 0 0 0 0
Transportation 29 3 5 37 0
Water and Wastewater 63 2 8 3 0
(N/A)** 29 0 2 1 1Stage
Completed 56 3 0 6 0
Conceptual 45 2 9 10 1
Construction 7 0 1 1 0
Planning & Design 14 1 6 24 0
State Agency (Completed/Canceled) 2 0 0 0 0Regional Project
Yes 3 0 0 0 0
No 121 6 16 41 1Level of Government
City 23 0 3 0 0
County 9 1 1 14 0
Other 63 2 7 3 0
State 29 3 5 24 1In CIP
Yes 98 2 12 14 0
No 24 4 4 27 1
Unknown 2 0 0 0 0Estimated Cost
$50,000 to $500,000 64 6 6 29 1
$500,001 to $5,000,000 45 0 7 10 0
$5,000,001 to $20,000,000 14 0 3 1 0
$20,000,001 to $50,000,000 0 0 0 1 0
$100,000,001 and Over 1 0 0 0 0
** N/A indicates the number of projects in the dataset that are not included under the Type.
*Projects that are geographically located in more than one area are repeat-counted for each relevant area type.

Growth Plans and Infrastructure Needs in Tennessee: A Nine-County Analysis
50
There were 186 projects reported for Madison County. Of these, only one project spansmore than one growth plan area type. Of the total for the county when summed acrossarea type categories—–i.e., 188 projects, with repeat-counting—more than three-quartersare transportation projects or water & wastewater projects. Some of these projects werein the conceptual stage, as were some of the Type A projects, especially those involvinghigher education.
Most of the infrastructure projects identified as needed in Madison County are within thecities or their urban growth areas. Surprisingly few are located in the urban growth areas,however, while a number of projects—especially transportation and water & wastewaterprojects—were identified as needed in the rather minuscule PGAs. (This raises questionsabout the accuracy of the reporting: in particular, whether the distinction between UGBand PGA was universally understood.) Of the projects to be located in rural areas, mostare transportation projects.
According to the general needs inventory, Madison County has two infrastructure projectsestimated to cost more than $20 million. These include a project estimated to cost$22 million that would involve four-laning State Route 18 south of Jackson, and aproposed 15-mile bypass to the east of Jackson estimated to cost $180 million. As of2003, the State Route 18 project was in a conceptual stage with a start date of 2001;the eastern bypass also was in a conceptual stage with a 2007 start date.
RELATIONSHIP OF INFRASTRUCTURE PROJECTS TO GROWTH PLAN, DEMOGRAPHIC PATTERNS,AND ECONOMIC PATTERNS
The infrastructure projects needed for Madison County, as identified in the 2003 generalneeds inventory, are heavy on infrastructure basics for a growing county: new K-12school construction, water & wastewater projects, and transportation projects. A numberof projects are in the conceptual or planning and design stage, which also indicatestrying to anticipate new growth.
The relationship between needed infrastructure projects and growth plan area types isdifficult to analyze for Madison County. Many of the projects are identified as beinglocated in municipalities. (Jackson, with two-thirds of the county’s population, is thegiant among its four municipalities.) However, as noted above, a number of projects—especially transportation and water & wastewater projects—were reported as neededfor the county’s PGAs, while only six projects were reported as needed for its urbangrowth areas. In contrast, we estimate that approximately one-quarter of the county’spopulation lives in the urban growth areas, while only a tiny fraction lives in its PGAs.This raises questions about whether Item 23 of the inventory form was answered accurately.

Growth Plans and Infrastructure Needs in Tennessee: A Nine-County Analysis
51
MEIGS COUNTY
VERY LOW DENSITY, HIGH GROWTH RATE
Meigs County, in southeastern Tennessee, is the smallestof the counties examined in both population (just over11,000 in 2000) and area (195 square miles). Locatednorth of Hamilton County, Meigs County is striated bynorth-south ridges and is bounded on the west by theTennessee River. In the northwestern section of the county,Watts Bar Lake (created by Watts Bar Dam on theTennessee River) affords recreational opportunities. Thepopulation of Meigs County grew by 38% in the 1990s—in numerical terms, about 3,000—attaining an averagedensity of 57 people per square mile in 2000. Decatur, itsonly city, makes up 13% of its population.
Based on a number of measures, the county is relativelypoor: As of 2000, its per capita income was about$14,500; nearly 16% of its families were below povertylevel; its per capita retail sales were barely over $3,000;its per capita property value was under $40,000; and itsmedian housing value, at about $87,000, was $5,000less than the Tennessee average. Its population is lesslikely to change residences than the Tennessee average,and its percentage of people 45 years and older issomewhat higher. Two-thirds of its workers commuteoutside the county to go to work.
The population ofMeigs County (2000census: 11,086) grew38%, or about 3,000,during the 1990s.Much of this growthwas in its northern andsouthern sections, notin the center where itssole city, Decatur, islocated. Because mostof the county isdesignated for plannedgrowth, it is difficult todetermine whether itsgrowth plan is shapingits infrastructure needs.

52
Growth Plans and Infrastructure Needs in Tennessee: A Nine-County Analysis
KEY STATISTICS
Numbers are rounded.Sources of information:Tennessee Advisory Commission on Intergovernmental Relations, county profiles.Tennessee Department of Economic and Community Development, county profiles.Tennessee State Board of Equalization, 2000 Tax Aggregate Report of Tennessee.United States Census Bureau.University of Tennessee Municipal Technical Advisory Service, cities by county.
Meigs County Tennessee 2000 pop. 11,086 5,689,283 % chg in pop 1990-2000 +38% +17% Land area (sq. miles) 195 41,217 2000 density (pop./sq. mi) 57 138 2000 per cap income $14,551 $19,393 2000 families below poverty level 15.8% 10.3% 2000 per cap retail sales $3,107 $11,203 2000 per cap estimated property value $39,529 $51,084 2000 median value, owner-occupied houses $87,200 $93,000 % of pop. 5 years+ living in different house in 1995 41% 46% % of workers 16 years+ commuting out of county 67% 27% % of pop. under age 18 25% 25% % of pop. age 45 years + 38% 36% Largest municipality (2000 pop.) (% of county pop.)
Decatur (1,395) (13%)
Other municipalities
__

Growth Plans and Infrastructure Needs in Tennessee: A Nine-County Analysis
53
GROWTH PLAN
Meigs County’s growth plan, shown below, was approved by LGPAC on January 26, 2000(TACIR, June 2002). The numbered sections are census tracts for the 2000 decennialcensus.
This map is adapted from a map digitized by the Tennessee Department of Economic and Community Developmentand is for informational purposes only.

54
Growth Plans and Infrastructure Needs in Tennessee: A Nine-County Analysis
DEMOGRAPHIC PATTERNS
The following information is derived from 2000 US Census data at the block group level.Where a block group straddles more than one area type, its area in each type has beenestimated and its population distributed accordingly.
MEIGS COUNTY—DEMOGRAPHIC VARIABLES BY PERCENTAGE DISTRIBUTION BY AREA TYPE
*In Meigs County, using geographic proportionality as the basis for allocating population at the block group levelacross area types has resulted in an underestimate of the population within Decatur.
Based on our block group estimates, approximately 10% of Meigs County’s populationlives within its one city, Decatur, or that city’s UGB, and only 2% of the county’spopulation is non-white. The remainder is distributed fairly equally between PGAs andareas designated as rural. The age composition of householders, the size of households,and the rate of poverty is quite similar across all four area types.
Meigs County—2000 Total City* UGB PGA Rural Population 100 4 6 42 48
White 98 99 99 98 98 Non-White 2 1 1 2 2
Under age 18 25 25 25 25 25
Age 18 and over 75 75 75 75 75 Households 100 4 6 42 48
Age of Householder 15-44 42 43 42 42 42 Age of Householder 45-64 38 37 38 39 38 Age of Householder 65+ 20 20 20 19 20
Of Those Classified as Poor 100 3.96 6.27 42.75 47.02 Overall Poverty Rate = 18.3 Housing Units 100 4 6 42 49
Occupied Units 83 90 89 83 82 Vacant Units 17 10 11 17 18
Of Occupied Housing Units 100 4 6 42 48
1 to 2 in Household 58 58 59 59 58 3 or More in Household 42 42 41 41 42

Growth Plans and Infrastructure Needs in Tennessee: A Nine-County Analysis
55
ECONOMIC PATTERNS
The following information is derived from 2000 US Census data at the block group level.Where a block group straddles more than one area type, its area in each type has beenestimated. Median values have then been calculated for (1) block groups that lie from 51to 100% within the given area type and (2) block groups that lie 50% or less within thegiven area type.
MEIGS COUNTY—ECONOMIC VARIABLES BY MEDIAN VALUE BY AREA TYPE
The small population size in Meigs County and the fact that all of its block groupsstraddle at least two area types makes it difficult to statistically reveal its intra-countyeconomic patterns based on 2000 census data. Distinctions among the variables donot show up. Intuitively, however, it can be said that areas adjacent or near to WattsBar Lake along the county’s northwestern side are likely to increase in prosperity,especially if land designation changes contemplated by the Tennessee Valley Authorityare actualized. These changes could make large tracts of shoreline acreage on WattsBar Lake available for residential and commercial development (Rebecca Ferrar, “Landof Promise,” Knoxville News-Sentinel, June 8, 2005).
Meigs County—2000 City UGB PGA Rural Median Household Income
% of Block Group <= 50% in Area Type 28,933 28,933 28,933 28,138 % of Block Group >=51% in Area Type ---- ---- ---- ----
Median Family Income
% of Block Group <= 50% in Area Type 33,202 33,201 33,201 34,226 % of Block Group >=51% in Area Type ---- ---- ---- ----
Per Capita Income
% of Block Group <= 50% in Area Type 15,190 15,190 15,190 15,707 % of Block Group >=51% in Area Type ---- ---- ---- ----
Median Year Structures Built
% of Block Group <= 50% in Area Type 1982 1982 1982 1982 % of Block Group >=51% in Area Type ---- ---- ---- ----
Median Housing Values
% of Block Group <= 50% in Area Type 86,050 86,050 86,050 86,300 % of Block Group >=51% in Area Type ---- ---- ---- ----
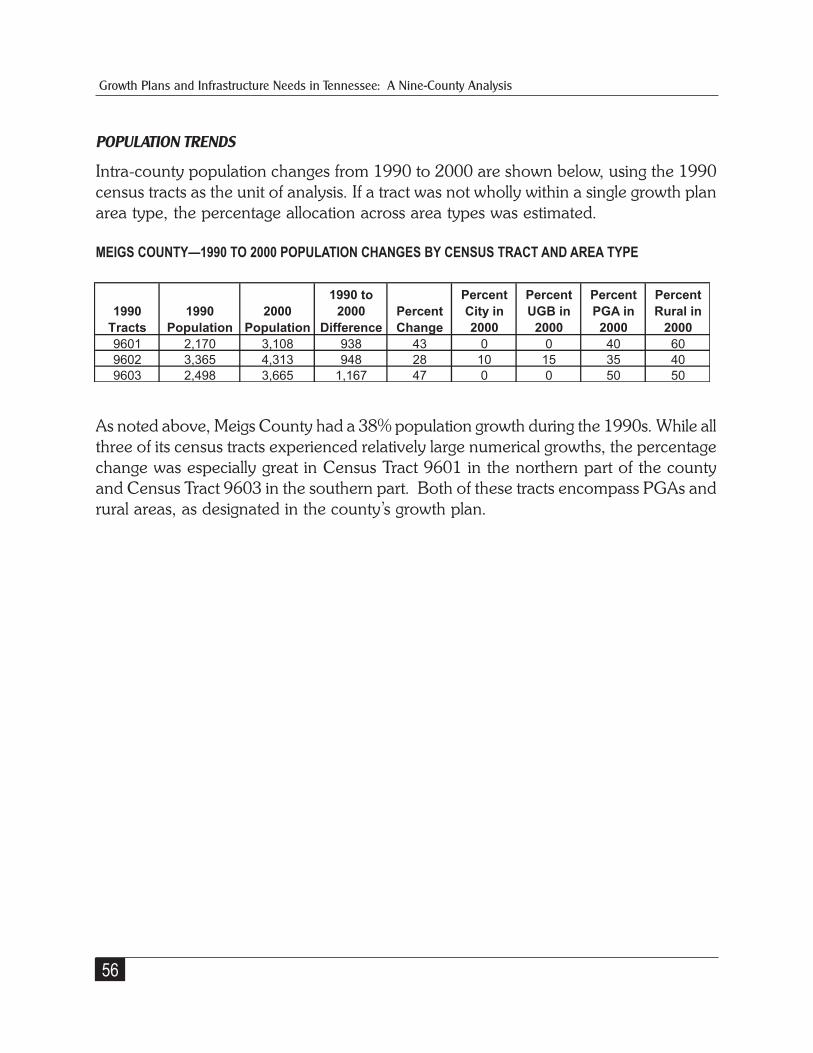
56
Growth Plans and Infrastructure Needs in Tennessee: A Nine-County Analysis
POPULATION TRENDS
Intra-county population changes from 1990 to 2000 are shown below, using the 1990census tracts as the unit of analysis. If a tract was not wholly within a single growth planarea type, the percentage allocation across area types was estimated.
MEIGS COUNTY—1990 TO 2000 POPULATION CHANGES BY CENSUS TRACT AND AREA TYPE
As noted above, Meigs County had a 38% population growth during the 1990s. While allthree of its census tracts experienced relatively large numerical growths, the percentagechange was especially great in Census Tract 9601 in the northern part of the countyand Census Tract 9603 in the southern part. Both of these tracts encompass PGAs andrural areas, as designated in the county’s growth plan.
1990
Tracts
1990
Population
2000
Population
1990 to
2000
Difference
Percent
Change
Percent
City in
2000
Percent
UGB in
2000
Percent
PGA in
2000
Percent
Rural in
2000
9601 2,170 3,108 938 43 0 0 40 60
9602 3,365 4,313 948 28 10 15 35 40
9603 2,498 3,665 1,167 47 0 0 50 50

Growth Plans and Infrastructure Needs in Tennessee: A Nine-County Analysis
57
INFRASTRUCTURE PROJECTS
The following table is based on data in the 2003 general public infrastructure needs inventory.
MEIGS COUNTY—NUMBER OF INFRASTRUCTURE PROJECTS BY AREA TYPE*
Within
City
Within
UGB
Within
PGA
Within
Rural
Total Projects 11 8 8 6Type A Projects 4 3 2 1
Community Development 1 0 0 0
Industrial Sites and Parks 0 1 1 0
LEA System-wide Need 1 0 0 0
Libraries and Museums 0 0 0 1
Recreation 1 1 0 0
Solid Waste 1 1 1 0
(N/A)** 7 5 6 5Type B Projects 8 6 7 5
Other Utilities 1 1 1 0
Property Acquisition 0 1 1 0
Transportation 5 2 3 5
Water and Wastewater 2 2 2 0
(N/A)** 3 2 1 1Stage
Completed 0 0 1 0
Conceptual 5 4 2 0
Construction 1 2 3 0
Planning & Design 5 2 2 6Regional Project
Yes 0 0 0 0
No 11 8 8 6Level of Government
City 4 2 0 0
County 2 2 3 3
Joint 2 2 1 1
Other 1 1 3 0
State 2 1 1 2In CIP
Yes 1 1 1 0
No 10 7 7 6Estimated Cost
$50,000 to $500,000 8 3 5 2
$500,001 to $5,000,000 1 3 1 2
$5,000,001 to $20,000,000 1 1 1 2
$20,000,001 to $50,000,000 1 1 1 0
*Projects that are geographically located in more than one area are repeat-counted for each relevant area type.
** N/A indicates the number of projects in the dataset that are not included under the Type.

Growth Plans and Infrastructure Needs in Tennessee: A Nine-County Analysis
58
There were 17 projects reported for Meigs County. Of these, six projects span two ormore growth plan area types. These include one industrial site project and two solidwaste projects as well as transportation and “other utilities” projects. None of the projectsfor Meigs County were identified as regional. Of the total for the county when summedacross area type categories—i.e., 33, with repeat-counting—about two-thirds are TypeB projects.
Most of the 11 projects in a conceptual stage are within Decatur or its UGB. Theseconceptual projects tend to be Type B projects such as transportation, water &wastewater, and other utilities.
According to the general needs inventory, Meigs County has one infrastructure projectestimated to cost $20 million or more: a road project (estimated to cost $40 million) tofour-lane State Route 30, which bisects the county from east to west. State Route 30has become a major connector between Rhea County to the west and Meigs County,now that a ferry crossing the Tennessee River has been replaced by a bridge. As of2003, the project, which started in 2001, was under construction.
RELATIONSHIP OF INFRASTRUCTURE PROJECTS TO GROWTH PLAN, DEMOGRAPHIC PATTERNS,AND ECONOMIC PATTERNS
The infrastructure projects needed for Meigs County, as identified in the 2003 generalneeds inventory, are mainly located within Decatur, its UGB, or PGA in the county.Only six projects—including five transportation projects—were identified as needed inrural areas.
Despite the strong correlation between infrastructure identified as needed and areasdesignated for growth, it is difficult to determine whether the county’s growth plan is, infact, playing a large role in shaping the county’s infrastructure needs. If the changesnow contemplated for the Watts Bar Lake shoreline are approved by TVA, this shorelinearea—now designated as rural in the Meigs County growth plan—is likely to become atarget for development. It will be interesting to see how this affects the county’s growthplan and/or determination of public infrastructure needs.

Growth Plans and Infrastructure Needs in Tennessee: A Nine-County Analysis
59
RUTHERFORD COUNTY
MODERATELY HIGH DENSITY, HIGH GROWTH RATE
Rutherford County, in middle Tennessee to the southeastof Davidson County, is on the move in many ways. Witha 2000 population of just over 182,000, it grew by 54% inthe 1990s. Murfreesboro, its largest city, is home to MiddleTennessee State University and makes up nearly 40% ofthe county’s population. With an average populationdensity of nearly 300 people per square mile, RutherfordCounty is more than twice as dense as Tennessee as awhole.
Rutherford County’s 2000 per capita income, at just under$20,000, is similar to Tennessee’s, but fewer than 6% ofits families are below the poverty level. As of 2000, its percapita retail sales were similar to Tennessee’s, as was itsper capita property value. In 2000, its median housingvalue was more than 20% higher, however, and over halfits population lived in a different house five years before.Its population is young—in 2000, just over a quarter of itspeople were 45 years or older—and nearly 40% of itsworkers commute outside the county.
The population ofRutherford County(2000 census: 182,023)grew a whopping63,453 (54%) in the1990s, mainly in andaround the four citiesin its northwestern andcentral sections. Theseareas have beendesignated for urbangrowth in the county’sgrowth plan; theremainder to the southand east is designatedas rural. Six new water& wastewater projectsare planned for itsrural areas, raising thequestion: Is the growthplan making adifference?

60
Growth Plans and Infrastructure Needs in Tennessee: A Nine-County Analysis
KEY STATISTICS
Numbers are rounded.Sources of information:Tennessee Advisory Commission on Intergovernmental Relations, county profiles.Tennessee Department of Economic and Community Development, county profiles.Tennessee State Board of Equalization, 2000 Tax Aggregate Report of Tennessee.United States Census Bureau.University of Tennessee Municipal Technical Advisory Service, cities by county.
Rutherford County Tennessee 2000 pop. 182,023 5,689,283 % chg in pop 1990-2000 +54% +17% Land area (sq. miles) 619 41,217 2000 density (pop./sq. mi) 294 138 2000 per cap income $19,938 $19,393 2000 families below poverty level 05.8% 10.3% 2000 per cap retail sales $10,361 $11,203 2000 per cap estimated property value $52,555 $51,084 2000 median value, owner-occupied houses $113,500 $93,000 % of pop. 5 years+ living in different house in 1995 56% 46% % of workers 16 years+ commuting out of county 38% 27% % of pop. under age 18 26% 25% % of pop. age 45 years + 27% 36% Largest municipality (2000 pop.) (% of county pop.)
Murfreesboro (68,816) (38%)
Other municipalities
Eagleville LaVergne Smyrna

Growth Plans and Infrastructure Needs in Tennessee: A Nine-County Analysis
61
GROWTH PLAN
Rutherford County’s growth plan, shown below, was approved by LGPAC on April 26,2000 (TACIR, June 2002). The numbered sections are census tracts for the 2000decennial census.
This map is adapted from a map digitized by the Tennessee Department of Economic and Community Developmentand is for informational purposes only.

62
Growth Plans and Infrastructure Needs in Tennessee: A Nine-County Analysis
DEMOGRAPHIC PATTERNS
The following information is derived from 2000 US Census data at the block group level.Where a block group straddles more than one area type, its area in each type has beenestimated and its population distributed accordingly.
RUTHERFORD COUNTY—DEMOGRAPHIC VARIABLES BY PERCENTAGE DISTRIBUTION BY AREA TYPE
An estimated 90% of Rutherford County’s population lives within either its municipalitiesor their urban growth areas. Since Rutherford County has no PGAs, the remainderlives in areas designated as rural. The age composition of householders in the urbangrowth areas tends to be younger than in the other areas, and the urban growth areashave proportionally more children under age 18. The areas within city limits tend tohave smaller households than the other areas, and the city areas also have somewhathigher rates of poverty and non-white populations.
Rutherford County—2000 Total City UGB PGA Rural Population 100 53 36 0 10
White 86 83 100 0 100 Non-White 14 17 12 0 7
Under age 18 26 25 29 0 27
Age 18 and over 74 75 71 0 73 Households 100 55 35 0 10
Age of Householder 15-44 57 58 58 0 50 Age of Householder 45-64 30 29 31 0 34 Age of Householder 65+ 13 14 10 0 16
Of Those Classified as Poor 100 65 27 0 8 Overall Poverty Rate = 9.0 Housing Units 100 55 35 0 10
Occupied Units 94 94 94 0 95 Vacant Units 6 6 6 0 5
Of Occupied Housing Units 100 55 35 0 10
1 to 2 in Household 54 58 49 0 49 3 or More in Household 46 42 51 0 51

Growth Plans and Infrastructure Needs in Tennessee: A Nine-County Analysis
63
ECONOMIC PATTERNS
The following information is derived from 2000 US Census data at the block group level.Where a block group straddles more than one area type, its area in each type has beenestimated. Median values have then been calculated for (1) block groups that lie from51 to 100% within the given area type and (2) block groups that lie 50% or less withinthe given area type.
RUTHERFORD COUNTY—ECONOMIC VARIABLES BY MEDIAN VALUE BY AREA TYPE
When the area types are examined by their predominant block group subcategories(>=51% in area type), it is evident that people in the cities tend to fare the worst on allthree income variables, while those in urban growth areas fare the best. Similarly,housing in urban growth areas tends to be newer and much more expensive than incities or in areas designated as rural.
Rutherford County—2000 City UGB PGA Rural Median Household Income
% of Block Group <= 50% in Area Type 49,819 43,546 ---- 44,631 % of Block Group >=51% in Area Type 36,697 50,728 ---- 47,004
Median Family Income
% of Block Group <= 50% in Area Type 54,222 50,203 ---- 51,365 % of Block Group >=51% in Area Type 47,422 55,556 ---- 51,250
Per Capita Income
% of Block Group <= 50% in Area Type 19,865 19,086 ---- 19,377 % of Block Group >=51% in Area Type 18,805 19,831 ---- 19,086
Median Year Structures Built
% of Block Group <= 50% in Area Type 1985 1977 ---- 1982 % of Block Group >=51% in Area Type 1975 1986 ---- 1979
Median Housing Values
% of Block Group <= 50% in Area Type 109,900 101,800 ---- 107,250 % of Block Group >=51% in Area Type 100,000 121,100 ---- 102,600

64
Growth Plans and Infrastructure Needs in Tennessee: A Nine-County Analysis
POPULATION TRENDS
Intra-county population changes from 1990 to 2000 are shown below, using the 1990census tracts as the unit of analysis. If a tract was not wholly within a single growth planarea type, the percentage allocation across area types was estimated.
RUTHERFORD COUNTY—1990 TO 2000 POPULATION CHANGES BY CENSUS TRACT AND AREA TYPE
During the 1990s, as noted above, Rutherford County had a 54% population growthrate. Growth occurred in many parts of the county, especially in the following censustracts: Tracts 401 and 403.1, in the LaVergne and Smyrna areas in the northwesternsection of the county; Tracts 409, 411, 412, 413, and 414, in a ring around Murfreesboro;Tract 405 in the northeastern section of the county; and Tract 407 in the county’s southcentral area. Tracts 405 and 407 are predominantly designated as rural; the othertracts with large population growth are wholly or largely within city limits or urbangrowth areas.
1990
Tracts
1990
Population
2000
Population
1990 to
2000
Difference
Percent
Change
Percent
City in
2000
Percent
UGB in
2000
Percent
PGA in
2000
Percent
Rural in
2000
401 4,595 13,199 8,604 187 100 0 0 0
402 1,474 2,277 803 54 100 0 0 0
403.01 7,472 14,511 7,039 94 80 20 0 0
403.02 6,084 6,832 748 12 31 69 0 0
404.01 1,194 1,389 195 16 90 10 0 0
404.02 8,500 11,094 2,594 31 ------------------------------------------------------------
405 5,188 8,968 3,780 73 0 40 0 60
406 3,568 4,181 613 17 0 0 0 100
407 4,634 7,454 2,820 61 3 13 0 83
408.01 10,738 15,878 5,140 48 ------------------------------------------------------------
408.02 3,087 5,106 2,019 65 5 43 0 53
409 7,995 16,117 8,122 102 27 73 0 0
410 3,701 4,946 1,245 34 10 90 0 0
411 4,501 8,503 4,002 89 10 80 0 10
412 2,245 6,187 3,942 176 10 65 0 25
413 7,310 10,271 2,961 41 100 0 0 0
414 7,660 11,465 3,805 50 72 28 0 0
415 3,493 3,154 -339 -10 100 0 0 0
416 5,438 5,456 18 0 100 0 0 0
417 4,625 5,060 435 9 100 0 0 0
418 2,963 4,256 1,293 44 90 10 0 0
419 3,573 4,285 712 20 100 0 0 0
420 3,369 5,159 1,790 53 75 25 0 0
421 5,163 6,275 1,112 22 77 23 0 0

Growth Plans and Infrastructure Needs in Tennessee: A Nine-County Analysis
65
INFRASTRUCTURE PROJECTS
The following table is based on data in the 2003 general public infrastructure needs inventory.
RUTHERFORD COUNTY—NUMBER OF INFRASTRUCTURE PROJECTS BY AREA TYPE*Within
City
Within
UGB
Within
PGA
Within
Rural
Site Not
Det.
No Area
Info
Total Projects 189 59 5 15 2 13Type A Projects 73 10 2 7 2 13
Business District Development 2 0 0 0 0 0
Community Development 8 1 0 0 0 0
Fire Protection 5 1 0 0 0 0
Industrial Sites and Parks 2 1 0 0 0 0
K-12 New School Construction 11 1 1 4 1 0
Law Enforcement 8 0 0 0 0 2
LEA System-wide Need 3 2 1 3 0 0
Libraries and Museums 1 0 0 0 0 0
Non K-12 Education 8 0 0 0 0 9
Other Facilities 0 1 0 0 0 0
Public Buildings 2 0 0 0 0 0
Public Health Facilities 4 1 0 0 0 2
Recreation 19 2 0 0 1 0
(N/A)** 116 49 3 8 0 0Type B Projects 123 51 3 8 0 0
Other Utilities 4 1 0 0 0 0
Property Acquisition 3 1 0 0 0 0
Stormwater 1 0 0 0 0 0
Transportation 65 13 2 2 0 0
Water and Wastewater 50 36 1 6 0 0
(N/A)** 66 8 2 7 2 13Stage
Completed 45 11 0 1 0 0
Conceptual 52 17 0 6 2 13
Construction 33 15 2 5 0 0
Planning & Design 45 15 3 3 0 0
State Agency (Completed/Canceled) 14 1 0 0 0 0Regional Project
Yes 20 1 0 0 0 0
No 169 58 5 15 2 13Level of Government
City 134 35 0 6 1 0
County 13 5 2 8 1 0
Joint 4 0 1 0 0 0
Other 3 9 1 1 0 0
State 35 10 1 0 0 13In CIP
Yes 129 39 2 11 2 0
No 40 19 3 4 0 11
Unknown 20 1 0 0 0 2Estimated Cost
$50,000 to $500,000 59 11 1 3 0 3
$500,001 to $5,000,000 90 40 1 9 0 7
$5,000,001 to $20,000,000 34 8 2 3 1 2
$20,000,001 to $50,000,000 5 0 1 0 1 0
$50,000,001 to $100,000,000 1 0 0 0 0 0
$100,000,001 and Over 0 0 0 0 0 1
** N/A indicates the number of projects in the dataset that are not included under the Type.
*Projects that are geographically located in more than one area are repeat-counted for each relevant area type.
Growth Plans and Infrastructure Needs in Tennessee: A Nine-County Analysis
66
There were 189 projects reported for Rutherford County. Of these, 43 projects span twoor more growth plan area types. These include LEA system-wide needs and recreationprojects as well as eight transportation projects and 32 water & wastewater projects. Inaddition, 21 regional projects were reported for Rutherford County, including highereducation, law enforcement, and public health projects as well as one property acquisitionproject. Of the total for the county when summed across area type categories—i.e., 283,including repeat-counting—nearly two-thirds of the projects are Type B projects.
Most of the projects are within the cities or their UGBs, and most of them servetransportation, water & wastewater, or new school construction needs. Five projectswere identified in error as being located within PGAs. (Rutherford County has no PGAs.)
Of projects that are in the conceptual stage, 25 are water & wastewater projects, while15 are transportation projects. In addition, some higher education projects and LEAsystem-wide projects were identified as conceptual.
According to the general needs inventory, Rutherford County has several non-stateinfrastructure projects estimated to cost more than $20 million: an expansion of theSinking Creek Wastewater Treatment Plant in Murfreesboro, estimated to cost $33million; two new high schools, one in Murfreesboro (estimated to cost about $28 million)and one in an undetermined location (estimated to cost $38 million); and a project,estimated to cost about $24 million, to five-lane State Route 96 from west of Murfreesboroto State Route 840. As of 2003, the Murfreesboro high school was under constructionwhereas the other high school was in the conceptual stage. In 2003, the widening ofState Route 96 was in the planning and design stage.
RELATIONSHIP OF INFRASTRUCTURE PROJECTS TO GROWTH PLAN, DEMOGRAPHIC PATTERNS,AND ECONOMIC PATTERNS
The infrastructure projects needed for Rutherford County, as identified in the 2003general needs inventory, show a strong emphasis on the needs of its existing municipalitiesand their urban growth areas, which contain an estimated 90% of the county’s population.The types of projects are those that would be expected in a fast-growing county: newK-12 schools, transportation, and water & wastewater. Projects within municipalitiesalso include four economic development (business district and industrial site) projects,as well as eight community development projects and eight law enforcement projects.These appear to fit the needs of the demographic and economic patterns of the municipalities.
In addition, however, four K-12 new school construction projects were identified asneeded in rural areas, as were six water & wastewater projects. Six of the rural areas’total of 15 needed infrastructure projects were in the conceptual stage as of 2003, and11 were in a capital improvement program. This suggests that the county growth planmay be having little effect on infrastructure projects identified as needed within the county.

Growth Plans and Infrastructure Needs in Tennessee: A Nine-County Analysis
67
SULLIVAN COUNTY
MODERATELY HIGH DENSITY, LOW GROWTH RATE
Sullivan County, in upper east Tennessee, has three majorcities—Johnson City, Kingsport, and Bristol—but noneof them is wholly within the county. (Strictly speaking,Bristol is, but Bristol, Virginia, lies right across the stateborder.) Johnson City, the largest among the Tri-Cities, islocated mainly in Washington County and accounts for atiny fraction of Sullivan County’s population, which wasslightly over 150,000 in 2000. Sullivan County grew by asluggish 7% in the 1990s, reaching a population densityof 371 people per square mile in 2000.
Many of Sullivan County’s demographic and economicindicators resemble the average for Tennessee: its percapita income, percentage of families below the povertylevel, per capita retail sales, per capita property value, andmedian housing value. Its percentage of workerscommuting outside the county is similar to Tennessee’s,and its percentage of people who have recently changedhomes is slightly lower. Notably, as of 2000, 42% of itspopulation was 45 years or older—the oldest demographicprofile of the nine counties examined.
Sullivan County’spopulation (2000census: 153,048) grew7% in the 1990s.Growth was especiallystrong in areasdesignated for plannedgrowth (mainly the“infill” between the “Tri-Cities”), but populationgrowth also was strongin some areasdesignated as rural.With 10 water orwastewater projectsidentified for ruralareas, growth trendsrather than growthplans may be drivingpublic infrastructure.

68
Growth Plans and Infrastructure Needs in Tennessee: A Nine-County Analysis
KEY STATISTICS
Numbers are rounded.* Municipalities located in more than one county.**As of the 2000 census, Johnson City, which is located mainly in Washington County, accounted for only 240 ofSullivan County’s population. Kingsport, with a 2000 census population of 44,905, accounted for 41,998 of SullivanCounty’s population, or 27%.Sources of information:Tennessee Advisory Commission on Intergovernmental Relations, county profiles.Tennessee Department of Economic and Community Development, county profiles.Tennessee State Board of Equalization, 2000 Tax Aggregate Report of Tennessee.United States Census Bureau.University of Tennessee Municipal Technical Advisory Service, cities by county.
Sullivan County Tennessee 2000 pop. 153,048 5,689,283 % chg in pop 1990-2000 +07% +17% Land area (sq. miles) 413 41,217 2000 density (pop./sq. mi) 371 138 2000 per cap income $19,202 $19,393 2000 families below poverty level 09.7% 10.3% 2000 per cap retail sales $12,157 $11,203 2000 per cap estimated property value $51,966 $51,084 2000 median value, owner-occupied houses $88,000 $93,000 % of pop. 5 years+ living in different house in 1995 40% 46% % of workers 16 years+ commuting out of county 28% 27% % of pop. under age 18 22% 25% % of pop. age 45 years + 42% 36% Largest municipality (2000 pop.) (% of county pop.)
JohnsonCity* (55,469) (0.16%**)
Other municipalities
BluffCity Bristol Kingsport*

Growth Plans and Infrastructure Needs in Tennessee: A Nine-County Analysis
69
GROWTH PLAN
Sullivan County’s growth plan, shown below, was approved by LGPAC on June 28, 2000(TACIR, June 2002). The numbered sections are census tracts for the 2000 decennialcensus.
This map is adapted from a map digitized by the Tennessee Department of Economic and Community Developmentand is for informational purposes only.

70
Growth Plans and Infrastructure Needs in Tennessee: A Nine-County Analysis
DEMOGRAPHIC PATTERNS
The following information is derived from 2000 US Census data at the block group level.Where a block group straddles more than one area type, its area in each type has beenestimated and its population distributed accordingly.
SULLIVAN COUNTY—DEMOGRAPHIC VARIABLES BY PERCENTAGE DISTRIBUTION BY AREA TYPE
Sullivan County’s population is spread across all four area types. Areas within city limitstend to have smaller, older households and a higher rate of poverty. In contrast,populations within urban growth areas or PGAs—an estimated 39% of the county’stotal population—have proportionally lower rates of poverty.
Sullivan County—2000 Total City UGB PGA Rural Population 100 44 28 11 16
White 97 95 98 98 98 Non-White 3 5 2 2 2
Under age 18 22 21 22 21 23
Age 18 and over 78 79 78 79 77 Households 100 46 28 11 15
Age of Householder 15-44 38 37 40 38 40 Age of Householder 45-64 36 34 38 38 39 Age of Householder 65+ 25 29 22 24 21
Of Those Classified as Poor 100 56 21 8 15 Overall Poverty Rate = 12.9 Housing Units 100 47 27 11 15
Occupied Units 92 91 93 93 91 Vacant Units 8 9 7 7 9
Of Occupied Housing Units 100 46 28 11 15
1 to 2 in Household 63 67 61 61 58 3 or More in Household 37 33 39 39 42

Growth Plans and Infrastructure Needs in Tennessee: A Nine-County Analysis
71
ECONOMIC PATTERNS
The following information is derived from 2000 US Census data at the block group level.Where a block group straddles more than one area type, its area in each type has beenestimated. Median values have then been calculated for (1) block groups that lie from 51to 100% within the given area type and (2) block groups that lie 50% or less within thegiven area type.
SULLIVAN COUNTY—ECONOMIC VARIABLES BY MEDIAN VALUE BY AREA TYPE
Within Sullivan County, urban growth areas are the most prosperous, followed by PGAs.Cities fare the worst on all three income variables except per capita income. On thatvariable, areas designated as rural have the lowest average per capita income when onlythe predominant block group subcategory (>=51% in area type) is considered. Housingin city areas tends to be much older and less expensive than in the other area types,especially the urban growth areas.
Sullivan County--2000 City UGB PGA Rural Median Household Income
% of Block Group <= 50% in Area Type 36,298 30,710 31,563 31,881 % of Block Group >=51% in Area Type 26,806 39,972 35,292 31,982
Median Family Income
% of Block Group <= 50% in Area Type 42,513 36,974 36,983 38,119 % of Block Group >=51% in Area Type 34,797 45,875 42,277 39,107
Per Capita Income
% of Block Group <= 50% in Area Type 17,516 17,340 17,369 17,820 % of Block Group >=51% in Area Type 16,942 20,745 18,358 15,914
Median Year Structures Built
% of Block Group <= 50% in Area Type 1977 1968 1969 1967 % of Block Group >=51% in Area Type 1957 1975 1972 1978
Median Housing Values
% of Block Group <= 50% in Area Type 88,000 80,550 81,100 82,350 % of Block Group >=51% in Area Type 71,100 98,100 87,350 82,300

72
Growth Plans and Infrastructure Needs in Tennessee: A Nine-County Analysis
POPULATION TRENDS
Intra-county population changes from 1990 to 2000 are shown below, using the 1990census tracts as the unit of analysis. If a tract was not wholly within a single growth planarea type, the percentage allocation across area types was estimated.
SULLIVAN COUNTY—1990 TO 2000 POPULATION CHANGES BY CENSUS TRACT AND AREA TYPE
As noted above, Sullivan County as a whole experienced only a modest growth rate of7% during the 1990s. Growth was strong in four census tracts, however: Tract 413, tothe south of Kingsport; Tract 436, between Kingsport and Johnson City, Tract 434,between Kingsport and Bristol; and Tract 433, between Bristol and Johnson City. Tracts434 and 436 are predominantly within PGAs or urban growth areas. Tracts 413 and433, however, include large portions of areas designated as rural.
1990
Tracts
1990
Population
2000
Population
1990 to
2000
Difference
Percent
Change
Percent
City in
2000
Percent
UGB in
2000
Percent
PGA in
2000
401 62 69 7 11 ---------------------------------------------
402 2,548 2,513 -35 -1 96 4 0
403 2,798 2,668 -130 -5 100 0 0
404 314 134 -180 -57 ---------------------------------------------
405 4,227 4,237 10 0 100 0 0
406 3,829 3,339 -490 -13 100 0 0
407 2,361 2,523 162 7 95 5 0
408 3,843 3,615 -228 -6 100 0 0
409 2,746 2,987 241 9 95 5 0
410 2,941 3,560 619 21 30 70 0
411 2,505 2,421 -84 -3 100 0 0
412 5,820 6,531 711 12 13 88 0
413 3,243 4,304 1,061 33 17 40 3
414 5,103 5,413 310 6 30 33 5
415 2,319 2,668 349 15 93 8 0
416 2,324 2,311 -13 -1 85 15 0
417 3,616 3,393 -223 -6 65 35 0
418 4,489 4,541 52 1 43 57 0
419 3,426 3,245 -181 -5 10 90 0
420 3,628 3,632 4 0 0 10 73
421 4,971 5,555 584 12 30 25 45
422 2,813 3,031 218 8 5 50 0
423 5,848 6,499 651 11 15 75 5
424 2,877 3,297 420 15 7 22 33
425 3,328 3,234 -94 -3 30 60 10
426 4,272 4,273 1 0 93 7 0
427.01 4,930 5,059 129 3 100 0 0
427.02 2,169 2,043 -126 -6 100 0 0
428.01 2,617 2,646 29 1 100 0 0
428.02 5,138 5,017 -121 -2 88 13 0
429 3,188 3,409 221 7 80 20 0
430 4,507 4,601 94 2 45 50 0
431 2,955 3,147 192 6 3 8 0
432 7,907 8,558 651 8 2 33 0
433 8,587 10,600 2,013 23 11 21 4
434 8,339 9,820 1,481 18 7 17 58
435 3,115 3,480 365 12 5 10 55
436 3,893 4,674 781 20 7 20 67Dashed lines indicate tracts that could not be allocated across area types.
63
18
30
7
5
90
65
0
0
0
0
38
0
0
0
17
0
45
5
0
0
0
0
0
40
33
0
0
0
0
0
---------------
0
0
0
Percent
Rural in
2000
---------------
0
0

Growth Plans and Infrastructure Needs in Tennessee: A Nine-County Analysis
73
INFRASTRUCTURE PROJECTS
The following table is based on data in the 2003 general public infrastructure needs inventory.
SULLIVAN COUNTY—NUMBER OF INFRASTRUCTURE PROJECTS BY AREA TYPE*Within
City
Within
UGB
Within
PGA
Within
Rural
Site Not
Det.
No Area
Info
Total Projects 178 37 18 18 3 16Type A Projects 48 3 6 5 2 7
Business District Development 2 0 0 0 0 0
Community Development 3 0 1 0 0 0
Fire Protection 1 0 0 0 0 0
Industrial Sites and Parks 4 2 2 0 1 0
K-12 New School Construction 1 0 0 0 0 0
Law Enforcement 0 0 1 1 0 0
LEA System-wide Need 3 0 0 1 0 0
Libraries and Museums 2 0 0 1 0 0
Non K-12 Education 2 0 0 0 0 3
Other Facilities 1 0 0 0 0 0
Public Buildings 7 0 0 0 0 0
Public Health Facilities 0 0 0 0 0 2
Recreation 21 1 1 2 1 2
Solid Waste 1 0 1 0 0 0
(N/A)** 130 34 12 13 1 9Type B Projects 135 36 13 13 1 0
Property Acquisition 2 2 0 0 0 0
Stormwater 3 0 0 0 0 0
Telecommunications 4 1 1 1 0 0
Transportation 60 3 5 2 0 0
Water and Wastewater 66 30 7 10 1 0
(N/A)** 43 1 5 5 2 16Stage
Completed 53 9 3 5 0 1
Conceptual 58 11 5 8 3 5
Construction 25 6 4 2 0 0
Planning & Design 42 11 6 3 0 0
State Agency (Completed/Canceled) 0 0 0 0 0 1
Unknown 0 0 0 0 0 9Regional Project
Yes 0 0 1 0 0 7
No 178 37 17 18 3 9Level of Government
City 165 23 6 2 2 0
County 2 2 7 6 1 0
Joint 5 5 3 1 0 0
Other 2 7 0 8 0 0
State 4 0 2 1 0 7
Unknown 0 0 0 0 0 9In CIP
Yes 155 21 6 0 1 0
No 23 16 12 18 2 14
Unknown 0 0 0 0 0 2Estimated Cost
$50,000 to $500,000 108 17 9 11 1 4
$500,001 to $5,000,000 59 16 8 4 2 1
$5,000,001 to $20,000,000 9 4 1 2 0 1
$20,000,001 to $50,000,000 2 0 0 1 0 1
** N/A indicates the number of projects in the dataset that are not included under the Type.
*Projects that are geographically located in more than one area are repeat-counted for each relevant area type.

Growth Plans and Infrastructure Needs in Tennessee: A Nine-County Analysis
74
There were 228 projects reported for Sullivan County. Of these, 20 projects span two ormore growth plan area types. These include a number of water & wastewater projects, aswell as a few projects serving transportation, telecommunications, recreation, and LEAsystem-wide needs. Several projects were identified as regional, including a water &wastewater project, a couple of recreation projects and public health projects, and threehigher education projects. Of the total number of projects for the county when summedacross area type categories—i.e., 270, including repeat-counting—nearly three-quartersare Type B projects. Over three-quarters of these are within cities or their UGBs.
Most of the projects in the conceptual stage were located within cities, their UGBs, orPGAs, and most were transportation or water & wastewater.
According to the general needs inventory, Sullivan County has two non-state projectsestimated to cost more than $20 million: a project, estimated to cost $25 million, toprevent storm water from entering the sanitary sewer system in Kingsport; and a project,estimated to cost $24 million, to make energy-saving upgrades throughout the schoolsystem. As of 2003, both projects were under construction. The wastewater projecthad begun in 1996; the school system energy-savings project, in 2001.
RELATIONSHIP OF INFRASTRUCTURE PROJECTS TO GROWTH PLAN, DEMOGRAPHIC PATTERNS,AND ECONOMIC PATTERNS
The infrastructure projects needed for Sullivan County, as identified in the 2003 generalneeds inventory, include a number of Type A projects for the municipalities—e.g., sixeconomic development projects, three community development projects, and 21recreation projects. These may be motivated in part by Sullivan County’s slow populationgrowth, its high proportion of householders age 45 or over, and its poorer incomeconditions in the cities compared with much of the rest of the county. In addition, anumber of water & wastewater projects are identified in both the municipalities andtheir UGBs, as well as a number of transportation projects. All of these appear to dovetail,at least in general, with Sullivan County’s growth plan, as do the projects identified asneeded in the county’s PGAs.
Notably, however, 10 water & wastewater projects have been identified as needed inareas designated as rural in Sullivan County’s growth plan. Of the total of 18 projectsidentified as needed in rural areas, none was in a capital improvement program andapproximately half were in the conceptual stage as of 2003.
Given the surge in population in the 1990s in some parts of Sullivan County designatedas rural in the growth plan adopted in June 2000, it appears that growth trends ratherthan growth plans may be driving some of Sullivan County’s stated infrastructure needs.

Growth Plans and Infrastructure Needs in Tennessee: A Nine-County Analysis
75
TIPTON COUNTY
LOW DENSITY, HIGH GROWTH RATE
Located north of Shelby County on the Mississippi River,Tipton County is growing and changing. The county haseight small municipalities. In 2000, Covington, its largestcity, had approximately 17% of the county’s total populationof about 51,000. The county grew by 36% in the 1990s, toa 2000 population density of 112 people per square mile,due partly to its proximity to Memphis. Nearly 60% of itsworkers commuted outside the county in 2000.
Tipton County’s 2000 per capita income and percentageof families below the poverty level were similar toTennessee’s as a whole. Per capita retail sales and propertyvalues were low as of 2000—just over $5,000 and$35,000 respectively—but the median value of housingin 2000, at more than $91,000, was close to the stateaverage. The county’s population is relatively young—only 32% were 45 or older—and mobile—47% lived in adifferent house five years earlier.
The population ofTipton County (2000census: 51,271) grew36% in the 1990s,mainly in the south-central areas adjoiningShelby County. Thecounty’s eight smallmunicipalities make upthe core of its growthplan, which includesurban growth areasand planned growthareas as well as largerural areas to thenorth. Infrastructureneeds are targetedalmost exclusively tothe cities and thesurrounding growthareas. Whether thelocation of plannedinfrastructure is due tothe county’s growthplan or to its partialtransition from sleepyto suburban isuncertain.

76
Growth Plans and Infrastructure Needs in Tennessee: A Nine-County Analysis
KEY STATISTICS
Numbers are rounded.Sources of information:Tennessee Advisory Commission on Intergovernmental Relations, county profiles.Tennessee Department of Economic and Community Development, county profiles.Tennessee State Board of Equalization, 2000 Tax Aggregate Report of Tennessee.United States Census Bureau.University of Tennessee Municipal Technical Advisory Service, cities by county.
Tipton County Tennessee 2000 pop. 51,271 5,689,283 % chg in pop 1990-2000 +36% +17% Land area (sq. miles) 459 41,217 2000 density (pop./sq. mi) 112 138 2000 per cap income $17,952 $19,393 2000 families below poverty level 10.3% 10.3% 2000 per cap retail sales $5,306 $11,203 2000 per cap estimated property value $35,337 $51,084 2000 median value, owner-occupied houses $91,500 $93,000 % of pop. 5 years+ living in different house in 1995 47% 46% % of workers 16 years+ commuting out of county 59% 27% % of pop. under age 18 29% 25% % of pop. age 45 years + 32% 36% Largest municipality (2000 pop.) (% of county pop.)
Covington (8,463) (17%)
Other municipalities
Atoka Brighton Burlison Garland GiltEdge Mason Munford

Growth Plans and Infrastructure Needs in Tennessee: A Nine-County Analysis
77
GROWTH PLAN
Tipton County’s growth plan, shown below, was approved by LGPAC on April 26, 2000(TACIR, June 2002). The numbered sections are census tracts for the 2000 decennialcensus.
Part of Tipton County is located on the western shore of the Mississippi River: notably,a fairly large area in the southwestern part of the county included in Census Tract 401and designated in the county’s growth plan as a rural area.

78
Growth Plans and Infrastructure Needs in Tennessee: A Nine-County Analysis
DEMOGRAPHIC PATTERNS
The following information is derived from 2000 US Census data at the block grouplevel. Where a block group straddles more than one area type, its area in each type hasbeen estimated and its population distributed accordingly.
TIPTON COUNTY—DEMOGRAPHIC VARIABLES BY PERCENTAGE DISTRIBUTION BY AREA TYPE
Based on our block group estimates, Tipton County’s population is fairly evenly distributedacross the four area types in its growth plan: municipalities, urban growth areas, PGAs,and rural areas. Areas within cities tend to have somewhat older, smaller households witha higher rate of poverty and a higher percentage of non-white population. In contrast,especially in urban growth areas and PGAs, households tend to be younger and larger,with a lower poverty rate.
Tipton County—2000 Total City UGB PGA Rural Population 100 24 31 22 22
White 78 70 83 85 72 Non-White 22 30 17 15 28
Under age 18 29 30 30 29 28
Age 18 and over 71 70 70 71 72 Households 100 26 31 22 22
Age of Householder 15-44 47 45 50 47 44 Age of Householder 45-64 35 33 35 37 37 Age of Householder 65+ 18 22 15 16 20
Of Those Classified as Poor 100 38 25 15 22 Overall Poverty Rate = 12.1 Housing Units 100 25 31 22 22
Occupied Units 95 95 95 96 94 Vacant Units 5 5 5 4 6
Total City UGB PGA Rural Of Occupied Housing Units 100 25 31 22 22
1 to 2 in Household 51 54 48 49 53 3 or More in Household 49 46 52 51 47

Growth Plans and Infrastructure Needs in Tennessee: A Nine-County Analysis
79
ECONOMIC PATTERNS
The following information is derived from 2000 US Census data at the block group level.Where a block group straddles more than one area type, its area in each type has beenestimated. Median values have then been calculated for (1) block groups that lie from 51to 100% within the given area type and (2) block groups that lie 50% or less within thegiven area type.
TIPTON COUNTY—ECONOMIC VARIABLES BY MEDIAN VALUE BY AREA TYPE
Especially when considering the predominant block group subcategories (>=51% in areatype), the PGAs stand out as faring best on all three income variables, while the areaswithin city limits fare worst. Similarly, housing tends to be newest and most expensive inPGAs, while within the cities, it tends to be older and less expensive.
Tipton County—2000 City UGB PGA Rural Median Household Income % of Block Group <= 50% in Area Type 41,343 40,255 39,375 40,217 % of Block Group >=51% in Area Type 29,479 40,217 50,208 39,662 Median Family Income % of Block Group <= 50% in Area Type 46,500 46,018 45,507 46,250 % of Block Group >=51% in Area Type 37,244 46,875 53,910 43,918 Per Capita Income % of Block Group <= 50% in Area Type 17,755 17,846 17,365 17,593 % of Block Group >=51% in Area Type 15,501 16,685 19,224 17,893 Median Year Structures Built % of Block Group <= 50% in Area Type 1983 1978 1979 1983 % of Block Group >=51% in Area Type 1969 1987 1985 1978 Median Housing Values % of Block Group <= 50% in Area Type 86,100 83,050 82,400 86,100 % of Block Group >=51% in Area Type 81,750 90,700 114,000 77,600

80
Growth Plans and Infrastructure Needs in Tennessee: A Nine-County Analysis
POPULATION TRENDS
Intra-county population changes from 1990 to 2000 are shown below, using the 1990census tracts as the unit of analysis. If a tract was not wholly within a single growth planarea type, the percentage allocation across area types was estimated.
TIPTON COUNTY—1990 TO 2000 POPULATION CHANGES BY CENSUS TRACT AND AREA TYPE
As noted above, Tipton County’s population grew by 36% during the 1990s. Growth wasespecially strong in Tracts 403.98, 405, and 408.98. These tracts are in the southeastpart of the county, in areas that are largely within municipal limits, UGBs, or PGAs. Incontrast, Tract 409 in the northern part of the county, which was predominantlydesignated as rural in the county’s growth plan, experienced a slight population declineduring the 1990s.
1990
Tracts
1990
Population
2000
Population
1990 to
2000
Difference
Percent
Change
Percent
City in
2000
Percent
UGB in
2000
Percent
PGA in
2000
Percent
Rural in
2000
401 4,066 5,094 1,028 25 0 0 35 65
402 1,617 2,022 405 25 13 0 25 63
403.98 8,997 15,191 6,194 69 ------------------------------------------------------------
404 2,515 3,124 609 24 5 28 3 65
405 2,999 4,967 1,968 66 15 55 30 0
406 6,565 7,752 1,187 18 20 47 10 23
407 4,920 4,969 49 1 100 0 0 0
408.98 2,075 3,646 1,571 76 ------------------------------------------------------------
409 1,744 1,628 -116 -7 0 10 15 75
410 2,070 2,878 808 39 8 8 5 80

Growth Plans and Infrastructure Needs in Tennessee: A Nine-County Analysis
81
INFRASTRUCTURE PROJECTS
The following table is based on data in the 2003 general public infrastructure needs inventory.
TIPTON COUNTY—NUMBER OF INFRASTRUCTURE PROJECTS BY AREA TYPE*
Within
City
Within
UGB
Within
PGA
Within
Rural
Site Not
Det.
No Area
Info
Total Projects 27 23 8 4 1 1Type A Projects 5 4 4 1 0 1
Community Development 3 0 0 0 0 0
Fire Protection 0 0 1 0 0 0
K-12 New School Construction 0 4 1 1 0 0
Non K-12 Education 0 0 0 0 0 1
Public Buildings 1 0 0 0 0 0
Public Health Facilities 0 0 1 0 0 0
Recreation 1 0 0 0 0 0
Solid Waste 0 0 1 0 0 0
(N/A)** 22 19 4 3 1 0Type B Projects 25 19 4 3 1 0
Other Utilities 1 0 0 0 0 0
Stormwater 2 0 0 0 0 0
Transportation 9 18 2 3 0 0
Water and Wastewater 13 1 2 0 1 0
(N/A)** 2 4 4 1 0 1Stage
Completed 2 1 0 0 0 0
Conceptual 19 20 6 4 1 1
Construction 2 0 0 0 0 0
Planning & Design 4 2 2 0 0 0Regional Project
Yes 0 1 1 0 0 0
No 27 22 7 4 1 1Level of Government
City 21 1 0 0 0 0
County 2 15 2 2 0 0
Other 0 0 4 0 1 0
State 4 7 2 2 0 1In CIP
Yes 13 2 0 0 0 0
No 14 21 8 4 1 0
Unknown 0 0 0 0 0 1Estimated Cost
$50,000 to $500,000 17 17 3 3 0 0
$500,001 to $5,000,000 8 1 1 0 1 0
$5,000,001 to $20,000,000 2 5 4 1 0 1
** N/A indicates the number of projects in the dataset that are not included under the Type.
*Projects that are geographically located in more than one area are repeat-counted for each relevant area type.

Growth Plans and Infrastructure Needs in Tennessee: A Nine-County Analysis
82
There were 52 projects reported for Tipton County. Of these, six projects span two ormore growth plan area types. These include five transportation projects and one water& wastewater project. In addition, two transportation projects were identified as regional.Of the total for the county when summed across area type categories—i.e., 64, includingrepeat-counting—over 50 are Type B projects. Most of the projects are within cities,their UGBs, or PGAs. Of the four within rural areas, three are transportation projects.
Five of the six K-12 new school construction projects are in a conceptual stage. Inaddition, 29 transportation projects and 11 water & wastewater projects were identifiedas conceptual.
According to the general needs inventory, Tipton County had no projects estimated tocost more than $20 million.
RELATIONSHIP OF INFRASTRUCTURE PROJECTS TO GROWTH PLAN, DEMOGRAPHIC PATTERNS,AND ECONOMIC PATTERNS
The infrastructure projects needed for Tipton County, as identified in the 2003 generalneeds inventory, reflect the basic infrastructure needs of a county that has begun togrow rapidly: new K-12 schools, transportation projects, and water & wastewaterprojects. These and other projects are, for the most part, located within the county’smunicipalities (especially the water & wastewater projects) or within the municipalities’fairly ample UGBs (especially the transportation and new school projects). A few arelocated in its PGAs. Only four—of which three are transportation projects—are locatedin areas designated as rural in the county’s growth plan.
Only 13 of the infrastructure projects identified as needed in Tipton County are in acapital improvement program, and many are in the conceptual stage. Again, this suggestsa county grappling with the early stages of growth.
There is a strong correlation between areas identified for growth in the county’s growthplan and where infrastructure projects are identified as needed. But it is uncertain whether,at this point, both the plan and the infrastructure needs are being driven by emergingdemographic and economic patterns.

Growth Plans and Infrastructure Needs in Tennessee: A Nine-County Analysis
83
WILLIAMSON COUNTY
MODERATELY LOW DENSITY, HIGH GROWTH RATE
Williamson County, located in middle Tennesseeimmediately south of Davidson County, is in a class byitself. Its population—nearly 127,000 in 2000—grew by56% during the 1990s. Franklin, the largest city, comprisesone-third of its population. With a 2000 density of 217people per square mile, it preserves a pastoral character,but at a cost.
In 2000, the median housing value of Williamson Countywas over $200,000, and its estimated per capita propertyvalue was nearly $100,000. The county had a per capitaincome of more than $32,000, and fewer than 4% of itsfamilies were below the poverty level. Per capita retailsales in Williamson County, at a 2000 level of more than$15,500, were among the highest of the nine countiesexamined. With only 33% of its people aged 45 years orolder as of 2000, the county’s population is relatively young.As of 2000, more than 50% of the county’s populationlived in different homes five years earlier, and nearly 50%of its workers commuted outside the county.
The population ofWilliamson County(2000 census: 126,638)grew by 56% in the1990s—the highestgrowth rate inTennessee. Much ofthis growth occurred inthe central section ofthe county where mostof its six municipalitiesare located. Thecounty’s growth plandesignates urbangrowth areas aroundthese municipalities aswell as two modestly-sized planned growthareas. The remainderof the county isdesignated as rural.Will it be? With nearlyone-quarter of thecounty’s statedinfrastructure needstargeted to its ruralareas, the growth planappears to be doinglittle to constrain plansfor infrastructure.

84
Growth Plans and Infrastructure Needs in Tennessee: A Nine-County Analysis
KEY STATISTICS
Numbers are rounded.* Municipality located in more than one county.Sources of information:Tennessee Advisory Commission on Intergovernmental Relations, county profiles.Tennessee Department of Economic and Community Development, county profiles.Tennessee State Board of Equalization, 2000 Tax Aggregate Report of Tennessee.United States Census Bureau.University of Tennessee Municipal Technical Advisory Service, cities by county.
Williamson County Tennessee 2000 pop. 126,638 5,689,283 % chg in pop 1990-2000 +56% +17% Land area (sq. miles) 583 41,217 2000 density (pop./sq. mi) 217 138 2000 per cap income $32,496 $19,393 2000 families below poverty level 03.5% 10.3% 2000 per cap retail sales $15,563 $11,203 2000 per cap estimated property value $97,222 $51,084 2000 median value, owner-occupied houses $208,400 $93,000 % of pop. 5 years+ living in different house in 1995 52% 46% % of workers 16 years+ commuting out of county 49% 27% % of pop. under age 18 29% 25% % of pop. age 45 years + 33% 36% Largest municipality (2000 pop.) (% of county pop.)
Franklin (41,842) (33%)
Other municipalities
Brentwood Fairview Nolensville Spring Hill* Thompson’s Station

Growth Plans and Infrastructure Needs in Tennessee: A Nine-County Analysis
85
GROWTH PLAN
Williamson County’s growth plan, shown below, was approved by LGPAC onJune 27, 2001 (TACIR, June 2002). The numbered sections are census tracts for the2000 decennial census.
This map is adapted from a map digitized by the Tennessee Department of Economic and Community Developmentand is for informational purposes only.
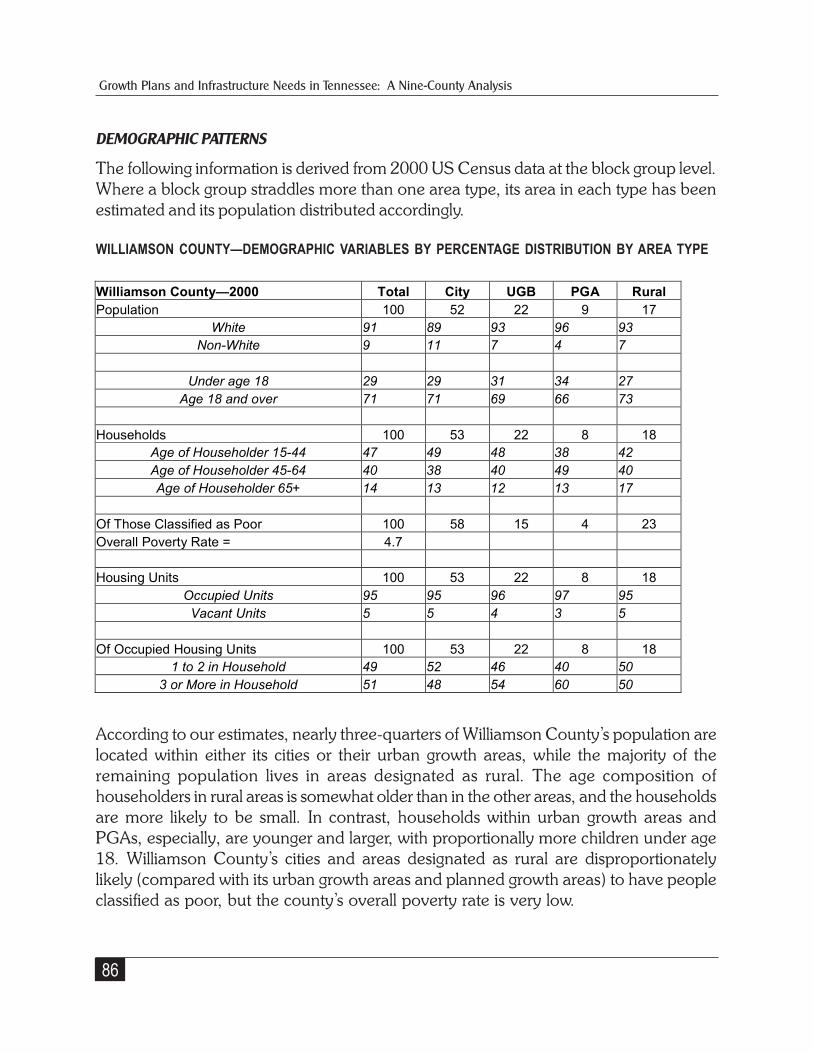
86
Growth Plans and Infrastructure Needs in Tennessee: A Nine-County Analysis
DEMOGRAPHIC PATTERNS
The following information is derived from 2000 US Census data at the block group level.Where a block group straddles more than one area type, its area in each type has beenestimated and its population distributed accordingly.
WILLIAMSON COUNTY—DEMOGRAPHIC VARIABLES BY PERCENTAGE DISTRIBUTION BY AREA TYPE
According to our estimates, nearly three-quarters of Williamson County’s population arelocated within either its cities or their urban growth areas, while the majority of theremaining population lives in areas designated as rural. The age composition ofhouseholders in rural areas is somewhat older than in the other areas, and the householdsare more likely to be small. In contrast, households within urban growth areas andPGAs, especially, are younger and larger, with proportionally more children under age18. Williamson County’s cities and areas designated as rural are disproportionatelylikely (compared with its urban growth areas and planned growth areas) to have peopleclassified as poor, but the county’s overall poverty rate is very low.
Williamson County—2000 Total City UGB PGA Rural Population 100 52 22 9 17
White 91 89 93 96 93 Non-White 9 11 7 4 7
Under age 18 29 29 31 34 27
Age 18 and over 71 71 69 66 73 Households 100 53 22 8 18
Age of Householder 15-44 47 49 48 38 42 Age of Householder 45-64 40 38 40 49 40 Age of Householder 65+ 14 13 12 13 17
Of Those Classified as Poor 100 58 15 4 23 Overall Poverty Rate = 4.7 Housing Units 100 53 22 8 18
Occupied Units 95 95 96 97 95 Vacant Units 5 5 4 3 5
Of Occupied Housing Units 100 53 22 8 18
1 to 2 in Household 49 52 46 40 50 3 or More in Household 51 48 54 60 50

Growth Plans and Infrastructure Needs in Tennessee: A Nine-County Analysis
87
ECONOMIC PATTERNS
The following information is derived from 2000 US Census data at the block group level.Where a block group straddles more than one area type, its area in each type has beenestimated. Median values have then been calculated for (1) block groups that lie from 51to 100% within the given area type and (2) block groups that lie 50% or less within thegiven area type.
WILLIAMSON COUNTY—ECONOMIC VARIABLES BY MEDIAN VALUE BY AREA TYPE
The three income variables in the table above reveal that, while people in WilliamsonCounty tend to have very high incomes, people in its areas designated as rural tend tobe comparatively worse off. Similarly, their houses are likely to be older, and the housesare valued lower, but only when compared with the extraordinary median housingvalues in the rest of county.
Williamson County—2000 City UGB PGA Rural Median Household Income
% of Block Group <= 50% in Area Type 59,470 59,470 63,432 75,343 % of Block Group >=51% in Area Type 75,923 82,595 ---- 53,750
Median Family Income
% of Block Group <= 50% in Area Type 69,559 72,001 72,809 82,295 % of Block Group >=51% in Area Type 77,565 83,987 ---- 56,328
Per Capita Income
% of Block Group <= 50% in Area Type 27,895 28,530 28,530 32,893 % of Block Group >=51% in Area Type 33,521 33,471 ---- 25,750
Median Year Structures Built
% of Block Group <= 50% in Area Type 1983 1981 1983 1984 % of Block Group >=51% in Area Type 1983 1984 ---- 1979
Median Housing Values
% of Block Group <= 50% in Area Type 179,550 182,450 182,450 198,600 % of Block Group >=51% in Area Type 211,900 223,800 ---- 153,800

88
Growth Plans and Infrastructure Needs in Tennessee: A Nine-County Analysis
POPULATION TRENDS
Intra-county population changes from 1990 to 2000 are shown below, using the 1990census tracts as the unit of analysis. If a tract was not wholly within a single growth planarea type, the percentage allocation across area types was estimated.
WILLIAMSON COUNTY—1990 TO 2000 POPULATION CHANGES BY CENSUS TRACT AND AREA TYPE
Williamson County, which grew by 56% during the 1990s, experienced its strongestpopulation growth in the following census tracts: Tract 502 in the eastern Brentwoodarea; Tracts 507, 509, and 510 in the area within and around Franklin; and Tract 512,in the southwestern part of the county. All but the last are predominantly within citylimits, urban growth areas, or PGAs. Tract 512 is predominantly designated as rural inthe county’s growth plan.
1990
Tracts
1990
Population
2000
Population
1990 to
2000
Difference
Percent
Change
Percent
City in
2000
Percent
UGB in
2000
Percent
PGA in
2000
Percent
Rural in
2000
501 6,021 7,692 1,671 28 5 26 10 59
502 9,840 17,314 7,474 76 91 9 0 0
503 8,236 10,518 2,282 28 85 13 3 0
504 10,723 13,658 2,935 27 4 8 54 35
505 8,634 10,816 2,182 25 40 19 0 41
506 5,493 7,265 1,772 32 28 38 0 35
507 2,187 7,934 5,747 263 30 50 20 0
508 6,151 6,400 249 4 100 0 0 0
509 12,889 24,248 11,359 88 63 34 0 3
510 2,650 6,139 3,489 132 25 45 0 30
511 4,252 4,894 642 15 0 3 0 97
512 3,945 9,760 5,815 147 27 10 0 63

Growth Plans and Infrastructure Needs in Tennessee: A Nine-County Analysis
89
INFRASTRUCTURE PROJECTS
The following table is based on data in the 2003 general public infrastructure needs inventory.
WILLIAMSON COUNTY—NUMBER OF INFRASTRUCTURE PROJECTS BY AREA TYPE*
Within
City
Within
UGB
Within
PGA
Within
Rural
No
Growth
Plan
Site
Not
Det.
No Area
Info
Total Projects 215 49 27 51 40 6 1Type A Projects 75 4 5 10 14 5 1
Community Development 2 0 0 0 0 0 0
Fire Protection 9 0 2 1 0 1 0
K-12 New School Construction 8 0 1 2 8 3 1
Law Enforcement 6 1 1 1 0 0 0
Libraries and Museums 2 0 0 0 0 0 0
Non K-12 Education 1 0 0 0 0 0 0
Other Facilities 1 0 0 0 0 0 0
Public Buildings 9 0 0 0 0 0 0
Recreation 33 2 1 1 3 1 0
Solid Waste 4 1 0 5 3 0 0
(N/A)** 140 45 22 41 26 1 0Type B Projects 144 45 22 41 27 2 0
Property Acquisition 5 0 0 0 1 1 0
Stormwater 9 2 1 1 0 0 0
Transportation 59 17 12 14 5 0 0
Water and Wastewater 71 26 9 26 21 1 0
(N/A)** 71 4 5 10 13 4 1Stage
Completed 51 4 4 9 25 0 0
Conceptual 89 23 13 22 6 6 0
Construction 32 12 6 8 5 0 1
Planning & Design 42 10 4 12 4 0 0
State Agency (Completed/Canceled) 1 0 0 0 0 0 0Regional Project
Yes 2 0 0 0 0 0 0
No 213 49 27 51 40 6 1Level of Government
City 175 4 0 0 4 0 0
County 17 13 14 18 16 5 1
Joint 2 3 1 2 0 0 0
Other 15 22 9 26 20 1 0
State 6 7 3 5 0 0 0In CIP
Yes 185 26 7 21 30 0 1
No 28 23 20 30 10 6 0
Unknown 2 0 0 0 0 0 0Estimated Cost
$50,000 to $500,000 86 16 10 16 15 2 0
$500,001 to $5,000,000 102 20 11 23 19 0 0
$5,000,001 to $20,000,000 23 8 4 6 6 4 0
$20,000,001 to $50,000,000 3 4 2 5 0 0 1
$100,000,001 and Over 1 1 0 1 0 0 0
*Projects that are geographically located in more than one area are repeat-counted for each relevant area type.
** N/A indicates the number of projects in the dataset that are not included under the Type.

90
Growth Plans and Infrastructure Needs in Tennessee: A Nine-County Analysis
There were 249 projects reported for Williamson County. Of these, 35 projects span twoor more growth plan area types. These include a number of transportation,water & wastewater, recreation, solid waste, and new K-12 school construction projectsas well as some law enforcement projects and public building projects. None ofWilliamson County’s projects were identified as regional. Of the total number of projectsfor the county when summed across all area type categories—i.e., 389, including repeat-counting—the projects are split evenly between Type A and Type B projects.
Most of the projects are within cities, their UGBs, or PGAs. However, 51 projects wereidentified as needed in parts of the county designated as rural in the county growthplan. Of these projects, most are water & wastewater, transportation, and solid waste.Forty projects are recorded in the database as “this entity does not have an officialgrowth plan,” even though Williamson County has had a growth plan since June 2001.More than three-quarters of the transportation, water & wastewater, and K-12 newschool construction projects were identified as in the conceptual stage.
According to the general needs inventory, Williamson County had several infrastructureprojects estimated to cost more than $20 million. These include three new schools—ahigh school in the northeast costing about $25 million (under construction as of 2003),a high school in the south costing an estimated $27 million (under construction as of2003), and an elementary/middle school in Franklin costing an estimated $23 million(completed in 2001).
Also included in the “over $20 million” category are two road widenings—of StateRoute 96 east to Rutherford County (in planning and design as of 2003, estimated tocost about $28 million), and of State Route 6 from Franklin south to Maury County (inthe conceptual stage as of 2003, estimated to cost $24 million)—as well as a new roadin the northeast section of the county. The new road—State Route 266, from I-65 eastto Smyrna—was in the conceptual stage as of 2003 and was estimated to cost $128million, with a start date of FY 2008. The county also has a five-year program to repairand repave roads, under construction as of 2003 and estimated at $21 million.
The construction of four new community centers (three in the southern section of thecounty and one in the northeast) was in the conceptual stage as of 2003, with anestimated total cost of $25 million. A $21 million renovation of a wastewater treatmentplant in Franklin was in planning and design as of 2003.

Growth Plans and Infrastructure Needs in Tennessee: A Nine-County Analysis
91
RELATIONSHIP OF INFRASTRUCTURE PROJECTS TO GROWTH PLAN, DEMOGRAPHIC PATTERNS,AND ECONOMIC PATTERNS
The 56% population growth rate that Williamson County experienced in the 1990s isreflected in its infrastructure needs, especially for new K-12 schools, water & wastewaterprojects, and transportation projects. Most of these are located within the county’s sixmunicipalities, their urban growth areas, or PGAs.
However, there also were 51 infrastructure projects identified as needed in areasdesignated as rural, including 26 water & wastewater projects and 14 transportationprojects. Of the 51 projects, 30 were not in a capital improvement program, and 34were in the conceptual or planning and design stage as of 2003. This suggests that thegrowth plan adopted for Williamson County in June 2001 may be doing relatively littleto constrain plans for infrastructure within the county.

92
Growth Plans and Infrastructure Needs in Tennessee: A Nine-County Analysis
COMPARISONS OF THE NINE COUNTIESCounty-level information for the nine counties is shown in the table on page 96,accompanied with a separate table on page 97 summarizing infrastructure costs basedon the four most recent general public infrastructure needs inventories. (We do nothave data from the first inventory.)
From this summarized information, as well as the in-depth consideration of each countyin the preceding section, the following observations can be made:
1. Counties (together with their municipalities and the coordinating committeesthat recommended growth plans) have approached their growth plans verydifferently.
For example, Giles County has no PGAs and designated most of its land as rural;in contrast, Meigs County designated large sections of the county as PGAs. GibsonCounty designated expansive UGBs, but no PGAs; in contrast, Tipton Countydesignated large PGAs but somewhat more modest UGBs. Madison County hasa huge UGB around Jackson with relatively little land designated as rural orPGA; in contrast, relatively large sections of Williamson County are designatedas rural, with two PGAs and fairly modest UGBs around existing cities. RutherfordCounty, adjacent to Williamson and with a similarly high growth rate, has largeUGBs around its cities but no designation of PGAs. Sullivan County’s growthplan, in contrast, creates a mosaic of all four types, as does Knox County’s.
2. Counties with high growth rates (1990 to 2000 percent change in population)tend to have relatively young, mobile populations on average.
The populations of fast-growing counties tend to be younger, with proportionallymore children under age 18; more mobile (in both their commuting patterns andtheir rate of change in housing); have higher incomes; and are less likely to live inpoverty than populations in counties with low growth rates. (The exception isMeigs County, a very-low-density county that has a high growth rate and a highpercentage of workers commuting out of the county but lacks the indicators ofprosperity shared by other fast-growing counties.)

Growth Plans and Infrastructure Needs in Tennessee: A Nine-County Analysis
93
3. A county’s per capita retail sales correlates weakly with measures of individualprosperity.
For example, Knox County, Madison County and Williamson County have virtuallythe same per capita retail sales, but the per capita income level in Knox andMadison counties is approximately two-thirds of Williamson County’s per capitaincome. It appears that retail sales are driven more by whether the county is aregional (multi-county) market center than by incomes within the county, takenindividually.
4. Within their municipalities, virtually all of the counties examined share certainpopulation characteristics, such as smaller, older, poorer households on averagethan households located elsewhere in the county.
Areas within municipalities generally have a higher percentage of old people and alower percentage of large households. Municipalities also have a relatively higherpercentage of the county’s non-white population, as well as a higher percentageof the county’s population living in poverty. In contrast, areas identified as urbangrowth areas or PGAs in the counties’ growth plans tend to be comparativelyyounger, with more income, larger households, more school-age children, andnewer, more expensive housing. (Again, the possible exception is Meigs County,which has only one municipality, Decatur, containing a small fraction of thecounty’s population.)
5. Infrastructure needs within the counties examined share certaincharacteristics.
In areas that are rapidly growing—especially urban growth areas and to a lesserextent PGAs—infrastructure projects tend to be such basics as transportationprojects, water & wastewater projects, and new K-12 school construction. Whilethese types of projects are found within municipalities as well, municipalities–especially those with populations of about 5,000 or more—generally have abroader range of projects, especially Type A projects involving economicdevelopment, community development, public health facilities, law enforcement,etc. Areas designated in county growth plans as rural tend to have fewinfrastructure projects with the exception of transportation projects. However,where population growth is occurring in rural areas, water & wastewater projectsalso may be identified as needed. Given that our population growth trend analysiswas based on a comparison of 1990 census tract data with 2000 census tract

94
Growth Plans and Infrastructure Needs in Tennessee: A Nine-County Analysis
data, whereas the our analysis of infrastructure needs was based on 2003 inventorydata, it appears that public infrastructure projects may, to some extent, be followingrather than driving population growth trends.
6. Infrastructure needs within the counties examined tend to be compatible withthe county’s growth plan.
Public infrastructure needs in the nine counties examined are greater in areas thatare designated in county growth plans for high-density or medium-density growththan they are within areas designated for low density development. In otherwords, there are both more projects and more expensive projects identified asneeded in areas that are within city limits, within UGBs, or within PGAs than inareas designated as rural.
7. Counties that are experiencing rapid population growth rates show sometendency to have higher estimated costs per capita for their publicinfrastructure needs.
Williamson, Rutherford, and Meigs counties (with population growth rates in the1990s of 56%, 54%, and 38% respectively) all had relatively high per capitaestimates—especially in the 2003 inventory, but also in prior inventories. Incontrast, Gibson, Sullivan, and Giles counties (with population growth rates inthe 1990s of 4%, 7%, and 14% respectively) all had relatively low per capitaestimates. Notably, however, the remaining three counties in this study—Knox,Madison, and Tipton, with population growth rates in the 1990s of 14%, 18%,and 36% respectively—do not follow these patterns. Knox and Madison counties’estimated costs per capita are relatively high for their growth rates while TiptonCounty’s are extraordinarily low. Possible explanations are as follows: KnoxCounty has more elaborate infrastructure needs because of its relatively densepopulation; in addition, its infrastructure totals are skewed by the inclusion of 44higher education projects. Madison County’s major city, Jackson, is a hub forthe surrounding region, which pumps money into its economy but also increasesits perceived need for such public infrastructure projects as transportation,water & wastewater, and economic development. Tipton County’s infrastructureneeds appear to have been significantly underreported. More on this point onthe next page.

Growth Plans and Infrastructure Needs in Tennessee: A Nine-County Analysis
95
8. By-county totals of estimated costs for public infrastructure needs may beless informative than infrastructure patterns at the intra-county level.
Tipton County’s infrastructure needs were estimated at only $128 per capita asof July 1999; four years later, they were estimated to be nearly 20-fold higher,but they still may have been underreported. Because the infrastructure inventoriesdepend on the voluntary cooperation of local (municipal and county) officials,state officials, utility district representatives, etc., it cannot be assumed thatresponse rates and the accuracy of reporting are comparable across counties.
In addition, especially in a small-population county such as Meigs, but even in alarge-population county such as Knox, totals of estimated costs for publicinfrastructure needs may be skewed by either a single project or a cluster ofatypical projects. Some of these “outlier” projects are regional; others are not. Inthe 2003 inventory for Knox County, as mentioned above, 44 publicinfrastructure projects–nearly one-sixth of the county’s total number of projects—were for higher education purposes. In Meigs County, a single $40 million highwayproject (not classified as regional) contributed over half of that county’s totalestimated cost of public infrastructure needs. Similarly, in Williamson County, a$128 million highway project in the conceptual stage—also not classified asregional—constituted nearly 15% of its total estimated cost of public infrastructureneeds.
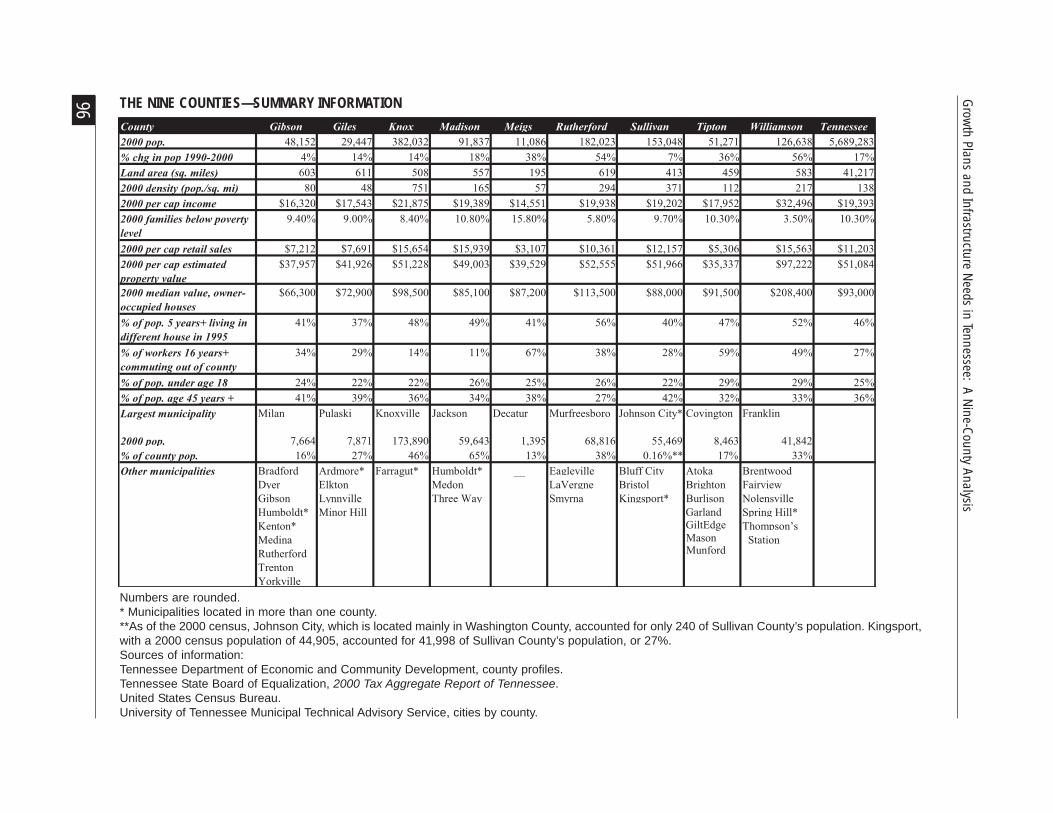
96 Grow
th Plans and Infrastructure Needs in Tennessee: A N
ine-County Analysis
Numbers are rounded.* Municipalities located in more than one county.**As of the 2000 census, Johnson City, which is located mainly in Washington County, accounted for only 240 of Sullivan County’s population. Kingsport,with a 2000 census population of 44,905, accounted for 41,998 of Sullivan County’s population, or 27%.Sources of information:Tennessee Department of Economic and Community Development, county profiles.Tennessee State Board of Equalization, 2000 Tax Aggregate Report of Tennessee.United States Census Bureau.University of Tennessee Municipal Technical Advisory Service, cities by county.
County Gibson Giles Knox Madison Meigs Rutherford Sullivan Tipton Williamson Tennessee
2000 pop. 48,152 29,447 382,032 91,837 11,086 182,023 153,048 51,271 126,638 5,689,283
% chg in pop 1990-2000 4% 14% 14% 18% 38% 54% 7% 36% 56% 17%
Land area (sq. miles) 603 611 508 557 195 619 413 459 583 41,217
2000 density (pop./sq. mi) 80 48 751 165 57 294 371 112 217 138
2000 per cap income $16,320 $17,543 $21,875 $19,389 $14,551 $19,938 $19,202 $17,952 $32,496 $19,393
2000 families below poverty
level
9.40% 9.00% 8.40% 10.80% 15.80% 5.80% 9.70% 10.30% 3.50% 10.30%
2000 per cap retail sales $7,212 $7,691 $15,654 $15,939 $3,107 $10,361 $12,157 $5,306 $15,563 $11,203
2000 median value, owner-
occupied houses
$66,300 $72,900 $98,500 $85,100 $87,200 $113,500 $88,000 $91,500 $208,400 $93,000
% of pop. 5 years+ living in
different house in 1995
41% 37% 48% 49% 41% 56% 40% 47% 52% 46%
% of workers 16 years+
commuting out of county
34% 29% 14% 11% 67% 38% 28% 59% 49% 27%
% of pop. under age 18 24% 22% 22% 26% 25% 26% 22% 29% 29% 25%
% of pop. age 45 years + 41% 39% 36% 34% 38% 27% 42% 32% 33% 36%
Largest municipality Milan Pulaski Knoxville Jackson Decatur Murfreesboro Johnson City* Covington Franklin
2000 pop. 7,664 7,871 173,890 59,643 1,395 68,816 55,469 8,463 41,842
% of county pop. 16% 27% 46% 65% 13% 38% 0.16%** 17% 33%
Bradford Ardmore* Humboldt* Eagleville Bluff City Atoka Brentwood
Dyer Elkton Medon LaVergne Bristol Brighton Fairview
Gibson Lynnville Three Way Smyrna Kingsport* Burlison Nolensville
Humboldt* Minor Hill Spring Hill*
Kenton* Thompson’s
Medina Station
Rutherford
Trenton
Yorkville
2000 per cap estimated
property value
$37,957 $41,926 $51,228 $49,003 $39,529 $52,555 $51,966 $35,337 $97,222 $51,084
Other municipalities Farragut* __
GarlandGiltEdge
MasonMunford
THE NINE COUNTIES—SUMMARY INFORMATION

Growth Plans and Infrastructure Needs in Tennessee: A Nine-County Analysis
97
*Bas
ed o
n po
pula
tion
estim
ates
from
the
US
Cen
sus
Bur
eau.
Ju
lyJ
uly
Ju
lyJ
uly
19
99
20
01
20
02
20
03
# o
fC
ost
/#
of
Co
st/
# o
fC
ost
/#
of
Co
st/
Pro
j.C
ap
ita
*P
roj.
Ca
pit
a*
Pro
j.C
ap
ita
*
Pro
j.C
ap
ita
*
Gib
son
68
$1
17
,42
4,3
50
$
2,4
45
3
8$
10
8,2
61
,00
0
$2
,24
8
63
$1
02
,02
5,7
56
$
2,1
24
9
2$
88
,14
7,0
54
$
1,8
39
Gil
es3
9$
49
,33
6,9
95
$
1,6
99
3
5$
70
,48
6,8
30
$
2,3
94
4
3$
65
,16
4,9
28
$
2,1
96
5
4$
10
8,5
61
,15
7
$3
,70
0
Kno
x2
68
$1
,25
6,8
09
,47
0
$3
,34
2
23
5$
1,6
49
,67
3,7
82
$
4,3
18
2
93
$1
,08
9,1
11
,91
2
$2
,82
5
28
3$
1,3
26
,59
5,9
44
$
3,3
76
Mad
iso
n9
3$
10
1,1
29
,25
0
$1
,16
6
12
5$
24
1,4
43
,48
8
$2
,62
9
15
3$
41
8,2
36
,16
0
$4
,52
7
18
6$
47
9,3
07
,55
5
$5
,10
6
Mei
gs
18
$7
0,3
86
,00
0
$6
,94
6
16
$6
8,5
75
,00
0
$6
,18
6
22
$7
2,0
22
,37
5
$6
,43
4
17
$7
3,3
00
,35
9
$6
,41
3
Ruth
erfo
rd1
63
$6
73
,99
3,1
92
$
3,9
32
1
63
$9
53
,07
6,3
32
$
5,2
36
1
95
$8
42
,51
5,6
86
$
4,4
31
1
89
$1
,13
3,6
14
,49
2
$5
,60
3
Sull
ivan
25
0$
31
1,0
26
,31
5
$2
,07
0
17
3$
36
6,1
53
,46
2
$2
,39
2
23
2$
40
6,1
55
,49
7
$2
,65
8
22
8$
36
0,3
46
,82
3
$2
,35
4
Tip
ton
19
$6
,19
1,4
16
$
12
8
12
$2
5,5
23
,97
3
$4
98
2
0$
41
,54
2,1
12
$
78
4
52
$1
29
,63
6,4
80
$
2,3
93
Wil
liam
son
20
8$
36
6,7
97
,95
7
$2
,96
3
17
3$
61
1,1
62
,05
7
$4
,82
6
24
5$
73
6,2
22
,99
9
$5
,50
1
24
9$
91
3,7
36
,29
0
$6
,46
7
Co
un
tyT
ota
l es
t. c
ost
To
tal
est.
co
stT
ota
l es
t. c
ost
To
tal
est.
co
st
As
of:
THE
NINE
COU
NTIE
S—ES
TIMA
TED
GENE
RAL
PUBL
IC IN
FRAS
TRUC
TURE
NEE
DS F
ROM
THE
1999
, 200
1, 20
02, A
ND 20
03 IN
VENT
ORIE
S

98
Growth Plans and Infrastructure Needs in Tennessee: A Nine-County Analysis
CONCLUSIONS AND RECOMMENDATIONS
CONCLUSIONS
While the public infrastructure needs identified in the 2002* inventory generallyappear to be compatible with county growth plans, this does not necessarily meanthat the growth plans are shaping the infrastructure needs.
Public infrastructure needs in the nine counties examined tend to be greater inareas that are within city limits, within UGBs, or within PGAs than they arewithin areas designated as rural.
Three possible (not mutually exclusive) explanations for the generally positivecorrelation between areas designated for high- to medium-density population inthe county growth plans and public infrastructure needs identified in the 2002*inventory are as follows. First, areas where public infrastructure projects werealready planned or under construction may have been targeted for growth in thegrowth plans. Second, recent population growth and related economic growthin an area may have prompted both designation of the area as a growth areaand identification of infrastructure needs in the area. And third, the UGBs and/or PGAs of some counties are so expansive that little territory is left to be designatedas rural, with the result that, de facto, most of the public infrastructure falls in agrowth area.
Based on this study, we cannot conclude that the growth plans are shapinginfrastructure needs. They may be, but some evidence suggests otherwise. Insome areas designated as rural—especially where population has grown fairlyrapidly in the recent past—public infrastructure projects such as water &wastewater systems, new K-12 school construction, and transportation projectshave been identified as needed.
To better determine whether growth plans are shaping infrastructure needs (notmerely correlated with them), both the growth planning process and theinfrastructure needs process should be examined over time, taking into accountdemographic and economic trends.
The growth plans had been adopted only two to three years before the 2002*infrastructure needs inventory was conducted. The “fit” of growth plans andreported infrastructure needs thus could be expected to be fairly good, with
*The inventory for the five-year period beginning July 1, 2002.

Growth Plans and Infrastructure Needs in Tennessee: A Nine-County Analysis
99
infrastructure generally going into areas specified for growth in the growth plans.As population and economic growth occurs in the future within counties, however,that growth may be directed by the growth plans; it may occur willy-nilly, ignoringthe growth plans; or the plans may be amended to accommodate growth trends.In the latter two events, it will be clear that the growth plans—while they mayreduce some conflicts over annexation—are doing little to guide the direction ofgrowth. Similarly, as population and economic growth occur within counties,that growth may be directed by plans for public infrastructure; it may occurwithout adequate public infrastructure; or public infrastructure needs may beidentified in response to the growth trends, whether or not they are compatiblewith the county’s growth plan.
Only under one of the two following conditions can it be said that a county’sgrowth plan is shaping its public infrastructure needs as identified in the annualinventories:
a. population and economic growth are directed by the county’s growth plan,and stated infrastructure needs also adhere to the growth plan, or
b. population and economic growth ignore the growth plan, but statedinfrastructure needs do not.
Under the third possible condition—the condition in which the growth plan isaltered to track growth, not vice versa—the infrastructure needs identificationprocess gets little guidance from the growth plan, so it too may be altered totrack growth.
RECOMMENDATIONS
1. To tailor the inventory forms for future analysis of infrastructure and growth plans,we offer the following suggestions:
Where possible, exact street addresses should be entered into both the generalneeds inventory form and the existing school needs inventory form. Inparticular, the zip code area(s) in which the project is located should be givenfor all projects except those that are county-wide, in order to enable a correlationof reported infrastructure needs with business pattern data.
Under item 14a of the general needs inventory form, the respondent shouldbe asked to rank-order the main reasons checked for the project.

100
Growth Plans and Infrastructure Needs in Tennessee: A Nine-County Analysis
A new item should be added following item 22 of the general needs inventoryform, asking about the degree of influence of the county’s growth plan on theinfrastructure need identified (e.g., none, some, a great deal).
Item 23 of the general needs inventory form should be clarified to make surethat each growth plan area type is mutually exclusive: specifically, “UrbanGrowth Boundary of an incorporated area” should be revised to “outside citylimits but within an Urban Growth Boundary of an incorporated area.”
Item B2-a of the existing school inventory form should be revised to distinguishrecent construction projects from recent renovation projects.
A new question should be added to Section B (Campus and ProjectInformation) of the existing school inventory form, to determine the reasonfor the project as it relates to growth and other needs. This question could ask“What is the reason for the renovation/improvement? … population growth… outdated facility … government mandate … other. If more than one reason,please rank-order your responses, with 1 as the most important reason.”Similarly, a new item should be added, asking about the degree of influenceof the county’s growth plan on the infrastructure need identified.
2. To improve the coordination of infrastructure planning with growth planning, werecommend that infrastructure planning, including annual reviews of the infrastructureinventory forms for the compatibility of infrastructure needs with growth plans,become an activity of the Joint Economic and Community Development Boardsmandated under Public Chapter 1101.
3. Counties that historically have been sparsely populated but are growing rapidlymay need special technical assistance to coordinate infrastructure planning and growthplanning. This assistance might be provided by University of Tennessee’s MunicipalTechnical Assistance Service or County Technical Assistance Service in conjunctionwith the Tennessee Department of Economic and Community Development’s LocalPlanning Assistance Office.

Tennessee Advisory Commission on Intergovernmental Relations,Authorization No. 316366 ; 150 copies, August 2006. This documentwas promulgated at a cost of $5.24 per copy.
TACIR Members
Representative Randy Rinks, ChairmanMayor Tom Rowland, Vice ChairmanHarry A. Green, Executive Director
LegislativeSenator Steve CohenSenator Ward CrutchfieldSenator Bill KetronSenator Mark NorrisRepresentative Tre HargettRepresentative Kim McMillanRepresentative Randy RinksRepresentative Larry Turner
StatutoryRepresentative Craig Fitzhugh, Chairman, Finance Ways & Means CommitteeSenator Douglas Henry, Chairman, Finance Ways & Means CommitteeComptroller John Morgan
Executive BranchPaula Davis, Department of Economic & Community DevelopmentDrew Kim, Governor’s Office
MunicipalTommy Bragg, Mayor of MurfreesboroSharon Goldsworthy, Mayor of GermantownBob Kirk, Alderman, City of DyersburgTom Rowland, Mayor of Cleveland
CountyNancy Allen, Mayor of Rutherford CountyJeff Huffman, County Executive of Tipton CountyRichard Venable, Mayor of Sullivan CountyKen Yager, Mayor of Roane County
Private CitizensJohn Johnson, MorristownLeslie Shechter Newman, Nashville
Other Local OfficialsBrent Greer, Tennessee Development District AssociationCharles Cardwell, County Officials Association of Tennessee