Embed Size (px)
Citation preview
Volume 01, No.11, November 2015
Pa
ge2
0
Growth Performance Analysis -A Comparative Study between
Private and Public Sector Non-Life Insurance Companies
Dr. Sanjib Kumar Pakira
Assistant Professor, Department of Commerce, Maharaja Manindra Chandra College
ABSTRACT:
The paper compares the growth performance of private and public sector non-life insurance
companies in terms of affiliation and association between Net Profit After Tax and growth
performance indicators for the period from 2001-02 to 2013-14 using secondary data with the
application of descriptive methods of statistical analysis including multiple regressions.
Insurance services are now being incorporated into wider financial industry and the insurance
sector plays an important role in service based economy of India. The growth performance of the
private and public sector non-life insurance companies is straightforwardly connected to the
economy. Hence a Comparative study of Growth analysis of both the sector for a period of 13
years is made. The main parameters of growth in insurance sector are Gross Direct Premium
Income (GDPI), No of Policies Issued (NPI), Incurred Claims Ratio (ICR), Change in Reserve
for Unexpired Risk (CRUR), Commission, Expenses of Management (CEM), Equity Share
Capital Of Non-Life Insurers (EQNLI) and Net Profit After Tax (NPAT) and Descriptive
statistics shows that the growth performance of private sector non-life insurance companies is
very pleasing than public sector non-life insurance companies during the period under study and
the multiple regression test results reveal that in terms of the parameters defined public sector
non-life insurance companies has performed much better than private sector non-life insurance
companies.
Keywords: Growth, insurance, premium, descriptive statistics, multiple regressions
1. INTRODUCTION
The performance of an economy is very much connected with the performance of the financial
sector of that economy. Financial sector comprise a very important ingredient in any economy.
The financial sector of India is gaining strength over the years and its contribution to growth is
overwhelming. Insurance industry acts as a crucial role in the economic growth of an economy.
A strong insurance market covers approach for well-organized resource allocation in the course
of transfer of risk and enlistment of savings. The Insurance industry occupies a unique place in a
nation‟s economy. The origin of insurance business has been developed from the concept of
protecting the interests of people from uncertainty by providing certainty of payment at a given
contingency. Unlike life insurance, non-life insurance is not meant for returns but is protection
against contingencies such as accidents, illness, fire, burglary etc (Kramer, 1996).
The non-life insurance segment has been regarded as one of the rapidly increasing sectors in the
financial services sphere in India, because through this segment all the risks and financial
damage caused by a third party can be alleviated. Many companies have roped into this segment
which has evolved intense competition in the sector (Joo, B.A.2005). The shift in favour of

Volume 01, No.11, November 2015
Pa
ge2
1
market driven competition has brought about major changes to the industry. The induction of this
new era of insurance development has not only seen the propagation of new product and services
but huge manpower and capital were deployed by insurers to manage the operations.
Therefore the need to identify the determinants of growth performance of non-life insurance
segment in the India as well as other country context has gained importance. The industry has
also been maintaining a constant growth rate of 15 per cent to 16 percent over the last few years.
However, still the market is small in terms of insurance penetration and insurance density and as
per international standard, India has a tremendous potential for growth. In 2012-13, the non life
insurance premium to GDP ratio (usually known as insurance penetration) in India was 0.80 per
cent as compared to world average of 3.10 percent (IRDA, 2013). For the same year, the non life
insurance premium to population (usually known as insurance density) in India was USD 10.5 as
compared to world average of USD 130 (IRDA, 2013). Due to high risky nature of this industry
and the growing cynicism regarding working of insurance companies in India, it becomes
immensely critical to appraise the performance of insurance companies particularly companies
from non life segment. Keeping in view of this, the present research work examines and
evaluated the growth of public and private non-life insurance as a factor accountable for these
non-life insurance companies play an important role from the notion of protecting the interests of
people from uncertainty by providing certainty of payment at a given contingency. Against the
backdrop of high risky nature of the insurance industry and the growing skepticism regarding the
working of companies in this sector, it becomes immensely critical to evaluate and compare
growth performance of public and private non life insurance companies operating in India.
2. REVIEW OF LITERATURES
Many empirical studies had undergone in assessing the efficiencies of non-life insurance
companies, but largely the sphere of research was limited to the overseas insurance companies
and markets. Only few works have been tendered in this arena for efficiency measurement of
insurance companies in India.
Dhanda (2004) examined the performance of non-life insurance companies based on both
primary and secondary data for the period from 1957 to 1990. It was generated that the growth of
individual business had not been very consistent during the period from 1957 to 1990. The share
of individual business remained more than 50 per cent in total business. The profitability analysis
showed that more than 60 per cent of total income was received by way of premium income and
the remaining income was earned by investing funds. Deloittie and Touche (2004) observed that,
the profitability as well as efficacy of the federal Multi Peril Crop Insurance (MPCI) programme
using secondary data on both the MPCI business, and the property and casualty insurance
business for the period from 1992 to 2002. The empirical results designated that the MPCI line
of business does not possess risk return advantages relative to the P & C business because of net
losses. Jain (2004) revealed that the recent de-tarrification in the non-life domain has provided a
great deal of operational freedom to the players. After ten years in competitive market, the Indian
non-life insurance industry has underwritten rose to Rs 35,816 crores, registering a growth of
13.44 per cent in 2009-10. In addition to this, even today insurance is treated as vital economic
activity and there is an excellent scope for its growth in the emerging markets. Hoyt and Powell
(2006) observed the financial performance of medical liability insurer by using economic

Volume 01, No.11, November 2015
Pa
ge2
2
combined ratio and the return on equity for the period from 1996 to 2004. The study establishes
that there was no proof that medical liability insurers had been earning excessive returns or that
they were over-capitalized. The study wrapped up that there was no evidence that medical
malpractice insurance was overpriced. Rao (2007) opined that a land mark year in the history of
Indian insurance industry was 1999-2000. The year 2007 is going to another watershed for the
industry because de-tariffication from first January 2007 has totally changed the complexion of
the non-life insurance industry. Since financial inclusion is being emphasized in various levels,
the insurance industry will have to play a vital role by providing health insurance and other
insurance products for the poor. Mahmoud (2008) assessed the financial performance of
insurance companies in Egypt based on the data consisted of three public sector and three private
sector non-life companies for the period from 1992-93 to 2005-06 using 25 ratios to measure the
efficiency and financial performance with the application of factor analysis for data reduction.
The study establish that the mean of efficiency of financial performance do not vary notably
under the study. Public sector belongings correspond to 66.7 per cent of the low-efficiency
clusters of financial performance, while private sector cases comprise 47.6 per cent of high-
efficiency clusters for financial performance. Consequently, there is a relationship between the
fuzzy classification of the insurance company's financial performance efficiency and its
ownership type
A significant number of studies on performance of public and private non life insurance sector
have already been undertaken. Though profitability and growth performance of the non life
insurance companies have become most fascinating area for study but with the view of growth in
economy, the importance of growth performance in non life insurance sector cannot be ignored.
The comparative analysis of growth performance among public and private non life insurance
sector is an area which has not yet explored.
The conclusive sum of this retrospective review of relevant literatures produced till date on the
offered subject reveals wide room for the validity and originates of this work and reflects some
crucial clues that affirm its viability, as may be marked here it. No study has incorporated the
growth performance of public and private non life insurance sector in India. The comparative
analysis of growth performance among public and private non life insurance companies at
insurance level is an area which has not yet explored. The present study will try to analyze and
compare the growth of the following public sector and the private sector non life insurance
companies which is shown in table-1.
Table-1: Non-life insurance companies operating in India
PRIVATE SECTOR PUBLIC SECTOR
1. Bajaj Allianz General Insurance Company
Ltd.
2. Bharti AXA General Insurance Company Ltd
3. Cholamandalam MS General Insurance
Company Ltd
4. Future General India Insurance Company Ltd,
5. HDFC ERGO General Insurance Company
Ltd
1. National Insurance Company Ltd.
2. The New India Assurance
Company Ltd
3. The Oriental Insurance Company
Ltd
4. United India Insurance Company
Ltd

Volume 01, No.11, November 2015
Pa
ge2
3
6. ICICI Lombard General Insurance Company
Ltd.
7. IFFCO Tokio General Insurance Company
Ltd.
8. L & T General Insurance Company Ltd.,
9. Liberty Videocon General Insurance
Company Ltd,
10. Magma HDI General Insurance Company Ltd,
11. Raheja QBE General Insurance Company Ltd
12. Reliance General Insurance Company Ltd.
13. Royal Sundaram Alliance Insurance Company
Ltd.
14. SBI General Insurance Company Ltd
15. Shriram General Insurance Company Ltd
16. TATA AIG General Insurance Company Ltd.
17. Universal Sompo General Insurance Company
Ltd
Source: HANDBOOK ON INDIAN INSURANCE STATISTICS 2013-14
2.1 Objectives of the Study
The Insurance industry occupies a unique place in a nation‟s economy. The origin of insurance
business has been developed from the concept of protecting the interests of people from
uncertainty by providing certainty of payment at a given contingency. Unlike life insurance, non-
life insurance is not meant for returns but is protection against contingencies such as accidents,
illness, fire, burglary etc. Keeping in view, the importance of insurance companies in nation‟s
development, the general objective of the study is to evaluate the overall growth performance of
private and public sector non-life insurance companies over a period of 13 years (2001-02 to
2013-14). More specifically, the intention of the study is to:
To study the growth performance of both private and public sector non-life insurance
companies under study.
To compare the growth of the of private and public sector non-life insurance companies
under study.
3. MATERIALS AND METHODS
3.1 Sources of data
The study is based on secondary data obtained from HANDBOOK ON INDIAN INSURANCE
STATISTICS 2013-14. In addition, the facts, figures and findings sophisticated in related past
studies and the government publications are as well used to complement the secondary data.
3.2 Research design
Since growth performance of a non-life insurance business means an increase in the business
over a period of time in the areas of Gross Direct Premium Income (GDPI), No of Policies
Issued (NPI), Incurred Claims Ratio (ICR), Change in Reserve for Unexpired Risk (CRUR),
Commission, Expenses of Management (CEM), Equity Share Capital Of Non-Life Insurers
(EQNLI) and Net Profit After Tax (NPAT) of the current year in comparison to previous year.
Volume 01, No.11, November 2015
Pa
ge2
4
So we have measured growth performance ratio encircling the absolute information using the
sample period extents from 2001-02 to 2013-14; nevertheless, there are 12 observations. Eviews
7.0 package program and SPSS have been utilized for coordinating the data and carrying out of
statistics and econometric analyses.
3.3 Variable used
In the present study, Gross Direct Premium Income (GDPI), No of Policies Issued (NPI),
Incurred Claims Ratio (ICR), Change in Reserve for Unexpired Risk (CRUR), Commission,
Expenses of Management (CEM), Equity Share Capital of Non-Life Insurers (EQNLI) and Net
Profit After Tax (NPAT) have been used to measure the growth performance. Net Profit After
Tax growth is taken as dependent variable and six main factors that affect the growth
performance have been taken as independent variable for the present study.
3.4 Tools used
In the course of analysis in the present study, descriptive statistics, correlation statistics and
multiple regression statistics have been used. The uses of all these tools at different places have
been made in the light of requirement of analysis.
3.5 Hypothesis taken
Since the objective of this study is to compare the growth of the non-life insurance companies in
private and public sector, the study makes the following hypothesis:
Hypothesis 1
H0: There are significant differences subsist in growth performance between private and public
sector non-life insurance companies over the period under study.
H1: There are no significant differences subsist in growth performance between private and
public sector non-life insurance companies over the period under study.
5. EMPIRICAL RESULTS AND ANALYSIS
4.1 Descriptive statistics
Descriptive statistics shows that mean value of public sector non-life insurance companies in
terms of growth performance indicators are more satisfactory than private sector non-life
insurance companies under the study except GDPI and NPI which indicates that growth
performance of public sector non-life insurance companies is very pleasing than private sector
non-life insurance companies in India during the period under study. To make the analysis and
interpretation more precise and accurate, the values of S.D., C.V., maximum, minimum,
Skewness and Kurtosis have been computed from the growth ratios. In the case of management
of growth performance in the area of NPI, CRUR, CEM, EQNLI and NPAT, C.V. of private
sector non-life insurance companies is better than public sector non-life insurance companies
because lower variability is seen in case of private sector non-life insurance companies. Again in
the area of GDPI and ICR lower variability is seen in case of public sector non-life insurance
companies. This is an indication of satisfactory management of growth performance. All the
variables of both private and public sector non-life insurance companies show positive and
negative skewness and the kurtosis which indicates that all the selected variables are less peaked

Volume 01, No.11, November 2015
Pa
ge2
5
than normal distribution. For a normal distribution kurtosis generally equals to 3. Median,
Skewness, Kurtosis, authenticates that none of the variables are normally distributed, which is
shown in tables 2 & 3.
Table-2: Descriptive Statistics on Various growth performance indicator of Public Sector
non-life insurance companies
GDPI NPI ICR CRUR CEM EQNLI NPAT
Mean 10.9967 12.0308 -.0092 .1724 .0104 .0356 .7289
Median 9.3600 8.9500 -.0200 .2110 .0160 .0000 .1201
Maximum 22.13 96.15 .10 .85 .27 .13 9.22
Minimum 3.07 -19.48 -.11 -.46 -.18 .00 -4.05
Std. Dev. 6.22473 30.34947 .06788 .47357 .11278 .05312 3.07262
C.V. (%) 56.61% 252.26% -737.83% 274.69% 1084.42% 149.21% 421.54%
Skewness .646 2.095 .297 -.003 .466 .889 1.857
Kurtosis -.618 5.606 -.912 -1.329 2.552 -1.344 6.091
Observations 12 12 12 12 12 12 12
Source: Author's own calculation with the help of spss
Table-3: Descriptive Statistics on Various performance indicator of private Sector non-life
insurance companies
GDPI NPI ICR CRUR CEM EQNLI NPAT
Mean 47.5467 33.9800 -.0325 -.1224 -.0604 .2008 -2.5485
Median 27.5950 18.3250 .0150 -.0980 -.0171 .2240 .2827
Maximum 188.64 96.72 .07 .43 .14 .41 8.93
Minimum 12.09 3.85 -.46 -.61 -.49 .00 -43.79
Std. Dev. 48.52470 29.32663 .14573 .31763 .16262 .11001 13.34240
C.V. (%) 102.06% 86.31% -448.40% -259.50% -269.24% 54.79% -523.54%
Skewness 2.540 1.082 -2.635 -.039 -1.818 -.304 -3.118
Kurtosis 7.376 .250 7.758 -.301 4.466 .511 10.455
Observations 12 12 12 12 12 12 12
Source: Author's own calculation with the help of spss

Volume 01, No.11, November 2015
Pa
ge2
6
4.2 Correlation Statistics
Generally, correlation analysis attempts to determine the degree and direction of relationship
between two variables under study. In a bivariate distribution, if the variables have the cause and
effect relationship, they have high degree of correlation between them. The co-efficient of
correlation is denoted by “r”. The correlation is studied using Karl Pearson’s correlation formula.
N Σxy - (Σx) (Σy)
r = ------------------------------------------------- (Karl Pearson’s correlation formula)
√ (N Σx2 – (Σx)2 ) (N Σy2 – (Σy)2)
Spearman‟s correlation analysis is used to see the relationship between growth performance and
profitability. If efficient growth performance increases profitability, one should expect a negative
relationship between the measures of growth performance management and profitability
variable. Table 4 & 5 demonstrates result of correlation coefficients and t-values are listed
accordingly.
Table-4: Correlation Statistics on Various performance indicator of
Public Sector non-life insurance companies
GDPI NPI ICR CRUR CEM EQNLI NPAT
GDPI 1.000
NPI .198 1.000
ICR -.248 -.291 1.000
CRUR .051 .028 -.148 1.000
CEM -.339 .084 .265 -.456 1.000
EQNLI -.324 -.163 .129 .033 -.302 1.000
NPAT .424 -.478 -.239 -.202 -.421 -.044 1.000
Source: Author's own calculation with the help of spss

Volume 01, No.11, November 2015
Pa
ge2
7
Table-5: Correlation Statistics on Various performance indicator of
private Sector non-life insurance companies
GDPI NPI ICR CRUR CEM EQNLI NPAT
GDPI 1.000
NPI .031 1.000
ICR -.912**
.197 1.000
CRUR -.392 .087 .476 1.000
CEM -.851**
.124 .877**
.168 1.000
EQNLI -.150 -.209 .167 -.044 .120 1.000
NPAT .124 .262 -.182 -.082 -.128 -.174 1.000
Source: Author's own calculation with the help of spss
**. Correlation is significant at the 0.01 level (2-tailed).
Correlation statistics in tables 4 identify that NPI, ICR, CRUR, CEM and EQNLI are negatively
correlated with NPAT and only GDPI is positively related with NPAT in case of public sector
non-life insurance companies during the period under study. Whereas Correlation statistics in
tables 5 identify that the entire variables except GDPI and NPI are negatively correlated with
NPAT in case of private sector non-life insurance companies during the period under study.
Negative relationship between the measures of growth performance management and
profitability variable indicate efficient growth performance increases profitability. Correlation
test result is unbelievably powerful in case of public sector non-life insurance companies than
private sector non-life insurance companies. However it does not talk about the grounds and
shock. In order to make out an unequivocal delineation of the shock, it is obligatory to execute
multiple regression tests between the selected variables.
4.3 Multiple Regression Statistics
Most sophisticated multiple regression techniques have been applied to study the joint influence
of all the selected ratios indicating growth performance and performance on the NPAT and the
regression coefficients have been tested with the help of the most popular „t‟ test. With the
intention of observe the association between the dependent variable Net Profit After Tax growth
(NPAT) and six independent variables of Gross Direct Premium Income growth (GDPI), No of
Policies Issued growth (NPI), Incurred Claims Ratio growth (ICR), Change in Reserve for
Unexpired Risk growth (CRUR), Commission, Expenses of Management growth (CEM), Equity
Share Capital Of Non-Life Insurers growth (EQNLI) have been used to measure the performance
of public and private sector non-life insurance companies
Volume 01, No.11, November 2015
Pa
ge2
8
The regression model used in this analysis is:
NPAT = £ + ß1GDPI + ß2 NPI + ß3 ICR + ß4 CRUR + ß5 CEM + ß6 EQNLI + εt (unexplained
variables or error terms)
Where £, ß1, ß2, ß3, ß4, ß5, ß6 are the parameters of the NPAT line.
With the aim to determine the reliability of the regression results, Durbin-Watson statistics has
been used. The rule of thumb is that the observed D-W statistic should be between 1 and 4 for
the dependability of the regression results and the absence of serial correlation. In order to
examine the multicollinearity between the independent variables, variance inflation factor (VIF)
has been used. According to modern statistics if the VIF of a variable does not exceed 5, it may
be said that there are no multicollinearity problem with other independent variables.
First of all, six independent variables of Gross Direct Premium Income growth (GDPI), No of
Policies Issued growth (NPI), Incurred Claims Ratio growth (ICR), Change in Reserve for
Unexpired Risk growth (CRUR), Commission, Expenses of Management growth (CEM), Equity
Share Capital Of Non-Life Insurers growth (EQNLI) and Net Profit After Tax growth (NPAT)
has been used as dependent variable. Using these six independent variables as the determinants
of NPAT it has found that six variables are correlated with each other.
4.3.1 Public Sector non-life insurance companies It is also observed that insignificant association is found with a very high standard error for all
the runs of the regression model. In order to reduce the multicollinearity problem and to obtain
reliable results, next step of regressions under enter method with seven variables linear
regression analyses run on the SPSS are performed.
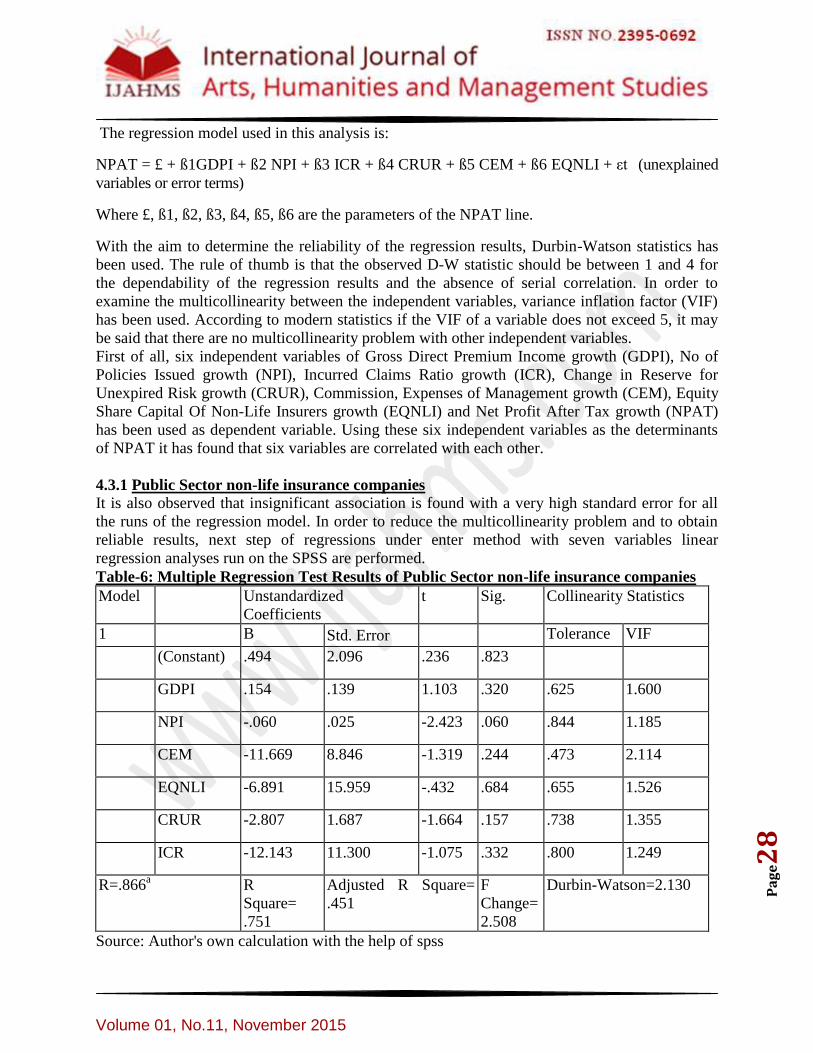
Table-6: Multiple Regression Test Results of Public Sector non-life insurance companies
Model Unstandardized
Coefficients
t Sig. Collinearity Statistics
1 B Std. Error Tolerance VIF
(Constant) .494 2.096 .236 .823
GDPI .154 .139 1.103 .320 .625 1.600
NPI -.060 .025 -2.423 .060 .844 1.185
CEM -11.669 8.846 -1.319 .244 .473 2.114
EQNLI -6.891 15.959 -.432 .684 .655 1.526
CRUR -2.807 1.687 -1.664 .157 .738 1.355
ICR -12.143 11.300 -1.075 .332 .800 1.249
R=.866a R
Square=
.751
Adjusted R Square=
.451
F
Change=
2.508
Durbin-Watson=2.130
Source: Author's own calculation with the help of spss

Volume 01, No.11, November 2015
Pa
ge2
9
a. Predictors: (Constant), ICR, EQNLI, CRUR, NPI, GDPI, CEM
b. Dependent Variable: NPAT
It is observed from the table 6 that, one unit increase in GDPI, NPAT of the public sector non-
life insurance companies during the period under study increased by 0.154 units. However, one
unit increase in NPI, CRUR and EQNLI, NPAT of the public sector non-life insurance
companies decreased by 0.060 units, 2.807 units and 6.891 units respectively. Again for one unit
increase in ICR and CEM, the NPAT of the public sector non-life insurance companies
decreased by 12.143 units and 11.669 units in the same way. It is evident from the table that all
the growth performance indicators except GDPI have extremely high negative impact on NPAT.
The multiple correlation coefficients (R) between the NPAT and the independent variables taken
together is 0.866. It may be said that NPAT was significantly influenced by its independent
variables. R2 defines to what extent the variation in the response is explained by the regression.
From the table it is observed that the value of R2 is 0.751, which means 75% of the variation is
explained by the regression. Adjusted R2 0.451 indicates the co-efficient of determination which
is positively associated in the regression equation. The value of F Change is 2.508, which
examines the significance of all the variables collectively in regression function. The observed
R2 and F statistics may thus be sufficient to draw an inference in the favour of goodness of the
regression model to fit into the present task of identifying the factors influencing the NPAT of
the public sector non-life insurance companies during the study period. Durbin-Watson static
informs us whether the assumption of independent errors is tenable. The closer to 2 the value is
the better and for the data it was 2.130. VIF measures the multicollinearity problem, which is the
inverse of tolerance value. Based on the value of VIF in tables, there is very low
multicollinearity among the variables because VIF is less than 5.
4.3.2 private Sector non-life insurance companies It is also observed that insignificant association is found with a very high standard error for all
the runs of the regression model. In order to reduce the multicollinearity problem and to obtain
reliable results, next step of regressions under enter method with seven variables linear
regression analyses run on the SPSS are performed.
Table- 7: Multiple Regression Test Results of Private Sector non-life insurance companies
Model Unstandardized
Coefficients
t Sig. Collinearity Statistics
1 B Std.
Error
Tolerance VIF
(Constant) -3.589 14.993 -.239 .819
GDPI -.070 .243 -.288 .783 .187 5.340
NPI .137 .190 .723 .497 .837 1.194
CEM -27.993 67.695 -.414 .694 .214 4.663

Volume 01, No.11, November 2015
Pa
ge3
0
EQNLI -13.936 48.124 -.290 .782 .927 1.078
CRUR -6.541 19.134 -.342 .744 .704 1.421
R=.352a R
Square=
.124
Adjusted R
Square= -.606
F
change
=.170
Durbin-Watson=2.669
Source: Author's own calculation with the help of spss
a. Predictors: (Constant), CRUR, EQNLI, CEM, NPI, GDPI
b. Dependent Variable: NPAT
c. Variable excluded: ICR
It is observed from the table 7 that after removing ICR, one unit increase in NPI, NPAT of the
private sector non-life insurance companies increased by 0.137 units. However, one unit increase
in GDPI, CRUR and EQNLI, NPAT of the private sector non-life insurance companies
decreased by 0.070 units, 6.541 units and 13.936 units correspondingly. Again for one unit
increase in CEM, the NPAT of the private sector non-life insurance companies decreased by
27.993 units in the same way. It is evident from the table that all the growth performance
indicators except NPI have extremely high negative impact on NPAT.
The multiple correlation coefficients (R) between the NPAT and the independent variables taken
together is 0.352. It indicates that the profitability was not responded more by its independent
variables. It may be said that NPAT was insignificantly influenced by its independent variables.
R2 defines to what extent the variation in the response is explained by the regression. From the
table it is observed that the value of R2 is 0.124, which means approx13% of the variation is
explained by the regression. Adjusted R2 -0.606 indicates the co-efficient of determination which
is negatively associated in the regression equation. The value of F change is 0.170, which
examines the significance of all the variables collectively in regression function. The observed
R2 and F statistics may thus be sufficient to draw an inference in the favour of goodness of the
regression model to fit into the present task of identifying the factors influencing the NPAT of
the private sector non-life insurance companies during the study period. Durbin-Watson static
informs us whether the assumption of independent errors is tenable. The closer to 2 the value is
the better and for the data it was 2.669. VIF measures the multicollinearity problem, which is the
inverse of tolerance value. Based on the value of VIF in tables, there is very low
multicollinearity among variables except GDPI because VIF of the variable is higher than 5.
4.3.3 Test of Hypotheses
A hypothesis is a supposition to be tested. The statistical testing of hypothesis is the significant
method in statistical inference. Hypothesis tests are far and wide used in business and industry
for making decisions. The following are the hypothesis framed and tested using test of
significance at 5% level of significance.

Volume 01, No.11, November 2015
Pa
ge3
1
t- test Results
Test Value = 0 95% Confidence
Interval of the
Difference
t df Sig. (2-
tailed)
Mean
Difference
Lower Upper
Public Sector non-life
insurance companies
.822 11 .429 .72892 -1.2233 2.6812
Private Sector non-life
insurance companies
-.662 11 .522 -2.54851 -11.0259 5.9288
Total 0.16 0.951
Source: Author's own calculation with the help of spss
The calculated value of t is less than the significant value, hence null hypotheses is accepted.
5. CONCLUSIONS
The present study investigates and compares the growth performance of public and private sector
non-life insurance companies for the period from 2001-02 to2013-14 using descriptive statistics,
correlation statistics and multiple regression statistics. The empirical results of descriptive
statistics illustrate that the growth performance of public sector non-life insurance companies is
very pleasing than private sector non-life insurance companies in India during the period under
study. In the case of management of growth performance in the area of NPI, CRUR, CEM,
EQNLI and NPAT, C.V. of private sector non-life insurance companies is better than public
sector non-life insurance companies because lower variability is seen in case of private sector
non-life insurance companies. Again in the area of GDPI and ICR lower variability is seen in
case of public sector non-life insurance companies. This is an indication of satisfactory
management of performance. Correlation test result is unbelievably powerful in case of public
sector non-life insurance companies than private sector non-life insurance companies .However
it does not talk about the grounds and shock. Again, multiple regression test results exemplifies
that the growth of Net Profits After Tax meagerly hinge on the growth indicators of private
sector non-life insurance companies and it relies on EQNLI, CRUR, NPI, GDPI, and CEM in
case of both public and private sector non-life insurance companies under the study. It also
indicates that the NPAT of private sector non-life insurance companies does not rely on ICR.
This study is not free from certain limitations. We have considered only 13 years period for the
study and based on only seven performance indicators. All the numerical figures or the growth
parameters, based on which the calculations were made and the inferences are drawn, had been
on the basis of information obtained from secondary sources.We could not consider the growth
on Comparative studies on Marketing Strategy between Indian Public Sector Unit and Private
Sector units and Customers' perception regarding Public and Private non-life Insurance products.
This will be my future research work.

Volume 01, No.11, November 2015
Pa
ge3
2
REFERENCES
i. Kramer (1996). “An ordered Logit Model for the Evaluation of Dutch Non Life Insurance
Industry”, De Economist, 144: 79-91.
ii. Joo, B.A. (2005). “Performance of Insurance Sector in India”, the Business Review,
11(2):77-86.
iii. IRDA Annual Report, (2012-13). Insurance Regulatory Development Authority,
Hyderabad.
iv. Dhanda, R.L. (2004), "Divisional Performance Evaluation of LIC Business in North
Zone", Finance India, Vol. XVIII, No. 1, pp. 229-233.
v. Deloittie; and Touche, L. (2004), "Federal Crop Insurance Program: Profitability and
Effectiveness Analysis", National Crop Insurance Services, 2-23.
vi. Jain, A. K. (2004). Waves of liberalization. The Journal of Insurance Institute of India,
30-53.
vii. Hoyt, R.E.; and Powell, L.S. (2006), "Assessing Financial Performance in Medical
Professional Liability Insurance", Journal of Insurance Regulation, 3-13.
viii. Rao, T. S. (2000). The Indian insurance industry: The road ahead. Journal of Insurance
Chronicle, 1(3), 31.
ix. Mahmoud, O. (2008), "A Multivariate Model for Predicting the Efficiency of Financial
Performance for Property and Liability Egyptian Insurance Companies", Casulty
Actuarial Society, 53-78.