Embed Size (px)
Citation preview

Growth of the Intensive Livestock Industry in Asia –
Implications for Australia
A.C. Edwards
ACE Livestock Consulting Pty. Ltd.
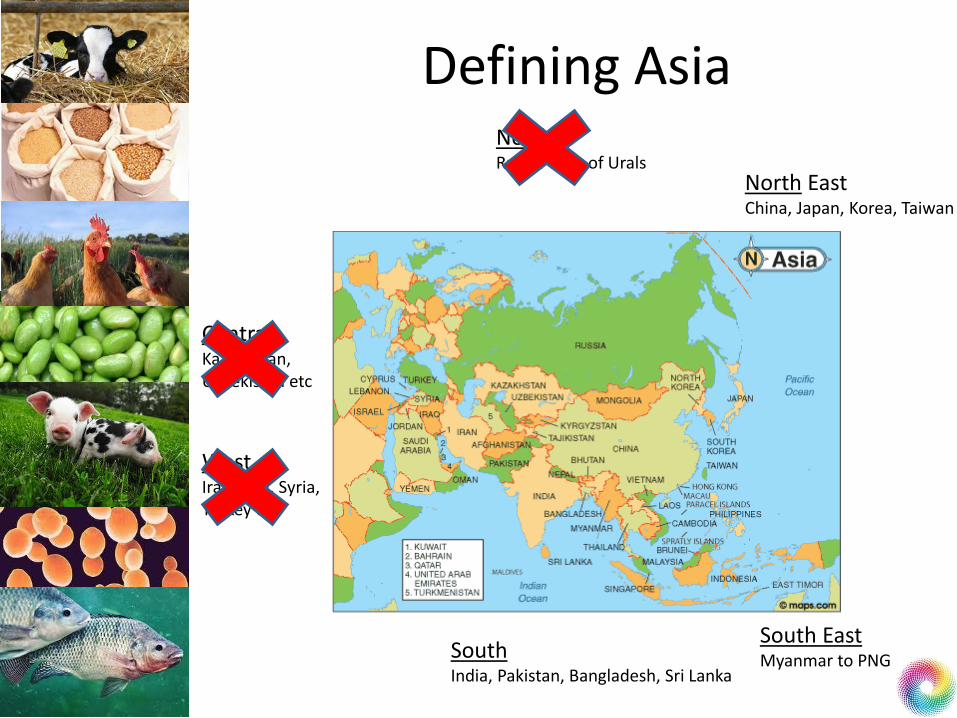
Defining Asia North Russia west of Urals
North East China, Japan, Korea, Taiwan
South India, Pakistan, Bangladesh, Sri Lanka
South East Myanmar to PNG
Central Kazakhstan, Uzbekistan etc
West Iran, Iraq, Syria, Turkey etc

Asia
• Over half the worlds population lives in Asia
• Also contains 60% of the 925 million under or malnourished people
• Highly heterogeneous region with wide difference in culture, economic activity, resources, level of development, and technical/institutional capacity
• Hence difficult to address collectively
• Main influences are China, India, Indonesia and Thailand

World Population Growth

Human Population (millions) Shift of demographics
1990 2010 2050
Sth Asia Total 1196 1704 2393
Rural 879 1164 1064
Urban 317 539 1329
East Asia Total 1359 1574 1512
Rural 923 785 386
Urban 436 789 1126
S.E. Asia Total 445 593 759
Rural 305 344 259
Urban 140 249 500
Aust/NZ Total 20 26 37
Rural 3 3 2.5
Urban 17 23 34.5
World Total 5296 6896 9306
Rural 3045 3412 2907
Urban 2251 3484 6399
(Source: FAOSTAT 2012)

Asian Wealth (GDP/Capita, USD)
2010 2030 2050
China 7518 21100 47800
India 3339 13200 41700
Indonesia 4394 13500 37400
South Korea 30200 60200 107600
Viet Nam 2793 11900 33800
Australia 56200 101000 145000
World 11900 19400 36600
(Source: IMF 2010)
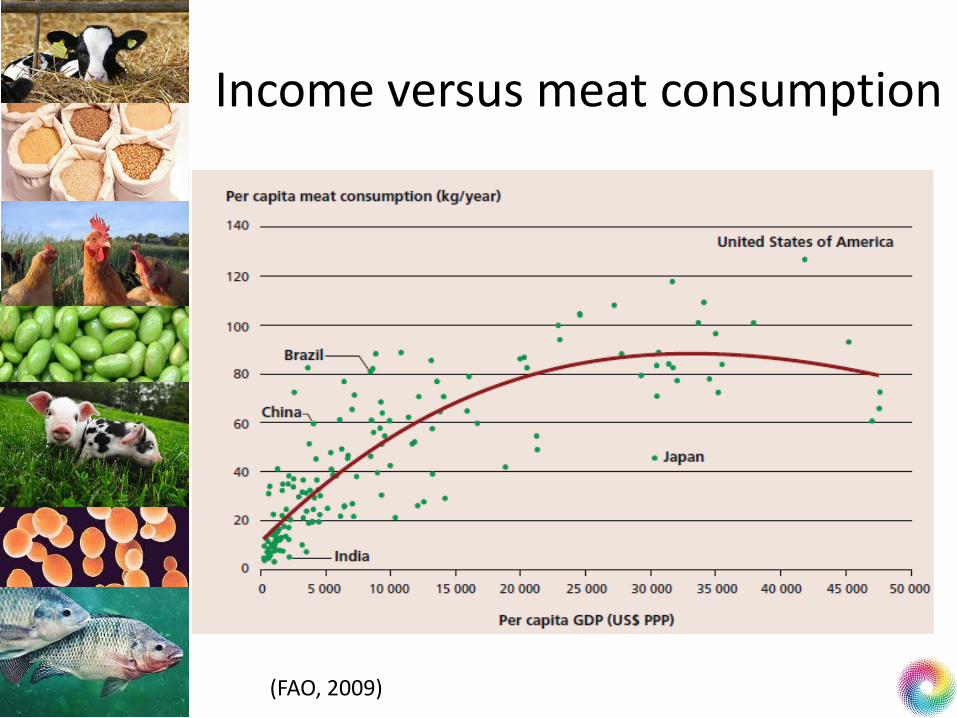
Income versus meat consumption
(FAO, 2009)

Changing nature of global food demand
• Driving Factors
Population
Wealth
urbanisation
• Projected outcomes by 2050
Not only more food (70%)
But a different food profile
2009 2050
Cereal Production 2.1 billion T 3.0 Billion T
Meat Production 270 Million T 470 Million T

World Agrifood Demand

China’s Imports

Net Movement of Chicken Meat 2012 (‘000 Tonnes)
Production Consumption Import Export Balance = self sufficient
South Asia
India 2602 2590 - 12 Pakistan, Bangladesh, Sri Lanka
SE Asia
Thailand 1592 1088 - 504 Indonesia, Cambodia
Malaysia 1620 1650 - 30 Laos, Singapore
Philippines 851 971 120 -
Vietnam 676 1276 600 -
North Asia
Japan 1470 2662 1192 -
South Korea 726 811 85 -
Taiwan 666 785 119 -
China 13708 14801 1093 -
Other
Eu 12764 12764 - -
USA 19465 15782 - 3683
(GIRA 2013)

Poultry Meat Consumption (kg/head/yr)
2001 2012 % Increase
South Asia
India 0.92 2.12 130
Pakistan 2.33 (4.38) 88
Bangladesh 1.03 (1.37) 33
Sri Lanka 4.37 (4.94) 13
SE Asia
Thailand 13.65 15.08 10
Malaysia 32.58 56.84 74
Philippines 7.9 9.93 26
Indonesia 4.41 7.33 66
Vietnam 4.9 14.12 188
Cambodia 2.15 (1.97) -
Laos 2.47 (4.54) 84
Singapore 24.19 (20.68) -
North Asia
Japan 17.16 21.11 23
South Korea 10.43 16.22 56
Taiwan 31.76 33.52 6
China 10.1 10.90 8
Others
EU 23.93 25.34 6
USA 49.4 50.23 2
(Figures in brackets = 2011 data) (GIRA 2013)

Net Movement of Pig Meat 2012 (‘000 Tonnes)
Production Consumption Import Export
South Asia
India 366 366 - -
SE Asia
Thailand 985 934 - 51
Malaysia (234) (247) 13 -
Philippines 1548 (1476) - 72
Indonesia (205) (205) - -
Vietnam 3349 3337 - 12
Cambodia (98) (98) - -
Laos (64) (64) - -
Singapore (19) (26) 7
North Asia
Japan 1275 2569 1294 -
South Korea 1067 1594 527 -
Taiwan 885 944 59 -
China 51400 51978 578 -
Other
EU 22646 20510 - 2136
USA 10540 8290 - 2300
(Figures in brackets = 2011 data) (GIRA 2013)

Pork Consumption (kg/head/year)
2001 2012 % Increase
South Asia
India 0.45 0.3
SE Asia
Thailand 10.56 13.92 32
Malaysia 7.75 (7.8) 1
Philippines 13.45 (15.1) 12
Indonesia 0.77 (0.85) 10
Vietnam 18.46 37.21 102
Cambodia 8.52 (6.82)
Laos 5.85 (10.22) 75
Singapore 6.66 (4.96)
North Asia
Japan 18.16 20.37 12
South Korea 24.54 31.88 30
Taiwan 43.5 40.3
China 31.38 38.47 23
Others
EU 43.74 40.72
USA 29.38 26.38
(Figures in brackets = 2011 data) (GIRA 2013)

Feed milling in 2012 (‘000 Tonnes)
Total Pig Ruminant Poultry Aqua
South Asia
India 26840 0 5864 17470 3500
Pakistan 7410
Bangladesh 2730
Sri Lanka 615
SE Asia
Thailand 15750 6000 800 7000 1600
Malaysia 4400
Philippines 11917
Indonesia 13801 500 1100 11252 1300
Vietnam 12000 6500 125 2455 2920
Cambodia
Laos
Singapore 0
Myanmar 600
North Asia
Japan 25220 6109 7947 10395 432
South Korea 13515
Taiwan 7893
China 198340 58140 65500 60400 13300
Total Asia 356542
Other
Europe 208400
USA 168460 23590 43020 86850 1000
Australia 7500
(Alltech Inc., 2013)

Asia is a major livestock producer
• The reality is that Asia accounts for
– 70% of the worlds poultry
– 44% of the worlds sheep & goats
– 49% of the worlds cattle
– 84% of the worlds pigs

Development & Demographic Change
• Rapid development of the pig & poultry industries has created a lot of structural change
• There is concern that many of the small holders will be marginalised resulting in rural hardship
• In China alone between 1985-2005, 70 million small poultry growers left the industry
• More than 50% of the broiler production now comes from large industrialised farms in China with a similar situation in Thailand and the Philippines
• In lower income countries the livestock revolution is just beginning

Consequences of Rapid Livestock Production Development
• Rapid expansion of livestock production has increased the risk to animals and human health from disease e.g. In 2007 ‘Blue ear disease’ (PRRS, PCV2, Swine fever) resulted in the loss of 50 million pigs in China (9% of their inventory)
• Uncontrolled use of antibiotics raises the risk of tissue residues and microbial resistance
• The emergence of H1N1 Swine flu, and H5N1 Avian flu (and their variants), plus SARS have damaged confidence in food safety
• Environmental pollution by uncontrolled manure disposal and dead stock have raised serious concerns.

Productivity Improvement
• The potential for livestock production improvement in Asia is high
– E.g. China has more pigs than the rest of the world combined, but productivity is low.
– E.g India producers more milk than the USA but achieves it by shear cow numbers as the average dairy yield per cow is only of the order of 4L/day

Implications for Australia
• Pig and poultry meat supply opportunities from Australia are limited
• Most of the increased meat demand will be as pork and chicken
• Australia is not well placed to compete for this supply – Constraints
• Cost of production – Labour – Feed – Licences – Environmental compliance – Welfare restrictions – Water (supply + cost) – Freight (Internal & export)
• Genetics • Small domestic market • AUD exposure • Exposure to world commodity market • Limited capital

Implications for Australia • Australia is competitive in other commodities
• Export Projections.
Competitors EU, Brazil, USA
EU, Ukraine, US
EU, East Europe, NZ
NZ
EU, Brazil, E. Europe, Thailand
Australia does not need much of the pie to do well. We may not be able to compete with generic meat products but we may well be able to capture the high quality clean/green market niche at good margins

Implications for Australia • Grain supply opportunities – feedgrains,legumes,oilseeds--
- but strong competition
• Need to educate Asian feedmillers on the value of wheat relative to corn or DDGS and the value of animal proteins relative to soybeanmeal.
• I endorse the statement of Moir & Morris (ABARE 2011) ‘Australia’s greatest contribution to global food security will be through
provisions of technical cooperative assistance to food deficient countries.’
• Avenues include – University Education – Trade training and experience – On-site consulting – Aid packages
This however may be transient. These countries way well over take us
technically in due course.

Conclusions
• The intensive livestock industries in Asia have advanced rapidly in recent years to be collectively the dominant livestock producers and stockfeed millers in the world.
• The scale, nature and intensity of activities in each of the countries involved varies widely, due to cultural, economic and resource differences.
• Some are well advanced and maturing while others are just beginning their development.
• The combined effects of population, wealth and urbanisation will increase meat demand and result in further intensive livestock development, creating greater demand for feedgrains and proteinmeals.

Conclusions
• Australia is not well placed to provide generic meat supply from intensive livestock production (pork, chicken, fish) but does have the capacity to supply a number of agricultural commodities (beef, lamb, dairy products, cereal grains, legumes, protein meals, sugar etc) and participate in the region’s prosperity.
• However Australia’s biggest contribution to global food security will likely come in the form of education and technical support to the developing countries.