Embed Size (px)
Citation preview


GROWTH AND EFFICIENCY OF SMALL SCALE INDUSTRY
AND ITS IMPACT ON THE ECONOMIC DEVELOPMENT OF
SINDH SINCE 1990-2004: CASE STUDY OF
LARKANA AND SUKKUR ESTATE AREA
PH D THESIS
BY
MUMTAZ ALI JUNEJO
DEPARTMENT OF COMMERCE
FACULTY OF COMMERCE & BUSINESS ADMINISTRATION
SHAH ABDUL LATIF UNIVERSITY. KHAIRPUR
SINDH PAKISTAN
2008
GROWTH AND EFFICIENCY OF SMALL SCALE INDUSTRY
AND ITS IMPACT ON THE ECONOMIC DEVELOPMENT OF
SINDH SINCE 1990-2004: CASE STUDY OF
LARKANA AND SUKKUR ESTATE AREA

Mumtaz Ali Junejo
A thesis submitted to the Shah Abdul Latif University Khairpur Sindh in Partial
Fulfillment of the requirement for the Degree of Doctor of Philosophy in Commerce under the
supervision of
Prof. Dr. Muhammad Nawaz Chand
2008
DEPARTMENT OF COMMERCE
FACULTY OF COMMERCE & BUSINESS ADMINISTRATION
SHAH ABDUL LATIF UNIVERSITY, KHAIRPUR
SINDH PAKISTAN

Dedicated to my
Father
Mother
Wife
&
Children

DECLARATION
I hereby declare that this thesis has been prepared and written by my-seif and that all
the work carried out in this study is based on my research except where specifically
stated
Mumtaz Ali Junejo


II
CERTIFICATE
This is certified that the research work embodied in the thesis entitled "GROWTH AND
EFFICINCY OF SMALL SCALE INDUSTRY AND ITS IMPACT ON THE
ECONOMIC DEVELOPMENT OF SINDH SINCE 1990-2004: CASE STUDY OF
LARKANA AND SUKKUR ESTATE AREA" was carried out by Mr. Mumtaz Ali
Junejo under my guidance and supervision. It is also certified that he has incorporated all
the observations/changes marked by the one of the foreign external examiner. His research
work is original and his thesis is worthy of presentation to Shah Abdul Latif University .
Khairpur for awarding the degree of Doctor of Philosophy (Ph.D) in the discipline of
Commerce.
Prof. Dr. Muhammad Nawaz Chand
Research Guide


ill
ACKNOWLEDGEMENT
With profound regards and deep sense of gratitude 1 feel pride in acknowledging that I am
very much indebted to learned Professor. Dr. Muhammad Nawaz Chand my guide who
always encouraged me by giving his dynamic and scholarly guidance by which I have
completed the Ph.D research work within time. Indeed. I acquired a great deal of knowledge
by his thought provoking ideas and concrete suggestions in research methodology. In fact it
was an up-hill task and mission impossible without his supervision and guidance which will
remain as most valuable asset in rest of my life.
I express my gratitude to Dr. Parvccz Ahmed Pathan who gave me valuable suggestions
regarding the research design and compilation of thesis.
I am also thankful to Dr. Ghulam Sarwar Larik who gave me some important books and
materials on the research methodology which enabled me to design the comprehensive
research proposal.
My special thanks to Mr. Aijaz Akhtar Memon Director Sindh Small Industries Corporation
Sukkur and Managing Director of SSIC who have provided me all kinds of facilities and
data from the Sukkur & Larkana estate areas.
I would also like to acknowledge Prof. Dr. Hakim Ali Kanasro for his insightful
contribution on the subject that has greatly enhanced my know ledge.
My exclusive thanks go to Prof. Dr. Jamil Ahmed Kazmi Chairman Department of
Geography at Karachi University for his noble ideas and tremendous help as well as
technical assistance in research w ork w hich is no parallel to others.
Mr Umair Bin Zamir Lecturer Department of Geography a1 Karachi University needs
appreciation for his sincere efforts which have supported to me in surfing internet and using
computer software.
I express my sincere gratitude to Prof. Shah Muhammad Luhrani. the Dean Faculty of
Commerce & Business Administration Shah Abdul Latif University Khairpur. Prof. Dr.
Sayed Qasim Ali Shah. Prof. Dr Ghulam Murtaza Mctlo, Chairman Departmant of
Commerce for their sincere cooperation and assistance during the research work.
1 am extremely thankful to Dr. Madad Ali Shah for his valuable suggestions on research
design and data analysis

I am also indebted to the staff of Libraries of University of Sindh. Shah Abdul luitif
University, Khairpur and State Bank of Pakistan for their help in finding the proper research
material.
I am also thankful to Mr. Nadeem Ahmed Kanasro for his help in compiling and printing of
this thesis.
I appreciate the services of Mr. Saeed Ahmed Junejo and Mr. Mansoor Ahmed Junejo my
sons for their sincerity and cooperation during the research and analysis of this study;
Last hut not least I shall be doing injustice to my wife if I do not place on record my
acknowledgement for her loving and caring attitude which has been a great source of
inspiration through the course of this study.
MUMTAZ ALI JUNEJO
Assistant Professor
Department of Comme rce
Shah Abdul Latif University,
Khairpur.


V
ABSTRACT
This empirical research analyzes the growth, efficiency, causes of sickness of small scale
industries, causes of emergence of entrepreneurs and competences of entrepreneurs at
Larkana and Sukkur estates area of Sindh province of Pakistan.
This study examines the educational background of the entrepreneurs of small scale
industries who were helm of affairs and their impact on the growth of sales of the year since
1990 to 2004, to analyze the growth, efficiency and economic impact on the Sindh
province. Two estates area of Sindh small industries corporation al 1 .arkana and Sukkur
were selected as case study. The samples were selected on the basis of economically
importance, homogeneous, localized, reasonably amenable to research and true
representatives of small firm's strength and weakness. The total sample of small firms was
85 from the both estate areas. This included 36 selected from the Larkana estate area and 49
from the Sukkur estate area. As per the definition of State Bank of Pakistan, less than 50%
firms are with the project cost up to the Rs. 20 million (inclusive of cost of land and
building).
Strong evidence emerges that owners of small industrial units arc family concern, having a
low educational background, lack of managerial knowledge and conservation-oriented
attitude results in underutilization of capacity and low growth of units established every
year.
This research w ork provides a survey of the theoretical and empirical literature to help to
promote the small scale industries in the Larkana and Sukkur regions.
This study indicates effective policy measures to promote the small scale industries
particularly in Larkana and Sukkur regions of Sindh and generally in Pakistan.
This research reveals that the majorir of owners of rice industries were using outdated
technology (Hu’lcr machine). The rate of broken rice was fifty percent So it can be
concluded that the rice of these industries were not feasible for sale in the international
markets. As a result the exporters of rice from India. Burma and Thailand have captured the
international markets.

VI
Thus it is clear that the owners of small scale industries in Larkana & Sukkur estate areas
are family concern with the centralized management structure. The one man show gives the
picture of a highly unprofessional management low emphasis on the professional
management system. And due to high sickness rate in the both estate areas the moral of the
investor is continuously declining.
In this research study, researcher has found the high co relationship between two variables
such as high education with sales.
This study has also found that, the growth rate of small and cottage industry' is 27.47 per
year in the Larkana estate area which is not satisfactory because the number of plots have
been not properly used by the Sindh small industries corporation Larkana (SSIC) since last
fourteen years. The average income of an individual employee is 55 thousands per year. It
proves that, in Larkana estate area there is high exploitation of labor indicating an inhuman
behavior of owners / managers of Larkana small scale industries with the permanent and
daily wages labors.
This research also includes the family occupation and last occupation of entrepreneurs in
the Larkana estate area. The business community is still dominant source of
entrepreneurship. For example. 50% people relate to the business community. 15% to
landlords of local area, 13% to industry with technical know ledge and 5% people from
professionals such as lawyers and Government servants who are swelling the ranks of
entrepreneurs.
This empirical research has also found the major causes of sickness include firstly the poor
managerial knowledge, secondly short fall of working capital, thirdly inadequate feasibility,
fourthly marketing problem and poor credit facilities, fifthly load shedding and sixthly tax
problem.
Phis research has revealed that the sheikh community dominates the small Industrial
business because they have invested Rs. 18.738 million which is much higher than the
investment of other communities like a Hindu. Bhutto. Abbasi. Mahesar, Brohi and Soomra.
This research has also analyzed the characteristics of small business ow ners (CSBO) for
the success of enterprise in the light of model of professor McClelland.
VII
CONTENTS
DESCRIPTION Pages
DECLARATION . I
CERTIFICATE II
ACKNOWLEDGEMENT III
ABSTRACT V
CONTENTS ' VII
LIST OF TABLES XI
LIST OF GRAPHS XIV
ABBREVIATION AND ACRONYMS XVI
CHAPTER - 1
Introduction
1.1 Introduction and Background 1
1.1.1 Phases of Industrial Development in the Historical Perspective1
1.1.2 Importance of Small Scale Industries in Pakistan 3
1.1.3 Pakistan Small Enterprise Scenario 5
1.2 Statement of the Problem 6
1.3 Research Objectives 9
1.4 Significance of Study 9
CHAPTER - 2
Research Methodology
2.1 Research Methodology 10
2.1.1 Sampling 10
2.1.2 The Growth Variables II
2.1.3 The Efficiency Variables 12
2.1.4 Factors Affecting Entrepreneurial Growth 12
2.1.4.1 Econom ic Factors 12
2.1.4.2 Non Economic Factors 12
2.1.5 Organizational Performance and Efficiency 13
2.1.6 Economic Performance of Firm 14
2.1.7 Primary Data Collection Method 15
2.1.8 Secondary Data Collection Method 15
2.1.9 Statistical Analysis 15
2.1.10 Hypothesis 16
2.1.11 Objective of the Study 16
2.1.12 Limitation of the Study 16


CHAPTER -3
Review of Literature
3.1 Introduction 17 3.2 Manufacturing SME Growth 20 3.3 Determinants of Efficiency among Small Industries 20 3.3.1 Education 22 3.3.2 Educational Specialization 22 3.3.3 Entrepreneurship and Economic Growth 22 3.3.4 Entrepreneurship and Enterprising Culture 23 3.3.5 Organizational Performance and Efficiency 23 3.3.6 Economic Performance of a Firm 25 3.4 Major Entrepreneurial Competencies 25 3.5 Individual Research Studies 27 3.6 Developing Competencies 29 3.7 Small is Beautiful 30 3.8 Historical Back Ground of Entrepreneurship 34 3.9 SMEs and Poverty Alleviation
CHAPTER-4
Impacts of Rice Industries on Economic Development of
Sindh
36
4.1 Introduction 40
4.2 The Production of Paddy in Sindh province of Pakistan 41 4.3 Status of Rice Milling units in Sindh 42 4.4 Rice Milling Operation 42 4.5 Post Harvest Losses 43 4.6 Export From Sindh 47 4.7 Problems and Measures 47 4.8 Harvesting and Threshing 48 4.8.1 Measures 49 4.8.2 Processing of Paddy 49 4.8.3 Measures 49 4.9 Issues of Rice Export 49 4.10 Seed 49 4.11 Recommendation 50 4.12 Conclusion
CHAPTER - 5 Role of Sindh Small Industries Corporation
for Expansion and Promotion of Industries in Sindh
50
5.1 Introduction 52 5.2 Annual Development Program of SSIC 53 5.3 Over All Industrial and Investment Scenario in the Sindh
province
54
5.4 Special Industrial Zones 55 5.5 Sugar Mills in Sindh 55 5.6 Cement Industries in Sindh 56 5.7 Self Employment Scheme by SSIC
VIII
56


IX
5.8 SSIC’s Sale Shop 5
9 5.9 Conclusion 5
9
CHAPTER - 6
Sindh Small Scale Industries Corporation Estate Area of Larkana
6.1 Introduction 60
6.2 Small Industries Estate Larkana 60 6.3 Materials and Methods 61 6.4 Analysis and Results of Larkana Estate .Area 62 6.5 Growth rate of established units of small scale industries 79 6.6 First Generation and Community-wise owners of small
industrial units at Larkana estate
79
6.7 Categories-wise results of small firms of Larkana estate
area as per model of McClelland
82
6.8 Economic Significance of Small Scale Industries Larkana
and Sukkur estate area
83
6.9 Regression Analysis of Small firms of uneducated
samples of Larkana
83
6.9.1 Result of regression analysis 84 6.9.2 Uneducated Samples of Small Firm 84 6.10 Result of Regression Analysis of Education of Small
Firms of Larkana
85
6.11 Hypothesis 88 6.12 Regression Analysis: Qualification versus respondents of
small firms on five points likert scale
98
6.13 Conclusion and Suggestions
CHAPTER-7 INDUSTRIAL ESTATE SUKKUR
102
7.1 Introduction 107
7.2 Materials and Methods 109 7.3 Position of sickness rate at Sukkur estate area 109 7.4 Growth of sales and profit of various small firms at
Sukkur estate area
III
7.5 Category-wise results of small firms as per model of
McClelland
120
7.6 Major causes of sickness in small industries at Sukkur
estate area
122
7.7 Family occupation and last occupation of entrepreneurs at
Sukkur estate area
123
7.8 Causes of Emergence of entrepreneurs at Sukkur estate
area
123 7.9 Growth Rate of Small Scale Industries at Sukkur estate
area
124 7.10 Regression Analysis of Uneducated Samples of Small
Firms
124 7.11 Analysis of variance 125 7.12 Results of Uneducated samples of Small firms 125 7.13 Results of regression analysis of educated samples of
small
126

firms
7.14 Results of regression analysis ofcducation versus respondents 131
and responses versus education
7.15 Conclusion and suggestions 136
CHAPTER - 8
DISCUSSION, CONCLUSION AND
RECOMMENDATION
8.1 Introduction 138
82 Educational background owners.'managers of Sukkur estate139
area
8.3 Organizational Structure of small Scale industries 139
8.4 Salary and Wages Structure 141
8.5 Strategy. Goals and Objectives 141
8.6 Problems and Obstacles 142
8.6.1 Internal Causes 144
8.6.2 Improper Project Feasibility 145
8.6.3 Lack of Managerial Knowledge 146
8.6.4 Poor Educational Background or Lack of Education 146
8.6.5 Out-dated Technology 146
8.6.6 Financial Problems 147
8.6.7 Poor Marketing Strategy 147
8.6.8 Lack of Motivational Factors 147
8.6.9 Traditional or Rigid Attitude 148
8.7 Discussion/Recommendations 149
8.7.1 Lack of Data on the Small Scale Industries in Pakistan 149
8.7.2 I^ck of Regulatory and Legislative Framework in Pakistan 150
8.7.3 Dire Need for Change 150
8.7.4 Lack of Financial Assistance 150
8.7.5 Inadequate Services Support in Various Fields 150
8.7.6 Marketing Problems 151
8.7.7 Low Credit Risk in the Small Industries 151
8.7.8 The Enterprising Behavior 151
8.7.9 Prior Training to the Entrepreneurs . 151
8.7.10 Creating the better linkages between small industries Federal, 152
Provincial and Chamber of Commerce
8.7.11 Problems of Export Oriented small scale industries 152
8.7.12 Poor social Infrastructure in Pakistan 152
8.7.13 Poor Infrastructure Facilit} 152
8.8 CONCLUSION S/RECOMMENDATIONS 152
REFERENCES / BIBLIOGRAPHY 157
APPENDICES - A to H 161-192

XI
LIST OF TABLES
Tabic Description Page
No . No
1.1 Percentage shares of manufacturing sectors in GDP of 4
Pakistan
4.1 Sowing and Transplanting Time 41
4.2 Time of Transplanting 42
4.3 Post Harvest Losses * 43
4.4 Rice Area, Production & Yield of Sindh and Pakistan 44
4.5 Physico-Chemical Characteristics of Rice Varieties 47
Developed by IRR1 Dokri
5.1 Sindh Small Industrial Estates 52
5.2 SSIC Sponsored Development Schemes during the Year 53
1995-96
5.3 SSIC Sponsored Development Schemes during the Year 53
1996-97
5.4 SSIC Sponsored on going Schemes during the Year 1996- 54
97
5.5 Large & Medium Industrial Estates 54
5.6 Sugar Mills in the Sindh Province 55
5.7 Loan Sanctioned by the SSIC under the Self Employment 57
Scheme
6.1 Classification of Rice Industries at Larkana Estate Area 62
6.2 Growth rate of Units established and Employment at 62
Larkana estate area.
6.3 Low' Type Rice Industry 69
6.4 Sales and profit position of a rice mill al Larkana estate 70
area.(Owner is Intermediate)
6.5 Sales and profit position of a rice mill at Larkana estate 71
area.(Ow ner of this rice mill is Graduate)
6.6 Sales and profit position of an owner of rice mill at 72
Larkana estate area.fThe Owner of this mill is M.A in Economics)High Type
Industry
6.7 Sales and Profit position of one owner of a Bakery, in the 74 estate area of Larkana
(The Ow ner of this Bakery is M.Sc.
in Geography)
6.8 Sales and Profit position of, one owner of a Bakery, in 75 the estate area of Larkana
Owner of this bakery is M.A.
Economics. Age 45
6.9 Sales and Profit position of, an ow ner of a Bakery, in the 75


Xll
estate area of Larkana (Owner of this baker is M.Sc.
Agriculture. Age 55ys)
6.10 Family occupation and last occupation of Entrepreneurs at 76 Larkana estate area
6.11 Causes of emergence of entrepreneurs at Larkana estate 77 area
6.12 Major causes of Sickness in small scale industries in 78
Larkana estate area
6.13 First Generation & Community wise Owners of Small 79 Industrial
Units at Larkana estate area
6.14 Respondents results on five points likert scale 81
6.15 Category -wise Results of small firms of 1 .arkana estate as 82
per formula of McClelland
6.16 Economic Significance of Larkana and Sukkur estate area 83
6.17 Case processing summary 98
6.18 Descriptive 99
6.19 Descriptive statistics 100
6.20 Correlations 101
6.21 Model Summan’ 101
6.22 ANOVA ' 102
6.23 Coefficients 102
7.1 The Salient features of Sukkur Estate area 107
7.2 Category-w ise Small and Cottage Industries at Sukkur 108
Estate
7.3 Position of Sickness at Sukkur Estate Area 109
7.4 Growth of sales and profit of five oil mills at Sukkur 111
estate area, the ow ners of these mills are Matriculate and Intermediate
7.5 Growth of sales and profit of oil mills owners who are 112 graduate at Sukkur estate
area. Total numbers of ow ners are five
7.6 Sales and profit growth of five flour mills at Sukkur estate 114 area. The owners of
these mills are Matriculate
7.7 Growth rate of sales and profit of one flour mill. The 115 owner of this mill is
uneducated. At Sukkur estate area
7.8 Growth rate of sales and profit of one flour mill. The 117
ow ner of this mill is M.A.LL.B. Sukkur estate area
7.9 Growth of sales and profit of Biscuit Industry at Sukkur 118
Industrial estate. The ow ner of this industry is uneducated
7.10 Category-wise Results of Small Firms as per Model of 120
McClelland of Sukkur Estate Area


XIII
7.11 Major causes of Sickness in small scale industries in
Sukkur estate area
122
7.12 Family occupation and last occupation of Entrepreneurs at
Sukkur estate area
123
7.13 Causes of emergence of entrepreneurs at Sukkur estate 123
area
7.14 Chi- Squire Tests 131
7.15 Responses Education Cross Tabulation 131 7.16 Test of Homogeneity of Variances 132
7.17 ANOVA 132 7.18 Correlations Education versus Responses 133
7.19 Correlations 134
7.20 Model Summary' 134
7.21 ANOVA (b) 134 7.22 Correlations Responses versus education 134
7.23 ANOVA 135 7.24 Coefficients (a) 135
7.25 Coefficient Correlations (a) 135
7.26 Model Summary 135
7.27 ANOVA 136 7.28 Coefficients 136
8.1 Educational Back ground of owners of Larkana Estate 138
area
8.2 Educational Back ground of owners of Sukkur Estate area 139
8.3 Definition of various Institutions of Small Scale Industry’ 149

XIV
LIST OF GRAPHS
Graph No Description Page No
1.1 Percentage Shares of Manufacturing Sector in GDP 5
4.1 Rice ?krea. Production losses in percent 44 4.2 Area in Million Hectors 45
4.3 Production in million Tons 45
4.4 Yield 46
4.5 Rice Area in Million Hectors 46
6.1 Growth rate of Employment in % 63
6.2 Sales of Low Type Rice Industry 64
6.3 Profit of Low Type Industry 69
6.4 Growth of Sales and Profit of Rice Mills 70 6.5 Growih of Sales and Profit of Rice Mills 71 6.6 Growth of Sales and Profit of Rice Mills 72
6.7 Growth of Sales and Profit 73
6.8 Growth of Sales and Profit 74
6.9 Growih of Sales and Profit 76
6.10 Entrepreneurs Emergence in % 77
6.11 Major Causes of Sickness in % 78 6.12 Histogram of the Residuals 85
6.13 Normal Profitability Plot of the Residuals 86
6.14 Residuals versus the fitted values 86 6.15 Residuals versus the order of Data 87
6.16 Summary of Q7 88
6.17 Summary of Q8 89
6.18 Summary of Q9 90
6.19 Summary' of Q10 91 6.20 Summary' of QI 3 92
6.21 Summary of QI 4 93 6.22 Summary of QI 5 94
6.23 Summary of QI 6 95
6.24 Response in Qualification 96
6.25 Histogram 97 6.26 Versus Fits 97
6.27 Normal Probability' Plot 98
7.1 Position of sickness at Sukkur estate area 110
7.2 Growth of sales and profit of five oil mills at Sukkur
estate area
112
7.3 Grow th of sales and profit of oil mills ow ners who
are graduate at Sukkur estate area five owners
113

XV
7.4 Sales and profit growth of five flour mills at Sukkur
estate area owners are matriculate
114
7.5 Growth rate of sales and profit of one flour mill.... 116 7.6 Growth rate of sales and profit of one flour mill MA 117 7.7 Growth rate of sales and profit of one biscuit
factor}’ uneducated
119
7.8 Causes of Sickness in % 122
7.9 Entrepreneurs emergence in % 124
7.10 Residuals versus order of the Data 127 7.11 Residuals versus the fitted values 127 7.12 Residuals versus the fitted values 128 7.13 Normal Probability plot of the residuals 128
7.14 Normal Probability plot of the residuals 129 7.15 Histogram of the Residuals 129 7.16 Histogram of the Residuals 130 7.17 Residuals versus the order of data 130 7.18 Means plots 132
7.19 Mean of Responses 133

XVI
ABBREVIATIONS / ACRONYMS
ADP Asian Development Bank
.APEC Asia Pacific Economic Corporation ASEAN Association of East-Asian Nations DFIs Direct Financial Investment EDI Entrepreneurship Development Institute of India GDP Gross Domestic Product GEM Global Entrepreneurship Monitor GPO Government of Pakistan ICTs Information and communication technologies ILO International Labor Organization ISO International Standard Organization Lakh Local Measurement: equal to one hundred thousands LMM Locally Manufacturing Machinery Scheme LSN Large Scale Manufacturing MOST Ministry of Science and Technology NPSL National Physical and Standards Laboratories NUST National University of Science and Technology NWFP North West Frontier Province PCBs Participating Commercial Banks PCSIR Pakistan Council for Scientific Industrial Research P1DC Production Industrial Development Corporation PIM Pakistan Institute of Management PITAC Pakistan Industrial Technical Assistance Centre R&D Research and Development SBA Small Business Administration of America SBP State Bank of Pakistan [ SEs Small Enterprises S1DO Small Industrial Development Organization Sis Small Industries SISIR Sindh Institute of Standard and Industrial Research SIZs Sindh Industrial Zones SMEDA Small And Medium Enterprises Development Authority SMEs Small Medium Enterprises SSIC Sindh Small Industries Corporation TEVTA Technical Training and Vocational Authority TQM Total Quality Management UNDP United Nations Development Program UNIDO United Nations International Development Organization US United States
WTO World Trade Organization __________________________

17
CHAPTER No.1
INTRODUCTION
1.1 Introduction and Background
At the inception of Pakistan in 1947. there were very few manufacturing establishments. It
was totally an agriculture-based economy . In 1949-50 the share of industrial sector in GDP
was around 8% with large contributing 2.2% and the small 5 8% comprising of cotton
ginning, rice husking, wheat milling. The surprising feature is that over the years the
contribution of the small sector has remained in the range of 5% to GDP. The situation of
Small Enterprises (SEs) is one of a rather loose integration within the mainstream of the
national economy. Many recent studies display the potential for expansion, numerous hurdles
thwart them. In Pakistan as in other countries the recognition is growing those small-scale
industries which are important for the development of the social and economic sectors.
However in spite of the growth of this awareness not much attention was paid to this sector.
Research has revealed that nothing contributes more to the flourishing of small enterprises
that favorable policy context (Thomason^ Thomas 1992). This is totally lacking in Pakistan
and reflects apathy to one of the most potential sectors of the economy.
1.1.1 Phases of Industrial Development in the Historical Perspective
Pakistan's comparative advantage was the skill its people had in mam fields of small and
cottage industry. Its people were famous for hand crafted products whether in metal or
woolen or cotton or wood. But this comparative advantage over time fritted away and was not
exploited or developed. There was no tradition of institution building. No guilds and
associations that would foster the skill and pass it on to the next generation. There were no
laws requiring the skill or recognition of skill, hence national industrial development
suffered.
18
The first five year plan did not meet with success. The real development that did take place
was during the second five year plan. After bifurcation of subcontinent. India enjoyed a lion
share in industrial sector. Where as. Pakistan left with few industries which not sufficient to
coup with the demand. Besides, influx of refugees' country faced multiple problems. The
private sector was shy and did not come forward at all. In 1952 formation of Pakistan
Industrial Development Corporation (PIDC) by the Government played a vital role. Almost
1041 industrial units were established in the country' including former East Pakistan (now
Bangladesh). This included fertilizer, chemical, medicine, textile/woolen. jute, cement, sugar,
paper, wood, ship building, heavy engineering, electrical engineering, steel mills, mineral
development, gas and Small Industrial Estates in all the provinces. During this period the
manufacturing sector registered a growth rate of 8%. In 1970 the experience of
Nationalization failed because of many reasons and subsequently privatization also failed
except like nationalization, privatization also took place without adequate home work. After
privatization large number of industrial units is lying closed. The industrial development has
been marred by low productivity and import substitution strategy. The trend had been
towards capital intensive and low on employment generation industry. The lessons of
nationalization compelled investors to avoid labor intensive projects and thus the rate of
unemployment increased and the economic situation worsened.
Pakistan’s economic development policies favored capital-intensive technology choices,
ignoring the fact it would create unemployment. Even the subsidized credits for small
enterprises stimulated more capital-intensive technologies. This situation is further
compounded by the fact that Pakistan ranks relatively low among other Asian countries in
such areas as per capital number of science and technology personnel and low on Research &
Development. This therefore does not create the small enterprise development environment.
Both for rural and urban production, appropriate technologies are needed which are labor
intensive, which use local resources it is in the background of such environment that SE. can
develop. Hence the need for small enterprise Development policy was imperative but totally
missing from a Thomas pp (1992). Considerable work was undertaken on SEs in the 1990s

19
by UNDP. W'hich allocated research projects on SEs and micro enterprises to UNIDO and
ILO. Similarly the institute of Social studies Advisory Services undertook World Bank
funded research for Bankers Equity. The donors coordination Group on promotion of the SEs
set up on 1993 organized a series of activities for SEs promotion. A series of measures were
undertake under the eighth five year plan (1993-98) to stimulate the growth of the SE sector
focusing on improving their productivity and enhancing product quality and standards
through training in vocational and technical skills and up-gradation of 2 technology and
modernization. The impetus to the SE sector came from this new focus, which culminated in
theGovernments decision to set up another small industries development organization (SIDO)
in October 1998 called SMEDA- small and medium enterprises development Authority . Yet
the bottom line is that there has been no policy initiative to support the growth of SEs. No
regulatory intervention to remove the retardants of SE growth. No law defining small
enterprises. And for 3 years the Government did not give official recognition to SMEDA nor
has SEP issued a license to the SME bank (December 2003).
1.1.2 Importance of Small -scale Industries in Pakistan
Small Industries (Sis) arc important part of a nation's economic and social structure and a key
to the equitable distribution of income. These enterprises are the nursery' for local
entrepreneurs and learning ground for workers to develop practical skills. Sis provides
myriads of support services to both large and medium Industries. Most important with the
advent of the last quarter of the 20lh century. Sis are also increasingly involved in the process
of internationalization.
In this era of fierce competition the development of core competencies is becoming
increasingly essential for survival networking has led to a higher reliance on small Industries.
Worldwide are now increasingly linked to a network of multi-dimensional support services
that arc essentially for Sis.
Small-scale industries play very important role in the economic development of any

20
developing or under-developed country. These industries meet the twin needs like solution of
unemployment problem and checking the economic concentration in the hands of a few.
These industries encourage self-sufficiency, self-reliance and coordination. They provide
beneficial re-allocation of available resources and their proper utilization. The traditional
village and cottage industries provide a vital means of livelihood to village artisans. These
industries create the scope of employment to the rural persons.
The small-scale industries however, contributed only 4.6 percent to GDP. While the share of
small-scale industries has increased to only 5.6 percent, the share of large scale industries
increased to 12.7 percent by the year 2004-05. The share of the manufacturing sector in GDP
has increased from 6.4 percent in 1949-50 to 183 percent in 2004-05.
Table-!.!: Percentage Shares of Manufacturing Sector in GDP
(per cent)
Year Total Large Scale Small Scale
1949-50 639 1.83 4.56
1959-60 9.90 5.67 423
1969-70 13.44 10.46 2.98
1979-80 14.50 10.55 3.95
1989-90 17.59 12.70 4.89
1999-2000 16.68 11.65 5.03
1999-2000 14.81 9.59 5.22
2000-01 15.90 10.45 5.45
2001-02 16.11 10.49 5.62
2002-03 16.42 10.73 5.69
2003-04 17.60 11.92 5.68
2004-05 1826 12.70 5.56
Source: 50 Years of Pakistan Volume I Summan. Pakistan Economic Survey, various
issues.

21
Graph 1.1 Percentage Shares of Manufacturing Sector in GDP
Pakistan is an economy comprising mainly of SMEs. The significance of their role is clearly
indicated by various statistics According to more resent estimates there are approximately 32
million business enterprises in Pakistan. Enterprises employing up to 99 persons constitute over
30% to the GDP. Rs. 140 billion to exports, and account for 25% of exports of manufactured
goods besides sharing 35% in manufacturing value added
However, there has been concern that in Pakistan the SME sector has not been able to realize its
full potential The SMEs continue to suffer from a number of weaknesses, which hamper their
ability to take full advantage of the opening of economy and the increasingly accessible world
markets. The areas of constraints are normally identified as labor, taxation, trade capacity,
finance and credit availability and management.
1.13 Pakistan's Small Enterprise Scenario
According to the Gallup Survey 2001, in Pakistan there are 2 million Small businesses having
the following breakup. Manufacturing units 400.000. services 600.000. Retailers 1.000.000 The
small manufacturing units employ 1.2 million employees, which is 70% of the labor force, but
if the Medium scale industries are added to this then the labor force employed in the SME
sector is 98% of all the labor There are only 5000 registered and identifiable large-scale
industries in the country. Small sector manufacturing contributes rupees 4.3 billion to the GNP
(value addition). This is the largest sector manufacturing contributes Rupees 4.3 billion to the

22
GNP (value addition). This is the largest sector of the economy that has received the least
support and attention as well as unfavorable policy support in the past.
According to a recent survey there has been low growth in the small business sector. Besides,
low value-added products and the technology in use is mostly the traditional technology which
has not had much up-gradation since the last 2 or3 decades. Yet the majority of this labor force
is unskilled and uneducated.
1.2 Statement of the problems
Most of the small Industries (Sis) are normally production-oriented setups operated by owner
managers w ith limited marketing, financial capabilities and managerial skill. The SSI
strengths are their flexibility, quick response at time and willingness to take small orders
However, their performance is flawed by multiple handicaps e.g. lack of guidance in
marketing, management, trends in international markets and lack of access to technology.
Most of the Sindh SSls are merely production houses with products that are produced based on
locally availability of raw material, labor, etc. hence they lack the vision to combat their full
international competitors.
According to banking council report (June 1995-96) 3785 Small Scale Industries were closed
in Pakistan, out of these 1296 Small Scale Industries were closed in Sindh. The owners of all
these closed units became the defaulters of various banks and financial institutions total
amounting Rs. 240.29 Billion.
According to another report of Development Statistics of Sindh 1998. During the year 1990
91, the total established units of Small Scale Industries were 1751, but in
1991- 92 56 unites became sick in one year
Pakistan National human Development Report 2OC3, UNDP has highlighted constraints to
the rapid growth of Small-Scale enterprises in Smail tow ns of Pakistan. Follow ing are major
constraints.

23
• Lack of managerial knowledge and inability to achieve quality control.
• lutck of capital for investment and absence of credit facilities.
• A well-planned strategy to develop exports of Sis docs not exist. The objectives arc
often not well defined and available policy instruments for industry and trade arc
mostly not aimed at developing the SI sector and its exports.
• Where support for SSIs is a stated objective, there is no implementation mechanism.
• The environment is often not conducive to the creation and growth of marketing
channels for SSIs export development companies, joint-marketing arrangements, export
consortia etc.
• There is an inadequate focus on issues of concern and relevance to Sis and a lack of
appreciation of the spec ial features and difficulties of SSIs in their reports.
• Many service institutions do not have well defined programs with clear objectives for
associations are inapt and incapable of advice and counseling to Small Enterprises in
export development.
• Training Facilities in Managem-nt, Marketing and Export Management arc often not
available to the entrepreneurs.
This is an era of New Entrepreneurial Economy and the Know ledge Based Economy
where the organizations arc “Network orientated”, where the structures are inter dependent,
where the workforce is diverse. where focus is on customer, and where the resource is
information (knowledge not capital). Therefore there is growing awareness as how to
prepare our new generation to cope with the new environment of competition, uncertainty
and innovation. (This brings us to the central theme ' ntrepreneurshm Education).


$
According io George Allen & Unwin (1972-73) that the main causes of poor performance
and declining conditions of small firms have serious problems of managerial knots ledge that
is why the most of small units hat e poor growth and profitability.
The men behind the battle field is perhaps most important which works for the success of a
business venture. Quite often, it happens that there is a likely hood of disputes with promoters
and the subsequent inability to run the enterprises. A complex business situation required
dynamic leadership coupled with sharp business acumen on the part of the leader of the
enterprise. It is generally believed that in small industries the strength of dynamic leadership
appears to be very weak. The unsuccessful entrepreneurs often tend to lose confidence, and
thus results in low moral in dealing with employees in the organization and customers and
other parties. Better qualified and successful professional managers would improve this kind
of situation. (TS Ready & L.V Ready. First edition. 1988.). Sickness of small industry is a
manifestation of several maladies in the working of the units. The causes of which
contributes to sickness are generally related to production, marketing, finance management
business management and environmental factors. In the last few decades. Japan has achieved
a remarkable rate of industrial development along with extra ordinary strong degree of
international competitiveness in small industrial sector. The based factors contributing to this
remarkable achievement are “Japanese- sty le management". Small business has been turn of
the twentieth century Small businesses in Japan have played a multidimensional role.


9
13 Research Objectives
• To find out the causes of sickness of small scale industries in the Larkana and
Sukkur estate area.
• To find out the causes of emergence of entrepreneurs in the Larkana and Sukkur
estate area,
• To analyze the competencies of the entrepreneurs in terms of various required
traits to be a successful entrepreneur.
• To analyze the educational backgrounds of the entrepreneurs and its impact on
the success of the business.
• To analyze the growth of sales and profit of small scale industries in Larkana and
Sukkur estate area as a case study.
• To identify the organizational structure, goals and strategy of small scale
industries in the Larkana and Sukkur estate area.
• To identify the main problems and obstacles in small scale industries.
• To analyze the growth of establishments of the units per year in the both estate
areas.
1.4 Significance of Study
This research reveals the Growth of Employ ment and Units Established per year in both
Estates and the growth of Sales and Profit per year. This research demonstrates the real
causes of sickness, last occupation of the entrepreneurs, causes of emergence of
entrepreneurs, growth rate of small scale industries in Larkana and Sukkur estate areas, per
capita of an individual employee, emergence of community' w ise owners of small scale
industries, necessity based and opportunity based entrepreneurship and this study has also
found the relationship between two variable such as Education and Sales
This study is beneficial for the entrepreneurs of the both estate areas of Sindh Small
Industries Corporations Larkana and Sukkur. Academicians. Research Scholars.

10
Government institutions like Chamber of Commerce and industries. Directorate of Sindh
SmaL industries Corporations, Ministry of Commerce & Industries and SMEDA.
CHAPTER NO.2
RESEARCH METHODOLOGY
2.1 Research Methodology
This research stud) is based on descriptive, quantitative and qualitative methods. The focus
is concentrated on the various variables and asked the relevant questions from the owners of
small scale industries located in estate area of Sindh small industries corporation at Larkana
and Sukkur. in order to increase the value of research, qualitative methods along with
quantitative techniques have been used to interpret the results. Descriptive research seeks ’o
determine the answer to. 'who', ‘what’, ‘when’, ‘where’, and how questions (Zikmund
William G. I986.p.36) states a phenomenon or a situation as it actually exits and it describe
Characteristics of Small Industrial Owners (CSIO) in terms of education and managerial
know ledge.
It is a proposition that due to lack of high educational base and managerial knowledge, the
most of owners managers are gening the poor results in terms of sales profit and
employment. Keeping in it view researcher has investigated the real causes of low growth of
small scale industries in Larkana and Sukkur estate area through the field study and
comprehensive questionnaire. Actuallv these two estate areas have been selected for the
purpose of acquiring the first hand information and find out the real causes of sickness in
small scale industries of Sindh.
2.1.1 Sampling
The samples were selected on the basis of economically important homogeneous, localized,
reasonably amenable to research and also representative of small firms' weaknesses and

11
strength. The samples of Small-Scale industries have been selected according to the
definition of State Bank of Pakistan.
Small-Scale Industry : Less than 50 persons with project cost (inciusne o’’;cst
of landi g and building) Rupee* 20 million.
Larkana Estate Area:
1. Rice Mills W
2. Food Industries 06
Total Small Industries 36
Sukkur Estate Area:
1. Oil mills 14
2. Flour mills II
3. Biscuit Industries 10
4. Food Industries 10
5. Dall Industries w
Total industries 49
The main emphasis of this research is on the abilities of the existing entrepreneurs in the
context of the educational background, managerial know ledge, growth of sales per scar,
growth of profit per sear and growth of employment per sear, emergence of entrepreneurs
and real causes of sickness in both estate areas.
2.1.2 The Growth Variables:
Growth is an important issue concerning small scale sector's role in economic development.
This research studs investigates the growth of different industrial units in terms of sales,
profit and employment. Actually, these are the variables determinants through which rate of
growth of each small industrial unit can be measured over period of the study i-c. 1990-
2004. which are located at estate area of Sindh Small Industries Corporation at Sukkur and
Larkana.
To analyze the strategic performance, these determinants help to evaluate the efficiency of
owner president manager of each unit in the perspective of what strategies they had made to
12
accelerate the pace of growth of sales and profit in the last fourteen y ear.
In this regard, a comprehensive questionnaire has been given to ask some pertinent questions
from the leaders of small scale industries, which are situated at the larkana ^nd Sukkur estate
area. Questionnaire is available in appendtx-ABCDE
a -..dcrsar.dtng of the factors that limit the rate of firm's growth is valuable for - inageme.it
scholars (Mahoney and Pandean 1992). Firm growth rates are important theories that explain
firm's efficiency of understanding, market power, profitability
I survival (Slater. 1980). Given the importance of understanding growth, which has
been an issue since Penrose's (1959) seminal contribution; organizational researchers have
examined the managerial limits to firm growth.
The growth of Small Scale Industries has been divided into four categories, which arc given
below:
1- Growth rate of sales and profit
2- Growth rale of employment
3- Growth of export per year
4- Growth rate of establishing units
2.13 The Efficiency Variables
The main proposition is that the most of managers owners are not true entrepreneurs
because they do not possess the required abilities of dynamic entrepreneurship which are
universally recognized trails i.e. managerial knowledge, better educational back ground,
mental ability, human relationship ability, communication skills, decision making ability
and conceptual ability. {Peter Drucker (1991)).
The efficiency of Small Scale Industries has been divided into four categories, which arc

13
given below:
1. High Educational background
2. Managerial know ledge
3. Latest Technology
4. High growth rate of sales and profit
1.1.4 Factors Affecting Entrepreneurial Growth
2.1.4.1 Economic Factors
1- Capital
2- Labor
3- Raw Material
4- Market
2.1.43 Non Economic Factors
1- Social
2- Psychological
3- Government
4- Law in orders situation
1.1.1 Organizational Performance and Efficiency
Organizational researchers have offered a variety of models for examining organizational
performance of efficiency , yet there is little consensus, as to what constitutes a valid set
criteria. Cameron. 1981; Levin and Minton. 1986). Thus, these have suggested that studies
of Organizational performance should include multiple criteria, (Cameron. 1986. Hit. 1988).
Efficiency and effectiveness are performance domains that have been clearly distinguished.
Efficiency refers to an input output ratio or comparison, where as effectiveness referees to an
absolute level of either input acquisition or output attainment (Penning and Good man
14
1977). The best performing organizations are both; effective and efficient (Katz and Kahn.
1978).
Organization operates in multiple domains / characteristics and may perform well (Cameron,
1978).
Some eminent research scholars have different domains/ characteristics for effective and
efficient leadership of the firms. Such as Gupta (1988), resting on the argument that, they
represent key proxies for executive leaderships such as. cognitive orientation and managerial
is the important factors for strategic decision making. Characteristics of leadership and
differences among them have emerged as topics of considerable interest in both the
academic and popular business literature on executive leadership.
The focus on top level leadership stem from the assumption that, given their formal and
symbolic power, have significant impact on both organizational activities and performance
(Finkelstein. 1988).
Although past research has extensively examined the relationship between organizational
factors and leadership domains (c.g. Dalton and Kcsncr, 1983). Datta and Guthrie. 1994;
Schwartz and Menon. 1985), little attention has been paid to the environmental and industry
context with which executive leaders operate.
Hence, question is that domains are required for effective and efficient leadership and how
these characteristics have relationship with performance?
Salancik, 1978; Thompson. (1967) suggest that examination of industry level influence on
managerial characteristics can be meaningful in the context of such key dimensions of
industry structure as degree of concentration, capital intensity , product differentiability,
growth rates and demand instability .
The ability of an organization to anticipate and respond to opportunities of pressure for
change, both internal and external is one the most important ways in which its
competitiveness and validity can be ensured.

15
The nature and objectives of organizational responses vary in part with how top management
triggers and interprets strategy issue (Dullon and Duncan, 1987; Kiester and Sproull, 1982
the performance of the business enterprise can be measured by the amount of profit
There is an opinion by T.K Galbraith that the objectives of the business enterprise are only a
consensus made up as the result of the negotiation among interests groups, such as
shareholders, bankers, employees, state, and the community participate in the business
enterprise for its betterment
2.1.6 Economic Performance of Firm
Anderson presents time series data from developing countries Columbia. India. Philippines
and Turkey all of which he classifieds on the basic of the share of manufacturing employment
in establishments of 5-49 or 5-99 workers. Only in Columbia the level employment in small
Industries was not raising rapidly. (Anderson's data on Columbia for 1953- 73).
Hoselitz had earlier noted that in contrast to Germany. Japan showed "the rather unusual
factor of smaller plants growing faster than large ones in a period of prosperity.".
Staley and Morass also commented that the repaid growth of small scale industry can lead
tow ard faster economic development of a country.
To evaluate the economic impact of the small scale industries, researcher has measured total
out put economy (commonly referred to as the economic efficacy of the firm) on income
distribution, and on the other determinates of welfare: such as the stability of family income
and development.
2.1.7 Primary data collection method
The primary data has been collected through the comprehensive questionnaire, interviews
and formal and informal discussions with owners managers of small scale industries.
Researcher has also discussed w ith the owners of sick units regarding the real causes of
sickness in small scale industries at Larkana and Sukkur estate area. Researcher met w ith

16
the officials of Sindh small industries corporation of Larkana and Sukkur and with
representatives of chamber of commerce and industries of both districts.
2.1.8 Secondary data collection method
The secondary data has been collected from the various scattered sources like national and
international magazines. journals and publications of various institutions like World Bank.
Asian development bank, books published by ministry of industry, commerce and trade and
the head office of Sindh small industrial corporation at Karachi, and branches of SSIC
Larkana and Sukkur. Economic Review of Pakistan from 1990 to 2004. various Reports of
State Bank of Pakistan and SMEDA.
2.1.9 Statistical Analysis
Multiple regressions provide a means of objectively assessing the degree and character of
the relationship between dependant and independent variables (Hair. Anderson. Tatham &
Black 199$).
We have used regression model as the best suitable statistical techniques for analysis of data
and interpretation of results. We have also used graphical techniques to examine the slope of
distribution, and scatter plot to find out the relationship between two Variables.

17
2.1.10 Hypotheses
1- Null Those owners managers who are highly educated their performance of the units
in terms of sales is increasing (positive)
2- Alternate. Those owners managers who are low educated or uneducated their
performance of the units in terms of sales is decreasing (Negative)
1. Null Those owners / managers who have managerial know ledge are true
entrepreneurs (Positive)
2. Alternate, Those owners / managers who lack managerial knowledge are workers
(Negative)
2.1.11 Objectives of the study
• To analyze the efficiency of existing owners, managers in terms of managerial
knowledge and educational background.
• To analyze the growth of sales and profit of small scale industry in two estate areas of
SSIC at Larkana and Sukkur as a case study.
• To identify the organizational structure design of small scale industry .
• To identify the strategy , goals and objectives of small scale industry.
• To identify the main problems and obstacles in small scale industry
• To identify the main causes of sickness in small scale industry through case study
analysis.
2.1.12 Limitation of the study
The study is limited to the small scale industries and does not include the area of cottage
industries due to time constraints.

18
CHAPTER N0.3
REVIEW OF LITERATURE
3.1 Introduction
This chapter explains the comprehensive review of the previous research work that has
been carried by the various research scholars on the growth and efficiency of small scale
industry and its impact on the economic development, causes of sickness and
competencies of the entrepreneurs. The theoretical and empirical literature of the world is
reviewed on the characteristics/traits which are required to be a successful entrepreneur.
Entrepreneur factors input are directly related to firm longevity , but input levels are
frequently linked to each other as well. Specifically highly educated owners employing
larger financial capital inputs are more likely to create viable, lasting firms than poorly
educated owners whose financial capital inputs arc less bountiful. (Timothy Bates 1990)
Economics to date have performed few empirical or theoretical studies of
entrepreneurship but sociologist and psychologist have dominated the field.(Brock and
Evans 1986). On the theoretical side of economics however, several recent articles on
entrepreneurship have produced a risk crop of hypotheses about small business behavior.
A model by Lucas (1978) suggested that persons having relatively more entrepreneurial
ability became entrepreneurs while those possessing relatively less became worker.
A more realistic model developed by Jovanovic (1982) assumes that uncertainty
characterizes the managerial ability factor at the point of small business startup those who
enter self- employment gradually learn about their managerial abilities by engaging in the
actual running of a business and observing how well they do. The essence of the turmoil
that typifies recently entered small business; other branches of social sciences have
addressed the question; who are the likely survivors of the sorting out process? Dougllas
(1976) finds that those entrepreneurs who educated arc survivals. Other studies emphasize
less tangible elements of entrepreneurial success (Shapiro 1975)
An article by Zaeira (1987) demonstrates theoretically that the exact levels of profits at
larger amounts of capital can be discovered only by actual increasing the quantity'
19
of capital. Zcira's model is particularly applicable to the small business startup whose owner it
unaw are of his/her managerial abilities.
The recent revival of the term Small and Medium Enterprises (SME.*) have captured the
attention of researchers towards the study of Governments and World Banks policies and their
implementations and more specific on outcome of those implementations. The use of the
measures like Total Quality Management and quality certifications in the SMEs and their
difficulties and flaws are studied.
The World Bank, in common with other international donors, asserts that a vibrant private
sector • with firms making investmenu, improving productivity and creating jobs - promotes
economics growth and increases opportunities for poor people. Specifically , entrepreneurship
is seen as one of the most important drivers of local economic development Thal is why. all
over the world, govemmcnu are extolling the virtues of stimulating and supporting a healthy
small business sector. The vitality of the small firms sector makes a considerable impact on
local competitiveness In developed countries, small and medium-sized enterprises (SMEs)
typically account for 99% or more of all firms; in developing countries it is more difficult to
tell, because the statistics are unreliable or simply not available. They typically provide around
50% of productive employment (UK: 45%, EU: 66%. Japan: 72%. developing countries: 50-
70%) and over 50% of private sector turnover. SMEs are flexible, innovative and responsive.
They tend to hemore productive. They are a crucial part of the supply chain • providing
materials, sub-assemblies and services to larger businesses and distributing goods to
customers. And as economies increasingly come to rely on 'knowledge workers', and large
firms increasingly 'stick to the knitting' rather than pursue vertical integration, then small firms
are likely to become more important. Economies with a high proportion of SMEs will be more
resilient to external shocks and will be more likely to have more firms, which grow into larger
businesses. Furthermore, stimulating the creation of more SMEs enables developing nations to
grow a solid middle class.

20
The World Bank reports (1990-2004) an effort to support their small business sectors,
governments around the world have implemented wide-ranging reforms; including macro-
stabilization programs, price liberalization, and privatization and trade-barrier reductions
However, the World Bank observes that, in some countries. SMEs have not made the
difference that might have been expected. Entrepreneurial activity remains limited, poverty
high and growth stagnant Where SMEs have performed well they have been highly beneficial
and provided the stability and growth
Certainly, development partners see supporting SMEs as an important part of their work and
believe that assisting more firms to start and grow has an impact on economic growth and on
poverty reduction The Commission for Africa stresses that growth will drive down poverty
more rapidly if poor people are better able to participate in society and the economy. They
suggest that poverty reduction through growth requires a focus on indigenous private
businesses.
Besides the ubiquitous criticisms of these initiatives based on the prohibitive costs of
implementation increased bureaucracy and complexity, and managerial confusion over the
different methods, there is little evidence to support their pecuniary rewards to SMEs
(Husband i Mandal. 1999)
Internationally, empirical research into the rate and success of implementation of these
initiatives in SMEs is largely considered to be inadequate (eg Ramsey 1998; Kuratko.
Goodale & Hornsby. 2001). Literature tn this area is more often conceptual than empirical,
and where empirical, it sometimes suffers from methodological limitations (such as unclear or
inconsistent definitions of SMEs. Due to limited research available, it appears that SMEs have
been very slow to implement formal quality models, and where they have, the outcomes are
inconclusive (Husband & Mandal. 1999). For example. Chittenden. Poutziouris& Mukhtar
(1998. p. 85) found that only a “liny minority ” of small firms in the L'K had registered for

21
ISO 9000. but the “great majority” of these found that the benefits of doing so exceeded the
costs. Reported benefits included marketing and competitive advantage, and to a lesser extent
improved internal operating efficiencies. On the other hand. Tcrziovski. Samson & Dow
(1997) surveyed over 900 manufacturing firms in Australia and New Zealand and found that
“ISO 9000 certification is not shown to have a significantly positive effect on organizational
performance” (p. 1). and that the rate of quality system adoption was lower in smaller firms
than in larger ones. Research pointing to the effectiveness (or otherwise) of quality initiatives
in SMEs is important to the continued development and competitiveness of small business.

22
3.2 Manufacturing SME Growth
In McMahon's (2001) research, exploratory cluster analysis was used with key enterprise
age, size and growth variables to discover if there appear to be any stable development
pathways evident in a Business Longitudinal Study (BLS) panel of data. Each of four annual
data collections for the longitudinal panel of manufacturing SMEs was separately examined
using cluster analysis. Comparisons were then made of cluster analysis outcomes over time.
Three relatively stable SME development pathways were discernible in the longitudinal
panel results-low, moderate and high growth The low growth development pathway appears
to account for approximately 70% of SMEs in the panel. The moderate growth pathway
seems to be followed by roughly 25% of the panel. And around 5% of the panel look to lie
on the high growth pathway , which is in accord with the observed rarity of substantial
growth amongst SMEs world-wide (McMahon. Holmes, Hutchinson &Forsaith. 1993).
Differences between the identified SME development pathway's in terms of enterprise age,
size and growth variables are highly significant in a statistical sense, thus underpinning
confidence in the development taxonomy.
It would appear that the development pathways and the pace of SME development in the
McMahon (2001) study match well with those in earlier research of a similar nature
undertaken by Hanks. Watson. Jansen & Chandler (1993). Both development models lead
towards the same range of SME configurations that are widely recognized in the relevant
research literature (McMahon, et al. 1993):
• Traditional SMEs following the low growth development pathway generally have few, if
any. growth aspirations. They principally exist to provide their owner- managers with a
source of employ ment and income, and are frequently operated in a manner consistent with
the lifesty le aspirations of their ow ner-managers.
23
3.3 Determinants of Efficiency among Small Industries
Many debates have centered on the adequacy of entrepreneurship.
Kilby 1981, for example, argued that the basic obstacle to the development of modem small
and medium scale manufacturing firms (which he said was a prerequisite for said and
enduring industrialization in Nigeria) was entrepreneurial deficiencies. Many observers have
also drawn attention to the enterprising nature of small business men in diverse part of the
developing w orld.
Anderson recently contained against cither extreme view, citing evidence to show that there are
indeed many potential entrepreneurs but that low levels of efficiency and endemic problems
such as the lack of modem bookkeeping practices may present good number of them from
realizing their potential. It is not easy to generalize about good management practices in the
every bookkeeping and ether should, some small firms probably should have double entry
bookkeeping and others should not
Perhaps the most time honored observation about the small entrepreneur in manufacturing is
that this pivotal figure is often very good at pan of the job the technological side is most
frequently cited (but deficient in some other area such as. management and marketing).
Rapidly rising levels of education in developing countries prompt an other question w hether
and how education contributes to entrepreneurial skills and performance. It is frequently argued,
and there is at least scattered evidence to support the view, that education helps individuals*
asses and gain new technological developments. It may also help entrepreneurs raise their
management, marketing, personnel relations and other relevant skills to perform the job more
effectively and efficiently. As a top leader of a firm, certainly he engages in the strategic
decision making process each managers perceptions and interpretations will reflect his or her
own “cognitive base”. Various research have defined a cognitive base as assumptions about the
future events, knowledge of alternatives, and the consequences attached to alternatives

24
(Hambricle and Mason.1984; Mach and Simon, 1958). It is crystal clear that Cognitive ability is
playing very crucial role especially in decision making process, because individual cognitive
ability base can develop from better education, training and experiences (Cy en and March.
1963). Actually there are the required domains: at least one should posses as a top leader of a
firm especially in this competitive w orld.
25
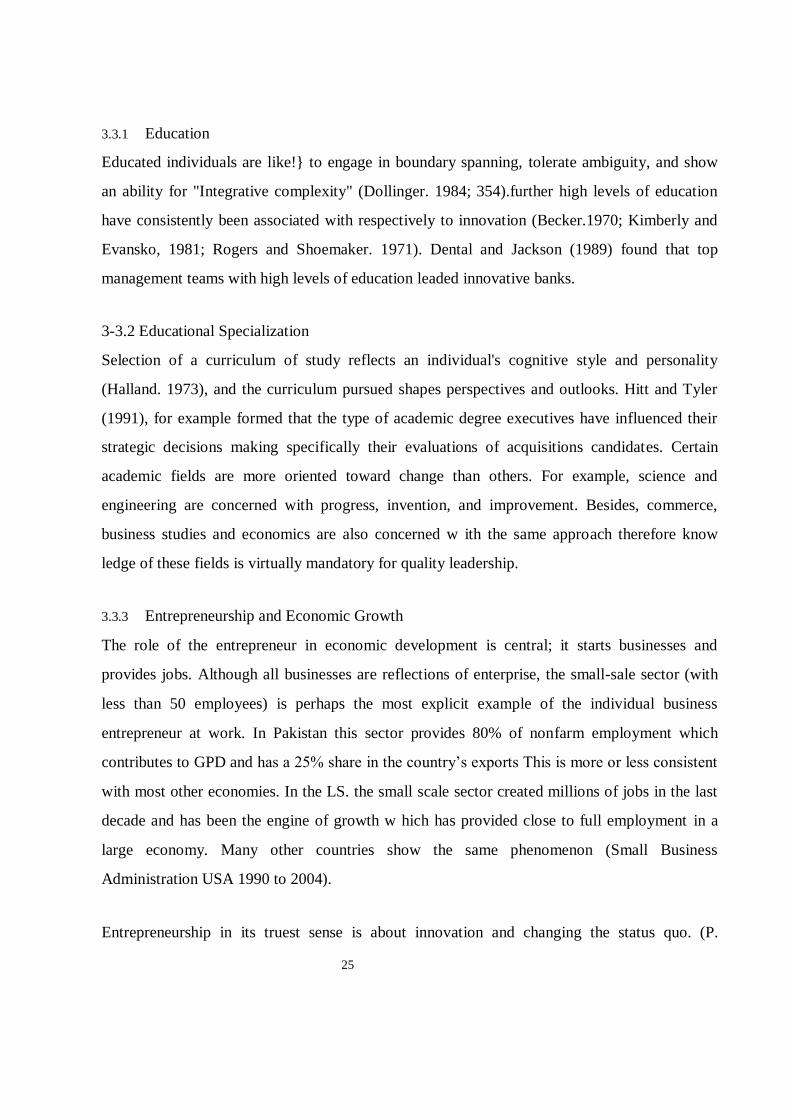
3.3.1 Education
Educated individuals are like!} to engage in boundary spanning, tolerate ambiguity, and show
an ability for "Integrative complexity" (Dollinger. 1984; 354).further high levels of education
have consistently been associated with respectively to innovation (Becker.1970; Kimberly and
Evansko, 1981; Rogers and Shoemaker. 1971). Dental and Jackson (1989) found that top
management teams with high levels of education leaded innovative banks.
3-3.2 Educational Specialization
Selection of a curriculum of study reflects an individual's cognitive style and personality
(Halland. 1973), and the curriculum pursued shapes perspectives and outlooks. Hitt and Tyler
(1991), for example formed that the type of academic degree executives have influenced their
strategic decisions making specifically their evaluations of acquisitions candidates. Certain
academic fields are more oriented toward change than others. For example, science and
engineering are concerned with progress, invention, and improvement. Besides, commerce,
business studies and economics are also concerned w ith the same approach therefore know
ledge of these fields is virtually mandatory for quality leadership.
3.3.3 Entrepreneurship and Economic Growth
The role of the entrepreneur in economic development is central; it starts businesses and
provides jobs. Although all businesses are reflections of enterprise, the small-sale sector (with
less than 50 employees) is perhaps the most explicit example of the individual business
entrepreneur at work. In Pakistan this sector provides 80% of nonfarm employment which
contributes to GPD and has a 25% share in the country’s exports This is more or less consistent
with most other economies. In the LS. the small scale sector created millions of jobs in the last
decade and has been the engine of growth w hich has provided close to full employment in a
large economy. Many other countries show the same phenomenon (Small Business
Administration USA 1990 to 2004).
Entrepreneurship in its truest sense is about innovation and changing the status quo. (P.

26
Drucker, j. Schumpeter). This is. perhaps, at the core of economic transformations, the internet
revolution, the know ledge-based organization and so on.

27
In the case of Pakistan, the green revolution in agriculture, the industrialization of the •60s and
the development of the textile industry in the ‘80s and ‘90s are some of the examples of
transformative entrepreneurial activity.
33.4. Entrepreneurship and enterprising culture
Allan Gibbs defends an enterprising culture as one which is characterized by “a set of attributes,
values and belief operating w ithin a particular community or environment that leads to
‘enterprising' behavior." Some of these traits exist and some have to be inculcated through
education. Some societies are known to have these traits. ‘‘Therefore there has been much
academic debate about whether the attributes can be developed in an individual or are the
products of genetics. The weight of opinion supports the notion that they can be influenced
considerably" says Allan Gibbs. He goes on to say “Education underpins culture. The lesson
from this is that entrepreneurship education is for everyone, not just the small business
entrepreneur." Talking about educational and managerial context he say 's "that
entrepreneurship is embodied in sets of values and beliefs relating to ways of doing seeming
and communication things." Therefore his logic is that we should learn from our environment
and adopt the value system or adopt a behavior, which is admired by the society The attributes
that are admired are what we adopt, and we tend to lode for those peoples who have these
attributes. And people who are projected as heroes are looked upon as being our heroes because
we recognize these attributes and behavior in them. They become our role models.
33.5. Organizational Performance and Efficiency
Organizational researchers have offered a variety of models for examining organizational
performance or efficiency, yet there is little consensus, as to what constitutes a valid set of
criteria. Cameron. 1981; Lewin and Minton, 1986). They have suggested that studies of
organizational performance should include multiple criteria. (Cameron. 1986. Hitt. 1988).

28
Efficiency and effectiveness are performance domains that have been clearly distinguished.
Efficiency refers to an input output ratio or comparison, whereas effectiveness referees to an
absolute level of either input acquisition or out come

29
attainment (Pennings and Good man. The best performing organizations are both, effective and
efficient (Katz and Kahn 1978),
Organizations operate in multiple domains characteristics and may perform well (Cameron.
1978).
Some eminent research scholars have different domains ' characteristics for effective and
efficient leadership of the firms. Such as. (Gupta. 1988). resting on the argument that, they
represent key proxies for executive leaderships such as. cognitive orientation and managerial
skills are the important factors for strategic decision making.
Characteristics of leadership and differences among them have emerged as topics of
considerable interest in both the academic and popular business literature on executive
leadership.
The focus on top lev el leadership stems from the assumptions that, given their formal and
symbolic power, have significant impact on both organizational activities and performance
(Finkelstein. 1988).
Although past research has extensively examined the relationship between organizational
factors and leadership domains (e.g Dalton and Kenser. 1983), Datta and Guthrie. 1994;
Schwartz and Menon. 1985), little attention has been paid to the environmental and industry
context with in which executive leaders operate. Hence, question is that domains are required
for effective and efficient leadership and how these characteristics have relationship with
performance?
Salancik, 1978; Thompson. 1967) suggest that examination of industry level influence on
managerial characteristics can be meaningful in the context of such key dimensions of industry
structure as degree of concentration. capital intensity , product differentiability, growth rates and
demand instability .

30
Ihe ability of an organization to anticipate and respond to opportunities or pressure for change,
both internal and external is one of the most important ways by which its competitiveness and
validity can be ensured.

31
The nature and objectives of organizational responses vary in part with how top management
triggers and interprets strategy issues (Dullon and Duncan. 1987; Kiesler and Sproull. 1982).
There is an opinion by T.K Galbraith, which the objectives of the business enterprise are only
a consensus made up as the result of the negotiation among interests group, such as
shareholders, bankers, employees, state, and the community should participate in the business
enterprise for its betterment.
3.3.6 Economic performance of a firm
Anderson presents time series data from developing countries like Columbia. India.
Philippines and Turkey all of which he classifieds on the basis of the share of manufacturing
employment in small industries not rising rapidly.
(Anderson’s data on Colombia were for 1953-73).
Hoselitz had earlier noted that, in contrast to Germany, Japan showed “the rather unusual
factor of smaller plants growing faster than large ones in a period of prosperity."
Staly and Moras also commented that, the rapid growth of small scale industry can lead
toward faster economic development of a country.
3.4 Major Entrepreneurial Competencies
However, there prevails a controversy on what it takes to be a successful entrepreneur.
Earlier, people used to believe that entrepreneurs are bom. not made. In other words, persons
with business family background could become successful entrepreneurs. Subsequently, the
sharpened knowledge of entrepreneurial competencies over the last four decades made people
to believe that entrepreneurs arc made, not bom. According to this view, persons possessing
proper knowledge and skill acquired through education and experience can become successful
entrepreneurs. In view of above controversy in order to understand clearly what it takes to be a

32
successful entrepreneur, research institutions and behavioral scientists, through their research
studies, have tried to resolve the controversy on what makes a successful entrepreneur. Here,
we arc presenting the findings of the representative institutional and individual research
studies on entrepreneurial competencies.
Entrepreneurship Development Institute of India (EDI), Ahmedabad conducted a research
study to identify what makes an entrepreneur successful. The study was conducted under the
guidance of Professor David C. McClelland, a well known behavioral scientist in three
countries—India. Malawi and Ecuador. The outcome of the study has been identification of a
set of entrepreneurial competencies or characteristics that result in superior performance. The
major finding of the study w as that the possession of competencies is necessary for superior
performance. This was cross culturally valid.
Follow ing is a list of major competencies identified by the study that lead to superior
performance of the entrepreneurs
1. Initiative: It is entrepreneur w ho initiates a business activity.
2. looking for Opportunities: He looks for an opportunity and takes appropriate actions as
and when it arises.
3. Persistence: He follows the Japanese proverb “Fall seven times; stand up eight". He
makes repeated efforts to overcome obstacles that get in the way of researching goals.
4. Information Seeker: Takes individual research and consults experts to get information to
help reach the goal.
5. Quality Conscious: He has always strong urge to excel to beat the exiting standard
6. Committed to Work: Does every sacrifice to get the task completed.
7. Efficiency Seeker: Makes always tenacious efforts to get the task completed within

33
minimum costs and time.
8. Proper Planning: Formulates realistic and proper plans and then executes rigorously to
accomplish the task.
9. Problem Sober: Always tries to find out ways and means to tide over the difficult times.
10. Self-Confidence: A strong believer in his strengths and abilities.
11. Assert is c: Good in asserting his issues with other for the cause of his enterprise.
12. Persuasive: Able to successfully persuade others to do what he actually wants from them.
13. Efficient Monitor: Personally supervises the work so that it is done per the standards laid
down.
14. Employees* Mell Wisher. He always concerns and also takes necessary measures to
improve the welfare of the employees working in his enterprise. Treats employees as a
factor of production having emotions and feelings.
15. Effective Strategist: Introduces the most effective strategies to effect employees to
achieve the enterprise goal whatsoever it may be.
3.5 Individual Research Studies
Several individual scholars have also undertaken research studies to identify the entrepreneurial
competencies or the quality of a successful entrepreneur The findings of some of the popular
studies arc given here.
In his study of entrepreneurial development of Madras city of India. James J. Bema listed the

34
following competencies:
1. He is an enterprising person.
2. He is always growth-oriented.
3. He w elcomes the introduction of advanced improved technology.
4. He looks for any changes like a watch-dog.
In the opinion of McCrory, a successful entrepreneur possesses the following qualities:
1. He invests his incomes in his enterprise. He is always quality conscious.
2. He is enough versatile as well as resourceful with limited resources at his command.
3. He makes every possible effort to take advantage from any opportunity as and when it
arises.
According to B.C. Tandon, a successful entrepreneur is characterized by the following four
qualities:
1. He is enough risk-bearer.
2. He is ready to adapt change, if the situations warrant.
3. He has ability to marshall the resources at his command.
4. He is a good organizer as well as a good manager.
While one can ascertain other factors to the list of entrepreneurial competencies, the said
competencies appear to be major ones. Now, an integrated view of entrepreneurial competencies
or qualities of a successful entrepreneur can be given as follows:
1. Enterprising
2. Risk Bearer

35
3. Creative Thinker
4. Ambitious
5. High Need for Achievement
6. Change-Agent
7. Hard and Tenacious W orker
8. Good Organizer. Manager and Administrator
9. Good and Prompt Decision-Maker
10. Strong Commitment and Finn Determination
The chief characteristics that successful entrepreneurs demonstrate arc summarized
3.6 Des eloping Competencies
As mentioned earlier, competency results in superior performance This is exhibited by one's
distinct behavior in different situations. The popular Kakinada experience has proved beyond
doubt that the entrepreneurial competency can be injected in human minds through education
and training. Competency finds expression in human behavior. How to develop and sharpen
the entrepreneurial competency is suggested in the following method or procedure.
The procedure involves four steps. These are.
1. Competency Recognition
2. Self-Assessment
3. Competency Application
4. Feedback
These are discussed one by one
Competency Recognition: Acquisition of a new behavior begins with understanding and

36
recognition of what a particular behavior means. In other words, the first step involved in
developing a particular competence is first to understand and recognize a particular
competence.
Self-Assessment: Once the particular competence is understood and recognized, the next step
towards acquiring a particular behavior / competence is to sec whether one possesses the
particular competence or not If yes. then to see how frequently one exhibits the same in his
practical life.
Where one stands w ith respect to a particular competence or what is the level of one's
competence can be ascertained by posing and answering relevant questions to a competence.
Such questions, for example, are given in questionnaire.
Competency Application: Having known where one stands with respect to a particular
competency, one needs to practice the same on continuous basts in various activities. In order
to make a new behavior a part of one's personality, the particular behavior / competency need
to be applied frequently even in the simplest activities that one perfumes in one's day-to-day
life. This is because “practice makes a man perfect"
Feedback: After understanding, internalizing and practicing a particular behavior or
competence, one needs to make an introspection of the same in order to sharpen and
strengthen one’s competency. This is called ‘feedback*. In simple terms, feedback means to
know the strengths and weaknesses of one's new behavior. This helps know how the new
behavior has been rewarding. This enables one to sustain or give up the exhibition of a
particular behavior or competence in his future life.
3.7 Small is Beautiful
Their role in economy is comprehensively determined, according to the Bolton Committee
Report, !972-73.This saw small firms as providing a productive outlet for enterprising and
37
independent minded people; offering the most efficient form of business organization in
industries w here the optimum size of the production unit or the sales outlet is small;
contributing to variety and consumer choice tn many markets; often producing specialist
supplies to large companies more cheaply; and providing an important source of innovation in
products, techniques and sen ices.
Further Bolton Committee pointed out; “In manufacturing the share of small firms in
employment and out put has fallen. There was also a dramatic fall in the number of small
manufacturing firm up to 1948. and a slower but continual decline has been going on since
then" The report also suggested that the declining share of small enterprises in economic
activity is apparently a universal process.
George Allen & Unwin. (1972-73) said that the main causes of poor performance and
declining conditions of small firms have serious problems of managerial knowledge, that
is why the most of small units have poor growth and profitability .
One research study has found the answer of the question. "Is mobility in American
business increasing or decreasing?" After analyzing expensive data between 1928 and
1952, it came to the conclusion that in smaller businesses opportunities for men of humble
origin to rise to the top were actually more restricted than in large ones. This was because
in smaller firms there were a greater proportion of managers bom to high positions. A later
study suggests that, so far as founders of firms were concerned, the tradition of democratic
mobility remained strong. The principal occupations of the fathers of a group of successful
American entrepreneurs, who had founded small firms, were analyzed. Twenty five
percent of the fathers had been small business proprietors, 10 percent professional men, 19
percent farmers and 8 percent sales men, clerks or supervision. But a large minority had
been unmistakably working class with 12 percent. Skilled laborers and 18 percent semi
skilled or unskilled. A more recent American siudy, concerning on entrepreneurs in high
technology industries, interestingly found that 50 percent of a sample these cause from

38
homes in which the father was self-employed. It also found that in this particular field, w
here educational qualifications are normally high, the more successful entrepreneurs
fended to be moderate.
To analyze all these variables, there is needed demographic information. In the period of
the Industrial Revolutions businesses mostly grew from their founders’ activities as
artisans, jobbers or middlemen. The most scholarly, yet fascinating account of how this
was done is contained in Sidney Pollard's Gensis of Modem Management.
The man behind the battle field is perhaps the most important input which makes for
success of a business venture. Quite often, it happens that there is a likely hood of disputes
with promoters and the subsequent inability to run the enterprises. A complex business
situation requires dynamic leadership coupled with sharp business acumen on the part of
the leader of the enterprise.
It is generally believed that in Small Scale Industries the strength of dynamic leadership
appears to be very week. The unsuccessful entrepreneurs often tend to lose confidence;
and these results in low moral in dealing with employees in the organization and customers
and other parties. Better qualified and successful professional managers would improve
this kind of situation.
T.S. Reddy & L.V. Reddy (1988) found the causes of sickness in Small Scale industry are a
manifestation of several maladies in the working of the units. The causes which contribute to
sickness are generally related to production, marketing, finance management and
environmental factors1.
B. Ramesh and Dr. P.N. Misra found that a sick unit is one which is not healthy, because
return on investment is not satisfactory . A healthy unit is one which ensures a minimum rate
of return on the investment. Thus return investment is measuring tool to analyze the

39
efficiency of the managers'owners of the small industrial units in the perspective of sales and
profit per year.
For the past fifteen years, strategy researchers and consultants have been preoccupied by a
quest for techniques and tools that top managers can reliably use to improve their firms
performance. Now question is that what types of managerial qualities are needed to
accomplish the predetermined Goals and objectives of the firms.
In this regard, there arc six main characteristics which are necessary posses by a manager of
any kind of small industry. The details are given below:
(i) Values
(ii) Aptitudes
(Hi) Skills
(iv) Knowledge
(v) Cognitive style
(vi) Demeanor
(Donald C. Hambrick Study Research Center Columbia University. U.S.A.,
1988).
There are many potential dimensions for assessing managerial attributes. For instance.
Leninson identifies 20 dimensions for evaluating leader’s qualities such factors as tolerance
for ambiguity', sense of humor and perseverance. Similarly stronger describes about the 36
managerial attributes which Pepsi-Cola International uses for evaluating managers efficiency.
The list includes such items as industry knowledge, writing skills, drive, mental ability,
managerial knowledge, marketing, knowledge and conceptual ability.
In the last few' decades. Japan has achieved a remarkable rate of industrial development

40
along with extra ordinary strong degree of international competitiveness in small industrial
sector. The basic factors contributing to this remarkable achievement are ’’Japanese — style
management". Small businesses have been considered to be an important element of
industrial structure in Japan since the turn of the twentieth century. Small businesses in Japan
have played a multi-dimensional role (The case of Japanese Small Businesses Yoshio Sato,
1992).
Il is crystal clear that, the determinants of efficiency of owners/manager of Small Scale
Industries are Growth of Sales and Profit.
Recent research on entrepreneurship, management, and organizations has underscored the
importance of understanding better the condition that promotes business survival and success.
Although organizational survival has been studied for many years (e.g. Mayer & Goldstein.
1961). research on this topic grew rapidly in the late 1970 and 1980s. Failures, bankruptcies
and hostile took over the attention of researchers during that period (Cameron, Sulton&
Whetten. 1988. Mayer. 1988; Whetten. 1987).
Several studies have suggested that men and women do not differ significantly on many of
the psychological attributes thought to characterize successful entrepreneurs; these attributes
include worth values like independence and motivations such as a need for achievement and a
willingness to take risk (Humphreys & Mc-Clunge, 1981; Pellegino& Reece. 1982; Schwartz.
1976). Survival and success are distinct aspects of performance that are determined by
different processes. Two recent studies have suggested that conclusion. Blau's (1984)
investigation by New York architecture firms showed that targe firms were more likely to
survival but that smaller ones were more profitable. Moreover. Carroll and Huo’s (1986) study
of newspapers suggested that their survival was more strongly related to institutional
environmental variables, such as political turmoil but their success was more strongly related
to task environment variables, such as the number of skilled employees in the local level labor

41
market.
In much economic research dealing with issues of growth and productivity, econometric
analysis is done based as a production function. The most commonly used production function
is the Cobb-Douglas function. These incorporate capital and labor as the factor inputs which
are usually considered the major resources in the production process.
A series of studies have confirmed the importance of management in explaining productivity
differences. Bergsman in a 1974 study of industry in six less developed countries found X-
cfficicncy several times as important as allocate efficiency in increasing gross national
product in these countries. Paclt (1974) studied six different industries in several less
developed countries and found significant variations in X- efficiency, and that inappropriate
choice of technology accounted for wide differences in productivity among the countries.
The desirable qualities of the owner'manager of small industrial units are the abilities to adopt
him to given circumstances and out his functions effectively, thereby contributing to the
development of a business firm. These abilities can be described only in broad, abstract terms
such as "Entrepreneurship”.
3.8 Historical Background of Entrepreneurship
The earliest of the term “Entrepreneur” is recorded in 17th Century French military history . It
referred to persons who undertook to lead military expeditions. An 18“* Centaury Irishman
named Richard Cantillon who was living in France at the time, is credited w ith being the firs
to use the term “Entrepreneur" in a business context. Later Jeam Baptiste Say. writing in
1803. described the entrepreneurial function in broader terms "the bringing together of the
factors of production with the provision of management and the bearing of the risks associated
with the venture”.
It was in the earls 20thCentaury when Moravian and Joseph Schumpeter cast the entrepreneur

42
as being the central actor in the change process, that anyone really took note. Schumpeter
contended that the singe most important function of the entrepreneur was innovation. Max
Weber’s entrepreneur is depicted as an energized individual. As the hero, the entrepreneur
sets in motion the revolutionary process associated with change. The result was higher
productivity , increased savings, and investment, all factors which are vital to economic
growth.
Schumpeter attributed the motivation of the entrepreneur to the need “to found a private
kingdom the will to conquer, the impulse to fight, to prove one self superior to others, to
succeed for the sake of it. and not for the fruits of success itself. Finally there is the joy of
creating of getting things done or simply exercising one's energy and ingenuity".
Marshall in 1920 described the entrepreneur as someone who “combines through vigorous
activity the factors of production, labor and capital so as to produce an increased output of
goods and services thereby increasing the total wealth or material w elfare of society ” David
McCelland the behaviorist who inspired the introduction of achievement motivation training
for entrepreneurs defined the entrepreneur as “a person w ho organizes and maintains a
business undertaking assuming the risks for the sake of profit”. William Bygrave "an
entrepreneur is someone who perceives an opportunity and creates an organization to pursue
it".
Evcrtt Hagen in his book on 'The Tneory of Social Change: How Economic Growth Begins:
linked personality formation and Entrepreneurship with the economic growth of society The
central theme of his link between growth and entrepreneurial motivation revolves around
what he termed the ‘the authoritative creative personality dichotomy". Triggered to respond in
an entrepreneurial way has led to surges of creative energy in cultures thereby producing
economic growth. Thomas Cochran was another one to attempt firs to a direct correlation
between Entrepreneurship and Economic Growth. The prevailing child rearing practices and
schooling common to the culture shape this model personality . Where the value system of
43
society encourages entrepreneurial behavior, growth will take place.
Perhaps the most well known of those who worked on the theory of linking Entrepreneurship to
economic growth was the Harvard psychologist David McClelland who in his book Achieving
Society established the existence in a culture of a “popular need for achievement”.
3.9 SMEs and Poverty Alleviation
More than 12 million people were added to the poor in Pakistan between 1993 and 1999. The
rising poverty was the result of poor governance and slow economic growth. The government.
NGOs and private sector arc implementing programs aimed at improving governance and
accountability of public institution to be able to better respond to the needs of the poor, assisting
them economically through creating income and employment opportunities, and improving their
access to better services. Employment creation is one of the most viable ways of reducing
poverty levels in the country . This wins SMEs an important place in the economy since the
declining growth of agricultural and large scale manufacturing (LSM) sector has crippled their
abilities to absorb Pakistan’s surplus labour. The capital to labor ratio in the SME sector is
around one-fourth that for LSM industries. Thus SMEs also need less level of investment per
job created, offering a rather inexpensive way of accommodating excess labour in the rural and
urban areas alike. SMEs thus become tool of equitable wealth distribution through out the
country . If approached strategically, million of jobs could be created in the five sectors of
textile, leather, dairy , marble and fisheries. The interim PRSP (Reduction strategy paper)
highlights the importance of pro-poor growth led by the private sector especially through SMEs.
The strategy has identified four sectors, namely agriculture. SMEs, it (information technology )
and energy (gas and coal). These sectors are generally labour intensive and their development
will eventually lead to job creation (Report of SMEDA 2004).
In 1983 huge research was undertaken by a L’S based firm international Management systems
to determine the trails of entrepreneurs. The study suggested that there were a number of trails
associated with success. They fell within three main clusters: the first cluster consisted of

44
achievement trails, namely opportunity seeking, persistence, commitment to work contract,
demand for quality and efficiency, and risk taking, the second cluster was composed of planning
trails, such as goal setting, systematic planning and control and information seeking while the
third cluster related to power traits, composed of persuasion and networking and self
confidence. After the identification of these traits a training package was developed to teach the
traits to entrepreneurs. These traits came to be known as Personal Entrepreneurial Capabilities
(PEC) and a lot of emphases arc places on this for Entrepreneurial Development.
Characteristics of leadership and differences among them have emerged as topics of
considerable interest in both the academic and popular business literature on executive
leadership. The focus on top-level leadership system from the assumption that given their
formal and symbolic power have significant impact on both organization activities and
performance (Flankers tcin. 1988). resting on the argument that they represent key proxies
for executive leadership’s cognitive orientation and knowledge base with important
implications for strategic decision making (Hambric and Mason. 1984). Although past
research has extensively examined the relations between organization factors and leadership
domains (e.g Dalton and Kesner, 1983; DAIta and Guthri. 1994: Schwartz and Menon.
1985), little attention has been paid to the environmental and industry context with which
executive leaders operate.
Hence, question is that, what types of characteristics arc required for effective leadership
and how these characteristics have relationship with performance?
Past empirical research on top management characteristics can be broadly divided into two
categories (1) studies that examine top management characteristics as a function of
organizations and environmental antecedents (e.g |Canella and Bubtkin. 1993: Dalton and
Kensner, 1983: Datta and Guthrie. 1994) and (2) studies that examine top management
characteristics an antecedent variable influencing managerial actins as well as organizational
out comes (e.g Finkelstein and Hambrik. 1990, Gelekanycz, and Fredrickson. 1993,

45
Wicrsema and Bantel. 1992).
Managerial abilities and strategies arc the key factors for firm's performance (e.g: Bain and
Qualls, 1978: Porter. 1980). The literatures in industrial organization economics (Bain and
Qualls. 1987: Scherer, 1980), competitive strategy (Porter. 1980). and organizational theory
(Pfeffer and Salancik. 1978: Thompson. 1967) suggest that examination of industry level
infancies on managerial characteristics can be meaningful in the context of such key
dimensions of industry structure as degree of concentration, capital intensity, product
differentiability, growth rates and demand instability.
The ability of an organization to anticipate and respond to opportunities or pressure for
change, both internal and external, is one of he most important ways in which its
competitiveness and validity can be ensured. The nature and effectiveness of organizational
responses vary in part with how top management triggers and interprets strategic issues (D
uhon and Duncan. 1987): Kiesles and sproull. 1982).
The world prominent researchers turned to examine the behavior or actins that separated
effective leaders form ineffective leaders, like the “Trait Theories", there behavioral theories
have been seen as universally applicable regardless of the specific situation facing a leader in
a particular organization.
Behavioural theories include studies of autocratic and democratic leadership behaviour,
leadership research conducted at the university of Michigons and at Ohio state University,
and Blake and Mouton’s managerial Grid.
Also known as an authority leader, generally centralized authority and make unilateral
decision Autocratic leaders tend to rely on legitimate power and coercive power to motivate
other.
Generally delegates authority and invites participation in decision making Democratic tend to

46
use referent and expert power to influence others. RensisLikert and other researcher at the
University of Michigan started to investigate how leadership bchavoiur relates to
organizational performance. As a result of studying effective and ineffective leaders. The
Michigan researchers identified two distinct leader behaviors, such as employee centered
behavior and job centered behavior.
1. Employee-Centered Behavior
Emphasizes interpersonal relation ships, teamwork, and employee participation.
2. .lob-Centered Leader Behavior
This type of leader also emphasizes the technical aspects of the job and the task that must be
accomplished to achieve group goals.
There are various theories which help to understand the leadership behaviors especially in small
scale industries and how such behaviors influence on the performance of the firms grow th in
terms of sales and profit.
Identifies environmental opportunities and threats, interpret the relevant information, considers
organization of capabilities and constraints and formulates and implements strategic change
(Mintzberg, 1979).
Thus an examination of what influences who executive's asses and direct firm strategy is an
important area of investigation.

47
CHAPTER N0.4
IMPACT OF RICE INDUSTRIES ON ECONOMIC
DEVELOPMENT OF SINDH
4.1 Introduction
This chapter explains the impact of rice industries on the economic development of Sindh, in
the beginning of the chapter, the detail of rice production in Pakistan is given. The production
of paddy in Sindh province, sowing and transplanting time, status of rice milling in Sindh, rice
milling operation, post harvest issues, export from Sindh, problems and measures, harvesting
and threshing, seed, recommendation and conclusion has also been discussed in this chapter.
Rice is consumed as a major food item after wheat and is third largest crop after wheat and
cotton by acreage. It is annually cultivated on an area of around 5 million acres. The crop
occupies about lOpercent of the tool cropped area. Annual rice production averaged at 4.75
million tons in 2004-5. It accounts for 17percent of value added by major crops. Punjab is the
leading producer of rice in the country . It accounts for 59.5 percent of the tool production. The
next leading province is Sindh. It accounts 29.5 percent The remaining provinces NWFP and
Baluchistan contribute 11 percent of the total production.
Pakistan ranks 14th in rice production in the world. It is the 6th largest exporter of rice,
holding 6percent share in rice export of the world. Rice export lowered around 2 million tons in
2004. Pakistan basmati rice has been a favorite among international rice buyers. Following
liberalization policy international trade after world trade agreement and Chinas interest of
importing 2.3 million tons of grain rice from Pakistan 2004. Pakistan rice will become highly
competitive and has been identified as one of the major commodities for export. This provides
us with ample opportunity for development of rice based value added products for earning
more foreign exchange
Many of the rice processing units are traditional huller type and are inefficient. Therefore,
there is dire need to establish modem rice mills through which entrepreneurs of rice mills can

48
be able to produce the high capacity production.
4.2 I'he Production of Padday in Sindh Province of Pakistan
In the Sindh province during the year 2004. an area of 551.000 hectares has been reported
under paddy crop. Total production was about 1.5 million tons. The nurseries for paddy
start in the month of May and transplanted from 15th June to 15th July. The harvesting of
the crop starts in the months of September and October.
IRR1-6 a heat tolerant variety is one of the major varieties, apart from this; DR-82. DR-83,
DR-92 Sada Hayat and Roosi varieties area also grown. The Russian variety, which is
originally, a basmati variety imported from Punjab and is being grown as tine type The tine
type variety has different names in Sindh such as Roosi, GM Basmati. Kernel. Supper.
Dubai or Basmati-2000. The basmati field is transplanted during 2nd of July and continues
till August 15th.
Table-4.1 Sowing and Transplanting Time
Variety TIME OF NURSERY SOWING
Upper Sindh Lower Sindh
IR-6. IR-8 Sada Hayat
2" week of May to
2"d week of June
3"* week April to
2nd w eek of May DR-82 Last week of May
to
2"* week of May to DR-92 Last week of June 3rt week of June
DR-83 3'° week of June to
2**1 week of July
1 “ week of June to
1“ week of July Lcteefy 2“ week of June to
1" week of July
3rd week of May to
last week of June Kanwal-95 2“ week of April to
2* week of May
1" week of April to
1" week of May Source; Sindh Baluchistan Rice Millers Association
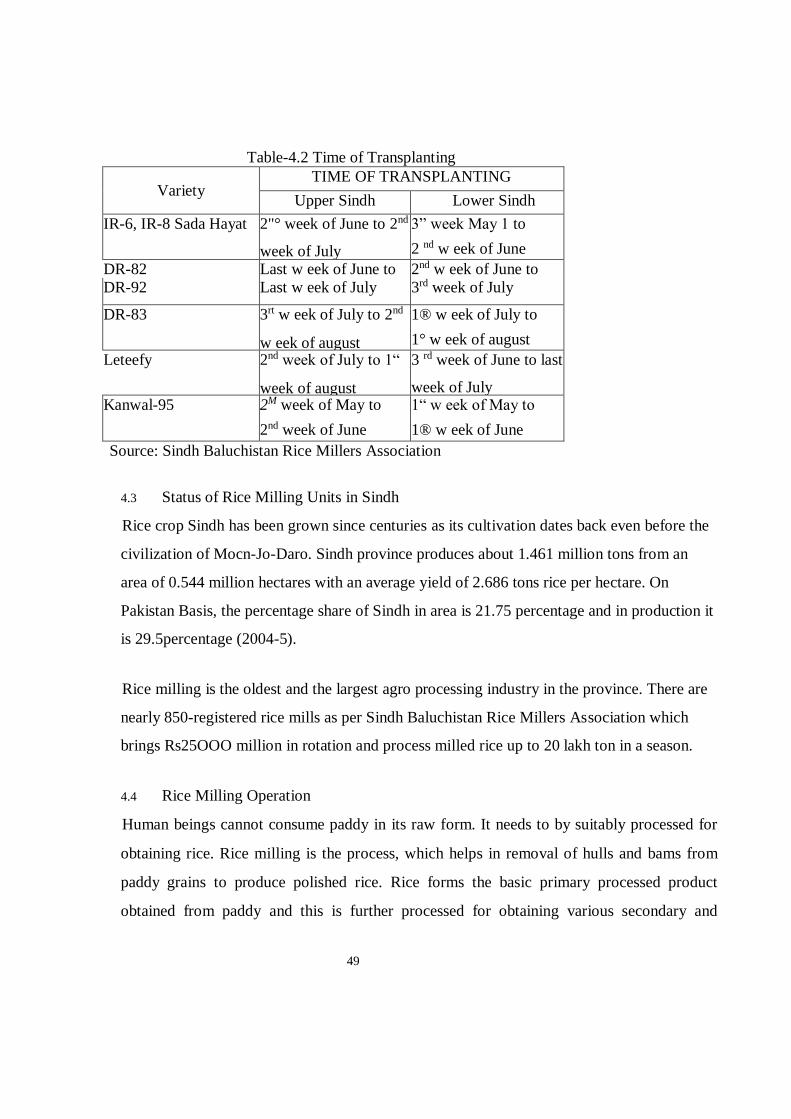
49
Table-4.2 Time of Transplanting
Variety TIME OF TRANSPLANTING
Upper Sindh Lower Sindh
IR-6, IR-8 Sada Hayat 2"° week of June to 2nd
week of July
3” week May 1 to
2 nd w eek of June
DR-82 Last w eek of June to 2nd w eek of June to
DR-92 Last w eek of July 3rd week of July
DR-83 3rt w eek of July to 2nd
w eek of august
1® w eek of July to
1° w eek of august
Leteefy 2nd week of July to 1“
week of august
3 rd week of June to last
week of July Kanwal-95 2M week of May to
2nd week of June
1“ w eek of May to
1® w eek of June
Source: Sindh Baluchistan Rice Millers Association
4.3 Status of Rice Milling Units in Sindh
Rice crop Sindh has been grown since centuries as its cultivation dates back even before the
civilization of Mocn-Jo-Daro. Sindh province produces about 1.461 million tons from an
area of 0.544 million hectares with an average yield of 2.686 tons rice per hectare. On
Pakistan Basis, the percentage share of Sindh in area is 21.75 percentage and in production it
is 29.5percentage (2004-5).
Rice milling is the oldest and the largest agro processing industry in the province. There are
nearly 850-registered rice mills as per Sindh Baluchistan Rice Millers Association which
brings Rs25OOO million in rotation and process milled rice up to 20 lakh ton in a season.
4.4 Rice Milling Operation
Human beings cannot consume paddy in its raw form. It needs to by suitably processed for
obtaining rice. Rice milling is the process, which helps in removal of hulls and bams from
paddy grains to produce polished rice. Rice forms the basic primary processed product
obtained from paddy and this is further processed for obtaining various secondary and

50
tertiary products.
The basic rice milling process consists of:
Process Definition
1. Pre Cleaning: Removing all impurities and unfilled grains from paddy.
2. De-stoning: Separating small stones from paddy.
3. Parboiling (Optional): Helps in improving the nutritional quality by gelatinization of
starch inside the rice grain. It improves the milling recovery percent during deshelling
and polishing^whitening operation.
4. Husking: Removing husk from paddy.
5. Husk Aspiration: Separating the husk from brown rice/unhusked paddy.
6. Paddy separation: Separating the unhusked paddy from the brown rice.
7. Whitening: Removing ail or part of the bran layer and germ from brown rice.
8. Polishing: Improving the appearance of milled rice by removing the remaining bran
particles and by polishing the exterior of the milled kernel.
9. Length Grading: Separating small and large broken from head rice.
10. Blending: Mixing head rice with predetermined amount of broken, as
required by the customer.
11. Weighing and Bagging: preparing the milled rice for transport to the customer.
4.5 Post Harvest losses
According to research conducted the total quantitative losses due to various post harvest
operation vary from 3.1 to 21.4percent as under.
Table-43 Post Harvest Losses
Operations Losses in percent
Harvesting (Pre harvest reaping losses) 0.25-29 Field drying 0.57-3.0 Transportation of harvest crop 0.02-0.6 Threshing 0.40-3.3

51
Cleaning or winnowing 0.50-5.0 Drying of the grains 0.01-0.1 Transportation of the grains 0.05-0.5 Storage 1.00-4.0 | Milling 0.30-2.0 | Total ________________________________ 3.10-21.4
Source: Survey Study
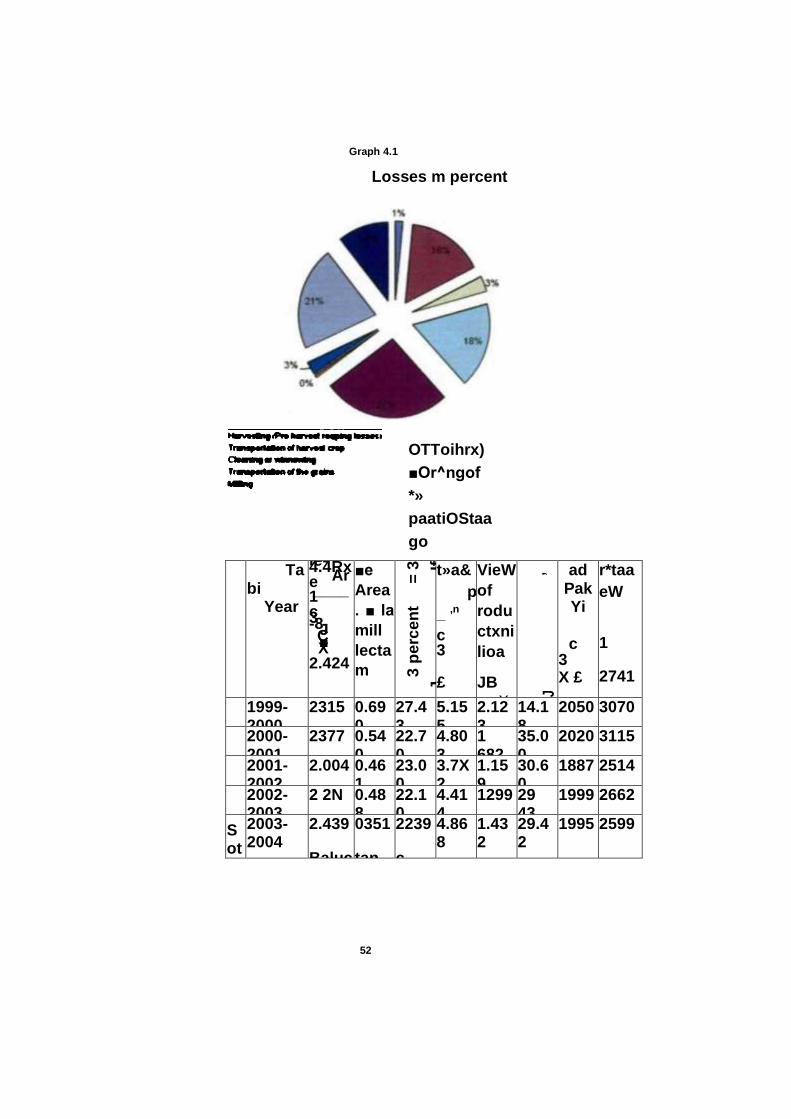
Graph 4.1
52
Losses m percent
Tabi
Year
1998- 1999
le-4.4Rx Are
____1 c 3 -8 JC ■ X 2.424
■e
Area
. ■ la
mill
lecta
m
z
0.70
4
3 p
erc
en
t =
3
J _
__
__
__
__
__
If
t»a&
p
_ ,n
c 3
£
4.64
7
VieW
of
rodu
ctxni
lioa
JB
•g X
1.93
0"
J ’ ad
Pak
Yi
c 3 X £
1982
r*taa
eW
1
2741
1999- 2000
2315 0.690
27.43
5.155
2.123
14.18
2050 3070
2000- 2001
2377 0.540
22.70
4.803
1 682
35.00
2020 3115
2001- 2002
2.004 0.461
23.00
3.7X2
1.159
30.60
1887 2514
2002- 2003
2 2N 0.488
22.10
4.414
1299 29 43
1999 2662
Sot
2003- 2004
tree
Small
2.439
Baluchis
0351
tan Ric
2239
c miller
4.868
sawc
1.432
ation
29.42
1995 2599
OTToihrx)
■Or^ngof
*»
paatiOStaa
go

53
Graph 4.2
Area in Million Hectors
01998-99 ■ 1999-2000 D2OOG-2OO1
□2001-2002 ■2002-2003 O2003-2W4
Graph 43
Production in million Ton#
■ 1998-99
□ 2001-2002
■ 1999-2000 ■2002-
2003
□2000-2001
02003-2004

Graph 4.4
54
Yield
■ 19M-99 ■ 1999-2000 02000-2001 02001-2002 ■ 2002-2003 02003-2004
Graph 4.5
Rice Area in Million Hectare
3 -----------------------------------------------------------------------------
199&-1999 1999-2000 2000-2001 2001-2002 2002-2003 2003-2004

55
Table-4.5 Physico- Chemical Characteristics of Rice Varieties
Particulars Varieties ] IR-6 DR-82 DR-83 S.Hayat DR-92
Paddv Grain •
Average Length(mm) 9.49 9.45 19.58 9.53 9.69 Average width (mm) 232 2.19 2.29 2.43 2.27 Average thickness
(mm)
1.50 1.70 1.79 1.88 1.98 Weight of 100 grains
(g)
2.50 235 2.13 2.47 2.49 Milled Rice
Average Length(mm) 6.59 6.16 6.82 6.68 6.62 Average width (mm) 1.98 1.73 1.88 2.05 2.06 Average thickness
(mm)
1.67 1.46 1.53 1.64 1.70 Length/width ratio
(mm)
4.20 3.90 4.30 4.30 4.22 Weight of 100 grains
(g)
1.93 1.80 1.79 1.79 1.92 Classification
According to F.A.O
| Size (Milled Rice) Long Long Long Long Long I According to
V.S.D.A
Size (Milled Rice) Medium Medium Long Medium Long Shape (Milled Rice) Slender Slender Slender Slender Slender
Chemical Characters
Amylose content 26.3 23.68 19.98 27.40 30.50 Gel consistency (mm) 30 32 33 52 32 Aroma None None None None None Bursting Less Less Less Less Less Eating Quality Good Good Good Good Good
Source: Sindh Baluchistan Rice Millers Association.
4.6 Export from Sindh
Total export of rice from Sindh in 2004-5 was 241akh Metric ton. 117819 containers of small
size w ere sent from Sindh, each container consist of220 bags, each bag has weight of 90-100 kg.
58910 large size of container were sent from Sindh, each container consist of 440 bags.
4.7 Problems and Measures
Follow ing are the problems identified during the study and under mentioned measures ♦ can be taken to increase the yield.
Verities/seed
• Problem of pre-basic quality seed supply.

56
• Check on the un-approved verities and unregistered seed companies.
Measures
• Increase the supply of pre-basic seed to the private sector by raising the credit facilities
to seed companies and by providing relief in terms taxes.
• Proper measures should be taken to check the marketing of seed of unapproved verities
and unregistered seed companies.
Sowing-Transplanting
• Lack of awareness about maintenance of plant population, presently plant population is
50000 per acre its almost half than standard.
• Efficient use of fertilizer, publication and distribution of literature is a major pre-
harvesting problem.
• Facing constraints in the commercial adoption of mechanical transplanting.
Measures
• Proper Awareness should be created regarding plant population and the standard of
plant population, which is equal to 100.000, plants per acre.
• Steps to be taken to create awareness by publishing written material and make it
convenience for growers.
• Steps to be Uken to encourage private sector and growers for the adoption of
mechanical transplanting.
4.8 Harvesting & Threshing
• Lack of awareness and habit of using modem combines as grow ers follow traditional
methods specially the use of tractor that results in increase of break percenuge.
• luck of incentives to private sector for importing combines.
• Feasibilities are required for importing reconditioned combines.
4.8.1 Measures

57
• Educating the growers for adopting the use of combines by arranging rice exhibition stall.
• Providing incentives to private sector for importing already tested head feeding combines
developed in Japan and Govt should allow the import of lightweight reapers combine
harvesters from Japan. Korea and china.
• Feasibility of importing reconditioned combines be also studied as to its cost effectiveness
and attract private sector in this business.
4.8 J Processing of Paddy
• Mostly millers and dealers are not using the paddy de-huskers and moisture meters,
consequently leads towards the losses.
• Un-availability- of loan facility and Taxes for import of modern machinery of
processing/polishing etc. (up gradation)
4.83 Measures
For safeguarding the interest of growers, paddy de-huskers and moisture meters should be used
in marketing of the paddy .
Institutional credit for balancing and modernization of rice mills i.e. for installing paddy
separators, cleaners, dc-stoncrs and polishers etc be made available. Tax holiday should also be
given for establishing such manufacturing industry .
4.9 Issues of Rice export
• Admixture of rice at various stages.
• Quality of rice during threshing of paddy at field level and processing of rice at shelters.
• Cultivation of basmati verities in non basmati areas.
• Availability of quality seed.
• Pre-shipmcnt inspection of rice.
4.10 Seed
Seed is one basic component for cultivation of any crop. In Sindh as per field observation one
could easily understand the position of quality seed. For instance it was difficult to identify
paddy field in area visited where one could say that it has been grown from a certified seed. Most
of the field contained mixture of so many other verities ranging between low. medium and high.

58
The growers and millers were complaining about the availability of seed. They complained that
there was no alternative except this mixture of seed. If this type of situation continued then it not
only affect marketing of rice crop in Sindh but per acre yield would further decline and the crop
would be more susceptible to diseases.
4.11 Recommendation:
It is therefore suggested that more seed processing units should be installed, as there is only one
seed-processing unit operating in Larkana by RR1 Dokri. It hardly covers 2pcrcent of total
requirements of five rice-growing districts. Seed processing machinery can cost not more then 1
million. For this rice millers association will make full cooperation as far as land and
construction is concerned. If such type of measures were not taken then the next year crop would
rather be a more admixture and prone to many types of disease and ultimately exports from
region will be affected.
4.12 Conclusion
Rice milling is the oldest and the largest agro processing industry in the province. There are
nearly 850-registered rice mills in Sindh Baluchistan. Rice Millers Association which brings RS.
25000 million in rotations and process milled rice up to 20 lakh tons. Among these rice mills
almost developed on modem pattern but many of them are using old rubber hullers. There is a
dire need to up-grade them on modem pattern to increase the yield by preventing the break
percentage. Millers of the area shown interest in, changing the present scenario by granting loan
facility step by step. There is an extreme need of awareness program to farmers before harvesting
so that moisture percentage may maintain at proper level which consequently decreases break
ratio.
Technology awareness to millers is also needed. As many of them even don’t know the progress
made in the sector.
There is dire need of installing seed processing unit to control the mixture of so many verities.
There is also need for installation of rice exhibition stall in collaboration with manufacturers,

59
pesticide companies and agriculture departments to create awareness about new technology.
Because due to the lack of awareness the percentage of rice break is 50percent, average recovety
of traditionally rice mills using steel hullers for de-husking or old rubber shelters is around 52-
54percent among 850 rice mills. Only four rice mills have parboiling unit Therefore rice millers
need more concentration to update die existing old technology into the modem rice mills
technology. It is a fact that such technology is available in the international market but due to the
lack of information the most of rice millers arc not aware. And this happening is due to low
educational base of the most of rice millers in Larkana district.
During the year 2000, 0.35 million tons of rice was laying in the rice mills and storages, if the
stock was cleared the country could earn 95 millions dollar. But unfortunately, the concerned
authorities of Pakistan were reluctant to sell the rice of Larkana in the international markets. It
was really cold-shouldered attitude of the government authorities with the rice millers of
Larkana. Due to U-tum of government an approximately 90 percent industrial units of rice
mills were badly affected and the owners of these rice mills became defaulters of various
commercial banks. In the year 2003-4 the trends of rice were downwards by the reason of
high prices of IRRI-6 and Pakistan was offering 1RR1-6 rice at the rate of $165 per metric
ton, while Vietnam was offering same quality of IRRI-6 at the rate of $150 per metric ton, and
Thailand was selling IRRI-6 best quality in the same market at the rate of S178 per metric ton.

60
CHAPTER N0.5
ROLE OF SINDH SMALL INDUSTRIES CORPORATION FOR
EXPANSION AND PROMOTION OF INDUSTRIES IN SINDH
S.l Introduction
This chapter describes the role of Sindh Small Industries Corporation for expansion and
promotion of small scale industries in Sindh. In the beginning. SSIC has established fourteen
industries estates in different regions of Sindh is given, annual development program of
SSIC. overall industrial and investment scenario in Sindh province, special industrial zones,
sugar mills in Sindh, cement industries in Sindh, self'employment scheme of SSIC and
conclusion arc discussed in the chapter
Sindh Small Industries Coqxwation has also established fourteen Small Industries Estates
which arc located in Hyderabad, Thatta, Badin. Mirpurkhas, Sanghar, Dadu, Sukkur.
Khairpur, Nawabshah, Larkana Shikarpur and Kandkot. Corporation has also developed two
industrial parks which arc located in Mirpurkhas and schwan. Besides, new estates at Tando
Adam. Hala, Gambat and Rohriarc also being established.
Tablc*9.1 Sindh Small Industrial Estates Name Year of
Eitabliahm
ent
Total
Area (In
Aem)
So of
plots
|>evrloit
rd
So. of
Plot.
Allotted
Units In
Ope ration
1 SITE Sukkur 1963-64 110 0 297 282 186 LSITEl.arkana 1964-65 59.0 313 201 46 ILP.MIrpurkhai 1974 5.0 32 22 NA SlPSdiw as 1974 5.0 36 33 NA LME Dadu 1982-83 10.7 45 22 NA • 4. Sit Shikarpur 1984-85 36.0 96 46 NA 7.SIE Kind hot 1984-85 14.4 47 II NA MIE Hyderabad 1985-86 50.1 96 96 NA ♦.SIE Mlrpurkhat 1985-86 51.2 177 150 NA 10. SIE Hadln 1985-86 30.2 107 17 NA II. SIE Sanghar 1985-86 45.0 98 52 NA 11 Sit. Nawabshah
1985-86 50.0 95 6 NA 13. SIE Thana 1986-87 50.0 98 21 NA IMIETando Adam
1991-92 13.5 75 44 42 (Power Loom) 15.0 52 2 NA
15. SIE Gambat 1994-95 46.4 142 NA (Power loom) NA
It. Sil Kohrl SA IMA NA ♦ 17, Karachi 1962 1875.55
ac
1060.63 East 206 1900 It. koiri 1983 3342 1150 1620 89 It. Nnriabad 1950 1268 380 860.4
3
76 2B Hyderabad 1952 150 44 82.18 380 21. tando Adam 42 TOTAL 591.6 1,806 1,005
Soun. e SSK .Head (Mike K tr.n hi

61
The SIE at Tando Adam and Gambat arc exclusively for power loom sector.
All infrastructure facilities have been provided in these estates. Industrial plots arc available for
allotment to the new investors.
The premium of an industrial plot of 1000 squire yards in the Small Industries Estates is Rs.
51,000. Possession is handed over on deposit of only Rs. 10,200 i.e. 20 percent of the
premium. The remaining cost can be paid in installments. In case industry is set up within two
years of the allotment of plot, 50 percent of the cost is refunded, otherwise full cost of the plot.
i.e. Rs. 51.000 will be recovered. Commercial plots are sold by open auction.
5.2 Annual Development Program of SSIC( 1995-96)
Table- 5.2 SSIC Sponsored Development Schemes during the Year
1995-96 S.NO Name of the Scheme Allocation in Rs.
Million 1 Establishment of regional and 4 district
Offices in Karachi
0,750
2 Auto Diesel Training-cum-Service Institute,
Karachi
1,000
3 Small Industries Estate for Power Loom
Sector, Hyd: (SITE Kotri)
1,000
4 Self-Employment Scheme 0.100 5 Development of Glass Bangles Centre.
Hyderabad
6 Upgradation of Insfrastucture of SIEs in
Sindh
7 Readymade Garments Training-cum-
Production
Centre, Mullah Essa Goth. Malir. Karachi
0,100
Total 2.950 Source: SSIC Head Office Karachi
Table-53 SSIC Sponsored Development Schemes during the Year 1996-
97 S.NO Name of the Scheme Rs. Million
Allocation 1 Establishment of regional and 4 district
Offices in Karachi
0,750
2 Auto Diesel Training-cum-Service Institute.
Karachi
1.000
3 Small Industries Estate for Power Loom
Sector, Hyd: (SITE Kotri)
1,000
4 Self-Employment Scheme 0.100 5 Development of Glass Bangles Centre.
Hyderabad
6 Upgradation of Insfrastucture of SIEs in
Sindh
7 Readymade Garments Training-cum-
Production Centre, Mullah Essa Goth. Malir.
Karachi
0.100
Total 2.950 Source: SSIC Head Office Karachi

62
Table-5.4 10 SSIC Sponsored on going Schemes during Che Year 1996-97
S.NO On-going Schemes Rs. Million Amount 1 Readymade Garment Training Center
Mila Essa Goth. Malir. Karachi
2.00
2 Establishment of Auto-Diesel Training
Cum- Service Institute. Karachi
3.000
3 Self-employment Scheme in Sindh 0.100 ■i Small Industries Estate for Power Loom
Sector. Hyderabad
1,000
5 Industrial Home for Women. Kunri
District Umerkot
1.000
Total 7,100 Source: SSIC Head Office Karachi
53 Cher-all Industrial and Investment Scenario in the Sindh Province
To sum up the industrial and investment activity in the Province of Sindh, the following
statistics would reveal that the overall scenario is bright and prosperous.
Table-5.5 Large & Medium Industrial Estates
S.NO Name of
Estate
(location)
Total
.No. of
Units
No. of
Units
working
No. of
Units
Close
d
Area
in Acres
Employment
(approx.)
1 SITE
Karachi
1,928 1.900 28 4.460 204,454 2 SITE North
Karachi
II —
«
1.019 Would stat
functioning
during current
year 3 SITE
Nooriabad
119 76 43 3,342 25,000
4 SITE
Kotri/Dadu
89 56 33 13 34.000
; 5 SITE Hyd 380 272 198 1.268 73.560 6 SITE Tando
Adam
42 12 30 . 150 1,500
7 SITE Sukkur 186 62 124 1.060 7,120 Grand total
percent age
2.755 2,378 366 13,174 345,634
Source: SSIC Head Office Karachi5.4 Special Industrial Zones The Special Industries Zones have been undertaken at Nawabshah. Larkana to Kotri Bandar.
Special concessions and incentives will be provided to the industries setup in these zones.
The work on the Nawabshah Zone is at an advanced state, where 240 acres of land has been
acquired. The estimated cost of development of infrastructure in the Zone is Rs. 345.000 million.
Two heavy industrial units are already under process and expected to come to for operation
within one to two years. Besides, feasibility of two industrial estates, each at Schwan (Laki Shah

63
Saddar) and Thar (Mrthi or Diplo) was also undertaken, where, the concessions available to
Special Industrial Zones will also be extended to these estates. These proposed estates would be
developed by SITE Limited out of its own resources; w hereas. Government of Pakistan would
provide the incentives as applicable to SLZs.
Besides, the approved industrial estates, industrial areas namely. Korangi. Landhi and Fedral
“B" Industrial Area in the Karachi City and in the Rural areas like, Gharo. Dhabeji Industrial
Areas and other thinly scattered industrial units exist in the Province.
53 Sugar Mills in Sindh
It would be worth mentioning that there exist 27 sugar mills in the Province at the following
locations
Table- 5.6 Sugar Mills in the Sindh Province
SAO Name of the District No. of Mills 1 Thana 05 2 Badin 05 3 Hyderabad 06 4 Sanghar 01 5 Mirpurkhas 02 6 Nawabshsh 01 7 NaushaheroFeroze 02 8 Khairpur 02 9 Sukkur 01 10 Dadu 01 II L.arkana 01 Total 27 Mills
Source: SSIC Head Office Karachi
Besides. 3 mills are at advance stale of implementations viz. Seri Sugar Mills Ltd..
Hyderabad. Bachani Sugar Mills Ltd., and Tharparkar Sugar Mills, Mirpurkhas.
1 .6 Cement Industries in Sindh There are also 9 cement factories in the Province at the fol lowing locations:
I Rohri Cement Factpru, Sukkur
2 Zeal Pak Cement factory. Hyderabad
3 Anwar Zeb Cement Factory . Thatta
4 Thatta Cement Factpru. Thana
5 Pakland Cement Factolry. Maiir

64
6 Essa Cement Factory Nooriabad
7 Dadabhoy Cement Industries. Nooriabad
8 National Cement Industries. Karachi
9 Javedan Cement Industries. Manghopir. Karachi
5.7 Self-Employment .Scheme by SSIC
The corporation launched the self-Employment Scheme in October. 1992 with a Revolving
Fund of Rs. 100 million contribution by the Government of Sindh. The objective of the scheme
is to meet financial requirements of small investors. w ho feel difficult to comply w ith
procedure of the financial institutions, as a result of which the loaning schemes were beyond
their reach to avail.
The funds are being provided by the following Commercial Banks called participating
commercial Banks (PCBs) under the agreement with them by the Sindh Small Industries
Corporation. The PCBs w ith the approval of the State Bank of Pakistan are re-imbursing the
disbursed amount to the Corporation under the Locally Manufactured .Machinery Scheme
(LMM Scheme). Under the agreement the PCBs will continue to re-imburse the disbursed
amount to the Corporation to the extent of Rs.500 million.
The modus-operandi is that the Corporation disburses loan to the approved projects * out of the Revolving Fund of Rs. 100 million contribution of the Government of Sindh.
The Government of Sindh has guaranteed repayment of the loans in case of default. The agreed
mechanism is that once the loans became due and are not repaid by the Corporation beneficiaries
to the PCBs w ithin a period of 90 days of due date, the concerned PCB will lodge a claim with
the SBP which will debit to the Provincial Government Account w ithout any reference to them.

65
Initially, the interest rate under the scheme was 8 percent but it has been enhanced to 14
percent ix. the rate applicable in case of LMM Scheme and repayment period is 9 sears with
18 month grace period.
Table-5.7 Loan Sanctioned by the SSIC under the Self Employment
Scheme S.NO Name I rade Date of
Sanction
1 Loan
Amount Rs. KARACHI REGION Total Amount
Sanction in
Rs. 4024000 1
2
Khyber Foundary&
Engg: Works, Karachi
Adil Corporation.
Karachi
Foundry &
Engg: Works
1
13.05.1989
1
500.000
Ready made
garments
।
18.05.1989
500.000
' 3 Abigali Garments.
Karachi
Garments
Making
21.08.1990
|
21.02.1991
500.000
4 Shahid Marble. Karachi Marble
Industry
199.000 5 Khawaja Dairy Farm.
Karachi
Dairy Farm 16.06.1990 500.000
6 Hubsch textile. Karachi Textile Mill 24.08 1993 500.000 7 Nazeer & Sons Plastic
W'orks, Karachi
Plastic 02.01.1994 325.000
8 A & A Textile Industry
Karachi
Textile
Industry
06.12.1004 500.000
9 Main Noor Textile.
Karachi
Textile
Industry
06.12.1994 500.000
HYDERABAD Total Amount Sanction in Rs. 834100 10 Qalandn Rice and Flour
Mill. Sanghar
Rice & Flour
Mills
06.04.1989 500.000
11 Modern Dairy Farm.
Dadu
Dairy Farm 18.07.1990 500.000 12 Mehran Dall Mill. Dadu Dall Mill 22.06.1989 500.000 13 Badin
Internationa
l
Industry. Badin
Cattle feed 14.04.1990 500.000
14 Samoo Dall Mill. Dadu Dall Mill 18.04.1990 500.000 15 Murad Dairy Farm.
Hyderabad
Dairy farm 13.05.1989 500.000
16 Mehar Saw Mills.
Thana
Saw Mills 05.05.1990 200.000 17 Khukhy Dairy Fam &
Dairy Products
Hyderabad
Dairy Farm 09.01.1990 500.000
18 Mani HoteEMotel&&
Restaurant. Sanghar
Hotel/Motel 09.12.1989 500.000
19 1 Babar Saw & Furniture
Industry Sanghar
Furniture
Manufacture
23.02.1991 465.000
20 Sippy Dairy Farm.
Hyderabad
Dairy Farm 19.02.1992 500.000
21 Jamali Flour Mill. Dadu Flour Mill 28.02.1991 500.000 22 Khaskhelly Dairy Farm
Hyderabad
Dairy Farm 28.02.1991 100.000
23 Indus Dairy Farm Dairy Farm 25.04.1991 200.000 IM 1 Mehran Dairy Farm | Dairy Farm 25.04.1991 200.000

66
Hyderabad
25 Akhond Beverages Beverages 19.02.1991 500.000 26 Ltd. Dadu Confectionary
item
20.10.1993 176,000
27 Bismillah RCC Pipe
Factor. Thana
Pipe Factory 18.04.1994 500,000
28 Sehwan Flour Mill
Sehwan
Flour Mill 31.05.1994 500,000 29 ___ , Madina Oil Mill. Sehwan | Qi) Mill
SUKKUR REGIONV Total Amount
Sane
15.06.1994 | 500,000
•lion in Rs. 3787260 30 Bismillah IcVe Factory
Rohri
Ice Factory 30.04.1989 500.000
31 Syed Saw Mill. Sukkur Saw Mill 30.05.1991 500,000 32 Shaheen Cattle Mill,
NausheroFeroze
Cattcl Farm 13.05.1991 495.260
33 Ali Flour Mill,
Nawabshah
Flour Mill 27.02.1991 500.000 34 Mehran Ice Factory
Sukkur
Ice Factory 09.04.1990 200.000 35 Shahid Poultry Farm
Nawabshah
Poultry Farm 30.07.1990 498,000
36 Abdul Hameed Khan &
Co. Sukkur
Cotton Waste 18.12.1991 500.000
37 Imperial Power Plastic ,
Nawabshah
Plastic Industy 18.04.1993 400,000
38 Indus Flour
MilLSakrand
Flour Mill 30.10.1993 194.000 LARKA NA REGION _______ Total Amount
Sane
Saeed Poultry Farm Pourlty Farm
Larkana
:tion in Rs.
4-4
09.01.1990
10500(1
200.000
40 Haji Nizamuddin
Pathan Ara Machine.
Shikarpur
Ara Machine 01.05.1991 225.000
41 Mehran RCC Shikarpur Pipe 21.02.1990 480.000 42 Ashfaque Power Looms
Industry Karachi
Power Looms 24.02.1990 500.000
43 Najam Plastic
Industries. Kandhkot
Plastic
Industries
13.08.1991 500.000
44 Zeeshan Plastic
Industries. Kandhkot
Plastic
Industries
13.08.1991 200.000
45 Inyatullah Flour Mill
Larkana
Flour Mill 13.08.1991 500.000
46 Soomro Plastic Industry
Shikarpur
Plastic
Industry
17.09.1989 500,000
47 United Rice Mills.
Larkana
Rice Mills 01.10.1991 200.000 48 Nehal Dairy Farm.
Jacobabad
Dairy Farm 15.08.1991 200.000
49 Moin Jo Daro Dairy
Farm.. Jacobabad
Dairy Farm 15.08.1991 200.000
50 Noordin Dairy Farm.
Jacobabad
Dairy Farm 15.08.1991 200,000
51 Mureed Dairy Farm.
Jacobabad
Dairy Farm 15.08.1991 500.000
| KARACHI REGION TOTAL AMOUNT _____________ 4024.000 HYDERABAD REGION TOT AL AMOUNT 83.41.000 LARKANA REGION TOTAL AMOUNT 44.05.000 SUKKUR REGION TOTAL AMOUNT | 37,87.260

67
Grand Total Rs. 20557260 Source: SS1C Head Office Karachi
The Corporation sanctioned an amount of Rs 130.994 million as loans to 206 small industrial
projects so far. Against this an amount of Rs.81,769 million has been disbursed to 117 projects.
The projects sanctioned so far will generate an investment of about Rs.217 million and create
about 2150 jobs. The PCBs have reimbursed an amount of Rs. 35.731 million against Rs. 47.322
million and claims lodged with them and are being pursued.
So far as Revolving Fund is concerned, the Government has provided an amount of Rs.60
million, thus release of balance amount of Rs. 40 million will accelerate implementation pace of
the scheme.
5.8 SSIC’s Sale Shops
To promote marketing of traditional crafts, the corporation have established sales shops at
Karachi (PlDC House), Karachi Airport. Khairpur and Kashmore.
5.9 Conclusion
Sindh Smail Industries Corporation has setup the various different types of small and cottage
industries in the different estate areas of the Sindh such as Karachi. Hyderabad. Thana. Badin.
Mirpur Khgas. Sanghar. Dadu. Sukkur. Larkana. Nawabshah. Shikarpur and Kandhkot. Besides,
new estate al TandoAdam. Halla, Gambat and Rohn arc also established. SSIC’s sanctioned an
amount Rs. 130.994 million as loan to 206 small industrial projects so for the purpose of
increasing the growth of small industries in province and creating the job opportunities as well.
But it has been observed that the above sanctioned amounts have been misused by the concerned
authority and entrepreneurs because they did not achieve the required targets of the scheme.

68
CHAPTER N0.6
SINDH SMALL SCALE INDUSTRIES CORPORATION
ESTATE AREA OF LARKANA
6.1 Introduction This chapter explains the results of field study of Larkana estate area. In the beginning of the
chapter, there is an introduction of state of Larkana and small industries estate.
The Small Scale Industries Corporation was launched as STATE OFFICE in Larkana during
1963. This project started w ith approved cost of 3 million. In this regard STATE OFFICE
purchased total 60 acres land for the purpose of establishing the different Small and Cottage
industrial units. During the same period, there were 313 plots, out of these 260 plots were
allotted for setting up 84 different types of industrial units and 53 plots were under process of
allotment
After passage of time, the Larkana STATE OFFICE was promoted as a full-fledged “SINDH
SMALL INDUSTRIES CORPORATION” in the year 1972. Eleven years later, the authority of
Sindh Small Industries Corporation opened new branch at SHIKARPUR District on 13I*1
January 1983 for the purpose of promoting Small and Cottage Industries in these areas. After
that another branch was introduced on 30* December 1994 at KANDHKOT. With the
introduction of these branches, Larkana office became regional office in the year 1989.
6.2 SMALL INDUSTRIES ESTATE LARKANA This estate w as established for the purpose of socio-economic uplift of this area in the context
of increasing the growth of small and cottage industries and providing the job opportunities to
the local people.
In this estate area, infrastructure facilities also have been provided such as malted road,
telephone, electricity , w ater and drainage. The authority of small industries has been allotted
I Rice Mills

69
different categories of the plots for following Cottage and Small Industries:
2. Specialized Textile
3. Engineering Workshops
4. Agricultural Implements
5. Woodwork
6. Poultry Farming
7. Oil Grain Milling
8. Cold Storage
9. RCC Pipe
10. Larkana Baker}'
11. Food Industries etc.
6.3 Materials and methods
In the year 2004 at Larkana estate area, total 84 small and cottage industries were in operation.
During the field study, it has found that the numbers of small rice mills were high and these
industries were also coming in the definition of State Bank of Pakistan. (The said definition is
available in chapter 1* introduction and background) In this regard we selected 30 units of rice
industries and six units of food industries from the Larkana estate area. To collect the required
information from the selected samples of small industrial units, we distributed the structured
questionnaire among the selected samples.
For analysis of date we have used the regression model for measuring the relationship between
the dependent and independent variables. We have also used the graphical techniques to
examine the slope of distribution, and scatter plot to find out the relationship between two
variables. Some analysis has been interpreted on the basis of respondents’ response. We have
also selected some samples on the random basis for the purpose of in-depth case studies such as
samples of un-educate, matriculate, intermediate and graduate entrepreneurs of small industrial
units at Larkana estate area. The details of analysis of data are available at appendices A-H
Indeed. Larkana is a rice growing area, which is cultivating huge “PADDY" every year i.e.. a 32
million tons. Keeping in view of importance of rice mills in the estate area of Larkana. we

70
started the empirical investigation about the rice mills.
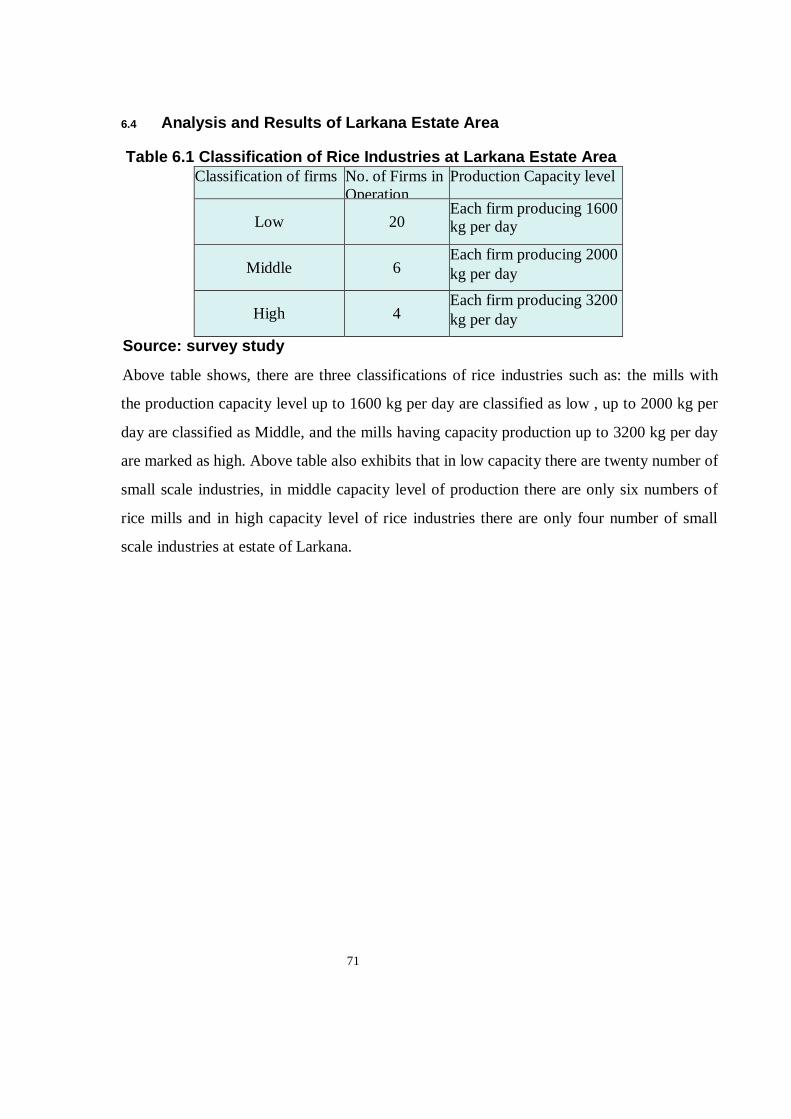
71
6.4 Analysis and Results of Larkana Estate Area
Table 6.1 Classification of Rice Industries at Larkana Estate Area
Classification of firms No. of Firms in
Operation
Production Capacity level
Low 20 Each firm producing 1600
kg per day
Middle 6 Each firm producing 2000
kg per day
High 4 Each firm producing 3200
kg per day
Source: survey study
Above table shows, there are three classifications of rice industries such as: the mills with
the production capacity level up to 1600 kg per day are classified as low , up to 2000 kg per
day are classified as Middle, and the mills having capacity production up to 3200 kg per day
are marked as high. Above table also exhibits that in low capacity there are twenty number of
small scale industries, in middle capacity level of production there are only six numbers of
rice mills and in high capacity level of rice industries there are only four number of small
scale industries at estate of Larkana.

72
Years No. of Units
Established
1976 1
1977 6
1978 1
1979 1
1980 2
1981 1
1982 2
1983 1
1984 1
1985 2
1986 2
1987 0
1988 1
1989 1
1990 0
1991 0
1992 1
1993 2
1994 2
1995 3
No. of Employment
Created
Growth Rate of
Employment in %
10 1.45
59 856
10 1.45
4 058
10 1.45
16 232
20 2.90
2 0.29
9 130
21 3.04
20 232
0 0.00
11 159
14 2.03
0 00
0 0.00
10 1.45
25 3.62
21 3.04
32 4 64
Table 63 Growth rate of Units estabashed and Employment at i airkana estate area.
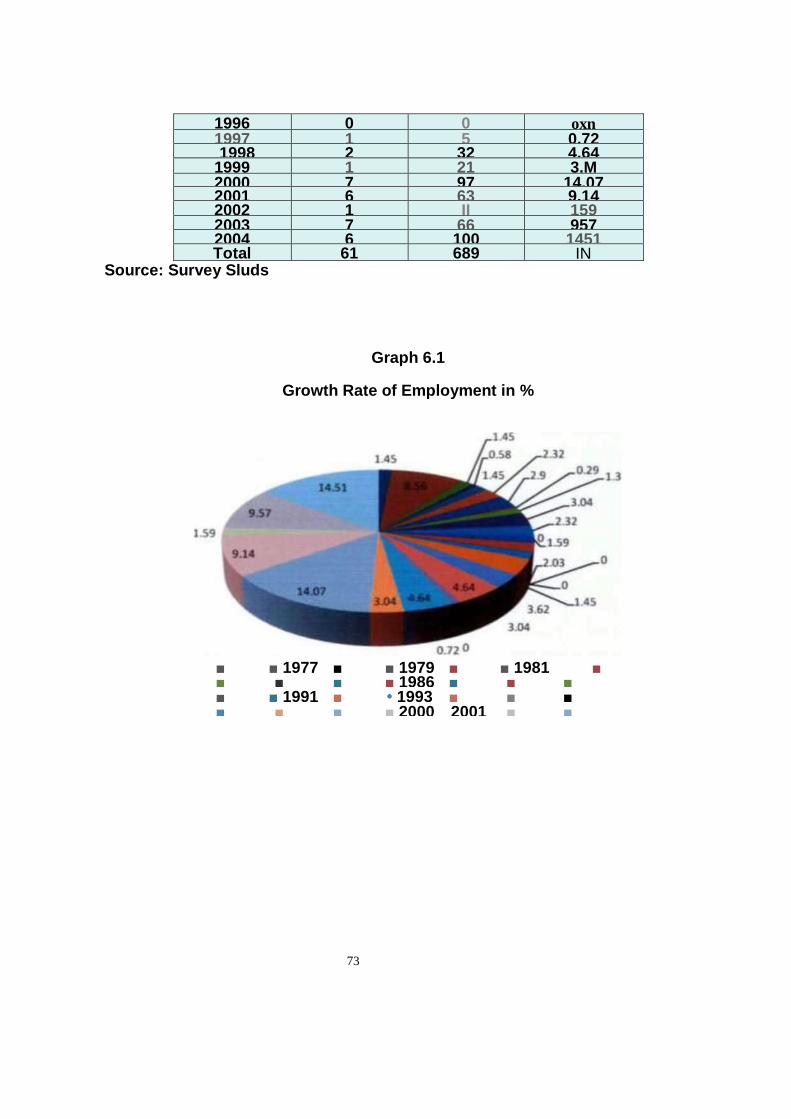
73
1996 0 0 oxn 1997 1 5 0.72 1998 2 32 4.64
1999 1 21 3.M 2000 7 97 14.07 2001 6 63 9.14 2002 1 II 159 2003 7 66 957 2004 6 100 1451 Total 61 689 _____ IN ____
Source: Survey Sluds
Graph 6.1
Growth Rate of Employment in %
■ 1976
■ 1977 ■ 1978
■ 1979 ■ 1980
■ 1981 ■ 1982 ■
1983
■ 1984
■ 1985
■ 1986 ■ 1987
■ 1988
■ 1989 ■
1990
■ 1991 ■ 1992
• 1993 ■ 1994
■ 1995
■ 1996 ■
1997
■ 1998
■ 1999
■ 2000 2001 ■ 2002
■ 2003
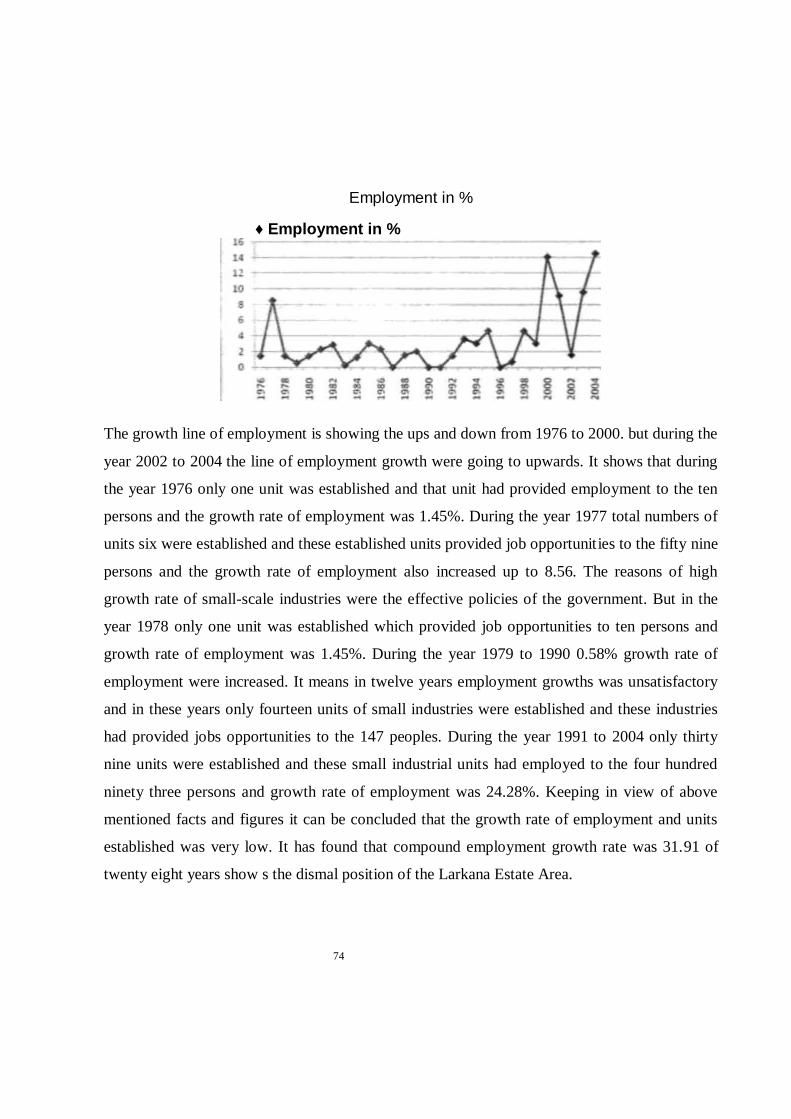
74
Employment in %
♦ Employment in %
The growth line of employment is showing the ups and down from 1976 to 2000. but during the
year 2002 to 2004 the line of employment growth were going to upwards. It shows that during
the year 1976 only one unit was established and that unit had provided employment to the ten
persons and the growth rate of employment was 1.45%. During the year 1977 total numbers of
units six were established and these established units provided job opportunities to the fifty nine
persons and the growth rate of employment also increased up to 8.56. The reasons of high
growth rate of small-scale industries were the effective policies of the government. But in the
year 1978 only one unit was established which provided job opportunities to ten persons and
growth rate of employment was 1.45%. During the year 1979 to 1990 0.58% growth rate of
employment were increased. It means in twelve years employment growths was unsatisfactory
and in these years only fourteen units of small industries were established and these industries
had provided jobs opportunities to the 147 peoples. During the year 1991 to 2004 only thirty
nine units were established and these small industrial units had employed to the four hundred
ninety three persons and growth rate of employment was 24.28%. Keeping in view of above
mentioned facts and figures it can be concluded that the growth rate of employment and units
established was very low. It has found that compound employment growth rate was 31.91 of
twenty eight years show s the dismal position of the Larkana Estate Area.

75
The development of Small - Scale Industries has a strong socio - economics base imperative for
the country. It needs smaller amount of capital, generates greater employment opportunities,
disseminates the benefit of economic growth to a larger number, has short gestation period and
carries the fruit of industrialization to rural areas. Small Industries have shown a remarkable
resilience even in adversity. It is envisaged that the small industry rout will accelerate the
export-led growth of the economy.
When the Pakistan came into existence on 14® August 1947, at that time Pakistan economy
was agrarian and exporting primary commodities and importing manufacturing units and
contributed only 8% of the (GDP) of the country .
Pakistan inherited a very small share of industrial units, which were quite insignificant and out
of 921 manufacturing units under factories act, Pakistan got only 34 units.
In Pakistan, growth of industries had to pass through different phases and periods for example
during the period of 1947 to 1952, there was no visible progress in the field of industry. Private
sector, during the same period established few industries on small scale basis. Keeping in view'
the pressing need of industrial setup and Government established Pakistan Industrial
Development Corporation in 1952 (P1DC).
The (PIDC) major investment was in paper and paper board, cement, fertilizer, jute mills.
Shipyards and Sui Karachi gas pipeline. During the short period of time. (PIDC) has established
59 different Industrial units by June 1972. During the year 1970 the government of Pakistan had
started the nationalization of private industries, devaluation and labor militancy the large inflow
of remittances from Pakistan workers abroad contributed to the rapid growth of the small scale
industry in the year 1970. the rate of growth was 2.9%. Remittances from the migrant workers
were US S2 to 3 billion annually in the year 1970s and early 1980s created a colossal market
for a variety of consumer goods produced by the small scale industry in the both areas like rural
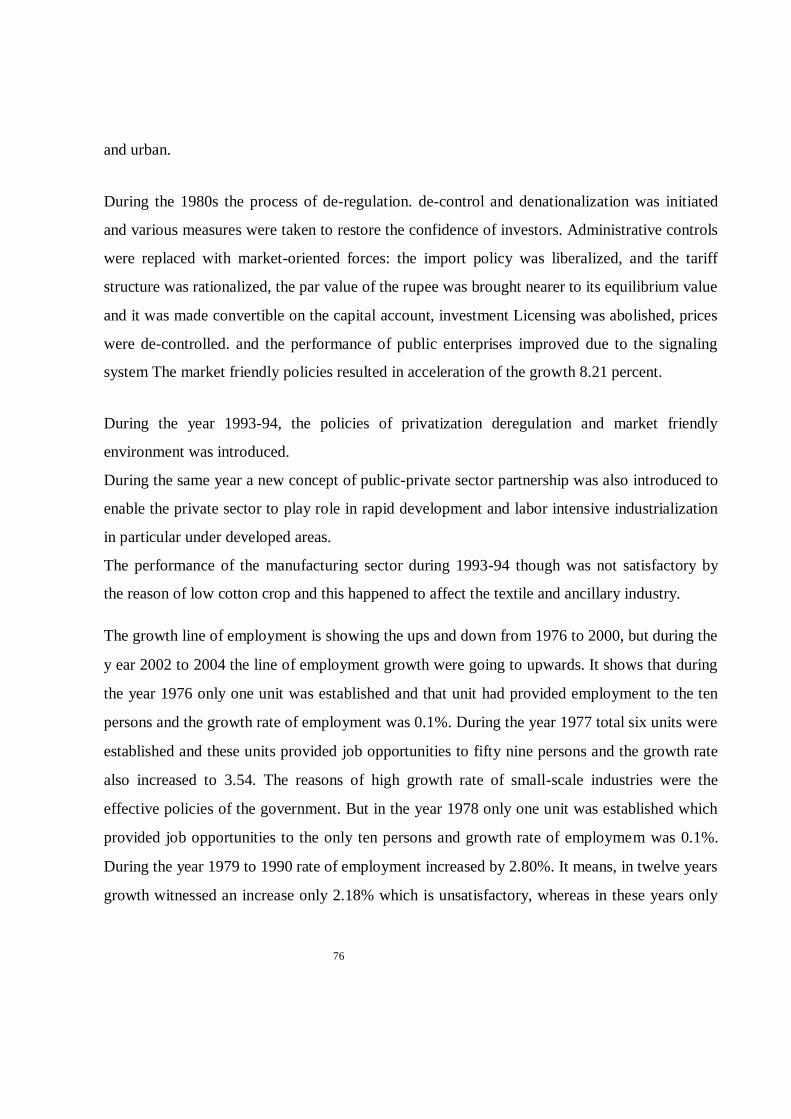
76
and urban.
During the 1980s the process of de-regulation. de-control and denationalization was initiated
and various measures were taken to restore the confidence of investors. Administrative controls
were replaced with market-oriented forces: the import policy was liberalized, and the tariff
structure was rationalized, the par value of the rupee was brought nearer to its equilibrium value
and it was made convertible on the capital account, investment Licensing was abolished, prices
were de-controlled. and the performance of public enterprises improved due to the signaling
system The market friendly policies resulted in acceleration of the growth 8.21 percent.
During the year 1993-94, the policies of privatization deregulation and market friendly
environment was introduced.
During the same year a new concept of public-private sector partnership was also introduced to
enable the private sector to play role in rapid development and labor intensive industrialization
in particular under developed areas.
The performance of the manufacturing sector during 1993-94 though was not satisfactory by
the reason of low cotton crop and this happened to affect the textile and ancillary industry.
The growth line of employment is showing the ups and down from 1976 to 2000, but during the
y ear 2002 to 2004 the line of employment growth were going to upwards. It shows that during
the year 1976 only one unit was established and that unit had provided employment to the ten
persons and the growth rate of employment was 0.1%. During the year 1977 total six units were
established and these units provided job opportunities to fifty nine persons and the growth rate
also increased to 3.54. The reasons of high growth rate of small-scale industries were the
effective policies of the government. But in the year 1978 only one unit was established which
provided job opportunities to the only ten persons and growth rate of employmem was 0.1%.
During the year 1979 to 1990 rate of employment increased by 2.80%. It means, in twelve years
growth witnessed an increase only 2.18% which is unsatisfactory, whereas in these years only

77
fourteen units of small industries were established which provided jobs opportunities to 147
peoples. During the year 1991 to 2004 only thirty nine units were established and these small
industrial units had employed to 493 persons and the growth rate stood at 24.28%. Keeping in
view the above mentioned facts and figures it can be concluded that the growth rate of
employment and units established was ven low. It has been found that compound employment
growth rate was 31.91% of twenty eight years shows the dismal picture of the Larkana Estate
Area.
The development of Small - Scale Industries has a strong impact on the socio - economic base
of the country . It needs smaller amount of capital, generates greater employment opportunities,
disseminates the benefit of economic growth to a larger number, has short gestation period and
carries the fruit of industrialization to rural areas. Small Industries have shown a remarkable
resilience even in adversity. It is envisaged that the small industry rout will accelerate the
export-led growth of the economy.
When the Pakistan came into existence on 14® August 1947, at that time Pakistan economy
was agrarian and exporting primary commodities and importing manufacturing units and
contributed only 8% to the (GDP) of the country .
Pakistan inherited a very small share of industrial units, which were quite insignificant and out
of 921 manufacturing units under factories act Pakistan got only 34 units.
In Pakistan, growth of industries had to pass through different phases and periods. For example,
during the period from 1947 to 1952. there was no visible progress in the field of industry .
Private sector, during the same period established a few industries on small scale level. Keeping
in view the pressing need of industrial setup government established Pakistan Industrial
Development Corporation in 1952 (PIDC).
The Pakistan Industrial Development Corporation’s major investment was in paper and paper

78
board, cement, fertilizer, jute mills. Shipyards and Sui Karachi gas pipeline. Dunng the short
period of time. PIDC had established 59 different Industrial units by June 1972 During the year
1970 the government of Pakistan had started the nationalization of private industries,
devaluation and man power export brought large inflow of remittances by Pakistan. Workers
from abroad which contributed in the rapid growth of small scale industry . In the year 1970.
the rate of growth was 2.9%.
Remittances from the migrant workers were US $2 to 3 billion annually during the year 1970s
and early 80s. Small Scale created a colossal market producing a variety of consumer goods in
the both areas like rural and urban.
During the 80s the process of dc-regulation, de-control and denationalization was initiated and
various measures were taken to restore the confidence of investors. Administrative controls
were replaced with market-oriented forces: the import policy was liberalized, and the tariff
structure was rationalized, the par value of the rupee was brought nearer to its equilibrium value
and it was made convertible on the capital account, investment licensing was abolished, prices
were de-controlled, and the performance of public enterprises improved due to the signaling sy
stem. The market friendly policies resulted in acceleration of the growth to 8.21 percent.
During the year 1993-94, the policies of privatization deregulation and market friendly
environment were introduced in the same year a new concept of publicprivate sector
partnership was also introduced to enable the private sector to play its role in rapid development
and labor intensive industrialization in under developed areas.
The performance of the manufacturing sector during 1993-94 was not satisfactory due to low
crop of cotton and this affected the textile and ancillary industry, adversely.
Sales and profit position of one rice mill at Larkana estate area. Owner of this industry is
Matriculate.
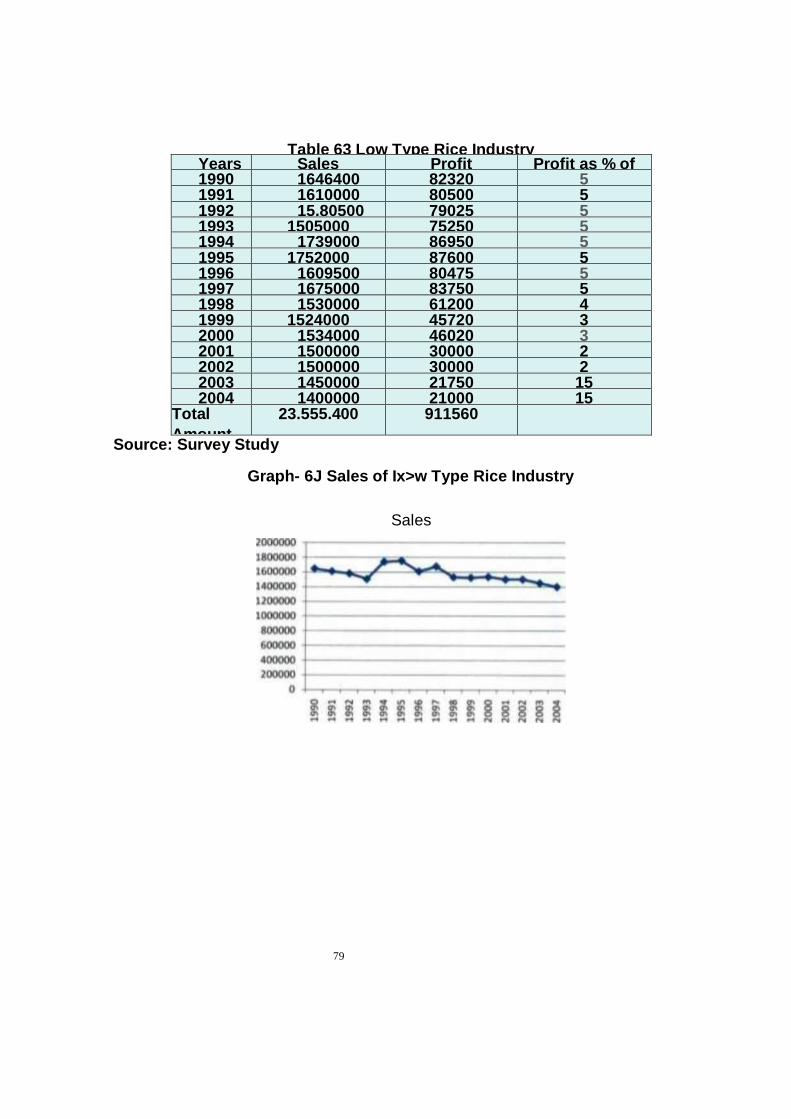
79
Table 63 Low Type Rice Industry Years Sales Profit Profit as % of
sale 1990 1646400 82320 5 1991 1610000 80500 5 1992 15,80500 79025 5 1993 1505000 75250 5 1994 1739000 86950 5 1995 1752000 87600 5 1996 1609500 80475 5 1997 1675000 83750 5 1998 1530000 61200 4 1999 1524000 45720 3 2000 1534000 46020 3 2001 1500000 30000 2 2002 1500000 30000 2 2003 1450000 21750 15 2004 1400000 21000 15
Total
Amount
Rs.
23.555.400 911560
Source: Survey Study
Graph- 6J Sales of Ix>w Type Rice Industry
Sales

80
Graph -63Profit of Low Type Industry
Above graph reveals that the growth of sales over the years were declining due to weak
strategy of the owner of the small rice industry at l^arkana because of outdated technology
and low quality of rice. This owner was using the huller technology which is outdated. And by
use of this machine the ratio of broken rice is high i,c. 50%. I'herefore the sales of this unit
were showing the downward slope. So it is cry stal clear that owner was unaware of the latest
technology and the major reason of low sale and low profit was his low level of education and
lack of managerial knowledge.
Table 6.4 Sales and profit position of a rice mill at Larkana estate area.
Years Sales in Rs Profit in Rs Profit as % of Sale 1990 1805860 90293 5
1991 1750000 87500 5 1992 1815000 90750 5 1993 1710000 85500 5 1994 1446400 82320 5 1995 1515000 75750 5 1996 1437600 71880 5 1997 1344800 53792 4% 1998 1238000 49520 4% 1999 1180000 35400 3% 2000 1160000 34800 3% 2001 1100000 22000 2% 2002 1000000 20000 2% 2003 1000000 15000 13% 2004 900000 15000 1.5
Total. 20402660 829505
Source: Survey study of Larkana estate area.

81
Graph- 6.4
Growth of Sales & Profit of Rice Mill
The above graph shows that the sales from the year I990-2004were declining Because the
owner of this mill was not capable enough to produce the better quality of rice due to using the
outdated technology which was not feasible to produce the well polished quality of rice.
Therefore, the sales were showing the declining trend. Another reason was his low level of
education. He relied on the out dated information relating to the demand of rice in the
international market
Table 63 Sates and profit position of a rice mill at Larkana estate area.
_______ ______ (Owner of tha rice mill is Graduate) _____
Years Sates in Rs Profit in Rs. Profit tn % of Sate 1990 12550000 627500 5
1991 12630000 631500 5 1992 12710000 635500 5 1993 12825000 641250 5 1994 12620000 631000 5 1995 12615000 630750 5 1996 12480654 624033 5 1997 12482800 624140 5 199g 12460000 498400 4 1999 12483249 499330 4 2000 12483249 374498 3
2001 12500000 625000 5 2002 12500000 625000 5
2003 12700000 635000 5 2004 12900000 645000 5
Total 188939952 8947901

82
Graph-6.5
Growth of Sales & Profit of Rice Mill
This graph depicts that the sale of this small industry is showing a positive trend over the
years because from the year 1990-95. the sales were stable but during the 1995-96 it
declined and again from 1997-1998 the sales increased and then again in 1999-2000 the
sales decreased due to fraudulent activity of exporter who got the rice from the Larkanian
industrialists and sold out the same rice and fled away. However, in the year 2002-04 the
sales again increased. This position shows that owner of this mill was quite capable to face
any challenge because of his better educational level, hard work and rational decisions
which helped him in avoiding loss.
Table 6.6 Sales and profit position of aa owner of rice mill al Larkaaa estate area. (The Owner of this mill is M.A in
Economics) High Type Industry
Years Sales in Rs. Profit in Rs. % 1998 7450000 372500 5 1999 7530000 376500 5 2000 763000 381500 5 2001 8000000 400000 5 2002 8100000 405000 5 2003 8100000 405000 5
2004 8100000 410000 5 Total 55010000 2750500 5
Source: Survey study of i^rkana estate area. Growth of Sales & Profit of Rice Mill
—•— Sales
• Net Profit %
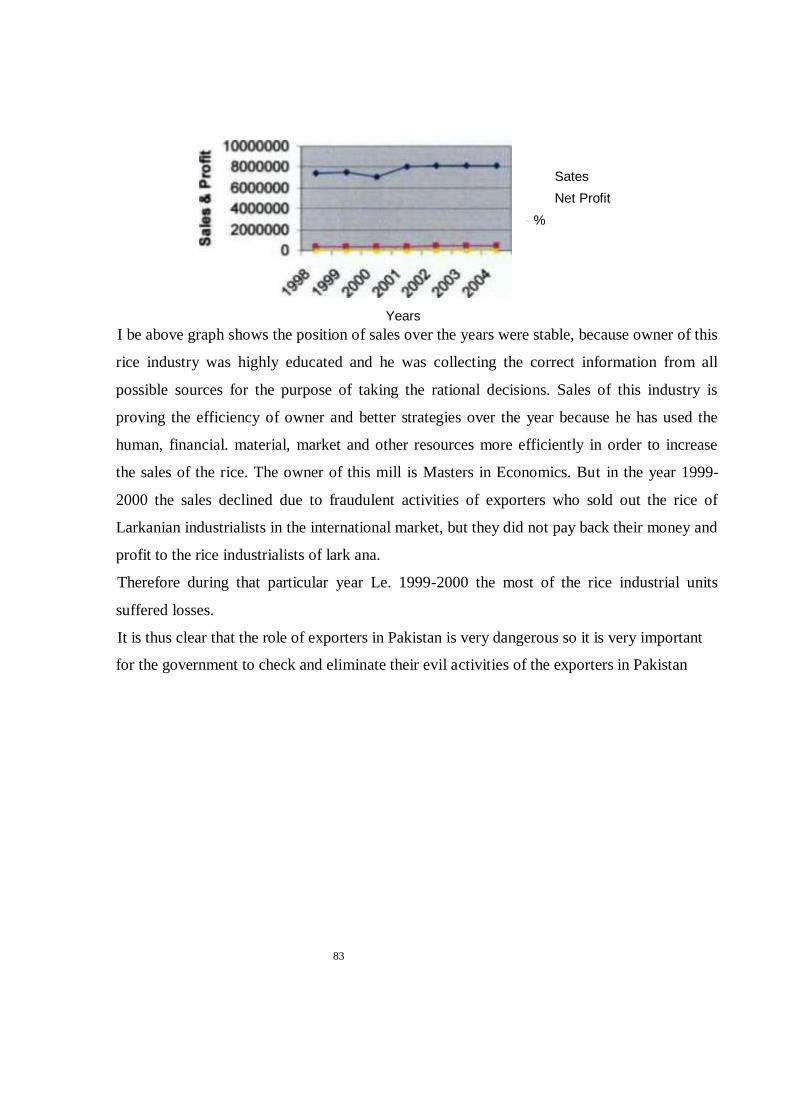
83
I be above graph shows the position of sales over the years were stable, because owner of this
rice industry was highly educated and he was collecting the correct information from all
possible sources for the purpose of taking the rational decisions. Sales of this industry is
proving the efficiency of owner and better strategies over the year because he has used the
human, financial. material, market and other resources more efficiently in order to increase
the sales of the rice. The owner of this mill is Masters in Economics. But in the year 1999-
2000 the sales declined due to fraudulent activities of exporters who sold out the rice of
Larkanian industrialists in the international market, but they did not pay back their money and
profit to the rice industrialists of lark ana.
Therefore during that particular year Le. 1999-2000 the most of the rice industrial units
suffered losses.
It is thus clear that the role of exporters in Pakistan is very dangerous so it is very important
for the government to check and eliminate their evil activities of the exporters in Pakistan
Years
Sates
Net Profit
- %
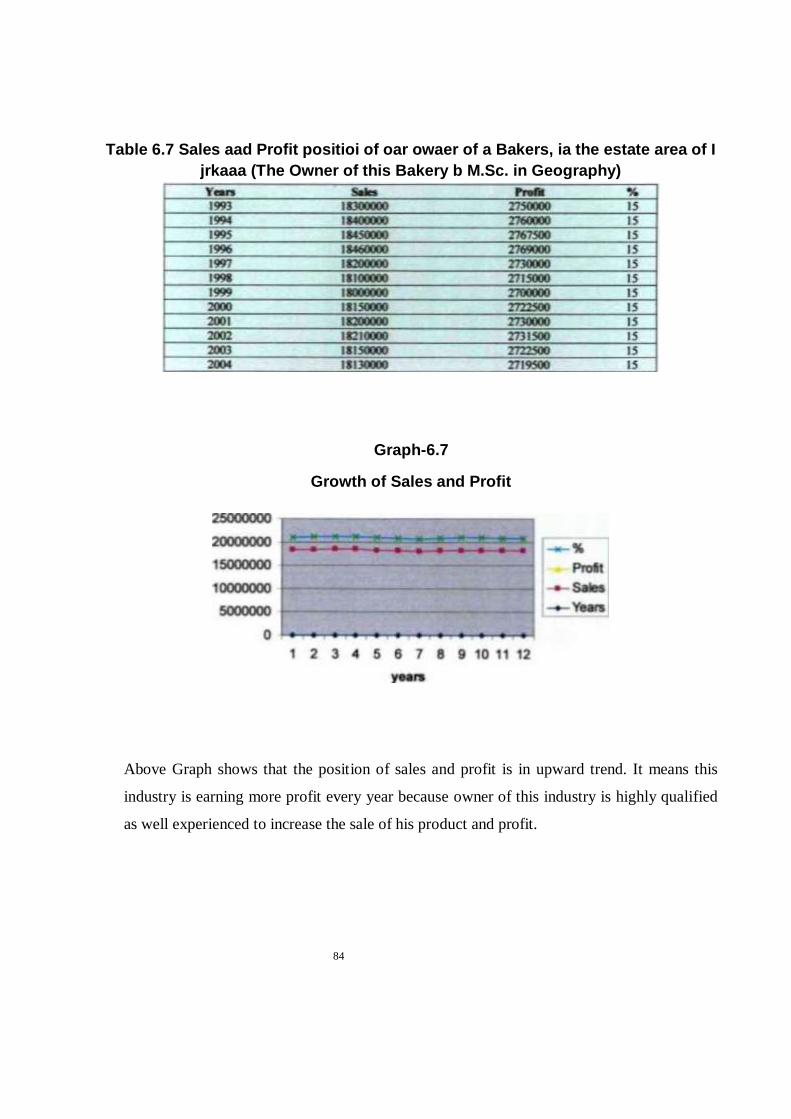
84
Table 6.7 Sales aad Profit positioi of oar owaer of a Bakers, ia the estate area of I
jrkaaa (The Owner of this Bakery b M.Sc. in Geography)
Graph-6.7
Growth of Sales and Profit
Above Graph shows that the position of sales and profit is in upward trend. It means this
industry is earning more profit every year because owner of this industry is highly qualified
as well experienced to increase the sale of his product and profit.

85
Table 6.8 Sales and Profit position of, one owner of a Bakery, in
the estate area of Larkana Owner of this bakery is M .A.
Economics. Age 45. Year Sale Profit % 1995 9750000 975000 10 1996 10000000 1000000 10 1997 10050000 1005000 10 1998 10060000 1006000 10 1999 10080000 1008000 10 2000 10090000 1009000 10
2001 10100000 J010000 10 2002 10105000 10110500 10 2003 10130000 10)3000 10 2004 10150000 1015000 10
Source: Survey Study
Graph 6.8
Growth of Sales And Profit
25000000
£
20000000
E
15000000
4
10000000 15000000 0
Above Graph shows that the position of sales and profit is in upward trend. It means this
industry was earning more profit every year because the owner of this industry being
qualified and experienced enough to achieve the better financial results.
Table 6.9 Sales and Profit position of an owner of a Bakery, la the estate area of
Larkana (Owner of this baker is M.Sc. Agriculture. Age 55vs) Year Sale Profit % 2000 10000000 1000000 10 2001 10050000 1005000 10 2002 10070000 100700 10 2003 10110000 1011000 10 2004 10140000 1014000 10

86
Source: Survey Study

87
Graph -6.9
Growth of Sales and Profit
Above Graph shows an upward trend in sales and profit It means this industry
was earning more profit every year because owner of this industry is highly
qualified and efficient to make correct decisions.
Table 6.10 Family occupation and last occupation of Entrepreneurs at larkana
estate area
Last Occupation of the
Family Occupation of the Entrepreneur
total Land lord
Profession
Business
Industry
entering in
manufacturing. Total No. of
entrepreneurs 83
IS 5 50 13 83
Source: Survey Study
Above table shows that the business community still constitutes the dominant source of
entrepreneurship, people from the small businesses, technicians, lawyers, land lords and
government servants arc swelling the ranks of entrepreneurs. Indeed, in Larkana district there
is domination of shaikh community on every type of businesses. Therefore most of the small
industrial units have been established by this community whereas second dominated is Hindu
community.
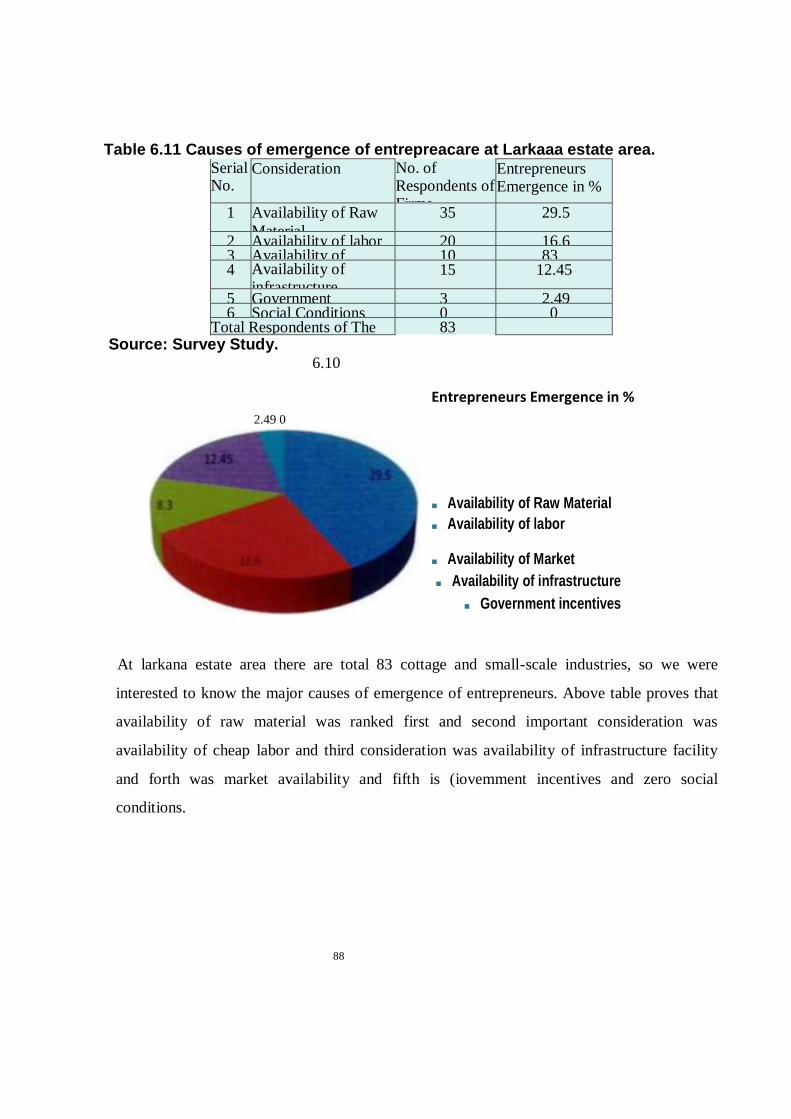
88
Table 6.11 Causes of emergence of entrepreacare at Larkaaa estate area. Serial No.
Consideration No. of Respondents of Firms
Entrepreneurs Emergence in %
1 Availability of Raw
Material
35 29.5
2 Availability of labor 20 16.6 3 Availability of
Market
10 83 4 Availability of
infrastructure 15 12.45
5 Government
incentives
3 2.49 6 Social Conditions 0 0
Total Respondents of The
Firms
83
Source: Survey Study. 6.10
Entrepreneurs Emergence in %
■ Availability of Raw Material
■ Availability of labor
■ Availability of Market
■ Availability of infrastructure
■ Government incentives
At larkana estate area there are total 83 cottage and small-scale industries, so we were
interested to know the major causes of emergence of entrepreneurs. Above table proves that
availability of raw material was ranked first and second important consideration was
availability of cheap labor and third consideration was availability of infrastructure facility
and forth was market availability and fifth is (iovemment incentives and zero social
conditions.
2.49 0
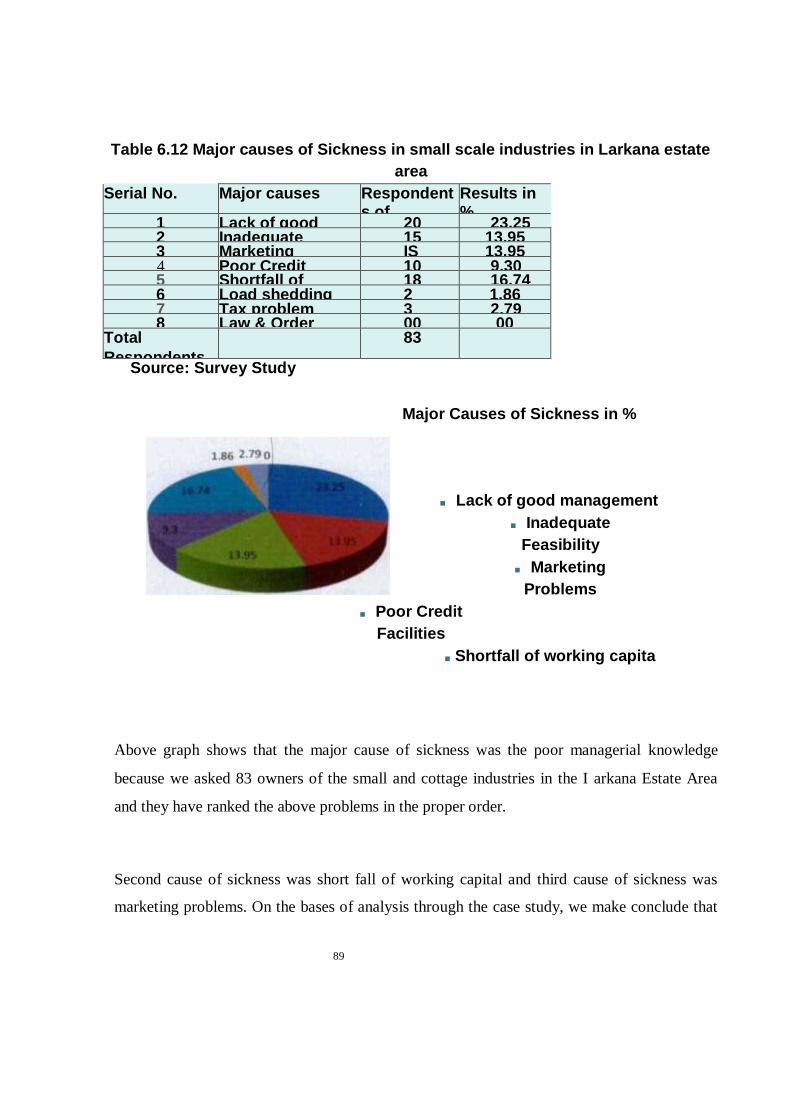
89
Table 6.12 Major causes of Sickness in small scale industries in Larkana estate
area
Serial No. Major causes Respondents of Firms
Results in %
1 Lack of good management
20 23.25 2 Inadequate
Feasibility
15 13.95 3 Marketing
Problems
IS 13.95 4 Poor Credit
Facilities
10 9.30 5 Shortfall of
working capita
18 16.74 6 Load shedding
problem
2 1.86 7 Tax problem 3 2.79 8 Law & Order
problem
00 00 Total
Respondents
of the firms
83
Source: Survey Study
Major Causes of Sickness in %
■ Lack of good management
■ Inadequate
Feasibility
■ Marketing
Problems
■ Poor Credit
Facilities
■ Shortfall of working capita
Above graph shows that the major cause of sickness was the poor managerial knowledge
because we asked 83 owners of the small and cottage industries in the I arkana Estate Area
and they have ranked the above problems in the proper order.
Second cause of sickness was short fall of working capital and third cause of sickness was
marketing problems. On the bases of analysis through the case study, we make conclude that

90
whatever may be the apparent causes but the root cause is poor management and the first
generation entrepreneurs, without proper motivation. financial base and insight in to the
problem. An inability and inefficiency to deal with these important factors, coupled with lack
of motivation and diversified interest, result in under-utilization of capacity and dearth of
working capital, cause and end in the closure of the enterprise.
6.5 Growth Rate of Established Units of Small Scale industries at lairkana estate area
Number of Projects in Operation XI00 Number of Plots
Available to the Estate
P» 86 X 100
313
= 27.47
Average income of the individual employee is 55.000 per year.
Above result show that the growth rale of small and cottage industry is 27.47
per year which is not satisfactory because the number of plots have been not
properly used. And average income of the individual employee is 55.000 per
year It proves that in luirkana Estate Area there is high exploitation of the labor
which is also indicating the inhuman behavior of the owners of the small-scale
industries with the different types of labors.
6.6 First Generation & Community wise Owners of Small Industrial Units at Larkana
estate area
Table 6.13 First Generation & Community wise Owners of Small Industrial Units
at larkana estate area.
Name of
Communit
y
No: of Units
Established
Investment in
Millions Rupee
Results in % Share
of each community
for establishment
of small industries
per year
Shaikh 27 18.738 22.41 Hindu 10 16.574 8.30 Bhutto 4 4.554 332

91
Abbasi 4 5.916 332 Mahesar 3 3.126 2.49 Barohi 2 1.020 2.49 Swmra 2 4.554 2.49 Mughal 2 1.237 2.49 Jatoi 2 1.360 2.49 Jokhia 1 0.636 0.83 Merani 1 1.765 0.83 Chachar 1 1.100 0.83
Table 6.7 Sales aad Profit positioi of oar owaer of a Bakers, ia the estate area of
I jrkaaa (The Owner of this Bakery b M.Sc. in Geography)
Graph-6.7
Growth of Sales and Profit
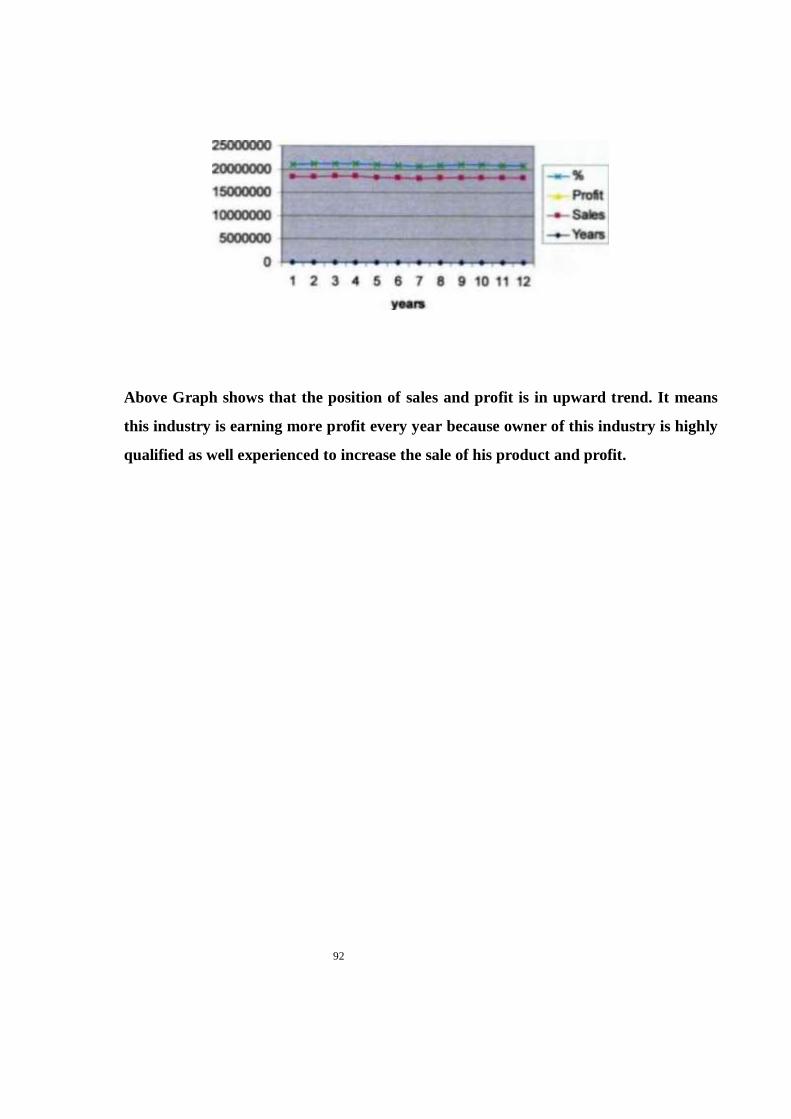
92
Above Graph shows that the position of sales and profit is in upward trend. It means
this industry is earning more profit every year because owner of this industry is highly
qualified as well experienced to increase the sale of his product and profit.
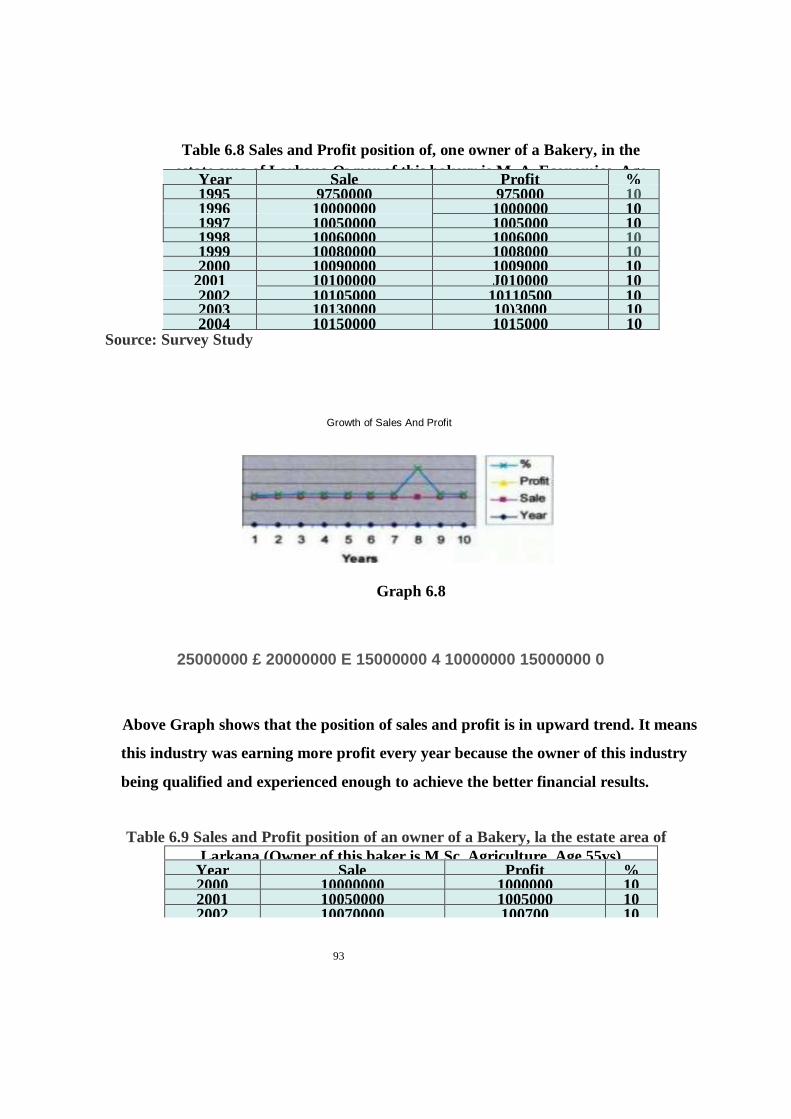
93
Table 6.8 Sales and Profit position of, one owner of a Bakery, in the
estate area of Larkana Owner of this bakery is M .A. Economics. Age
45. Year Sale Profit % 1995 9750000 975000 10 1996 10000000 1000000 10 1997 10050000 1005000 10 1998 10060000 1006000 10 1999 10080000 1008000 10 2000 10090000 1009000 10
2001 10100000 J010000 10 2002 10105000 10110500 10 2003 10130000 10)3000 10 2004 10150000 1015000 10
Source: Survey Study
Graph 6.8
25000000 £ 20000000 E 15000000 4 10000000 15000000 0
Above Graph shows that the position of sales and profit is in upward trend. It means
this industry was earning more profit every year because the owner of this industry
being qualified and experienced enough to achieve the better financial results.
Table 6.9 Sales and Profit position of an owner of a Bakery, la the estate area of
Larkana (Owner of this baker is M.Sc. Agriculture. Age 55vs) Year Sale Profit % 2000 10000000 1000000 10 2001 10050000 1005000 10 2002 10070000 100700 10
Growth of Sales And Profit

94
2003 10110000 1011000 10 2004 10140000 1014000 10
Source: Survey Study
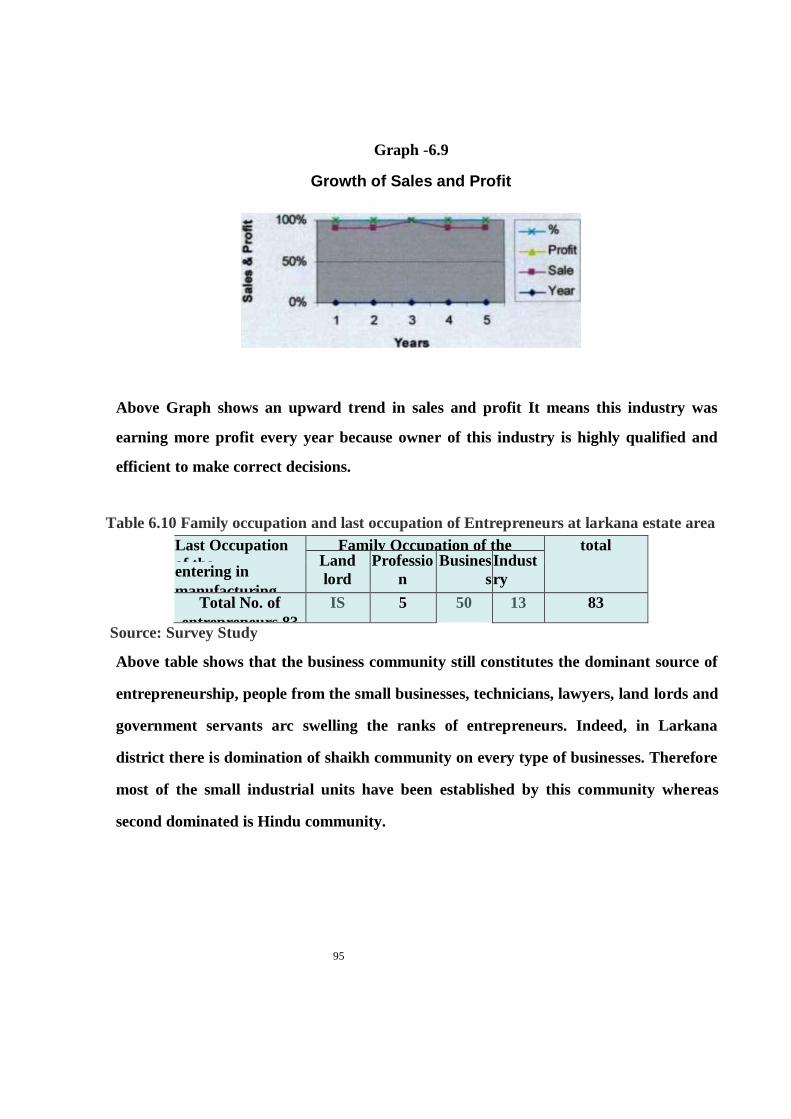
95
Graph -6.9
Growth of Sales and Profit
Above Graph shows an upward trend in sales and profit It means this industry was
earning more profit every year because owner of this industry is highly qualified and
efficient to make correct decisions.
Table 6.10 Family occupation and last occupation of Entrepreneurs at larkana estate area
Last Occupation
of the
Family Occupation of the
Entrepreneur
total Land
lord
Professio
n
Busines
s
Indust
ry entering in
manufacturing. Total No. of
entrepreneurs 83
IS 5 50 13 83
Source: Survey Study
Above table shows that the business community still constitutes the dominant source of
entrepreneurship, people from the small businesses, technicians, lawyers, land lords and
government servants arc swelling the ranks of entrepreneurs. Indeed, in Larkana
district there is domination of shaikh community on every type of businesses. Therefore
most of the small industrial units have been established by this community whereas
second dominated is Hindu community.

96
Table 6.11 Causes of emergence of entrepreacare at Larkaaa estate area.
Seria
l No.
Consideration No. of
Respondents
of Firms
Entrepreneurs
Emergence in %
1 Availability of Raw
Material
35 29.5
2 Availability of labor 20 16.6 3 Availability of
Market
10 83 4 Availability of
infrastructure
15 12.45
5 Government
incentives
3 2.49 6 Social Conditions 0 0
Total Respondents of The
Firms
83
Source: Survey Study.
6.10
Entrepreneurs Emergence in %
■ Availability of Raw Material
■ Availability of labor
■ Availability of Market
■ Availability of
infrastructure
■ Government incentives
At larkana estate area there are total 83 cottage and small-scale industries, so we were
interested to know the major causes of emergence of entrepreneurs. Above table proves
that availability of raw material was ranked first and second important consideration
was availability of cheap labor and third consideration was availability of infrastructure
facility and forth was market availability and fifth is (iovemment incentives and zero
social conditions.
2.49 0

97
Table 6.12 Major causes of Sickness in small scale industries in Larkana estate area
Serial No. Major causes Respondents
of
Firms
Results in %
1 Lack of good
management
20 23.25 2 Inadequate
Feasibility
15 13.95 3 Marketing
Problems
IS 13.95 4 Poor Credit
Facilities
10 9.30 5 Shortfall of working
capita
18 16.74 6 Load shedding
problem
2 1.86 7 Tax problem 3 2.79 8 Law & Order
problem
00 00 Total
Respondents of
the firms
83
Source: Survey Study
Major Causes of Sickness in %
■ Lack of good management
■ Inadequate
Feasibility
■ Marketing
Problems
■ Poor Credit
Facilities
■ Shortfall of working capita
Above graph shows that the major cause of sickness was the poor managerial knowledge
because we asked 83 owners of the small and cottage industries in the I arkana Estate
Area and they have ranked the above problems in the proper order.
Second cause of sickness was short fall of working capital and third cause of sickness
was marketing problems. On the bases of analysis through the case study, we make
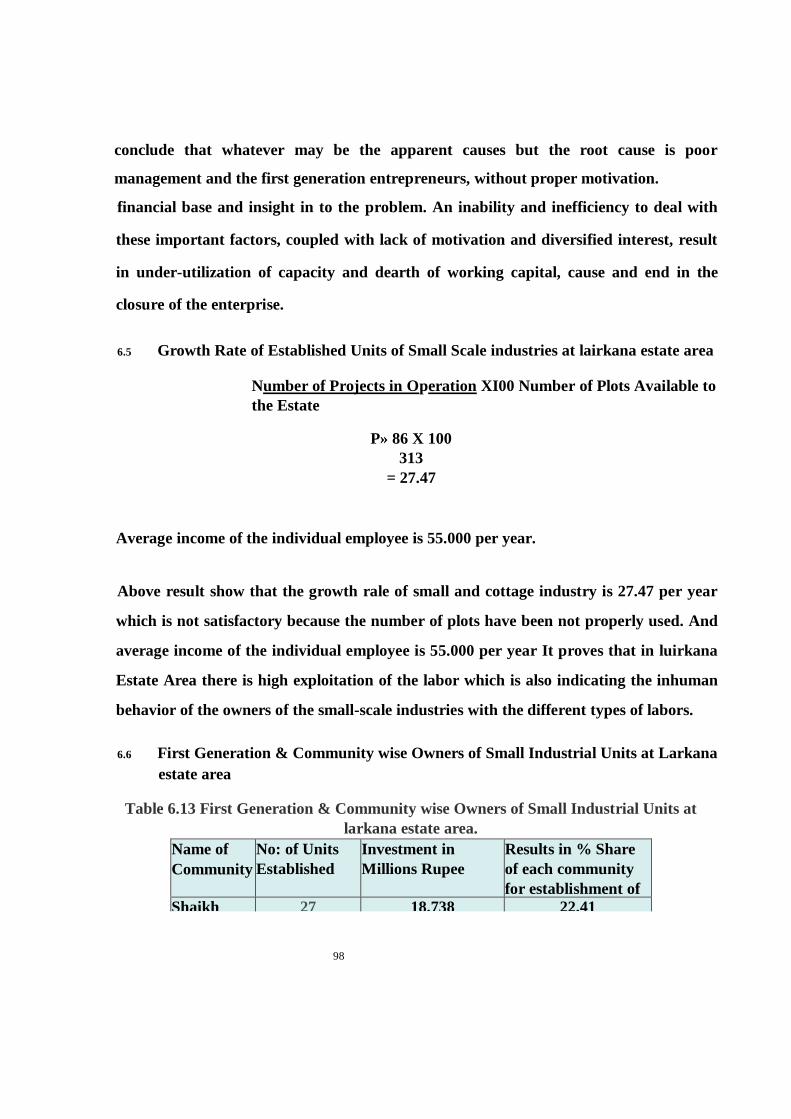
98
conclude that whatever may be the apparent causes but the root cause is poor
management and the first generation entrepreneurs, without proper motivation.
financial base and insight in to the problem. An inability and inefficiency to deal with
these important factors, coupled with lack of motivation and diversified interest, result
in under-utilization of capacity and dearth of working capital, cause and end in the
closure of the enterprise.
6.5 Growth Rate of Established Units of Small Scale industries at lairkana estate area
Number of Projects in Operation XI00 Number of Plots Available to
the Estate
P» 86 X 100
313
= 27.47
Average income of the individual employee is 55.000 per year.
Above result show that the growth rale of small and cottage industry is 27.47 per year
which is not satisfactory because the number of plots have been not properly used. And
average income of the individual employee is 55.000 per year It proves that in luirkana
Estate Area there is high exploitation of the labor which is also indicating the inhuman
behavior of the owners of the small-scale industries with the different types of labors.
6.6 First Generation & Community wise Owners of Small Industrial Units at Larkana
estate area
Table 6.13 First Generation & Community wise Owners of Small Industrial Units at
larkana estate area.
Name of
Community
No: of Units
Established
Investment in
Millions Rupee
Results in % Share
of each community
for establishment of
small industries per
year
Shaikh 27 18.738 22.41
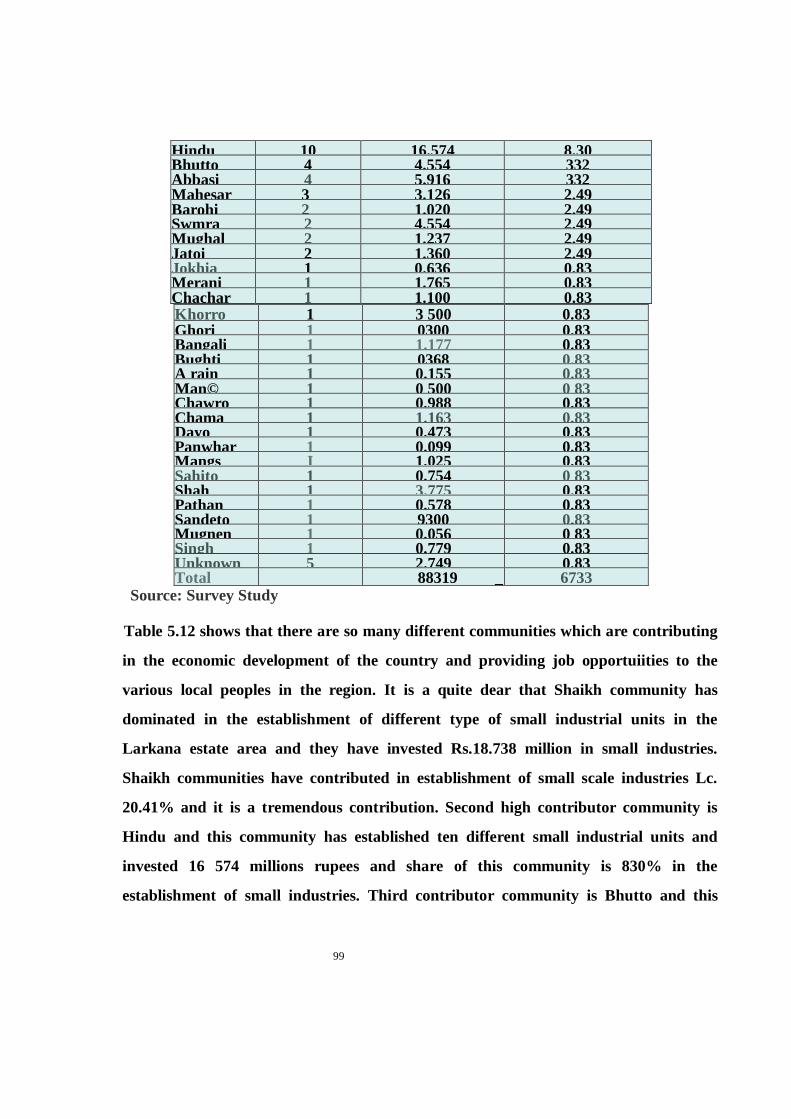
99
Hindu 10 16.574 8.30 Bhutto 4 4.554 332 Abbasi 4 5.916 332 Mahesar 3 3.126 2.49 Barohi 2 1.020 2.49 Swmra 2 4.554 2.49 Mughal 2 1.237 2.49 Jatoi 2 1.360 2.49 Jokhia 1 0.636 0.83 Merani 1 1.765 0.83 Chachar 1 1.100 0.83 Khorro 1 3 500 0.83 Ghori 1 0300 0.83 Bangali 1 1.177 0.83 Bughti 1 0368 0.83 A rain 1 0.155 0.83 Man© 1 0 500 0 83 Chawro 1 0.988 0.83 Chama 1 1.163 0.83 Dayo 1 0.473 0.83 Panwhar 1 0.099 0.83 Mangs I 1.025 0.83 Sahito 1 0.754 0 83 Shah 1 3.775 0.83 Pathan 1 0.578 0.83 Sandeto 1 9300 0.83 Mugnen 1 0.056 0 83 Singh 1 0.779 0.83 Unknown 5 2.749 0.83 Total 88319 _ 6733
Source: Survey Study
Table 5.12 shows that there are so many different communities which are contributing
in the economic development of the country and providing job opportuiities to the
various local peoples in the region. It is a quite dear that Shaikh community has
dominated in the establishment of different type of small industrial units in the
Larkana estate area and they have invested Rs.18.738 million in small industries.
Shaikh communities have contributed in establishment of small scale industries Lc.
20.41% and it is a tremendous contribution. Second high contributor community is
Hindu and this community has established ten different small industrial units and
invested 16 574 millions rupees and share of this community is 830% in the
establishment of small industries. Third contributor community is Bhutto and this
100
community has established four small industries in the estate and invested Rs.4.554
million share of this community in establishment of industries is 3.32% Fourth
contributor community is Abbasi and this community has established 4 small
industries and invested Rs.5.916 million and share of this community is 332%. Fifth
high contributor community is Mchcsar and this community has established three
small industries and invested Rs.3.126 million and share of this community in
establishment of small industrial units is 2.49% There are different communities such
as Brohi, Soomara. Mughal and jatoi. who have established only two industries. Brohi
community has invested Rs.1.020 million and share of this community is 2.49%
Soomara has invested Rs.4.554 million and share of this community is 2.49% Jatoi has
invested Rs.1360 million and share of this community is 2.49%. There are various
others communities as well such as Joktria, Merani. Chachar. Khohro. Ghori. Bangali.
Bughti. Aram. Mangi. Chawru. Chama and Dayo These
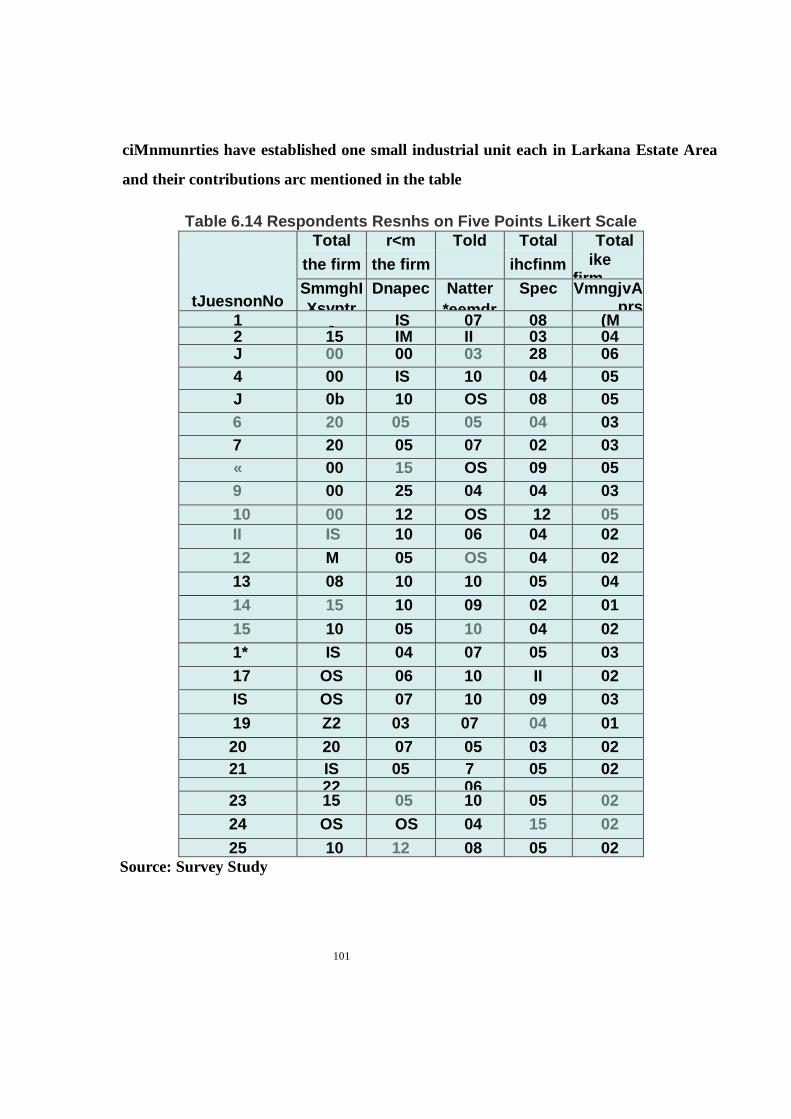
101
ciMnmunrties have established one small industrial unit each in Larkana Estate Area
and their contributions arc mentioned in the table
Table 6.14 Respondents Resnhs on Five Points Likert Scale
tJuesnonNo
Total r<m Told Total Total
the firm the firm ihcfinm ike firm
SmmghI
Xsvptr
Dnapec Natter
*eemdr
Mpre
Spec VmngjvAprs
1 - IS 07 08 (M 2 15 IM II 03 04 J 00 00 03 28 06
4 00 IS 10 04 05
J 0b 10 OS 08 05
6 20 05 05 04 03
7 20 05 07 02 03
« 00 15 OS 09 05
9 00 25 04 04 03
10 00 12 OS 12 05
II IS 10 06 04 02
12 M 05 OS 04 02
13 08 10 10 05 04
14 15 10 09 02 01
15 10 05 10 04 02
1* IS 04 07 05 03
17 OS 06 10 II 02
IS OS 07 10 09 03
19 Z2 03 07 04 01
20 20 07 05 03 02
21 IS 05 7 05 02 22 06
23 15 05 10 05 02
24 OS OS 04 15 02
25 10 12 08 05 02
Source: Survey Study

102
6.7 Category-wise Results of Small firms of Larkana Estate Area as per formula of
McClelland
Table 6.15 Category-wise Results of Small firms of
Larkana Estate Area as per formula of McClelland
FOTNO
: A B c D
1 01 01 01 00 2 01 01 01 01 3 01 01 00 00 4 01 01 01 00 5 01 01 01 01 6 01 01 01 01 7 01 01 01 01 8 01 01 01 00 9 01 01 01 00 10 01 01 01 00 11 01 01 01 01 12 01 01 01 01 13 01 01 01 01 14 01 01 01 01 15 01 01 01 01 16 01 01 01 01 17 01 01 01 01 18 01 01 01 01 19 01 01 01 01 20 01 01 01 01 21 01 01 01 01 22 01 01 01 01 23 01 01 01 01 24 01 01 01 01 25 01 01 01 01
Total
aeolB
25 25 24 19
A Category Finns B Category Firms C Category Firms D Category Firms 25x4=100 25x3=75 ' 24x2=48 19x1=19
According to above mentioned results 4 rice industries producing 80 kg. per day are A
category firm because the owners of these industries are highly qualified. One food
industry and larkana bakery is also coming in the A category as the owners of these two
industries are also capable enough because it is proved that above six entrepreneurs
have high need achievement urge according to the model of professor McClelland.
In B category firms there arc six rice industries and two from food industries total
number is eight Although, six rice industries are medium type and owner of this

103
industries are graduates and the sales of these industries is satisfactory and owners of
these industries have also possessed the need for achievement as per the model of
professor McClelland.
In C category firms there are total six rice industries and the owners of these industries
have a low outlook for achievements as per the required characteristics of the model.

104
In D category firms there are seventeen rice industries which are also coming in the
low type of industries and are producing 40 kg per day The owners of these industries
have zero level need for achievements as per the required characteristic of the model.
6.8 Economic Significance of Small scale Industries Larkana & Sukkur
Estate Area
Table 6.16 Economic Significance of Sauli scale Industries Larkana A Sukkur Estate Area
Cluster Export Investment Prodnctioa Employmen
t larkana Estate
area (Sindh)
Pakistan
1157 Mifiions
Rice Industries 13
Millions MT
exported per
year.
106681
millions
40140 MT
23 Millions
Tons per
Year,
produced
rice
industries
914 only
estate 6000
Larkana
District
Rice
Industries Other
industries 00 173 Millions 1330
millions
Employmen
t 1500
Sukkar Estate
Area (Sindh)
Pakistan
000 61324 171600 MT
Flour Mills
Poultry
forms
Furniture
industrv
42617
Millions
other
industries
1191
Source: Survey Study
6.9 Regression Analysis of Small firms of Ineducated samples of Larkana
The regression equation is
Total sales of 14 years = 6066504 + I 92 Total Net Profit of 14 years Predictor
CocfStDev T P Constant 6066504 120688 5027 0000
Total Nc 1.9201 0.1865 1029 0.000
S - 62664 R-Sq = 89.1% R-Sqfadj) = 882%
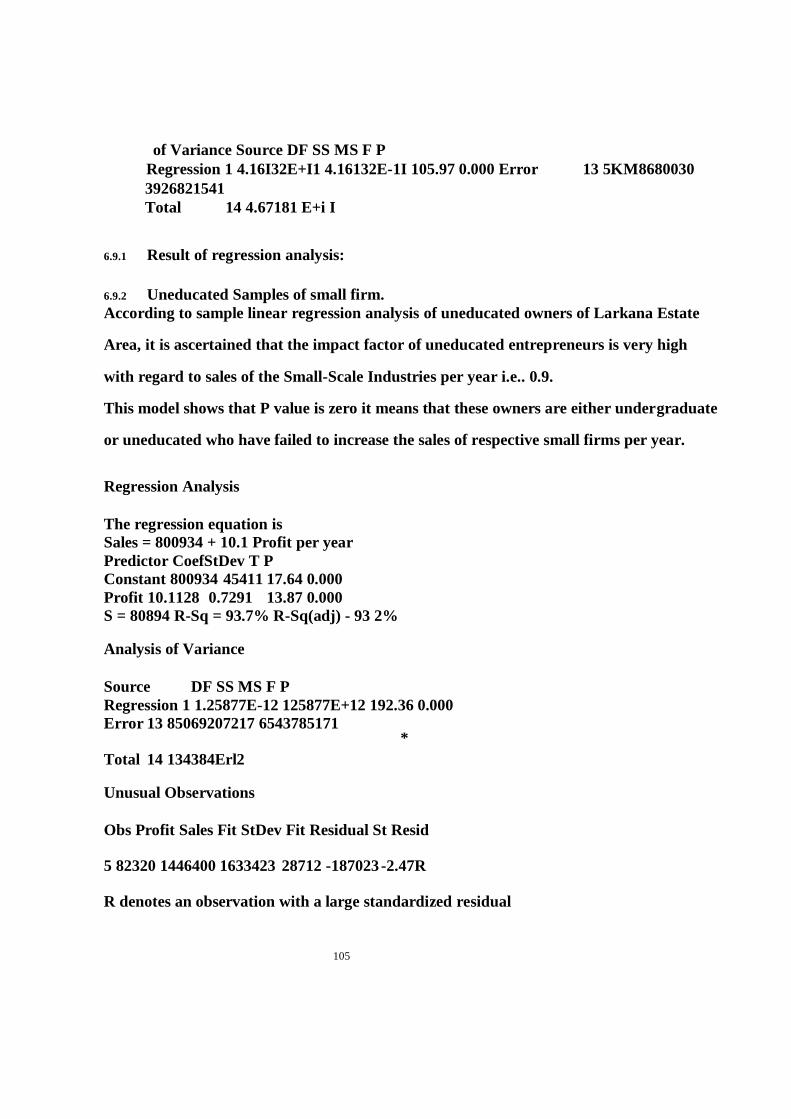
105
of Variance Source DF SS MS F P
Regression 1 4.16I32E+I1 4.16132E-1I 105.97 0.000 Error 13 5KM8680030
3926821541
Total 14 4.67181 E+i I
6.9.1 Result of regression analysis:
6.9.2 Uneducated Samples of small firm.
According to sample linear regression analysis of uneducated owners of Larkana Estate
Area, it is ascertained that the impact factor of uneducated entrepreneurs is very high
with regard to sales of the Small-Scale Industries per year i.e.. 0.9.
This model shows that P value is zero it means that these owners are either undergraduate
or uneducated who have failed to increase the sales of respective small firms per year.
Regression Analysis
The regression equation is
Sales = 800934 + 10.1 Profit per year
Predictor CoefStDev T P
Constant 800934 45411 17.64 0.000
Profit 10.1128 0.7291 13.87 0.000
S = 80894 R-Sq = 93.7% R-Sq(adj) - 93 2%
Analysis of Variance
Source DF SS MS F P
Regression 1 1.25877E-12 125877E+12 192.36 0.000
Error 13 85069207217 6543785171 *
Total 14 134384Erl2
Unusual Observations
Obs Profit Sales Fit StDev Fit Residual St Resid
5 82320 1446400 1633423 28712 -187023 -2.47R
R denotes an observation with a large standardized residual
106
Durbin-Watson statistic • 1.42
Lack of fit test
Possible curvature in variable Profit (P - 0.084)
Overall lack of fit test is significant at P = 0.084
Pure error test - F ” 1.33 P ” 0.5963 DFipure error) = 1
1.1 rows with no replicates
6.10 Result of regression anatysis of education of small firms of Larfcaaa Above
model has proved that “x” is significantly related to “y” it proves that slope is
significant at the 03 this test is shows strong evidence is proved to the null hypothesis
Over all fit test is proving that there is insignificant error Le. 1.00.
This R.sq. test has also found the high reliability and validity of model Le. nearer to
1.00
Graph- 6.12
Histogram of the Residuals
(response s Qualfic)

107

108
Graph -6.13
Normal Probability Plot of the Residuals
(response s Quallttc)
Graph-6.14
Residuals Versus the Fitted Values
(response Is Qualific)
Resid
ual
R
esi
dual

Grapb-6.17
109
Residuals Versus the Order of the Data
(response s Qualfc)
Observation Order
Results of histogram of residuals, normal probability plot of the residuals, residuals
versus the fitted values and residuals versus order of the data response is qualification
Graphs 5.10. 5.1 1,5.12 & 5.13
Above results clearly show that education has a high impact over the sales R2” 93.7% the
model selected is appropriate.
To examine the overall impact of education (qualification) P-Value obtained is 0.084
which proves the hypothesis that more qualified entrepreneurs cause high sales output
The difference of the observed and predicted values shown in the residual plots is in
obvious positive pattern of relationship between two variables such as in graph 5.11 the

110
close association of the variables is shown higher is the qualification related with higher
are the sales. From the graph 5.13 the increase sales prediction can be seen. Although,
the general trend specifies the increasing sale with the qualification standard
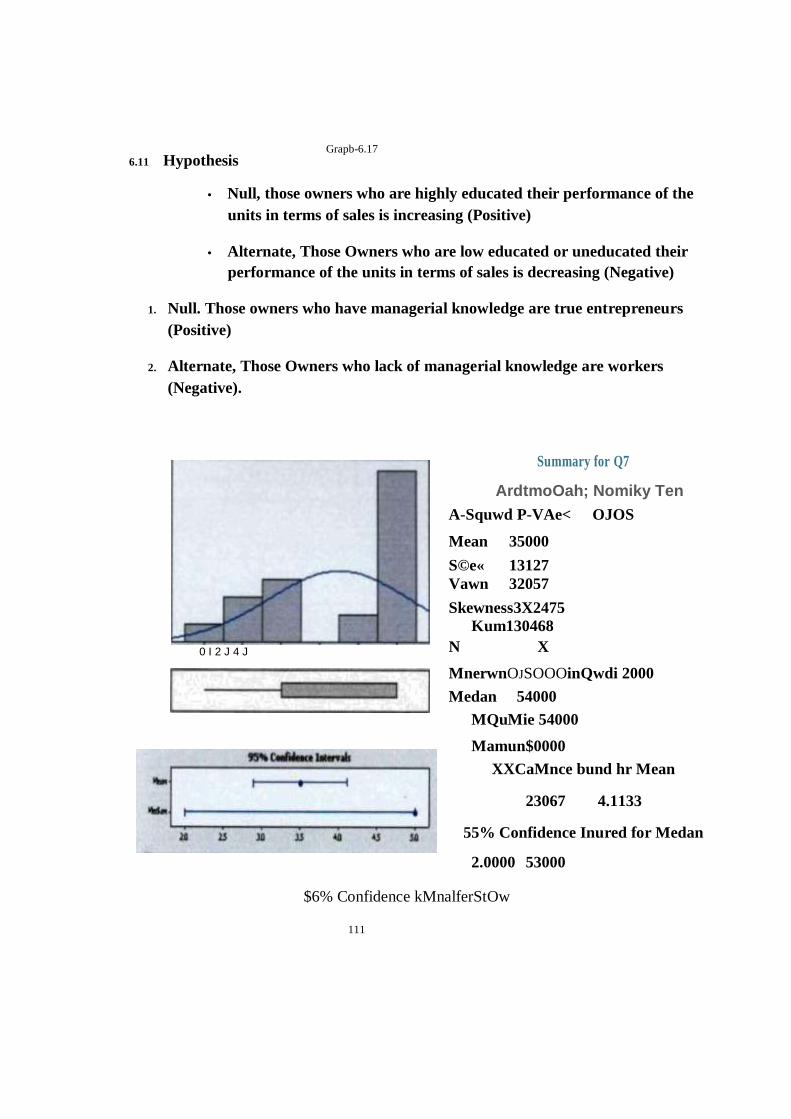
Grapb-6.17
111
6.11 Hypothesis
• Null, those owners who are highly educated their performance of the
units in terms of sales is increasing (Positive)
• Alternate, Those Owners who are low educated or uneducated their
performance of the units in terms of sales is decreasing (Negative)
1. Null. Those owners who have managerial knowledge are true entrepreneurs
(Positive)
2. Alternate, Those Owners who lack of managerial knowledge are workers
(Negative).
Summary for Q7
ArdtmoOah; Nomiky Ten
A-Squwd P-VAe< OJOS
Mean 35000
S©e« 13127
Vawn 32057
Skewness3X2475
Kum130468
N X
MnerwnOJSOOOinQwdi 2000
Medan 54000
MQuMie 54000
Mamun $0000
XXCaMnce bund hr Mean
23067 4.1133
55% Confidence Inured for Medan
2.0000 53000
$6% Confidence kMnalferStOw
0 I 2 J 4 J

112
1.4702 23ft
Source: Survey study

Grapb-6.17
113
AndenofrOAnqNornukty T«
ASouwdMl
p-vAt< o-ocs
Mew 22500 $©»» 1(453
VAnt 22071 SltewnenOSimrutost
-120545
N X
Mhmun 04)000
IflQuwie !J»00
Me4» 14)000
WQueA 44)000
Otonum 54)000
55% Coridtna Into J ft* Mew
UIS 2M7
55%C«MwcelrtoalforMedw
1.0000 34)000
«%C«*denceIntoifw$iDe*
1JX 2.14(2
Summary for Q8
Source: Survey
study

114
Graph-
6.18
Summary for
Q9
95% Confidewe Intervals
AndersoyDatlngNotmabty Tea A-Sqjwd
P-Vaiue<
7.90
ooes
Mean !£M4
StDev 0X242 Vanaree 03897 Simes -1.92397 Kurtox 25284 N 38
Mnrun OOXlO
la Quade
20000
Mdur. 20000 3d
Quade
2JK0O
Mamum 24)000 35% Confidence Interval hr Mean 1.432 1.9057
55% Confidence Interval hr Median 2.0000 2O000
35% Ccrfidence Interval hrStDev
05X3 0X143
Source: Survey
study

Graph- 6.23
115
Anderwo-DafingNcmaky Tea
A-Sguand1233
P-Value <0305
Mean13889
SlDe* 0.«4
Variance02159
Sleswess-4,0514
Kurtosis152596
N X
Mrwxm 03000
IstQuartie 23000
Medai 2.0000
id wartie 2-0000
Mannum 2.0000
95% Ccnfidence Intend fix Mean
1J317 2M1
95% Confidence Intend fix Medan
23000 23000
95% Confidence Intend fix StDex
03X8 03061
Summary for
Q10
Source: Survey study
95% CMUMte laterxJs
IB ID LT ISO IS ZOO 115

Gmpb-6.20
116
AndewhD«foqNonruity Test
A-Squwd 4.70
P-VAe< OJOS
Mew 10550 9D«042«
Vwwct 0J%8
Skewnen 008727 Kunczl.W
N %
Mnnm 0J00O
IsQuwde LOOK Med* 1J000
MQuMie IJ000
Murrw 3J000
95«C«iMeKe Intend for Mew
03424 12M7
«%CwM«nc»iniert»fwMedw
:M® IJOOO
%%C4f6deKeIi*en^forSiDe¥
OSIN 0J217
Source: Survey
study
Summary for Q13
95S CtaliiMte iMemb
U M 14 U U U
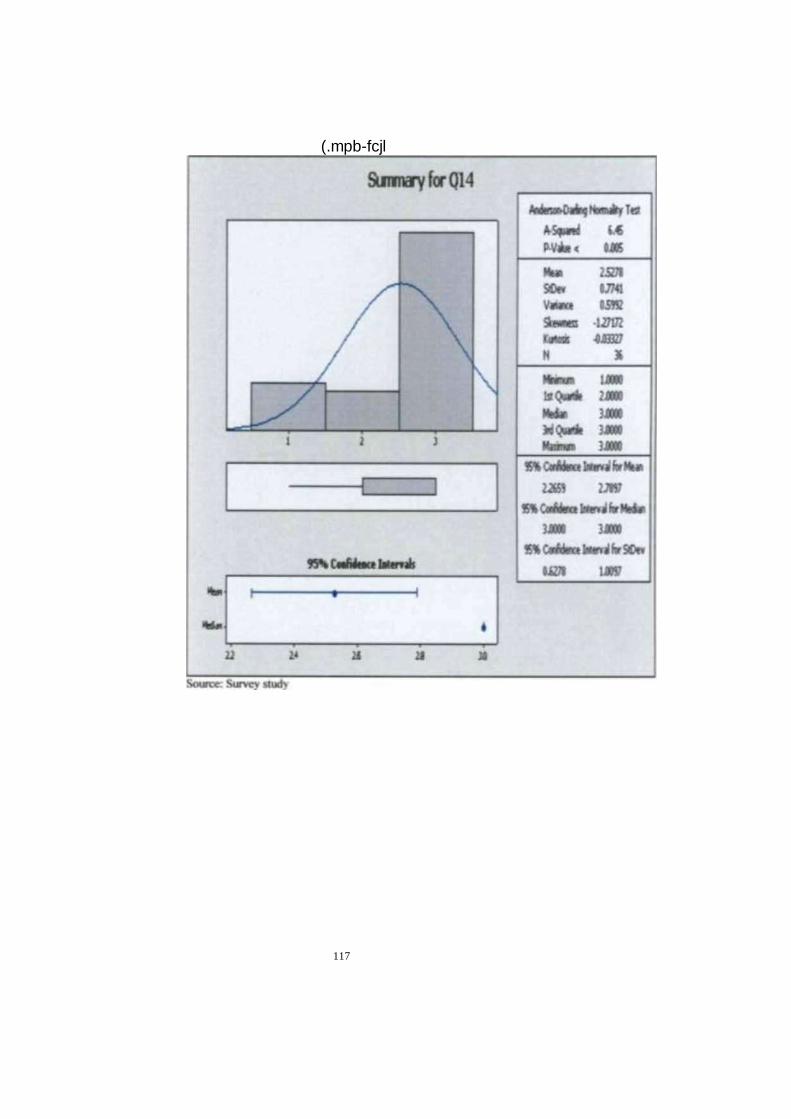
117
(.mpb-fcjl

Gr*pb-K22
118
Sunray for Q15
A-S^ SA
W*e< MS Me* um
se*. MM V*«t 05771 Sbwi
es
•L77W Kiras 151132 N X
Merur LJOCC
btQuMk
3M0
Med* 3JM kCw* iMO
Kanr 440®
SVurMreetamiryMe* 2*€2 3.1123
3AK •40®
««<*UBoMiirSOn
04820 128B
Sourer: Survey
study

Graph- 6.23
119
Source: Survey study
For the field study survey, the cluster sampling was used. The total 36 samples were
selected from the Larkana estate area. 15 questions were set to ask within the samples
framework but the responses upon 8 questions were received. We have found high
relationship impact of high education, managerial knowledge, technical knowledge and
feasibility report on the sales of the small scale industries. To examine the overall
impact of above mentioned variables P- Value obtained is 0.005.
Summary for
Q16

Graph- 6.23
120
Above graph shows that the limit set were within 5.0 to -10 and 35 different
respondents wen: incorporated for the process proportion / control chart In this regard
Mega Stat software is used. This graph shows that the process proportion of the
respondents is under control and that the responses over few questions are
underestimated and incorrectly responded. However, those respondents arc predicted
as lower in knowledge and qualification.
Graph on page no 100 & 101 arc also showing the same results.

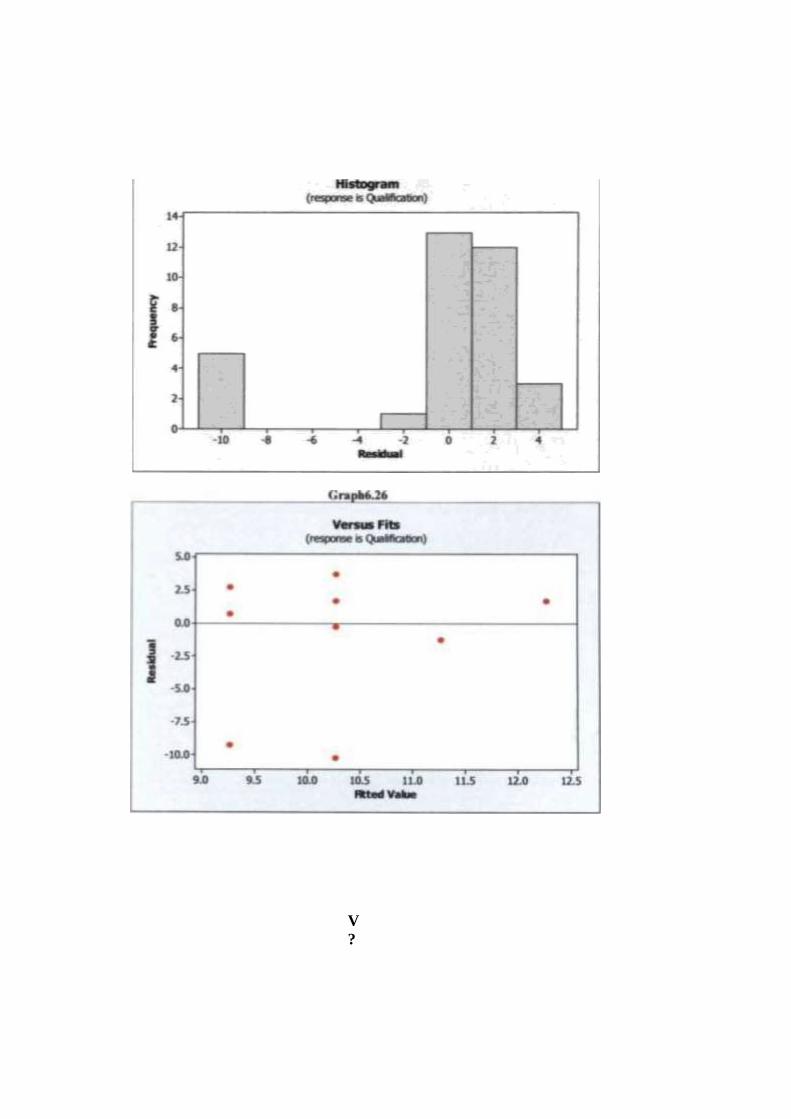
V
?


Graph 6.27
98
Normal Probability Plot
(response is Qualification)
Source: Survey study
6.12 Regression analy sis Versus Respondents of 1 .arkana small firms on five
points Likert scale.
Table-6.17
Case Processing Summary
Cases Included Excluded Total N Percen
t N Perce
nt N Perce
nt Strongly Disagree
• Question Number
25 1000%
0 0%
25 100 0% Disagree *
Question Number
25 100 0%
0 0% 25 100 0%
Nertner Agree not Disagree • Question Number
25 100
0% 0 0% 25
100 0%
Agree "
Question
Number
25 1000%
0 0%
25 100 0%
Strongty Agree *
Question Number
25 100 0%
0 0% 25 100 0%
8 Limited to first 100 cases

99
Table 6.IS Descriptive
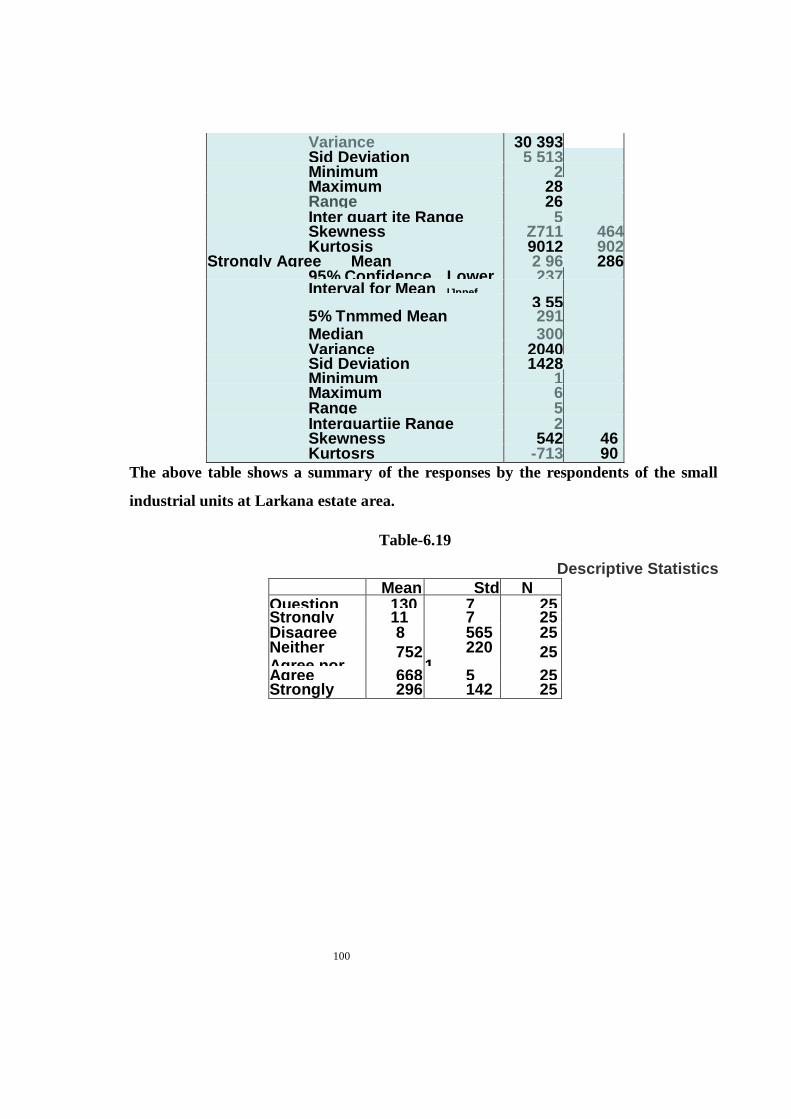
100
Variance 30 393 Sid Deviation 5 513 Minimum 2 Maximum 28 Range 26 Inter quart ite Range 5 Skewness Z711 464 Kurtosis 9012 902
Strongly Agree Mean 2 96 286 95% Confidence Lower Bound
237 Interval for Mean lJppef
Bound
3 55
5% Tnmmed Mean 291
Median 300 Variance 2040 Sid Deviation 1428 Minimum 1 Maximum 6 Range 5 Interquartiie Range 2 Skewness 542 46
4 Kurtosrs -713 902 The above table shows a summary of the responses by the respondents of the small
industrial units at Larkana estate area.
Table-6.19
Descriptive Statistics
Mean Std Deviation
N Question Number
1300
7 360
25 Strongly Disagree
11 28
7 924
25 Disagree 8
56
5657
25 Neither Agree nor
Disagree
752 2201
25
Agree 668 5 513
25 Strongly Agree
296 1428
25

101
Table 4J0
Correia Oom
Quest
ion
Numb
er
Strongly
Dwgroe
NeOer Agree'
nor
DwgroeAgroe
Stron
gly
Agroe
Droagroe
Pearson CorroMic Question Nixntoi
Strongly Dwgrt
1 OOO
448
446
1000
•278
653
003 -165
003 -578
-737
•738 Dieagroe ■ m 553
1 000 - 021 -148 266 NatVwrA
groe n
Dwgroe
—- 003
003
■021 1000 - 354 007
Agroe • IM -578
.148 -384 1000 522 Strongly
Agroe
-737
-735
256
007 522
i OOO Sig (1-<aaad) Question Nwnoi
Strongly Osagn
013
013
089
000
496 215
494 001
OOO
OOO
Owgros OM
000
460 241
099 Neither
Agroe n
Droagroe
496
4M 480
. 029 487
Agroe 215
001
241
029 004 Strongly
Agree
000
OOO
099
487 004
• N Question Nwn»
25
25
25 25 25 25 Strongly Otaagn
25
25
25 25 25 25 Disagree 2
5
25
25 25 25 25 A^reaHI
25
25
25 25 25 25
Agrae 25
25
25 25 25 25 Strong.'y Agree
25
25
25 25 25 25
The above correlation table proves that there is a high relationship of qualified
respondents with the required qualities to be a successful entrepreneur i.c 0.7 correlation
at Larkana estate area It is crystal clear that high education is a strong factor by which
Pakistan can increase the growth of small scale industries
Table 6.21
Model Sunvnai^
t> Dependent VanaOieQueesonNkanber
Table 6.22
ANOVA0
Mooe Sum of
Square
s
df Mean
Square F Sq
1
Regross
cn
Residua
l Tcta
82C0
43 479
967
1300
000
4
20
24
206 011
23 996
9 543
000*
a Predictors (Constant) Strongly Agree Neuner Agree nor Disagree Disagree

102
Agree
6 Dependent Variable Question Number
The model applied for the finding the impact of education over responses. The model is
suitable and applicable R =0.794 and R*—0.631 This also shows the responses are
closely related with respondents.
Table-6.23
Coefficient*
Moor
Unsandardt
zedCoe^oe
nfj
StmdardtzM t Sig
Correlations
8 StO Error
Bets Zero-order
Partial
Part (Consta
nt)
Disagre
e
19 402
053
041
3.916
267
001
793
-278 059 036
Neither
Agree
nor
Disagre
e
556
523
166
1 064 300
003 231 145
Agree 543
26t 407
2 081
060
-165 422 283 Strongl
y Agrei -
4956
951
-962
-5211 000
-.737 -759 -708 • Dependent Variable Queeton Number
6.13 Conclusions & suggestions
This study has found significant co-relationship between educated entrepreneurs and
growth of sales per year The various regression models have been applied to find out the
impact of education on the respondents required traits. In this regard it is found that
there is high co-relationship 0.7 over the response of qualified respondents towards
required competent traits. The test results of the equality of variances. The significant
values tell us that the samples taken are not dependent on each other. T- test for equality
of samples are applied hence sample are equal and independent in selection The model
applied for the measuring the impact of education over responses are suitable and
applicable at R=0.794 and R:“0.631. This also shows that the responses are closely
related with the respondents Indeed, it is crystal clear that, in Larkana estate area, the
most of owners of small-scale industries are family concern

103
with centralized management structure. In the simple words it can be said that there is
one man show. This gives the picture of highly-unprofessional management with very
little emphasis on the professionally qualified management due to the lack of education
or low level education
The over whelming majority of firms representatives are conservative-oriented because
they are not capable to critically examine and interpret financial statements such as.
balance sheet, return on investment, and breakeven analysis and workout ratios to keep
them in taking timely corrective measures
The policy makers and the concerned department of Sindh Small Industries Corporation
(SSIC) have not so far promoted the small industries in I,arkana estate area. Now it is
very important for the SSIC. Government, banks and other concerned departments,
they must give the opportunities to the graduates in economics, commerce and business
administration field because the candidates of these fields are highly capable to run the
small firms more effectively and efficiently rather those who are uneducated and have
merely business experience.
It ts a fact that Small Business Administration of America has opened many offices near
all universities and colleges of various states for the purpose of hunting the prospective
candidates who are interested to invest and launch an independent business in the
America. Small Business Administration of America is providing technical and finical
assistance to the willing candidates for promoting the small-scale industries in America.
SBA has provided training facilities to the ten million entrepreneurs through seminars,
workshops and counseling sessions in the field of management and marketing
SBA has provided in each estate of small-scale industries well equipped infrastructure
104
like roads, electricity, hospitals, libraries, gas, telephone, and internet and E- Commerce
facilities.
The most units of small-scale industries are sick due to the absent of proper feasibility
report, and such units were declared sick since beginning in the estate area of Larkana
while others were sick due to the lack of working capital, wrong choice of financiers,
high interests payments, frauds, corruption, lack of financial control and absence of
costing sy stem and delay in the release of funds by banks or financiers.
Through the field study wt found that, in the all sample firms, there is no concept of
hands-some salary and wages for the efficient workers. They are giving low wages and
meager salary to the regular and daily wages workers.
a
Through the survey method we have found that there is low growth of small-scale
industries in the Larkana estate area due to the lack of proper motivation of first
generation entrepreneurs and U-turn in government policies.
We have used the simple linear regression model and found relationship between high
education with the better growth of sales per year and so we have also found a
relationship between the low education / illiterate with lesser sales per year.
The following measures may be Uken to reduce the incidence of industrial sickness and
increase growth of small-scale industries particularly in Larkana region and generally in
Sindh.
1. The man behind the project plays a vital rote in the sickness of the firm. In the case
of first generation entrepreneurs, financial agencies and SS1C department must
105
select the enterprise very carefully and evolve a through screening mechanism
regarding their qualification and past business experience and managerial
knowledge
2. Project appraisal should be more realistic with best standards of monitoring and
evaluation sy stem.
3. As far as possible, some professional experts should be appointed for designing the
realistic project feasibility, and counseling the entrepreneurs about the
management and marketing field.
4. Processing and milling of PADDY in Larkana is controlled by the private sector.
All most all of the rice mills in Larkana are using obsolete very old technology to
mill the rice. For better quality, it would be necessary to modernize the all rice
mills for the purpose of cleaning, de stoning polishing and grading the rice.
5. .As far as rice milling by- product husk. bran, and broken - are concerned, it was
found that Sindh is not getting the potential benefits from by products of rice
milling. The husk is used as fuel for brick making, bran is used as animal feed, and
the broken rice is sold in the domestic as well as in the international market at low
prices. Manufacture of edible oils is potentials use of bran. This edible oil could be
produced as an import substitute for soybean oil and palm oil.
6. The head office of the SSIC must make some provision for work shops, trainings to
the new and old entrepreneurs in all estate area of Sindh. The department must get
the lesson from the dynamic role of (SBA) Small Business Administration of
America for promoting and expanding the pace of small-scale industries on sound
footings.
7. During the field study we found that, the role of chamber of commerce and
industry Larkana was not satisfactory because when we met with the concerned

106
officials about the annual reports of small-scale industries they said that we arc not
making the annual reports
8. We found that the chamber of commerce and industry Islamabad has developed
collaboration with the National University of Science and Technology (NUST) at
Rawalpindi for the purpose of providing professional trainings to the
entrepreneurs of Islamabad and Rawalpindi.
Source Annual Report 1998-99 (ICCI).
9. The SSIC must establish a research cell. The main function of research cell should
be collecting the pertinent data from all units of the district for monitoring
analyzing and finding the solution of problems which are being faced by the
entrepreneurs.
10. The SSIC must hold seminars, exhibitions, work shops and lecture program and
corner meetings w ith the different people of the society for the purpose of
encouraging to invest in small industries in Sindh.
11. Though the field study we found that Larkana is cultivating the large scale
production of guava and tomato so it suggests that this area is feasible for guava
pulp processing industry and tomato ketchup industry. More over, paper board
industry is also feasible due to waste available out of PADDY.
12. As we have already indicated that the directorate of SSIC has not been playing the
desired role for expansion and promotion of Small-scale Industries in I arkana
estate area so there is dire need for establishing a separate institute, such as. Sindh
Institute of Standard and Industrial Research for the purpose of promoting and
developing the small scale industry in Sindh. In this regard, government of Sindh
may like to establish the (SISIR) and this institute should

107
be a separate statutory board to provide industries in Sindh with standardization
and better services. The main functions of this institute may include.
• Testing and verification of industrial projects, analysis and design of Sindh made
goods.
• Providing free consultancy services.
• Drafting and promulgating of Sindh industrial standard.
• The main role of SISIR is to promote and up grade quality technology levels in
manufacturing sector and export technical assistance.
The service will be provided by SISIR through multi disciplinary team comprising of
Scientists. Engineers, Economists. Technologists. Quality control professionals and
experts of Management & Marketing fields.
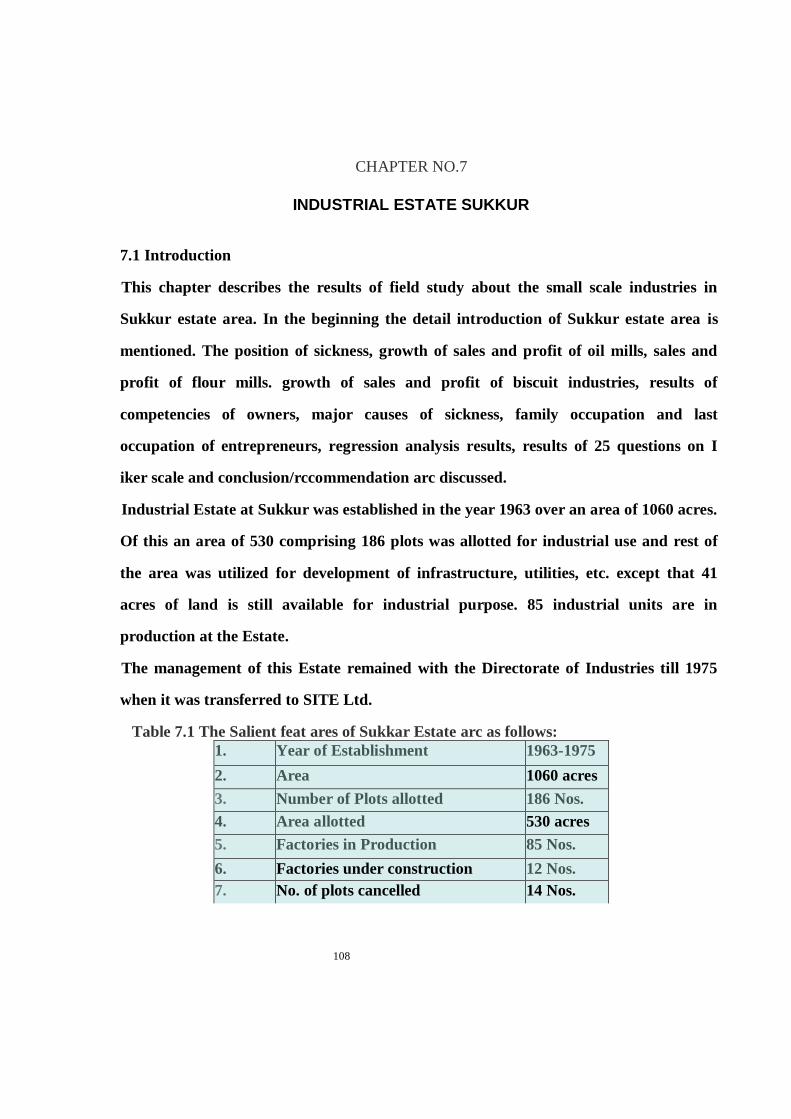
108
CHAPTER NO.7
INDUSTRIAL ESTATE SUKKUR
7.1 Introduction
This chapter describes the results of field study about the small scale industries in
Sukkur estate area. In the beginning the detail introduction of Sukkur estate area is
mentioned. The position of sickness, growth of sales and profit of oil mills, sales and
profit of flour mills. growth of sales and profit of biscuit industries, results of
competencies of owners, major causes of sickness, family occupation and last
occupation of entrepreneurs, regression analysis results, results of 25 questions on I
iker scale and conclusion/rccommendation arc discussed.
Industrial Estate at Sukkur was established in the year 1963 over an area of 1060 acres.
Of this an area of 530 comprising 186 plots was allotted for industrial use and rest of
the area was utilized for development of infrastructure, utilities, etc. except that 41
acres of land is still available for industrial purpose. 85 industrial units are in
production at the Estate.
The management of this Estate remained with the Directorate of Industries till 1975
when it was transferred to SITE Ltd.
Table 7.1 The Salient feat ares of Sukkar Estate arc as follows:
1. Year of Establishment 1963-1975
2. Area 1060 acres
3. Number of Plots allotted 186 Nos.
4. Area allotted 530 acres
5. Factories in Production 85 Nos.
6. Factories under construction 12 Nos.
7. No. of plots cancelled 14 Nos.

109
S. Plots allotted and lying vacant 88 Nos.
9. Area covered by Board ISO acres
10. Area covered by Departmental Use 5 Acres
II. Area under Low Cost Housing
Scheme
39 acres
12. Land available for allotment 412 acres

110
Table 72 Category-wise Small and Cottage Industries at Sukkar Estate
1. Ice A Cold Storage Units 19 Nos.
2. OIL Cooking Oil Scwp 20 No,
3. Chemicals 05 Nai.
4. Cotton 05 Nas.
5. Poultry 1 arm 12 NOB.
6. Soap 09 Nod
7. Hour Milk 10 NOB
8- Dal Factory 07 Nos
9. Agriculture Equipments 07 Nos.
10. Bocragcs 03 Nos.
II. Ghee 02 Nos.
12. 1—— J fVLrjuiiinn 1 CMMJ HIM-CAS 1 ng
13 Nos.
13 niMKJWOfX 10 No.
14. Pharmaceutical 01 No.
15. Marble 01 No.
16. Plastic 02 Nos.
17. * 02 Nos.
18. Pipe Factory 03 Nos. 19. 1 hinting 02 Nos.
20. tobacco 01 No.
21. Leather 01 Nos.
22. electronic 01 Nos.
23. Wool Unit 02 Nos.
24. Enginecrmg 14 Nos.
25. Re-Rolling 03 Nos
26. 1 l(J5KT> 'InuIiicn 15 07 Nos.
27. Textile 04 Nos.
28. Police Station 02 Nos.
29. Training Centre/School 03 Nos.
30 Mi seellaneuus 15 Nos. Total 186
Source: Industries. Commerce & Mineral Development Department Government of
Sindh & SSIC.
7 J Materia h a ad Methods
During the year 2004 al Sukkur estate area 113 cottage and small-scale industries
were in operation. After careful field study of Sukkur Estate area, we selected 49

111
different small industrial units as per the definition of Stale Bank of Pakistan. For
analysis of data we have used regression model as the best suitable statistical
techniques for analysis of data and interpretation of results. Moreover, some data are
analyzed on the basis of responses of respondents. The details of analysis of data are
available on the various appendices from A to H.
7 3 Position of Sickness Rate at Sukkar Estate Area
Table 73 Position of Sickness Rate at Sakknr Estate Area
Years Number
s of suits
became
sick
Numbers of
u ntfi) ph»v td
Total cost
of units la
millions
Rs:
s rale in
%
Reasons of
Sickness
1978 1 12 0275 0.17 Lack of
demand 1979 1 7 02 0.19 Lack of
demand 1980 • - • - • •
1981 * • • - •
1982 • • • • •
1983 • • - • •
1984 • - • • -
1985 1 12 1327 0.66 Managerial
inability 1986 1 14 1378 0.79 Managerial
inability 1987
1988 1 5 028 0.8 Managerial
inability 1989
1990 1 5 0.12 0.81 Lack of
demand 1991
1992 1 12 1.69 0.82 Managerial

112
inability
1993 2 24 1.536 1.66 Inadequate
feasibility 1994 11 92 8.705 9.13 Managerial
inability
1995 22 134 20.837 10.2
8
Managerial
inability
1996 5 43 2331 4.19 Managerial
inability 1997
1998 3 23 2.267 2.53 Mfliuigcnsi
inability 1999 - - - •
2000 1 10 0.07 1.86 l.ack of
demand 2001 - - - • -
2002 - - • • •
2003 - • - - -
2004 2 24 1.833 1.78
inability
Total 53 417 43.049 35.67
Source: Survey Study
Graph-7.1
Postion of sickness at sukkur estate area

113
In the year 1978 only one unit was closed and total 12 peoples were unemployed and the
sickness rate was .17. In the year 1979 one unit was closed and 7 people were unemployed
the rate of sickness was .19 in the year 1985 one unit was closed and total 12 people were
unemployed and rate of sickness was .66. In the year 1986 one unit was closed and 14
people were unemployed and the rate of sickness was .79. In the year 1988 one unit was
closed and 5 people were unemployed, the rate of sickness was .8. In the year of 1990 one
unit was closed. In the year 1992 to 1995 the total number of 26 units closed and sickness
rate was also increased like 21.87. During the year 1996 to 2004 11 units became sick and
sickness rate was 1036.
7.4 Growth of sales aad profit of varioes small firms at Sakkar estate area Table 7 A
Growth of sales aad profit of five oil mills at Sakkar estate area, the owners of these mHb
are Matriealateaadlatermcdiate.
Years Sales Profit %
1990 60000000 3000000 5%
1991 509000000 2950000 5%
1992 507060000 2853000 5%
1993 56870000 2843500 5%
1994 56080000 2804000 5%
1995 51090000 2554500 5%
1996 50880000 2544000 5%
1997 409075000 2453750 5%
1998 408587000 2429350 5%
1999 401090000 2004500 5%
2000 40080000 2004000 4%
2001 40050000 1602000 4%
2002 40030000 1601200 4%
2003 40020000 1200600 3%

114
2004 40010000 1200300 3%
Total 729922000 34000700
Soarce: Survey study of Sukkur estate area.

115
Graph-7.2
Growth of sains and pro* of Mm oi mSs at Sukkur estato arna.
Above graph shows that the sales were declining from the year 1990-99. but profit was
5%. In the year 2000-2002 the sales were further declined and profit was also decreased
up to the 4% . In the year 2003-04 sales were sharply declined and profit was also
decreased. Keeping in view the above picture of the sales and profit it can be concluded
that the owners of these mills were not capable enough to tackle the declined trends of
sales and profit The gloomy pictures of these industries arc proving that owners were
unaware regarding the strategic management and marketing management.
It is crystal clear that the owners of these industries are family concern with flat
management structure. In simple words it can be said that it reflects ONE MAN SHOW
by unprofessional owners.
Tabic 73 Growth of sales and profit of oil mills owners who are Graduate at
Sukkar estate area. Total numbers of owners are five.
Years Sales Profit %
1990 62000000 1300000 5%
1991 61000000 3050000 5%
1992 60000000 3000000 5%
1993 60000000 3000000 5%
1994 58020000 2900000 5%
1993 51000000 2550000 5%

116
1996 50000000 2500000 5%

117
1997 48000000 2400000 5%
1998 464XXXXX) 2300000 5%
1999 48000000 240000 5%
2000 49000000 2450000 5%
2001 50000000 2500000 5%
2002 52000000 2600000 5%
2003 55000000 2750000 5%
2004 5MMXXXM) 2800000 5%
Total 806020000 36340000
Source: Survey study of Sukkur estate area.
In the year 1990-94 the sales were showing a downward trend, whereas during the year
1995-2000 the sales further declined on account of tough competition among oil industries
in the local markets and in the same period various other oil industries were also
established. In the year 2001-04 sales increased because the owners of these industries had
adopted new strategics They appointed the agents who visited various local areas and met
with various shopkeepers in different areas and got the orders on the concessional price.
Thus, with this strategy, the owners of these mills increased their sales.
Graph-73

118
Fhc owners of these oil industries were graduate that's why they tackled the problems
efficiently setting better strategies. But the fact remaining that owners of these oil mills
must get training in management and marketing to become more effective through
quality and cost control to achieve better financial results.
Table 7.6 Sales aad profit growth of five floar mills at Sukkur estate area. The
owners of these mills are Matriculate.
Years Sales Profit % 1990 26350000 1317500 5% 1991 26030000 I3OI5O
O
5% 1992 26030000 13OI5O
O
5% 1993 25000000 1250000 5% 1994 23000000 1150000 5% 1995 21000000 1050000 5% 1996 20000000 1000000 5% 1997 18000000 720000 4% 1998 16000000 640000 4% 1999 13000000 390000 3% 2000 10000000 300000 3% 2001 9000000 180000 2% 2002 8500000 170000 2% 2003 8000000 160000 2% 2004 7500000 150000 2% total 257410000 11M05M
Source: Survey study of Sukkur estate area.
Graph-7.4
Sales and profit growth of five flour mills at
Sukkur estate area. Owners aer matriculate

119
I be above graph shows the sharp decline of sales from the year 1990 to 2004. During the
year 1990-92 the sales position were stable but in the year 1993-96 the sales were declined
and profit was 5% per year. But in the year 1997-98 the sales further declined and the
profit reduced to 4% per year. In the year 1999-2000 the sales received further setback
profit came down to 3% per year. During the years 2001 to 2004. the sales further
declined sharply and the profit at 3% per year.
The owners of these flour mills were matriculates therefore they could not ascertain the
reasons of sharp decline in sales and profit over the years. Later, the numbers of flours
mills rapidly increased. As a result, the competition amongst the flour mill owners further
enhanced Some very competent and highly educated owners established flour mills in
Sukkur estate area, selling their flour on discount in the same markets and thus easily
captured the entire market and eliminated their competitors.
It was noted that some of the owners of these mills were family concerns with centralized
management structure. It based on ONE MAN SHOW. It was further found that in view
of lack of professional education in the field of management and marketing, the sales &
profit of their industrial units sharply declined in the reporting years.
Table 7.7 Growth rate of sales and profit of one flour mill The owner of this mill is
uneducated at Sukkur estate area.
Year Sales Profit %
1990 26350000 1317500 5%
1991 26030000 I3OI5O
O
5%
1992 26030000 I3OI5O
O
5%
1993 25000000 1250000 5%
1994 23000000 1150000 5%
1995 21000000 1050000 5%

120
1996 20000000 1000000 5%
1997 18000000 720000 4%
1998 16000000 640000 4%
1999 13000000 390000 3%

121
2000 10000000 300000 3%
2001 ‘XKXA 180000 2%
2002 8500000 170000 2%
2003 800000(1 160000 2%
2004 7500000 150000 2%
Total 257410000 110805
00
Source: Survey study of Sukkur estate area.
Graph- 73
The above graph shows that during the years 1990-96 the sales sharply declined but profit
remained at 5% per year. In the year 1997-98 the sales rapidly declined and profit also
decreased to 4% per year. In the year 1999-01 the sales were further declined and profit
was also decreased to 3% per year. In the year 2001-04 the sales of this industry further
sharply declined and profit as well to 2%.

122
It is crystal clear that the owner of this industry was not able to grasp to situation due to
his personal deficiencies on account of low education with no training in the field of
marketing and management so it was very difficult for him to understand the changing
environment of the markets.
Table 7.8 Growth rate of sales and profit of one flour mill The owner of this mill is
M.A.LL.B. Sukknr estate area
Year Sales Net Profit %
1993 26350000 1317500 5%
1994 26350000 1317500 5%
1995 26450000 1322500 5%
1996 26550000 1327500 5%
1997 26830000 1341500 5%
1998 27010000 1350500 5%
1999 28000000 1400000 5%
2000 29020000 1451000 5%
2001 32000000 1600000 5%
2002 34000000 1700000 5%
2003 35000000 I75OOOO 5%
2004 35500000 1775000 5%
Total 353060000 1765300
0
Source: Survey study of Sukkur estate area.
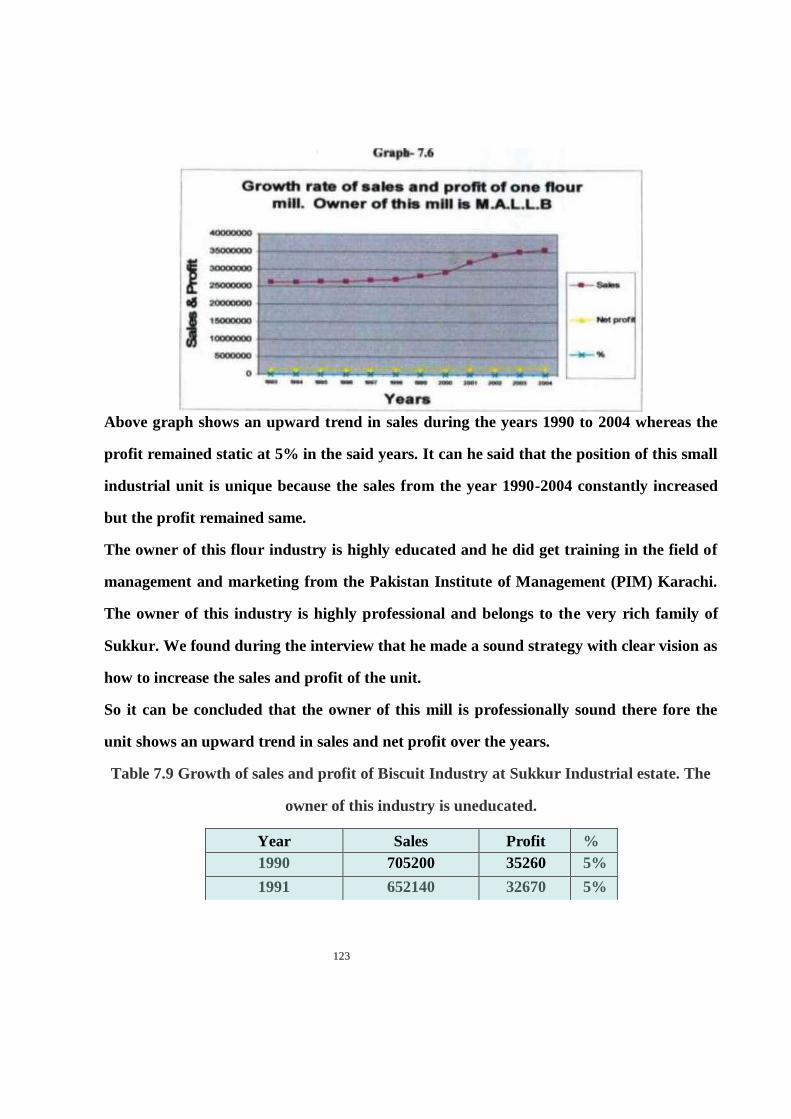
123
Above graph shows an upward trend in sales during the years 1990 to 2004 whereas the
profit remained static at 5% in the said years. It can he said that the position of this small
industrial unit is unique because the sales from the year 1990-2004 constantly increased
but the profit remained same.
The owner of this flour industry is highly educated and he did get training in the field of
management and marketing from the Pakistan Institute of Management (PIM) Karachi.
The owner of this industry is highly professional and belongs to the very rich family of
Sukkur. We found during the interview that he made a sound strategy with clear vision as
how to increase the sales and profit of the unit.
So it can be concluded that the owner of this mill is professionally sound there fore the
unit shows an upward trend in sales and net profit over the years.
Table 7.9 Growth of sales and profit of Biscuit Industry at Sukkur Industrial estate. The
owner of this industry is uneducated.
Year Sales Profit %
1990 705200 35260 5%
1991 652140 32670 5%

124
1992 665030 32515 5%
1993 553768 27518 5%
1994 535000 25175 5%
1995 498050 24925 5%
1996 486420 24321 5%
1997 460000 16240 4%
1998 384086 15363 4%
1999 354589 10637 3%
2000 331831 99325 3%
2001 236800 96204 3%
2002 211630 42212 2%
2003 208750 40175 2%
2004 195600 39012 2%
Total 56790955 2422168
Source: Survey study of Sukkur estate area.
Graph- 7.7
Growth rate of sales and profit of one Biscuit Factory at
Sukkur estate area. Owner Uneducated
Years
The above graph shows that the sales during the sears 1990-96 decreased but the profit
remained at 5% each year. In the year 1997-98 the sales were further decreased and the

125
profit also decreased from 5% to 4% in the same years. In the year 2001-02 sales sharply
declined and so the profit from 4% to 3%. Like wise, in the year 2002- 04 similar
downward trend in sales and profit continues.
On the basis of our analysis we found that the rote cause of declining results is poor
management and weak financial base and lack of vision coupled with absence of
motivation and diversified interest, result in underutilization of capacity and dearth of
managerial knowledge.

126
IS Category-wine Rcsalts of Small Firms as per Model of McClelland of
Sakkar Estate Area
Table 7.10 (ategorywise Resells of Small Firms as per Model of McClelland of
SakkarEstale Area.
Q: Na:
A B c D
1 01 01 01 01
2 01 01 01 01
3 01 01 01 00
4 01 01 0! 01
5 01 01 01 01
6 01 01 01 01
7 01 01 Hl 01
« 01 01 01 01
9 01 01 01 01
10 01 01 01 01
II 01 01 01 01
12 01 01 01 01
13 01 01 01 01
14 01 01 01 01
15 01 01 01 01
16 01 01 01 01
17 01 01 01 01
IB 01 01 01 01
19 01 01 01 01
20 01 01 01 01
21 01 01 01 01
22 01 01 01 01
23 01 01 01 01
24 01 0) 01 01
25 01 01 01 01
total
•core
25 25 25 24
A C ategory Firms B Category Finns C Category Finns D category Firms
127
25x4=100 25x3-75 25x2=50 24x1=24
“A” Category Firms Total samples 11
Above table shows that two owners of Oil Mills, three from Biscuits Industries, two from
Marble & Tiles Industries and four Flour mills are coming in the "A" Category Firms
because the owners of these industries are highly qualified and they have high need for
achievement ability as per the model. It has also found that the sales and profit of these
industries are satisfactory .
“B" Category Firms Total samples 14
Seven Intermediate Owners from flour mills and one from Biscuits Industries, two from
food industries, two from Marble and tiles and one from Dall Industries and one from Oil
mills arc coming in the B category firms. Because the targets set by the owners of these
industries were low as against the model.
“C” Category Firms Total samples 11
Six Matriculate owners from the oil mills, one from Biscuit industry, two from food
industries and two from flour mills lacked the knowledge and vision into the affairs of
business so as to achieve better results. As per the model, the owners of these industries
have taken low marks.
“D” Category Firms Total samples 13
Five owners from oil mills, three from flour mills, one from biscuit industries, two from
food industries and two from Dall mills. They failed to achieve any better results of the
business. It has also found that the owners of these industries have not possessed the
required trait as per the model.
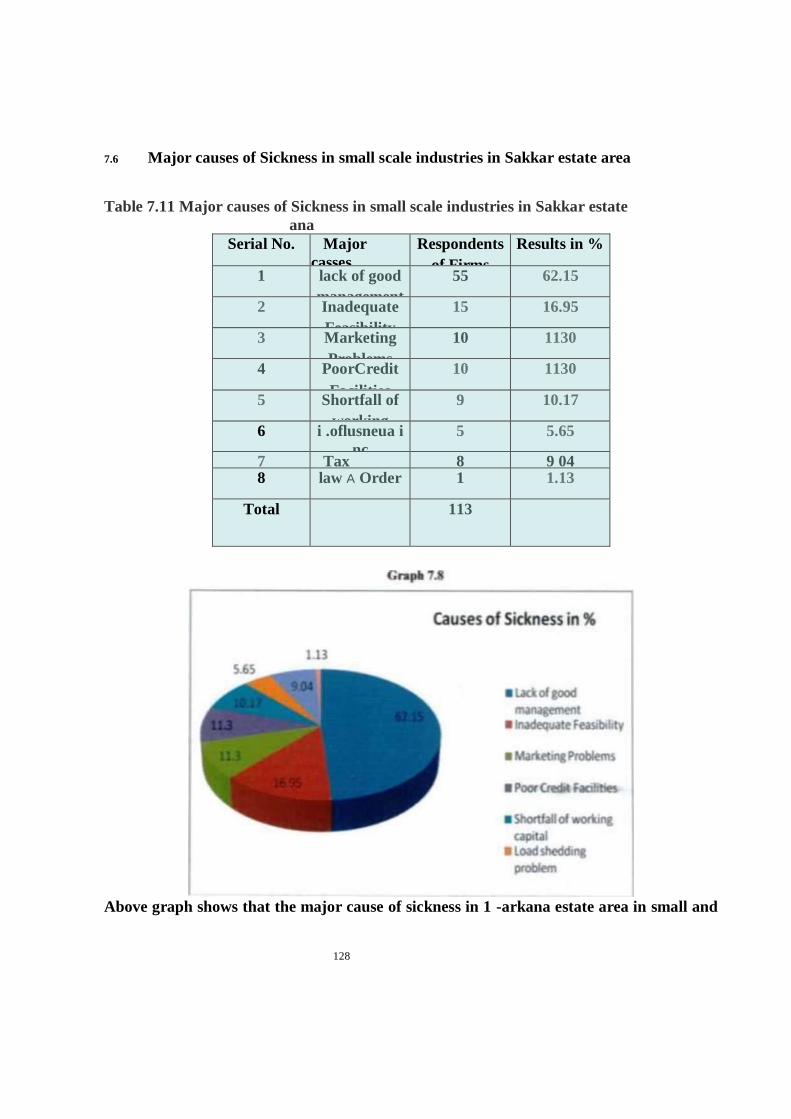
128
7.6 Major causes of Sickness in small scale industries in Sakkar estate area
Table 7.11 Major causes of Sickness in small scale industries in Sakkar estate
ana
Serial No. Major
casses
Respondents
of Firms
Results in %
1 lack of good
management
55 62.15
2 Inadequate
Feasibility
15 16.95
3 Marketing
Problems
10 1130
4 PoorCredit
Facilities
10 1130
5 Shortfall of
working
capital
9 10.17
6 i .oflusneua i
nc
5 5.65
7 Tax
problem
8 9 04 8 law A Order 1 1.13
Total 113
Above graph shows that the major cause of sickness in 1 -arkana estate area in small and

129
cottage industries is lack of good management according to the respondents results i.e..
62.15% Second major cause of the sickness is inadequate feasibility reports. Third major
cause of sickness is market problems and poor credit facilities, fourth major cause of
sickness is tax problem and load shedding.
7.7 Family occupation and last occupation of Entrepreneurs at
Sukkar estate area
Table 7.12 Family occupation aad last occupation of Entrepreneurs at Sukkar estate area
Last Occupation of the
entrepreneur before
entering in
manufacturing.
Family
Occup
land lord
ation of
tb
e
Eatrepr
e
Busines
s
near
Industr
y
EM
Total No. of
entrepreneun 113
8 28 65 20 113
Source: Survey study
The above table reveals that the 65 entrepreneurs came from family businesses. 20 from
profession. 20 from industry and 8 from landlord.
TA Causes of emergence of entrepreneurs at Sukkar estate area
Table 7.13 Causes of emergence of entrepreneurs at Sakkur estate area.
Seri
al
No.
t oanideraboa Na. af
Respondents
of Firm.
Eatrepraseun
Emergence
in %
1 Availability of Raw Mmcriai
45 50.85
2 Availability of Labor 30 33.9
3 Availability of Market 20 22.6
4 Availability of rafrastrurturr
15 16 95
5 Cioscmmenl incentives
3 3J9 6 Social Conditions 00 00
Total Re«p»adcatiat The Hran
tu
Sauce: Survey studs (.rap* 7.9

130
Above graph demonstrates that the causes of emergence first by the reason of availability
of the raw material. second availability of labor, third availability of market, fourth
availability of infrastructure facilities and fifth government incentives.
7.9 Growth Rate of Small Scale I ad as tries at Sakkar Estate Area
P ^ umber of Projects in Operation X100
Number of Plots Available to the Estate
P" 113 X 100
298
- 37.91
Average income of the individual employee & daily wages of workers Rs: 60.000 per year.
7.10 Regression Analysis of Uneducated samples of firms.
The regression equation is
Total sales of 14 years = 6066504

131
+ 1.92 Total Net Profit of 14 years Predictor CocfStIJev T P
Constant 6066504 120688 502 7 0.000
Total Nc 1.9201 0.1865 10.29 0.000
S - 62664 R-Sq = 89.1 % R-Sq(adj) - 882%
7.11 Analysis of Variance Source DF SS MS F P Regression 1 4J6132E-11 4.16I32E+11
105.97 0.000 Error 13 51M8680030 3926821541
Total 14 4.67181 E+ll
7.12 Results of Uneducated Samples of small firm
Simple linear regression analysis of uneducated owners of Sukkur Estate Area shows that
the impact factor of uneducated entrepreneurs is very high w ith regard to sales of the
Small-Scale Industries per year i.e^ 0.9.
This model shows that P value is zero it means these owners either non-graduate or
uneducated as they failed to increase the sales of respective small firms per year.
Analysis
The regression equation is Sales = 800934 + 10.1 Profit per year Predictor CoefStDev T P
Constant 800934 45411 17.64 0.000
Profit 10.1128 0.7291 13.87 0.000
S - 80894 R-Sq - 93.7% R-Sq(adj) - 932%
Analysis of Variance
Source DF SS MS F P

132
Regression 1 I25177E+12125877E+12 192.36 0 000 Error
13850692072176543785171
Total 14 I.34384E+I2
Unusual Observations
Obs Profit Sales Fit StOev Fit Residual St Resid
5 82320 1446400 1633423 28712 -187023 -2.47R
R denotes an observation with a large standardized residual
Durbin-Watson statistic = 1.42
Lack of fit test
Possible curvature in variable Profit (P = 0.084)
Overall lack of fit test is significant at P = 0.084
Pure error test - F = 1-33 P = 0.5963 DF(pure error) = 1
1.1 rows with no replicates
7.13 Results of regression a nah sis of educated samples of small firms
Above model has proved that “X” is significantly related to “y” it proves that slope
is significant at the 0.5 this test shows strong evidence is proved to the null
hypothesis
Over all fit test is proving that there is insignificant error i.e. 1.00.
This R3 test is approximately 1.00.which precludes that the model is valid and highly
reliable.

133
Graph- 7.1#
Residuals Versus tie Order of tie Data
rtWowsSRs)
Graph-7.11
R«»
ldua
l R
esid
ua
l

134
Residuals Versus tie Fitted Values
«*»■»• smi

135
(im ph-7.12
Resniuats Versus B>e Fitted Values
i'n»«w<MM|
Gm ph-7.13
Normal Pt obabilty Plot of tie Residuals
t"W« • 8*»1

136

137
Graph
7.14
Normal Probability Plot of the Residuals moraitMui
Nonvwi Scot*
Gra pb-
7.15
Histogam of tie
Residuals
htpowt Total a|
Residue
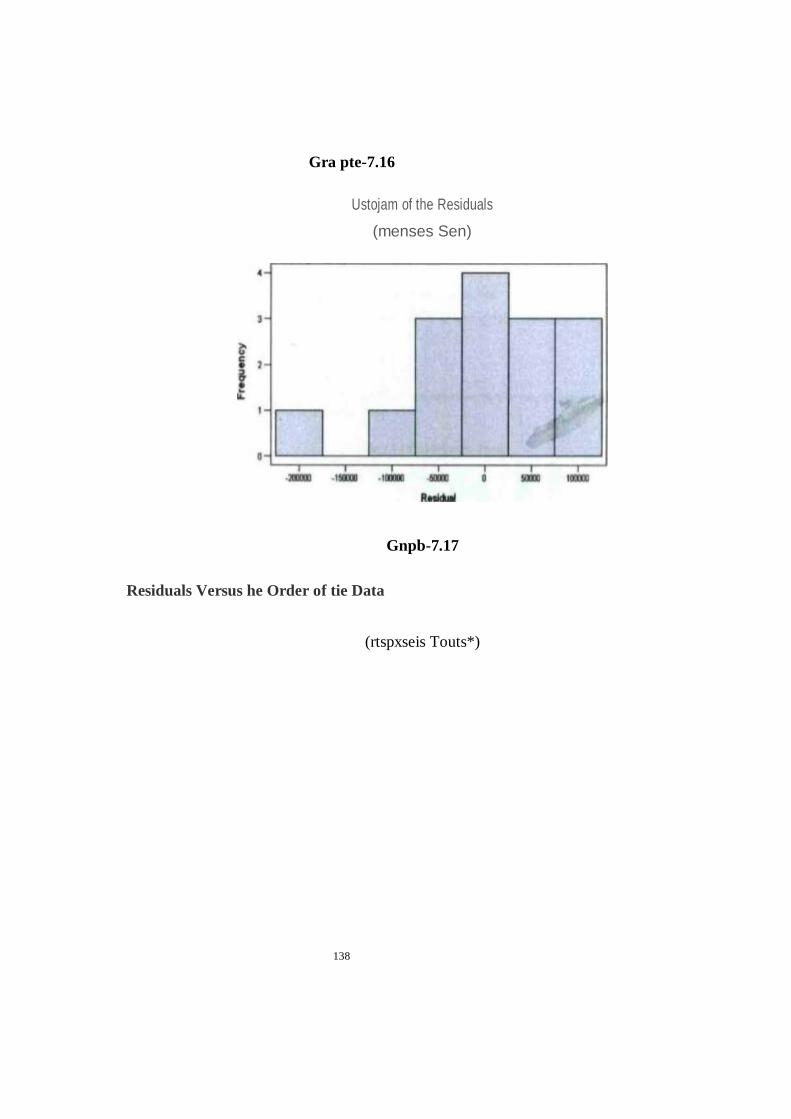
138
Gra pte-7.16
Ustojam of the Residuals
(menses Sen)
Gnpb-7.17
Residuals Versus he Order of tie Data
(rtspxseis Touts*)

139
Obeervabon Order
The results of above mentioned graphs No.6.8, 6.9, 6.10. 6.11, 6.12. 6.13. 6.14 and 6.5
the model indicate that the predicted variable ie, education is closely related to the
sales. The model is highly reliable at the significant P' O.OM. The above model shows
overall observation falls in the sales area. This proves that the model is applied
appropriately and the trends are also showing the positive relations between the
predictable variables such as high qualification with sale.
The above residuals suggest that the model is appropriately specified that tends the
highly correlation ship.
7.14 Results of regressioa analysis of Education versa* respondents and responses
versus education
Table 7.14 Chi-Square Tests
Value Aaymp
Sq (2aided) Pearson Crv-
Square
00 800(a)
84 575 UtehhoodRatt
o
00 002 84 305 Lawar-by-ljnaer
062
1 820

140
N of Vafed Canes
100
a 110 cete(100 0%) have expected count lees than & The minenum expected count a 20
Table 7.15 Responses * Education Cross tabulation

141
Table 7.16 Test of Homo*cacity of Variances
Levene ■MM dt1
8*
Roipond#nt
» R**pof*M
2480 4
4
048
The above taMea reveal that the sample a are independent, homogenous and
taken from a normal population
Table 7.17 Aaova
Graph 7.l«
Means Plots

142
Ihc above graph shows that the education of the respondents. Maximum mean

143
respondents have the educational backgropund from matriculation to inlet mediate.
Above grpah also proves that in Larkana estate area few entrepreurs have grduatc
level education.
Graph 7.19
Meaa of Responses
The trends of above graph shows that the education level increases the mean of
responses increases
Table 7.18 Correia lions Education versus Responses
Education
Responses Education Pearson
Correlation Sig (1-
tadad) Sum of Squares
and Cross-products
Covariance
N Responses Pearson
Correlation Sig (1-
taaed) Sum of Squares
and Cross-products
Covariance
N
1
200
000
2 020
100
1.0000
000
200
000
2 020
100
1000O
000
200
000
2 020
100
1
200
000
2 020
100
Correlation is significant at tne 0.01 level (1-Wled)

144
Above table demonstrates a high relationship between education and responses
Table 7.19 Correlations
Table 7.20 Model Summary ( b)
b Dependent Venable Education
The model tells us that there is a significance change over education among the
respondents. The significance value is 0.822
Table 7 JI ANOVA (b)
Model Sum of
Square
s
df Mean
Square F
Regression
Residual
Total
104
199 896
200 000
1
96
99
104
2 040
051 822(a)
a Predioore (Constant). Respondents b Dependent Variable Education
Table 7.22 Cor relations Responses versus education

145
level of significant 0.01: when education taken as a variable the relationship between
education and responses and found very high co-relationship between respondents and
education ix- I
Table 7.23 ANOVA (b)
Model Sum of
Square
s
Df Mean SQUW F SQ
1 Regression
1620
1 1620 061 822(a) Residua
l 3106
020
96
31 684 Total 3106
640
99
■ Predictors (Constant). Education b Dependent Vanable Respondents
Regression model shows a very high impact of education over the respondents which
arc highly significant value at 0.822.
Co-efficient of the regression model supports the idea of high impact of educated
entrepreneurs on the various different traits which arc available at appendix.....
Table 7.25 Coefficient Correlations (a)
a Dependent Vanabie Education
Table 7.26 Model Summary
R R Square
Adjusted R
Std Error
of the
Estimate 08
7
008
-013 5638

146
The independent variable is Education
Table 7 21 ANOVA Sum at
Square
s
Dt Mean
Square F &B
Regression
23 349
2 11674 367 694 Reexiual 3063
291
97
31.787 Total 3106
640
99
The independent variable <s Education
Table 728 Coefficients
Coefficients Standardi
zed
Coefficien
ts
T Sa
B Std Error
Beta B Std Error Education 120
4
1 405
306 857 394 Education
~ 2
■279 337 -295 -827 410 (Constant)
9 823
1.186
8 279 000
7.15 ( onclusion& suggestions
The study concludes that the model applied is a significant and found the co-
relationship between educations with responses on the 25 questions asked on the five
point Likert scale at the level of significant I. Regression model shows a very impact of
education over the respondents at the significant value 0.822. Co-efficient of the
regression model supports the idea of high impact of educated entrepreneurs i.e„
significant al 0.01 level.
The following measures. however, to some extent may reduce the incidence of
industrial sickness:
(1) The man behind the project plays a vital role in the sickness of the enterprise. In
the case of first generation entrepreneurs, financial agencies should select the
enterprise very carefully and evolve a thorough screening mechanism.
(2) Project appraisals should be more realistic with the best standards of appraisal.

147
(3) The SSIC, chamber of commerce and industries should shoulder the
responsibility for preventing industrial sickness from the Sukkur Estate Area.

148
(4) As for as possible some out side professional experts from the management,
marketing and engineering side should be appointed for the purpose of
counseling and necessary support to the entrepreneurs.
As small-scale units are vulnerable to sickness because of their weak production and
financial base, inefficient management and narrow customer-oriented market, need-
based credit facilities on the simple procedure and minimum rate of interest are
required to be made available by banks to rehabilitate units falling sick.
Magnitude of industrial sickness, especially in the Small Industrial Estate Sukkur, is
staggering. Uliat is worse, the number of sick units and the amounts of outstanding Rs.
43.049 millions bank advances have been steadily increasing in recent years. Industrial
sickness has grave socio-economic consequences. It leads to unemployment, loss of
production, under-utilization of productive assets, and blockage of the savings of the
community.
A vicious circle is buih into the economy. Industrial sickness adversely affects the
morale of the entrepreneurs, banks, financial institutions, general public and
governmental authorities. Because of all these adverse effects of sickness, it is in the
interest of all parties, i.e.. the Government banks, financial institutions and
entrepreneurs, that the magnitude of sickness should be minimized as quickly as
possible.
On the basis of the analysis made and the cases studied, we may conclude that whatever
may be the apparent cause or causes of sickness, the root cause is poor management and
the resultant cause finance.
The first generation entrepreneurs, without proper motivation, financial base and

149
insight into the problem, are often lured by different schemes and set up industries,
after some time, they lose interest, divert their attention and cause industrial sickness.
To succeed, an entrepreneur must be able to manage men. material and money. The
term men include not only the men employed in his industrial unit but also the men
responsible for the issue of various licenses and the sanction of loans. An inability and
inefficiency to deal with these important factors, coupled with lack of motivation and
diversified, interest, result in under-utilization of capacity and dearth of working
capital, cause disease and end in the closure of the enterprise.

150
CHAPTER NO.8
DISCUSSION, CONCLUSION & RECOMMENDATION
8.1 Introduction
This chapter gives the detailed results of the field study. Firstly, it explains the
educational back ground of the owners managers of Larkana and Sukkur estate area,
secondly, organizational structure of the small scale industries, thirdly, salary and
wage structure. Fourthly, strategy, goals and objectives have been discussed, fifthly,
problems and obstacles of small scale industries. Sixthly improper project feasibility,
seventhly lack of managerial knowledge and poor educational back ground or lack of
education has given. Eighthly, outdated technology, ninthly, financial problem,
tenthly, poor marketing strategy, eleventh, lack of motivational factors, twelfth,
traditional or rigid attitude and thirteenth, discussion, conclusion and
recommendations arc given in this chapter.
Ta Me 8.1 Educational back ground of owners' managers of Larkana estate area
S.No Nature of
firm
Total
numbe
r
affirms
owners managers
Graduate Inter Metric I ncdocatcd 1 Rice Mills 30 04 03 07 16
2 FOOD
INDU
STIR
ES
06 02 02 02 00
Grand
Total
36 06 05 09 16
Source field studs
Above table shows the disappointing picture of various owners of the small scale
industries at Larkana estate area in the perspective of educational background so that

151
it can be concluded that the majority of owners are uneducated and others have low
level of educational background. Duc to this reason, the 26 owners of the rice
industries are unable to achieve the better growth of sales and profit per year. But
contrary, the owners of four rice industries are highly qualified and efficient because
the growth of sales and profit arc good. The growth rate of two food industries in
terms of sales and profit arc better due to better qualification and managerial abilities
but the growth rale of sales and profit of four food industries arc not satisfactory due
to low educational background in the larkana estate area
8.2 Educational back ground of owners/ managers of Sukkar estate area
l alilc 8.2 Educational bark ground of owners/ managers of Sukkur estate area
S.No Nature of firm Total
number
of firms
Educational-background of
owners/ managers Graduate
later Metric Uneducated 1 Oil Mills 14 02 05 04 03
2 IOOD
INDUSTIRES
06 02 02 01 01
3 Hour Mills 16 04 07 02 03
4 Biscuit
Industry
06 03 01 01 01
5 Dual Mills 03 00 01 01 01
6 Marble and
files
04 02 01 01 00
Grand
Total
49 13 17 10 09
Source: survey studs
Above table shows the dismissal picture of the Sukkur estate area in the perspective of
educational background of the various entrepreneurs for example nine owners of
various small industrial units are uneducated. Moreover, 27 owners of different small
industries have low educational base. And only thirteen entrepreneurs are graduate. It

152
is concluded that the majority of the owners are not capable enough to face the
challenges of 21" century.
8.3 J Organizational structure of small scale industries
The organizational structures of small scale industries are flat. It means that, in each
small scale industry. There is one president/founder and others arc subordinates.
The main concept of such type of flat organization is that. “The firm is founded by an
entrepreneur who works alone or with a handful/skilful of employees to produce the
product".
This definition shows the narrow structural characteristics of small organization. with
few formal rules, broad work specialization. and centralized decision making
The comprehensive definition of Hat organization is that. “Wide span of management
and few hierarchal levels”
It is found that in both estates area there is same organizational structure of the small
scale industries
The organizational structure of small industries is given below:
In the low level capacity of rice mills, there arc 80 total regular employees, who are
working on the different positions and total 200 part time labors are working. In the

153
middle level production capacity rice firms, there arc twenty four regulv employees
and on the daily wage basis there arc seventy two. In the high level production
capacity ncc industries, there are total regular employees twenty four and part lime
labors are ninety Obviously, the small scale industries are starting their operation in
the month September every year by the reason of cultivation of paddy In the six food
industries there are total regular employees are thirty six and on the wage basis total
labor are one hundred forty four
In the oil mills of Sukkur estate area there are total 70 regular employees, who
are working in the different positions and contrary. 140 labors working in the
daily wage bases.
In the flour mills, there arc 55 regular employees and 110 labors working on the
part time bases.
In the food industries, there are 25 regular employees and 50 part time labors In
the biscuits industries, there are 25 regular employees and 100 part time labors.
In the marble and tiles industries, there are 300 regular employees and 200 pan
time labors.
In the Dall (Pulse) mills, there arc 100 regular employees and 200 part time
labors
8.4 Salary and wage structure
Through the field study, it is found that, the majority of owners/managers are giving
the meager salary to the various full time employees RS: 4000 to 5000 per month and
RS: 80 to 100 as daily wages to the part time employees. So it is concluded that in the
Larkana and Sukkur estate area there is high exploitation of labors.

154
8.5 Strategy, goals and objectives
A plan is a projected course of action; it is the foundation on which other management
functions operate. So it is virtually mandatory to lay the sound strategy; otherwise
weak strategy leads towards collapse. There fore, it is essential that all functions must
be performed effectively and efficiently for achieving the goals and objectives of the
organization. To analyze and interpret the performance of owner? managers of
Larkana and Sukkur estate area in the context of strategy' of last 14 years. In this
regard, 1 asked following open ended questions.
o How did you assume that you would be successful to achieve the goals and
objectives of the business?
o What were your main objectives and goals?
In response to the first question, twenty six owners of rice industries were not
confident regarding the achievement of goals and objectives of the firms but four
owners of rice industries were highly optimistic to achieve the goals and objectives of
the business. By having huge past experience of the business and strategy .
In the response of the same question two owners of the food industries were confident
for achieving the objective of the firms but others were not confident.
In response to the same question, the most of ow ners of Sukkur estate area were not
confident.
In response of second question, twenty six owners of rice industries and four owners of
food industries were emphasizing on the profit not on the quality of product but six
owners of rice and food industries were emphasizing on the high quality of production

155
because four owners of rice industries installed the latest technology .therefore the
broken ratio of rice was decreased i-e; 50% to 5%.
In the response of second question more than 80% of the owners were not aware
regarding the future goals of the firms
During the discussion with the owners of various industries of rice and foods. 1 found
the most of the owners are confused and not clear about the future results of the
business by the reason of un-education and low level educational background. It
shows the grave scenario of the small scale industries in the Larkana estate area. It
has also found that the most of owners are unfit in the context of heavy requirements
of the job. The overwhelming majority of the firms representatives were conservation
oriented in terms of their goals and objectives of the business because the most of the
sample firms are rigid and unaware about the latest techniques of business such as
“Break-even analysis point" and “Return on investment”. It has also found that the
most of the owners of small scale industries are not using the double entry system,
cash book and balance sheet; therefore they are unable to paint the clear picture of
the financial position of the business.
The key managerial task is to ensure that the relationship between firm and its
environment is one by which the firm can attain its goals and objectives. Sound
leadership is one of the most important requirements for the success of any
organization. A real leader is the motivating force that stimulates and directs the
organization towards accomplishments of Goals and objectives.
It is found that, magnitude of industrial sickness in the small industrial estate Sukkur
is increasing. It is also found that the amount of outstanding Rs.43.049 million bank
advances have been steadily increasing in recent years. So it leads to unemployment,

156
loss of production, under utilization of capacity and low moral of investors in the
region.
8.6 Problems and obstacles
During the formal discussion with the various owners of small scale industries at
Larkana estate area, the most of twenty' eight owners of small firms are blaming to
the government policies and ineffective role of export promotion bureau and chamber
of commerce and industries. Besides, eight ow ners of small scale industries were
making responsible to the heavy electrical bills and heavy taxes were the major causes
of low

157
growth of small scale industries at Larkana estate area. But when I met with president
of Sindh rice millers association, he said that we arc facing the lot of serious problems of
low growth of sales and profit since many years due to the recession in the country, cold
response of government representatives of ministry of commerce and industry and
export promotion bureau More over, he said that during the March- April 3.5 lack tons
of rice were laying in the mills and god owns and if stock was exported to the
international markets country could earn 895 million dollars. He had also offered to the
government to take-up the stock on two month credit or open-up trade with Iranian
government but in this regard government officials did not get any response. And
during that time most of the owners of rice mills became the defaulters of the various
commercial banks. Actually these ore the main obstacles for the better growth of rice
industries at Larkana estate area. And these are also the loss of the country’s economy.
Further, the president of Sindh Baluchistan rice millers association informed that 1RRI
seed was imported from the Philippines in the year 1968 and since then this variety was
growing in Sindh but now a days the seed quality has deteriorated, in order to improve
the quality of rice it is imperative to obtain better quality of rice seed from abroad or
the government must invest in research and development to produce quality seed
locally.
President of Rice Millers Association admitted that the most of our owners/managers of
rice industries are un-educatcd and have no knowledge regarding the management field
and he has also made responsible to the directorate office of Sindh Small Industries
Corporation (SSIC). Because they did not provide us any kind of trainings since
inception. He also informed that. Sindh and Baluchistan Province, produces about 2.3
million tons of rice every year, out of which about 1.2 million tons remain surplus for
158
the export. 1RRI-6 rice, keeps about 80% of our total production. Where as in 20% we
grow 1RR1-9, DR-82, , DR-83, DR-92 and KS-282 etc. fine coarse rice varieties as well.
Due to setback in international market. Government has not come forward to support
the local growers and industry as per support prices of the commodity; therefore, since
three yeas this industry has been constantly bearing heavy losses, and has reached at the
brink of devastation
He also informed that. Pakistani exporters were also involved in the fraudulent
activities; therefore, they could not have earned a good name for our country. Due to

159
this, rice importing countries have serious objection regarding the quality of rice.
Keeping in this problem, we have decided to establish an “export wing" In this
regard, if Government gives the facility of soft loans and provides RECP warehouses
on reasonable rate, would be further motivated us to export our rice al our own.
Actually rice is a cash crop of Sindh and Baluchistan, produces about 2.2 million tons
of rice, among which about U million tons is exported each year to earn about 2
billion dollars of foreign exchange for the country.
It is found that the government policies are not favoring the agriculture and rice
industries in Sindh and Baluchistan, although this sector is playing very significant
role in order to earn 2 billion dollars foreign exchange every year and employed the
five thousands labor force in the Sindh and Baluchistan provinces.
This research reveals that in the Sukkur estate area 30 small industrial units fell sick
because of improper feasibility reports, lack of demand of product, lack of education,
high government taxes, and instability of politics in the country and bad law and
order situation It is found that the Sindh small industries corporation has not
provided any kind of training to the entrepreneurs
Through the field study, we found that, there are some internal causes of sickness in
small industrial units at the estate area of Larkana and Sukkur. The details of
internal causes are given below:
8.6.1 Internal causes
• Improper project feasibility
• Lock of managerial know ledge
• Poor educational background of lack of education
• Out dated technology

160
• Financial problem
• Poor marketing strategy
• Lack of motivational factor
• Traditional or rigid attitude

161
8.6.2 Improper project feasibility
This factor acts mainly at the initial stages of the project. Many projects were sick by
birth because of inadequate feasibility reports regarding the demand of product in
various markets, wrong choice of technology, improper forecasting of financial
requirements, delayed in supply of plant and machinery or in their installation or
release of funds by financiers. No clear vision, goals and objectives. The root of all
these problems may be traced to the lack of expertise in project planning and
management on behalf of entrepreneurs and promoters.
It is a fact that, the directorate offices of SSIC are also responsibly for this
happening because they were not scrutinizing the project proposals properly or
failing to provide their expertise in the planning and implementing the project
The symptoms are escalation of project costs, high debts, high interest payments and
wrong choice of technology.
Some of borrowers are also make responsible to the various commercial banks for
the causes of sickness because these banks were not giving the expertise especially in
the stages of feasibility reports.
After careful studies of the various feasibility reports, it is found that, there are so
many crucial factors which are very essential to make the ground feasibility reports
about the small industrial project. For example, the lists of these factors arc given
below:
• Industrial classification
• Methods of marketing
• Market outlook
• Plant capacity

162
• Utilities for the project
• Civil works
• Estimated project cost
• Production process
• Manpower requirements
• Per Kg manufacturing cost.
• Profit & loss account
• Production process
• List of machine
During the field study. It is found that, the most of entrepreneurs are completely
unaware about the above mentioned requirements for making better feasibility
reports.
8.6.3 Lack of managerial knowledge
The majority of entrepreneurs are unaware about the knowledge of managerial
field. Therefore, they were performing the non-managerial tasks. Rather the tasks of
managerial functions such as planning, organizing, leading and controlling. Indeed,
in this dynamic world this sector needs qualified professionals to handle the every
activity of business affairs more effectively and efficiently. It is clear that, the sound
knowledge of managements is a key to success.
8.6.4 Poor educational background or Lack of education
This research reveals that, the most of owners'managcrs are very poor in sound
educational background, and the rest of un-educated. For example, in the both estate
nineteen owners/managers are graduate, twenty two are intermediate, nineteen arc
matriculate and twenty five are owners/managers are un-educated. Now you can

163
imagine that, these un-educated crowed is not capable to survive in this competitive
business atmosphere. The percentage of total un-educated owners is 29.41. And the
percentage of graduate is 22.35. The percentage of intermediate is 25.88. and
matriculate is 22.35 percentages. Keeping in this scenario, it is concluded that, these
owners.managers are not comfortable at their business units, they need some
prescription to avoid this grave situation.
hi order to be able cure a disease, wc must give advise them, they should be prepared
their next generation to handle the affairs of small industrial units.
8.6.5 Out- dated technology
it is a known fact that technology plays an important role in the viability of an
industrial unit.
In sectors like processing of chemicals, petrochemicals, textiles, and agro processing,
tried and established technologies arc predominant and the pace of change is slow
but developments information technology and micro-electronics which started in late
seventies and eighties have considerable changed the scenario. The pace of change so

164
far as new innovations and introduction of new technology is concerned, is much
faster today than it was in fifties or sixties and even seventies.
In such a global scenario, small industrial units can not survive and with stand the
global competition purely on the basis of cheap labor or adoption of simple labor
intensive technologies and keep pace with changing situation, they would be
maintained their competitive advantages.
8.6.6 Financial problems
The most of units arc sick by the reasons of lack of working capital, wrong choice of
financiers, high interests payments, frauds, corruption, lack of financial control, an
absent of costing systems and delay in release of funds by banks or financiers.
Obviously, the professional approach is missing on the part of owners/managers and
promoters, either the officials of SSIC or bankers, even there are no concept of
monitor and control the financial affairs of the industry in time.
8.6.7 Poor marketing strategy
During the informal discussion w ith the owners/managers of small industrial units
in both estates regarding the marketing strategy, they are layman, and not aware
about the tools techniques of marketing strategy. For example, when 1 asked the few
questions, like what kind of strategy you have made to penetrate the market? What
is your market segmentation strategy? The answer to question I was quite astonished
that when the most of owners/managers were said, we don’t know about these terms!
But they gave answer in Sindhi, such as.
After discussion, it is found that they did not know about the marketing about the
mix strategy and some important elements of market segmentation, such as,
1. Demographics variables

165
2. Geographic and Psychographics information
8.6.8 Lack of motivational factors
Through the field study it is found that, in the all sample firms, there are no concept
of hands-some salary or bonus schemes for efficient workers, even they are giving
the low wages and meager salary to the regular and part time workers, due to this
nonmotivating behavior of owner/managers with labors, these arc rapid labors
turnover problem, so this happened also effect on the operations of the firms and
some time create the labor shortage problem.
8.6.9 Traditional or rigid attitude
As already indicated, a substantial proportion of the samples firms are conservation-
oriented in terms of learning the latest techniques regarding the monitor and control
of financial affairs like.
Double entry sy stem, cost accounting, break-even analysis techniques, returns on
investment technique, and balance sheet.
Indeed, most of owners/managers are using the old age methods of financial control;
they are not maintaining the financial record of every transaction.
Several firm seemed to be more concerned with purely not defensive postures,
notable in relation to taxation and the family wealth than with progress and
efficiency.
Keeping in it scenario, it is a virtually necessary for eight five owners / managers of
small scale industries at estate area of Larkana and Sukkur. they must get the
immediate training in the field of management and marketing otherwise their

166
survival is in jeopardy.
It is a very important for the first generation entrepreneurs they must give the
opportunities to their educated children for running the parent industries
Pakistan's economy has this amazing potential for development but sadly, Pakistan
hasn't been able to derive optimal benefits despite a series of efforts launched by
various policy makers at different times. The impetus of all these endeavors was on
the large scale industries and manufacturing concerns. High rate of failures, owing
to economic slumps, institutional malpractices, political motives and damaging
activities of labor unions in that sector, left the formal lending institutions with huge
infected portfolios, in addition to adverse effects on the entire economy e.g.
insufficient and low quality production to meet the demands of local and
international markets, deficit in balance of payments and ever rising unemployment,
etc.
8.7 Discussion/Recommendations
Pakistan's Small Industries (Sis) arc still unable to achieve their maximum potential
and are in dire need of ‘hand-holding’ and business support services. Mostly, small
entrepreneurs in Pakistan arc facing following problems:
8.7.1 Lack of data on the small scale industries in Pakistan
- It is found that the most of institutions in Pakistan arc not maintaining the
proper record of the small-scale industries. Due to this problem, it is very
difficult for researchers to collect the pertinent data from various concerned
institutions like Chamber of Commerce and Industries. Export Promotion

167
Bureau and the Directorate of Sindh Small Industries Corporation.
- It is also found that the most of entrepreneurs arc not maintaining the
financial records.
Due to dearth of information on this sector, the potential candidates arc
avoiding to invest in this sector.
- Sis still lack a uniform and clear definition, making it difficult for various
institutions to form uniform policies and devise standardized procedures to
deal with this sector.
Table.8.3 Definition of small scale industries
as used by the various institutions
Institution Small
1 State Bank of Pakistan Employment Between 10 to 35
people Fixed Asset between Rs.2
to Rs.20 million 2 Small Medium Enterprises
Development Authority
10-50 persons employed and
productive
Assets limit of Rs. 20 million 3 Sindh Small Industries
Corporation
5 to 10 persons employed and
fixed Assets limit of Rs. 10 million 4 Ministry of Commerce and
Industry
10 to20 persons employed and
fixed
Assets limit of Rs. 10 million Source: Survey study
This lack of information is in itself a problem for the Sis since the entrepreneurs
can not find feasibilities on different businesses and sector of the economy. The
available secondary data is inadequate and can not escort them on the path leading
towards success.
8.7.2 Lack of Regulatory and Legislative Framework in Pakistan
- The government of Pakistan has not taken the regulatory measures to ensure
168
the registrations and other documentation of small industrial units in Pakistan.
- Obviously. State Bank of Pakistan has reviewed and revised the set of
prudential regulations of this sector, in order to provide financial assistance on
easy terms and conditions.
8.7 J Dire Need for Change
It is observed that the most of owners of small industrial units have been used
the out dated technology especially in the Larkana and Sukkur regions.
Therefore, the most of small industries are producing low quality of products
which is not feasible to sale in the international markets. It is also observed that
the production of small scale industries is not fulfilling the local demands of the
markets.
• Our economy needs a conductive business environment and an entrepreneurial
culture for the change to take place. Educational institutions. Government of
Pakistan and other private sector role players need to make sincere
contributions, if we are to compete with the international market.
8.7.4 Lack of Financial Assistance
- It is found that in Pakistan there is acute shortage of financial assistance to the
small industries.
- Small Industries perceive that high risks and high costs are associated with
Bank's financing services. There is lack of accurate information on Banks and
Borrowers.
8.7.5 Inadequate Services Support in various fields
169
It is felt that the owners of small industries particularly in Sindh and generally
in Pakistan they immediately need for support services in the field of
Accounting. Management. Marketing. e-Commerce. e-Busincss. Product
designing. Price and Human Resource Management, etc.
Shortage of skilled staff causes delays in production and affects quality of
output & sales. High price and unsatisfactory quality of raw material is a
matter of great concern for those belonging to the manufacturing sector. The
entrepreneurs are also interested in adopting new technologies and training
manpower, but lack the resources, technical and training assistance. Lack of
all these has led Sis towards low productivity.
8.7.6 Marketing Problems
It is also found that the small industrialists are supplying their products to the
domestic markets face various problems like bargaining on price and credit
purchases therefore, it is a virtually mandatory for the government to create
the link with the international markets.
8.7.7 Low credit risk in the small industries
It is found that the default rate in this sector is very low in comparison to large
scale industries. Small Industries have provided tremendous opportunities to
financial institutions to design various tools for the sector's development.
8.7.8 The enterprising behavior
It has rightly quoted by the Henry Ford, if money is your hope for
independence you will never have it. So now it is clear and crystal that the

170
success of entrepreneur lies on the quality of knowledge, experience and
ability.
8.7.9 Prior training to the entrepreneurs
It is a very important for the promoting agencies of Pakistan to the small scale
industries, they must give the comprehensive trainings to the various
entrepreneurs in the field of management, marketing, financial management
as well as in technology.

171
8.7.10 Creating the better Linkages between Small Industries Federal, Provincial and
Chamber of Commerce and Industries.
It is very important for the Government departments’ federal and provincial
offices to establish the better linkages with the owners of small scale industries
and officials of the directorate of small industrial estates for the expansion and
better growth in this sector.
8.7.11 Problems of Export Oriented Small Scale Industries
litis research reveals that the government is not given the due consideration to
the rice industries of Larkana so that industrialists of this secotr are not
satisfied form the government policies. Therefore, government and Sindh
Small Industries Corporation must make a plan for export of rice of Larkana
District in the various international markets.
8.7.12 Poor Social Infrastructure in Pakistan
This research has found that the most of the people have a low educational
base or poor knowledge especially in the field of management and marketing.
Therefore, it is concluded that the most of entrepreneurs are incompetent in
their respective businesses. So it is a virtually important for the government to
start the introduction of entrepreneurship education as a part of the
curriculum in the formal education system from the secondary levels to
University levels.
8.7.13 Poor Infrastructure Facility
This research has found that in both estate area of Larkana & Sukkur there

172
are poor infrastructure facilities such as internet, libraries, hospitals, training
centers, counseling program and roads.
8.8 Conclusions/Recommendations
It has found that the Small Scale Industries are solving the twin problems of
the country by giving the job opportunities and eradicating the poverty.
It has also found that there is no consensus over the comprehensive definition
of Small Scale Industry there for it can be concluded that there is lack of
seriousness regarding the importance of Small Scale Industries in Pakistan. So
there is a dire need for standardized and universal revised definition of Small
173
Industries. It is also ver}' important for the State Bank of Pakistan in its Small
enterprise prudential regulation needs to be revised for research and policy
purposes.
8.8.1 It is recommended that entrepreneurship education must be reviewed in terms
of skills and quality traits which arc very important to ensure the success of
the business. So in this regard, if the government will give opportunities to the
potential students from the field of economics, commerce and business
administration for establishing the new Small Industrial Units in the various
regions of Pakistan because these candidates have a new idea regarding the
businesses. As matter of fact education of entrepreneurship has traced out
from 1938 to university of Japan where approximately 30 institutions were
giving the entrepreneurship education and in America 25 institutions were
offering courses in the field of entrepreneurship education and number of
students are also increasing in such courses.
Il has found that the Small Scale Industries contribute 30 percent in the GDP
and provide 35 percent of the value added in the manufacturing industry and
generate 25 percent of manufacturing sector export earnings ($ 2.5 billion).
The man behind the project plays a vital role in the sickness of the firm. In rhe
case of first generation entrepreneurs, financial agencies and SSIC department
must select the enterprise very carefully and evolve a through screening
mechanism regarding their qualification and past business experience and
managerial know ledge.
8.8.2 Project appraisal should be more realistic with best standards of monitoring
and evaluation system.

174
8.8.3 As far as possible, some professional experts should be appointed for designing
the realistic project feasibility, and counseling the entrepreneurs about the
management and marketing field.
8.8.4 Processing and milling of PADDY in I.arkana is controlled by the private
sector. All most all of the rice mills in Larkana arc using obsolete very old
technology to mill the rice. For better quality, it would be necessary to
modernize the all rice mills for the purpose of cleaning, de stoning polishing
and grading the rice.
8.8.5 As far as rice milling by- product husk, bran, and broken - are concerned, it
was found that Sindh is not getting the potential benefits from by products of
175
rice milling. The husk is used as fuel for brick making, bran is used as animal
feed, and the broken rice is sold in the domestic as well as in the international
market at low prices. Manufacture of edible oils is potentials use of bran. This
edible oil could be produced as an import substitute for soybean oil and palm
oil.
8.8.6 The head office of the SSIC must make some provision for work shops, trainings
to the new and old entrepreneurs in all estate area of Sindh. The department
must get the lesson from the dynamic role of (SBA) Smail Business
Administration of America for promoting and expanding the pace of small-scale
industries on sound footings.
8.8.7 During the field study we found that, the role of chamber of commerce and
industry Larkana was not satisfactory because when we met with the concerned
officials about the annual reports of small-scale industries they said that we are
not making the annual reports.
8.8.8 We found that the chamber of commerce and industry Islamabad has developed
collaboration with the National University of Science and Technology (NUST) at
Rawalpindi for the purpose of providing professional trainings to the
entrepreneurs of Islamabad and Rawalpindi. Source Annual Report 1998-99
(1CC1).
8.8.9 The SSIC must establish a research cell. The main function of research cell
should be collecting the pertinent data from all units of the district for
monitoring analyzing and finding the solution of problems which are being
faced by the entrepreneurs.
8.8.10 The SSIC must hold seminars, exhibitions, work shops and lecture program and
comer meetings with the different people of the society for the purpose of
176
encouraging investing in small industries in Sindh.
8.8.11 Through the field studies, we found that Larkana is cultivating the large scale
production of guava and tomato so it suggests that this area is feasible for guava
pulp processing industry and tomato ketchup industry. More over, paper board
industry is also feasible due to waste available out of PADDY.
8.8.12 As we have already indicated that the directorate of SSIC has not been playing
the desired role for expansion and promotion of Small-scale Industries in
Larkana estate area so there is dire need for establishing a separate institute,
such as, Sindh Institute of Standard and Industrial Research for the purpose of

177
promoting and developing the small scale industry in Sindh. In this regard,
government of Sindh may like to establish the (SISIR) and this institute should
be a separate statutory board to provide industries in Sindh with
standardization and better services. The main functions of this institute may
include.
• Testing and verification of industrial projects, analysis and design of
Sindh made goods.
• Providing free consultancy services.
• Drafting and promulgating of Sindh industrial standard.
• The main role of SISIR is to promote and up grade quality technology
levels in manufacturing sector and export technical assistance.
The service will be provided by SISIR through multi disciplinary team
comprising of Scientists. Engineers. Economists. Technologists. Quality control
professionals and experts of Management & Marketing fields.
Keeping in view of above mentioned facts and figures, it is a virtually necessary
for the owners of Small Scale Industries at Sukkur and Larkana State area they
must get the training in the field of management and financial accounting.
8.8.13 It is found that in both estate areas the small industrial units are the family
units, therefore, we recommend that they must give the opportunities to their
educated children's for run the smooth business affairs. It is regrettable to say
that the directorate offices of Sindh Small Industries Corporation Larkana and
Sukkur did not give the importance to the training of entrepreneurs at their
estate area in the field of management and financial accounting.
8.8.14 We must suggest that if government wants to develop the business culture in

178
Sindh then they must grant some scholarships every year for study in a broad to
the new and old entrepreneurs for the sack of “Industrial Education”.
It has found that Chamber of Commerce and Industry of Larkana and Sukkur
estate area was not playing a important role for the better growth of Small Scale
Industries in both regions. During the survey study it has been observed that the
chamber of commerce and industries of both estates did not make any
comprehensive annual reports regarding the growth of small industrial units in
these regions. Besides, Islamabad Chamber of Commerce and industry took the
bold steps regarding the ISO-9000 quality certificate and total quality
management system in the Small Industries in the Province of Punjab.
Islamabad Chamber started the collaboration with the National University of
Science and Technology (NUST) for the purpose of providing professional
training to the entrepreneurs of Islamabad and Rawalpindi (Source) annual
report 1998-1999 (ICCI).
8.8.15 Keeping in this scenario government of Sindh. Ministry of Commerce. Industry
and Trade must take some viable steps for the purpose of providing the best
training facilities to the entrepreneurs of Larkana and Sukkur in the field of
management and total quality management for upgrading the quality of
industrialist to meet the challenges of 21" Century.
• The SSIC must establish a research cell. The main function of
research cell should be collecting the pertinent data from the all
units of districts of Sindh province for monitoring, analyzing and
finding the solution of problems which are being faced by the
entrepreneurs.
179
• Sindh Small Industries Corporation must hold seminars,
exhibitions, workshops, lecture program and comer meetings with
the different people of society for the purpose of encouraging and
better investment in different regions of Sindh.
• SSIC must be declared Sukkur and Larkana as a tax free zone and
start on window operation facility for the purpose of attracting to
the new investors.
• Duties should be lowered on imported machinery so that owners of
small scale industries in Sindh can be used advanced technology for
better quality' of products.
• Throughout the research it has found that Larkana is cultivating the
large scale production of Guava and tomato so it indicates that this
area is feasible for Guava pulp processing industry and tomato
ketchup industry. It has also found that paper board industry is
also feasible because due to waste of PADDY.


159
REFERENCES/BIBLIOGRAPHY
Advanced Engineering Centre for Manufacturing (1995). ISO 9000 Survey Report.
Quality Certification News, Special Report, 2(2), 1-8.
Advantage in Smaller Firms. Journal of Small Business Management. 39(4), 293-311.
Anderson. P. “Small Industry in developing countries. A discussion of issues." world
development. Vol. 10, No, 11, (1982)
Ayyagari, M. Beck, T, and DemirgO^-Kunt, A, (2003), “Small & Medium
Enterprises across the Globe: anew database", World Bank working paper op.
cit.
Bates. Timothy (1990). Entrepreneur Human Capital Inputs and Small Business
Longevity. The Review of Economics and Statistics Vol.LXXXll No. 4
Bates. Timothy, “Self -employed Minorities; Traits and Trends” Social Sciences
Quarterly 68 (1987) 539-550
Beck. T. and Demirgthj-Kunt. A, (2004), “SMEs, growth & poverty”. World Bank.
Public policy for the private sector, note 268
Berry A. and Armando Pinell - Sites, “Small-Scale Enterprises in Columbia A case
study, studies in employment and Rural Development No. 56, (department of
development economies, world bank (1979).)
Brock, Willian. and Devid Evans (1986) The Economics of Small Business (New
York. Holmes and Meir, 1986)
Chittenden, F, Poutziouris, P., & Mukhtar. S-M. (1998). Smail Firms and the ISO
9000 Approach to Qualitv Management. International Small Business Journal,
17(1), 73-88.
Cohn. T., and Lindberg. R. A. 1974 Survival and Growth: Management Strategies
for the small firm. New York: AMACON.
David C McClelland 1969 the free press. New York “Motivating Economic
Achievement” The Urge to achieve, think, November December 1966 page 22

160
Department of Industry, Science & Tourism (1997). A Portrait of Australian
Business: Results of the 1995 Business Longitudinal Survey - Small Business
Research Program, Joint Productivity Commission and Department of Science
and Technology Publication, Canberra. Australia.
Dougllas, Merril (1976), "Relating Education to Entrepreneurial success”. Business
Horizons 19, p40-44
Drucker. P. 1985, Innovation and Entrepreneurship, William Heinemann.
GEM Project: Various reports www.gcmconsortium.org.
Entrepreneurial Development Written by (S.S. KHANKA) first edition 1999.
Federal Buresu of statistics census of manifesting Industries 1990-2004 Karachi
Government of Pakistan.
Freedman. J., & Godwin. M. (1994). Incorporating the micro business: Perceptions
and Gopa consultants study on Small-Scale Industries in Pakistan volume 1,
Vienna: UNDO. 1981.
Hallberg, KA, (2000) "Market-oriented strategy for small and medium scale
enterprises”, IFC Discussion Paper 40
Hanks, S.H.. Watson, C.. Jansen, E., & Chandler, G. (1993). Tightening the life-cycle
construct: Ataxonomic study of growth stage configurations in high-
technology organisations. Entrepreneurship Theory and Practice 18(2), 5-29.
Hoffman, K, (2005), “Enterprise solutions to poverty", Shell Foundation op. cit.
Husband, S.. & Mandal. P. (1999). Perceptions and Realities of Quality Methods in
Australian Small- to Medium-sized Enterprises. Proceedings of the !2is Annual
SEAANZ ConferenceNicloria University of Technology', Mav, 143- 157.
Hussain S.l. "Allocate and technical efficiency a study of small enterprise in rural
Bangladesh. (World Bank 1983).
Irwin, D, and Grayson. D. (2001), "Educating Entrepreneurs”, a speech delivered at
the RSA
161
Jovanovic. Boyan.(1982) “Selection and Evolution in Industry”, Econometrica 5O.p
649-670
K Sadhak: The Role of Entrepreneur in Backward Area. Dava Publishing, Delhi
1989 PP 78-80
Kilby. P. "Small-Scale Industry in Kenya, (development economics department,
world banks 1981).
Klein. M, writing in ‘IFC 2004 Annual Review: small business activities’, World
Bank
Kuratko, D.F., Goodale, J.C., &Homsby, J.S. (2001). Quality Practices for a
Competitive
Lucas. Robert (1978), On the Size of Distribution of Business Firms, The Bell
Journal of Economics- 9 p 508-523
Luetkenhorst. W. (2004) “Economic development the role of SMEs and the rationale
for donor support: some reflections on recent trends and best practices”,
UNIDO
Malik Mhammadn Hussain and Aftab .Ahmed Cheema. Winter 1986 “ the role of
Small-Scale Industry in Pakistan Economy and Government Incentives . The
Pakistan development review. VoL xxv. No.4.
McMahon. R.G.P. (2001). Deriving an empirical development taxonomy for
manufacturing SMEs using data from Australia's business longitudinal survey
. Small Business Economics 17(3), 197-212.
McMahon. R.G.P., Holmes. S., Hutchinson. P., &Forsaith. D. (1993). Small
enterprise financial management Theory and practice. Harcourt Brace.
Sydney, New South Wales, misperceptions In Finance and the small firm eds
A.. Hughes &Storey. D. 232-283.
Muzmdar. D. “A descriptive Analysis of the role of Small-Scale Enterprise in the
Indian Economy”, (W orld Bank December, 1979)
Navid Hamid and Ijaz Nabi, “Role of Small-Scale Industries in employment
generation”. Pakistan economic and social review Vol. XXII Nos 1 and 2

162
summer / w inter 1984 pp 43-64
Papanek. G. 1967. Pakistan's Development - Social Goals and Private Investment
Harward University Press.
Pappas. Carter. Evans &KoopTelesis. (1990). The global challenge: Australian
manufacturing in the 1990s. Australian Manufacturing Council Melbourne.
Pasha. Hafiz A and Zafar H. IsmaiL April. 1989. determinants of success of
industrial estate in Pakistan discussion paper # 103
Ramsey . J. (1998). The Value of ISO 9000 Certification to a Small Business.
Proceedings: Second International and Fifth National Research Conference on
Quality Management, February, 145-156.
Report originally seen (2000) at www .arthurandcrson.com; see Fortune 27 Nov 2000
for summary Written by Cobweb information Ltd Routledge, London.
Schramm. CJ. (2004), “Building entrepreneurial economies”. Foreign Affairs. Jul-
Aug pp!04-l 15
Shapiro. Albert (1975), “ The Displaced Uncomfortable Entrepreneur”. Psvchologv
Today 9 p83-88
Sickness in Small Industry Written by (T.S. FEDDY & LV. REDDY) Published by
Himalaya Publishing House.
SS khanka: Entrepreneurship in Small Scale Industries. Himalva Publishing House.
Delhi 1990 Page 114-115.
Staley, e. and R, Morse "Modern Small-Scale Industry for Developing countries
(McGraw Hill, 1965)
Terziovski, M., Samson, D. & Dow, D. (1997). The Business Value of Quality
Management Systems Certification: Evidence from Australia and New
Zealand. Journal of Operations Management, 15( 1). pp. I -18.
Timmons, J, "New Venture Creation”, Irwin and Schramm. CJ, “Building
Entrepreneurial Economics”
163
UN Commission Report on Private Sector Development (2004) “Unleashing
Entrepreneurship" Does Entrepreneurship Lead to Economic Growth ? An
unanswered question. C Cobweb Information Ltd 2007 Page 6 of 6
Unlocking the Potential of Small Enterprises for Economic Development Written by
(Iqbal M. Khan 2004)
WDR 2005, op. cit.
Wide van der, T., & Brown, A. (1998). Venturing Dowm the TQM Path for SMEs.
Internationa Small Business Journal, 16(2), 50-68.
World Bank (2004), “World development report 2005: A Better Investment Climate
for Everyone". IBRD/W'orld Bank
World Bank (2004a), “Doing business in 2004” IBRD/World Bank
World Bank, experiment and development of Small Enterprise (Washington D.C,
February 1978)
Zeira. Joseph (1987), “Investment as a Process of Search”, Journal of Political
economy. 95 p204-210.

164
APPENDIX - A
QUESTIONNAIRE FOR OWNERS / MANAGERS OF DIFFERENT SMALL
SCALE INDUSTRIES
AT LARKANA AND SUKKUR ESTATE AREA
INTRODUCTION
1. Nature of firm
2. Name of owner
3. . foundation year / date
4. Total cost of established units in RS.
5. Total load in Rs.
6. Interest in load in Rs. Per Year
7. Own investment Yesor No
8. Name of Bank, where load has been taken
9. Total investment on land in Rs.
10. Qualification & Experience of Managers/Owncrs
a) Matriculate □
b) Intermediate □
c) Graduate * □
d) Post Graduate □
e) Any extra qualifications please specify.
f) Past Experience of business
10 years □ 05 years □ 02 years □ 01 year □ or None □

165
g) Age (Please specify)years.
11. Total Number of Employees: Regular Daily Wages Total Over 200
100-199
50-99
25-49
10-24
Below 10 i
12. Mode of Business Firm
a) Partnership (Please specify) name of partner
- How Many? (Please specify in No.
Dividend share of each partner
b) Simple proprietorship
c) Joint stock company (Please specify the name of the
Company)
13. Organizational Structure
President/Manager
Accountant (Please specify the qualifications & Total No.)
Clerk (total numbers)
Peon (total numbers)
Chowkidars (total numbers)
14. Legal Status
Private Limited Company
Unlimited Company
15. Salary and Wage Structure
a) Total Salary of President / Manager in each month in Rs.

166
b) Total Salary of Accountant in each month in Rs.
c) Total Salary of Clerks in each month in Rs.
16. Daily Wages
a) Total number of labors on daily wages
b) Total wage rate of per day of each labour
17. Strategy and Vision of the Manager
What are your goals and objectives of this business?
a) Earn more and more profit
b) Provide the goods and services to the people
c) To be pioneering industry in local, national. International level
d) To expand the firm in to medium and large
c) Or all above
15. Method of Production
a) Daily output
b) Input of labor, how much number of labour is engaged daily
c) Input of materials how much materials is used daily
d) Input of capital how much capital is involved daily in rupees
e) Quality of product: Very good □ Good □ Average o Below average □
19. Materials
f) Nature of raw materials
g) From where to purchase? Local Level from other area abroad
h) Quality of raw materials. Very good □ good □ Average □
Below average □

167
20. Age of the Business Finn
a) Established before partition
b) During 1950s
c) During 1970s
d) During 1980s
e) During 1990s 0 During 1998-99
g) During 1999-2000
21. Organizational Design
a) Flat
b) Tall
c) Medium
22. Market
(Please mention about the various market where you are selling your
products. Locally)
a) Name of Place by Abroad: Name of Place -
c) Transportation expenditure in year in Rs.
23. Structure of Market
a) Competition
b) Monopoly
c) Oligopoly
24. Government Policies
a) Income tax: Please tell me. how various taxes are affect on the cost
production? If yes how much? 5% 10% 15%
20%
b) Plese tell me about different taxes which are hampring the growth of
small industries in Larkana/Sukkur Regoins. Plese specify your answer.

168
25. Electricity or load-shedding problem
a) Can you describe about the load shading problem and its affect on
output production in daily.month ____ Year
169
b) Production without load-shedding:
Per Day month
Year ____________
c) Do you think that load shedding is a major reason of declining situation
of various small scale industries in estate of area of Larkana or
Sukkur?
Yes No (if yes please specify).
26. Customer
a) What type of customer are purchasing your production: Lower class □
Middleclass □ Upper class □
27. Channels of distribution
a) Whole-seller
b) Retailers
c) Middle men's
d) Direct, or all above
28. Product pricing
a) What is the basis of pricing produces? Discount Price Cost + Markup
Competitive price
b) Any other please specify
29. Investment

170
a) What is total investment?
Less than two lacs
More titan two or four lacs
More than four to six lacs
More than six to eight lacs
More than eight to 10 lacs
More than ten lacs (please specify total amount in Rs.)
b) How the capital was arranged for establishing this unit?
Self
Load from relative or fried
Load from Govt, schemes
(Please specify the name of scheme)By Banks
(Please specify the name of the Banks)
I
30. progress and problem
a) Over the past 10 years has your firm been growing in terms of sales.
net profit and number of employees? If yes. how much (Please specify)
b) Employees total number have been increased
c) Sales in quantity
d) Net profit in Rs.
e) Total employ ment created during last 10 years
f) Again over the past 5 years, have any other major development
affected the firm's growth in terms of employment, net sales, net profit
or decrease in number of employees 3% %5 10% 15%
20%
g) Decrease in Net sales 2% 3% 4% 5%

171
Or above (if so. please specify)
h) Decrease in Net Profit 2% 3% 4% 5%
Or above (if so. please specify)
31. Have you any other plans for next 5 years? (Please specify in detail)
32. What do you see as the main obstacles in the way these goals for next 5 years
can not be met? (Please specify in detail)
33. Do you propose staying in the firm until yon retire. Yes or No.
34. Do you feel it is desirable or not desirable that firm should stay in your
family? Why do you say that? (Please specify your answer)
35. Where do you see the firm in ten years time? (Please specify1 your answer)
36. In your experience of business w hat quantities do you recommend as
necessary for success? (Please specify your answer)

172
37. In your experience of business what quantities do you recommend for
Manager/President of firm? (Please specify your answer)
38. in your business experience, would you like to tell us the major causes of
sickness of various units?
a) Lack of management know ledge.
b) Lack of skilled labor
c) in adequate provision of raw material.
d) Electricity problem
e) Govt. Policies & new taxes.
x f) Lack of credit facilities.
g) All above.
39. Do you think that, political instability is a major hurdle in the development of
small industries in Sindh, Yes or No.
40. Do you think that, the director of small scale industries corporation is
providing the better
Information about the change of Govt, Policy
Change of market situation
About new schemes of Govt.
A providing the better advices to increase the efficiency of the firm?
41. Do you know about the some analy tical techniques of the business, w hich are
helpful to analyze the business position like:
a) Break-even analysis point. (Yes or No) or others please specify.
42. Before establishing this firm what were the business objectives, goals and
mission. (Please specify your answer).

173
43. How did you assume that I would be successful to achieve the all kinds of
Business Goals and objectives in the future? Please specify the basic logics of
plans: (Please specify your answer)
44. Did you identify the customer need, wants and desire for satisfaction before
selling the product in the market, (Yes or No) (If yes please specify your
answer)
45. Suppose you are understanding that now a days your firm is going in
declining situation, then what ty pes of measures you will take to avoid such
situations: (if yes please specify your answer).
46. What barrier stand in the way of good performance:
a) lack of experience of any kind of business
b) lack of managerial knowledge
c) lack of marketing knowledge
d) lack of proper education of business
e) lack of training

174
f) or all above
47. . Do you think that “Ambition” is relating with business results, such as,
a) To increase the productivity and quantity
b) To increase the cost
c) To earn the more profit
48. If the information comes in that a new material has been developed hat w ill
you do:
a) wait for more information
b) consider how to use it.
49. What is your behavior with the employees?
a) Polite
b) Harsh
c) Dictated
d) Mixed
50. If an executive oppose your new product strategy , w hatw ill you do?
a) Shelve up temporarily
b) Preside persistently
51. What you think about gathering products related information?
a) Gather as much as possible
b) Gather selected information
52. What are the major goals of your firms?
a) New product development

175
b) Markets share expansion
e) Or all above
53. Would you like Io tell us about the patterns of decision making process such
as:
a) President s own point of view
b) Decision by the president upon consultation with executives.
c) According to executives views.
54. Would you like tell us about the various motivating factors which are very
essential to increase the productivity and efficiency of workers such as:
a) Adequate pay system
b) Fairly wage system
c) Conductive working conditions
d) Better human relations
e) Status / Promotion
f) Job Satisfaction


173
Appendix –B
What are the major causes of establishing the small scale industries?
1. Availability of raw material
2. Availability of labor
3. Availability of market
4. Availability oFinfra structure
5. Govt: incentives
6. Social conditions

174
Appendix -C
Please tick the, which factor is a first cause of sickness, second, third, fourth, fifth, sixth,
seventh, and eighth from the following factors.
/
1. Lack of managerial know ledge
2. In adequate feasibility
3. Marketing problems
4. Poor credit facilities
5. Short fall of w orking capital
6. Load shedding
7. Tax problem
8. Law and order problem

175
Appendix -D
Please tick the last occupation before establishing the small scale industry
1. Land lord
2. Profession such as lawyer, clerk , officer, technician .teacher.
3. Business
4. Industry


17S
Appendix-E
List of Questions
• I start my work with full confidence that I will succeed
• I welcome challenges and opportunities
• Before starting a new project, I collect a great deal of information
• I devote the most of my time to my work
• I try to find ways and means to accomplish to my task with in the shortage
possible time
• I prefer to do task that I know-well
• I try to persuade people to do what I want
• I work for long hours to complete my work
• I think of many new ideas
• I change my decision when others succeed to convince me that I am wrong
• I look for new opportunities like a watch dog
• I always try to continue my efforts in-spite of several odds come in the way
• I try to find ways to do things for less cost
• When I am confused, I seek others advise
• I take the advantage of opportunities as and when that arise
• I want to see my industry that best of its type
• I do not let my work interfered by others
• I try to get the maximum return from my limited resources
• I do my work systematically and logically
• I apply alternative approaches to solve the problems
• I strict with my decision even If others disagree with me
• I am always in search of people who can help me in my work
• I prefer to do risky ventures

4
• I try to take lessons from my past doings
• I do my level best to satisfy others through my work
Note: Above questions are based on the five point likert scale, strongly
disagree, disagree, neither disagree nor agree, agree, strongly agree.


176


178


180


182

184


186


188


190


192