Embed Size (px)
Citation preview

Chin. Phys. B Vol. 21, No. 5 (2012) 058101
Growth and annealing study of hydrogen-doped
single diamond crystals under high
pressure and high temperature∗
Li Yong(李 勇), Jia Xiao-Peng(贾晓鹏), Hu Mei-Hua(胡美华),
Liu Xiao-Bing(刘晓兵), Yan Bing-Min(颜丙敏), Zhou Zhen-Xiang(周振翔),
Zhang Zhuang-Fei(张壮飞), and Ma Hong-An(马红安)†
State Key Laboratory of Superhard Materials, Jilin University, Changchun 130012, China
(Received 7 September 2011; revised manuscript received 25 October 2011)
A series of diamond crystals doped with hydrogen is successfully synthesized using LiH as the hydrogen source
in a catalyst-carbon system at a pressure of 6.0 GPa and temperature ranging from 1255 C to 1350 C. It is shown
that the high temperature plays a key role in the incorporation of hydrogen atoms during diamond crystallization.
Fourier transform infrared micro-spectroscopy reveals that most of the hydrogen atoms in the synthesized diamond are
incorporated into the crystal structure as sp3 –CH2-symmetric (2850 cm−1) and sp3 CH2-antisymmetric vibrations
(2920 cm−1). The intensities of these peaks increase gradually with an increase in the content of the hydrogen source
in the catalyst. The incorporation of hydrogen impurity leads to a significant shift towards higher frequencies of the
Raman peak from 1332.06 cm−1 to 1333.05 cm−1 and gives rise to some compressive stress in the diamond crystal lattice.
Furthermore, hydrogen to carbon bonds are evident in the annealed diamond, indicating that the bonds that remain
throughout the annealing process and the vibration frequencies centred at 2850 and 2920 cm−1 have no observable shift.
Therefore, we suggest that the sp3 C–H bond is rather stable in diamond crystals.
Keywords: high pressure and high temperature, hydrogen-doped diamond crystals, annealing, LiHadditives
PACS: 81.05.ug, 61.72.U–, 81.10.–h DOI: 10.1088/1674-1056/21/5/058101
1. Introduction
Due to the unique physical, chemical, mechan-
ical, and electrical properties of diamond, natural
and synthetic diamonds have been widely used for a
long time.[1−3] As is well known, hydrogen is one of
the most common impurities in natural diamond.[4−7]
Theoretical studies have shown that semiconductor
properties could be endowed by attaching hydrogen to
diamond.[8] In 1989, it was reported that a natural di-
amond single crystal subjected to the action of atomic
hydrogen in hydrogen plasma could remarkably reduce
its resistivity from a high value of 1016 Ω · cm to about
105 Ω · cm.[9]
In recent years, investigations into hydrogen in
the chemical vapour deposition (CVD) of diamond
have been extensively performed.[10−12] However, the
measurement results have shown that hydrogen exists
mainly at the grain boundaries of the CVD diamond
film. Whether hydrogen exists in diamond film struc-
tures is still under argument.[13]
Nevertheless, so far, there have been hardly any
reports on synthetic diamond doped with hydrogen
under high pressure and high temperature (HPHT).
Considering this, we now attempt to prepare single
diamond crystals doped with hydrogen and study the
behaviours of hydrogen in synthesized diamond.
In the present investigation, hydrogen is inten-
tionally incorporated into synthesized diamond. In
order to obtain a better understanding of the defects
involved, the experiments doped with LiH additive in
a range from 0.0% to 0.3 % (the weight ratio in the
crystal) are performed in an Fe59Ni25Co16–C system
at a pressure of 6.0 GPa and temperature ranging from
1255 C to 1350 C. Moreover, the effects of hydrogen
incorporation are investigated in detail. Our results
may benefit the further study of the incorporation of
hydrogen and nitrogen into natural diamond.
∗Project supported by the National Natural Science Foundation of China (Grant No. 51172089) and the Program for New Century
Excellent Talents in University of China.†Corresponding author. E-mail: [email protected]
c⃝ 2012 Chinese Physical Society and IOP Publishing Ltdhttp://iopscience.iop.org/cpb http://cpb.iphy.ac.cn
058101-1

Chin. Phys. B Vol. 21, No. 5 (2012) 058101
2. Experimental procedure
All experimental runs were performed in a China-
type large volume cubic high-pressure apparatus
(CHPA) (SPD-6×1200).[14,15] The sample assembly
for the synthesis of diamond using the tempera-
ture gradient method (TGM) has been reported
previously.[16−21] The temperature was calibrated us-
ing a Pt-6% Rh/Pt-30% RH thermocouple, whose
junction was placed near the crystallization sample.
Pressure was measured at room temperature by the
change in resistance of the standard substances and at
the temperature when the graphite-diamond equilib-
rium was reached. The 100 face of a high-quality di-
amond crystal was selected as the growth facet. High-
purity graphite powder (99.9% purity) was employed
as the carbon source, and single diamonds were grown
in the Fe59Ni25Co16–C system. Then, LiH powder
was directly added into the catalyst as the hydro-
gen source, and the sample selected was annealed in
a solid-state cell at a temperature of 1870 C and a
pressure of 6.8 GPa for 30 min.
After synthesis, the crystallization samples were
dissolved in hot acids mixed with H2SO4 and HNO3
to remove the remaining graphite and metal catalyst
from the crystal surface. After annealing, synthetic
diamond was removed from the sample chamber and
cleaned in boiling acids (HCl,HNO3). Then, the in-
frared spectra were measured with a Perkin–Elmer
2000 Fourier-transform infrared (FTIR) spectrometer
in a spectral range between 400 and 4000 cm−1 with a
spectral resolution of 2 cm−1 in transmittance mode.
X-ray photoelectron spectroscopy (XPS) was used to
detect the state of Li in the diamond structure. Fur-
thermore, the synthesized products were characterized
by Raman spectra to analyse the stress in the diamond
lattice.
3. Results and discussion
3.1.Hydrogen-doped single diamond
crystallization
A schematic diagram of the growth cell is shown
in Fig. 1. Growth runs were carried out at a fixed
pressure of 6.0 GPa and in a temperature range of
1255–1350 C. The experimental results obtained in
the Fe59Ni25Co16–C system are summarized in Table
1. As clearly illustrated, the synthesis temperature
of the growing high-quality pure diamond single crys-
tal generally increases slightly with the increase in the
LiH additive in the system. Otherwise, skeletal crys-
tal would be produced because of the inappropriate
synthesis temperature.
Fig. 1. (colour online) Schematic diagram of the growth
cell. 1: pyrophyllite; 2, 5: ceramic cylinder and cover;
3: graphite heater; 4: seed; 6: steel ring; 7: insulator; 8:
carbon source; 9: alloy solvent; 10: metal plate.
Table 1. Experimental results of the crystallization of di-
amond in the Fe59Ni25Co16–C system with LiH additive.
Runs LiH /% Temperature/C Time/h Colour
N-1 0.0 1255 6 yellow
N-2 0.1 1255 6 –
N-3 0.1 1262 6 yellow
N-4 0.2 1262 6 –
N-5 0.2 1262 6 yellow
N-6 0.3 1262 7 –
N-7 0.3 1273 8 yellow
N-8 ¿0.3 1273∼1350 8 –
Figure 2 shows optical images of typical single di-
amond crystals synthesized under HPHT conditions.
Obviously, the obtained diamonds all exhibit cubic or
cub-octahedral shapes with dominant 100 faces and
minor 111 faces, and display yellowness. The sizes of
the four samples are all approximately 2 mm in diame-
ter. However, it is necessary to note that high-quality
single crystal is extremely difficult to obtain as the
content of additive LiH exceeds 0.3 %, which can be
explained as follows. In the system, H can be offered
by LiH decomposition under a pressure of 4–4.5 GPa
and a temperature of 850 C,[22] so a rich-hydrogen
environment can be established. In addition, it is
extremely difficult to completely expel the inherent
free-nitrogen, which comes from the air and raw ma-
terials, from the chamber. Thus, rich-hydrogen and
nitrogen simultaneously introduced into the cell may
change the behaviours of the catalyst/solvent, such
as the glutinosity, the liquid surface tension, and the
058101-2

Chin. Phys. B Vol. 21, No. 5 (2012) 058101
capability of dissolving graphite, and the change re-
strains the growth of high-quality diamond crystal.[23]
Hence, the content of LiH must be controlled strictly
in the growth process.
Fig. 2. (colour online) Optical images of diamond doped
separately with LiH additive of (a) 0.0%, (b) 0.1%, (c)
0.2%, (d) 0.3%.
3.2. FTIR spectra of hydrogen-doped di-
amond
For the spectroscopic characterization, a number
of diamond crystals are selected from runs N-1, N-3,
N-5 and N-7 for further analysis. In Fig. 3, the FTIR
spectra of these representative diamond crystals are
recorded in a range from 1000 to 3500 cm−1. It is re-
vealed that the absorptions at 1130 and 1344 cm−1 are
typical for synthesized crystals and attributed to the
C-centre with a single substitutional nitrogen atom.
In addition, the hydrogen-related absorption is hardly
found in the diamond (sample A, as shown by curve
a) without any LiH additive. However, samples B, C,
and D all exhibit absorptions at 2850 and 2920 cm−1,
as shown by curves b, c, and d, respectively. As dis-
cussed in previous reports,[24−26] the two peaks of ab-
sorption are attributed to sp3 –CH2-symmetric vibra-
tions and sp3 CH2-antisymmetric vibrations, respec-
tively. Hence, this allows us to conclude that H atoms
potentially occupy the lattice sites of the carbon atoms
in diamond structure and bond with C atoms, which
leads to the formation of H in the form of sp3. Addi-
tionally, the tendency shown clearly in Fig. 3 is that
the intensities of the 2850 and 2920 cm−1 hydrogen-
related peaks increase with an increase in the ratio of
LiH additive. It should be noted that so far there has
been no reliable method to determine the concentra-
tion of H incorporated as an impurity in diamond. Ap-
parently, further investigations on this subject should
be carried out.
XPS is used to detect whether Li exists in the di-
amond structure. The XPS for the diamond with an
LiH content of 0.3% is shown in Fig. 4. In Fig. 4, no
signal related to Li is observed, which indicates that
Li atoms are not trapped in diamond structure. This
is possibly because the overwhelming majority of Li
elements remain in the catalyst.
Fig. 3. (colour online) FTIR spectra of diamonds synthe-
sized separately by adding an LiH additive of 0.0%, 0.1%,
0.2%, and 0.3% for curves a b, c, and d, respectively.
Fig. 4. The XPS of diamond with an Li–H content of
0.3 %.
Furthermore, the corresponding relationship be-
tween hydrogen incorporation and the concentration
of substitutional nitrogen is investigated in detail. Ac-
cording to the absorption coefficient of the IR spec-
tra, the concentrations of nitrogen impurity can be
evaluated.[24,27] Our results indicate that the substi-
tutional nitrogen concentration in diamond decreases
from 416 ppm to 80 ppm as LiH content increases from
0.0% to 0.3%. It is a likely explanation that hydrogen
058101-3
Chin. Phys. B Vol. 21, No. 5 (2012) 058101
atoms can be effectively incorporated into diamond
and hydrogen atoms restrain the nitrogen atoms from
entering into the diamond structure.
3.3.The effect of hydrogen on the Ra-
man spectrum of diamond
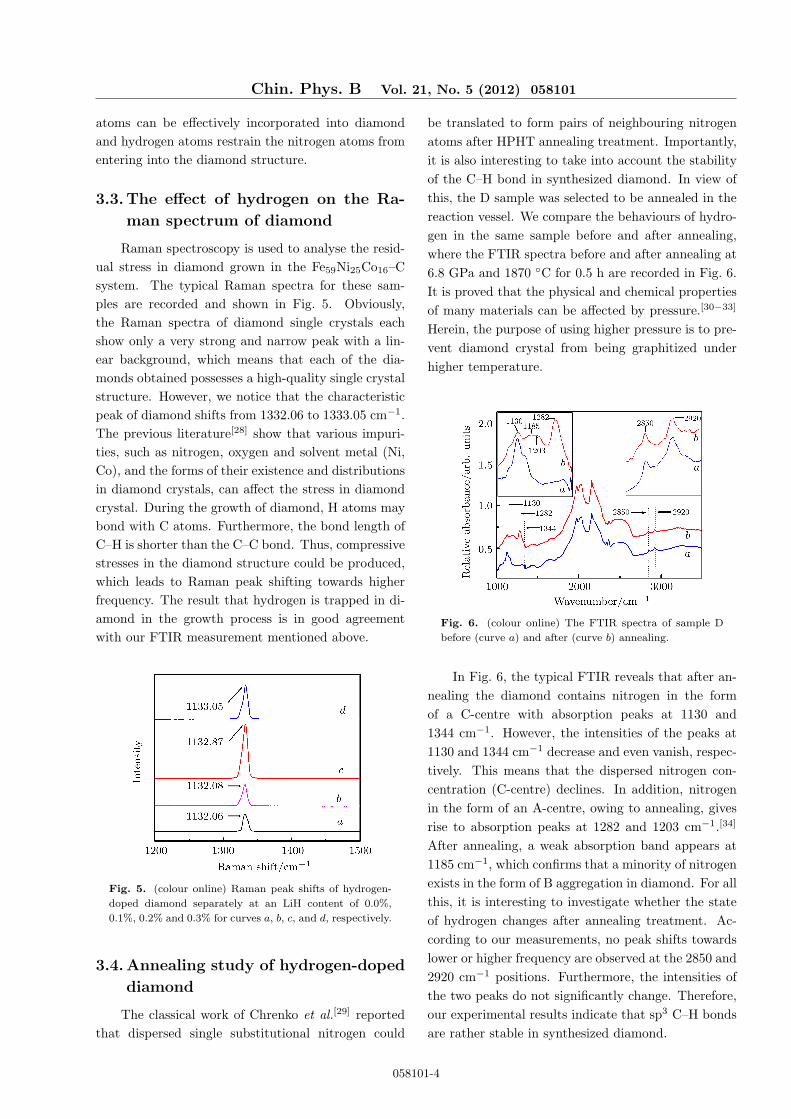
Raman spectroscopy is used to analyse the resid-
ual stress in diamond grown in the Fe59Ni25Co16–C
system. The typical Raman spectra for these sam-
ples are recorded and shown in Fig. 5. Obviously,
the Raman spectra of diamond single crystals each
show only a very strong and narrow peak with a lin-
ear background, which means that each of the dia-
monds obtained possesses a high-quality single crystal
structure. However, we notice that the characteristic
peak of diamond shifts from 1332.06 to 1333.05 cm−1.
The previous literature[28] show that various impuri-
ties, such as nitrogen, oxygen and solvent metal (Ni,
Co), and the forms of their existence and distributions
in diamond crystals, can affect the stress in diamond
crystal. During the growth of diamond, H atoms may
bond with C atoms. Furthermore, the bond length of
C–H is shorter than the C–C bond. Thus, compressive
stresses in the diamond structure could be produced,
which leads to Raman peak shifting towards higher
frequency. The result that hydrogen is trapped in di-
amond in the growth process is in good agreement
with our FTIR measurement mentioned above.
Fig. 5. (colour online) Raman peak shifts of hydrogen-
doped diamond separately at an LiH content of 0.0%,
0.1%, 0.2% and 0.3% for curves a, b, c, and d, respectively.
3.4.Annealing study of hydrogen-doped
diamond
The classical work of Chrenko et al.[29] reported
that dispersed single substitutional nitrogen could
be translated to form pairs of neighbouring nitrogen
atoms after HPHT annealing treatment. Importantly,
it is also interesting to take into account the stability
of the C–H bond in synthesized diamond. In view of
this, the D sample was selected to be annealed in the
reaction vessel. We compare the behaviours of hydro-
gen in the same sample before and after annealing,
where the FTIR spectra before and after annealing at
6.8 GPa and 1870 C for 0.5 h are recorded in Fig. 6.
It is proved that the physical and chemical properties
of many materials can be affected by pressure.[30−33]
Herein, the purpose of using higher pressure is to pre-
vent diamond crystal from being graphitized under
higher temperature.
Fig. 6. (colour online) The FTIR spectra of sample D
before (curve a) and after (curve b) annealing.
In Fig. 6, the typical FTIR reveals that after an-
nealing the diamond contains nitrogen in the form
of a C-centre with absorption peaks at 1130 and
1344 cm−1. However, the intensities of the peaks at
1130 and 1344 cm−1 decrease and even vanish, respec-
tively. This means that the dispersed nitrogen con-
centration (C-centre) declines. In addition, nitrogen
in the form of an A-centre, owing to annealing, gives
rise to absorption peaks at 1282 and 1203 cm−1.[34]
After annealing, a weak absorption band appears at
1185 cm−1, which confirms that a minority of nitrogen
exists in the form of B aggregation in diamond. For all
this, it is interesting to investigate whether the state
of hydrogen changes after annealing treatment. Ac-
cording to our measurements, no peak shifts towards
lower or higher frequency are observed at the 2850 and
2920 cm−1 positions. Furthermore, the intensities of
the two peaks do not significantly change. Therefore,
our experimental results indicate that sp3 C–H bonds
are rather stable in synthesized diamond.
058101-4

Chin. Phys. B Vol. 21, No. 5 (2012) 058101
4. Conclusion
In this paper, the results presented provide evi-
dence that hydrogen may be incorporated into syn-
thesized diamond single crystals during growth under
HPHT conditions. FTIR measurements show that
the absorptions associated with hydrogen peaked at
2850 and 2920 cm−1. Furthermore, it has been ob-
served that the intensities of hydrogen-related absorp-
tions are enhanced when the content of the hydrogen
source is increased. Due to the production of com-
pressive stress in the as-grown specimens, the Raman
peak shifts towards higher frequency. Finally, anneal-
ing experiments suggest that the 2850 and 2920 cm−1
positions shift towards neither lower nor higher fre-
quency. The result indicates that the sp3 C–H bond
is rather stable.
References
[1] Kim Y D, Choi W, Wakimoto H, Usami S, Tomokage H
and Ando T 1999 Appl. Phys. Lett. 75 3219
[2] Zhang W J, Wu Y, Wong W K, Meng X M, Chan C Y,
Bello I, Lifshitz Y and Lee S T 2003 Appl. Phys. Lett. 83
3365
[3] Shin D C, Sarada B V, Tryk D A and Fujishima A 2003
Anal. Chem. 75 530
[4] Weerdt F D and Kupriyanov I N 2002 Diamond Relat.
Mater. 11 714
[5] Kiflawi I, Fisher D, Kanda H and Sittas G 1996 Diamond
Relat. Mater. 5 1516
[6] Jr Kindlein W, Livi R P, Balzaretti N M and Jornada J
A H 2000 Diamond Relat. Mater. 9 22
[7] Kania P and Oelhafen P 1995 Diamond Relat. Mater. 4
425
[8] Dai Y, Yan C X, Li A Y, Zhang Y and Han S H 2005
Carbon 43 1009
[9] Landstrass M I and Ravi K V 1989 Appl. Phys. Lett. 55
1391
[10] Fuchs F, Wild C, Schwarz K and Koidl P 1995 Diamond
Relat. Mater. 4 652
[11] Connell S H, Sellschop J P F, Butler J E, Maclear R D,
Doyle B P and Machi I Z 1998 Diamond Relat. Mater. 7
1714
[12] Teukam Z, Ballutaud D, Jomard F, Chevallier J, Bernard
M and Deneuville A 2003 Diamond Relat. Mater. 12 647
[13] Ping Loh K, Nishitani-Gamo M, Sakaguchi I, Taniguchi
T and Ando T 1999 Diamond Relat. Mater. 8 1296
[14] Huang G F, Jia X P, Li S S, Zhang Y F, Li Y, Zhao M
and Ma H A 2010 Chin. Phys. B 19 118101
[15] Qin J M, Zhang Y, Cao J M and Tian L F 2011 Acta
Phys. Sin. 60 58012 (in Chinese)
[16] Strong H M and Wentorf J R H 1972 Naturwissenschaften
59 1
[17] Strong H M and Chrenko R M 1971 J. Phys. Chem. 75
1838
[18] Kanda H 2000 Braz. J. Phys. 30 482
[19] Shigley J E, Abbaschian R and Clarke C 2002 Gem and
Gemology 38 301
[20] Yarnell A 2004 Chem. Eng. News 82 35
[21] Sumiya H, Toda N and Satoh S 2000 New Diamond Front.
Carbon Technol 10 233
[22] Du Y H, Ji X R, Yang X X, Gong X L, Yang D P, Su Z
P and Zhang T C 2007 Diamond Relat. Mater. 16 1475
[23] Liang Z Z, Jia X P, Ma H A, Zang C Y, Zhu P W, Guan
Q F and Kanda H 2005 Diamond Relat. Mater. 14 1932
[24] Coudberg P and Catherine Y 1987 Thin Solid Films 146
93
[25] McNamara K M, Williams B E, Gleason K K and Scruggs
B E 1994 J. Appl. Phys. 76 2466
[26] Field J E 1992 The Properties of Natural and Synthetic
diamond (London: Academic) P36-41, P81-179
[27] Kiflawi I, Mayer A E, Spear P M, van Wyk J A and Woods
G S 1994 Philos. Mag. B 9 1141
[28] Anthony T R 1995 Diamond Relat. Mater. 4 1346
[29] Chrenko R M, Tuft R E and Strong H M 1977 Nature 270
141
[30] Zou Y G, Liu B B and Liu Y C 2007 Acta Phys. Sin. 56
5172 (in Chinese)
[31] Qin J M, Zhang Y, Cao J M, Tian L F, Dong Z W and Li
Y 2011 Acta Phys. Sin. 60 36105 (in Chinese)
[32] Zhou M, Zhang P, Liu T C, Xu D P, Jiang Y H, Gao S Q
and Li Z W 2010 Acta Phys. Sin. 59 210 (in Chinese)
[33] Wu B J, Han Y H, Hang G, Liu C L, Wang Y and Gao C
X 2010 Acta Phys. Sin. 59 4235 (in Chinese)
[34] Sutherland G B B M, Blackwell D E and Simeral W G
1954 Nature 174 901
058101-5