Embed Size (px)
Citation preview

Growing Up in New ZealandNow We Are Born
2012

i
Susan M.B. Morton
Polly E. Atatoa Carr
Cameron C. Grant
Arier C. Lee
Dinusha K. Bandara
Jatender Mohal
Jennifer M. Kinloch
Johanna M. Schmidt
Mary R. Hedges
Vivienne C. Ivory
Te Kani R. Kingi
Renee Liang
Lana M. Perese
Elizabeth Peterson
Jan E. Pryor
Elaine Reese
Elizabeth M. Robinson
Karen E. Waldie
Clare R. Wall
Suggested citation: Morton, S.M.B., Atatoa Carr, P.E., Grant, C.C., Lee, A.C., Bandara, D.K., Mohal, J., Kinloch, J.M., Schmidt, J.M., Hedges, M.R., Ivory, V.C., Kingi, T.R., Liang, R., Perese, L.M., Peterson, E., Pryor, J.E., Reese, E., Robinson, E.M., Waldie, K.E., and Wall, C.R. 2012. Growing Up in New Zealand: A longitudinal study of New Zealand children and their families. Report 2: Now we are born. Auckland: Growing Up in New Zealand.
ISSN: 2253-251X (Online), ISSN: 2253-2501 (Print)
© Growing Up in New Zealand 2012
Contact details: Dr Susan Morton, Director, Growing Up in New Zealand, PO Box 18288, Auckland 1743, Phone +64 9 373 7599.
Further information on Growing Up in New Zealand is available at www.growingup.co.nz
Growing Up in New Zealand: A longitudinal study of New Zealand children and their families
Report 2: Now we are born.
March 2012

GROWING UP IN NEW ZEALAND - NOW WE ARE BORN 2012
ii
While progress has been made through the release of government green papers and high level debate, there is still a great deal of work to be done. I acknowledge the contribution Growing Up in New Zealand is making to this process.
Growing Up in New Zealand delivers some of the research-based evidence required to support quality policy decisions. The importance of this cannot be overstated. We know that policies developed in isolation from the available scientific evidence may be less effective and in some cases lead to adverse consequences. The increasing move towards formalising the way in which science advice is incorporated into policy is to be encouraged.
Growing Up in New Zealand is well positioned to support the government’s vision that every child thrives, belongs, and achieves - not in isolation but as part of families and whānau, and communities. As the cohort ages, the study should deliver a better understanding of the complex interplay of the many factors that lead to child outcomes and help determine protective factors for the most vulnerable members of our society.
A year on from the first report the challenges facing the Growing Up in New Zealand families have not diminished. They are in fact, even more complex as the families negotiate their way through the first nine months of their child’s life. This report marks the beginning of the longitudinal insights the study
is designed to provide us. Early influences on the developmental trajectories of the study children are beginning to emerge and the risk and resilience conferred to specific groups or individuals will be identified over time.
Longitudinal studies such as Growing Up in New Zealand are difficult and complex to conduct but they provide resources of incredible depth – not only for policy makers but for researchers and others with an interest in the issues influencing the development of New Zealand children. I acknowledge the role of The University of Auckland in leading the study to this stage and the continued involvement of government agencies.
The value of Growing Up in New Zealand will increase over time. Along with the value of the knowledge generated there is a great responsibility to respect the contributions made by the families involved in the study. I have no doubt Dr Susan Morton and her team will continue to shoulder this responsibility with the skill and dedication they have shown to date.
Professor Sir Peter Gluckman KNZM, FRSNZ, FMedSci, FRS Chief Science Advisor to the Prime Minister
Foreword
I welcome the opportunity to introduce the second report from Growing Up in New Zealand. This report comes at a time of ever increasing discussion about how families and society can work together to create a positive future for our children and New Zealand.
Photo
: Syd
Man
nio
n

iii
Growing Up in New Zealand is grateful for the continuing support from many groups and individuals.
Most importantly, this study would not be possible without the children and families who have provided us with their information over the last year, and who continue to participate in Growing Up in New Zealand. Once again, this report demonstrates the time, honesty and commitment that our participants have provided to the study. We appreciate all of the feedback from our participants and acknowledge the significant challenges faced by many of our families since their babies were born. We value the privileged position that we have in the lives of our participant families, and we look forward to our continued involvement with them all.
The authors of this report are members of the research team for Growing Up in New Zealand, the Research Director (Dr Susan Morton), Associate Directors (Associate Professor Cameron Grant and Dr Polly Atatoa Carr), Senior Research Fellow (Dr Mary Hedges), Research Fellows (Dr Johanna Schmidt and Dr Jennifer Kinloch) and members of the bio-statistical team (Dr Arier Chi-Lun Lee, Dinusha Bandara and Dr Jatender Mohal). The content of this report is also informed by the experts in the specific research domains and themes for Growing Up in New Zealand. Further information regarding the research team for the study is available on our website: www.growingup.co.nz
This report would not be possible without the efforts of all those involved in the wider Growing Up in New Zealand team. We specifically acknowledge Linda Hefford (Operations Manager), Jude Cooney (Communications Manager), and Peter Tricker (Data and Systems Manager). In addition, our experienced face-to-face and telephone interviewers are acknowledged; as are our data access, retention, community engagement and quality assurance staff. We acknowledge all the team’s achievements for the project over the last year, and we thank them all for their invaluable contribution to the study and this report.
We would also like to acknowledge the key funders of Growing Up in New Zealand, who not only help to sustain the study but also help to ensure that the information from our families contributes evidence to inform the policy environment in New
Zealand. We thank the initial funders of Growing Up in New Zealand, in particular the Ministry of Social Development, supported by the Health Research Council. Since the development phase, the study has also been supported by Auckland UniServices (particularly through the ongoing involvement of Mark Burgess, Megan Putterill and Kerry Price) and The University of Auckland. We acknowledge the continued support of the Vice-Chancellor of The University of Auckland, Professor Stuart McCutcheon; and also thank the former Dean of the Faculty of Medical and Health Sciences (and the now Deputy Vice-Chancellor Strategic Engagement for The University of Auckland), Professor Iain Martin.
Many other government agencies continue to contribute to the ongoing sustainability and utility of Growing Up in New Zealand. We thank particularly the Ministry of Health and the Ministry of Education as well as Te Puni Kokiri, and the Ministries of Justice, Science and Innovation, Pacific Island Affairs, Corrections, Police, Women’s Affairs, Sport New Zealand (formerly SPARC) and the Mental Health Commission. We also acknowledge the support of the Families Commission, Children’s Commission, Department of Labour, Housing New Zealand, Office of Ethnic Affairs, Statistics New Zealand and the Treasury.
In addition, Growing Up in New Zealand acknowledges the ongoing support and advice provided by our Kaitiaki Group (chaired by Professor Sir Mason Durie). This group assists the wider Growing Up in New Zealand team to ensure that the approach of the study is consistent with our Kaitiaki principles (including those of the Treaty of Waitangi), and that the collection, storage, analysis and use of Māori knowledge is compatible with Māori development goals and aspirations. Similarly, we acknowledge the ongoing support and contribution of the national and international members of our Scientific Advisory Group and Data Access Committee.
Growing Up in New Zealand would like to record its gratitude in respect of a $10,000 philanthropic donation which has assisted the printing and publishing of this first longitudinal report. While this donor has chosen to remain anonymous, their generosity is appreciated.
Acknowledgements

GrowinG Up in new Zealand - now we are born 2012
iv
This report is especially exciting because it is the first to provide a truly longitudinal perspective on the development of our children, rather than just a cross-sectional snapshot of their lives. The information described herein is collated from face-to-face interviews and telephone interviews with mothers and partners of the Growing Up in New Zealand children over a 12 month period. It also presents information about the children’s birth and immediate postnatal period, which has been brought together from multiple routine data sources to add to the information provided by the parents.
The Growing Up in New Zealand study has been designed to collect information about what it is like to grow up in New Zealand in the 21st century for our current population of children from before birth until they are young adults. The key features of Growing Up in New Zealand allow this study to reflect the realities for children growing up in the context of the New Zealand environment today, and to provide a depth of evidence with respect to the developmental trajectories of Māori whānau, and of equity and resilience, for the contemporary child population. The study is uniquely positioned to provide this evidence because of the diversity of the families who have agreed to share their stories with us as their children grow up. We are extremely grateful for their continuing participation, for their generosity and honesty, and for their commitment to improving the future for us all.
This study is of relevance not only for researchers and communities, but also for policy-makers. Importantly, this study is uniquely positioned to evaluate current cross-sectoral policies, and their utility, effectiveness and impact on children’s wellbeing in the short-term and over time. It is providing, and over time will continue to provide, evidence about the realities faced by New Zealand families today; this will allow new policy to be developed that is appropriately targeted to address entrenched problems, and to harness success and solutions.
The call for robust research to better inform policy is championed by the Prime Minister’s Chief Science Advisor, Professor Sir Peter Gluckman, as reflected in his foreword for this report. Growing Up in New Zealand is contributing to the collection of that evidence about the importance of the early years of life for shaping future health and wellbeing for the new generation of New Zealanders. This longitudinal report allows an appreciation of what family and child characteristics determine vulnerability in the 21st century New Zealand environment. It also provides evidence about what creates resilience in the face of similar risk factors and environments, evidence which is needed to change our child health statistics and ensure more of our children do survive, thrive, belong and achieve.
This report provides details about the beginning of the children’s journeys, in the context of their families and their wider environments. The children are not yet one year old, but already their developmental pathways are being established. We know how critical the first 1000 days of life (from the beginning of pregnancy until two years of age) are for ensuring that all children have a good start in life and therefore can look forward to a healthy future. This report details how our children are doing at the halfway point in this critical developmental period.
We also know that, internationally, New Zealand children rank very poorly in comparative health and wellbeing statistics. When child morbidity and mortality statistics are compared across countries with similar economic and social conditions (OECD) New Zealand children are often ranked in the bottom third, and sometimes even ranked last. There are also unacceptable inequalities seen with respect to health and developmental outcomes within the New Zealand child population, with poorer outcomes in general for our Māori and Pacific children and their families and for those living in socio-economic deprivation. Despite attempts to remediate these differences in outcomes over several decades,
Directors foreword
It gives me great pleasure to present this second report on behalf of all those involved in Growing Up in New Zealand.
This report describes the development of the new generation of New Zealand children from before they were born (as also described in Report 1: Before we are born) until they are nine months of age.

v
inequalities often remain and in many cases they have increased. It is not enough to continue to simply describe these international and within-population differences. The information provided by the families in Growing Up in New Zealand over time is designed to give a more complete picture about the underlying reasons why we see these differential outcomes, and will therefore provide much better evidence for strategies to reduce inequalities and to improve outcomes for all children. This type of evidence is actively being sought by multiple government agencies to ensure that all children born in New Zealand today have the best start in life and all are enabled to thrive, belong and achieve.
New Zealand should be a good place to raise children. Many of our Growing Up in New Zealand families told us in the antenatal report that they had moved to New Zealand to give their children a better future than they may have had living elsewhere. We know that many of our children already achieve great things; they are growing up healthy and happy and will contribute to a New Zealand that we all want to be part of. Many children will thrive and achieve in the face of adversity and disadvantage. We rarely hear about these successes. In the Growing Up in New Zealand study we celebrate these, and the information we collect
over time from the children and their families will allow us to understand what helps to shape and enable resilience and excellent outcomes for our children, in all areas of their lives, from the very beginning. This capacity to provide evidence about ‘what works’ is an important feature of this new longitudinal study, and one that over time will allow us to create healthy futures for all our children and, at the same time, change our international ranking and reduce the unacceptable inequalities within our population.
The information provided in this report represents the collective voices and stories of the diverse families of the new generation of children over their first months of life after birth. We are extremely privileged within Growing Up in New Zealand to be able to bring those collective voices from the family table to the policy table.
Dr Susan Morton Research Director Growing Up in New Zealand

GrowinG Up in new Zealand - now we are born 2012
vi
Foreword ii
Acknowledgements iii
Directors Foreword iv
List of Tables ix
List of Figures x
Contents
1. Growing Up in New Zealand 11.1 Study overview 2
1.2 The cohort 3
1.3 The conceptual framework 3
1.4 Data Collection Waves 5
1.4.1 Data Collection Waves in early years of life 6
1.5 Cohort retention and data completeness 7
1.5.1 Interview data 7
1.5.2 Linked data 10
1.6 The focus of this first longitudinal report 10
1.7 Summary of key findings 11
1.7.1 The children at birth and the first few weeks 11
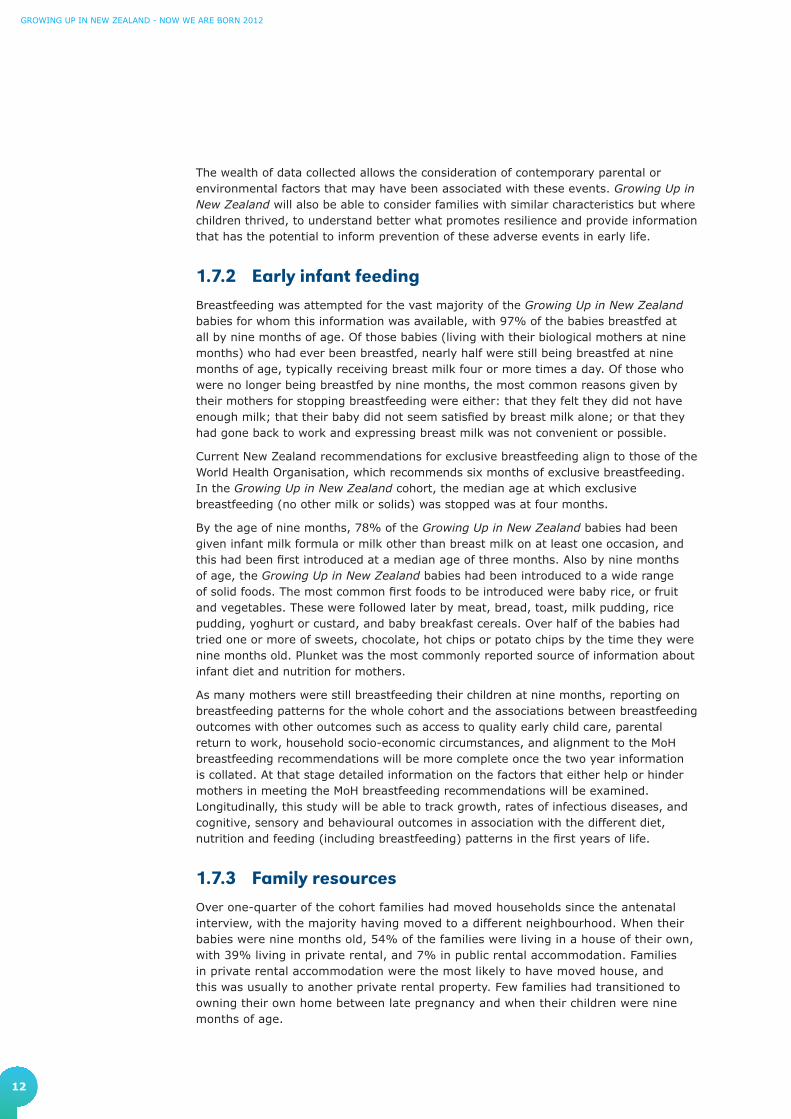
1.7.2 Early infant feeding 12
1.7.3 Family resources 12
1.7.4 Immunisation and health status 13
1.7.5 Interaction with health services and wellbeing 14
1.7.6 Parental health status and health related behaviour 15
1.7.7 Family stability and family environments 15
1.7.8 Parental work and leave 16
1.7.9 Child care 16
1.7.10 Home language environment 17
1.7.11 Home literacy environment 17
1.8 Future directions 18
1.9 Statistical analyses 18
1.10 Adding a personal voice 20
2. The Growing Up in New Zealand cohort at birth 212.1 Date and place of birth 22
2.2 Type of delivery 23
2.3 Gender and ethnicity 24
2.4 Gestational age and birth weight 25
2.4.1 Gestational age at delivery 25
2.4.2 Absolute birth weight at delivery 26
2.5 Birth weight as the dependent (outcome) variable 28
2.5.1 Longitudinal modelling 28
2.5.2 Birth weight as an explanatory variable for future longitudinal analyses 33
2.6 Babies immediate health at birth 36
3. The Growing Up in New Zealand cohort in the first nine months 373.1 Sleeping in the first six weeks 38
3.2 Infant feeding in the first nine months 39

vii
Foreword ii
Acknowledgements iii
Directors Foreword iv
List of Tables ix
List of Figures x
3.2.1 Any breastfeeding 39
3.2.2 Antenatal intentions for breastfeeding 40
3.2.3 Exclusive breastfeeding 41
3.2.4 Formula feeding 42
3.2.5 Food and beverage consumption 42
3.2.6 Ongoing collection and analyses of nutritional information 44
3.3 Postnatal care and interaction with primary health services 45
3.3.1 Postnatal care 45
3.3.2 Well Child/Tamariki Ora 46
3.3.3 Primary health care provider 47
3.3.4 Alternative practitioners 48
3.4 Immunisation 48
3.4.1 Antenatal intentions for immunisation 49
3.4.2 Immunisation coverage at nine months of age 50
3.5 Child health at nine months 53
3.5.1 Child health status 53
3.5.2 Child illnesses at nine months 56
3.6 Developmental status 58
3.7 Ongoing collection and analyses relating to child health and development 59
4. Growing Up in New Zealand childrens family and home environment 614.1 Relationship status of Growing Up in New Zealand childrens parents in first nine months 62
4.2 Family structure and home environment 64
4.3 Parental wellbeing 65
4.3.1 Self-reported mother and partner health status 65
4.3.2 Parental long-term disability and illness 66
4.3.3 Parental respiratory and atopic health status 67
4.3.4 Parental mental health 67
4.3.5 Change in maternal mental wellbeing from late pregnancy to when children are nine
months of age
69
4.4 Parental health related behaviours 78
4.4.1 Parental alcohol consumption 78
4.4.2 Parental smoking 80
4.4.3 Parental drug use 82
4.5 Parental leave and return to employment 83
4.5.1 Maternal leave taken by nine months of age 83
4.5.2 Type of leave taken by mothers 84
4.5.3 Leave taken by partners 84
4.5.4 Parents that did not take leave 86
4.5.5 Anticipated and actual leave 87
4.5.6 Return to employment 88
4.6 Early childhood education and child care 90
4.6.1 Child care use by Growing Up in New Zealand families when children are nine months of age 90
4.6.2 Antenatal plans and actual postnatal child care use in the first nine months 93
4.6.3 Growing Up in New Zealand children not in regular child care at nine months of age 94
4.7 The home language environment 94
4.8 The home literacy environment 97
4.8.1 Books in the home 97
4.8.2 Reading, singing and telling stories 98
4.8.3 Interaction with media in the first nine months of life 101

GrowinG Up in new Zealand - now we are born 2012
viii
References 120
Growing Up in New Zealand publications 123
Glossary 124
Appendix 1: Study Objectives (detail) 127
Appendix 2: Longitudinal Research Questions 128
Appendix 3: Construct Map 129
4.9 Household tenure and mobility 103
4.9.1 Mobility of Growing Up in New Zealand families 103
4.9.2 Changes in household tenure 105
4.10 Household environments 106
4.10.1 Crowding 106
4.10.2 Heating in houses 106
4.10.3 Household damp and mould 108
4.11 Economic resources for families 110
4.11.1 Household income over the first nine months 111
4.11.2 Working for Families 113
4.12 Economic situation and hardship 113
4.12.1 Economic situation 113
4.12.2 Hardship 115
4.12.3 Area level deprivation when children are nine months of age 116
5. Highlights and challenges for the parents of the Growing Up in New Zealand children 1175.1 Looking back 118
5.2 Looking forward 119

ix
Table 01: Characteristics of mothers and partners with complete information at the antenatal and nine month data collection waves
9
Table 02: Absolute birth weight (grams) 26
Table 03: Results of univariate analysis of birth weight adjusted for gestational age, gender and parity
30
Table 04: Results of multivariate analysis of birthweights
34
Table 05: Comparison of maternal intentions to breastfeed in the antenatal period with breastfeeding by nine months
40
Table 06: Percentage of babies breastfed at nine months by mothers ethnicity
40
Table 07: Introduction and current intake of solid foods
43
Table 08: Providers of Well Child/Tamariki Ora checks in the first nine months
46
Table 09: Frequency of specific infant health issues
57
Table 10: Comparison of partnership status for mothers between antenatal and nine month data collection waves
63
Table 11: Household structure at antenatal and nine month data collection waves
64
Table 12: Mothers health status at antenatal and nine month data collection waves
65
Table 13: Change in mothers self-reported Edinburgh Depression Inventory classification
68
Table 14: Maternal antenatal Edinburgh Depression Inventory score model
72
Table 15: Change in maternal Edinburgh Depression Inventory model
76
Table 16: Comparison of maternal antenatal intentions and actual leave taken
87
Table 17: Comparison of partner antenatal intentions and actual leave taken
88
Table 18: Type of employment for the parents of the children to nine months of age
88
Table 19: Comparison between antenatal intentions for childcare and reality at nine months
93
Table 20: Languages spoken to the baby 95
Table 21: Languages spoken at home antenatally and at nine months
96
Table 22: Frequency of reading books and singing songs or telling stories at nine months
98
Table 23: Media exposure at nine months 102
Table 24: Comparison of household tenure from pregnancy to nine months for families that moved
105
Table 25: Household dampness and condensation
108
Table 26: Household income source(s) 112
List of Tables

GrowinG Up in new Zealand - now we are born 2012
x
Figure 01: Conceptual framework for understanding child development in Growing Up in New Zealand
4
Figure 02: Cohort participation from antenatal to nine month data collection waves
8
Figure 03: Distribution of dates of birth 22
Figure 04: Place of delivery 23
Figure 05: Delivery type by maternal age 23
Figure 06: Ethnicity of the children as described by their mothers at nine months
24
Figure 07: Gestational age (completed weeks gestation) at delivery
25
Figure 08: Absolute birth weight distribution (by gender)
27
Figure 09: Absolute birth weight distribution (by maternal ethnicity)
27
Figure 10: Sleeping location of the babies six weeks following their EDD
38
Figure 11: Percentage of the babies being exclusively breastfed over time
41
Figure 12: Sources of information on infant feeding 44
Figure 13: Postnatal health care providers in the first six weeks
45
Figure 14: Primary health care arrangement for the babies at nine months
47
Figure 15: Immunisation rates for scheduled immunisations up to nine months according to maternal intentions during pregnancy
49
Figure 16: Immunisation rates in the first nine months
50
Figure 17: Immunisation intentions and coverage by birth order
51
Figure 18: Immunisation intentions and coverage by area level deprivation
51
Figure 19: Immunisation intentions and coverage by maternal ethnicity
52
Figure 20: Health status of the children as reported by mothers at nine months
53
Figure 21: Child health status by mothers self-reported health status
54
Figure 22: Child health status according to reported health or developmental problem
55
Figure 23: Maternal self-reported Edinburgh Depression Inventory classification at antenatal and nine month data collection waves
67
Figure 24: Maternal alcohol consumption from before pregnancy to nine months
78
Figure 25: Maternal alcohol consumption at nine months by area level deprivation
79
Figure 26: Maternal change in smoking status 80
Figure 27: Change in smoking status for partners 81
Figure 28: Maternal leave from employment 83
Figure 29: Type of leave taken by mothers by nine months
84
Figure 30: Leave from employment for partners 85
Figure 31: Type of leave taken by partners by nine months
85
Figure 32: Maternal reasons for not taking leave 86
Figure 33: Partner reasons for not taking leave 87
Figure 34: Mothers reasons for not working at nine months
89
Figure 35: Main non-parental child care used at nine months
91
Figure 36: Childrens books in the household by birth order
97
Figure 37: Frequency of reading books to the baby by parental ethnicity
99
Figure 38: Frequency of singing songs or telling stories to the baby by parental ethnicity
100
Figure 39: Family mobility by childs birth order 103
Figure 40: Family mobility by area level deprivation
104
Figure 41: Family mobility by maternal ethnicity 104
Figure 42: Household tenure for families 105
Figure 43: Heating in childrens homes by area level deprivation
107
Figure 44: Types of heating used in the homes where heating was used
107
Figure 45: Household dampness and area level deprivation
109
Figure 46: Heavy condensation in the room where the babies sleep at night by area level deprivation
109
Figure 47: Mould or mildew in the room where the babies sleep at night by area level deprivation
110
Figure 48: Changes in household income (per annum)
111
Figure 49: Perceptions of the impact of the national economy for families
114
Figure 50: Mothers of the babies who reported relative disadvantage in the first nine months
115
Figure 51: Area level deprivation of families in pregnancy and at nine months
116
List of Figures

1
1. Growing Upin New Zealand

2
GROWING UP IN NEW ZEALAND - NOW WE ARE BORN 2012
1.1 Study overviewGrowing Up in New Zealand is a longitudinal study that provides an up-to-date, population-relevant picture of what it is like to be a child growing up in New Zealand in the 21st century. It recruited and collected information from both mothers and their partners from before their children were born, and it has undertaken several further data collection waves during the children’s first two years of life. It is unique in terms of its capacity to provide a comprehensive picture of contemporary child development across multiple domains of influence for children born in New Zealand, and for including significant numbers of Māori, Pacific and Asian children as well as New Zealand European and other New Zealanders.
From its inception the Growing Up in New Zealand study has been explicitly designed to follow children from before birth until they are young adults, to understand ’what works’ for children and families (rather than primarily focusing on negative outcomes) and to consider pathways of development across multiple domains of influence. This will allow a much better understanding of the complex interplay of all the factors that lead to child outcomes including growth, health, behaviours and cognitive development. The model of child development shaping this study is child centred, but never forgets that children develop in dynamic interactions with their families, communities, environments and societal contexts over time. This conceptual approach to the study acknowledges the growth in our understanding of early child development in the last few decades, with an increasing recognition of the importance of the antenatal period and the first few years of life for shaping future developmental pathways for children.
This first longitudinal report describes the children’s development from before their birth and through the critical first nine months of their lives. The report highlights the breadth of information that is available from the children and their families in these early months, but it is not the end of what is possible. There is much to be done yet to describe more fully the associations that exist between the diverse environments that these children are growing up in and their development to date, as well as into the future. These analyses will be undertaken over the next several months as the more detailed level data is fully prepared and more complex modelling is undertaken by the study team. In this report there are examples of what is possible, but these are only indicative of the evidence that is yet to emerge from this rich resource. This evidence will contribute important information about the development of our new generation of New Zealand children that will help to inform strategies to ensure that every child born in 21st century in New Zealand is enabled to thrive, belong and achieve (New Zealand Government, 2011).

3
SECTION 1
1.2 The cohortGrowing Up in New Zealand recruited pregnant women who were due to have their babies between the 25th of April 2009 and the 25th of March 2010. The geographical area chosen for recruitment, after due consideration, was the region of the North Island covered by the three contiguous District Health Boards (DHBs) of Auckland, Counties Manukau and Waikato. Given the lack of a register of pregnant women, specific challenges for this study included ensuring that: all eligible pregnant mothers living in the selected recruitment region received a timely invitation for their children to participate; the cohort recruited was of sufficient size to provide adequate statistical power for complex analyses of developmental trajectories over time across the whole cohort of children as well as within subgroups (including by ethnicity); and that the cohort was broadly generalisable to all New Zealand children. These challenges were met. Growing Up in New Zealand recruited 6822 pregnant women and 4401 of their partners. An additional 200 families in a ‘Leading Light: Roopu Piata’ group were recruited in late 2008. Key ethnic and socio-demographic characteristics of the recruited main cohort families are similar to those of families having children in New Zealand today (as described in Morton et al, 2010 and Morton et al, 2012), and the size and diversity of this cohort is unprecedented.
1.3 The conceptual frameworkGrowing Up in New Zealand has been designed as longitudinal from the outset; it is multidisciplinary in nature and includes a translational dimension, with an explicit intent to both relate to the current policy context and inform future policy development. This study builds on the demonstrated value and lessons learnt from earlier New Zealand longitudinal studies, while reflecting the scientific and demographic changes that have occurred since the earlier studies began in the 1970s.
The conceptual framework for Growing Up in New Zealand takes a lifecourse approach to child development and therefore recognises the dynamic interactions between children and their environments across a broad range of influences from their immediate family environments to their wider societal context over time (Figure 01).

4
GROWING UP IN NEW ZEALAND - NOW WE ARE BORN 2012
Form
al S
ociet
y: Ed
ucation
al Institutions, Community Organisations, Law and Order, Social Support, Government Agencies
Wider Social Environment: Cultures, Policies
Informal Society: friends, peers, neighboursPhysical Environment
Family / Whanau
Genes and Biological Factors
y Organisations, Law
Environment: Cultu
ety: friends, peers,
ysical Environmen
Family / Whanau
s and Biological Fac
First Point in Time
Second Pointin Time
FirstGeneration
SecondGeneration
Inter-generational cycle:Influences across
generations
Lifetime cycle:Within a lifetime representing any
stages of the lifecourse
Social, political & cultural cycle:Significant changes in social, political
& cultural norms across time
Figure 01. Conceptual framework for understanding child development in Growing Up in New Zealand

5
SECTION 1
The information collected from the cohort families from before birth (as described in Report 1: Before we are born) is centered on the child as the participant throughout, and is collected to determine what influences child development over time, rather than as a series of cross-sectional snapshots, as well as to facilitate understanding of the dynamic interactions between each child and their broader family and societal environment. The model incorporates the notion that the development of all children begins from before they are born (intergenerational) and that each lifecourse outcome is the result of a complex interplay over time between the individual’s biology and their environment (epigenetic).
1.4 Data Collection Waves Each Data Collection Wave (DCW) of Growing Up in New Zealand seeks information across six inter-connected domains: family and whānau (extended family), societal context and neighbourhood, education, health and wellbeing, psychological and cognitive development, and culture and identity. Each cross-sectional DCW is planned according to a balance of age-appropriate information from all the inter-connected domains, in the context of the overarching longitudinal research objectives, while being as policy-relevant as possible.
Attention is also given to ensuring that the methods utilised to collect domain-specific evidence acknowledge the unique New Zealand population and environmental context. In particular in the New Zealand context, the integration of the Māori theme and experts in the Kaitiaki group ensure that Growing Up in New Zealand provides a unique opportunity to examine the factors which contribute to the wellbeing of Māori tamariki (children) and their whānau in New Zealand in the 21st century.
Study Objectives and Longitudinal Research Questions guide the development of methods and specific tools used to collect information about children’s development in contemporary New Zealand for all the DCWs (provided for reference in Appendices 1 and 2).

6
GrowinG Up in new Zealand - now we are born 2012
1.4.1 Data Collection Waves in early years of lifeGrowing Up in New Zealand was designed as a longitudinal study, with anticipated contact with the cohort up to the age of 21 years. Trajectories of early life development from before birth are recognised as critical for the ongoing health, wellbeing and resilience of children and their families. To this end, four DCWs were explicitly planned for Growing Up in New Zealand to collect detailed information in the first two years of the children’s lives. Appendix 3 provides more detail on the constructs measured in each of the DCWs.The longitudinal information collected to date includes:
• data from the antenatal DCW (completed in June 2010) which consisted of a face-to-face Computer Assisted Personal Interview (CAPI) with the pregnant mother (most often in the last trimester of her pregnancy) and with her partner (almost always the father). Baseline results were presented in Report 1: Before we are born in November 2010;
• data from the second face-to-face CAPI with the child’s mother and her partner which took place when the cohort children were nine months old and was completed in January 2011;
• information collated from linkage to routinely collected perinatal health records, completed in late 2011, providing information about the latter stages of pregnancy, the child’s birth and immediate neonatal outcomes. Linkage to the perinatal data was achieved through accessing records held by the three DHBs where the majority of the Growing Up in New Zealand children were born, as well as information from midwifery organisations. The child’s National Health Index (NHI) number facilitated these linkages;
• the third face-to-face CAPI which occurs when the children are two years old (due for completion mid-2012). This CAPI also involves direct observations and developmental and anthropometric assessments of the children when they are two years of age.
In addition, brief Computer Assisted Telephone Interviews (CATI) were conducted six weeks after the expected date of delivery (EDD) of the cohort children (the first point of contact after birth), and when the children were approximately 35 weeks, 16 months and 23 months old. These CATI allow for the collection of age-appropriate developmental information and assist with cohort retention. Further CATIs are planned for when the children are approximately 31 and 39 months old, and the next face-to-face data collection is planned for when the children are approximately four years of age.
This report includes longitudinal information from the antenatal DCW, the perinatal linked data and the nine month DCW, together with the CATI information from the six week and 35 week calls.

7
SECTION 1
1.5 Cohort retention and data completeness
Loss to follow-up is a feature of all longitudinal studies, and is often greatest in the first two years of a study when relationships with participants are being established. Because Growing Up in New Zealand began in pregnancy there is also a transition to be made in this report between mothers and partners (who were the N in the antenatal report) to the children themselves at birth and at nine months of age. This section provides information on the retention of the mother and partner participants in Growing Up in New Zealand, and data on the children in the study to nine months of age. In future reports attrition analyses will focus on the child participants. Maximising overall participation, as well as minimizing any bias in attrition continues to be an ongoing goal for the Growing Up in New Zealand team.
1.5.1 Interview dataAntenatal interviews were completed with 6822 mothers, and 4401 of their partners. Unfortunately, 31 of these mothers (and 17 of their corresponding partners) experienced the perinatal death of their child. No further data were collected from these mothers and partners beyond the antenatal period, and we are very grateful for their involvement in Growing Up in New Zealand. In addition, 30 mothers opted out of involvement in the study after they had provided information during pregnancy and nine mothers have not been able to be contacted since their pregnancy interview.
At six weeks following their EDD, a CATI phone call was made to all remaining mothers. From those who were contacted (6751 mothers or 99% of all those who provided data in pregnancy) it was determined that a total of 6846 live births made up the participant cohort for Growing Up in New Zealand. A total of 6662 of these babies were singletons, and 184 were twins or triplets. There were two mothers who skipped the phone call made at six weeks past their EDD but these mothers provided information to Growing Up in New Zealand when their babies were nine months old.
When the babies were nine months old, 49 mothers who had completed six week interviews opted out of further involvement in the study and there were 314 mothers (corresponding to 320 babies in the cohort) that could either not be contacted at this stage, or who were contacted and requested to skip this DCW.
There were 6384 mothers (94% of all those who provided data in pregnancy) who completed the interviews when the Growing Up in New Zealand babies were nine months old. These mothers included a small number of new participants who were now the primary caregivers of the babies through a formal or informal adoption or whangai arrangement, or were extended family members taking on this role. Of the 6846 children in the Growing Up in New Zealand cohort, information for 6470 (95%) was collected at the nine month DCW (6301 singletons and 169 twins or triplets). Tragically, six babies in the Growing Up in New Zealand cohort died in the time following the phone call made six weeks after their EDD. Further review of all the perinatal and early life losses from the Growing Up in New Zealand cohort will be conducted once linkage to routine health records is completed.

8
GrowinG Up in new Zealand - now we are born 2012
Figure 02: Cohort participation from antenatal to nine month data collection waves
* Complete antenatal interview data. One additional mother provided incomplete antenatal data and information is included from six weeks onwards.
Skipped refers to a mother (or her partner) who has been unable to provide information at a specific data collection point, but still intends to complete subsequent data collections.
Lost to follow-up refers to a participant who could not be contacted at this specific data collection point.
Opt out refers to a participant who has specifically indicated that they no longer wish to participate; where this is a mother, the partner and participant child or children are therefore opted out.
For mothers and partners, the denominator for completed DCWs is the total with antenatal data. For the children, the denominator for completed DCWs is the total live births determined at the six week call. +This includes 10 new mothers.
Table 01 compares the key socio-economic and demographic characteristics of mothers and partners with complete data at the antenatal and nine month data points. In general the distributions of key parental characteristics are very similar for these parents.
Antenatal Interview
6 week call
9 Month Interview
Pregnant mothersN = 6822*
PartnersN = 4401
Mother questionnaireCompleted = 6751 (99%)
Skipped = 2
Partner questionnaireCompleted = 4094 (93%)
Skipped or lost to follow-up = 258
Mother questionnaireCompleted+ = 6384 (94%)
Skipped or lost to follow-up = 314
Opt out = 30Opt out due to perinatal child death = 31Lost to follow-up = 9
New = 25
Opt out = 57Opt out due to perinatal child death = 17
Opt out = 49Opt out due to child death = 6
Child Counts (N =6790)Completed = 6470 (95%)
Skipped or lost to follow-up = 320
Child Counts (N =6846)Completed = 6843
Skipped = 3
Opt out = 50Deceased = 6
Information from 4094 partners was collected when the babies were nine months old (93% compared to the antenatal period). Of these, 25 were new partners who were either newly involved in the lives of the cohort children, or who were now interested in being involved in the study despite not wanting to be involved in the antenatal period. There were 258 partners who did not contribute to data collection when the babies were nine months old as they had requested to skip this DCW, or could not be contacted. Figure 02 shows participation rates up to and including the nine month data collection.

9
SECTION 1
Table 01: Characteristics of mothers and partners with complete information at the antenatal and nine month data collection waves
Mother Partner
Antenatal
(N=6822)
n(%)
9 months
(N=6384)
n(%)
Antenatal
(N=4401)
n(%)
9 months
(N=4094)
n(%)
Age groups *
<20 years 328 (4.8) 285 (4.5) 84 (1.9) 61 (1.5)
20 – 29 years 2663 (39.1) 2447 (38.4) 1162 (26.4) 1042 (25.6)
30+ years 3828 (56.1) 3639 (57.1) 3153 (71.7) 2965 (72.9)
Ethnicity (total responses)1
New Zealand European 4242 (62.3) 4090 (64.2) 3042 (69.2) 2911 (71.6)
Māori 1244 (18.3) 1121 (17.6) 634 (14.4) 574 (14.1)
Pacific Peoples 1155 (17.0) 1013 (15.9) 580 (13.2) 484 (11.9)
Asian 1081 (15.9) 992 (15.6) 633 (14.4) 552 (13.6)
MELAA ** 161 (2.4) 144 (2.3) 105 (2.4) 91 (2.2)
Other 39 (0.6) 38 (0.6) 18 (0.4) 14 (0.3)
Planned/Unplanned Pregnancy
Planned 4091 (60.2) 3902 (61.5) - -
Unplanned 2700 (39.8) 2442 (38.5) - -
Parity
First child 2927 (42.9) 2753 (43.2) - -
Subsequent child 3888 (57.1) 3614 (56.8) - -
Education
No secondary school qualification
491 (7.2) 418 (6.6) 300 (6.8) 248 (6.1)
Secondary school qualification/ NCEA 1–4
1627 (23.9) 1484 (23.3) 897 (20.4) 813 (20.0)
Diploma or Trade Certificate/ NCEA 5–6
2083 (30.6) 1957 (30.8) 1607 (36.6) 1490 (36.7)
Bachelors Degree 1539 (22.6) 1474 (23.2) 836 (19) 794 (19.5)
Higher Degree 1064 (15.6) 1024 (16.1) 756 (17.2) 720 (17.7)
2006 Deprivation Index
Dep 1 & 2 1092 (16.4) 1044 (16.8) 803 (18.9) 763 (19.4)
Dep 3 & 4 1158 (17.4) 1116 (18.0) 826 (19.4) 794 (20.2)
Dep 5 & 6 1160 (17.5) 1088 (17.5) 788 (18.5) 732 (18.6)
Dep 7 & 8 1405 (21.2) 1320 (21.2) 883 (20.8) 811 (20.6)
Dep 9 & 10 1828 (27.5) 1646 (26.5) 948 (22.3) 830 (21.1)
* Age at the antenatal interview** Middle Eastern, Latin American or African1 Includes multiple response(s) and will total to more than 100%

10
GrowinG Up in new Zealand - now we are born 2012
There are 370 children for whom nine month data is not available because their mothers had skipped this DCW, opted out or could not be contacted. Of these: 179 were boys and 191 were girls; 355 were singleton babies; and 147 were their mother’s first-born children. It is expected that some of those babies for whom we do not have information in the nine month DCW (particularly those where their mothers have opted to skip this interview) will continue to be involved in, and contribute future data to, Growing Up in New Zealand.
1.5.2 Linked dataIn addition to the CAPI and CATI information, just under 98% (6656) of the 6822 mothers recruited antenatally consented to Growing Up in New Zealand accessing health information for themselves and their infant in the first year of life. This included health information from external agencies such as the Ministry of Health (MoH), and that collected by DHBs and other health providers (including maternity carers). The NHI numbers were obtained from the MoH for all cohort children, and these were used to link mothers to their perinatal records for those where consent had been given. Overall, linked perinatal data was obtained for 6652 mothers (98% of all mothers who provided data in pregnancy and 99.9% of those who consented to data linkage) and 6696 babies (98% of the Growing Up in New Zealand cohort at birth). Because linked data came from multiple sources, each of which collected information in slightly different ways, extensive consistency checking and validation was required to create one complete perinatal dataset that could be merged with the other longitudinal datasets. Much of this checking is ongoing at the time of preparing this report. Birth weight, gestational age and type of delivery information used in this report, acquired from the collated perinatal dataset, have been through this systematic cleaning and checking process. Any missing information in the linked data on key variables was completed by direct contact with parents wherever practicable, usually at routine CATI contacts.
1.6 The focus of this first longitudinal reportThis report is based on the data gathered at the antenatal and nine month face-to-face interviews with the parents of the Growing Up in New Zealand child cohort. In addition, this report includes the linked perinatal data, and that collected from the telephone interviews (with the mothers of the Growing Up in New Zealand children) at six weeks past their EDD, and when the children were approximately 35 weeks old. This report presents data about the children themselves for the first time, and compares parental antenatal intentions for their children’s postnatal environments with the reality for families. An example of a lifecourse approach to a cross-sectional outcome is provided by way of modelling of pre-pregnancy and pregnancy specific characteristics and contextual influences on size at birth of the cohort children. A further modelling example which considers change of maternal mental health status between pregnancy and when the children are nine months of age is also provided.
Many further possibilities (beyond what was achievable at the time of preparing this report) exist to extend the modelling approaches to consider other early life outcomes and change over time between pregnancy and early life for the Growing Up in New Zealand children. Additional analyses will be undertaken over the following 12 months to provide this evidence. Other longitudinal and lifecourse approaches will be more appropriate when further data is collected and integrated with the current first year’s data, in particular once routine health data for the first 12 months is cleaned and linked, and the two year data collection is completed.

11
SECTION 1
1.7 Summary of key findingsA summary of the key findings from the information the families have generously shared in the first nine months of their children’s lives are provided in this section, as are some opportunities for the further use of this information.
1.7.1 The children at birth and the first few weeksThis report introduces, for the first time, the children in the Growing Up in New Zealand cohort. The babies in the Growing Up in New Zealand cohort were born between 3 March 2009 and 14 May 2010. Over three-quarters (78%) were born in Auckland, Middlemore, or Waikato hospitals. The cohort was made up of 6662 singletons, 89 pairs of twins and 2 sets of triplets. The gender split of these babies was 3526 (52%) male and 3320 (48%) female infants.
Two-thirds of the Growing Up in New Zealand babies were born by spontaneous vaginal delivery. Nearly one in four were delivered by caesarean section (over half of these as an emergency), with the likelihood of a caesarean delivery increasing with maternal age (38% of all mothers over the age of 40 years had a caesarean section). The high rate of caesarean births has implications for health service utilisation given the increasing average age of mothers having babies in New Zealand today.
Most babies (91%) in the Growing Up in New Zealand cohort were born at term (between 37 weeks and 41 weeks completed gestation). There were 424 babies (6.2%) born preterm (before 37 weeks gestation) and 2.5% born post-term (after 41 weeks completed gestation). The distribution of birth weight within the cohort ranged from 575 grams to 5850 grams, with an average of 3481 grams. Nearly 80% of the babies weighed between 2500 grams and 4000 grams at birth, and 4.9% were born low birth weight (less than 2500 grams). More than 1000 babies (16%) weighed more than 4000 grams at birth. Male babies and babies born to mothers who identified as Pacific were heavier on average than female babies or babies born to mothers of other ethnicities.
Multivariate longitudinal analyses using the information available for the cohort from before and during pregnancy highlighted the importance of the mother’s own lifecourse growth (height, body mass index) and development (education, employment and income) for influencing the growth of her own children in utero. A significant proportion of a baby’s size at birth was related to their mother’s overall health and usual behaviours prior to her pregnancy. Behaviours during pregnancy such as smoking and alcohol consumption, and pregnancy specific health issues such as gestational diabetes and hypertension, also contributed to offspring size at birth.
Size and gestational age at birth are important predictors of immediate and later child health and development. The wealth of parental, family and environmental data that will be collected for these babies over time will allow an examination of the impact of size at birth on growth, health and development within the New Zealand context for all of the cohort children, and for particular subgroups. Further this study will be able to consider these impacts in the context of the lifecourse influences on size at birth, rather than using size at birth as the starting point on its own.
Most babies did not experience any specific health problems in the immediate postnatal period. For the small number for whom complications were experienced, those reported most frequently included jaundice or respiratory difficulties. Ventilatory assistance after delivery was required by 2.5% of the Growing Up in New Zealand babies.
The family history, pre-pregnancy information, and pregnancy specific information collected from the cohort provides an opportunity to investigate which mothers had premature deliveries or small for gestational age infants, required operative delivery, had a child with poor health in infancy or unfortunately experienced a late fetal death.
12
GrowinG Up in new Zealand - now we are born 2012
The wealth of data collected allows the consideration of contemporary parental or environmental factors that may have been associated with these events. Growing Up in New Zealand will also be able to consider families with similar characteristics but where children thrived, to understand better what promotes resilience and provide information that has the potential to inform prevention of these adverse events in early life.
1.7.2 Early infant feedingBreastfeeding was attempted for the vast majority of the Growing Up in New Zealand babies for whom this information was available, with 97% of the babies breastfed at all by nine months of age. Of those babies (living with their biological mothers at nine months) who had ever been breastfed, nearly half were still being breastfed at nine months of age, typically receiving breast milk four or more times a day. Of those who were no longer being breastfed by nine months, the most common reasons given by their mothers for stopping breastfeeding were either: that they felt they did not have enough milk; that their baby did not seem satisfied by breast milk alone; or that they had gone back to work and expressing breast milk was not convenient or possible.
Current New Zealand recommendations for exclusive breastfeeding align to those of the World Health Organisation, which recommends six months of exclusive breastfeeding. In the Growing Up in New Zealand cohort, the median age at which exclusive breastfeeding (no other milk or solids) was stopped was at four months.
By the age of nine months, 78% of the Growing Up in New Zealand babies had been given infant milk formula or milk other than breast milk on at least one occasion, and this had been first introduced at a median age of three months. Also by nine months of age, the Growing Up in New Zealand babies had been introduced to a wide range of solid foods. The most common first foods to be introduced were baby rice, or fruit and vegetables. These were followed later by meat, bread, toast, milk pudding, rice pudding, yoghurt or custard, and baby breakfast cereals. Over half of the babies had tried one or more of sweets, chocolate, hot chips or potato chips by the time they were nine months old. Plunket was the most commonly reported source of information about infant diet and nutrition for mothers.
As many mothers were still breastfeeding their children at nine months, reporting on breastfeeding patterns for the whole cohort and the associations between breastfeeding outcomes with other outcomes such as access to quality early child care, parental return to work, household socio-economic circumstances, and alignment to the MoH breastfeeding recommendations will be more complete once the two year information is collated. At that stage detailed information on the factors that either help or hinder mothers in meeting the MoH breastfeeding recommendations will be examined. Longitudinally, this study will be able to track growth, rates of infectious diseases, and cognitive, sensory and behavioural outcomes in association with the different diet, nutrition and feeding (including breastfeeding) patterns in the first years of life.
1.7.3 Family resourcesOver one-quarter of the cohort families had moved households since the antenatal interview, with the majority having moved to a different neighbourhood. When their babies were nine months old, 54% of the families were living in a house of their own, with 39% living in private rental, and 7% in public rental accommodation. Families in private rental accommodation were the most likely to have moved house, and this was usually to another private rental property. Few families had transitioned to owning their own home between late pregnancy and when their children were nine months of age.

13
SECTION 1
Families who had recently had a child had, on average, experienced a drop in income, particularly those households who were previously earning between $100,000 and $150,000 per annum. Over 40% of families in the study had received paid parental leave over the last year and a similar percentage had received family tax credits. Over the same time period a significant percentage of these families (18%) had received a government benefit (including unemployment, sickness, domestic purposes, and invalids benefits). An unexpected finding was the number of sources of income that families were reliant on during the first nine months of their child’s lives. Nearly one in five families were receiving income from four or more sources, while only 14% received income from just one source. The costs associated with dealing with these multiple sources of income, for the family and for those administering income support, warrant further review.
Many families reported that they had experienced some form of hardship in the previous 12 months. Half of all families reported they have been forced to buy cheaper food so they could pay for other things they needed, 18% reported putting up with feeling cold to save on heating costs, 13% had made use of food grants or food banks because of money shortages and a similar percentage had often gone without fresh fruit or vegetables. Importantly, many families reported experiencing more than one type of hardship around the time that the Growing Up in New Zealand children were born.
1.7.4 Immunisation and health statusOne key health outcome for infants that has been explored in detail in the first nine months of life is immunisation coverage. By the age of nine months, nearly all babies had received their six week (95%) and three month (94%) immunisations. However, coverage had dropped to 90% for the five month immunisations. Of all babies, 3.8% had not received any of the immunisations on the national schedule by the age of nine months. Rates of immunisation coverage were less overall than parents had intended antenatally.
Differences between antenatal intentions and the actual postnatal immunisation rates varied according to key parental characteristics. In pregnancy, mothers having their first baby were more likely to intend to have that child immunised compared to mothers having their second or subsequent child. This pattern was also seen for completed immunisation at six weeks, three months and five months.
Asian and Pacific families had the highest intentions for immunisation prior to the birth of their children, and at nine months of age babies whose mothers identified as Asian also had the highest rates of immunisation overall, with 95% coverage at each of the immunisation points. Despite their high intentions, babies born to Pacific mothers were less likely to have complete immunisations. The lowest immunisation rates for all scheduled immunisations were seen for babies whose mothers identified as New Zealand European or Māori. Completed five month immunisation rates were 83% for babies born to mothers who identified as Māori and 87% for babies whose mothers identified as New Zealand European who also had the lowest immunisation intentions antenatally.
Immunisation intentions in pregnancy also differed by area level deprivation, with mothers living in the most deprived areas most likely to intend to have their child immunised. However, by nine months of age the babies whose mothers lived in the most deprived areas had the lowest rate of five month immunisations.

14
GrowinG Up in new Zealand - now we are born 2012
The early drop in rates of completed immunisation seen for Māori and New Zealand European children, and for children living the most deprived areas means that these children are not on track to meet the MoH 95% immunisation target by the age of two years. These low rates suggest that this may be a contributor to the inequities in rates of infectious disease seen in our preschool population.
These differential patterns of immunisation uptake across the cohort, as well as the overall lower rates of actual uptake compared to antenatal intentions suggest that the translation of knowledge into action is not straight forward. It is likely that there are different barriers to, and enablers of, health related behaviours across groups and that knowledge is necessary but is not sufficient, on its own, for action. By the time the cohort are two years of age, linkage to routine immunisation health records will provide a complete picture of the timeliness of immunisation coverage. Growing Up in New Zealand will also be able to supplement this routine data with information on the barriers and enablers in order to examine immunisation in relation to rates of vaccine preventable disease, and in association with other key family and environmental variables.
Most mothers reported that their babies were either in excellent or very good health at the age of nine months. Just under one in 10 of the babies in the cohort were reported to have specific health or developmental problems by the age of nine months. The most common health issue reported for the Growing Up in New Zealand babies in the first nine months was a cough ‘that had lasted for a week or more’. Approximately one in four children had experienced a chest infection or other respiratory illness, and a similar proportion of the children had experienced one or more ear infections. Approximately one in five children had experienced at least one episode of gastroenteritis, and one in three had experienced eczema or dermatitis by the age of nine months. In most cases, these illnesses had resulted in one or more primary care consultations. Almost all babies (95%) had been given paracetamol at least once, and just under half of all babies (46%) had been prescribed antibiotics at least once by the age of nine months.
The impact of these health issues (along with the associations between timely immunisation, health service utilisation and other aspects of child development such as use of early child care and home environments) will be described further as the children of the Growing Up in New Zealand cohort move through their preschool years and transition to formal schooling.
1.7.5 Interaction with health services and wellbeingAt six weeks of age, almost three-quarters of the babies had been seen by Plunket. Almost 91% of the cohort children received all of their Well Child/Tamariki Ora checks in the first nine months of life.
When primary health care was required, most babies were taken to either a single known doctor (67%) or to one of several doctors at one practice (27%). At nine months of age, around 1400 families were using a primary care provider that was not local to their place of residence, and a similar number of families had changed primary care health providers (at least once) since before their baby was born. Where the mother had changed General Practitioner (GP), most (78%) reported no difficulties in finding a new GP. One in five babies had also been seen by a complementary or alternative practitioner, by the age of nine months. This was most often an osteopath.
Growing Up in New Zealand is interested in tracking the continuity of health care for infants and their families to understand how this affects children’s wellbeing, development, equity of outcomes and health service utilisation. The ongoing use of health service providers, continuity of care, and interactions with other services (including specific Whānau Ora providers) will be explored further following the collation of the data from the two year DCW.

15
SECTION 1
1.7.6 Parental health status and health related behaviourThe current health of parents, and their health related behaviours, influence the everyday environments created for the Growing Up in New Zealand children. These may also influence the health related behaviours of their children in time. When the children were nine months of age, 11% of mothers had symptoms suggestive of postnatal depression compared to 16% of mothers who had symptoms suggestive of depression in late pregnancy. This report considers the determinants of the mother’s mental health status, and in particular what had influenced changes in her mental health status between the antenatal and postnatal period. The most important determinant of a mother’s mental health status postnatally was her mental health status prior to the birth of her child. Being a young mother or having high levels of financial or relationship stress increased the chances of a mother having poorer mental health postnatally. However, with few exceptions, mothers who either had a history of depression or who developed depressive symptoms during pregnancy were the most likely to be depressed postnatally. This suggests that most of the mothers at risk of developing depressive symptoms in the first nine months of their child’s life could have been identified either before or during pregnancy. Therefore the optimum time to intervene to help to provide healthy postnatal environments for children would seem to be before the children are born.
Mothers’ alcohol consumption patterns when their children were nine months of age tended to be reduced in comparison to pre-pregnancy patterns. More than 88% of mothers who were breastfeeding at nine months were either not drinking at all or having less than four standard drinks per week. Of those mothers who had stopped breastfeeding, almost one-third were not drinking alcohol at all, and a further 47% were drinking less than four standard drinks per week. Overall, mothers living in the most deprived areas were less likely to be drinking alcohol than those living in less deprived areas, and New Zealand European mothers were more likely to be drinking alcohol than mothers of any other ethnicity.
When the babies were nine months of age, 14% of their mothers were smoking, an increase from the 11% of mothers smoking during pregnancy but still less than the 20% of mothers who were smoking before pregnancy. Almost one in three of the cohort children were, however, living in a household where someone smoked cigarettes.
A small, but important, number of mothers had returned to smoking once their children were born. Similarly, alcohol consumption also increased postnatally. This suggests that while campaigns regarding the detrimental effects of maternal smoking and drinking while pregnant are salient, a message with a longer term view may aid in continued cessation and improved child health.
1.7.7 Family stability and family environmentsApproximately nine out of 10 of the Growing Up in New Zealand children had parents who had been in a stable relationship over the previous 12 months. Mothers under the age of 20, those without secondary school qualifications, and those living in the most deprived areas were most likely to have experienced a change in their relationship status. Approximately one-quarter of the cohort are growing up in an extended family situation and approximately one in 12 children were being brought up by a mother without a current partner. This study will be able to look in detail, throughout the preschool period, at how changes in family structure may affect child wellbeing and development during their early years.

16
GrowinG Up in new Zealand - now we are born 2012
1.7.8 Parental work and leaveOf those mothers who were in paid employment when pregnant, over 80% had taken some leave. Of those mothers who had taken leave, 30% were still on leave when their babies were nine months old. The leave taken by mothers was most likely to be a combination of paid parental leave (87%), unpaid parental leave (55%) and annual leave (34%). Over half of the mothers who had taken leave used two or three types of leave to cover their time away from employment. The majority of parents who were working at the time of the antenatal interview and intended to take leave after their babies were born had managed to take leave.
Over 2000 of the mothers had returned to work by the time their children were nine months old, with the majority of these women (83%) returning to work for their previous employer. The children were (on average) five months old when their mothers returned to work. In comparison, partners tended to return to work when the babies were two weeks old, on average. For mothers who had not yet returned to work, one important reason for this decision was the inability to get suitable and affordable child care.
The findings regarding parental return to the workforce are preliminary as many mothers were still on leave at the time of the nine month interview. However, interesting differences in return to work patterns between the mothers and partners within this data are evident. Later data collections will complete parental leave information and allow a more comprehensive examination of factors that contribute to, or are affected by, decisions regarding parental leave when children are very young.
1.7.9 Child careReturning to work or study was the main reason for why over 2200 of the cohort children spent time (an average of 20 hours per week) being looked after by someone other than their parents at nine months of age. Of those in child care for more than eight hours per week, 40% (685) used an early child care centre (such as daycare, Kohanga Reo, or Pacific Islands early childhood centre), 32% were being looked after by their grandparents, and a further 6% were with another relative for their regular child care. The types of main child care providers used at nine months differ notably by ethnicity. For example mothers who identified as Asian or Pacific most often used grandparents as their child care provider. This was also the case for mothers living in areas of high deprivation. Grandparents and other relatives were also the least likely to have been paid for their child care provision by the Growing Up in New Zealand families. Of those families using regular child care, 20% were receiving a child care subsidy.
A comprehensive stocktake of child care provision, access and quality is being gathered longitudinally from this cohort and will be described in further detail. In the first nine months of the children’s lives early differences in choices and patterns of child care provision are already evident. Over time the longitudinal information will provide a more comprehensive understanding of the engagement of New Zealand families with early child care over and above participation rates. Detail collected regarding formal and informal child care in Growing Up in New Zealand includes why choices are made about when and what care arrangement, or combination of arrangements, is used by families, how often and why a child care provider is changed, and parental perceived quality indicators of child care used. Importantly also, this study will be able to assess the impact that the engagement with early childhood education has on preschool health and development for this cohort as well as preparedness for school entry.

17
SECTION 1
1.7.10 Home language environmentAs reported antenatally, 20% of parents were not using English as their primary language before the children were born. However, at nine months, 95% of mothers and partners reported using some English to speak to their nine month old children at home. Also, 16% of mothers and 12% of partners were using some te reo Māori to speak to their babies. This is greater than the 3-5% of mothers and partners who reported being able to hold an everyday conversation in te reo Māori during the antenatal interview. It is likely that this difference is due to the use of words or phrases spoken in te reo Māori to babies in the home rather than the use of te reo Māori as the language spoken in the home most often. However it will be important to follow up the impact that this has on children’s language development at two years when their language abilities are both more developed and more extensively assessed.
The next most common languages used by the parents of the cohort to speak to their babies were Samoan, Tongan, Hindi and Mandarin. Most of those who spoke a non-English language did so because it was the language they spoke best (approximately 40% of these mothers and partners) or because they wanted to raise their child as bilingual (17% of these mothers and 15% of these partners). Raising their child to be bilingual was the reason given most often by the mothers who used te reo Māori as their main language.
1.7.11 Home literacy environmentParents were likely to be singing songs or telling stories to their Growing Up in New Zealand children at least once a day and many were also reading books regularly when their children were nine months old. Approximately 60% of the children were living in homes where there were at least 20 children’s books. Few mothers reported having no children’s books at home.
One in three of the Growing Up in New Zealand children were reported to be watching children’s TV programmes daily and nearly one in five were reported to be viewing videos or DVDs daily by the age of nine months. Three quarters of mothers reported that the television was routinely on in the same room as their baby each day.
The Growing Up in New Zealand children have been born into a new technological age, where interaction with technology starts early, and a high number of children have already engaged with media, either actively or passively, in their first nine months. As these children grow, their interactions with media and new technology are likely to increase. The influence of these interactions, as well as technological advances, will be followed through the preschool period, along with the development of their cognitive, behavioural and social trajectories.

18
GrowinG Up in new Zealand - now we are born 2012
1.8 Future DirectionsThese key findings only represent the beginning of understanding what it is like for children to grow up in 21st century New Zealand. Already there are differences emerging in the environments that are able to be provided by New Zealand families to support their children’s early development. It is clear that not all children are born equal and that there are opportunities to consider how strategies might be targeted, even before birth, to ensure all New Zealand children thrive, achieve and belong. Over time the longitudinal evidence provided by the families, and the children themselves, will provide a better understanding of how this can be facilitated in the current New Zealand environment.
Currently the Growing Up in New Zealand team is in the field conducting two year interviews with the mothers and partners of the cohort children, as well as interacting with the children themselves for the first time. These interviews are expected to be completed in mid 2012. For the children who have had their interviews the next point of contact is a brief phone call when they are approximately two and a half years old.
Linkage is underway to routine health records for the first 12 months of the children’s lives, and further linkage is planned for health and education records in the preschool period and beyond.
Planning is also underway for the preschool data collection wave. This will collect important information to fill in the trajectories of development for contemporary New Zealand children during their critical preschool years. The exact nature of the engagement with families and their children at this point is subject to available funding.
Data collection waves are expected to occur every two to three years from the preschool point onwards to ensure that important transition points are detailed (for example transition to formal schooling) and developmental trajectories continue to be described for our New Zealand children.
We look forward to adding longitudinal information to the data collections already collated to provide a robust evidence base about what contributes to developmental trajectories in the context of 21st century New Zealand from before birth until early adulthood for our new and diverse generation of New Zealand children.
1.9 Statistical analysesThis report contains information pertaining to data from several sources: the antenatal and nine month face-to-face interviews conducted with mothers and, where available, their partners enrolled in Growing Up in New Zealand; the six week and 35 week CATIs with the mothers; and the routine perinatal data collated from linkage with health records (from several sources). Where data from two or more separate sources are compared or cross-tabulated (e.g. comparisons between information provided at the antenatal and nine month interviews), the statistics are provided for participants (or their mothers or partners) where there is complete information from both (or more) sources. Data collected up to October 2011 are included in the analyses for this report. Content in this report is validated and accurate for the data included. However, due to the longitudinal nature of this ongoing study, future data may alter the way this is understood.
19
SECTION 1
Descriptive statistics including means, standard deviations, medians, ranges, percentages and 95% Confidence Intervals (CIs) are provided throughout the report. The percentages provide estimates of the proportion of the population that have a particular characteristic or behaviour. Tables also include the number of participants (‘n’) who reported each of the different response(s) for a given question and the total number of participants (‘N’) who provided information with respect to a specific question(s). The total number of participants who answered the questions (‘N’) varies either because of the branching nature of the questionnaire, the exclusion of those who refused to answer a particular question, the exclusion of those who responded with ‘don’t know’, or occasionally because of missing data (for a question). The 95% CIs indicate the precision of the estimate by providing an observed interval which is highly likely to contain the true statistic. The wider the CI the less precise is the estimate.
The parents of the Growing Up in New Zealand cohort were asked to describe the ethnic groups(s) that their children belong to. In this report this is described to Level 1 of the Statistics New Zealand categories only. However, more detailed information (including levels 3 and 4) were collected and will be included in later analyses.
Odds ratios (OR) are used in the report to investigate the association of dichotomous ‘risk’ factors and dichotomous outcome variables. The odds ratio is defined as the ratio of the odds for those with the risk factor presented to the odds for those without (noting that ‘risk’ is used as a generic statistical term here rather than suggesting all odds ratios refer to actual risks).
Longitudinal and multivariate models are also provided in this report for two outcomes; firstly, a lifecourse approach was taken to the determinants of birth weight; and secondly, a longitudinal approach was taken to consider the determinants of change in maternal mental health status between pregnancy and the postnatal period. In both cases General Linear Modelling (GLM) was used to analyse the associations between the multiple determinants of these two outcomes. The results presented in this report include the model R2, coefficients of parameter estimates and their standard errors, Pr(>F) and Pr(>|t|). The model R2 is an estimate of the amount of the variation in the outcome variable (e.g. birth weight) from the observed data that can be explained by the full multivariate fitted model. The coefficients of parameter estimates and their standard errors indicate the size, the direction of the effect and the precision of the parameter estimates. The Pr(>F) indicates the significance of the association between the fitted model or the determinants and the outcome variable. The Pr(>|t|) indicates the significance of the association between the determinant and the outcome variable, where the determinant was a continuous variable. Where the determinant is a categorical variable, the Pr(>|t|) indicates the significance of the difference of the parameter estimate between the reference category and the tested category of the specific categorical variable. Statistical significance was defined using a two-sided significance level of 0.10.
Data reported in the text have been rounded to the nearest whole number, except where the percentage is less than 10, in which case they have been rounded to one decimal place. Where data from other sources has been reported and in the modelling results, decimal points have been retained. In tables and graphs, numbers have been rounded to one decimal place. The rounding to one decimal place means percentages may not necessarily add exactly to 100%. In summary tables where multiple response(s) have been allowed percentages total to more than 100%. Row (horizontal) and column (vertical) percentages are used in tables to illustrate specific results of interest. The analyses in this report were conducted using SAS® for Windows version 9.2.
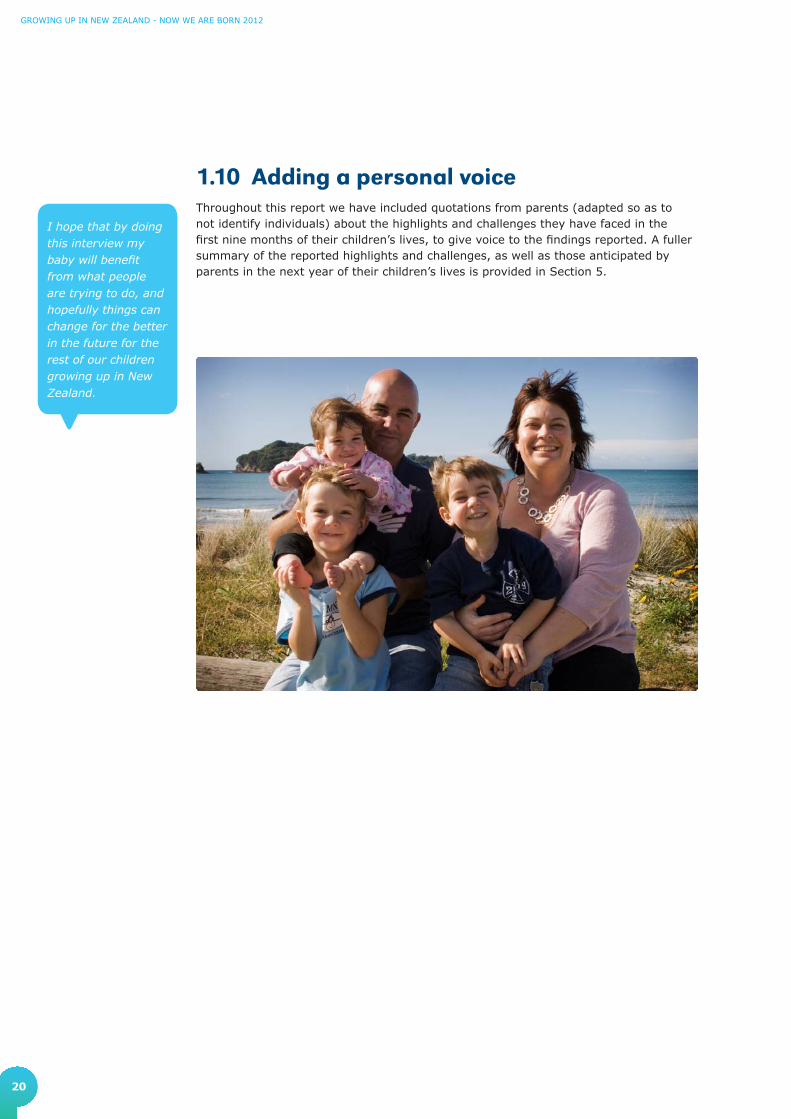
20
GrowinG Up in new Zealand - now we are born 2012
1.10 Adding a personal voiceThroughout this report we have included quotations from parents (adapted so as to not identify individuals) about the highlights and challenges they have faced in the first nine months of their children’s lives, to give voice to the findings reported. A fuller summary of the reported highlights and challenges, as well as those anticipated by parents in the next year of their children’s lives is provided in Section 5.
I hope that by doing this interview my baby will benefit from what people are trying to do, and hopefully things can change for the better in the future for the rest of our children growing up in New Zealand.

21
2. The Growing Upin New Zealand cohortat birth

22
GROWING UP IN NEW ZEALAND - NOW WE ARE BORN 2012
2. The Growing Up in New Zealand cohort at birth
The Growing Up in New Zealand babies were recruited antenatally and children were eligible for inclusion if their mother’s expected date of delivery (EDD) was between the 25th of April 2009 and the 25th of March 2010 (as described in Section 1.2). The parental and family environments that existed prior to the children’s births were described in our first report (Morton et al., 2010), and our conceptual framework was described in Section 1.3. The information in this section introduces the characteristics of the children themselves at birth. This information is collated from multiple routine perinatal data sources, as well as from parental report.
2.1 Date and place of birth The birth dates of the 6846 children in Growing Up in New Zealand ranged from March 2009 to May 2010. The distribution ot their dates of birth is shown below (Figure 03). Given rates and timing of premature delivery, as well as recruitment rates, we expected to see fewer deliveries in the earliest months of the distribution.
0
1
2
3
4
5
6
May 2010February 2010November 2009August 2009May 2009 March 2009
Perc
ent
(%)
Figure 03: Distribution of dates of birthEach bar = 2 weeks
Pregnant women were recruited from the Auckland, Counties Manukau and Waikato DHB regions. Information on birth location is available for 6843 of the Growing Up in New Zealand babies. Almost all babies (6467, 95%) were born in a medical facility (hospital or birth centre). Over three-quarters of babies (5349, 78%) were born in the three major hospitals (Auckland, Middlemore, and Waikato) in the three DHB recruitment regions, with 14% (928) of babies born in birth centres in Auckland and Hamilton. Approximately 3% of babies were born at home, although not always as a planned home delivery (0.1%). Less than 3% of the cohort were born either outside these three DHB regions in either New Zealand or overseas (Figure 04).

23
SECTION 2
Figure 04: Place of delivery
Deliveries described as within each of the three DHBs are those that occurred within a hospital or birthing/maternity facility.
2.2 Type of deliveryThe majority of the babies in the Growing Up in New Zealand cohort were born by spontaneous vaginal delivery (4482, 66%), with approximately one in 10 of all births (641, 9.5%) requiring an assisted delivery (vacuum extraction or forceps, but not including caesarean section) (Figure 05).
Nearly one-quarter of all babies were born by caesarean section (1647, 24%), which included both planned or elective caesarean (686, 10%) and unplanned or emergency caesarean (961, 14%). The likelihood of a baby being born by caesarean (either planned or emergency/unplanned) increased with maternal age. For example, a mother aged 35 years or older was 2.5 times more likely to have a caesarean than a mother aged 25 years or younger (OR=2.5, 95%CI: 2.2-3.0).
0
10
20
30
40
Elsewhereoverseas
Elsewhere inNew Zealand
Had a home birth orborn before arrival
at the hospital
Waikato DHBCounties-ManukauDHB
Auckland DHB
36.7
32.2
25.7
2.7 2.50.2
Perc
ent
(%)
Perc
ent
(%)
0
10
20
30
40
50
60
70
80
90
100 Other assistedbirth** (N=640)
Emergency orunplannedcaesarean(N=961)
Planned caesarean(N=686)
Spontaneousvaginal delivery*(N=4481)
40 years or older30-39 years20-29 yearsUnder 20 years
7.4
82.1
1.0
9.6
9.1
71.3
6.2
13.4
10.0
62.1
13.2
14.8
8.7
53.3
18.3
19.7
Figure 05: Delivery type by maternal age
* Spontaneous vaginal delivery includes normal and breech delivery without requiring instrumental assistance** Other assisted birth includes those that required vacuum extraction or forceps
When he popped out, it was the fi rst time I've ever seen a woman giving birth. It was an amazing experience and I would say it was the biggest highlight.

24
GrowinG Up in new Zealand - now we are born 2012
In our culture it is always the biggest thing that you give birth to a boy - the biggest highlight is that he turned out to be a boy.
The New Zealand Health Information Service’s Maternity Report (2007) describing all New Zealand hospital deliveries in 2004 reported similar proportions of delivery type. Of all New Zealand live hospital births in 2004, 66.5% were spontaneous vaginal deliveries, 9.5% were assisted deliveries, and 23.7% of infants were born by caesarean section (planned and unplanned). The incidence of caesarean sections in New Zealand has increased from 11.7% of mothers in 1988 to 23.7% in 2004 (New Zealand Health Information Service, 2007). The percentage of caesarean deliveries in the Growing Up in New Zealand mothers (24%) aligns well to these recent national figures for all hospital births. Similarly, the association between increasing age and increasing likelihood of caesarean section seen for the Growing Up in New Zealand mothers is very similar to that reported for all New Zealand hospital births (New Zealand Health Information Service, 2007). This trend towards increasing maternal age for New Zealand births has important implications for the allocation of both maternity and postnatal health care resources given the association of increased maternal age with more complications in pregnancy and in the immediate perinatal period.
2.3 Gender and ethnicity Of the 6846 live born babies who make up the Growing Up in New Zealand cohort, 3526 (52%) were male, and 3320 (48%) were female.
The parents of the Growing Up in New Zealand cohort were asked to describe the ethnic group(s) that their children belong to at the antenatal and nine month interviews, with multiple responses possible at each collection point. Information is also sought about the level of engagement that the families have with their own nominated ethnic group. When the children were approximately nine months of age, mothers indicated that 4488 (69%) of the cohort were New Zealand European, 1549 (24%) were Māori, 1378 (21%) were Pacific Peoples, 1094 (17%) were Asian, 180 (3%) were Middle Eastern, Latin American or African, and 256 (4%) belonged to other ethnic groups (Figure 06). Where information was available at nine months (6465), multiple ethnicities were indicated for approximately one-third (2077, 32%) of children, with 1705 (26%) of children described as having two ethnicities, and 372 children (5.8%) described as having three or more ethnicities.
Figure 06: Ethnicity of the children as described by their mothers at nine months
Multiple response(s), therefore percentages will total to more than 100%* Middle Eastern, Latin American or African
0
20
40
60
80
100
OtherMELAA*AsianPacific PeoplesMāoriNew ZealandEuropean
Perc
ent
(%)
69.4
24.021.3
16.9
2.8 4.0
The smile on her mother’s face when she saw she had a girl rather than the boy she was expecting was fantastic.

25
SECTION 2
2.4 Gestational age and birth weightSize at birth, which includes measures of absolute birth weight as well as gestational age at delivery (Spencer, 2003), is an important predictor of both immediate perinatal health and health status in later life. Graded associations (both positive and negative) have now been described with multiple health and non-health related outcomes according to the normal distribution of size at birth across a population (Barker, 1998; Gluckman & Hanson, 2006). In particular, birth weight and subsequent patterns of postnatal growth have been associated with longer-term outcomes including physical development (e.g. obesity), and cognitive, behavioural and motor development (Lynch & Smith, 2005). Being small at birth is commonly correlated with poorer health outcomes including increased risk of later life chronic diseases such as diabetes and heart disease (Barker, 1998). Over time examining the relationships between size at birth and gestational age at delivery and later life health and development outcomes will be important within the Growing Up in New Zealand cohort.
2.4.1 Gestational age at deliveryThe majority (6244, 91%) of the babies in the Growing Up in New Zealand cohort were born at term (between 37 and 41 weeks completed gestation). A further 6.2% (424) of the cohort were born before 37 weeks of gestation (preterm delivery) and 2.5% were born after more than 41 completed weeks of gestation (post-term) (Figure 07). These figures are similar to those reported by the New Zealand Health Information Service (2007) for all New Zealand live births in 2004 (91.6% of births were at term and 7.1% were preterm).
0
5
10
15
20
25
30
35
43+ 424140393837363534333231302928272625
Preterm (<37 weeks) Term (37-41 weeks)
Post-term(>41
weeks)
Perc
ent
(%)
0.1 0.1 0.1 0.1 0.1 0.1 0.3 0.10.2 0.6 0.9 1.22.5
6.6
15.5
24.6
29.4
15.2
2.3
Figure 07: Gestational age (completed weeks gestation) at delivery
Bringing her home from hospital was great because she was premature and special and it’s been lovely watching her development into a happy healthy baby.

26
GrowinG Up in new Zealand - now we are born 2012
The percentage of babies in New Zealand born preterm has increased over the last several decades, from 4.3% in 1980 to 5.9% in 1999 (Craig, Thompson, & Mitchell, 2002), and 7.1% in 2004 (New Zealand Health Information Service, 2007). The increase in preterm births is generally considered to be the result of a mix of increasing maternal age, which increases the likelihood of premature delivery, more multiple births and increasing use of assisted reproductive technologies (ART) (Craig et al., 2002). Almost half of all premature deliveries are of unknown cause. The antenatal environmental, family and pregnancy specific information (including use of ART) available from the Growing Up in New Zealand study will allow us to investigate further what factors were associated with premature delivery for the Growing Up in New Zealand cohort.
2.4.2 Absolute birth weight at deliveryThe birth weights of the 6841 babies in the Growing Up in New Zealand cohort with available information on weight at birth ranged from 575 grams to 5850 grams (with a mean of 3481 grams and a median of 3500 grams, SD=583 grams). Nearly 80% (5397) of the babies weighed between 2500 grams and 4000 grams (appropriate birth weight), with 16% (1109) of the babies weighing over 4000 grams (high birth weight), and 4.9% (335) weighing less than 2500 grams (low birth weight), including 0.6% of babies classifiable as either very low birth weight (between 1500 grams and 1000 grams) or extremely low birth weight (less than 1000 grams) (Table 02).
Table 02: Absolute birth weight (grams)
Birth weight N (%)Min(grams)
Max(grams)
Mean(grams)
Median(grams)
SD(grams)
Low birth weight (<2500g)
335 (4.9) 575 2499 2030 2215 472
Appropriate birth weight (2500-4000g)
5397 (78.9) 2500 4000 3402 3430 355
High birth weight (>4000g)
1109 (16.2) 4005 5850 4306 4240 268
The percentage of low birth weight babies (4.9%) in this cohort was slightly lower than that reported by the OECD (2011) for all New Zealand live births (5.9%) in 2009. The percentage of low birth weight reported nationally for term babies by the New Zealand Health Information Service (2007) in 2004 was 2%. When restricted to term deliveries the proportion for the Growing Up in New Zealand infants was a comparable 1.8%.
On average, male babies were heavier (3536 grams) than females (3424 grams) at birth (Figure 08). This pattern is consistent with international and New Zealand birth weights by gender (New Zealand Health Information Service, 2007). The Growing Up in New Zealand babies were slightly heavier on average (about 100 grams for both boys and girls) than the weight described for all live births nationally in 2004.

27
SECTION 2
Figure 09: Absolute birth weight distribution (by maternal ethnicity)
Figure 08: Absolute birth weight distribution (by gender)
There were differences in the distribution of birth weight seen for the Growing Up in New Zealand babies according to their mother’s ethnicity (Figure 09). Babies whose mothers identified as Pacific had the highest average birth weight (3610 grams, SD=601). Babies whose mothers identified as Asian had the lowest average birth weight (3262 grams, SD=539). The average birth weights of babies whose mothers identified as Māori (3478 grams, SD=578) or New Zealand European (3516 grams, SD=578) were similar. A similar pattern of average birth weight according to maternal ethnicity is reported by the New Zealand Health Information Service (2007).
60005500500045004000350030002500200015001000500
A bsolute birth weight (grams)
New Zealand EuropeanMāoriPac ific P eoplesA s ianMELA A *O ther
500 1000 1500 2000 2500 3000 3500 4000 4500 5000 5500 6000
Absolute birth weight (grams)
0%
6%
11%
17%
23%
28%
34%
40%
Perc
ent
(%)
Boys (N=3525) Girls (N=3316)
Perc
ent
(%)
40
34
28
23
17
11
6
0
Mothers who have identified multiple ethnicities are represented in the distribution for each of their described ethnicities
*MELAA - Middle Eastern, Latin American or African.

28
GrowinG Up in new Zealand - now we are born 2012
2.5 Birth weight as the dependent (outcome) variable
This section presents an example of the capacity of the longitudinal data within Growing Up in New Zealand, analysing the pre-pregnancy and pregnancy determinants of birth weight for the cohort, including consideration of the influences of the environment and parental and family status (in comparison to other analyses of the determinants of size at birth that tend to focus on the immediate pregnancy environment).
Birth weight remains the strongest known single indicator of an infant’s immediate risk of perinatal and infant mortality (Spencer, 2003). The lower the birth weight of an infant the greater the risk of neonatal death and developmental problems. Although less important in terms of absolute numbers affected, very large infants, at the other extreme of the birth weight distribution, also have an increased risk of death in the neonatal period. Within populations the prevalence of low birth weight in particular has been widely used as an indicator of that population’s overall health status. In the last few decades indices of fetal growth have taken on new significance in the light of a now substantial body of evidence linking indices of reduced fetal growth to an increased risk of disease in adult life, in particular chronic diseases such as cardiovascular disease. The Growing Up in New Zealand data provides a unique opportunity to model the determinants of birth weight for a contemporary and diverse population of children born in New Zealand. Importantly, because the data collection began from before birth, the modelling can include pre-pregnancy and pregnancy behaviours and contexts, reported in the antenatal period rather than recalled postnatally.
2.5.1 Longitudinal modellingThe method of General Linear Modelling (GLM) was used to model the determinants of birth weight for the Growing Up in New Zealand birth population. The analysis presented here was restricted to singleton babies to avoid the complexity of the determinants of restricted birth weight in multiple pregnancies. Analyses described below are adjusted for gestational age at delivery, gender and parity (birth order) as birth weight is also known to be strongly patterned by these key variables. Controlling for these known determinants it was then possible to consider the association of other pre-pregnancy and pregnancy factors with birth weight. The analyses firstly explored associations between each of the explanatory variables and birth weight separately (adjusting for gender, parity and gestational age at delivery), and then based on these findings developed a multivariate model of the determinants of birth weight for babies in the Growing Up in New Zealand cohort.

29
Section 2
Pre-pregnancy and pregnancy specific determinants of birth weight
The initial analyses (Table 03) considered the effect of each possible determinant (explanatory variable) of birth weight, adjusting for gender, parity and gestational age for each. The variables were grouped according to their temporal ordering, so maternal pre-pregnancy characteristics appear first, followed by family and paternal characteristics, then pregnancy behaviours and pregnancy specific health.
The babies' own gestational age at delivery, gender and maternal parity were strongly significantly associated with birth weight, with greater gestational age, being male and being a second or subsequent child being associated with higher birth weights.
These initial analyses demonstrated that each of the maternal pre-pregnancy characteristics: age at pregnancy; self-defined ethnicity; maternal height; pre-pregnancy weight and Body Mass Index (BMI), highest educational qualification and maternal smoking before pregnancy were all significantly associated with the child’s weight at birth (Table 03), after accounting for parity, gestational age at delivery and baby’s gender. In particular babies born to Pacific mothers tended to be almost 90 grams heavier on average than those born to New Zealand European mothers, whereas those born to Māori mothers tended to be nearly 60 grams lighter, and those born to Asian mothers almost 240 grams lighter at birth. Maternal pre-pregnancy smoking was associated with lighter infants on average compared to non-smokers pre-pregnancy, and mothers without any secondary education tended to have smaller babies than more educated mothers.
Additionally socio-economic family characteristics before and during pregnancy, including total household income, maternal employment in pregnancy, and whether others smoked in the household were also significantly associated with the Growing Up in New Zealand child’s weight at birth (Table 03). Having less available income and being exposed to passive smoke before and during pregnancy were both associated with a reduction in an infant’s birth weight. Mothers who were students tended to have larger babies compared to those who were unemployed or not in the workforce by choice. There was little difference in size in birth between those mothers not in the workforce by choice in late pregnancy, compared to those working in their third trimester.
Other maternal pregnancy specific characteristics such as continued physical activity after the first trimester of pregnancy, maternal smoking during pregnancy, and higher alcohol consumption during pregnancy were also associated with smaller babies, whereas maternal compliance with MoH nutritional guidelines was associated with slightly larger babies at birth. Pregnancy specific health issues, including gestational diabetes, hypertension and pre-eclampsia also significantly influenced birth weight. Gestational diabetes tending to increase birth weight by almost 125 grams, whereas hypertension or pre-eclampsia both reduced birth weight (Table 03).
Of note is that paternal age (at pregnancy) and paternal completed education, as well as mother’s self-rated general pre-pregnancy health status, whether she reported an existing long-term disability, and whether the pregnancy was planned or assisted, did not have a significant association with birth weight in these analyses.
The results of these initial analyses were used to guide the multivariate modelling which is summarised in Table 04.

30
GrowinG Up in new Zealand - now we are born 2012
Tab
le 0
3:
Resu
lts
of
un
ivari
ate
an
aly
sis
of
bir
th w
eig
ht
ad
just
ed
fo
r g
est
ati
on
al
ag
e,
gen
der
an
d p
ari
ty
Vari
ab
leLevels
Refe
ren
ce G
rou
pIn
itia
l an
aly
sis
resu
lts§
Pr(
>F)*
Co
effi
cien
t+S
E+
Pr(
>|t
|)#
Mate
rnal p
re-p
reg
nan
cy
Mat
ernal
age
(yea
rs)
Less
than
25
30 -
34
0.1
258
-33.4
316.4
00.0
415
25 -
29
-32.0
415.1
40.0
344
35 -
39
-11.1
415.9
30.4
844
40 a
nd a
bov
e
-4
2.1
929.1
70.1
481
Sel
f-re
port
ed e
thnic
ity
Paci
fic
People
sN
ew Z
eala
nd E
uro
pea
n<
.0001
88.5
116.1
7<
.0001
Māo
ri-5
9.8
016.4
10.0
003
Asi
an-2
39.6
616.1
2<
.0001
MELA
A**
-78.9
739.5
30.0
458
Oth
er-6
0.3
893.3
10.5
176
Hig
hes
t ed
uca
tion
No s
econdar
y sc
hool qual
ifica
tion
Hig
her
deg
ree
0.0
157
-43.1
225.4
30.0
901
Sec
ondar
y sc
hool/
NCEA 1
-4
26.8
818.1
80.1
394
D
iplo
ma/
Trad
e ce
rtifi
cate
/NCEA 5
-6
30.9
217.3
70.0
750
Bac
hel
or’s
deg
ree
15.0
318.3
60.4
130
Pre-
pre
gnan
cy B
MI
(per
kg/m
2)
<.0
001
12.7
41.0
0<
.0001
Hei
ght
(per
cm
)
<
.0001
14.3
70.7
8<
.0001
Pre-
pre
gnan
cy w
eight
(per
kg)
<.0
001
6.0
20.3
2<
.0001
Sel
f-re
port
ed g
ener
al h
ealth
Poor
Exc
elle
nt
0.2
309
48.1
539.8
20.2
267
Fa
ir
21.3
423.3
70.3
613
G
ood
-7.5
315.6
70.6
306
Ver
y good
17.6
515.5
60.2
566
Dis
abili
tyYe
sN
o0.5
051
16.2
424.3
60.5
051
Sm
oki
ng p
rior
to p
regnan
cyYe
sN
o0.0
013
-44.8
413.9
30.0
013
Fam
ily c
hara
cteri
stic
s
Part
ner
age
(yea
rs)
0.8
639
-0.1
91.0
90.8
639
Part
ner
educa
tion
No s
econdar
y sc
hool qual
ifica
tion
Hig
her
deg
ree
0.1
820
-41.4
031.1
30.1
836
Sec
ondar
y sc
hool/
NCEA 1
-43.5
422.4
40.8
745
Dip
lom
a/Tr
ade
cert
ifica
te/N
CEA 5
-624.9
120.0
50.2
142
Bac
hel
or’s
deg
ree
0.5
822.8
50.9
797
House
hold
inco
me
<=
$30K
> $
70K t
o <
= $
100K
0.0
025
-83.2
624.2
60.0
006
>
$30K t
o <
= $
70K
-21.6
917.7
20.2
211
>
$100K
-1.9
317.0
80.9
102

31
Section 2
Mate
rnal P
reg
nan
cy
Plan
ned
Pre
gnan
cyYe
sN
o0.6
705
4.8
711.4
50.6
705
Ass
iste
d P
regnan
cyYe
sN
o0.5
786
-13.4
524.2
10.5
786
Sm
oki
ng
Ante
nat
alYe
sN
o<
.0001
-158.9
719.0
4<
.0001
Sm
oki
ng
Continue
during p
regnan
cyN
on-s
moke
r<
.0001
-151.8
019.3
8<
.0001
Sto
pped
during p
regnan
cy
68.4
419.8
50.0
006
Pass
ive
smoki
ng
Yes
No
<.0
001
-101.9
123.0
0<
.0001
Alc
ohol co
nsu
mption in t
he
firs
t tr
imes
ter
4+
drinks
per
wee
kD
id n
ot
drink
0.2
228
0.4
822.6
40.9
829
1 -
3 d
rinks
per
wee
k
-4
4.0
522.0
90.0
461
Le
ss t
han
1 d
rink
per
wee
k
-1
5.3
119.7
00.4
372
Alc
ohol co
nsu
mption a
fter
the
firs
t tr
imes
ter
4+
drinks
per
wee
kD
id n
ot
drink
0.0
197
-153.0
261.2
10.0
124
1 -
3 d
rinks
per
wee
k-5
9.0
431.7
60.0
631
Less
than
1 d
rink
per
wee
k-1
5.0
119.1
40.4
328
Num
ber
of nutr
itio
nal
guid
elin
es f
ollo
wed
4 g
uid
elin
esN
one
0.2
745
46.7
033.2
80.1
607
3 g
uid
elin
es
34.8
920.7
90.0
934
2 g
uid
elin
es
32.6
017.2
30.0
586
1 g
uid
elin
e
18.6
616.3
50.2
538
Phys
ical
act
ivity
afte
r th
e firs
t tr
imes
ter
Yes
No
0.0
066
-32.9
212.1
10.0
066
Labour
forc
e st
atus
Not
in w
ork
forc
eEm
plo
yed
0.0
003
4.9
713.3
20.7
089
Stu
den
t
64.2
022.6
10.0
045
U
nem
plo
yed
-61.8
621.1
20.0
034
ED
I Ante
nat
al (
per
unit)
0.3
152
1.1
81.1
70.3
152
Ges
tational
dia
bet
esYe
sN
o<
.0001
124.3
829.4
4<
.0001
Hyp
erte
nsi
on
Yes
No
0.0
341
-48.8
223.0
30.0
341
Pre-
ecla
mpsi
aYe
sN
o0.0
069
-96.7
635.8
00.0
069
Bir
th
Ges
tational
age
(per
wee
k)Ŧ
<.0
001
174.3
53.4
3<
.0001
Gen
der
ŦBoy
Girl
<.0
001
97.9
113.4
5<
.0001
Parity
ŦSubse
quen
tFi
rst
born
<.0
001
145.5
04329
13.5
2<
.0001
§ T
he
initia
l an
alys
es c
onsi
der
ed t
he
effe
ct o
f ea
ch e
xpla
nat
ory
fac
tor
on b
irth
wei
ght
afte
r ad
just
ing for
gen
der
, par
ity
and g
esta
tional
age
at d
eliv
ery.
* T
he
Pr(>
F) indic
ates
the
signifi
cance
of th
e as
soci
atio
n b
etw
een t
he
fitt
ed m
odel
or
the
det
erm
inan
ts a
nd t
he
outc
om
e va
riab
le.
+ T
he
coef
fici
ents
of par
amet
er e
stim
ates
and t
hei
r st
andar
d e
rrors
, SE,
indic
ate
the
size
, th
e direc
tion o
f th
e ef
fect
and t
he
pre
cisi
on o
f th
e par
amet
er e
stim
ates
.# T
he
Pr(>
|t|)
indic
ates
the
signifi
cance
of th
e as
soci
atio
n b
etw
een t
he
det
erm
inan
t an
d t
he
outc
om
e va
riab
le,
wher
e th
e det
erm
inan
t w
as a
continuous
variab
le.
Wher
e th
e det
erm
inan
t is
a c
ateg
orica
l va
riab
le,
the
Pr(>
|t|)
indic
ates
th
e si
gnifi
cance
of th
e diffe
rence
of th
e par
amet
er e
stim
ate
bet
wee
n t
he
refe
rence
cat
egory
and t
he
test
ed c
ateg
ory
of th
e sp
ecifi
c ca
tegorica
l va
riab
le.
**M
ELA
A -
Mid
dle
Eas
tern
, La
tin A
mer
ican
or
Afr
ican
.Ŧ U
niv
aria
te a
nal
yses
res
ult.

32
GrowinG Up in new Zealand - now we are born 2012
Multivariate longitudinal analysis for determinants of birth weight
In the model to consider the collective effects of the pre-pregnancy and pregnancy determinants of infant birth weight in the Growing Up in New Zealand cohort, gestational age (in completed weeks), babies' gender and maternal parity all remained strongly significantly associated with size at birth (Table 04). Differences in birth weight according to mother’s self-prioritised ethnicity persisted in the mutually adjusted model, with babies born to Pacific mothers tending to be larger, and those born to Māori and Asian mothers smaller, when compared to babies born to New Zealand European mothers. However, only the difference in birth weight between babies born to Asian and New Zealand European mothers remained statistically significant, with babies born to Asian mothers tending to be approximately 130 grams lighter at birth on average (after adjusting for all other determinants).
Mother’s highest level of education was significant in the initial analysis but it did not reach statistical significance in the final mutually adjusted model (Table 04). However the direction of the association between completed maternal education level and birth weight was consistent with expectations that less well educated mothers tend to have smaller babies. Maternal education, though, is also known to be highly correlated with maternal occupation and income, and therefore some of the effects of maternal education on birth weight in this cohort may well have been mediated through these more proximal variables in the model (Table 04). Although the trend across all household income categories was not statistically significant, the differences in birth weight between groups were in the expected direction, with lower household incomes associated with lower birth weights. Maternal participation in the labour market during late pregnancy was also associated with birth weight in the final adjusted model. Mothers not in the labour force or those who were students tended to have larger babies than the mothers who were either in paid employment in late pregnancy, after adjustment for household income, maternal education and all other determinants in the model.
In the mutually adjusted model being an older mother (over 40 years in particular) was associated with having a smaller baby on average. This is in contrast to mothers who developed gestational diabetes who had significantly larger babies (approximately 90 grams larger on average) while those who had gestational hypertension and/or pre-eclampsia had significantly smaller babies (approximately 100 grams smaller in both cases).
Those mothers who continued smoking during pregnancy had babies that were on average 176 grams smaller than those of non-smoking mothers. Those who had given up smoking during pregnancy however had slightly larger babies than those who were non-smokers before pregnancy. Although only marginally significant this association persisted after adjusting for maternal BMI and compliance with nutritional guidelines, and is not usually reported. Maternal weight gain in pregnancy, which has not been modelled at this stage, may have assisted with understanding this outcome better. Mothers who were exposed to passive smoking during their pregnancies had smaller babies, although not as small as babies born to active smokers. Following MoH nutritional guidelines did result in slightly larger babies (modest 30 to 40 gram increases) but the differences were not statistically significant after adjusting for the known confounders of this association such as maternal education, household income and BMI. Physical activity after the first trimester of pregnancy resulted in marginally smaller babies (approximately 30 grams lighter), although the association remained significant with other potential confounders included in the model (maternal education, household income, non-smoking, adherence to nutritional guidelines).

33
Section 2
The model R2 of 0.41 suggests that the explanatory variables included in the multivariate model are able to explain approximately 41% of the variation seen in the Growing Up in New Zealand infants’ weights at birth. The explanatory power of this model is relatively high in comparison to other models based on observational data where R2 is often only in the order of 0.30. This may be due to the inclusion of a wider range of biological, social, family, pre-pregnancy and behavioural variables in this study in addition to the pregnancy specific variables that are often the focus of explanations of birth weight variation. It may also be in part because there is less measurement error in the explanatory variables for the Growing Up in New Zealand cohort because they have been measured during pregnancy rather than retrospectively.
Summary of birth weight modelling
Overall the multivariate modelling indicates that there are some key determinants of birth weight that are shaped during the mother’s own lifecourse development. In particular her own pre-pregnancy height, weight and BMI were strongly associated with her infant's birth weight, as were her pre-pregnancy behaviours, including smoking (whether she stopped or not in pregnancy) and usual physical activity (given that virtually all mothers active during pregnancy were also active before they became pregnant). Maternal age at pregnancy and level of completed education were also important, both directly and indirectly through their association with total household income and maternal employment status in pregnancy. Pregnancy behaviours such as active smoking, as well as passive exposure to smoke and continued alcohol consumption all reduced size at birth, as did maternal pregnancy specific hypertensive disease. Gestational diabetes increased size at birth significantly (after adjusting for maternal pre-pregnancy height and BMI) whereas complying with the wide range of nutritional guidelines only had a small positive effect on growth after adjusting for other determinants (Table 04).
2.5.2 Birth weight as an explanatory variable for future longitudinal analyses
The distribution of birth weight according to ethnicity within the Growing Up in New Zealand cohort will be used to examine how size at birth relates firstly to postnatal growth trajectories and secondly to the evolution of health and developmental trajectories over time within the context of the whole New Zealand child population, as well as in particular subgroups. Currently the graded associations in health outcomes seen in international populations in later life, according to size at birth, have not been examined for New Zealand Māori or Pacific children in particular. The distributions of birth weights of children identifying with these groups do not necessarily align to the international findings of smaller babies having poorer lifecourse health and development (Gluckman & Hanson, 2006). Ongoing longitudinal data collections offer a unique opportunity to follow these trajectories and consider the lifelong effects for all New Zealand children over time.
Because the Growing Up in New Zealand data collections began before birth, the effects of the pre-pregnancy and the pregnancy specific environments can also be considered in these future analyses and lifecourse models.

34
GrowinG Up in new Zealand - now we are born 2012
Tab
le 0
4:
Resu
lts
of
mu
ltiv
ari
ate
an
aly
sis
of
bir
thw
eig
hts
Vari
ab
leLevels
Refe
ren
ce G
rou
p
Mo
del S
tati
stic
sP
r(>
F)*
<0
.00
01
R2
= 0
.41
¥
Pr(
>F)*
Co
effi
cien
t+S
E+
Pr(
>|t
|)#
Mate
rnal p
re-p
reg
nan
cy
Age
(yea
rs)a
tern
al a
ge
(yea
rs)
Less
than
25
30 -
34
0.4
016
11.7
223.8
30.6
228
25 -
29
-10.1
717.7
30.5
665
35 -
39
-12.3
817.4
00.4
769
40 a
nd a
bov
e
-5
6.6
332.8
30.0
846
Sel
f-re
port
ed e
thnic
ity
Paci
fic
People
sN
ew Z
eala
nd E
uro
pea
n<
.0001
33.2
225.3
20.1
896
Māo
ri-2
6.0
022.8
10.2
546
Asi
an-1
32.2
821.3
6<
.0001
MELA
A**
18.1
550.2
80.7
181
Oth
er-5
.38
104.5
30.9
590
Hig
hes
t ed
uca
tion
No s
econdar
y sc
hool qual
ifica
tion
Hig
her
deg
ree
0.2
891
-64.8
139.6
80.1
025
Sec
ondar
y sc
hool/
NCEA 1
-4
-4
.34
22.2
10.8
451
D
iplo
ma/
Trad
e ce
rtifi
cate
/NCEA 5
-6
8.5
720.1
80.6
710
Bac
hel
or's
deg
ree
15.1
519.4
70.4
365
Pre-
pre
gnan
cy B
MI
(per
kg/m
2)
<.0
001
13.2
91.2
6<
.0001
Hei
ght
(per
cm
)
<
.0001
14.0
20.9
4<
.0001
Fam
ily c
hara
cteri
stic
s
House
hold
inco
me
<=
$30K
> $
70K t
o <
= $
100K
0.2
204
-54.1
428.8
00.0
602
>
$30K t
o <
= $
70K
-8.1
918.7
70.6
626
>
$100K
5.9
917.6
20.7
339

35
Section 2
Pre
gn
an
cy s
peci
fic
Mat
ernal
sm
oki
ng
Continue
smoki
ng
Non-s
moke
rs<
.0001
-167.3
728.8
0<
.0001
Sto
pped
sm
oki
ng
46.9
224.9
00.0
596
Pass
ive
smoki
ng
Yes
No
0.0
754
-58.9
933.1
70.0
754
Alc
ohol co
nsu
mption
4+
drinks
per
wee
kD
id n
ot
drink
0.4
434
-45.9
093.7
00.6
242
afte
r 1st
trim
este
r1 -
3 d
rinks
per
wee
k
-2
9.9
036.1
60.4
084
Le
ss t
han
1 d
rink
per
wee
k
-3
0.0
321.2
40.1
574
Num
ber
of nutr
itio
nal
4 g
uid
elin
esN
one
0.3
016
31.8
240.5
90.4
331
guid
elin
es follo
wed
3 g
uid
elin
es
43.4
323.5
40.0
651
2 g
uid
elin
es
30.8
018.9
40.1
04
1 g
uid
elin
e
11.7
417.7
50.5
083
Act
ive
in 1
st t
rim
este
rYe
sN
o0.0
341
-32.5
315.3
50.0
341
Labour
forc
e st
atus
Not
in w
ork
forc
eEm
plo
yed
0.0
446
29.8
316.7
00.0
742
Stu
den
t
58.2
425.4
00.0
219
U
nem
plo
yed
-10.0
229.7
80.7
366
ED
I (p
er u
nit)
0.2
442
1.6
31.4
00.2
442
Ges
tational
dia
bet
esYe
sN
o0.0
118
87.9
534.9
30.0
118
Hyp
erte
nsi
on
Yes
No
0.0
002
-102.8
527.5
90.0
002
Pre-
ecla
mpsi
aYe
sN
o0.0
172
-100.7
942.2
90.0
172
Bir
th
Ges
tational
age
(per
wee
k)
<
.0001
171.6
83.9
3<
.0001
Gen
der
Boy
Girl
<.0
001
118.3
612.9
1<
.0001
Parity
Subse
quen
tFi
rst
born
<.0
001
134.2
414.4
8<
.0001
¥ T
he
model
R2 is
an e
stim
ate
of th
e am
ount
of th
e va
riat
ion in t
he
outc
om
e va
riab
le (
e.g.
birth
wei
ght)
that
can
be
expla
ined
by
the
full
multiv
aria
te fi
tted
model
.* T
he
Pr(>
F) indic
ates
the
signifi
cance
of th
e as
soci
atio
n b
etw
een t
he
fitt
ed m
odel
or
the
det
erm
inan
ts a
nd t
he
outc
om
e va
riab
le.
+ T
he
coef
fici
ents
of par
amet
er e
stim
ates
and t
hei
r st
andar
d e
rrors
, SE,
indic
ate
the
size
, th
e direc
tion o
f th
e ef
fect
and t
he
pre
cisi
on o
f th
e par
amet
er e
stim
ates
.#
The
Pr(>
|t|)
indic
ates
the
signifi
cance
of th
e as
soci
atio
n b
etw
een t
he
det
erm
inan
t an
d t
he
outc
om
e va
riab
le,
wher
e th
e det
erm
inan
t w
as a
continuous
variab
le.
Wher
e th
e det
erm
inan
t is
a c
ateg
orica
l va
riab
le,
the
Pr(>
|t|)
indic
ates
t
he
signifi
cance
of th
e diffe
rence
of th
e par
amet
er e
stim
ate
bet
wee
n t
he
refe
rence
cat
egory
and t
he
test
ed c
ateg
ory
of th
e sp
ecifi
c ca
tegorica
l va
riab
le.
**M
ELA
A -
Mid
dle
Eas
tern
, La
tin A
mer
ican
or
Afr
ican
.
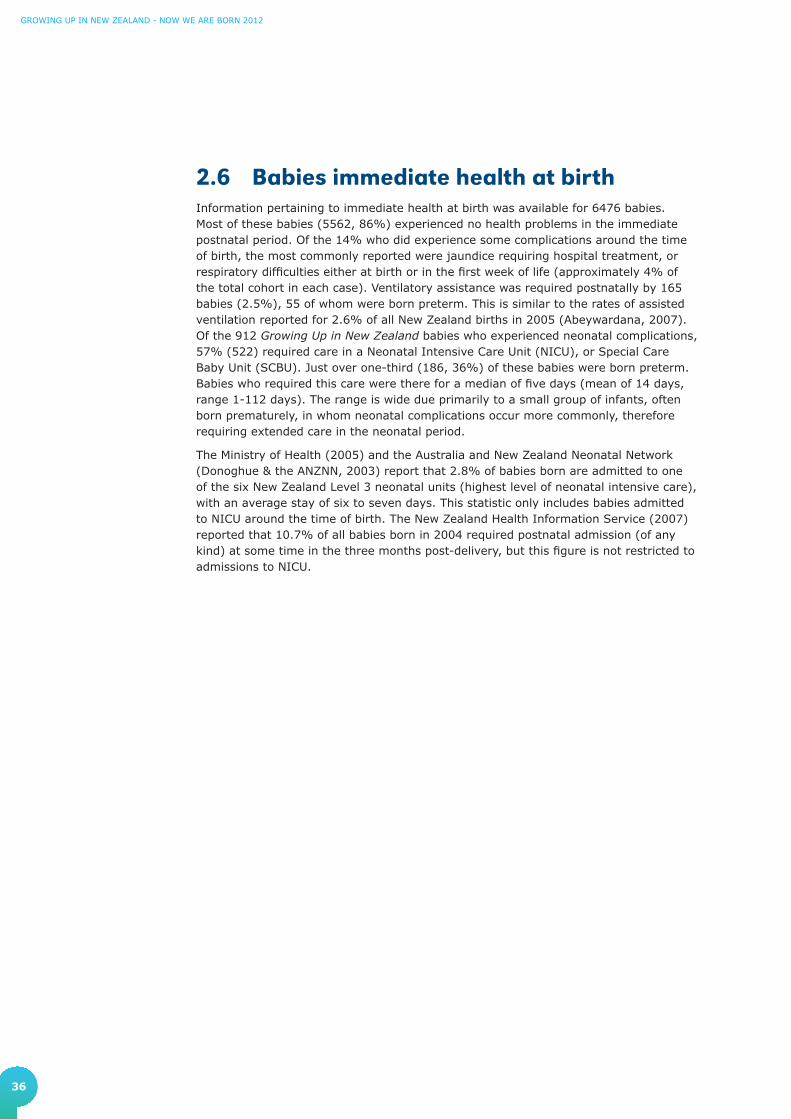
36
GrowinG Up in new Zealand - now we are born 2012
2.6 Babies immediate health at birthInformation pertaining to immediate health at birth was available for 6476 babies. Most of these babies (5562, 86%) experienced no health problems in the immediate postnatal period. Of the 14% who did experience some complications around the time of birth, the most commonly reported were jaundice requiring hospital treatment, or respiratory difficulties either at birth or in the first week of life (approximately 4% of the total cohort in each case). Ventilatory assistance was required postnatally by 165 babies (2.5%), 55 of whom were born preterm. This is similar to the rates of assisted ventilation reported for 2.6% of all New Zealand births in 2005 (Abeywardana, 2007). Of the 912 Growing Up in New Zealand babies who experienced neonatal complications, 57% (522) required care in a Neonatal Intensive Care Unit (NICU), or Special Care Baby Unit (SCBU). Just over one-third (186, 36%) of these babies were born preterm. Babies who required this care were there for a median of five days (mean of 14 days, range 1-112 days). The range is wide due primarily to a small group of infants, often born prematurely, in whom neonatal complications occur more commonly, therefore requiring extended care in the neonatal period.
The Ministry of Health (2005) and the Australia and New Zealand Neonatal Network (Donoghue & the ANZNN, 2003) report that 2.8% of babies born are admitted to one of the six New Zealand Level 3 neonatal units (highest level of neonatal intensive care), with an average stay of six to seven days. This statistic only includes babies admitted to NICU around the time of birth. The New Zealand Health Information Service (2007) reported that 10.7% of all babies born in 2004 required postnatal admission (of any kind) at some time in the three months post-delivery, but this figure is not restricted to admissions to NICU.
37
3. The Growing Upin New Zealand cohort in the fi rst nine months
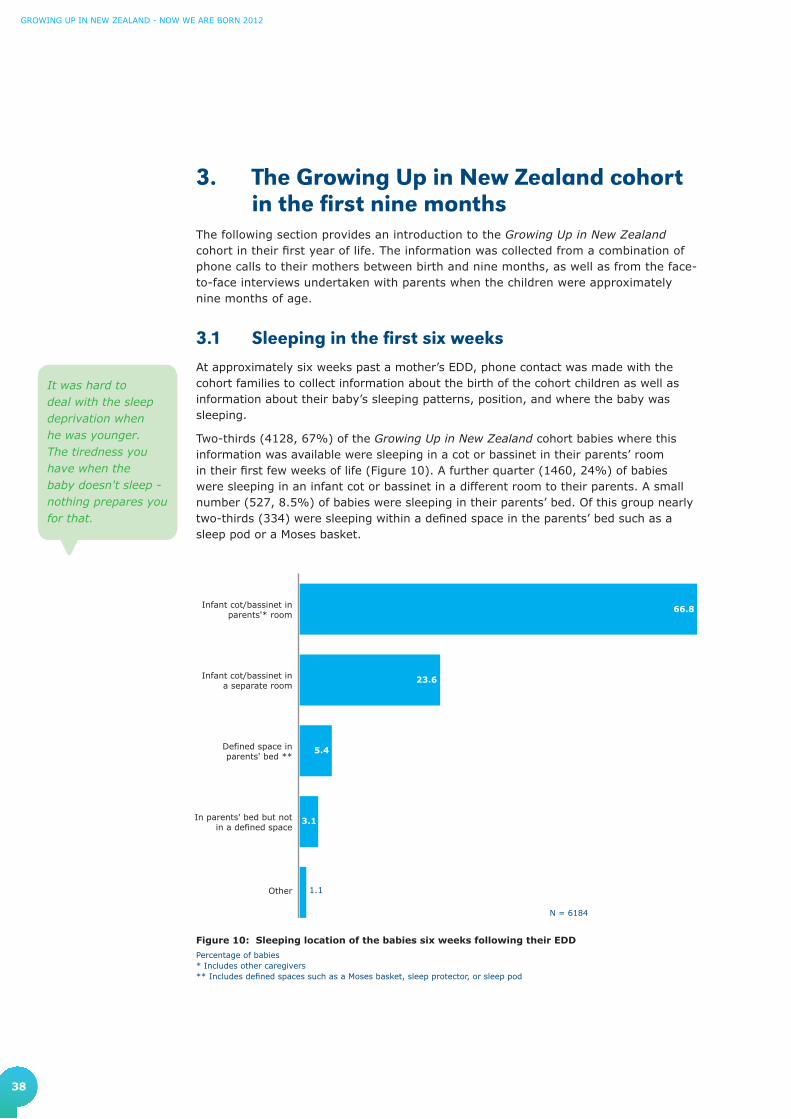
38
GROWING UP IN NEW ZEALAND - NOW WE ARE BORN 2012
3. The Growing Up in New Zealand cohort in the first nine months
The following section provides an introduction to the Growing Up in New Zealand cohort in their first year of life. The information was collected from a combination of phone calls to their mothers between birth and nine months, as well as from the face-to-face interviews undertaken with parents when the children were approximately nine months of age.
3.1 Sleeping in the first six weeksAt approximately six weeks past a mother’s EDD, phone contact was made with the cohort families to collect information about the birth of the cohort children as well as information about their baby’s sleeping patterns, position, and where the baby was sleeping.
Two-thirds (4128, 67%) of the Growing Up in New Zealand cohort babies where this information was available were sleeping in a cot or bassinet in their parents’ room in their first few weeks of life (Figure 10). A further quarter (1460, 24%) of babies were sleeping in an infant cot or bassinet in a different room to their parents. A small number (527, 8.5%) of babies were sleeping in their parents’ bed. Of this group nearly two-thirds (334) were sleeping within a defined space in the parents’ bed such as a sleep pod or a Moses basket.
Figure 10: Sleeping location of the babies six weeks following their EDD
Percentage of babies* Includes other caregivers** Includes defined spaces such as a Moses basket, sleep protector, or sleep pod
Other
In parents' bed but notin a defined space
Defined space inparents' bed **
Infant cot/bassinet ina separate room
Infant cot/bassinet inparents'* room
66.8
23.6
5.4
3.1
1.1
It was hard to deal with the sleep deprivation when he was younger. The tiredness you have when the baby doesn't sleep - nothing prepares you for that.
N = 6184
39
SECTION 3
When the children were approximately six weeks of age, 79% (4560) of all babies where this information was available were sleeping on their backs. The remaining babies were mostly sleeping on their sides (1010, 17.6%), and 3% were reported to be sleeping on their stomachs.
Sleep position in early life is important because it has been associated with Sudden Unexplained Death in Infancy (SUDI; Mitchell et al., 1992) and the Ministry of Health and Child and Youth Mortality Review Committee (2008) recommend that babies sleep on their backs, particularly to avoid their faces being covered accidentally by sheets or bedding. The same guidelines recommend that women avoid smoking in pregnancy, that babies sleep in the same room as parents for the first six months, and that babies are breastfed. Caution is also advised for co-sleeping with babies (particularly if the mother has smoked during pregnancy). Growing Up in New Zealand will be able to collate detailed information, from before pregnancy, on these and other potential risk factors, as well as potential protective factors for SUDI and other important early life health outcomes. Collecting this detailed information longitudinally will allow an assessment of the importance of particular contextual and environmental influences alone, as well as together, to elucidate possible ways to mitigate poor health outcomes for New Zealand children.
Mothers were also asked about the pattern of their child’s sleep, in particular the longest time they slept for. Sleeping patterns described were highly variable; however, the median length of the longest sleep was five hours and 30 minutes, and the reported range of the longest sleep was from 30 minutes to over 13 hours.
3.2 Infant feeding in the first nine monthsThe MoH makes a range of recommendations regarding breastfeeding and nutrition for babies and toddlers (e.g. Ministry of Health, 2008). Growing Up in New Zealand will be able to establish how well these recommendations are followed, what enables or constrains this, and the impacts of different dietary patterns and behaviours.
3.2.1 Any breastfeedingMost Growing Up in New Zealand babies were breastfed from birth, however rates varied considerably by the time the children were nine months of age. Where information is available, 6234 (97%) of the Growing Up in New Zealand babies had ever been breastfed, with the remaining 3.2% (206) never breastfed. First children were more likely to have ever been breastfed compared to subsequent children (OR = 1.8, 95%CI: 1.3-2.5).
By nine months of age, 25 of the cohort babies were no longer living with their biological mothers, and 13 of these babies had been breastfed (for a duration ranging from two days breastfeeding to six months; median of two weeks).
Of those babies (with their biological mothers at nine months) who were ever breastfed, close to half (3013, 48%) were still being breastfed at nine months of age, with 73% (2186) of these babies being breastfed four or more times per day, and nearly one-third (949, 32%) of these babies being breastfed six or more times per day. At nine months, each breastfeeding session had a median duration of 10 minutes (mean of 14 minutes). The remaining 3221 (52%) babies were no longer being breastfed at nine months of age. For these babies, the median age of the baby when breastfeeding was stopped was four months of age (mean of 4.4 months).
I feel that there needs to be more support in hospitals to teach mothers how to breastfeed properly. More support from midwives and Plunket for breastfeeding.

40
GROWING UP IN NEW ZEALAND - NOW WE ARE BORN 2012
3.2.2 Antenatal intentions for breastfeedingGrowing Up in New Zealand asked all mothers in pregnancy, and their partners, whether they intended to breastfeed their babies after they were born, and what their ideal duration of breastfeeding would be. With the addition of information from the nine month interviews, this report is able to follow up whether (and why) these intentions for feeding (as well as for other aspects of child development) were fulfilled or not.
Overall, information is available for both the antenatal intentions and nine month breastfeeding outcomes for 5795 babies. The mothers of 5583 (96%) of these babies indicated in pregnancy that they intended to breastfeed their child, and reported that they had breastfed their child (Table 05). Of the babies whose mothers did not intend to breastfeed, 62% (66) were indeed not breastfed, and 38% (41) were breastfed. Of these 41 babies, 20% were still being breastfed at nine months. For mothers who were undecided about breastfeeding at the time of the antenatal interview, 76% were breastfeeding at nine months.
Table 05. Comparison of maternal intentions to breastfeed in the antenatal period with breastfeeding by nine months
Intentions to breast feed – Antenatal
n(%)
Any breast feeding by 9 months
n(%) Total
Yes No
Yes 5583 (95.8) 105 (1.8) 5688 (98.2)
No 41 (0.7) 66 (1.1) 107 (1.9)
Total 5624 (97.1) 171 (3.0) 5795 (100)
N = 5795 for complete information from antenatal and nine month interviewsAgreement (diagonal) = 97.5% (95%CI: 97.1-97.8)
Very small differences were seen in the breastfeeding patterns at nine months by maternal ethnicity (Table 06).
Table 06. Percentage of babies breastfed at nine months by mothers ethnicity
Ethnicity *
Yes, I am breastfeeding
(N=3012)
n(Row%)
Yes, I breastfed but have stopped now
(N=3221)
n(Row%)
No, I have never breastfed
(N=205)
n(Row%)
New Zealand European (N=4144)
1936 (46.7) 2092 (50.5) 116 (2.8)
Māori (N=1133) 459 (40.5) 623 (55.0) 51 (4.5)
Pacific Peoples (N=1019)
479 (47.0) 489 (48.0) 51 (5.0)
Asian (N=998) 505 (50.6) 470 (47.1) 23 (2.3)
MELAA (N=145)** 78 (53.8) 65 (44.8) 2 (1.4)
Other (N=41) 18 (43.9) 22 (53.7) 1 (2.4)
* Multiple response(s), therefore will total to more than 100%** MELAA - Middle Eastern, Latin American or African

41
SECTION 3
3.2.3 Exclusive breastfeedingFor the Growing Up in New Zealand cohort exclusive breastfeeding is defined as a baby receiving only breast milk without water, milk formula, other liquids or solid food. Information regarding the duration of exclusive breastfeeding was available for 6185 babies in the Growing Up in New Zealand cohort at nine months of age. The mothers of 23 babies (0.8% of the of the babies who were being breastfed at nine months) reported they were still exclusively breastfeeding their babies at this age. For the remaining 6162 babies who were no longer being exclusively breastfed at nine months of age, exclusive breastfeeding was stopped at a median age of four months (mean of 3.85 months). Over 90% of babies were no longer being exclusively breastfed by six months of age (Figure 11).
0
20
40
60
80
100
6+ months5th month4th month3rd month2nd monthFirst monthFirst weekFirst day
96.392.8
81.7
74.0
63.4
47.3
28.1
6.0
Perc
ent
(%)
Figure 11: Percentage of the babies being exclusively breastfed over time
Where babies were no longer being breastfed at nine months (3221, 52%), their mothers were asked the reasons for stopping breastfeeding (multiple responses were allowed). The most common reasons reported by these mothers were that they did not have enough milk (1246, 38%); that the baby did not seem satisfied by breast milk alone (1015, 32%); that baby had ‘weaned themselves’ (607, 19%); and/or because mothers had gone back to work and expressing breast milk was not convenient or possible while working (606, 19%).
Antenatally, where information was available, 68% of the mothers (4076) described their ideal duration for breastfeeding as greater than six months. When the babies were born, fewer mothers were able to breastfeed for this duration.
The enablers of and impediments to breastfeeding in the first six months and beyond will be able to be considered more fully when further longitudinal information is available.

42
GROWING UP IN NEW ZEALAND - NOW WE ARE BORN 2012
For the babies who were still being breastfed at all at nine months, exclusive breastfeeding was stopped at a median age of five months compared to three months for babies who were no longer being breastfed at all at nine months of age.
The World Health Organisation (2009) recommends exclusive breastfeeding for the first six months of life in both developed and developing countries (Kramer & Kakuma, 2002), and continued breastfeeding (along with supplementary food) to two years of age. In New Zealand the guidelines from the Ministry of Health (2008) recommend exclusive breastfeeding until babies are ready for and need extra food, which is suggested to be at around six months of age.
3.2.4 Formula feedingBy the age of nine months, 5040 (78%) of the Growing Up in New Zealand babies had been given infant milk formula or milk other than breast milk on at least one occasion. The median age of babies when infant formula was first introduced was three months old (mean of 3.5 months). Most of the Growing Up in New Zealand babies who had been given a milk substitute were given an infant formula. The most common of these were follow-on formula (3682, 73%) or cow’s milk formula (2987, 59%). A small percentage of babies in this cohort had tried pasteurised or bottled cow’s milk (271, 5.4%) or another kind of milk (2%). The Ministry of Health (2008) guidelines recommend that babies who are not being breastfed should be fed an infant formula until they are at least 12 months old, and that cow’s milk should not be fed to babies less than one year of age as it may increase the risk of depleted iron stores (American Academy of Pediatrics, 1992, cited in Ministry of Health, 2008).
3.2.5 Food and beverage consumptionBy nine months of age, the Growing Up in New Zealand babies had consumed a wide range of food. The first solid food most frequently introduced was baby rice, followed soon after by fruit and vegetables. Meat, bread or toast, milk puddings, rice pudding, yoghurt or custard, and baby breakfast cereals tended to be introduced slightly later, but most children continued to eat these regularly at the age of nine months. By contrast over half no longer regularly consumed baby rice. At nine months, the foods that babies were most likely to be eating on a daily basis were vegetables, fruit, meat and bread or toast. Across the cohort (6470), 53% (3399) of the babies had eaten at least one of sweets, chocolate, hot chips or potato chips, and 9.4% (611) of babies had eaten all of these foods, although very few consumed them daily (Table 07). The foods least likely to have been tried by babies by nine months of age were shellfish (336, 5.2%) and soy-based foods (562, 8.7%). Peanuts and peanut butter had been tried by nearly one-quarter of all the babies (1502, 23%).
Over one-third of all infants had tried fruit juice, but few babies had consumed other drinks such as soft drinks (352, 5.4%), herbal drinks (2.2%), tea (3.1%), or coffee (0.6%).
She has been picky about food since she was born so feeding is a real concern for me.
I am really looking forward to him sitting up and eating little sandwiches and not having to puree all his foods.

43
SECTION 3
Table 07. Introduction and current intake of solid foods
Food and beverage consumption
Before 9 months At 9 months
N=6470
n(%)*
Age (months)first consumed
Daily
(Ro
w%
)
Weekly
(Ro
w%
)
Less
th
an
w
eekly
(R
ow
%)
No
lo
ng
er
fed
(Ro
w%
)
Median Mean
Baby rice 5443 (84.1) 5 5 21.1 16.6 6.8 55.5
Baby breakfast cereal 5099 (78.8) 6 6 47.9 24.5 4.9 22.7
Other cereal 3179 (49.1) 7 7 48.3 34 9.9 7.8
Bread or toast 5274 (81.5) 7 7 52.8 38.2 7.2 1.8
Rusks 4697 (72.6) 6 6 15.2 32.2 16.8 35.8
Biscuits 4122 (63.7) 7 7 31.6 45.7 19.8 2.9
Vegetables (raw or cooked) 6252 (96.6) 6 6 90.8 8.6 0.3 0.3
Fruit (includes fresh and canned)
6332 (97.9) 6 5 86.8 12 0.9 0.3
Meat, chicken, meat dishes 5801 (89.7) 7 7 58.9 37.8 2.4 0.9
Fish, fish dishes (includes fresh and canned)
3546 (54.8) 7 7 5.8 60.3 30.4 3.5
Eggs 3596 (55.6) 7 7 6.8 53.2 31.2 8.8
Milk puddings, rice pudding, yoghurt, custards
5402 (83.5) 7 7 36.5 49.7 10.1 3.6
Nuts or peanut butter 1502 (23.2) 8 8 9.5 51.9 30.1 8.5
Shellfish 336 (5.2) 8 7 1.9 19 63.2 15.9
Soy foods, tofu, soy desserts 562 (8.7) 7 7 9.6 42.4 32.8 15.2
Sweets 1382 (21.4) 7 7 5.1 31.9 53.1 9.9
Chocolate 1932 (29.9) 7 7 1.7 21.4 63.9 13
Hot chips 2618 (40.5) 8 7 1.2 33.3 59.8 5.6
Potato chips (crisps) 1267 (19.6) 8 8 3.3 32.9 54.5 9.2
Fruit juices (includes watered down juice)
2343 (36.2) 7 7 25.5 36.8 27.6 10.1
* Multiple response(s), therefore will total to more than 100%

44
GROWING UP IN NEW ZEALAND - NOW WE ARE BORN 2012
There are multiple guidelines and information sources for families regarding maternal nutrition in pregnancy, children’s transition to solid food and nutrition in the first year of life. Most Growing Up in New Zealand families with nine month old babies received information about infant diet and nutrition from Plunket (5912, 93%) or family or friends (4898, 77%) and books and the internet were the next most likely sources of this information. Nearly one-quarter of the babies’ mothers (1524, 24%) also received information on infant feeding from their GP (Figure 12).
Figure 12: Sources of information on infant feeding
* Includes Plunket helpline and Plunket nursePercentage of mothers who reported this informationMultiple response(s), therefore will total to more than 100%
Pharmacist
Māori/PacificHealth Provider
Other
Self knowledge
Public Health
Midwife
General Practitioner
Magazines
Internet
Books
Family or Friends
Plunket* 93.0
76.9
43.9
39.8
33.8
23.9
14.0
6.6
5.9
4.6
2.6
3.0
N = 6370
3.2.6 Ongoing collection and analyses of nutritional information
Growing Up in New Zealand will continue to collect information on breastfeeding, infant feeding, introduction of new foods and nutritional behaviours for the duration of the childhood period. Over time, the information collected will allow a fuller consideration of, for example, the effect that breastfeeding has on many childhood outcomes across the spectrum of physical, social and cognitive development. The degree of evidence for these associations varies greatly internationally across these outcomes. Further research is needed to determine the strength (or existence) of these associations, particularly within the New Zealand context. Other contextual (or confounding) factors may also be important in explaining the associations between breastfeeding and development over time. Growing Up in New Zealand will be able to track growth, cognitive, sensory and behavioural developmental trajectories throughout the preschool period and beyond, including outcomes such as rates of infectious diseases like diarrhoea and pneumonia in childhood and mother-child interaction patterns, alongside the evolution of nutritional intake and dietary behaviours in the first years of life. The rates of different feeding patterns presented in this report are currently interim outcomes. By the time the children in this cohort are two years of age, the majority will have completed breastfeeding and we will be able to report on breastfeeding patterns for almost the entire cohort. These patterns will be able to be analysed as outcome

45
SECTION 3
variables to ascertain what has enabled or impeded the breastfeeding to continue, as well as explanatory variables for early life health and developmental outcomes. These patterns will continue to be important in understanding child development in the preschool period and beyond in association with the influence of access to quality early child care, parental return to work and changing household socio-economic circumstances.
In addition to information on breastfeeding and detailed data on nutrition in pregnancy, Growing Up in New Zealand will continue to collect nutritional data throughout childhood. Assessment of this longitudinal nutritional information will provide insight into the relationships between key variables, for example parental atopy, changes in dietary intake in pregnancy, and other key environmental or behavioural characteristics, with infant and child nutrition as well as general health and developmental outcomes over time.
3.3 Postnatal care and interaction with primary health services
The provision of readily accessible and effective health and support services is critical in the postnatal period for families when they are caring for their infants.
3.3.1 Postnatal careLMCs continued to engage with nearly all families (over 99%) in the first six weeks after the Growing Up in New Zealand babies were born, at least once. In addition almost three-quarters (4604, 74%) of families were in contact with Plunket, 41% (2525) had taken their babies to a GP and 5.3% (326) had been to a specialist medical professional in that time period.
Figure 13: Postnatal health care providers in the first six weeks
Excludes LMCsPercentage of mothers who reported this informationMultiple response(s), therefore will total to more than 100%*Includes osteopath, chiropractor or cranial osteopath**Includes lactation consultant, community or hospital nurse
74.3
40.8
5.3
1.6
0.8
0 10 20 30 40 50 60 70 80
Other**
Alternative practitioner*
Māori /Pacific health provider
Specialist
General Practitioner
Plunket
2.3N = 6196
I wish there were a centralised body that assisted parents - there's Plunket and midwives and doctors, but it would be good if they were working together well and if there was a check-up system on them.

46
GROWING UP IN NEW ZEALAND - NOW WE ARE BORN 2012
3.3.2 Well Child/Tamariki OraThe Well Child/Tamariki Ora service is provided free to all New Zealand children. It includes regular health checks provided by registered nurses (including Plunket nurses) and community health workers/kaiawhina with specific training in child health. Eight of these health checks are offered between four weeks and four years of age. These services cover health education and promotion, health protection and clinical assessment, family/whānau support, and linking of families to other services if required, such as early childhood education and social services. Overall, a majority of Growing Up in New Zealand babies had been able to access the Well Child/Tamariki Ora health checks, with mothers of over 91% of the cohort reporting that their child had had their checks at birth, two weeks, six weeks, three months and five months of age (Table 08).
The Well Child/Tamariki Ora checks at birth and two weeks were most likely to have been completed by a midwife for the Growing Up in New Zealand cohort. At six weeks of age most babies are expected to transition from midwife care to community and GP care, and therefore the six week Well Child/Tamariki Ora checks for this cohort were more likely to have been completed by a Plunket/Well Child nurse (3255, 51%) than a midwife (2476, 39%), and 27% (1708) of the visits at this age (which also coincides with the first immunisation on the national schedule) were completed at a GP practice.
A very small number of infants (0.2%) in the cohort had not received any of their Well Child/Tamariki Ora checks by nine months of age.
Table 08. Providers of Well Child/Tamariki Ora checks in the first nine months
Birth
(N=6286)
n(%)*
2 weeks
(N=6259)
n(%)*
6 weeks
(N=6347)
n(%)*
3 months
(N=6237)
n(%)*
5 months
(N=6134)
n(%)*
Midwife 5389 (85.7) 5583 (89.2) 2476 (39.0) 114 (1.8) 61 (1.0)
Plunket/Well Child Nurse
113 (1.8) 406 (6.5) 3255 (51.3) 5343 (85.7) 5283 (86.1)
Public Health Nurse
85 (1.4) 60 (1.0) 92 (1.4) 138 (2.2) 146 (2.4)
Māori Health Provider
9 (0.1) 20 (0.3) 44 (0.7) 72 (1.2) 73 (1.2)
Pacific Health Provider
5 (0.1) 8 (0.1) 36 (0.6) 40 (0.6) 45 (0.7)
GP/GP Practice 145 (2.3) 160 (2.6) 1708 (26.9) 1219 (19.5) 1137 (18.5)
Paediatrician/ Specialist
1089 (17.3) 235 (3.8) 223 (3.5) 67 (1.1) 61 (1.0)
Other 18 (0.3) 12 (0.2) 8 (0.1) 7 (0.1) 9 (0.1)
* Multiple response(s), therefore will total to more than 100%

47
SECTION 3
3.3.3 Primary health care providerWith respect to regular primary health care for the Growing Up in New Zealand babies, two-thirds (4324, 67%) of the cohort were most likely to be taken to a single known doctor within a primary care practice when requiring health care, and a further 27% (1747) visited the same practice where they might see one of several doctors (Figure 14). At nine months of age, a small number (85, 1.3%) of these babies were likely to be taken to an after hours service or a hospital emergency department as the first option when requiring health care.
Figure 14: Primary health care arrangement for the babies at nine months
Percentage of mothers who reported this information
Other
I take my baby (babies)to a hospital emergency
department
I usually use the after hoursdoctors or services
I have not had to take mybaby (babies) to a doctor
I see one of several doctorsin different practices
I see one of several doctorsin the same practice
I have a single doctor whoI see for most of my baby's
(babies') doctor visits66.8
27.0
2.4
1.8
0.8
0.5
0.6
N = 6469
Of the infants who were usually seen by a GP, and where information was available, the parents of the majority of these babies (5559, 89%) reported being either completely, very, or fairly satisfied by their usual GP practice; a small proportion (423, 6.7%) reported being dissatisfied; and 4.4% reported being neither satisfied nor dissatisfied.
Most families (4804, 74%) took their Growing Up in New Zealand child to a local GP practice (defined as within a 10-minute drive from their home). The families of 23% (1465) of the babies used a GP or health care provider that was non-local. At each point of contact with the families, information is sought regarding accessibility, use of and confidence in local services, including primary health care. This allows information to be collected about why local or non-local services (including social services) are being used and will add value to routine data available from service utilisation or neighbourhood surveys.
As well as continuity of primary care and local access, the families of the nine month babies who had changed their GP were also asked how easy it had been for them to find a GP for their child. For those mothers of the Growing Up in New Zealand cohort who reported they had changed GP (1372), most (1076) reported no difficulties in finding a GP. Where difficulties were reported (for 296, or 22% of those who had changed GP) these included (mothers could choose more than one option): difficulties
48
GROWING UP IN NEW ZEALAND - NOW WE ARE BORN 2012
in finding a GP with whom they were happy (for 183 mothers or 13% of all those who had changed GP); their GP practice of choice was not taking new patients (3.5%); not knowing about local services because the family was in a new area (77, 5.6%); or not being able to find a GP who spoke their own language (0.2%).
Provision of primary care is typically free for infants in New Zealand, however the mothers of 3.5% of the babies in the Growing Up in New Zealand cohort reported difficulties paying for medical care. The mothers of 3.3% of the Growing Up in New Zealand babies reported not being able to afford to collect medicines that had been prescribed by a GP for their Growing Up in New Zealand child.
Growing Up in New Zealand will be able to track the continuity of health care service provision over time for this cohort, allowing the identification of those factors that facilitate optimal access to and engagement with health care for the children. The impact that patterns of use and access have on health and other developmental outcomes in the short and long term will be a key outcome for this information over time. This evidence will help to inform policies and practices to optimise service provision for all children in New Zealand including facilitating ways to ensure the integration of health and social services through initiatives such as Whānau Ora.
3.3.4 Alternative practitionersInformation on the use of alternative health practitioners was available for 6467 babies. Of these, approximately one in five of the babies (1319, 20%) had been seen by a complementary or alternative practitioner or traditional healer in the first nine months of their lives. The most frequently seen alternative providers used were osteopaths (732), chiropractors (246), naturopaths (189) and homeopaths (150).
3.4 ImmunisationGrowing Up in New Zealand is well placed to provide comprehensive data regarding immunisation for contemporary New Zealand children. The data presented in this report includes information up to nine months of age, and therefore includes details regarding those children who received the immunisations on the National Immunisation Schedule at six weeks, three months and five months. Comprehensive information on the babies who did not receive immunisation is also available, including antenatal intentions to immunise (or not).
The immunisation rates up to the age of two years for the Growing Up in New Zealand cohort are currently being collected from parents and further linkage will allow a more complete assessment of why a child did or did not receive all their immunisations, and if so whether these were delivered at the time intended in the immunisation schedule in order to optimise health outcomes.
Further details regarding immunisation access, coverage, and impact will be provided over time from the Growing Up in New Zealand cohort.
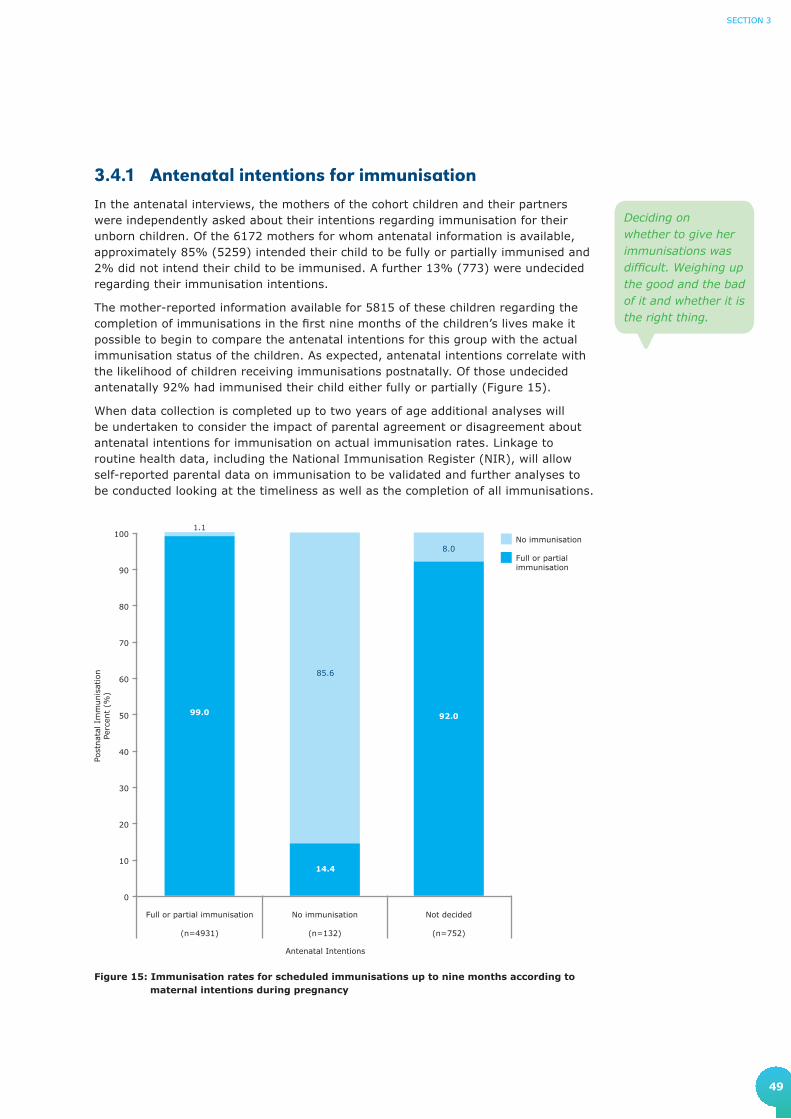
49
SECTION 3
3.4.1 Antenatal intentions for immunisationIn the antenatal interviews, the mothers of the cohort children and their partners were independently asked about their intentions regarding immunisation for their unborn children. Of the 6172 mothers for whom antenatal information is available, approximately 85% (5259) intended their child to be fully or partially immunised and 2% did not intend their child to be immunised. A further 13% (773) were undecided regarding their immunisation intentions.
The mother-reported information available for 5815 of these children regarding the completion of immunisations in the first nine months of the children’s lives make it possible to begin to compare the antenatal intentions for this group with the actual immunisation status of the children. As expected, antenatal intentions correlate with the likelihood of children receiving immunisations postnatally. Of those undecided antenatally 92% had immunised their child either fully or partially (Figure 15).
When data collection is completed up to two years of age additional analyses will be undertaken to consider the impact of parental agreement or disagreement about antenatal intentions for immunisation on actual immunisation rates. Linkage to routine health data, including the National Immunisation Register (NIR), will allow self-reported parental data on immunisation to be validated and further analyses to be conducted looking at the timeliness as well as the completion of all immunisations.
0
10
20
30
40
50
60
70
80
90
100No immunisation
Full or partialimmunisation
Not decided
(n=752)
No immunisation
(n=132)
Full or partial immunisation
(n=4931)
1.1
85.6
8.0
Post
nat
al I
mm
unis
atio
nPe
rcen
t (%
)
Antenatal Intentions
99.0
14.4
92.0
Figure 15: Immunisation rates for scheduled immunisations up to nine months according to maternal intentions during pregnancy
Deciding on whether to give her immunisations was difficult. Weighing up the good and the bad of it and whether it is the right thing.
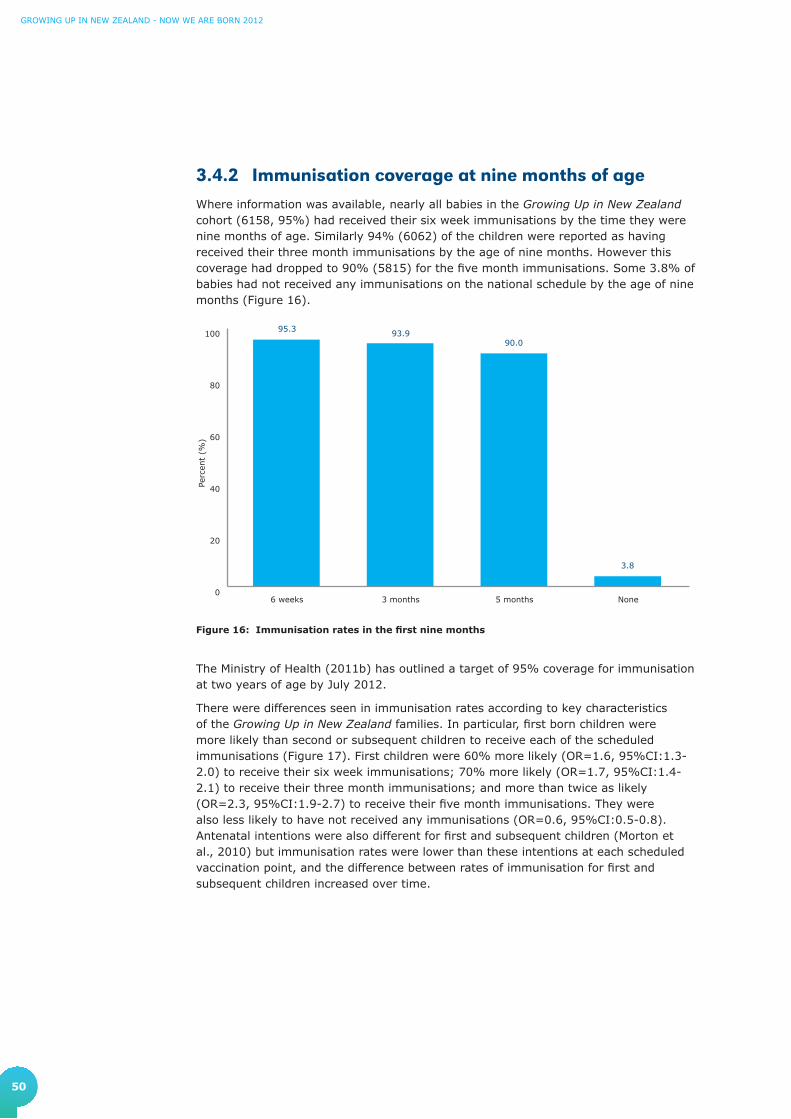
50
GROWING UP IN NEW ZEALAND - NOW WE ARE BORN 2012
3.4.2 Immunisation coverage at nine months of ageWhere information was available, nearly all babies in the Growing Up in New Zealand cohort (6158, 95%) had received their six week immunisations by the time they were nine months of age. Similarly 94% (6062) of the children were reported as having received their three month immunisations by the age of nine months. However this coverage had dropped to 90% (5815) for the five month immunisations. Some 3.8% of babies had not received any immunisations on the national schedule by the age of nine months (Figure 16).
0
20
40
60
80
100
None5 months3 months6 weeks
Perc
ent
(%)
95.3 93.990.0
3.8
Figure 16: Immunisation rates in the first nine months
The Ministry of Health (2011b) has outlined a target of 95% coverage for immunisation at two years of age by July 2012.
There were differences seen in immunisation rates according to key characteristics of the Growing Up in New Zealand families. In particular, first born children were more likely than second or subsequent children to receive each of the scheduled immunisations (Figure 17). First children were 60% more likely (OR=1.6, 95%CI:1.3-2.0) to receive their six week immunisations; 70% more likely (OR=1.7, 95%CI:1.4-2.1) to receive their three month immunisations; and more than twice as likely (OR=2.3, 95%CI:1.9-2.7) to receive their five month immunisations. They were also less likely to have not received any immunisations (OR=0.6, 95%CI:0.5-0.8). Antenatal intentions were also different for first and subsequent children (Morton et al., 2010) but immunisation rates were lower than these intentions at each scheduled vaccination point, and the difference between rates of immunisation for first and subsequent children increased over time.
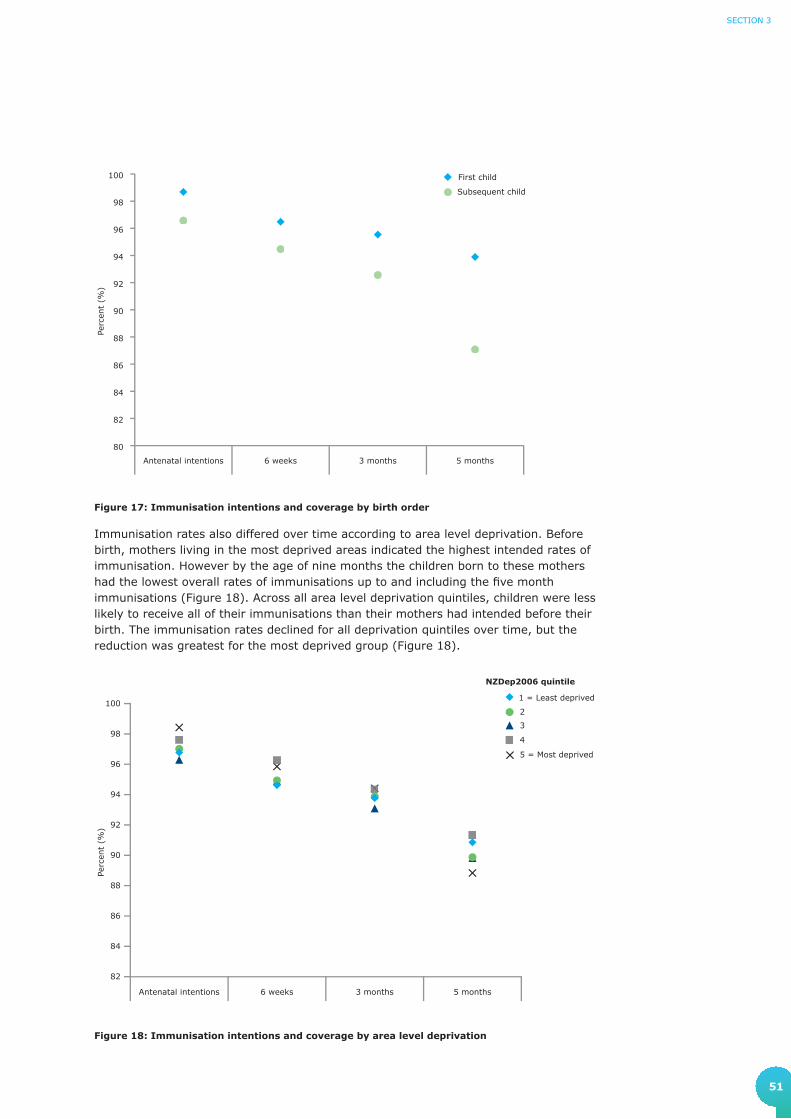
51
SECTION 3
Figure 17: Immunisation intentions and coverage by birth order
Immunisation rates also differed over time according to area level deprivation. Before birth, mothers living in the most deprived areas indicated the highest intended rates of immunisation. However by the age of nine months the children born to these mothers had the lowest overall rates of immunisations up to and including the fi ve month immunisations (Figure 18). Across all area level deprivation quintiles, children were less likely to receive all of their immunisations than their mothers had intended before their birth. The immunisation rates declined for all deprivation quintiles over time, but the reduction was greatest for the most deprived group (Figure 18).
Figure 18: Immunisation intentions and coverage by area level deprivation
80
82
84
86
88
90
92
94
96
98
100
Subsequent child
First child
5 months3 months6 weeksAntenatal intentions
Perc
ent
(%)
82
84
86
88
90
92
94
96
98
100
5 = Most deprived
4
3
2
1 = Least deprived
5 months3 months6 weeksAntenatal intentions
Perc
ent
(%)
NZDep2006 quintile

52
GrowinG Up in new Zealand - now we are born 2012
Immunisation rates over the first nine months also differed according to maternal ethnicity. Babies whose mothers identified as Asian had the highest rates of immunisation overall, with over 95% coverage at each scheduled immunisation point. The lowest immunisation rates at all scheduled times were seen for babies whose mothers identified either as New Zealand European or Māori (Figure 19). Postnatal immunisation rates were lower for all ethnic groups than their intensions for immunisation before the children were born.
Figure 19: Immunisation intentions and coverage by maternal ethnicity
*MELAA - Middle Eastern, Latin American or African
The immunisation coverage for this cohort shows a similar pattern to that reported by the Ministry of Health (2011a), with highest rates of immunisation for Asian babies, and lowest rates for Māori babies.
If Growing Up in New Zealand immunisation rates continue to track as they have in the first nine months of life this suggests that Māori babies are most at risk of not meeting the MoH 95% coverage target at two years of age. The longitudinal data collection together with the linkage to the NIR and National Minimum Data Set (NMDS) means that the information provided in the next two years from this cohort should provide a more complete picture of why we see these differential immunisation rates by ethnicity and area level deprivation and will provide some insights into how the inequalities in coverage we currently see in New Zealand might be reduced.
The coverage rates reported here do not include important information on the timeliness of immunisation. There is an association between both completeness and appropriate timing of immunisation and the likelihood of childhood vaccine-preventable diseases. Planned linkage to the NIR and routine hospital records in the first 12 months of life for the Growing Up in New Zealand cohort will provide more detailed information about both the timing of immunisation and rates of serious vaccine-preventable illnesses for this cohort.
75
80
85
90
95
100
Other
MELAA*
Asian
Pacific Peoples
Māori
New ZealandEuropean
5 months3 months6 weeksAntenatal intentions
Perc
ent
(%)

53
SECTION 3
3.5 Child health at nine monthsChild health status in the first year of life will be assessed in several ways in the Growing Up in New Zealand cohort. Parental report about health and development generally, as well as specific health and developmental problems, were collected at the six week CATI and in detail at the nine month parental face-to-face interviews. This information will be supplemented, and where necessary validated, in the near future with information from linkage to routine health data collected by the MoH. The information at this stage is based on parental report of the children’s health status in their first nine months of life.
3.5.1 Child health statusIn general the mothers of the majority of babies (5674, 88%) described their babies' health status as either excellent or very good when the cohort were nine months of age. Some 12% (763) of babies were reported to be in good or fair health with very few babies (0.5%) reported to be in overall poor health (Figure 20).
Figure 20: Health status of the children as reported by mothers at nine months
0
20
40
60
80
100
Excellent Very goodFair/GoodPoor
Perc
ent
(%)
0.5
11.8
27.9
59.8
There was worry because he was born premature so it’s great seeing him now very healthy and having pretty much overcome all his early problems.

54
GROWING UP IN NEW ZEALAND - NOW WE ARE BORN 2012
The reported health status of the child is likely to have been infl uenced by the mother’s own health and her assessment of her current health status. The reverse may also be true, in that if a child’s health is of concern this may affect the mothers' perception of her own health. Mothers reported their own overall health status as well as rating their child’s health when their children were nine months old. Nearly two out of every three mothers (4102, 63%) reported their own health as either very good or excellent, and just greater than one in three (2251, 35%) mothers reported fair or good health. Very few mothers reported being in poor health (1.8%) when their children were nine months of age.
Maternal report of child health status is patterned by the mother’s perception of her own current health status (Figure 21). Mothers who reported their own health status as excellent were most likely to also report excellent health for their child. These factors are able to be explored further within this cohort. Linkage to routine health data, in association with self-reported and contextual variables, will provide understanding of perceived and actual health status (across generations) over time.
Figure 21: Child health status by mothers self-reported health status
Perc
ent
(%)
0
10
20
30
40
50
60
70
80
90
100Excellent
Very Good
Fair/Good
Poor
Excellent
(N=1464)
Very Good
(N=2638)
Fair/Good
(N=2251)
Poor
(N=113)
Mother Health Status
Child Health Status
24.8
30.1
44.3
18.0
34.1
47.4
10.1
29.5
60.1
4.4
15.4
79.6
0.9 0.5 0.4 0.6

55
SECTION 3
The rating of a child’s health status at nine months may well also be influenced by whether the child has any identified health and development issues (as reported by their parents), either from birth (congenital) or those that may have developed postnatally. Where information was available, specific doctor diagnosed health or developmental problems were reported for 9.4% (610) of the babies in the cohort. These will be followed up in further detail once routine linkage to health records is completed for the first year of life.
The babies reported to have an existing health or developmental problem were more likely to be reported as having poor or fair health by their mother than good, very good, or excellent health. As Growing Up in New Zealand tracks ongoing and future measures of child health, associations between a child’s health and events occurring during early life or the antenatal period will also be explored.
Figure 22: Child health status according to reported health or developmental problem
Perc
ent
(%)
0
10
20
30
40
50
60
70
80
90
100 No health ordevelopmentproblem
Health ordevelopmentproblem
Excellent
(n=3867)
Very Good
(n=1803)
Fair/Good
(n=762)
Poor
(n=32)
62.5
75.8
88.0
94.9
37.5
24.2
12.05.1
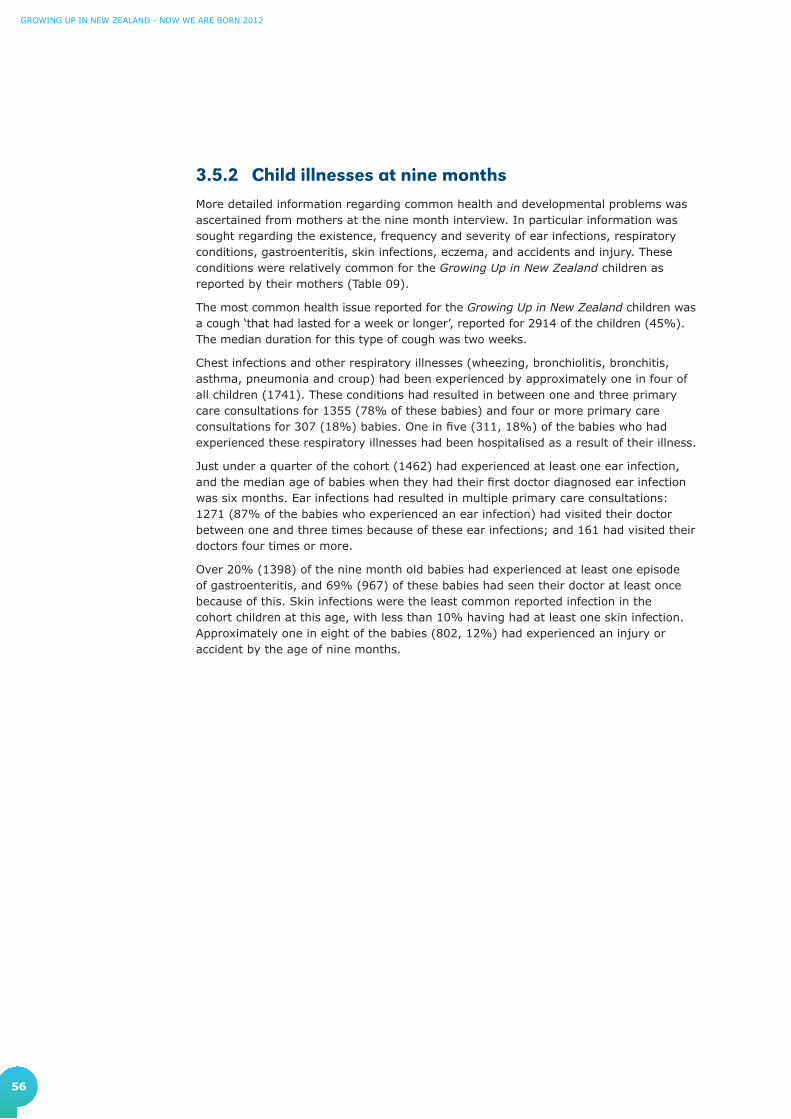
56
GROWING UP IN NEW ZEALAND - NOW WE ARE BORN 2012
3.5.2 Child illnesses at nine monthsMore detailed information regarding common health and developmental problems was ascertained from mothers at the nine month interview. In particular information was sought regarding the existence, frequency and severity of ear infections, respiratory conditions, gastroenteritis, skin infections, eczema, and accidents and injury. These conditions were relatively common for the Growing Up in New Zealand children as reported by their mothers (Table 09).
The most common health issue reported for the Growing Up in New Zealand children was a cough ‘that had lasted for a week or longer’, reported for 2914 of the children (45%). The median duration for this type of cough was two weeks.
Chest infections and other respiratory illnesses (wheezing, bronchiolitis, bronchitis, asthma, pneumonia and croup) had been experienced by approximately one in four of all children (1741). These conditions had resulted in between one and three primary care consultations for 1355 (78% of these babies) and four or more primary care consultations for 307 (18%) babies. One in five (311, 18%) of the babies who had experienced these respiratory illnesses had been hospitalised as a result of their illness.
Just under a quarter of the cohort (1462) had experienced at least one ear infection, and the median age of babies when they had their first doctor diagnosed ear infection was six months. Ear infections had resulted in multiple primary care consultations: 1271 (87% of the babies who experienced an ear infection) had visited their doctor between one and three times because of these ear infections; and 161 had visited their doctors four times or more.
Over 20% (1398) of the nine month old babies had experienced at least one episode of gastroenteritis, and 69% (967) of these babies had seen their doctor at least once because of this. Skin infections were the least common reported infection in the cohort children at this age, with less than 10% having had at least one skin infection. Approximately one in eight of the babies (802, 12%) had experienced an injury or accident by the age of nine months.

57
SECTION 3
Table 09: Frequency of specific infant health issues
Number of events
Cough *(N=6463)
n(Column%)
Chest infection**(N=6465)
n(Column%)
Ear infection(N=6466)
n(Column%)
Gastro- enteritis(N=6464)
n(Column%)
Skin infection(N=6466)
n(Column%)
Injury or accident(N=6468)
n(Column%)
Never 3549 (54.9) 4724 (73.1) 5004 (77.4) 5066 (78.4) 5932 (91.7) 5666 (87.6)
1-3 Times 2644 (40.9) 1550 (24) 1330 (20.6) 1287 (19.9) 501 (7.7) 743 (11.5)
4-6 Times 214 (3.3) 136 (2.1) 107 (1.7) 85 (1.3) 16 (0.2) 37 (0.6)
7-9 Times 30 (0.5) 26 (0.4) 19 (0.3) 11 (0.2) 7 (0.1) 5 (0.1)
10+ Times 26 (0.4) 29 (0.4) 6 (0.1) 15 (0.2) 10 (0.2) 17 (0.3)
* Cough lasting for a week or more** Includes wheezing, bronchiolitis, bronchitis, asthma, pneumonia, or croup
In addition to these illnesses one in three (2149, 33%) of all babies in the cohort had experienced eczema or dermatitis before the age of nine months, with a median age of first onset of eczema at three months (mean of 3.5 months). Of those babies who had developed eczema or dermatitis, 78% (1677) had visited the doctor regarding their eczema or dermatitis at least once. Approximately 12% (262) of babies with eczema or dermatitis had seen a doctor four or more times. A small group (1%) of these babies had also required hospital treatment as a result of their eczema or dermatitis.
Other than primary health care consultations and hospitalisation, mothers were also asked about the use of common pain-relieving medications and antibiotics during their babies’ first nine months. Almost all babies (6164, 95%) had been given paracetamol (e.g. Pamol, Pamol infant drops, Panadol, Junior Parapaed or Paracare) by the age of nine months, with approximately half of babies (3343, 52%) having received this medication between one and 10 times, and 589 (9.1%) babies having received more than 30 doses of paracetamol. By comparison, fewer babies (1094, 17%) had ever been given ibuprofen-containing medications (e.g. Brufen, Nurofen or Fenpaed).
Just under half of all babies (2992, 46%) had ever been prescribed a course of antibiotics and 8.7% (560) of babies had been prescribed more than two courses of antibiotics in their first nine months of life.

58
GROWING UP IN NEW ZEALAND - NOW WE ARE BORN 2012
3.6 Developmental status Overall, the babies of the Growing Up in New Zealand cohort are achieving developmental milestones as expected by the time they are nine months old.
For example, over half of the babies (3480, 55%) would often look at a toy across the room when it was pointed at by their mothers, and 28% (1809) had begun to point at interesting objects or events themselves.
Nearly all (6365, 98%) of the nine month old babies would shake or bang a rattle or other toy when it was given to them and about half (3458, 54%) would ask for something by extending their arm and opening and closing their hand. Nearly half of the babies (2958, 47%) would extend their arm to show something that they were holding, and around one-third of the Growing Up in New Zealand babies at nine months of age would often give a toy or another object that they were holding to their mother (2130, 33%).
At nine months, the majority (5969, 92%) of the Growing Up in New Zealand babies would often sit without support for 30 seconds or more. The babies were also commonly on the move by the time they were nine months old, with just over half of the babies (3411, 53%) often crawling for at least five metres. Half of all the babies at this age (3230, 50%) were using furniture or other objects to pull themselves up to stand, but most of them (5568, 86%) could not yet stand up from a sitting position without help. Just over a quarter of the Growing Up in New Zealand babies were walking confidently by the age of nine months, with 28% (1826) described as often walking across the room without help.
Almost all (6371, 98%) of the Growing Up in New Zealand babies would smile or laugh while looking at their mothers and 84% of the babies (5432) had begun to signal that they wished to be picked up by extending their arms upwards, with 60% of the babies (3894) doing this frequently at nine months of age.
It has been incredible seeing her personality develop, seeing her sit up and explore, watching her take pleasure in her first foods, playing games with us.
He is my child, and he makes me happy and proud with his new developments all the time.
We really enjoy all the little things that he is learning, like clapping. He is nearly walking and that is really exciting.

59
SECTION 3
I did laugh when she started to poke her tongue out.
3.7 Ongoing collection and analyses relating to child health and development
The health of New Zealand children ranks poorly in terms of morbidity and mortality statistics compared to other countries with similar levels of social and economic development (OECD, 2009; UNICEF, 2007, 2010). New Zealand children are also hospitalised more frequently in the preschool period for respiratory and skin infections than children growing up in similar environments in Australia, the United States and the United Kingdom (Baker et al., 2010; Grant et al., 1998). In addition overall summary routine health statistics hide wide inequalities in child health for groups within the New Zealand population, with especially poor comparative health statistics reported for our Māori and Pacific children. The underlying reasons why we see these differences in health status, both internationally and within New Zealand, remain very poorly understood and attempts to improve overall child health status or to reduce inequalities have often been ineffective.
It is increasingly clear that health status at any one point in time is shaped by multiple influences, biological, familial, social and environmental, acting together over time. The longitudinal information being collected for this cohort will offer a unique opportunity to investigate the underlying reasons why we see the high rates of poor health for our children, as well as how resilience and good health outcomes are shaped. By tracking health and development status over time, in the context of the children’s environments, this study will provide evidence relating to associations between health and development status at different ages with multiple measures of parental behaviour, nutrition (including breastfeeding), diagnosed conditions later in life, household environments, warmth and heating, and health service utilisation. This will provide valuable evidence to inform strategies likely to change New Zealand’s child health ranking internationally and, importantly, reduce inequalities within the population. As routine linkage to health data is undertaken and health and development status is updated at the two and four year data collection points, detailed longitudinal modelling of the lifecourse influences that have led to specific health outcomes will be possible. This modelling will be augmented by the information about the actual impact of health and developmental issues at the family level as well as parental behaviours and the environmental context that will provide valuable information to inform strategies that are population-relevant for 21st century New Zealand.
Just over 80% of the babies (5334) could string together sounds (such as uh oh, mama, gaga, bye bye, dada) with about one-third of the babies (2161, 34%) beginning to shake their head to mean ‘no’ and 731 (11%) beginning to nod their head to mean ‘yes’ by the age of nine months. Just over one-third (2335, 36%) of babies would often smack their lips in a ‘yum yum’ gesture to indicate that something tasted good and 16% (1005) of the babies had begun to shrug to indicate ‘all gone’ or ‘where’d it go?’. There were 548 babies (8.4%) who had begun to blow kisses from a distance.
At nine months the Growing Up in New Zealand babies had an average of three teeth, and their first tooth had appeared at an average age of six months. Half of babies (3215, 50%) were now having their teeth cleaned and nearly all babies (5974, 92%) had a bath or shower either once or more every day, or once every other day.
Over time, information will be gathered about children’s achievement of age-specific developmental milestones. As more longitudinal data is collected we will be able to examine the determinants of these achievements as well as the impact and timing of achieving milestones on the future wellbeing and developmental status of the children.
I love just watching this beautiful baby girl grow and develop into a little person. Seeing all the different developmental milestones. Helping her develop and learn.

60
GROWING UP IN NEW ZEALAND - NOW WE ARE BORN 2012

61
4. Growing Up in New Zealand childrens family and home environment

62
GrowinG Up in new Zealand - now we are born 2012
4. Growing Up in New Zealand childrens family and home environment
This section describes the family contexts and the home environments that the Growing Up in New Zealand children are exposed to on a day-to-day basis. These environments are critically important for shaping children’s developmental trajectories (Harold, 2011; Mackay, 2005), especially in the first months of life when every child is vulnerable and is dependent on at least one parent (or equivalent carer) for their everyday nurturing and care. The antenatal report (Morton et al., 2010) provided information about the diverse families and environments into which the new generation of New Zealand children were being born. The information in this section describes similar features of those environments during the child’s first nine months of life and, where appropriate, documents changes that have occurred. Over the duration of the longitudinal study these environments will continue to be measured to consider how changes in family structure and dynamics of the physical and social environment interact with changes in the development and wellbeing of the children. Much of the information in this section is descriptive at this stage, but increasingly changes in environments and child status will be able to be modelled to understand better how multiple factors interact over time to shape developmental outcomes across the life course. An example of the modelling approach is provided here for maternal wellbeing during pregnancy and during the first year of the child’s life. This model was chosen because of the importance of maternal wellbeing for early child development.
4.1 Relationship status of Growing Up in New Zealand childrens parents in first nine months
As illustrated in the conceptual framework that informs Growing Up in New Zealand (Figure 01), children grow up in dynamic interaction with the people and environments around them, and their earliest interactions, in general, are with their mothers and fathers. Therefore the nature of the relationship between the child’s parents is extremely important in terms of the earliest environment that is provided for them immediately after birth and throughout their early years.
When we saw the parents of the Growing Up in New Zealand children in pregnancy, 3855 (63%) of mothers reported that they were married, or in a civil union; 1979 (32%) were living with their partner or dating and 333 (5.4%) of mothers were not in a relationship.
I guess it’s been really good realising that you can do it and she is turning out okay. And the bond in my and my partner's relationship has grown that much stronger.

63
SECTION 4
Parents were asked independently about their relationship status when the Growing Up in New Zealand children were nine months old, and most described their relationship in the same way. The parental relationship status had changed for around 4.9% (282) of the cohort children (Table 10). Of the 5745 mothers of the Growing Up in New Zealand babies who provided information about their relationship status at both the antenatal and nine month interviews, approximately 4% (225) reported having a partner at the antenatal interview but were no longer in a relationship by the time their children were nine months old. Only 1.0% of these mothers reported having a partner when their children were nine months old when they had not had a current partner in late pregnancy.
Overall, approximately one in 12 (457, 8.0%) of the mothers of the cohort children reported not having a partner when their children were nine months old.
Table 10: Comparison of partnership status for mothers between antenatal and nine month data collection waves
Partnership status – antenatal
n (%)
Partnership status – 9 months
n (%)Total
Mother without a partner
Mother with a partner
Mother without a partner 232 (4.0) 57 (1.0) 289 (5.0)
Mother with a partner 225 (3.9) 5231 (91.1) 5456 (95.0)
Total 457 (8.0) 5288 (92.0) 5745 (100.0)
N=5745 for complete information from antenatal and 9 month interviews Agreement (diagonal) = 95.1% (95%CI: 94.5-95.6)
Although the overall likelihood of parental relationships changing in the 12 months from late pregnancy to when the child was aged nine months was small, the likelihood of change was greater for some groups of mothers in comparison to others. Almost one in four mothers of cohort children who were teenagers at the time their child was nine months had experienced a change in their relationship status between the antenatal and nine month interview points, in comparison to approximately 7.9% of mothers in the 20-29 age group, 2.2% in 30-39 age group and 2.8% of those over 40 years. The likelihood of a relationship change was also greatest for children living in the most deprived geographic areas: 8.9% living in the most deprived quintile experienced change compared to 2.1% living in the least deprived areas.

64
GrowinG Up in new Zealand - now we are born 2012
4.2 Family structure and home environmentParents create the most important immediate environment for the Growing Up in New Zealand children, but the children are also in dynamic interaction with other people living in the same household, and parents may not always be living together in the same house as the child. The stability of the household environment and the family structure in which the child was growing up was compared between late pregnancy and when the children were nine months of age. Most family structures had not changed in that 12 month period, with 91% (5713) reporting living in the same household situation. However, of the 6284 households with complete information at both time points, 9.1% (571) had undergone some change. In particular the number of households where Growing Up in New Zealand children were living with a sole parent only had more than doubled to 7.4% (463 households) between pregnancy and when the child was nine months of age. The number of two-parent households (with no other adult) decreased slightly from 66% to 63% (3945 households) over time as did the number of households where parents were living with non-kin or in extended family households (Table 11).
Table 11: Household structure at antenatal and nine month data collection waves
Mother reported – antenatal
n (%)
Mother reported – 9 months
n (%)
TotalParent alone
Two parents alone
Parent(s) with extended family
Parent(s) with non-kin
Parent alone 175 (2.8) 12 (0.2) 11 (0.2) 1 (0.0) 199 (3.2)
Two parents alone 202 (3.2) 3866 (61.5) 81 (1.3) 16 (0.3) 4165 (66.3)
Parent(s) with extended family
79 (1.3) 30 (0.5) 1374 (21.9) 10 (0.2) 1493 (23.8)
Parent(s) with non-kin 7 (0.1) 37 (0.6) 85 (1.4) 298 (4.7) 427 (6.8)
Total 463 (7.4) 3945 (62.8) 1551 (24.7) 325 (5.2) 6284 (100.0)
N=6284 for complete information from antenatal and 9 month interviewsAgreement (diagonal) = 90.9% (95%CI: 90.2-91.6)

65
SECTION 4
4.3 Parental wellbeing Children’s development is affected on a daily basis by the health and wellbeing of their parents. Therefore, to collect information about the Growing Up in New Zealand children’s development, the health and wellbeing of the child’s parents and their immediate family was also ascertained. This provided information about the immediate environment provided to the children, as well as useful information for later longitudinal analyses about the child’s own trajectory of development and wellbeing.
4.3.1 Self-reported mother and partner health status At the nine month interview, as well as at the antenatal contact point, the parents of the Growing Up in New Zealand children were asked about their current health status, both in terms of self-perceived overall health status and the existence of any specific health issues or long-standing disabilities or chronic illnesses that had been confirmed by a health professional. The proportion of mothers of the Growing Up in New Zealand children who rated their overall health as either very good or excellent increased from 56% (3785) to 64% (4054) between late pregnancy and when their children were nine months of age, whereas the relatively low proportion who rated their health as poor was similar at both time points (152, 2.2% in pregnancy and 110, 1.7% at nine months). The proportion of mothers who rated their health as fair or good over the same time period decreased from 42% (2871) to 35% (2218).
Table 12 presents a comparison of maternal health status over time when data is available at both antenatal and nine month data collection waves. Overall, approximately half of these mothers had changed their views about their own health status during this time, usually for the better.
Table 12: Mothers health status at antenatal and nine month data collection waves
Mothers’ health status – antenatal n (%)
Mothers’ health status – 9 months n (%) Total
Poor Fair/Good Very good Excellent
Poor 16 (0.3) 75 (1.2) 28 (0.4) 13 (0.2) 132 (2.1)
Fair/Good 56 (0.9) 1325 (20.8) 956 (15.0) 290 (4.6) 2627 (41.3)
Very good 25 (0.4) 613 (9.6) 1179 (18.5) 470 (7.4) 2287 (36.0)
Excellent 12 (0.2) 198 (3.1) 434 (6.8) 669 (10.5) 1313 (20.7)
Total 109 (1.7) 2211 (34.8) 2597 (40.8) 1442 (22.7) 6359 (100.0)
N=6359 for complete information from antenatal and 9 month interviews Agreement (diagonal) = 50.1% (95%CI: 48.9-51.4)
I have limited parenting abilities as a result of my own health problems and issues, which are ongoing.

66
GrowinG Up in new Zealand - now we are born 2012
A similar pattern was seen for partners’ self-rated health with 65% (2640) rating their overall health as either very good or excellent when the children were nine months of age (compared to 1945, 47% in the antenatal period) and 35% (1421) rating their health as fair or good (compared to 2139, 52% in the antenatal period). The proportion of partners who rated their health as poor decreased from 1.7% to 0.8%.
Understanding what enables a change in perceived health status, as well as how this is likely to affect the Growing Up in New Zealand children’s development, will be an ongoing challenge in this longitudinal study. Preliminary analyses suggest that mothers who have higher educational qualifications (compared to those with no secondary education in particular) and older mothers are less likely to change their health rating and more likely to rate their own health as good or excellent at both time points. Interestingly whether the babies are a first or subsequent child for the mother does not appear to be related to the propensity for change in perceived health status. There is likely to be a complex inter-relationship between actual and perceived parental health and actual and perceived child health and wellbeing. This will be explored more fully over time as more information is collected about both child and parental health and about the temporal relationships between risk and enabling factors that may have influenced these outcomes.
4.3.2 Parental long-term disability and illnessAs was the case for the perceived health status of the children (Section 3.5), perception of parental health is also likely to be influenced by the presence of any long-standing chronic or acute illness or disability (for the parent, the Growing Up in New Zealand child or another family member). Growing Up in New Zealand is interested in how family health status influences the lives of children within the broader environmental context, and how families can be better supported to facilitate their child’s development if there are significant health issues. At the nine month interview, 263 (4.1%) of the babies’ mothers and 255 (6.2%) of the partners reported a long-term disability and 653 (10%) mothers and 332 (8.1%) partners reported a long-term illness. The most commonly reported conditions related to mental health (e.g. depression) or respiratory health (e.g. asthma). Of the parents who reported a long-term disability or illness, 70% (585) of these mothers, and nearly 80% (400) of these partners stated that they felt that their illness or disability did not impact on their ability to care for the Growing Up in New Zealand babies. Growing Up in New Zealand will provide information over time regarding how the children of parents with long-term disability or illness cope, how they are best supported, and how their own health and development evolves in the context of all the environmental influences that impact on their wellbeing.
It’s been a challenge being able to look after her myself with my physical disability.

67
SECTION 4
4.3.3 Parental respiratory and atopic health statusWhen the Growing Up in New Zealand babies were nine months old we asked their parents about whether they had any history of specific respiratory and atopic conditions themselves, including frequent daily coughing, pneumonia, asthma, eczema, hayfever, and food allergies. This was collected to provide parental information to help to understand the genetic and intergenerational components of childhood health issues (particularly respiratory and atopic conditions) in the Growing Up in New Zealand cohort (Rusconi et al., 1999). Just over half (3270, 51%) of the mothers of the Growing Up in New Zealand babies and approximately one-third (2177, 34%) of the partners reported never having experienced any of the specific health problems. Of these health issues, hayfever was the most commonly reported (27% of mothers and 17% of partners). A further 18% (1127) of the mothers and 11% (669) of the partners reported having had asthma, and 15% (967) of the mothers and 5.6% (358) of the partners reported having had eczema. Less than 10% of the mothers and partners reported daily coughing, pneumonia, or a food allergy.
4.3.4 Parental mental healthGrowing Up in New Zealand has collected information to estimate the prevalence of parental depression, anxiety and/or parental stress at each DCW in order to understand the impact these conditions may have on children’s developmental trajectories. Collecting information at the same time about the environmental factors that may help to mitigate the impact of these conditions will provide evidence to develop appropriate strategies to optimise healthy development for children in these environments from their earliest years.
A set of screening questions from the Edinburgh Depression Inventory (EDI) was used at both the antenatal and nine month data collection points to ascertain the chances that mothers were experiencing depressive symptoms at each point. A score of 12 or more (out of 30) is considered to indicate that depressive symptoms are likely (Cox, Holden, & Sagovsky, 1987), but does not necessarily constitute a diagnosis of depression. When the Growing Up in New Zealand children were nine months of age 686 (11%) of mothers met the criteria for probable depressive symptoms. This was less than the 1002 (16%) mothers who met the same criteria in pregnancy (Figure 23).
It's not that I'm grateful for the postnatal depression but since being diagnosed I know that's what it is and that I'm not a bad mum.
Perc
ent
(%)
0
10
20
30
40
50
60
70
80
90
100EDI score 12+
EDI score < 12
9 months Antenatal
16.210.7
83.8 89.3
Figure 23: Maternal self-reported Edinburgh Depression Inventory classification at antenatal and nine month data collection waves

68
GrowinG Up in new Zealand - now we are born 2012
Growing Up in New Zealand has also looked at symptoms of anxiety in the parents of the cohort, using validated screening tools (Spitzer, Kroenke, Williams, & Lowe, 2006). When the babies were nine months old, 1359 (21%) of mothers demonstrated mild anxiety symptoms, compared to 370 (5.8%) of mothers with moderate anxiety and 123 (1.9%) of mothers with symptoms suggestive of severe anxiety. Of the babies’ mothers who reported anxiety as a frequent occurrence (more than weekly), the majority of these (988, 61% of 1621) reported that they felt that their feelings of anxiety did not make caring for their babies difficult at all, whilst 633 (39%) of these mothers said their feelings of anxiety made caring for their babies somewhat, very or extremely difficult. Both mothers and partners reported balancing work and family life, and financial problems as the biggest contributors to their stress.
Symptoms of anxiety and stress have been linked to maternal postnatal depression and have been associated with the quality of the parent and child relationship (Reck et al., 2008) as well as to differences in child developmental trajectories (emotional, behavioural and cognitive) (Ross, Gilbert Evans, Sellers, & Romach, 2003). Further analysis of the associations between parental anxiety, stress and depression within the broader child developmental context will continue within the Growing Up in New Zealand study, as many effects may not be obvious until the children are older than nine months of age.
Where information on the EDI scores was available for mothers during pregnancy and when their children were nine months old, 635 (11%) had moved from a score of 12+ to one of <12 indicating that their mental health status had probably improved. A further 272 (4.7%) mothers had scores that suggested that depressive symptoms had persisted over time and 335 (5.8%) of the mothers at nine months had evidence of new depressive symptoms (Table 13).
Table 13: Change in mothers self-reported Edinburgh Depression Inventory classification
Self-reported EDI – antenatal n (%)
Self-reported EDI – 9 months n (%) Total
EDI score < 12 EDI score 12+
EDI score < 12 4517 (78.4) 335 (5.8) 4852 (84.3)
EDI score 12+ 635 (11.0) 272 (4.7) 907 (15.8)
Total 5152 (89.5) 607 (10.5) 5759 (100.0)
N=5759 for complete information from antenatal and 9 month interviews Agreement (diagonal) = 83.2% (95%CI: 82.2-84.1)

69
SECTION 4
4.3.5 Change in maternal mental wellbeing from late pregnancy to when children are nine months of age
The information available for this report, collected over a 12 month period, provides the first opportunity to begin to consider and model longitudinal features of the dataset, in addition to comparing cross-sectional relationships over time. Because repeated health and development measures have been collected for parents and children it is possible to derive variables that estimate changes in health and development status over a known time period. It is then possible to assess the effect (both direction and magnitude) that individual, family and/or contextual factors may have had in determining the extent of any change in status. This type of modelling is especially important for providing evidence with policy utility because it helps to elucidate what factors contribute to changes over time in important outcomes, and potentially offers time windows when they might be best addressed to reduce, or mitigate detrimental effects on developmental trajectories.
This example of modelling change over time relates to maternal mental health status, especially maternal depression, which when measured either in antenatal or postnatal life is known to be associated with children’s early life developmental outcomes. For the mothers of the Growing Up in New Zealand children maternal depressive symptoms were assessed using the well validated EDI where the higher the EDI score the greater the chance that a mother is experiencing depressive symptoms. The EDI questions were asked both antenatally and at the nine month interview.
Change over time modelling
The method of General Linear Modelling (GLM) was used to model the determinants of the EDI score at the antenatal interview as well as for the change in EDI score from antenatal to nine months. Explanatory variables used in the model included maternal demographic factors of age, ethnicity and highest education level as well as measures of family or household deprivation, household income and mother’s own labour force participation. Maternal health related behaviours before and during pregnancy, including smoking and alcohol consumption, passive smoking and physical activity levels, as well as specific maternal health issues that existed prior to pregnancy were used in the modelling. Variables describing characteristics of the household, parental relationship and those relating specifically to the Growing Up in New Zealand pregnancy were also used. These included whether the pregnancy was planned or not, whether the mother was in a relationship, any pregnancy specific health issues (gestational diabetes, hypertension or pre-eclampsia), current household financial situation, levels of anticipated postnatal support from family or external sources (measured during pregnancy) and a measure of physical or verbal conflict in the relationship during pregnancy and postnatally. The temporal ordering of the variables was respected in the final model (e.g. pre-pregnancy variables before the pregnancy specific) so that the effects of distal and more proximal variables could be assessed.

70
GrowinG Up in new Zealand - now we are born 2012
The analyses were carried out in two stages: firstly, the modelling considered the determinants of the maternal EDI score (in late pregnancy); and secondly the modelling looked at the determinants of change in EDI score between the antenatal and postnatal period. For the change in EDI analysis the model presented here is restricted to mothers with complete antenatal and postnatal EDI information and who gave birth to singletons, to avoid issues of clustering and differences in birth outcomes for multiple births.
Determinants of Antenatal maternal mental health (using the EDI)
The results of modelling the determinants of antenatal EDI score are shown in Table 14 and summarised here. Univariate analysis was initially used to examine the association between each possible explanatory variable and antenatal EDI score. Based on the univariate analysis result, multivariate analysis was then carried out with antenatal EDI score as the outcome. Mother’s highest level of education, area level deprivation measure, household crowding and household income were highly significant when analysed univariately, but did not remain statistically significant in the multivariate analysis of antenatal EDI score (Table 14). The effects of these more distal socio-demographic characteristics may be better captured by the other proximal maternal behavioural variables with which they are known to be correlated, and that were included in the model (for example smoking, alcohol consumption, and maternal employment).
A step-wise modelling approach was used to respect the temporal ordering of the variables, and therefore their likely impact on maternal mental health over time, to see if this made any difference to the final model and its interpretation. What was consistently found, regardless of the order in which variables were entered into the model, was that maternal education and family deprivation and income variables lost significance in the final model when more proximal maternal and family variables were added. The result from the final multivariate analysis for maternal antenatal EDI score is given in Table 14 (labelled ‘Mothers’).
Other proximal variables measuring specific pregnancy related health conditions such as diabetes, hypertension or pre-eclampsia were aggregated into a gestational morbidity variable which indicated whether a mother had experienced any of these issues in pregnancy. The presence of poorer health in pregnancy as well as a less stable relationship during pregnancy both increased the antenatal EDI score, but neither remained significant determinants of antenatal EDI score in the final multivariate model.
71
SECTION 4
In the final full multivariate model (Table 14) antenatal EDI scores tended to be significantly higher when pregnancy was unplanned, for younger mothers (under 30 years of age compared to those aged 30 to 34), and for mothers who identified as Asian or Pacific compared to New Zealand European mothers. Antenatal EDI scores were also greater in those with a previous doctor diagnosis of depression or anxiety. In addition the pregnancy EDI score was higher for mothers who reported poorer self-rated health and an existing disability prior to pregnancy. During pregnancy those who were not employed, who consumed alcohol during their pregnancy, or who were current smokers (or had only given up in pregnancy) tended to have higher EDI scores in pregnancy. EDI scores were also higher for mothers who were not active during the first trimester of pregnancy and for those with high levels of family stress. Conversely a planned pregnancy, activity before and during pregnancy and family support all reduced the antenatal EDI score. The R2 for this multivariate model suggested approximately 21% of the variation was explained for the Growing Up in New Zealand mothers’ antenatal EDI score.
The multivariate analyses are restricted to mothers with current partners, and complete data to measure change (Table 14, ‘Mothers with partner'), we were able to investigate the association between antenatal EDI score and two additional relationship variables: levels of verbal and of physical conflict in the multivariate analysis, also adjusted for the same variables as for the full sample. The association with antenatal EDI score remained highly significant for both conflict variables after adjustment for all others, with higher levels of physical conflict or verbal conflict being associated with an increased antenatal EDI score. The coefficients for the other explanatory variables remained largely stable, except for the alcohol and smoking parameters which had reduced significance when the conflict variables were included in the model, suggesting that levels of conflict are correlated with maternal smoking and alcohol consumption. This multivariate model explains approximately one-quarter of the variation in antenatal EDI score for those pregnant mother with partners (R2=0.24).

72
GrowinG Up in new Zealand - now we are born 2012
Tab
le 1
4:
Mate
rnal an
ten
ata
l Ed
inb
urg
h D
ep
ress
ion
In
ven
tory
sco
re m
od
el
Vari
ab
leLevels
Refe
ren
ce G
rou
p
Mo
del
Sta
tist
ics
Pr(
>F)
< 0
.00
01
R
2=
0.2
1¥
Mo
del S
tati
stic
s P
r(>
F)
< 0
.00
01
R
2=
0.2
4¥
Mo
thers
Mo
thers
wit
h p
art
ner
Pr(
>F)*
Co
effi
cien
t+S
E+
Pr(
>|t
|)#
Pr(
>F)*
C
oeffi
cien
t+S
E+
Pr(
>|t
|)#
Mate
rnal p
re-p
reg
nan
cy
Mat
ernal
age
(yea
rs)
Less
than
25
30-3
4<
.0001
1.0
40.2
1<
.0001
<.0
001
0.8
50.2
1<
.0001
25-2
9
0.5
30.1
70.0
013
0.5
60.1
60.0
006
35-3
9
-0
.25
0.1
70.1
33
-0
.20
0.1
70.2
255
40 a
nd a
bov
e
0.0
30.3
30.9
207
0.1
20.3
30.7
115
Sel
f-re
port
ed e
thnic
ity
Paci
fic
People
sN
ew Z
eala
nd E
uro
pea
n<
.0001
1.3
20.2
1<
.0001
<.0
001
0.7
90.2
20.0
003
Māo
ri0.0
50.2
10.8
093
-0.4
60.2
10.0
281
Asi
an0.7
30.2
00.0
003
0.5
70.2
00.0
035
MELA
A**
0.5
60.4
40.2
071
0.3
60.4
40.4
148
Oth
er1.1
71.0
10.2
456
0.8
71.0
30.3
978
Gen
eral
hea
lth
Poor
Exc
elle
nt
<.0
001
1.7
20.4
70.0
003
0.0
001
1.1
70.4
80.0
154
Fa
ir
1.2
80.2
8<
.0001
1.0
80.2
80.0
001
G
ood
0.6
80.1
80.0
002
0.7
00.1
8<
.0001
Ver
y G
ood
0.4
80.1
70.0
045
0.5
60.1
60.0
007
Dis
abili
ty
Yes
No
0.0
506
0.5
00.2
60.0
506
0.0
101
0.6
70.2
60.0
101
Prev
ious
dia
gnosi
s of
dep
ress
ion
Yes
No
<.0
001
1.2
60.1
8<
.0001
<.0
001
1.1
40.1
8<
.0001
Prev
ious
dia
gnosi
s of
anxi
ety
Yes
No
<.0
001
1.1
90.2
1<
.0001
<.0
001
1.0
20.2
1<
.0001

73
SECTION 4
Fam
ily c
hara
cteri
stic
s
Rel
atio
nsh
ip s
tatu
s N
o c
urr
ent
rela
tionsh
ipM
arried
/civ
il unio
n0.5
358
0.3
20.3
30.3
231
0.7
99
--
-
Dat
ing n
ot
cohab
itin
g0.4
20.3
50.2
249
0.2
20.3
40.5
216
Cohab
itin
g0.1
30.1
60.3
965
0.0
60.1
50.7
118
Fam
ily s
tres
s (p
er u
nit)
<.0
001
0.3
20.0
2<
.0001
<.0
001
0.2
80.0
2<
.0001
Fam
ily s
upport
(per
unit)
0.0
003
-0.0
40.0
10.0
003
0.0
079
-0.0
30.0
10.0
079
Phys
ical
conflic
t sc
ore
(per
unit)
--
--
<.0
001
0.4
00.0
6<
.0001
Ver
bal
conflic
t sc
ore
(per
unit)
--
--
<.0
001
0.2
20.0
2<
.0001
Pre
gn
an
cy s
peci
fic
Plan
ned
pre
gnan
cy
Yes
No
0.0
073
-0.3
90.1
50.0
073
0.0
008
-0.4
80.1
40.0
008
Ante
nat
al m
ater
nal
sm
oki
ng
Continue
smoki
ng
Non-s
moke
rs0.0
344
0.4
90.2
50.0
513
0.2
504
0.2
00.2
60.4
491
Sto
pped
sm
oki
ng
0.4
70.2
20.0
344
0.3
60.2
20.1
078
Pass
ive
smoki
ng
Yes
No
<.0
001
1.1
00.2
7<
.0001
0.0
031
0.8
30.2
80.0
031
Alc
ohol during p
regnan
cyYe
sN
o0.0
924
0.2
40.1
40.0
924
0.3
123
0.1
40.1
40.3
123
Act
ive
in 1
st t
rim
este
rYe
sN
o0.0
275
-0.2
90.1
30.0
275
0.0
801
-0.2
30.1
30.0
801
Labour
forc
e st
atus
Not
in
work
forc
eEm
plo
yed
0.0
322
0.2
50.1
50.0
938
0.0
088
0.3
90.1
50.0
071
Stu
den
t
0.2
80.2
40.2
368
0.3
30.2
30.1
512
U
nem
plo
yed
0.6
70.2
50.0
061
0.6
50.2
50.0
092
Preg
nan
cy s
pec
ific
hea
lth iss
ues
^Ye
sN
o0.1
12
0.3
10.1
90.1
120
0.1
846
0.2
60.1
90.1
846
¥ T
he
model
R2 is
an e
stim
ate
of th
e am
ount
of th
e va
riat
ion in t
he
outc
om
e va
riab
le (
e.g.
ED
I sc
ore
) th
at c
an b
e ex
pla
ined
by
the
full
multiv
aria
te fi
tted
model
.* T
he
Pr(>
F) indic
ates
the
signifi
cance
of th
e as
soci
atio
n b
etw
een t
he
fitt
ed m
odel
or
the
det
erm
inan
ts a
nd t
he
outc
om
e va
riab
le.
+ T
he
coef
fici
ents
of par
amet
er e
stim
ates
and t
hei
r st
andar
d e
rrors
, SE,
indic
ate
the
size
, th
e direc
tion o
f th
e ef
fect
and t
he
pre
cisi
on o
f th
e par
amet
er e
stim
ates
.# T
he
Pr(>
|t|)
indic
ates
the
signifi
cance
of th
e as
soci
atio
n b
etw
een t
he
det
erm
inan
t an
d t
he
outc
om
e va
riab
le,
wher
e th
e det
erm
inan
t w
as a
continuous
variab
le.
Wher
e th
e det
erm
inan
t is
a c
ateg
orica
l va
riab
le,
the
Pr(>
|t|)
indic
ates
t
he
signifi
cance
of th
e diffe
rence
of th
e par
amet
er e
stim
ate
bet
wee
n t
he
refe
rence
cat
egory
and t
he
test
ed c
ateg
ory
of th
e sp
ecifi
c ca
tegorica
l va
riab
le.
** M
ELA
A -
Mid
dle
Eas
tern
, La
tin A
mer
ican
or
Afr
ican
.^ P
regnan
cy s
pec
ific
hea
lth iss
ues
incl
ude
ges
tational
dia
bet
es,
hyp
erte
nsi
on a
nd p
re-e
clam
psi
a.

74
GrowinG Up in new Zealand - now we are born 2012
Determinants of change in maternal mental health (antenatal to postnatal)
Beginning with the insights into the determinants of antenatal EDI score the next step in the modelling was to consider what may have led to changes in mothers’ mental health status between late pregnancy and the first nine months post-delivery. In general, a similar set of explanatory variables were used for the change in EDI model as for the determinants of antenatal EDI score. However where there had been change in the explanatory variables over time new change variables were calculated for use in the change model. This enabled an assessment of whether it was the baseline level or the change over time in these that influenced the change in EDI. The explanatory variables that had also undergone change from the antenatal to postnatal period included: household income; crowding; mother’s self-reported general health status; alcohol consumption; family stress; family and external support.
In the change model (Table 15), firstly univariate analysis was carried out to examine the association between change in EDI score (EDI score at nine months minus the antenatal EDI score) and each of the explanatory variables separately. Univariate analysis results suggested that the single most significant determinant of change in EDI score was the prior antenatal EDI score. This means that some explanatory variables that contributed to the antenatal EDI score did not contribute further to the change in EDI score as their effect was captured by the antenatal status. For example alcohol consumption was significantly related to EDI score measured at both the antenatal and nine month time points, as well as univariately with change in EDI. However change in alcohol consumption was not related to change in EDI status, suggesting that baseline alcohol consumption pre-pregnancy was related to maternal mental health, but changes in alcohol intake in the 12 month period between pregnancy and postnatal life did not contribute to changed mental health status over the same time period. Based on these univariate analysis results, a multivariate analysis was conducted.
In general postnatal EDI scores tended to be better than antenatal EDI (that is mothers tended to have better mental health status postnatally than during pregnancy).Results from the multivariate analysis with change in EDI as the outcome suggest that antenatal EDI remains the single most important determinant of change in EDI score between the antenatal and postnatal period (Table 15). Many of the variables that were significant predictors of the antenatal EDI score (Table 14) did not contribute further to the change in EDI. These became non-significant in the change model, suggesting that their effects were mediated via antenatal mental health. For example whether the pregnancy was planned or not ceased to be significant, as this had already contributed to the chances of having a higher EDI score in pregnancy.
75
SECTION 4
Younger mothers (those aged less than 30 years) were more likely to have poorer mental health postnatally (compared to mothers aged 30 to 34 years), as were mothers who identified as Asian, Pacific or Māori (compared to New Zealand European mothers). Having a poorer self-reported health status compared to an excellent rating was also associated with a poorer mental health postnatally. However this association with self-rated general health status may not be a causal effect but may instead be the result of the poorer mental health status itself.
If the household financial situation had deteriorated and/or if the family had experienced household hardship or family stress had increased in the postnatal period then maternal mental health was likely to have deteriorated. If the mother was smoking when the Growing Up in New Zealand children were nine months of age or she had a previous diagnosis of depression or anxiety then her postnatal mental health was also likely to have deteriorated. By contrast mothers who had returned to work by the time their children were nine months of age, and those who reported having greater levels of family support, were likely to have better mental health in the postnatal period. As with the self-rated postnatal general health measure, returning to work may appear protective in this change model, but poorer mental health status may prevent a mother considering returning to work in the postnatal period.
The same multivariate model used for the ‘Mothers’ (Table 15) was restricted to mothers with partners at the nine month interview point to analyse change in EDI, including the physical and verbal conflict scores from the postnatal period (Table 15, ‘Mothers with partner’). Both the postnatal physical and verbal conflict scores remained highly significant in the multivariate model, increasing the chances of a mother having poorer mental health status (as in the antenatal EDI model). Most of the other parameter estimates remained very similar in the restricted model, except that being a current smoker was no longer significant, once again suggesting a high degree of correlation between the nature of the relationship and parental behaviours.
Further change over time modelling work
This report only provides a brief introduction to the complexity and possible interpretation of these types of change over time models. The brief summary here provides an example of the capacity of the longitudinal and multidisciplinary data available, even at this early stage, to consider what individual, family, environmental and contextual factors are associated not only with an outcome at one point in time, but what factors contribute significantly to changes in status over time. This type of lifecourse and longitudinal modelling and the resulting evidence will help to identify environmental and contextual factors that may be amenable to change, so as to improve developmental outcomes for New Zealand children and their families.

76
GrowinG Up in new Zealand - now we are born 2012
Tab
le 1
5:
Ch
an
ge in
mate
rnal Ed
inb
urg
h D
ep
ress
ion
In
ven
tory
mo
del
Vari
ab
leLevels
Refe
ren
ce G
rou
p
Mo
del
Sta
tist
ics
Pr(
>F)*
< 0
.00
01
R
2=
0.3
9¥
Mo
del S
tati
stic
s P
r(>
F)*
< 0
.00
01
R
2=
0.4
1¥
Mo
thers
Mo
thers
wit
h p
art
ner
Pr(
>F)*
Co
effi
cien
t+S
E+
Pr(
>|t
|)#
Pr(
>F)*
Co
effi
cien
t+S
E+
Pr(
>|t
|)#
Mate
rnal p
re-p
reg
nan
cy
Mat
ernal
age
(yea
rs)
Less
than
25
30-3
4 0
.0285
0.4
90.2
00.0
118
0.0
903
0.3
10.2
00.1
279
25-2
9
0.4
20.1
70.0
111
0.4
00.1
70.0
171
35-3
9
0.3
50.1
70.0
444
0.3
60.1
70.0
362
40 a
nd a
bov
e
-0
.10
0.3
40.7
634
-0
.04
0.3
40.9
127
Sel
f-re
port
ed e
thnic
ity
Paci
fic
People
sN
ew Z
eala
nd E
uro
pea
n<
.0001
1.4
00.2
0<
.0001
<.0
001
1.1
30.2
2<
.0001
Māo
ri0.6
90.2
00.0
004
0.3
90.2
10.0
617
Asi
an1.2
30.1
9<
.0001
1.2
50.1
9<
.0001
MELA
A**
0.4
40.4
60.3
338
0.5
20.4
70.2
697
Oth
er1.2
81.0
20.2
088
1.3
81.0
30.1
806
Prev
ious
dia
gnosi
s of
dep
ress
ion
Yes
No
<.0
001
1.0
00.1
7<
.0001
<.0
001
0.9
90.1
8<
.0001
Prev
ious
dia
gnosi
s of
anxi
ety
Yes
No
0.1
01
0.3
50.2
10.1
01
0.0
336
0.4
70.2
20.0
336
Pre
gn
an
cy s
peci
fic
ED
I Ante
nat
al<
.0001
-0.6
40.0
1<
.0001
<.0
001
-0.6
70.0
1<
.0001
Plan
ned
pre
gnan
cy
Yes
No
0.2
129
-0.1
70.1
40.2
129
0.6
579
-0.0
60.1
40.6
579
Fam
ily c
hara
cteri
stic
s
House
hold
finan
cial
situat
ion
§A lot
wors
eAbout
the
sam
e0.1
992
0.5
00.2
10.0
175
0.4
471
0.4
10.2
20.0
585
A little
wors
e
0.0
80.1
60.6
303
0.1
70.1
60.3
049
A little
bet
ter
0.0
60.1
80.7
126
0.1
40.1
80.4
456
A lot
bet
ter
0.0
40.2
50.8
833
0.1
50.2
60.5
606
House
hold
har
dsh
ipŦ
Yes
No
<.0
001
0.7
40.1
3<
.0001
<.0
001
0.6
30.1
3<
.0001
Chan
ge
in fam
ily s
tres
s (p
er u
nit)
<
.0001
0.1
00.0
1<
.0001
<.0
001
0.0
90.0
1<
.0001
Chan
ge
in fam
ily s
upport
(per
unit)
<.0
001
-0.0
70.0
1<
.0001
<.0
001
-0.0
60.0
1<
.0001
9 m
onth
Phys
ical
conflic
t sc
ore
(per
unit)
0.0
003
0.1
90.0
50.0
003
9 m
onth
Ver
bal
conflic
t sc
ore
(per
unit)
<.0
001
0.2
10.0
2<
.0001

77
SECTION 4
Mate
rnal ch
ara
cteri
stic
s
Chan
ge
in g
ener
al h
ealth
Less
hea
lthy
Unch
anged
<.0
001
0.9
50.1
6<
.0001
<.0
001
0.7
90.1
6<
.0001
Hea
lthie
r-0
.22
0.1
40.1
247
-0.2
70.1
50.0
664
9 m
onth
mat
ernal
sm
oki
ng
Sm
oke
rN
on-s
moke
r0.0
229
0.4
40.1
90.0
229
0.8
577
0.0
40.2
10.8
577
9 m
onth
em
plo
ymen
t st
atus
Em
plo
yed
Unem
plo
yed
<.0
001
-0.6
90.1
3<
.0001
<.0
001
-0.6
70.1
3<
.0001
¥ T
he
model
R2 is
an e
stim
ate
of th
e am
ount
of th
e va
riat
ion in t
he
outc
om
e va
riab
le (
e.g.
chan
ge
in E
DI)
that
can
be
expla
ined
by
the
full
multiv
aria
ble
fitt
ed m
odel
.* T
he
Pr(>
F) indic
ates
the
signifi
cance
of th
e as
soci
atio
n b
etw
een t
he
fitt
ed m
odel
or
the
det
erm
inan
ts a
nd t
he
outc
om
e va
riab
le.
+ T
he
coef
fici
ents
of par
amet
er e
stim
ates
and t
hei
r st
andar
d e
rrors
, SE,
indic
ate
the
size
, th
e direc
tion o
f th
e ef
fect
and t
he
pre
cisi
on o
f th
e par
amet
er e
stim
ates
.# T
he
Pr(>
|t|)
indic
ates
the
signifi
cance
of th
e as
soci
atio
n b
etw
een t
he
det
erm
inan
t an
d t
he
outc
om
e va
riab
le,
wher
e th
e det
erm
inan
t w
as a
continuous
variab
le.
Wher
e th
e det
erm
inan
t is
a c
ateg
orica
l va
riab
le,
the
Pr(>
|t|)
indic
ates
th
e si
gnifi
cance
of th
e diffe
rence
of th
e par
amet
er e
stim
ate
bet
wee
n t
he
refe
rence
cat
egory
and t
he
test
ed c
ateg
ory
of th
e sp
ecifi
c ca
tegorica
l va
riab
le.
**M
ELA
A -
Mid
dle
Eas
tern
, La
tin A
mer
ican
or
Afr
ican
.§ Sel
f-re
port
ed c
om
par
ison b
etw
een p
ost
nat
al a
nd a
nte
nat
al.
Ŧ E
xper
ience
d o
ne
or
more
of th
e fo
llow
ing in t
he
last
12 m
onth
s: b
een forc
ed t
o b
uy
chea
per
food s
o c
ould
pay
for
oth
er t
hin
gs,
put
up w
ith fee
ling c
old
to s
ave
hea
ting c
ost
s, m
ade
use
of sp
ecia
l fo
od g
rants
or
food b
anks
, co
ntinued
w
earing s
hoes
with h
ole
s, g
one
without
fres
h fru
it a
nd v
eget
able
oft
en,
rece
ived
hel
p in t
he
form
of fo
od,
cloth
es o
r m
oney
fro
m a
com
munity
org
anis
atio
n.

78
GROWING UP IN NEW ZEALAND - NOW WE ARE BORN 2012
4.4 Parental health related behavioursParental health related behaviours in the fi rst nine months may have direct effects on child health and development. They also set up patterns of behaviour that the children will learn from as they grow up. Understanding the complex relationships between biology and environments over time, including continuity of behaviours across generations, is a key area of interest for this longitudinal study. Information regarding parental alcohol intake, smoking and other drug use is provided in this section to describe components of the environments the Growing Up in New Zealand children are experiencing in early life.
4.4.1 Parental alcohol consumptionAt the antenatal interview, 29% (1982) of the mothers of the Growing Up in New Zealand cohort reported not consuming any alcohol before pregnancy (this included those who were abstaining because they were actively planning a pregnancy as well as those who generally chose not to drink). While pregnant with the Growing Up in New Zealand children, just over three-quarters (5266, 77%) of mothers did not drink any alcohol in the fi rst three months of their pregnancy, and 87% (5898) of mothers did not drink any alcohol after the fi rst three months of the Growing Up in New Zealand child’s pregnancy (Morton et al., 2010).
Overall, 61% of mothers (3901) were drinking any alcohol when their babies were nine months old. Alcohol consumption was patterned by maternal characteristics including breastfeeding status, area level deprivation and ethnicity. When the babies were nine months old, nearly half of the mothers who were still breastfeeding (1405, 47%) were not drinking any alcohol, and 1249 (42% of those who were still breastfeeding) reported drinking less than four standard drinks per week. Of those mothers who were no longer breastfeeding, 32% (1083) were not drinking any alcohol, 47% (1603) reported drinking less than four standard drinks per week, and 21% (738) reported drinking between four and 19 standard drinks per week (Figure 24).
I’ve changed my life a lot for the better – I’ve stopped drinking and smoking since the birth of my daughter.
0
20
40
60
80
100
20+
4 to 19
1 to 3
<1
None
At 9 month -Not breastfeeding
(n=3424)
At 9 month -Breastfeeding
(n=3013)
After 1sttrimester
(n=6810)
During 1sttrimester
(n=6804)
Before pregnancy
(n=6805)
Perc
ent
(%)
Drinks (per week)
29.1
77.4
86.6
46.6
31.6
18.2
9.0 9.3
21.6
24.423.5
6.9
3.2
19.922.4
26.9
5.9
0.7
11.8
21.0
2.20.8 0.1 0.1 0.6
Figure 24: Maternal alcohol consumption from before pregnancy to nine months
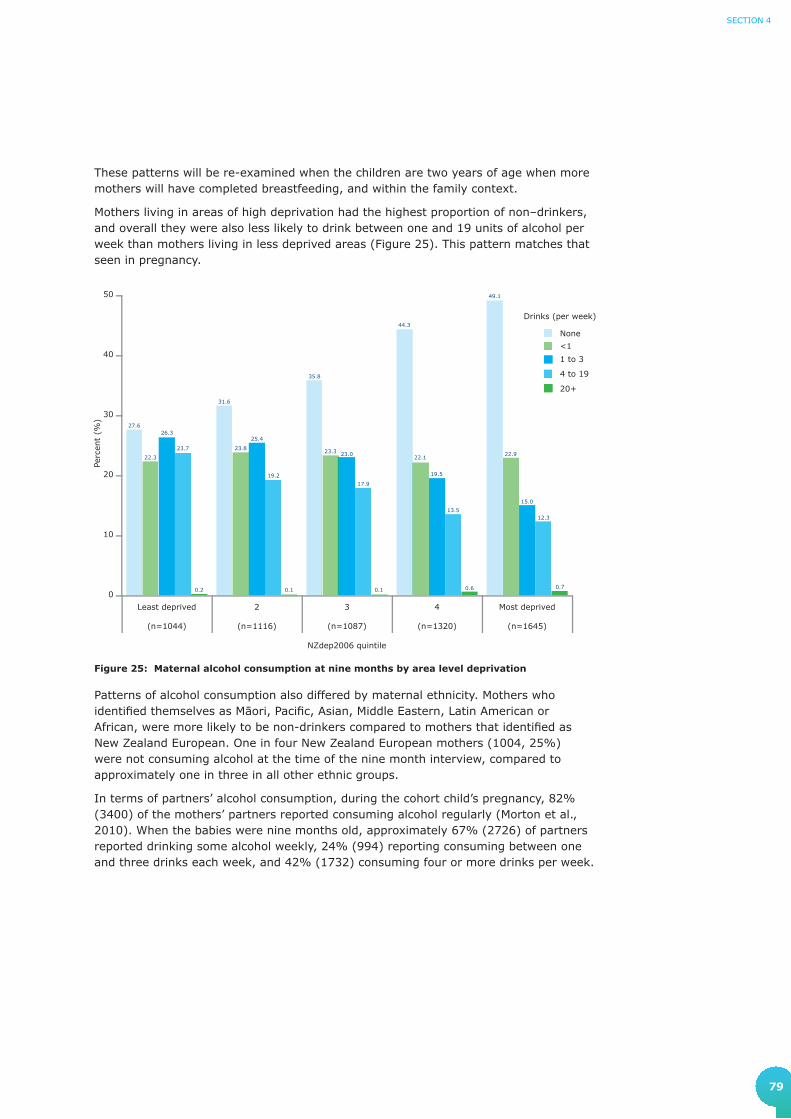
79
SECTION 4
These patterns will be re-examined when the children are two years of age when more mothers will have completed breastfeeding, and within the family context.
Mothers living in areas of high deprivation had the highest proportion of non–drinkers, and overall they were also less likely to drink between one and 19 units of alcohol per week than mothers living in less deprived areas (Figure 25). This pattern matches that seen in pregnancy.
0
10
20
30
40
50
20+
4 to 19
1 to 3
<1
None
Most deprived
(n=1645)
4
(n=1320)
3
(n=1087)
2
(n=1116)
Least deprived
(n=1044)
Perc
ent
(%)
27.6
31.6
35.8
44.3
49.1
22.3
23.8 23.322.1
22.9
26.325.4
23.0
19.5
15.0
23.7
19.2
17.9
13.512.3
0.2 0.1 0.1 0.6 0.7
Drinks (per week)
NZdep2006 quintile
Figure 25: Maternal alcohol consumption at nine months by area level deprivation
Patterns of alcohol consumption also differed by maternal ethnicity. Mothers who identifi ed themselves as Māori, Pacifi c, Asian, Middle Eastern, Latin American or African, were more likely to be non-drinkers compared to mothers that identifi ed as New Zealand European. One in four New Zealand European mothers (1004, 25%) were not consuming alcohol at the time of the nine month interview, compared to approximately one in three in all other ethnic groups.
In terms of partners’ alcohol consumption, during the cohort child’s pregnancy, 82% (3400) of the mothers’ partners reported consuming alcohol regularly (Morton et al., 2010). When the babies were nine months old, approximately 67% (2726) of partners reported drinking some alcohol weekly, 24% (994) reporting consuming between one and three drinks each week, and 42% (1732) consuming four or more drinks per week.

80
GrowinG Up in new Zealand - now we are born 2012
4.4.2 Parental smokingWhen the Growing Up in New Zealand children were nine months of age mothers and their partners were asked about cigarette smoking. This added longitudinal information to the smoking data available from before and throughout pregnancy. Both active and passive smoking information was sought.
At the antenatal interview, 20% (1387) of mothers reported regularly smoking cigarettes prior to the Growing Up in New Zealand child’s pregnancy, and in pregnancy this reduced to 11% (664) of mothers (Morton et al., 2010).
When the babies were nine months old, approximately seven out of 10 (4515, 71%) babies lived in households where there were no cigarette smokers, one-quarter (1645, 26%) lived in households where one or two people smoked cigarettes, and a small number (220, 3.4%) lived in households where more than two people regularly smoked cigarettes. For the mothers, 14% (896) reported smoking an average of 8.3 cigarettes per day, with a median of seven cigarettes per day.
There was complete information regarding cigarette smoking before pregnancy, at the antenatal interview, and when the children were nine months old for 5756 mothers of 5834 babies. This allows changes in maternal smoking behaviour to be tracked across this time period (Figure 26). Of these 5756 mothers, 1119 were smoking before pregnancy, 561 continued to smoke during pregnancy, and 507 (90% of those who smoked in pregnancy) reported that they were still smoking when their babies were nine months old. Of the mothers who were smokers before pregnancy, 558 had stopped smoking during pregnancy and 220 of these (nearly 40%) had returned to smoking when their children were nine months old. Most of the 4637 mothers who did not smoke prior to pregnancy did not smoke during pregnancy (4622 mothers) and were not smoking when the babies were nine months old (4557). A small number of mothers who did not smoke pre-pregnancy reported that they did smoke during pregnancy (15 mothers), and about half of these mothers reported that they were still smoking when their babies were nine months old.
TOTAL5756
YES507
(90.4%)
NO54
(9.6%)
YES561
(50.1%)
NO558
(49.9%)
YES1119
(19.4%)
NO4637
(80.6%)
YES15
(0.3%)
NO4622
(99.7%)
YES220
(39.4%)
NO338
(60.6%)
YES8
(53.3%)
NO7
(46.7%)
YES65
(1.4%)
NO4557
(98.6%)
Smoking post-pregnancy
Smoking during pregnancy
Smoking pre-pregnancy
Figure 26: Maternal change in smoking status
N=5756 for complete information from antenatal and 9 month interviewsPercentages given are the fraction of the total on the preceding (higher) level

81
SECTION 4
When the mothers were pregnant with the Growing Up in New Zealand babies, 18% (728) of the partners reported that they smoked cigarettes regularly. When the babies were nine months old, a similar overall proportion of partners were smoking cigarettes (673, 16% smoking an average of 9.7 cigarettes and a median of nine cigarettes per day).
Information regarding changes in the partners’ smoking behaviour from pregnancy to when the babies were nine months old was available for 3835 partners (Figure 27). Just over four out of five of the partners who were smoking regularly at the time of the pregnancy (624, 16%) continued to smoke regularly when the babies were nine months old (520, 83%). Nearly all of the partners who were not smoking at the time of the pregnancy remained non-smokers when the babies were nine months old.
TOTAL3835
YES520
(83.3%)
NO104
(16.7%)
YES624
(16.3%)
NO*3211
(83.7%)
YES108
(3.4%)
NO3103
(96.6%)
Smoking post-pregnancy
Smoking during pregnancy
Figure 27: Change in smoking status for partners
* Of those who did not smoke 877 (27.3%) smoked sometime prior to mothers pregnancy. N=3835 for complete information from antenatal and 9 month interviewsPercentages given are the fraction of the total on the preceding (higher) level
Growing Up in New Zealand will be able to determine the environmental and family factors that facilitate smoking cessation for parents, and the impact that these behaviours have on child developmental outcomes and health related behaviours in the children themselves.

82
GrowinG Up in new Zealand - now we are born 2012
4.4.3 Parental drug useWhen the babies of the Growing Up in New Zealand cohort were nine months old, their parents were asked whether they had ever used illicit drugs. Overall, 45% (2845) of the mothers and 58% (2363) of the partners reported that they had ever used marijuana. This is roughly comparable to the lifetime prevalence figures reported in the most recent MoH drug use data, where 47.2% of adult women and 51.3% of adult men reported a history of marijuana use (Ministry of Health, 2010).
For those parents in Growing Up in New Zealand who reported using marijuana, a further question was asked about whether mothers and partners had used marijuana since the birth of the cohort child. This was reported for 9.7% (275) of these mothers and 19% (439) of these partners. Of those who had used marijuana since their child’s birth, over half reported using marijuana once a month or less (161 mothers and 237 partners), with daily usage reported by 38 mothers and 53 partners. This aligns with 13.4% of adults reporting daily usage in the national survey, among those who had used marijuana in the past 12 months (Ministry of Health, 2010).
Where a mother reported ever using marijuana, it was likely that her partner also reported that they had used marijuana in the past (in approximately 78% (1456/1857) of the cases where we have information for both parents). However this was less common after the child’s birth.
In addition, 1645 (26%) of all the mothers of the Growing Up in New Zealand cohort babies and 1417 (35%) of the partners reported ever using other drugs, including amphetamines, cocaine, ecstasy, opiates, hallucinogens and/or party pills. Of these 65 of the mothers, and 117 of the partners reported using these since the Growing Up in New Zealand babies were born. Regular use of these other drugs (i.e. fortnightly, weekly or daily) was rare.

83
SECTION 4
4.5 Parental leave and return to employment
Nationally and internationally there is a current focus on the provision of parental leave and the need to better understand the potential impact of parental work patterns on children’s development, especially in the preschool years. Understanding the potential impact of parental work patterns also needs to consider balancing economic efficiencies, accessibility to quality early child care, and formal and informal support.
All of these areas are a current and future focus for Growing Up in New Zealand, which is able to describe the context of parental employment, family, social and economic support, child care utilisation, and developmental outcomes for all our children. It will also compare the ideal leave arrangements and intentions with what actually happens for families.
Importantly, a high proportion of mothers of the cohort children were still on leave from employment when their babies were nine months old, and therefore any analyses presented regarding parental leave in this report are only interim. The characteristics of families where mothers are still on leave when the baby is nine months may differ systematically from those where leave is completed.
4.5.1 Maternal leave taken by nine monthsOverall 3534 mothers (84% of those who indicated that they were in paid employment when pregnant) took some form of leave before or after their Growing Up in New Zealand baby was born (Figure 28). When the children were nine months of age 1055 mothers (30% of those who had taken any form of leave) remained on leave.
Returning to work has been a big challenge because I wasn't ready to come back to work. I would have preferred to stay with her longer.
I’m looking forward to my wife going back to work and getting more money for the family - that takes the pressure off being a one income family.
Figure 28: Maternal leave from employment
Percentages given are the fraction of the total on the preceding (higher) level* This number is greater than that used in the antenatal report which was the number of mothers currently employed at the
ante-natal interview
MOTHERN=6384
YES1055
(30.0%)
NO2462
(70.0%)
YES3534
(83.6%)
NO691
(16.4%)
YES4230
(66.3%)
NO2152
(33.7%)
Still on leave
Took any leave
Had a paid job at any time while pregnant*
2 mothers did not provide information
5 mothers did not provide information
17 mothers did not provide information The change from
going fulltime working to looking after a baby fulltime and not having any instruction book – that’s been a challenge.
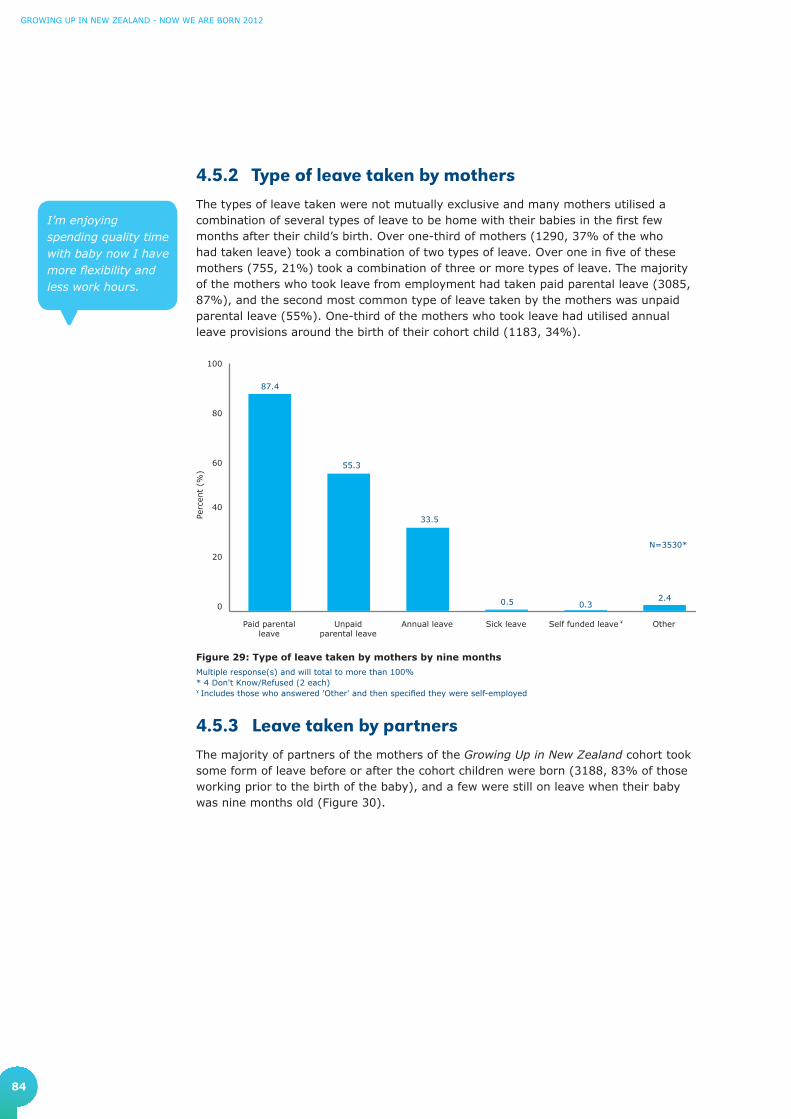
84
GrowinG Up in new Zealand - now we are born 2012
4.5.2 Type of leave taken by mothersThe types of leave taken were not mutually exclusive and many mothers utilised a combination of several types of leave to be home with their babies in the first few months after their child’s birth. Over one-third of mothers (1290, 37% of the who had taken leave) took a combination of two types of leave. Over one in five of these mothers (755, 21%) took a combination of three or more types of leave. The majority of the mothers who took leave from employment had taken paid parental leave (3085, 87%), and the second most common type of leave taken by the mothers was unpaid parental leave (55%). One-third of the mothers who took leave had utilised annual leave provisions around the birth of their cohort child (1183, 34%).
I’m enjoying spending quality time with baby now I have more flexibility and less work hours.
Figure 29: Type of leave taken by mothers by nine months
Multiple response(s) and will total to more than 100%* 4 Don't Know/Refused (2 each)¥ Includes those who answered 'Other' and then specified they were self-employed
4.5.3 Leave taken by partnersThe majority of partners of the mothers of the Growing Up in New Zealand cohort took some form of leave before or after the cohort children were born (3188, 83% of those working prior to the birth of the baby), and a few were still on leave when their baby was nine months old (Figure 30).
0
20
40
60
80
100
OtherSelf funded leave Sick leaveAnnual leaveUnpaidparental leave
Paid parentalleave
87.4
55.3
33.5
0.5 2.4
Perc
ent
(%)
0.3
¥
N=3530*
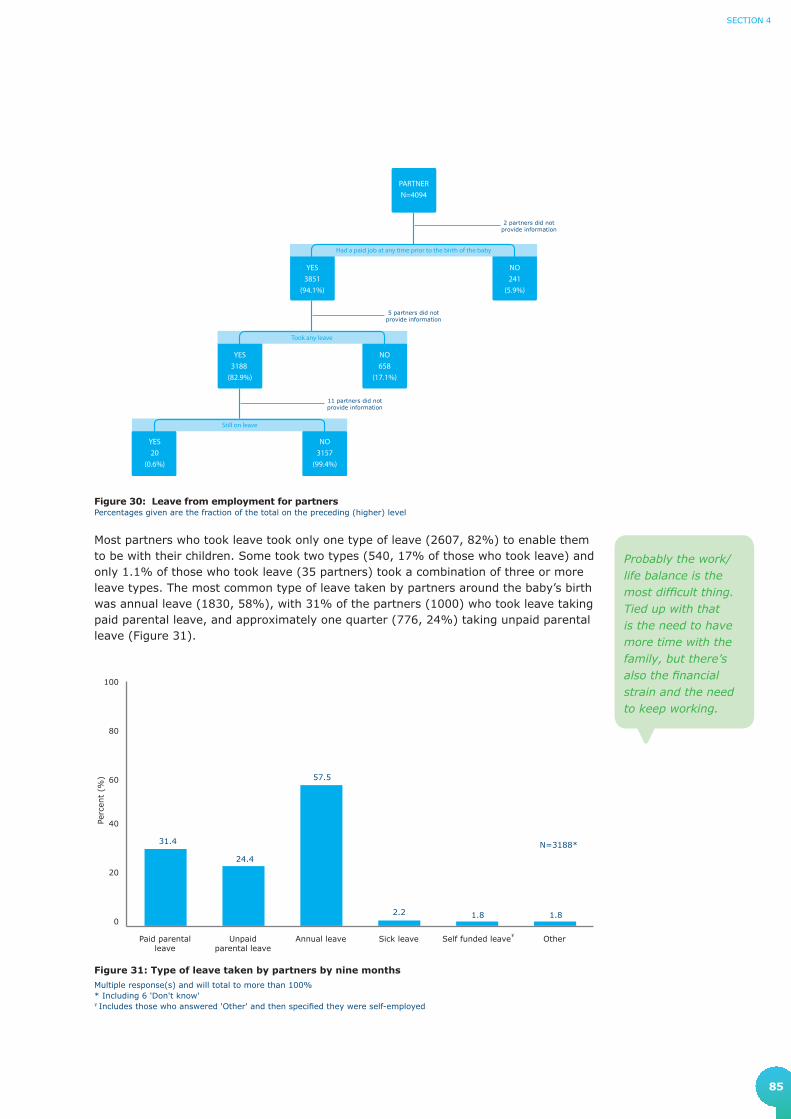
85
SECTION 4
Probably the work/life balance is the most difficult thing. Tied up with that is the need to have more time with the family, but there’s also the financial strain and the need to keep working.
PARTNERN=4094
YES20
(0.6%)
NO3157
(99.4%)
YES3188
(82.9%)
NO658
(17.1%)
YES3851
(94.1%)
NO241
(5.9%)
Still on leave
Took any leave
Had a paid job at any time prior to the birth of the baby
2 partners did not provide information
5 partners did not provide information
11 partners did not provide information
Figure 30: Leave from employment for partnersPercentages given are the fraction of the total on the preceding (higher) level
Most partners who took leave took only one type of leave (2607, 82%) to enable them to be with their children. Some took two types (540, 17% of those who took leave) and only 1.1% of those who took leave (35 partners) took a combination of three or more leave types. The most common type of leave taken by partners around the baby’s birth was annual leave (1830, 58%), with 31% of the partners (1000) who took leave taking paid parental leave, and approximately one quarter (776, 24%) taking unpaid parental leave (Figure 31).
Figure 31: Type of leave taken by partners by nine months
Multiple response(s) and will total to more than 100%* Including 6 'Don't know'¥ Includes those who answered 'Other' and then specified they were self-employed
0
20
40
60
80
100
OtherSelf funded leaveSick leaveAnnual leaveUnpaidparental leave
Paid parentalleave
31.4
24.4
57.5
2.2 1.8
Perc
ent
(%)
1.8
¥
N=3188*

86
GrowinG Up in new Zealand - now we are born 2012
4.5.4 Parents that did not take leaveWhen the Growing Up in New Zealand cohort babies were nine months old, 691 mothers (16% of those who had been in paid work during pregnancy) and 658 partners (17% of those who had any paid work in the six months prior to the baby’s birth) had not taken any type of leave before or after the baby was born. Of these mothers who had not taken leave the most common reasons for this decision included: resignation from their employment before the birth of their child (241, 35% of those who had not taken leave); not meeting the government parental leave requirements (19%); parenting preferences (10%); being self employed or in a family-run business (9.0%); or redundancy (6.7%). In addition 24 of the mothers who had not taken leave had arranged flexible work for after the birth of their child, 39 were not able to take leave for financial reasons, and 41 described the need to continue employment to fulfil professional or work commitments (Figure 32).
Figure 32: Maternal reasons for not taking leave
Percentage of mothers who reported this informationMultiple response(s) and will total to more than 100%
N=691Flexible work arranged
Company or employer regulationsabout entitlement
Financial reasons
Professional or work commitments
Redundancy
Other
Self employed/family run business
Parenting preferences
Government regulationsabout entitlement
Resigned 34.9
19.4
10.0
9.0
7.8
6.7
5.9
5.6
4.5
3.5
The partners who did not take leave (658, 17% of all partners who had a paid job prior to the baby’s birth) cited a different order of priority for their reasons for not taking leave. The most common reasons for these partners not taking leave were, in this order: professional or work commitments (37%); financial reasons (27%); working for themselves or family (11%); parenting preferences (9.4%); and workplace regulations about entitlement (5.5%). In addition 21 stated that they had arranged flexible work, 21 had resigned and 19 had been made redundant (Figure 33).

87
SECTION 4
4.5.5 Anticipated and actual leave At the antenatal interview 95% of the 3671 mothers who were working at that time indicated that they intended to take parental leave. The average anticipated leave period was eight to nine months (with a range of one week to some years).
There are 3344 mothers for whom we have information about anticipated leave antenatally and leave taken. Of these, 3221 intended to take leave antenatally and 92% of these actually took leave. An additional 41 mothers who did not anticipate taking leave antenatally did take leave either before or after their baby was born (Table 16).
Table 16: Comparison of maternal antenatal intentions and actual leave taken
Antenatal leave intentions n (%)
9-month leave n (%)
TotalTook leave either before or after the
baby was bornDid not take leave
Intend to take leave 2976 (89.0) 245 (7.3) 3221 (96.3)
Do not intend to take leave 41 (1.2) 82 (2.5) 123 (3.7)
Total 3017 (90.2) 327 (9.8) 3344 (100.0)
N=3344 with information from antenatal and 9 month interviews
Agreement (diagonal) = 91.4% (95%CI: 90.5-92.4)
Figure 33: Partner reasons for not taking leave
Percentage of partners who reported this information Multiple response(s) and will total to more than 100%
N=658Government regulations
about entitlement
Redundancy
Flexible work arranged
Resigned
Company or employer regulationsabout entitlement
Other
Parenting preferences
Self employed/family run business
Financial reasons
Professional or work commitments 37.4
28.6
11.2
9.4
7.4
5.5
3.3
3.2
2.9
2.0
At the antenatal interview 3341 (89% of those partners who were working) expected to take parental leave compared to the 95% of mothers, with a much shorter average duration of leave expected (two to three weeks).

88
GrowinG Up in new Zealand - now we are born 2012
4.5.6 Return to employmentOverall, of the 2386 mothers and 3744 partners who were working when the Growing Up in New Zealand children were nine months old, 1880 (79%) of the mothers and 2908 (78%) of the partners were paid employees. A further 19% (441) of the working mothers and 20% (756) of the partners were self employed, with 44% (332) of these partners employing others compared to 22% (96) of the self employed mothers. This suggests quite a different type of self employment for mothers and partners (Table 18).
Table 18: Type of employment for the parents of the children to nine months of age
Mother N=2386
n (Column %)
Partner N=3744
n (Column %)
A paid employee 1880 (78.8) 2908 (77.7)
Self employed and not employing others 345 (14.5) 424 (11.3)
Self employed and employing others 96 (4.0) 332 (8.9)
Working in a family business or family farm 65 (2.7) 80 (2.1)
Weekend work was relatively common for both mothers and partners with 32% of the 2386 mothers and 40% of the 3744 partners in employment usually working the weekend. Working mothers of the Growing Up in New Zealand babies were more likely than partners to have ‘non-traditional’ working hours. One-third of the 2386 mothers who were working (777) did not have a regular daytime working schedule compared to one-quarter of the partners (913); 16% (381) of the working mothers had an irregular working schedule, compared to 9.6% (359) of the partners. Working mothers were more likely than partners to work regular evening shifts and to be on call. The proportion of working mothers and partners on night shifts, rotating shifts and split shifts were similar.
There were 2134 mothers and 3154 partners who provided further information about the type of work they returned to, and when they returned to work, after their babies were born. The majority of these mothers (83%) returned to work for their previous employers after their babies were born, or they had been self employed prior to taking leave and continued to be self employed postnatally. Similarly, 95% of these partners returned to work for their previous employers after their leave or they returned to
Table 17: Comparison of partner antenatal intentions and actual leave taken
Antenatal leave intentions n (%)
9 month leave n (%)
TotalTook leave either before or after the
baby was bornDid not take leave
Intend to take leave 2764 (80.5) 315 (9.2) 3079 (89.7)
Do not intend to take leave 149 (4.3) 206 (6.0) 355 (10.3)
Total 2913 (84.8) 521 (15.2) 3434 (100.0)
N=3434 for complete information from antenatal and 9 month interviews
Agreement (diagonal)=86.5% (95%CI: 85.3-87.6)
Where we have complete data from the antenatal period as well as when the babies were nine months old, 2764 partners (90% who expected to take leave) had taken leave. A further 149 partners who had not intended to take leave had taken some leave before or after the cohort children were born (Table 17).
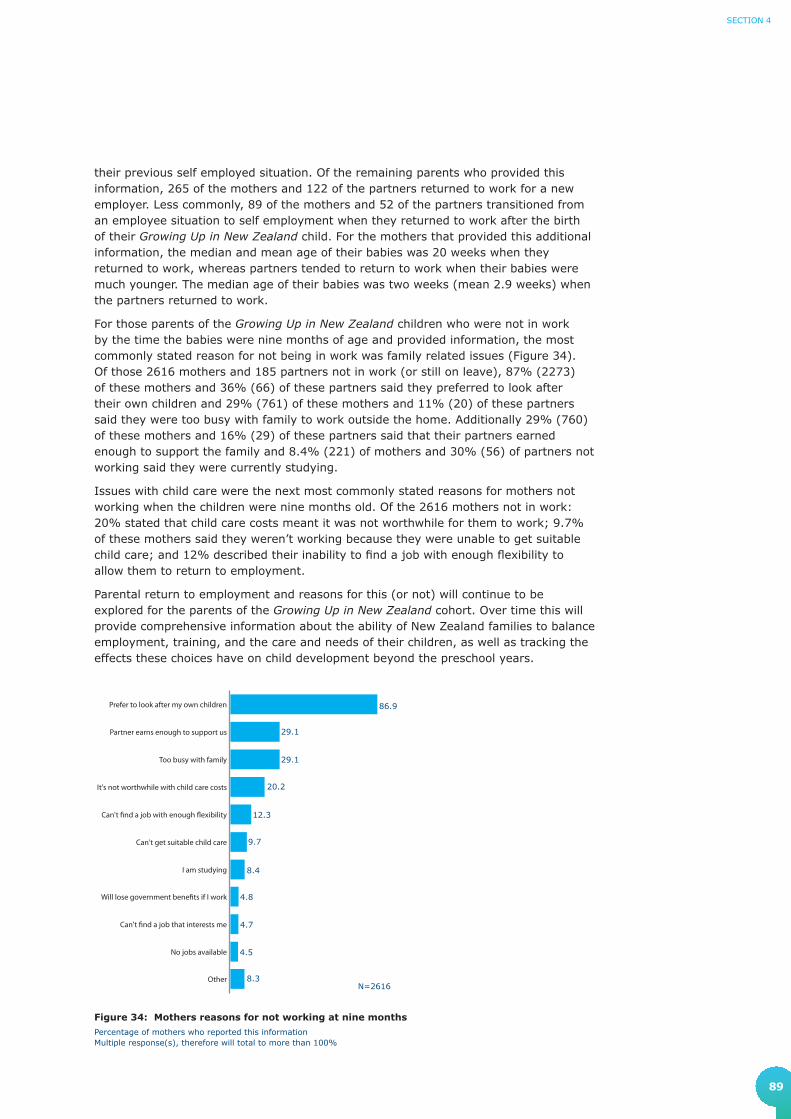
89
SECTION 4
Figure 34: Mothers reasons for not working at nine months
Percentage of mothers who reported this informationMultiple response(s), therefore will total to more than 100%
N=2616
No jobs available
Can't �nd a job that interests me
Will lose government bene�ts if I work
Other
I am studying
Can't get suitable child care
Can't �nd a job with enough �exibility
It's not worthwhile with child care costs
Too busy with family
Partner earns enough to support us
Prefer to look after my own children 86.9
29.1
29.1
20.2
12.3
9.7
8.4
8.3
4.8
4.5
4.7
their previous self employed situation. Of the remaining parents who provided this information, 265 of the mothers and 122 of the partners returned to work for a new employer. Less commonly, 89 of the mothers and 52 of the partners transitioned from an employee situation to self employment when they returned to work after the birth of their Growing Up in New Zealand child. For the mothers that provided this additional information, the median and mean age of their babies was 20 weeks when they returned to work, whereas partners tended to return to work when their babies were much younger. The median age of their babies was two weeks (mean 2.9 weeks) when the partners returned to work.
For those parents of the Growing Up in New Zealand children who were not in work by the time the babies were nine months of age and provided information, the most commonly stated reason for not being in work was family related issues (Figure 34). Of those 2616 mothers and 185 partners not in work (or still on leave), 87% (2273) of these mothers and 36% (66) of these partners said they preferred to look after their own children and 29% (761) of these mothers and 11% (20) of these partners said they were too busy with family to work outside the home. Additionally 29% (760) of these mothers and 16% (29) of these partners said that their partners earned enough to support the family and 8.4% (221) of mothers and 30% (56) of partners not working said they were currently studying.
Issues with child care were the next most commonly stated reasons for mothers not working when the children were nine months old. Of the 2616 mothers not in work: 20% stated that child care costs meant it was not worthwhile for them to work; 9.7% of these mothers said they weren’t working because they were unable to get suitable child care; and 12% described their inability to find a job with enough flexibility to allow them to return to employment.
Parental return to employment and reasons for this (or not) will continue to be explored for the parents of the Growing Up in New Zealand cohort. Over time this will provide comprehensive information about the ability of New Zealand families to balance employment, training, and the care and needs of their children, as well as tracking the effects these choices have on child development beyond the preschool years.

90
GrowinG Up in new Zealand - now we are born 2012
4.6 Early childhood education and child care
Within the New Zealand context, education policy recommends participation in early childhood education to encourage development in the early years. The current priority in early childhood education policy is to improve the participation of Māori and Pacific children, and children living in low socio-economic areas (Ministry of Education, 2008, 2010; Ministry of Social Development, 2008, 2010). Growing Up in New Zealand is able to track the use of different forms of early child care, including both formal and informal care, and ascertain the impact of the utilisation of a range of forms of early care and education at various points in the preschool years.
4.6.1 Child care use by Growing Up in New Zealand families when children are nine months of age
It is important to note that the information provided here about the use of formal and informal child care is an interim analysis, given the previous section which describes large number of mothers who have not yet returned to work and who have not yet accessed regular child care arrangements. The use of early childhood education and other forms of child care is expected to increase beyond infancy, and therefore further details about this important component of influences on child development will be described further when the children are two and four years of age, as well as when they enter formal education.
A range of child care arrangements, other than care by the mothers, was being used by families of the nine month old Growing Up in New Zealand children. The information reported here is for regular care rather than ad hoc or occasional care arrangements. Most commonly the children were regularly cared for by their father when the mother was not present (2291, 39%). In a small number of cases the fathers were the sole caregivers. Non-parental child care was also common. By the age of nine months, 2234 (35%) mothers, representing over one-third of the cohort, stated that in the preceding month their children had been looked after at regular times during the week by someone other than the child’s parent.
I’m looking forward to sending him to baby care and I want him to mingle with other kids so that he can learn about different cultures and be with different people and different kids.

91
SECTION 4
Of those nine month old babies who had been in any regular child care in the month prior to the nine month interview (2220 of those with complete information), the median duration of child care per child per week was 20 hours (mean of 23.0 hours). For those children who regularly spent eight hours or more per week in a specific child care arrangement (1732, 78% of all regular care), they tended to spend a median of 25 hours per week (mean of 28.1 hours) in that child care arrangement. Where information was provided the main reason these children were in child care was because of their mother’s work or study commitments (87%). A few of these children were in child care to give their mothers some time alone (4.0%), or to establish a relationship with their grandparent(s) (2.7%), while some parents reported that child care was used because it was good for their child’s development, or because they wanted them to mix with other children of the same age.
Further information was collected about the main child care for the Growing Up in New Zealand families where child care was used for eight hours or more per week (Figure 35). Common forms of regular child care used by these families when the children were nine months old were either daycare centres or grandparents, each being used by approximately one third (daycare centre 624, 36% and grandparents 557, 32%). The next most frequent regular child care arrangements used by these families were organised home-based care (166, 9.7%) or nanny care at home (135, 7.9%). Kohanga Reo were the main child care providers at nine months of age for 2.4% (42) of these cohort babies in regular care, and Pacific Islands early childhood centres were used for 1.1% (19) of these children.
Figure 35: Main non-parental child care used at nine months
0
10
20
30
40
50
Other(includeChurch
Crèche, Gym,Leisure,
CommunityCentre)
Other person(includesfriend or
neighbour)
OtherRelative
GrandparentNannyPacificIslands Early
ChildhoodCentre
KohangaReo
Organisedhome-based
care programme(i.e Barnardos
or PORSE)
DaycareCentre
36.4
Perc
ent
(%)
9.7
2.41.1
7.9
32.5
6.1
3.01.0
N=1716
Because we earn less money than we used to, we’ve been limited in where we can take her and we’ve not been able to send her to child care when I think it is good for her, because it is too expensive.
I guess yesterday was the first day at her grandparents house. I really missed her. Our home isn't complete without our children in it.

92
GrowinG Up in new Zealand - now we are born 2012
Of the families using regular child care for their Growing Up in New Zealand babies for eight or more hours a week, the type of child care used differed according to a number of key characteristics. For example, in-home care and nannies were more likely to be the main childcare type used by families living in the least deprived quintile (80 families) compared to those in the most deprived quintile (38 families). The families living in the most deprived quintile were more likely to have their Growing Up in New Zealand babies looked after by grandparents (147 families) as their main form of childcare compared to those living in the least deprived quintile (81 families). Child care provided by other relatives (not grandparents) was also more frequent for families living in more deprived areas compared to those in least deprived areas.
There were also differences in types of main care arrangements by maternal ethnicity. A daycare centre was used as the main childcare type for 43% of New Zealand European mothers with children in regular care for more than eight hours a week, compared to 37% of Māori mothers, 24% of Pacific mothers and 21% of mothers who identified as Asian. Similarly, in-home care and nannies were also more likely to be the main childcare type used by mothers who identified as New Zealand European compared to all other ethnicities. By contrast, grandparents were the main childcare providers used by 23% of New Zealand European mothers, 28% of Māori mothers, 41% of Pacific mothers and 61% of Asian mothers using regular childcare for eight hours or more a week.
The majority of the main child care arrangements being used for the Growing Up in New Zealand families for eight or more hours a week at nine months incurred costs. Formal child care arrangements, including daycare centres, home-based care, and nannies were the most likely to incur cost compared to less formal care (e.g. care provided by extended family members). Approximately 20% of families using this regular childcare reported receiving a subsidy for their child care payments.
This study will be able to provide more comprehensive evidence of these patterns of childcare access and utilisation (as well as reasons for the use of childcare type) as the cohort children develop in the preschool period.
The types of care used by the families in the Growing Up in New Zealand cohort when their children are very young are influenced by many non-independent factors, including family factors such as current financial resources, parental employment situation, extended family availability, parents’ values and cultural beliefs. These are similarly influenced by factors associated with the care itself (such as accessibility, flexibility, location, quality and cost). More information will be collected about use of child care, as more parents return to the workforce and more families use formal early childhood education. As further information becomes available about the contextual factors that are associated with use of care, longitudinal analyses will be possible to consider how these multiple factors interact and how early child care choices are made for the Growing Up in New Zealand cohort, as well as what effect different choices have on children’s developmental trajectories over time. These further analyses will include information about the perceived quality of child care, and the reason for particular choices of care for the Growing Up in New Zealand cohort families. This will provide contemporary New Zealand evidence about the effects of early childhood education to add to the body of research on preschool care that describes both positive and negative outcomes associated with care for different populations and contexts (Belsky et al., 2007; Harrison & Ungerer, 2005).

93
SECTION 4
It is known that rates of participation in formal early childhood education are patterned by ethnicity and deprivation in New Zealand, with children who are Māori or Pacific, and those living in areas of high deprivation having the lowest participation rates overall. Growing Up in New Zealand will be able to add value to these routine participation statistics by delving beneath the descriptions of participation and non-participation, to consider the interaction of all the family, child and contextual factors that are likely to lie behind these rates. This deeper understanding will provide an opportunity to assess why we see these differential rates of child care usage for our current New Zealand preschoolers, and how we might appropriately address the differences in them.
4.6.2 Antenatal plans and actual postnatal child care use in the first nine months
For those families using regular child care when the Growing Up in New Zealand children were nine months old it was possible to compare the type of care being used with the type that parents indicated they intended to use before their children were born. This information is not complete because many families are not yet engaged in child care arrangements. However, at this early stage approximately two-thirds of the families who had indicated that they planned to use extended family members or formal early childhood education had used this option postnatally. Agreement for other intentions was considerably lower (Table 19).
Table 19: Comparison between antenatal intentions for childcare and reality at 9 months
Intentions for child care
(Antenatal) *
Child care used
(9 months)
Agreement
% (n 9 month/n antenatal)
Childminder in your home (not family)
Nanny 57.6% (34/59)
Childminder in their home (not family)
An organised home-based care programme such as Barnardos or PORSE
36.9% (24/65)
Other family member in your own home or other family member in their home
Grandparent or other relative
68.8% (317/461)
Early childhood centre or similar Daycare Centre or Kohanga Reo or Pacific Islands Early Childhood Centre
67.5% (339/502)
Other Other person (includes friend or neighbour) Other (includes Church crèche/Gym, Leisure, Community centre)
2.7% (1/37)
Where complete information from antenatal and nine month interviews is available*Multiple response(s) and will total to more than 100%

94
GrowinG Up in new Zealand - now we are born 2012
4.6.3 Growing Up in New Zealand children not in regular child care at nine months of age
As described throughout the previous section, the majority of the Growing Up in New Zealand children (65%) are not in any form of regular formal or informal non-parental care situation when they are nine months of age. The main reasons given by mothers of children not in any regular non-parental care were that child care was not needed (76%) or that they did not want the children to be cared for by strangers (12%). Some of these mothers described issues of access, with 5.1% of the mothers of those babies not in child care stating that child care was too expensive, and approximately 1% of these mothers stating each of the following: that transport difficulties prevented their use of child care; that there were no child care spaces; that there was no care available locally; or that care wasn’t available at the times they needed it. A smaller number reported that using child care did not suit their cultural or ethnic beliefs. Growing Up in New Zealand will continue to monitor access to and use of child care by the cohort children, their reasons for child care use or non-use, and the impact of this (and the quality of care) on child outcomes over the preschool period and beyond.
4.7 The home language environmentAs well as exposure to formal and informal care in the preschool years, early learning and early child cognitive and socio-emotional development is shaped by the home environment and the resources available to the Growing Up in New Zealand families. One feature of the home environment that highlighted the diversity of families currently having children in New Zealand was the wide range of languages that were being used on a daily basis in the homes that the children were born into. In the antenatal report it was noted that approximately one-third of the Growing Up in New Zealand children had at least one parent who was born overseas. As a result a wide range of languages were being spoken by parents at home, with one in five not using English as their preferred everyday language, although nearly all (97%) said they could converse in English (Morton et al., 2010). Therefore it is especially relevant to consider what languages are being used in the homes now that the children are born.
When parents were asked about all the languages they spoke to their children when they were nine months old, 95% of both mothers (6058) and partners (3876) identified English as a language that they used to speak to their baby. The next most common language reported as being spoken to the Growing Up in New Zealand babies was te reo Māori which was used by 16% (1001) of mothers and 12% (485) of partners. This represents a different proportion of parents speaking at least some te reo Māori to their babies, compared to parents’ own ability to use te reo Māori in a conversation as reported antenatally (5.0% of mothers and 3.5% of partners). While these proportions seem very different it is unlikely that they are measuring the same capacity to use te reo Māori. Further information about what these differences mean for the children’s own language development will be available over the preschool period, when children’s language use and development is assessed in more detail.
Of the mothers speaking te reo Māori to their children, 66% identified themselves as Māori.
She is starting to interact with us by speaking in a couple of languages, so I am hoping that she will switch from one to another very easily.

95
SECTION 4
After English and te reo Māori, the languages most commonly spoken to the children were Samoan, Tongan, Hindi and Mandarin. These were spoken by 3% to 7% of mothers and partners (Table 20). As was seen in the antenatal period, many other languages were also spoken to the children, not all of which are in the table (Morton et al., 2010).
Table 20: Languages spoken to the baby
Mother (N=6383)
n (%)
Partner (N=4094)
n (%)
English 6058 (94.9) 3876 (94.7)
Māori 1001 (15.7) 485 (11.8)
Samoan 460 (7.2) 220 (5.4)
Tongan 287 (4.5) 121 (3)
Fijian 36 (0.6) 27 (0.7)
Niuean 60 (0.9) 29 (0.7)
Cook Islands Maori 112 (1.8) 36 (0.9)
Cantonese 84 (1.3) 48 (1.2)
Mandarin 211 (3.3) 115 (2.8)
Korean 25 (0.4) 11 (0.3)
Japanese 40 (0.6) 30 (0.7)
Hindi 254 (4) 155 (3.8)
Arabic 31 (0.5) 21 (0.5)
NZ Sign Language 88 (1.4) 31 (0.8)
Other 950 (14.9) 591 (14.4)
Multiple response(s) and will total to more than 100%
The parents of the Growing Up in New Zealand babies were also asked about the languages most frequently spoken to the cohort babies in their first nine months of life (Table 21). For approximately four out of five mothers (5067, 80%) and partners (3411, 84%), English was the language most frequently spoken to the babies. For this and most languages, the language usually spoken at home during the Growing Up in New Zealand child’s pregnancy was the language most frequently spoken to the babies. The exception to this was te reo Māori which was more commonly spoken by both mothers (18 increased to 47) and partners (5 increased to 22) than those who usually spoke te reo Māori at home when pregnant (Morton et al., 2010).

96
GrowinG Up in new Zealand - now we are born 2012
Over time, Growing Up in New Zealand will be able to examine children’s language use patterns in infancy within the context of their family and other influences, and how they impact on child development and wellbeing more generally.
For those parents who mostly spoke a language other than English to their babies, the main reason for this was that it was the language they spoke best (777, 43% of the mothers and 364, 39% of the partners who mostly spoke a non-English language to their babies). However, for those mothers who mostly spoke te reo Māori to their babies, this was most commonly because they wanted to bring their baby up as bilingual. This reason was also given by 17% (309) of all mothers and 15% (144) of all partners who mostly spoke a non-English language to their babies. Similar proportions of these parents described the use of a non-English language as a way to maintain their culture (280, 15% of mothers and 160, 17% of partners). Other reasons given included so that their baby could speak with their family or because the parents felt that this language was important for their baby’s future success.
Table 21: Languages spoken at home antenatally and at nine months
Mother: Language usually spoken at home – antenatal (N=6365)
n (Column%)
Mother: Language mostly spoken to the baby – 9 months (N=6365)
n (Column%)
Partner: Language usually spoken at home – antenatal (N=4068)
n (Column%)
Partner: Language mostly spoken to the baby – 9 months (N=4068)
n (Column%)
English 5172 (81.3) 5067 (79.6) 3433 (84.4) 3411 (83.8)
Māori 18 (0.3) 47 (0.7) 5 (0.1) 22 (0.5)
Samoan 167 (2.6) 161 (2.5) 68 (1.7) 70 (1.7)
Tongan 162 (2.5) 163 (2.6) 67 (1.6) 71 (1.7)
Fijian 9 (0.1) 11 (0.2) 4 (0.1) 3 (0.1)
Niuean 2 (0.0) 1 (0.0) 0 (0.0) 1 (0.0)
Cook Islands Maori 12 (0.2) 10 (0.2) 3 (0.1) 2 (0.0)
Cantonese 46 (0.7) 49 (0.8) 26 (0.6) 25 (0.6)
Mandarin 139 (2.2) 162 (2.5) 70 (1.7) 72 (1.8)
Korean 19 (0.3) 20 (0.3) 4 (0.1) 5 (0.1)
Japanese 5 (0.1) 19 (0.3) 2 (0.0) 4 (0.1)
Hindi 179 (2.8) 168 (2.6) 98 (2.4) 97 (2.4)
Arabic 21 (0.3) 20 (0.3) 12 (0.3) 13 (0.3)
NZ Sign Language 2 (0.0) 1 (0.0) 0 (0.0) 0 (0.0)
Other 412 (6.5) 466 (7.3) 276 (6.8) 272 (6.7)
N=6365 mothers and N=4068 partners have complete information from antenatal and 9 month interviews
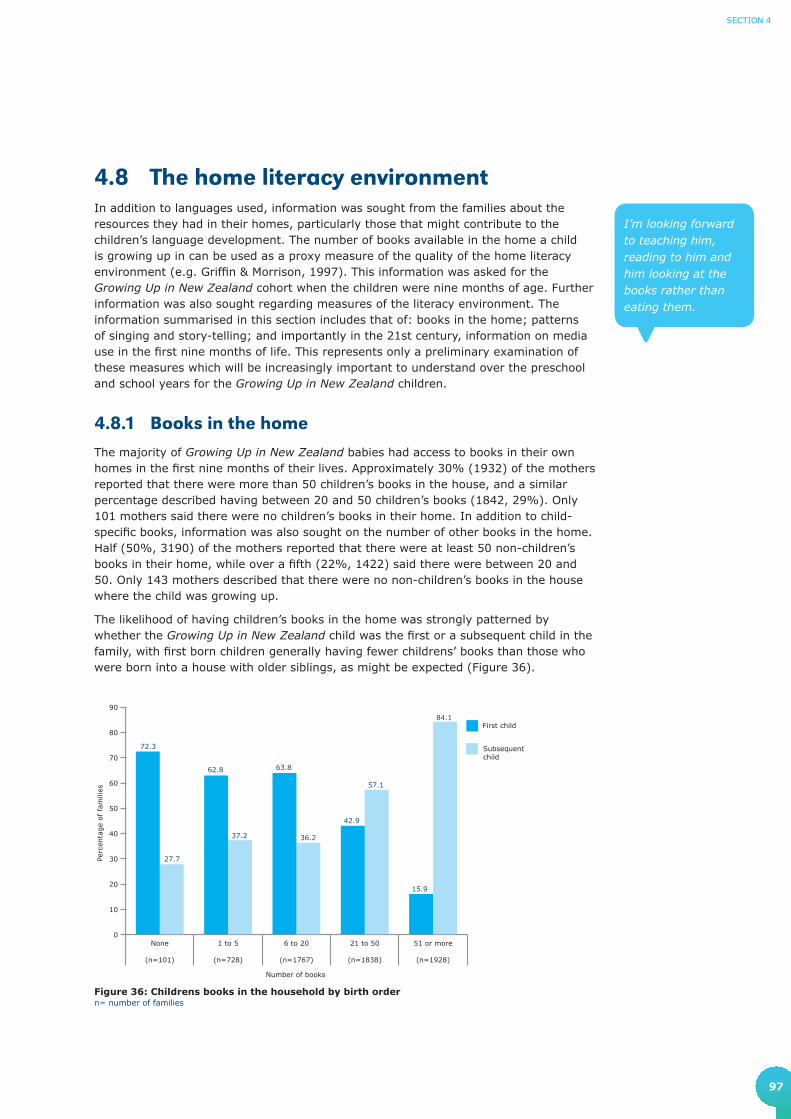
97
SECTION 4
4.8 The home literacy environment In addition to languages used, information was sought from the families about the resources they had in their homes, particularly those that might contribute to the children’s language development. The number of books available in the home a child is growing up in can be used as a proxy measure of the quality of the home literacy environment (e.g. Griffin & Morrison, 1997). This information was asked for the Growing Up in New Zealand cohort when the children were nine months of age. Further information was also sought regarding measures of the literacy environment. The information summarised in this section includes that of: books in the home; patterns of singing and story-telling; and importantly in the 21st century, information on media use in the first nine months of life. This represents only a preliminary examination of these measures which will be increasingly important to understand over the preschool and school years for the Growing Up in New Zealand children.
4.8.1 Books in the homeThe majority of Growing Up in New Zealand babies had access to books in their own homes in the first nine months of their lives. Approximately 30% (1932) of the mothers reported that there were more than 50 children’s books in the house, and a similar percentage described having between 20 and 50 children’s books (1842, 29%). Only 101 mothers said there were no children’s books in their home. In addition to child-specific books, information was also sought on the number of other books in the home. Half (50%, 3190) of the mothers reported that there were at least 50 non-children’s books in their home, while over a fifth (22%, 1422) said there were between 20 and 50. Only 143 mothers described that there were no non-children’s books in the house where the child was growing up.
The likelihood of having children’s books in the home was strongly patterned by whether the Growing Up in New Zealand child was the first or a subsequent child in the family, with first born children generally having fewer childrens’ books than those who were born into a house with older siblings, as might be expected (Figure 36).
I’m looking forward to teaching him, reading to him and him looking at the books rather than eating them.
0
10
20
30
40
50
60
70
80
90
Subsequentchild
First child
51 or more
(n=1928)
21 to 50
(n=1838)
6 to 20
(n=1767)
1 to 5
(n=728)
None
(n=101)
72.3
62.8 63.8
42.9
15.9
27.7
37.2 36.2
57.1
84.1
Perc
enta
ge
of
fam
ilies
Number of books
Figure 36: Childrens books in the household by birth ordern= number of families

98
GrowinG Up in new Zealand - now we are born 2012
4.8.2 Reading, singing and telling stories Over half the babies in the Growing Up in New Zealand cohort were having books read to them at least once a day by their mothers when nine months old (3347, 52% of mothers). There were 1025 mothers (16%) who reported seldom or never reading to their babies. Partners were less likely to read to their babies as frequently as mothers. More than one-third of partners (1543, 38%) reported that they seldom or never read to their babies compared to the 23% (933) of partners who were reading to the babies at least once a day (Table 22).
Table 22: Frequency of reading books and singing songs or telling stories at nine months
Mother report
n (Column%)
Partner report
n (Column%)
Read books to the baby N=6381 N=4086
Seldom or never 1025 (16.1) 1543 (37.8)
Once a week 579 (9.1) 697 (17.1)
Several times a week 1430 (22.4) 913 (22.3)
Once a day 2239 (35.1) 722 (17.7)
Several times a day 1108 (17.4) 211 (5.2)
Sing songs or tell stories to the baby N=6380 N=4083
Seldom or never 234 (3.7) 621 (15.2)
Once a week 228 (3.6) 482 (11.8)
Several times a week 804 (12.6) 964 (23.6)
Once a day 1749 (27.4) 1002 (24.5)
Several times a day 3365 (52.7) 1014 (24.8)
The proportion of mothers reading to their babies every day differed for mothers of different ethnic groups, although the differences were small. Babies born to Asian mothers were the least likely to be read to daily (429, or 43% of Asian mothers), and babies of New Zealand European mothers were the most likely to be read to on a daily basis (2317, or 57% of New Zealand European mothers) (Figure 37).
It’s great singing to him and listening to him singing along. Making his noises.

99
SECTION 4
0
10
20
30
40
50
60
70
80
90
100 Daily
Weekly
Seldomor never
Other
(n=38)
MELAA*
(n=144)
Asian
(n=991)
PacificPeoples
(n=1012)
Māori
(n=1121)
New ZealandEuropean
(n=4089)
Perc
ent
(%)
56.743.5 50.2
43.344.4
55.3
31.7
34.2
31.0
31.6 30.6
26.3
11.7
22.318.8
25.1 25.018.4
(b) Partner
Figure 37: Frequency of reading books to the baby by parental ethnicity
*MELAA - Middle Eastern, Latin American or African
(a) Mother
0
10
20
30
40
50
60
70
80
90
100Daily
weekly
Seldomor never
Other
(n=14)
MELAA*
(n=91)
Asian
(n=548)
PacificPeoples
(n=483)
Māori
(n=571)
New ZealandEuropean
(n=2909)
Perc
ent
(%)
24.220.5 22.4 20.8
15.421.4
41.9
37.038.3
29.9
30.8
42.9
33.9
42.639.3
49.353.9
35.7
Over half of all the mothers (3365, 53%) reported singing or telling stories to their babies several times a day, and over a quarter (1749, 27%) reported doing so daily. Only 3.7% (234) of the mothers said that they seldom or never sang or told stories to their baby (Table 22).

100
GrowinG Up in new Zealand - now we are born 2012
The proportions of parents singing or telling stories to their babies on a regular basis did not differ markedly by mothers ethnicity (Figure 38).
(b) Partner
Figure 38: Frequency of singing songs or telling stories to the baby by parental ethnicity
*MELAA - Middle Eastern, Latin American or African
(a) Mother
0
10
20
30
40
50
60
70
80
90
100Daily
Weekly
Seldomor never
Other
(n=38)
MELAA*
(n=144)
Asian
(n=991)
PacificPeoples
(n=1012)
Māori
(n=1121)
New ZealandEuropean
(n=4088)
Perc
ent
(%)
80.178.0 79.3
81.2
87.5 86.8
16.3 17.317.8 15.0
9.0 5.3
3.6 4.7 3.0 3.7 3.57.9
0
10
20
30
40
50
60
70
80
90
100Daily
Weekly
Seldomor never
Other
(n=14)
MELAA*
(n=91)
Asian
(n=547)
PacificPeoples
(n=483)
Māori
(n=571)
New ZealandEuropean
(n=2907)
Perc
ent
(%)
47.254.3
59.052.1 52.8
42.9
37.7
31.4
31.7
29.4 26.4 50.0
15.1 14.49.3
18.5 20.9
7.1

101
SECTION 4
4.8.3 Interaction with media in the first nine months of life
Given that the children who make up the Growing Up in New Zealand cohort have been born at a time where the use of media and technology is changing rapidly, gathering information about the children’s use of media and technology will be important throughout this study, especially as there is much evidence about the negative adolescent and adult outcomes that are associated with long hours of television watching for children who were followed up in earlier New Zealand longitudinal studies (Hancox, Milne, & Poulton, 2004).
At the nine month interview parents were asked how often their children watched children’s television, videos or DVDs, and how often a television was turned on in the room the children were in. A majority of mothers (3957, 62%) reported that their children seldom or never watched videos or DVDs. One in five mothers (20%, 1260) reported that their children watched videos or DVDs weekly, and a similar proportion (18%, 1163) reported that their babies watched videos or DVDs daily. Just under half of the mothers (48%, 3052) reported that their children seldom or never watched children’s television programmes. One in five mothers (20%, 1308) reported that their children watched children’s television programmes weekly, and nearly a third (32%, 2016) reported that their children watched children’s television programmes every day. Approximately three-quarters of mothers (76%, 4856) reported that the television was on in the same room as the baby on a daily basis, while less than one in 10 mothers (7.4%, 469) reported that this seldom or never happened.
Even at the age of nine months, exposure to technology is already very common for the children in the Growing Up in New Zealand cohort. The influence of media and new technology on children is a current issue for both research and policy focus in New Zealand and internationally. The American Academy of Pediatrics Committee on Public Education (2001) recommends that children under two spend little-to-no time watching television. The impact of background television on preschoolers is an area of considerable research interest. This will be an important area to follow up over time, in terms of the children’s interaction with media and new technology, but also the associations this might have with children’s development across multiple domains.
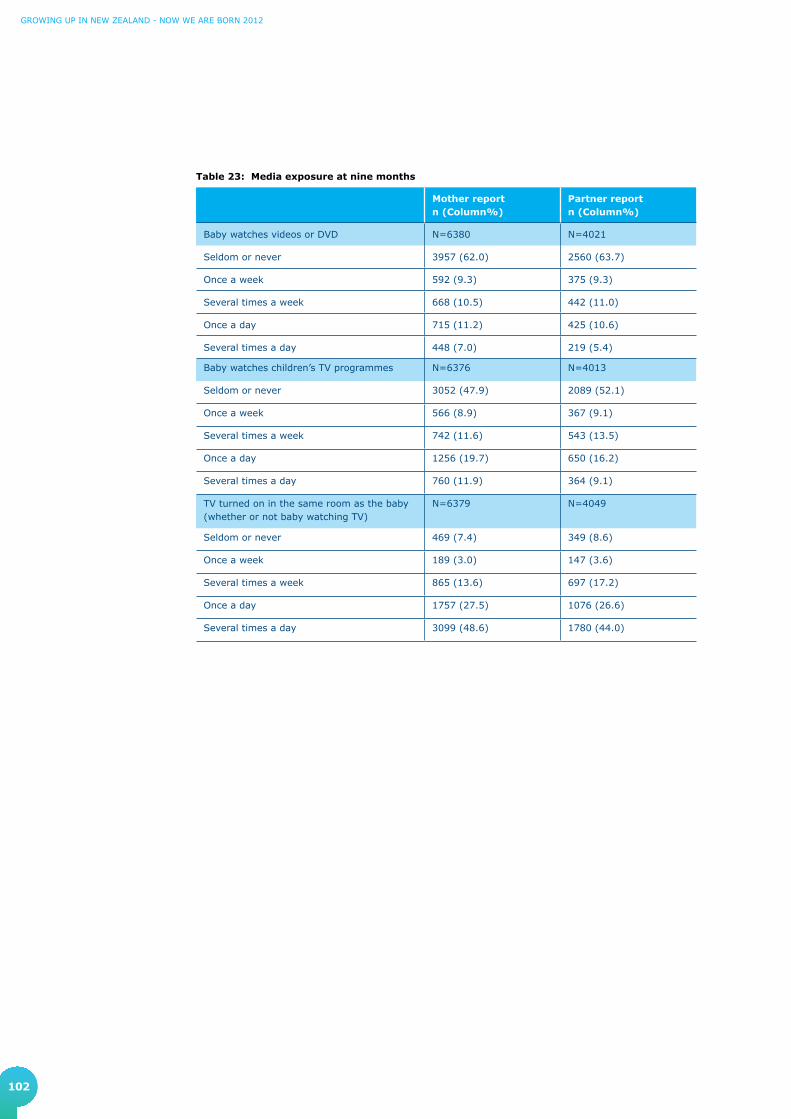
102
GrowinG Up in new Zealand - now we are born 2012
Table 23: Media exposure at nine months
Mother report n (Column%)
Partner report n (Column%)
Baby watches videos or DVD N=6380 N=4021
Seldom or never 3957 (62.0) 2560 (63.7)
Once a week 592 (9.3) 375 (9.3)
Several times a week 668 (10.5) 442 (11.0)
Once a day 715 (11.2) 425 (10.6)
Several times a day 448 (7.0) 219 (5.4)
Baby watches children’s TV programmes N=6376 N=4013
Seldom or never 3052 (47.9) 2089 (52.1)
Once a week 566 (8.9) 367 (9.1)
Several times a week 742 (11.6) 543 (13.5)
Once a day 1256 (19.7) 650 (16.2)
Several times a day 760 (11.9) 364 (9.1)
TV turned on in the same room as the baby (whether or not baby watching TV)
N=6379 N=4049
Seldom or never 469 (7.4) 349 (8.6)
Once a week 189 (3.0) 147 (3.6)
Several times a week 865 (13.6) 697 (17.2)
Once a day 1757 (27.5) 1076 (26.6)
Several times a day 3099 (48.6) 1780 (44.0)

103
SECTION 4
4.9 Household tenure and mobilityIn addition to the resources available for children from their parents and family and within their households, it is also important to track the stability and quality of these environments over time. This section considers the mobility of the Growing Up in New Zealand families between the antenatal and the nine month interviews and reports on how that mobility may have changed the household tenure status over that time.
4.9.1 Mobility of Growing Up in New Zealand familiesIn the antenatal report the families of the unborn children were a highly mobile group (Morton et al., 2010), in comparison to New Zealanders of all ages and with children internationally. At each point of contact with the Growing Up in New Zealand parents information is collected about where the child is living. This has important implications for retention and also informs the contextual information for the child over time.
Approximately a quarter (26%) of the Growing Up in New Zealand families had moved between the time of their antenatal and nine month interviews. Of these 1632 families that had moved, 84% (1362) had moved once, 12% (201) had moved twice, and the remaining 4.0% (62) had moved three or more times in the 12 month period.
The likelihood of a family moving in the time between pregnancy and the Growing Up in New Zealand child reaching nine months of age was influenced by the characteristics of the children and the families. Children were 50% more likely to live in families that had moved dwelling if they were the first child compared to a subsequent child (OR = 1.5, 95%CI 1.4-1.7) (Figure 39).
0
10
20
30
40
50
60
70
80
90
100Moved
Did not move
Subsequent child
(n=3614)
First child
(n=2750)
30.222.1
69.877.9
Perc
ent
(%)
Figure 39: Family mobility by childs birth order
We’re looking forward to owning a house, and not moving around any more. I don't want to make her feel that she has no sense of family, no fixed living place, because I felt that way.
We’re looking forward to moving into a new home, getting the kids embedded in a school and getting to know a community.
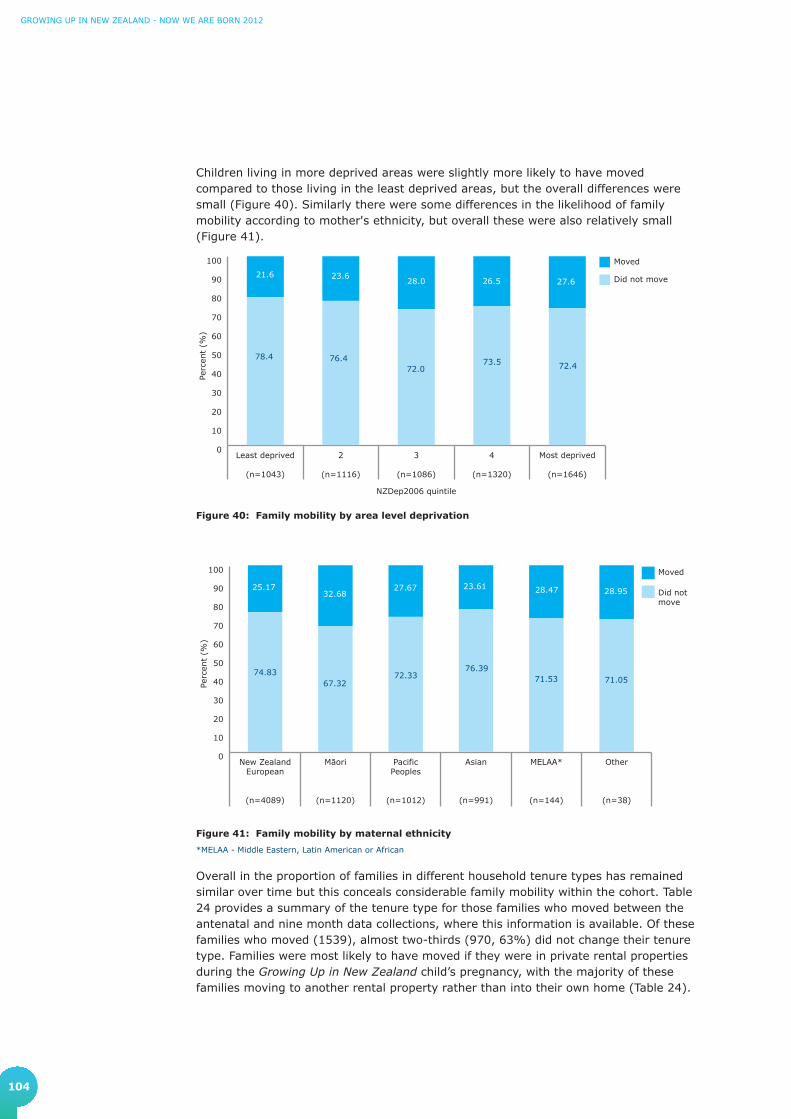
104
GrowinG Up in new Zealand - now we are born 2012
Children living in more deprived areas were slightly more likely to have moved compared to those living in the least deprived areas, but the overall differences were small (Figure 40). Similarly there were some differences in the likelihood of family mobility according to mother's ethnicity, but overall these were also relatively small (Figure 41).
Figure 40: Family mobility by area level deprivation
Figure 41: Family mobility by maternal ethnicity
*MELAA - Middle Eastern, Latin American or African
Overall in the proportion of families in different household tenure types has remained similar over time but this conceals considerable family mobility within the cohort. Table 24 provides a summary of the tenure type for those families who moved between the antenatal and nine month data collections, where this information is available. Of these families who moved (1539), almost two-thirds (970, 63%) did not change their tenure type. Families were most likely to have moved if they were in private rental properties during the Growing Up in New Zealand child’s pregnancy, with the majority of these families moving to another rental property rather than into their own home (Table 24).
Perc
ent
(%)
0
10
20
30
40
50
60
70
80
90
100 Moved
Did not move
Most deprived
(n=1646)
4
(n=1320)
3
(n=1086)
2
(n=1116)
Least deprived
(n=1043)
21.6 23.628.0 26.5 27.6
78.4 76.472.0
73.5 72.4
NZDep2006 quintile
Perc
ent
(%)
0
10
20
30
40
50
60
70
80
90
100 Moved
Did notmove
Other
(n=38)
MELAA*
(n=144)
Asian
(n=991)
PacificPeoples
(n=1012)
Māori
(n=1120)
New ZealandEuropean
(n=4089)
25.1732.68
27.67 23.61 28.47 28.95
74.8367.32
72.3376.39
71.53 71.05

105
SECTION 4
4.9.2 Changes in household tenureThe mobility of children and their families means that the distribution of household tenure of the families may have changed in the first year of the child’s life. Overall the proportions of families either renting (privately or publically), or who owned their own dwelling (usually with a mortgage) remained similar. As was reported before the children were born, nearly half of the Growing Up in New Zealand children continue to live in rented accommodation, the majority of which is private rental.
Figure 42: Household tenure for families Percentage of families that reported this information
The similarities in proportion of overall tenure type over time conceal the high level of family mobility. Table 24 provides a summary of the stability or otherwise of tenure over the almost 12 month period for those who moved where there are data for both time points. Of these families who moved (N=1539), almost two-thirds (970, 63%) did not change their tenure type. Families were most likely to have moved if they were in private rental properties during the Growing Up in New Zealand child’s pregnancy, with the majority moving to another rental property rather than into their own home (Table 24).
Table 24: Comparison of household tenure from pregnancy to nine months for families that moved
Household tenure – antenatal n(%)
Household tenure – 9 months n(%) Total
Family ownership Private rental Public rental
Family ownership 260 (16.9) 209 (13.6) 16 (1.0) 485 (31.5)
Private rental 240 (15.6) 660 (42.9) 40 (2.6) 940 (61.1)
Public rental 14 (0.9) 50 (3.3) 50 (3.3) 114 (7.4)
Total 514 (33.4) 919 (59.7) 106 (6.9) 1539 (100.0)
N=1539 with complete tenure information from antenatal and 9 month interviews
Agreement (diagonal) = 63% (95%CI: 60.6-65.4)
Public rental
Private rental
Family ownership
52.339.8
7.8
53.938.9
7.2
a. Antenatal b. Nine months
The best thing has been the fact that we have a new house and we can build a nest for the children, and the baby can have his own room.

106
GrowinG Up in new Zealand - now we are born 2012
4.10 Household environments Within Growing Up in New Zealand it is essential to understand measures of the home environment beyond those available from routine statistics (such as cross-sectional data collections like the census), or descriptive summary statistics. In this section preliminary insights are provided into household crowding, heating, damp and mould. Further value of this data will become more evident over time as changes in characteristics of the home environment are tracked alongside the development and wellbeing of the children themselves.
4.10.1 CrowdingHousehold crowding has been associated with an increased risk of childhood illness, especially communicable and vaccine-preventable diseases such as acute rheumatic fever (Jaine, Baker, & Venugopal, 2011) and meningococcal disease (Baker et al., 2000). The crowding measure for the Growing Up in New Zealand children at nine months is a simple, standard proxy measure that compares the number of people in the household and the number of available bedrooms. More detailed data on crowding are being collected for the cohort children.
In the families of the Growing Up in New Zealand children where information was available to calculate the crowding index during the child’s first year of life (6383 families): 12% (743) were in houses with two or more people per bedroom, considered to be high crowding; 60% (3803) were living in houses with one to less than two people per bedroom, considered to be medium crowding; and 29% (1837) of these babies were in houses with less than one person per bedroom (low crowding).
In New Zealand, household crowding differs by ethnicity and measures of socio-economic status (Ministry of Social Development, 2010). For the whole population Pacific Peoples are much more likely to live in crowded houses than any other ethnic group (43%), followed by Māori (23%), Asian (20%), and New Zealand European (4%) (Ministry of Social Development, 2010). Patterns of diseases that are linked to crowding also vary by ethnicity. Over time in this study we will be able to understand further the impact that crowding has on child health and development, alongside the contribution of multiple other contextual factors, most of which do not exist independently.
4.10.2 Heating in housesIn addition to the contribution of crowding to child health, ambient temperature and indoor temperature are also related to the likelihood of childhood morbidity and mortality in New Zealand (Taylor, 1991). In Growing Up in New Zealand information is sought from the parents about the types of heating used by the families throughout their houses as well as specifically in the children’s bedrooms. When the children were nine months of age the majority of mothers (89%, 5698) reported that their babies were living in homes that used some form of heating. There were 681 mothers (11% of homes) who reported that no heating was used in the houses where the Growing Up in New Zealand children lived. Children living in more deprived areas were more likely to live in homes where no heating was used (Figure 43).
The house is too small so we are thinking about moving. We have three children and the two of us, and we’re living in a two bedroom flat.

107
SECTION 4
Perc
ent
(%)
0
10
20
30
40
50
60
70
80
90
100 Household notheated
Household heated
Most deprived
(n=1644)
4
(n=1320)
3
(n=1085)
2
(n=1116)
Least deprived
(n=1044)
4.3 5.5 5.711.8
21.1
NZDep2006 quintile
95.7 94.5 94.388.2
78.9
Figure 43: Heating in childrens homes by area level deprivation
A first child was 30% more likely to live in a home that was heated compared to a subsequent child (OR = 1.3, 95%CI: 1.1-1.5).
Of the houses that were heated (5698), nearly nine out of 10 (5073, 89%) used electric heating and over a quarter (1579, 28%) used wood fired heating. Gas was the next most common source of heating for Growing Up in New Zealand homes with flued gas heating sources in 14% (810) of the households, and unflued (portable) gas heater usage reported for 12% (710) of households with heating (Figure 44).
Perc
ent
(%)
0
20
40
60
80
100
Other*WoodUnflued(portable) gas
Flued gasElectric
89.0
14.2 12.3
27.7
2.2
N=5698
Figure 44: Types of heating used in the homes where heating was used
*Includes coal, solar heating equipment, HRVMultiple response(s) and will total to more than 100%

108
GrowinG Up in new Zealand - now we are born 2012
Unflued gas heaters can pose a number of health risks, especially when they are used without adequate ventilation (Wickham, 2011). These heating sources have been associated with increased risk of asthma symptoms in particular (Pilotto et al., 2004).
Growing Up in New Zealand is well-placed to consider the associations between heating sources in the homes of the children with health outcomes from infancy throughout childhood. Because of the breadth and depth of information collected in this study over time, associations between heating, health and readiness for school can be considered in the light of the broader family and environmental context. For example as described in Section 4.12, 18% of the mothers of the child cohort reported tolerating ‘feeling cold’ to save on heating costs and this hardship may also impact on health and developmental outcomes for the child.
4.10.3 Household damp and mouldInformation was collected from the Growing Up in New Zealand parents about some of the features that are commonly associated with cold homes to add further detail to the heating information. This section summarises information that was collected about dampness and mould. Four out of five (5048, 80%) of the mothers reported that their babies were living in homes that were either never, hardly ever, or not very often damp, and a similar number (4975, 78%) reported that there was never, hardly ever or not very often heavy condensation in the room where the Growing Up in New Zealand baby usually slept. The remaining babies were living in a house that was quite often (943, 15%), always or almost always (350, 5.5%) damp, and were sleeping in a room that quite often (998, 16%), always or almost always (382, 6%) had heavy condensation (Table 25). In most cases, these factors tended to cluster. Families with damp houses were more likely to also report condensation in the room their baby slept in.
Table 25: Household dampness and condensation
Household dampness (N=6341)
n(Column%)
Heavy condensation in the room where baby sleeps at night (N=6355)
n(Column%)
Never or hardly ever 3197 (50.4) 3249 (51.1)
Not very often 1851 (29.2) 1726 (27.2)
Quite often 943 (14.9) 998 (15.7)
Always or almost always 350 (5.5) 382 (6.0)
I’m looking forward to moving to a house with no mould.

109
SECTION 4
Most families lived in houses which did not have mould or mildew in the baby’s room. However, the percentage of mothers who reported that their baby’s room was damp or had heavy condensation or mould did increase with increasing area level deprivation (Figure 45).
Figure 45: Household dampness by area level deprivation
Figure 46: Heavy condensation in the room where the babies sleep at night by area level deprivation
Perc
ent
(%)
0
10
20
30
40
50
60
70
80
90
100Always oralmost alwaysQuite often
Not very often
Never orhardly ever
Most deprived
(n=1635)
4
(n=1310)
3
(n=1075)
2
(n=1113)
Least deprived
(n=1039)
NZDep2006 quintile
63.455.1 52.7 47.0
40.7
26.129.9
29.430.7
28.9
8.2 12.4 13.916.6
20.2
2.3 2.64.0 5.7 10.2
Perc
ent
(%)
0
10
20
30
40
50
60
70
80
90
100Always oralmost always
Quite often
Not very often
Never orhardly ever
Most deprived
(n=1639)
4
(n=1315)
3
(n=1079)
2
(n=1112)
Least deprived
(n=1041)
NZDep2006 quintile
61.455.0 54.5
47.643.0
26.7
28.4 26.727.6
26.4
9.613.8 14.4
18.619.6
2.3 2.94.5 6.2 11.0
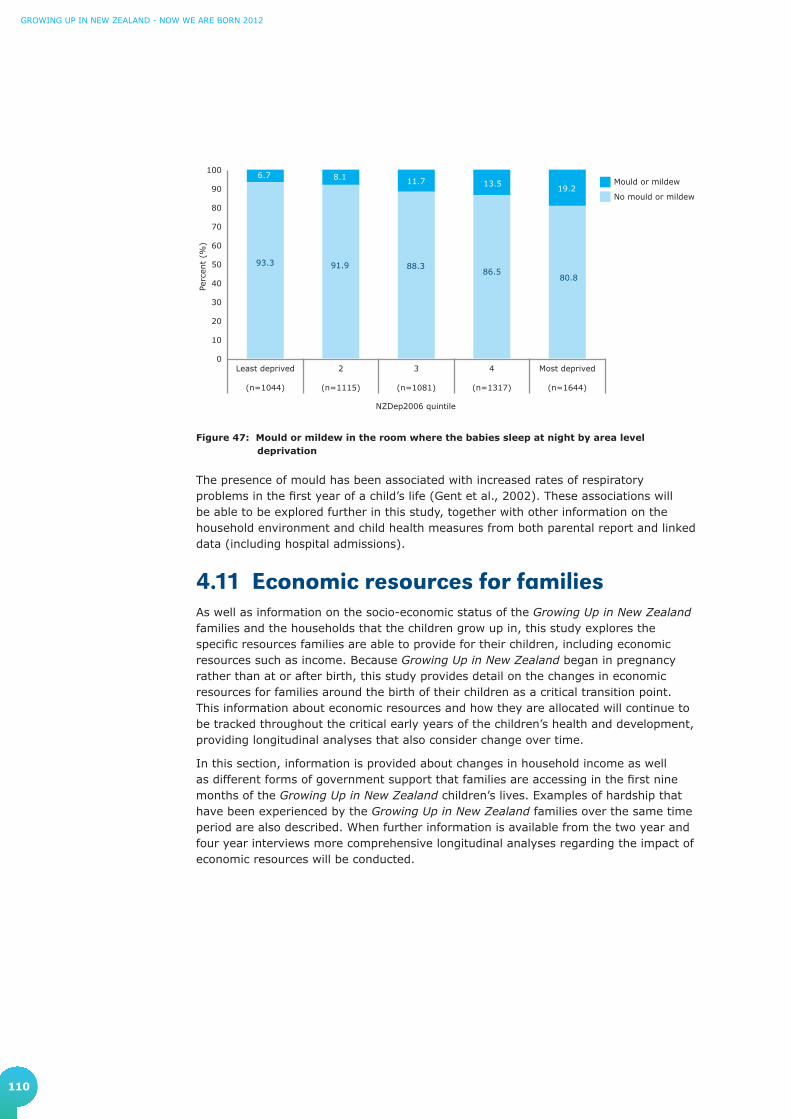
110
GrowinG Up in new Zealand - now we are born 2012
Figure 47: Mould or mildew in the room where the babies sleep at night by area level deprivation
The presence of mould has been associated with increased rates of respiratory problems in the first year of a child’s life (Gent et al., 2002). These associations will be able to be explored further in this study, together with other information on the household environment and child health measures from both parental report and linked data (including hospital admissions).
Perc
ent
(%)
0
10
20
30
40
50
60
70
80
90
100Mould or mildew
No mould or mildew
Most deprived
(n=1644)
4
(n=1317)
3
(n=1081)
2
(n=1115)
Least deprived
(n=1044)
NZDep2006 quintile
93.3 91.9 88.386.5
80.8
6.7 8.1 11.7 13.519.2
4.11 Economic resources for familiesAs well as information on the socio-economic status of the Growing Up in New Zealand families and the households that the children grow up in, this study explores the specific resources families are able to provide for their children, including economic resources such as income. Because Growing Up in New Zealand began in pregnancy rather than at or after birth, this study provides detail on the changes in economic resources for families around the birth of their children as a critical transition point. This information about economic resources and how they are allocated will continue to be tracked throughout the critical early years of the children’s health and development, providing longitudinal analyses that also consider change over time.
In this section, information is provided about changes in household income as well as different forms of government support that families are accessing in the first nine months of the Growing Up in New Zealand children’s lives. Examples of hardship that have been experienced by the Growing Up in New Zealand families over the same time period are also described. When further information is available from the two year and four year interviews more comprehensive longitudinal analyses regarding the impact of economic resources will be conducted.

111
SECTION 4
4.11.1 Household income over the first nine monthsThe distribution of household income available in homes where the Growing Up in New Zealand children were living changed in a non-systematic way between late pregnancy and over the first nine months of the child’s life. In pregnancy, approximately one in three (1593, 31%) households had an annual income between $30,000 and $70,000. When the babies were nine months old 40% (2189) of families were in this household income bracket. In pregnancy, 18% (914) of families were in households that earned $100,001-$150,000, but by the time the babies were nine months old, there were only 8% (440) of households in this household income bracket. The percentage of families earning $30,000 or less remained similar, 9.9% and 11% respectively. The percentage of households in the top income bracket (over $150,000 per annum) was also similar in the antenatal period and when the babies were nine months old (19% and 18%, respectively).
Figure 48: Changes in household income (per annum)
0
5
10
15
20
25
Nine Month
Antenatal
>$150
,000
$100
,001
–$15
0,00
0
$70,
001–
$100
,000
$50,
001–
$70,
000
$30,
001–
$50,
000
$20,
001–
$30,
000
<$20,
001
Perc
ent
(%)
4.35.6
14.1
16.5
23.0
17.5
19.0
4.6
6.3
18.3
21.622.9
8.0
18.2
My husband’s business has taken off, so financially we’ve been a lot better so there is more stability for our daughter, and we're more comfortable. I feel more stable, which affects how I mother her.

112
GrowinG Up in new Zealand - now we are born 2012
The number and type of income sources were sought for the first nine months of the Growing Up in New Zealand children’s lives. The sources were diverse and some households received income from multiple sources. Over four out of five (5286, 83%) households had received income from wages or salaries, 45% (2829) had received paid parental leave payments, and 43% (2719) had received family tax credits (e.g. Working for Families). Nearly a quarter (1462, 23%) had received income through self-employment, and 19% (1232) had received income from investments. Just under one in five (1151, 18%) had received income from an unemployment, sickness, invalid, or domestic purposes benefit. A further 6% (364) of households received child support payments. Households also reported receiving income from ACC, other insurers, superannuation, pensions, or student allowances. Very few had received no income since the birth of their baby.
An unexpected finding was the number of income sources on which the households were reliant on during the first nine months of their child’s lives. Only 14% (856) received income from a single source, 38% (2391) received income from two sources, 31% (1944) from three, 13% (814) from four sources and over 5% (341) of families received income from five or more sources.
Table 26: Household income source(s)
Household income sourceN=6346
n (%)
Wages, salary, commissions, bonuses, etc, paid by an employer 5286 (83.3)
Paid parental leave 2829 (44.6)
Family tax credits (e.g. Working for Families) 2719 (42.8)
Self-employment or business 1462 (23.0)
Interest, dividends, rent, other investments 1232 (19.4)
Domestic purposes benefit 723 (11.4)
Child support payments 364 (5.7)
Unemployment benefit 354 (5.6)
Sickness benefit, invalids benefit 268 (4.1)
Student allowance (including scholarships or stipends) 223 (3.5)
Other government benefits (including ACC, other government support such as NZ superannuation or veteran’s pension)
702 (11.1)
Other sources of income 343 (5.4)
Multiple response(s), therefore will total to more than 100%

113
SECTION 4
4.11.2 Working for FamiliesAt the antenatal interview, just over three-quarters of mothers (4731, 77%) reported being aware of the Working for Families tax credits. Of those who were aware of the Working for Families tax credits in pregnancy, almost 30% (1399) were already receiving these tax credits, and just over half (2403, 51%) expected to receive these tax credits once their Growing Up in New Zealand child was born (Morton et al., 2010).
When the Growing Up in New Zealand children were nine months old a total of 2719 mothers reported receiving the Working for Families tax credits. Many mothers in this study have yet to return to paid employment, so information regarding access to Working for Families (and comparison with antenatal expectations for this income support) will be assessed in detail after later data collections.
4.12 Economic situation and hardshipAt the time that the children in the Growing Up in New Zealand cohort were born New Zealand entered a period of economic recession. Therefore when the children were nine months of age their parents were asked how their families had been affected by the recession, and importantly, how they felt the economic climate may affect their ability to provide for their young children. They were also asked to comment on expectations for their own financial situation in the future as well as the economic future of New Zealand.
4.12.1 Economic situationOf all the mothers of the Growing Up in New Zealand babies, 42% (2558) reported that they thought the general economic situation in New Zealand (in 2010/11) was worse than it was 12 months before. However there was general optimism about the future, with the majority of mothers (3506, 57%) expecting that the general economic situation would be better in 12 months’ time compared to only 13% (771) who expected it would be worse.
Just under half (2833, 45%) of the mothers reported that their household financial situation was worse when their children were aged nine months than it had been 12 months before, and 68% (4272) expected that their household financial situation would improve in the following year. However 56% (3523) of the mothers did not attribute their current financial situation to the general economic situation, whereas one-third (2200, 35%) did feel that the general economic situation had impacted negatively on their personal financial situation (Figure 49).
The recession has had a financial impact on us, which has caused stress.

114
GrowinG Up in new Zealand - now we are born 2012
Figure 49: Perceptions of the impact of the national economy for families
A Lot Better
A Little Better
About The Same
A Little Worse
A Lot Worse
How do you think the general economic situation in the country now compares with 12 months ago? (N=6128)
What are your expectations for the general economic situation in 12 months’ time? (N=6105)
12.5
29.3
28.5
27.9
1.8
3.98.8
29.9
44.1
13.3
How do you think your household financial situation compares with 12 months ago? (N=6285)
14.1
31
29.8
18.5
6.7
1.4
4.2
26.1
40.3
27.9
What are your expectations for your household financial situation in 12 months’ time? (N=6264)
7.8
27.4
56.4
7.3
1.1
Has the general economic situation made your personal financial circumstances ... ? (N=6246)

115
SECTION 4
4.12.2 HardshipDespite general optimism about the national economic situation and personal finances, many of the Growing Up in New Zealand children are nevertheless growing up in families that are currently experiencing a degree of relative disadvantage. Mothers were asked to answer specific questions that are used to assess individual level deprivation (Salmond, King, Crampton, & Waldegrave, 2005). These are presented in raw form here, but will be used further to consider their effects on child development when more longitudinal data is available.
With respect to the preceding 12 months, half (3185, 50%) of the Growing Up in New Zealand mothers reported that they had been forced to buy cheaper food in order to afford other necessities, and nearly one in five (1170, 18%) reported ‘putting up with feeling cold’ to save on heating costs. A small number (338, 5.3%) of Growing Up in New Zealand families had received help in the form of basic necessities from community organisations, and 13% (825) reported having used food grants or food banks (Figure 50). Less than half of the families did not report any of these measures of relative disadvantage (44%, 2778), 29% (1866) reported only one, 13% (834) reported two and 14% (903) reported three or more of these.
Figure 50: Mothers of the babies who reported relative disadvantage in the first nine months Percentage of mothers who reported this information
0 10 20 30 40 50
Received help in the form of food, clothes or money from acommunity organisation (i.e the Salvation army)
(N=6380)
Continued wearing shoes with holes becauseyou could not a�ord replacements?
(N=6377)
Gone without fresh fruit and vegetables often,so that you could pay for other things you needed?
(N=6379)
Made use of special food grants or food banks becauseyou did not have enough money for food?
(N=6370)
Put up with feeling cold tosave heating costs?
(N=6376)
Been forced to buy cheaper food so that youcould pay for other things you needed?
(N=6375)50.0
18.4
13.0
12.5
10.8
5.3
Trying to get the simple things like nappies and food for him is a challenge. We are coping but we have had to cut out our personal things to cater for his needs.
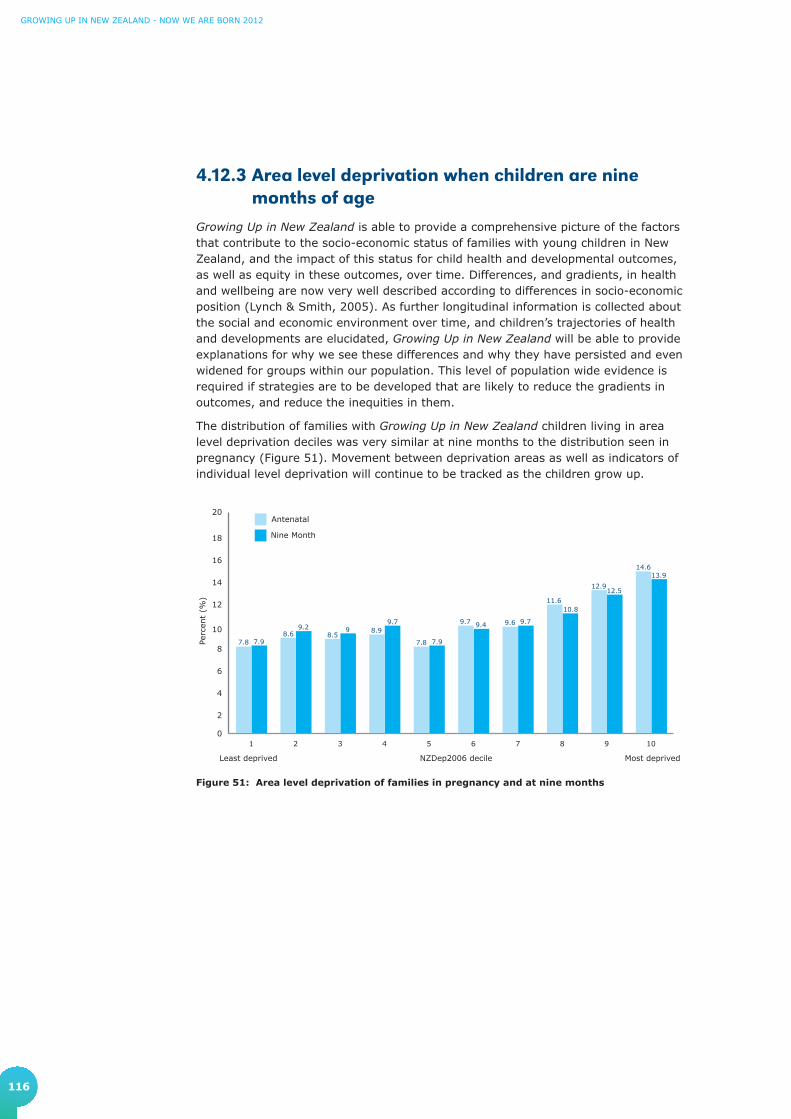
116
GrowinG Up in new Zealand - now we are born 2012
4.12.3 Area level deprivation when children are nine months of age
Growing Up in New Zealand is able to provide a comprehensive picture of the factors that contribute to the socio-economic status of families with young children in New Zealand, and the impact of this status for child health and developmental outcomes, as well as equity in these outcomes, over time. Differences, and gradients, in health and wellbeing are now very well described according to differences in socio-economic position (Lynch & Smith, 2005). As further longitudinal information is collected about the social and economic environment over time, and children’s trajectories of health and developments are elucidated, Growing Up in New Zealand will be able to provide explanations for why we see these differences and why they have persisted and even widened for groups within our population. This level of population wide evidence is required if strategies are to be developed that are likely to reduce the gradients in outcomes, and reduce the inequities in them.
The distribution of families with Growing Up in New Zealand children living in area level deprivation deciles was very similar at nine months to the distribution seen in pregnancy (Figure 51). Movement between deprivation areas as well as indicators of individual level deprivation will continue to be tracked as the children grow up.
Figure 51: Area level deprivation of families in pregnancy and at nine months
0
2
4
6
8
10
12
14
16
18
20
Nine Month
Antenatal
10987654321
Perc
ent
(%)
7.88.6 8.5
8.9
7.8
9.7 9.6
11.6
12.9
14.6
7.9
9.2 99.7
7.9
9.4 9.7
10.8
12.5
13.9
NZDep2006 decileLeast deprived Most deprived
117
5. Highlights and challenges for the parents of the Growing Up in New Zealand children

118
GROWING UP IN NEW ZEALAND - NOW WE ARE BORN 2012
5. Highlights and challenges for the parents of the Growing Up in New Zealand children
At the conclusion of the nine month interviews we gave parents the opportunity to reflect on the important highlights and challenges they had faced since their babies were born, and what they were looking forward to the most in the next year of their child’s life. A summary of the most frequent responses is provided in this section.
5.1 Looking backFor many parents, being able to watch their children achieve new milestones was a real highlight of their child’s first nine months. This included seeing their child smile for the first time, say their first word, hearing them laugh and seeing them start to crawl. Some mentioned enjoying watching their baby’s personality emerge and being able to interact more with them as they grew up.
Parents also described how the baby had brought happiness to their family as one of the highlights of the last nine months. For those having their first child, a highlight was ‘becoming a family’ and the parents of first babies talked about how they were enjoying ‘learning to be a parent’. Those babies with older siblings were often described by their parents as having ‘completed the family’, and their parents were enjoying observing the development of a relationship between the Growing Up in New Zealand baby and their siblings. Those parents with more than one child also noted how much more confident they were being the parent of the Growing Up in New Zealand baby compared to their earlier children, however they also discussed challenges around needing to be more organised, balancing their time between all their children, and coping with sibling rivalry.
Parents often used discussing their highlights and challenges as a moment to reflect upon how the baby had changed them. Both mothers and partners often expressed positive feelings about being a parent, suggesting that having a new baby in their life provided different priorities, had made them ‘better people’, and they referred to the pleasure of being ‘needed’. However, while re-prioritising their lives was a highlight for many, this was also described as a challenge by some parents. Both parents often mentioned missing having time to themselves or as a couple.
Some mothers described feeling drained by the need to be constantly caring for someone, and feeling like they weren’t always coping. A common challenge for mothers of the Growing Up in New Zealand babies was a ‘loss of self’ and a lack of independence. In some cases this was described particularly in relation to not working and/or being at home ‘all the time’.
It is hard losing yourself and wholeheartedly caring for someone else, and the selflessness that comes with that - losing my prior identity and coming to terms with my new identity as a mother in all its forms.
I was present at his birth and held him straight away. Whenever he smiles at me, it's really amazing.
I was worried about how I would be as a father, but all the sleepless nights have been worth it.
The biggest challenge would be the lack of sleep.

119
SECTION 5
Mothers rather than partners were more likely to discuss how they had helped to shape the development and personality of their baby as a highlight. Mothers were also more likely to be challenged by feeling a lack of confidence with their baby as well as the difficulties of not always understanding their baby’s needs, and feeling the constant challenge to be a good, or ‘good enough’, parent.
Many partners mentioned pleasure in the fact that their role in the baby’s life was beginning to become more significant. Partners were also more likely to mention the demands on their time as a challenge, some struggled to find the best way to provide support, and partners also described the difficulties of balancing work and family, and the increased responsibility they felt. For those mothers who had returned to work, leaving their baby was frequently described as a challenge. The difficulties of the increased financial pressure placed upon the family by having a reduced income and/or more dependents were described by both parents.
Partners were much more likely to mention being challenged by the sound of their baby crying, while both parents often described the difficulties around sleep deprivation and getting their baby to sleep.
5.2 Looking forwardIn the year ahead, parents were looking forward to their child achieving new milestones, including walking and talking and looking forward to seeing personalities develop further. The parents were looking forward to their baby being able to talk more, so that they could better understand their child’s wants and needs. They were looking forward to their baby becoming more sociable, and very much looking forward to the babies sleeping through the night. Sometimes parents mentioned looking forward to specific events, such as their baby going swimming, going on a holiday, to the beach, or being introduced to family members overseas for the first time.
Mothers particularly talked about looking forward to their baby having increasing independence, and not being so reliant on the mother themselves. Some mothers were looking forward to returning to work in the next year and if this was the case, often both partners talked about how this would improve the family’s financial situation. Partners often saw the year ahead as an opportunity for them to spend more time with their child, and both parents were looking forward to having more time for themselves and each other. Both parents often described looking forward to being able to get out more with their baby and doing things together as a family. Some parents also anticipated that they were looking forward to their baby being cared for by someone else – including looking forward to their child’s first experience, and interactions, in a formal child care arrangement.
Overall, the Growing Up in New Zealand parents reported a variety of highlights and challenges as they looked back over the first nine months of their children’s lives and looked forward to the year ahead. We also look forward to continuing to add the valuable parents’ perspectives to the wealth of information we collect about them and their children as they grow up in New Zealand today.
I want to see more of her personality coming through. I want to get to know her better. I want to be a part of her development and help her shape who she is, be her guardian and be part of her life, to be a part of her exploring this world and learn about things together. I want to see myself evolving with her.
I am proud of myself that I am a good mother to him and I am able to look after him. I know that I do my best looking after him.

120
GROWING UP IN NEW ZEALAND - NOW WE ARE BORN 2012
References
Abeywardana, S. (2007). Report of the Australian and New Zealand Neonatal Network 2005. Sydney: ANZNN.
American Academy of Pediatrics Committee on Public Education. (2001). Children, adolescents, and television. Pediatrics, 107, 423-426.
Baker, M., McNicholas, A., Garrett, N., Jones, N., Stewart, J., Koberstein, V., & Lennon, D. (2000). Household crowding a major risk factor for epidemic meningococcal disease in Auckland children. Pediatric Infectious Disease Journal, 19(10), 983-990.
Baker, M., Telfar Barnard, L., Zhang, J., Verrall, A., & Howden-Chapman, P. (2010). Close-contact infectious diseases in New Zealand: Trends and ethnic inequalities in hospitalisations, 1989 to 2008. Wellington: Housing and Health Research Programme, University of Otago.
Barker, D.J.P. (1998). Mothers, Babies and Health in Later Life (2nd ed.). Edinburgh: Churchill Livingstone.
Belsky, J., Burchinal, M., McCartney, K., Lowe Vandell, D., Clarke-Stewart, K.A., Tresch Own, M., & The NICHD Early Child Care Research Network. (2007). Are there long-term effects of early child care? Child Development, 78(2), 681-701.
Cox, J., Holden, J., & Sagovsky, R. (1987). Detection of postnatal depression. Development of the 10-item Edinburgh Postnatal Depression Scale. The British Journal of Psychiatry, 150(6), 782-786.
Craig, E., Thompson, J., & Mitchell, E. (2002). Socioeconomic status and preterm birth: New Zealand trends, 1980 to 1999. Archives of Disease in Childhood Fetal and Neonatal Edition, 86(3), F142.
Donoghue, D.A., & the ANZNN. (2003). The report of the Australian and New Zealand neonatal network, 2001. Syndey: ANZNN.
Gent, J.F., Ren, P., Belanger, K., Triche, E., Bracken, M.B., Holford, T.R., & Leaderer, B.P. (2002). Levels of household mold associated with respiratory symptoms in the first year of life in a cohort at risk for asthma. Environmental Health Perspectives, 110(12), A781.
Gluckman, P.D., & Hanson, M.A. (Eds.). (2006). Developmental origins of health and disease. New York: Cambridge University Press.
Grant, C.C., Pati, A., Tan, D., Vogel, S., Aickin, R., & Scragg, R. (2001). Ethnic comparisons of disease severity in children hospitalized with pneumonia in New Zealand. Journal of Paediatrics and Child Health, 37(1), 32-37.
Grant, C.C., Scragg, R., Tan, D., Pati, A., Aickin, R., & Yee, R.L. (1998). Hospitalization for pneumonia in children in Auckland, New Zealand. Journal of Paediatrics and Child Health, 34(4), 355-359.
Griffin, E.A., & Morrison, F.J. (1997). The unique contribution of home literacy environment to differences in early literacy skills 1. Early Child Development and Care, 127(1), 233-243.
Hancox, R.J., Milne, B.J., & Poulton, R. (2004). Association between child and adolescent television viewing and adult health: a longitudinal birth cohort study. Lancet, 364(9430), 257-262.
Harold, G. (2011). Families and children: A focus on parental separation, domestic violence and child maltreatment. In, Office of the Prime Minister's Science Advisory Committee (Ed.), Improving the Transition: Reducing Social and Psychological Morbidity During Adolescence. A report from the Prime Minister's Chief Science Advisor. (pp. 177-189). Wellington: Office of the Prime Minister's Science Advisory Committee.
Harrison, L., & Ungerer, J. (2005). What can the Longitudinal Study of Australian Children tell us about infants' and 4 to 5 year old's experiences of early childhood education and care? Family Matters, 72, 26-35.
Jaine, R., Baker, M., & Venugopal, K. (2011). Acute rheumatic fever associated with household crowding in a developed country. The Pediatric Infectious Disease Journal, 30(4), 315.
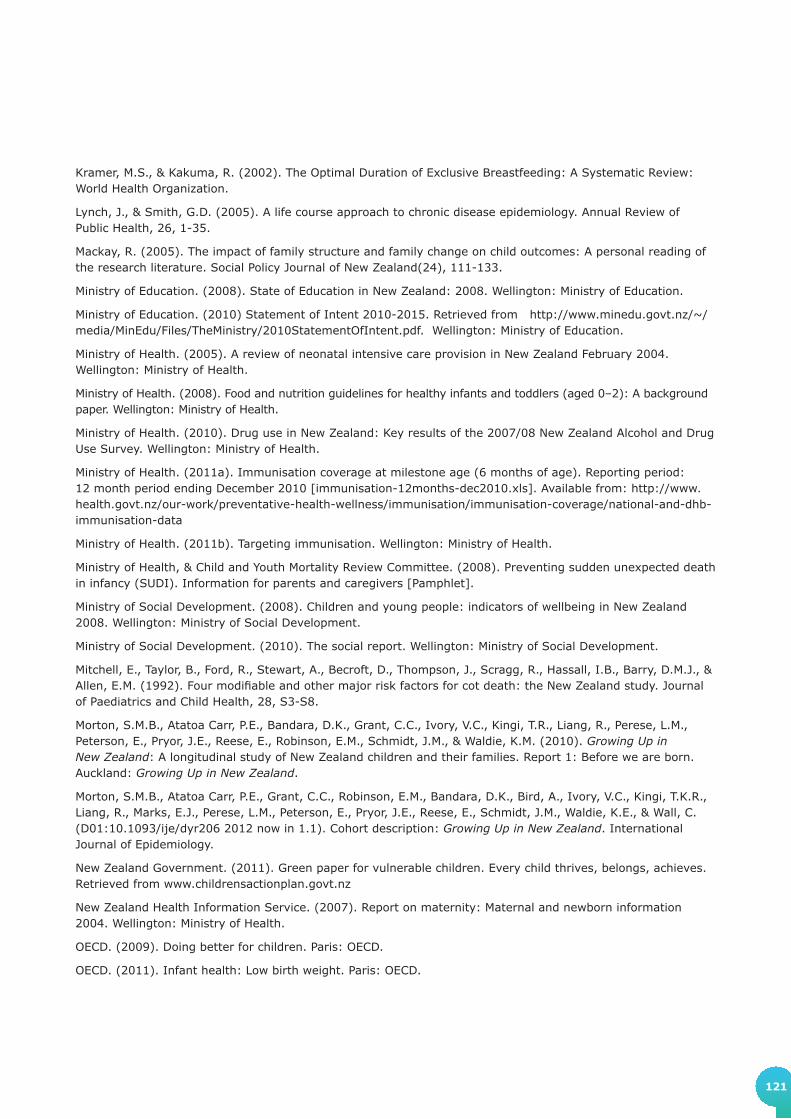
121
Kramer, M.S., & Kakuma, R. (2002). The Optimal Duration of Exclusive Breastfeeding: A Systematic Review: World Health Organization.
Lynch, J., & Smith, G.D. (2005). A life course approach to chronic disease epidemiology. Annual Review of Public Health, 26, 1-35.
Mackay, R. (2005). The impact of family structure and family change on child outcomes: A personal reading of the research literature. Social Policy Journal of New Zealand(24), 111-133.
Ministry of Education. (2008). State of Education in New Zealand: 2008. Wellington: Ministry of Education.
Ministry of Education. (2010) Statement of Intent 2010-2015. Retrieved from http://www.minedu.govt.nz/~/media/MinEdu/Files/TheMinistry/2010StatementOfIntent.pdf. Wellington: Ministry of Education.
Ministry of Health. (2005). A review of neonatal intensive care provision in New Zealand February 2004. Wellington: Ministry of Health.
Ministry of Health. (2008). Food and nutrition guidelines for healthy infants and toddlers (aged 0–2): A background paper. Wellington: Ministry of Health.
Ministry of Health. (2010). Drug use in New Zealand: Key results of the 2007/08 New Zealand Alcohol and Drug Use Survey. Wellington: Ministry of Health.
Ministry of Health. (2011a). Immunisation coverage at milestone age (6 months of age). Reporting period: 12 month period ending December 2010 [immunisation-12months-dec2010.xls]. Available from: http://www.health.govt.nz/our-work/preventative-health-wellness/immunisation/immunisation-coverage/national-and-dhb-immunisation-data
Ministry of Health. (2011b). Targeting immunisation. Wellington: Ministry of Health.
Ministry of Health, & Child and Youth Mortality Review Committee. (2008). Preventing sudden unexpected death in infancy (SUDI). Information for parents and caregivers [Pamphlet].
Ministry of Social Development. (2008). Children and young people: indicators of wellbeing in New Zealand 2008. Wellington: Ministry of Social Development.
Ministry of Social Development. (2010). The social report. Wellington: Ministry of Social Development.
Mitchell, E., Taylor, B., Ford, R., Stewart, A., Becroft, D., Thompson, J., Scragg, R., Hassall, I.B., Barry, D.M.J., & Allen, E.M. (1992). Four modifiable and other major risk factors for cot death: the New Zealand study. Journal of Paediatrics and Child Health, 28, S3-S8.
Morton, S.M.B., Atatoa Carr, P.E., Bandara, D.K., Grant, C.C., Ivory, V.C., Kingi, T.R., Liang, R., Perese, L.M., Peterson, E., Pryor, J.E., Reese, E., Robinson, E.M., Schmidt, J.M., & Waldie, K.M. (2010). Growing Up in New Zealand: A longitudinal study of New Zealand children and their families. Report 1: Before we are born. Auckland: Growing Up in New Zealand.
Morton, S.M.B., Atatoa Carr, P.E., Grant, C.C., Robinson, E.M., Bandara, D.K., Bird, A., Ivory, V.C., Kingi, T.K.R., Liang, R., Marks, E.J., Perese, L.M., Peterson, E., Pryor, J.E., Reese, E., Schmidt, J.M., Waldie, K.E., & Wall, C. (D01:10.1093/ije/dyr206 2012 now in 1.1). Cohort description: Growing Up in New Zealand. International Journal of Epidemiology.
New Zealand Government. (2011). Green paper for vulnerable children. Every child thrives, belongs, achieves. Retrieved from www.childrensactionplan.govt.nz
New Zealand Health Information Service. (2007). Report on maternity: Maternal and newborn information 2004. Wellington: Ministry of Health.
OECD. (2009). Doing better for children. Paris: OECD.
OECD. (2011). Infant health: Low birth weight. Paris: OECD.

122
GROWING UP IN NEW ZEALAND - NOW WE ARE BORN 2012
Pilotto, L.S., Nitschke, M., Smith, B.J., Pisaniello, D., Ruffin, R.E., McElroy, H.J., Martin, J., & Hiller, J.E. (2004). Randomized controlled trial of unflued gas heater replacement on respiratory health of asthmatic schoolchildren. International Journal of Epidemiology, 33(1), 208.
Reck, C., Struben, K., Backenstrass, M., Stefenelli, U., Reinig, K., Fuchs, T., Sohn, C., & Mundt, C. (2008). Prevalence, onset and comorbidity of postpartum anxiety and depressive disorders. Acta Psychiatrica Scandinavica, 118(6), 419-508.
Ross, L.E., Gilbert Evans, S. E., Sellers, E. M., & Romach, M. K. (2003). Measurement issues in postpartum depression part 1: Anxiety as a feature of postpartum depression. Archives of Women's Mental Health, 6(1), 51-57.
Rusconi, F., Galassi, C., Corbo, G.M., Forastiere, F., Biggeri, A., Ciccone, G., Renzoni, E., & The SIDRIA Collaborative Group. (1999). Risk factors for early, persistent, and late-onset wheezing in young children. American Journal of Respiratory and Critical Care Medicine, 160(5), 1617-1622.
Salmond, C., King, P., Crampton, P., & Waldegrave, C. (2005). NZiDep. A New Zealand index of socioeconomic deprivation for individuals. Wellington: University of Otago/ The Family Centre Social Policy Research Unit.
Spencer, N. (2003). Weighing the evidence. How is birthweight determined? Abingdon: Radcliffe Medical Press.
Spitzer, R.L., Kroenke, K., Williams, J.B.W., & Lowe, B. (2006). A brief measure for assessing generalized anxiety disorder: the GAD-7. Archives of Internal Medicine, 166(10), 1092.
Taylor, B. (1991). A review of epidemiological studies of sudden infant death syndrome in southern New Zealand. Journal of Paediatrics and Child Health, 27(6), 344-348.
UNICEF. (2007). Child poverty in perspective: an overview of child well-being in rich countries. Florence: UNICEF Innocenti Research Centre.
UNICEF. (2010). The children left behind: A league table of inequality in child well-being in the world's ricehst countries. Innocenti Report Card 9. Florence: Innocenti Research Centre.
Wickham, L. (2011). Review of Unflued LPG Cabinet Heaters in New Zealand. Air Quality and Climate Change, 45(1), 19.
World Health Organization. (2009). Infant and young child feeding: model chapter for textbooks for medical students and allied health professionals. Geneva: World Health Organization.

123
Growing Up in New Zealand publications
Morton, S.M.B. (and Morton Consortium). (2006). Longitudinal study of New Zealand children and their families: Development phase report 1: Conceptual framework and vision. Wellington: Ministry of Social Development.
Morton, S.M.B. (and Morton Consortium). (2006). Longitudinal study of New Zealand children and their families: Development phase report 2: proposed study design. Wellington: Ministry of Social Development.
Morton, S.M.B. (and Morton Consortium). (2006). Longitudinal study of New Zealand children and their families: Development phase report 3: Estimated budget for proposed study design. Wellington: Ministry of Social Development.
Morton, S.M.B (and Morton Consortium). (2007). Longitudinal study of New Zealand children and their families: Development phase report 4: Lessons from the field study. Wellington: Ministry of Social Development.
Morton, S.M.B. (2007). Longitudinal study of New Zealand children and their families: Development phase report 5: Revised study design. Wellington: Ministry of Social Development.
Shulruf, B., Morton, S., Goodyear-Smith, F., O’Loughlin, C. & Dixon, R. (2007). Designing multidisciplinary longitudinal studies of human development: Analyzing past research to inform methodology. Evaluation and the Health Professions, 30(3), 207-228.
Morton, S.M.B., Atatoa Carr, P.E., Bandara, D.K., Grant, C.C., Ivory, V.C., Kingi, T.R., Liang, R., Perese, L.M., Peterson, E., Pryor, J.E., Reese, E., Robinson, E.M., Schmidt, J.M., & Waldie, K.M. (2010). Growing Up in New Zealand: A longitudinal study of New Zealand children and their families. Report 1: Before we are born. Auckland: Growing Up in New Zealand.
Morton, S.M.B., Atatoa Carr, P.E., Grant, C.C., Robinson, E.M., Bandara, D.K., Bird, A., Ivory, V.C., Kingi, T.K.R., Liang, R., Marks, E.J., Perese, L.M., Peterson, E., Pryor, J.E., Reese, E., Schmidt, J.M., Waldie, K.E., & Wall, C. (D01:10.1093/ije/dyr206 2012). Cohort description: Growing Up in New Zealand. International Journal of Epidemiology.

124
GROWING UP IN NEW ZEALAND - NOW WE ARE BORN 2012
Glossary
ACC Accident Compensation Corporation of New Zealand
Antenatal Of or occurring before birth.
ART Assisted Reproductive Technologies
Barnardos New Zealand organisation providing child and family services, early child care and education, residential services, and advocacy programmes for children.
BMI Body Mass Index
CAPI Computer Assisted Personal Interview
CATI Computer Assisted Telephone Interview
CI Confidence Interval
DCW Data Collection Wave
DHB District Health Board
Domestic purposes benefit For this report, the domestic purposes benefit referred to is typically that available to sole parents supporting one or more dependent children in their household.
EDD Expected Date of Delivery
EDI Edinburgh Depression Inventory, based on the Edinburgh Postnatal Depression Scale
Exclusive breastfeeding Feeding only breast milk, (including expressed breast milk) and not any water, milk formula, other liquids, or solid food.
Gestational age The period of time between conception and birth, usually calculated from 14 days after the mothers last menstruation.
GP General Practitioner
GLM General Linear Model
HRC Health Research Council of New Zealand
Immunisation schedule The series of immunisations offered free to babies, children, adolescents and adults in the national immunisation programme offered in New Zealand. The immunisations relevant for this report are:
Age given Diseases covered and vaccines
6 weeks Diphtheria/Tetanus/Whooping cough/Polio/Hepatitis B
Haemophilus influenzae type b 1 injection (INFANRIX® -hexa)
Pneumococca 1 injection (Synflorix®)
3 months Diphtheria/Tetanus/Whooping cough/Polio/Hepatitis B
Haemophilus influenzae type b 1 injection (INFANRIX® -hexa)
Pneumococcal 1 injection (Synflorix®)
5 months
Diphtheria/Tetanus/Whooping cough/Polio/Hepatitis B
Haemophilus influenzae type b 1 injection (INFANRIX® -hexa)
Pneumococcal 1 injection (Synflorix®)

125
SECTION 2
Leading Light–Roopu Piata The first 200 families recruited into the study. The mothers of the Leading Light-Roopu Piata babies had an EDD between 24 November and 14 December 2008 and lived in the same study region at recruitment as the main cohort.
MELAA Middle Eastern, Latin American or African
MoH Ministry of Health
Neonatal The period of the first 28 days after birth.
NHI National Health Index
NICU Newborn Intensive Care Unit
NIR National Immunisation Register
NMDS National Minimum Data Set
NZDep2006 NZDep2006 is an area measure of socio-economic deprivation and combines nine variables from the 2006 census reflecting eight dimensions of deprivation (income, owned home, support, employment, qualifications, living space, communication and transport). NZDep2006 provides a deprivation score for each New Zealand meshblock – a geographical unit defined by Statistics New Zealand, containing a median of approximately 87 people in 2006. The NZDep2006 is presented in deciles in this report, with a value of 1 indicating those meshblocks in the least deprived 10 percent of all areas in New Zealand, and a value of 10 indicating the most deprived 10% of all areas. Also provided in this report are quintiles with values of 1 (least deprived 20%) to 5 (most deprived 20%). In this report the NZDep scores have also been divided into high (deciles 8-10), medium (deciles 4-7) and low deprivation (deciles 1-3). It should be notes that NZDep2006 deprivation scores apply to areas rather than individual people.
NZHIS New Zealand Health Information Service
OR Odds ratio
Parity Number of previous births for mother.
Perinatal Of or around the time of birth.
Plunket The Royal New Zealand Plunket Society (commonly known as ‘Plunket’) provide free support services for the development, health and wellbeing of children under five in New Zealand.
PORSE New Zealand organisation (Play Observe Relate Support Extend) offering in-home child care services, community play and learning programmes.
Pr(>F) The Pr(>F) indicates the significance of the association between the fitted model or the determinants and the outcome variable.
Pr(>|t|) The Pr(>|t|) indicates the significance of the association between the determinant and the outcome variable, where the determinant was a continuous variable. Where the determinant is a categorical variable, the Pr(>|t|) indicates the significance of the difference of the parameter estimate between the reference category and the tested category of the specific categorical variable.

126
GROWING UP IN NEW ZEALAND - NOW WE ARE BORN 2012
Preterm Childbirth occurring at less than 37 weeks of gestation.
Postnatal Of or occurring after birth.
Post-term Childbirth occurring after 41 completed weeks of gestation.
R2 The model R2 is an estimate of the amount of the variation in the outcome variable (e.g. birth weight) from the observed data that can be explained by the full multivariate fitted model.
SCBU Special Care Baby Unit
SD Standard Deviation
SE Standard Error
SUDI Sudden Unexpected Death of an Infant
Term Childbirth occurring between 37 and 41 completed weeks of gestation
Trimester One of three approximately equal thirds of the 40 weeks of an average pregnancy (first, second and third trimesters).
Whānau Ora Whānau Ora is a recent New Zealand government initiative to provide social, education and other support services and opportunities to families across New Zealand. A focus of the Whānau Ora approach is for multiple government agencies to work together with families in need in order to empower families to become more self-managing and take responsibility for their own development.
Working for Families A package of financial support for families with children in New Zealand delivered by Work and Income and Inland Revenue through tax credits. Eligibility is dependent on household income and number of children.

127
Appendices
Appendix 1: Study Objectives (detail)
The overall study objectives for the longitudinal study are detailed below. These were agreed during the development phase of the study (2006) and have been reviewed during the intensive planning phase for each Data Collection Wave since. This process will continue.
The overarching goal of Growing Up in New Zealand has been to design and implement a contemporary longitudinal study of New Zealand children in the context of their families and the wider social, cultural and political environments to enable the following broad objectives to be met:
1. A mapping of the developmental trajectories for a cohort of New Zealand children as a group and within New Zealand European/Pakeha, Māori, Pacific and Asian subgroups, in order to identify the main causal pathways, and the links between them, across multiple levels of influence (political, social, cultural, intergenerational, familial and individual) for outcomes in key social, developmental and health domains across the life course. Specifically to:
• Determine the associations between outcomes at different points in the lifecourse development of the child and in different environmental domains (referring to environment in its widest sense including the family, physical, social and political).
• Determine the nature and temporal sequence of determinants in the pathways, establishing those that are direct and those that are indirect (i.e. temporally proximal factors, in relation to the outcome, that act as mediators of more distal determinants in the developmental pathways).
• Determine the nature and the timing of factors that are of key importance and that may be amenable to intervention at the individual or at the policy level.
2. A description of cross-sectional outcomes (in several domains) at key points in the life course of the developing child to enable comparisons between subgroups and within New Zealand European/Pakeha, Māori, Pacific and Asian subgroups, and with international populations. Specifically to:
• Describe patterns of development at different stages of the life course across the New Zealand population.
• Describe patterns of variation in developmental outcomes between different groups in the population (for example, by ethnicity, geographic location, socio-economic status, parental and family characteristics).
• Compare these outcomes and variations in them with both international and earlier New Zealand cohorts.
3. A focus on factors and trajectories, across multiple levels of influence, that confer resilience and optimise development, rather than focusing solely on risk factors for poor outcomes. Specifically to:
• Examine influences on the range of normal development rather than focusing only on extremes of outcome.
4. Identification of critical or sensitive periods in development, and levels of influence, that will allow the development of policy directed at optimising the life course development of every child born in New Zealand. Specifically to:
• Consider appropriate policy initiatives to address outcomes in key domains of individual development from childhood to adulthood including cognitive capacity, physical health, mental and emotional wellbeing, educational attainment, socialisation, behaviours (including risk-taking) and reproductive outcomes.
• Consider appropriate policy initiatives to address outcomes related to the wider influences on development including family structure and support, poverty and financial stress, social networks, cultural affiliation, physical environments and the media.

128
GROWING UP IN NEW ZEALAND - NOW WE ARE BORN 2012
Specific research questions were developed to shape the design of the longitudinal study throughout its 21 years. They are divided into domain specific questions, but domains are inter-dependent therefore questions are relevant across domain areas. The collective set of questions addresses the overall study objectives.
As each Data Collection Wave is planned these questions are used to assist the process of determining what constructs will be measured at each time point.
HEALTH AND WELLBEING
1. What are the developmental pathways that determine the health status of children across the lifecourse from antenatal development to early adulthood?
2. How does an individual’s biological profile, and the environment in which they grow, mutually interact over time to influence development?
PSYCHOSOCIAL AND COGNITIVE DEVELOPMENT
3. What are the key determinants of the developmental trajectories that lead to psychosocial competence, and what precipitates either continuity or change in these trajectories?
4. What biological and environmental factors impact on cognitive ability and how do these factors influence developmental outcomes and trajectories over the lifecourse?
EDUCATION
5. How do the multiple levels of educational context and composition, self, family and environment influence and affect educational and development outcomes over time?
6. What factors influence academic motivation, perceived academic competence and educational achievement through life, in particular at key transition points?
FAMILY/WHĀNAU
7. How does the quality of family dynamics including sibling, parent-child, inter-parental and relationships with extended family and whānau influence children’s development?
8. How do children’s experiences of family/whānau lives vary and what factors confer resilience or present risks to their development, in diverse family/whānau forms and in periods of transition?
9. How involved are fathers in children’s lives, and what are their influences over time on children’s development and wellbeing?
CULTURE AND IDENTITY
10. How are culture and ethnic identity understood and shaped for children and their families and what developmental trajectories are associated with different cultural upbringings across the lifecourse?
11. What influences do the physical, social and cultural environments have on children and their families’ cultural experiences and identities in terms of holistic development?
SOCIETAL CONTEXT AND NEIGHBOURHOOD ENVIRONMENT
12. What are the key features (social networks, infrastructure, and physical environment) of neighbourhoods and environment which impact on an individual’s development over time?
13. What role do neighbourhoods and environment have in mediating the associations between family circumstances, dynamics and social conditions, and child development?
14. How important is engagement of the family and child with key social services and institutions—including health, education and social service providers—in affecting child outcomes? What factors in the social and family environment facilitate effective engagement?
15. How are diverse social and economic contexts expressed in family values, practices, beliefs and resources? How are child outcomes shaped by the effect of these social locations on family values, practices, beliefs and resources?
16. How are child outcomes affected by the nature of their parents’ workforce participation, and what factors both internal and external to the family modify these effects?
17. What effects do mass media, communications, and new technologies have on children’s health and development, and what factors in the family and social environment modify these effects?
Appendix 2: Longitudinal Research Questions

129
SECTION 2
Appendix 3: Construct Map
This construct map provides a summary of the key constructs that were measured as part of the antenatal interview, the perinatal data linkage, the six week and 35 week CATIs, and the nine month interview, and those that are currently being measured as part of the two year interview. Detailed questionnaires will be made available on the Growing Up in New Zealand project website (www.growingup.co.nz) after data collections are completed in the field.
Do
main
Co
nst
ruct
s in
clu
de
An
ten
ata
lP
eri
nata
l6
wks
35
w
ks
9 M
on
ths
2 y
ears
MP
CP
MC
PC
PC
PM
PC
MP
Hea
lth &
W
ellb
eing
Gro
wth
; D
iet
and N
utr
itio
n;
Act
ivity
& E
xerc
ise;
Child
Hea
lth;
Pare
nta
l H
ealth;
Fam
ily H
ealth;
Str
ess
& H
ardsh
ip;
Bio
mar
kers
/Bio
logic
al S
amplin
g;
Ava
ilabili
ty &
Acc
ess
to H
ealth S
ervi
ces
& I
nfo
; M
icro
bio
logic
al E
nvi
ronm
ent
••
••
•
••
••
••
Psyc
hoso
cial
&
Cognitiv
e D
evel
opm
ent
Motiva
tion &
Em
otion;
Soci
al;
Conduct
& B
ehav
iour;
Par
enting
Prac
tice
s; P
aren
tal Li
fest
yle;
M
enta
l H
ealth;
Sen
se o
f Sel
f;
Gen
eral
Cognitiv
e Fu
nct
ionin
g;
Gen
eral
Inte
lligen
ce;
Languag
e;
Quan
tita
tive
Know
ledge;
Sen
sory
Ski
lls;
Sen
sorim
oto
r Fu
nct
ions;
Exe
cutive
Funct
ionin
g
••
••
••
••
Educa
tion
Tran
sitions
bet
wee
n e
duca
tional
se
ttin
gs;
Qual
itie
s &
Att
ribute
s of
Lear
nin
g E
nvi
ronm
ents
; Choic
e &
U
tiliz
atio
n o
f Educa
tional
Ser
vice
s;
Child
care
Use
& P
olic
ies;
Motiva
tion
& A
cadem
ic C
om
pet
ence
; Pa
rent-
Child
Inte
ract
ions;
Conce
ptions
of
Ach
ieve
men
t; C
ognitio
n;
Moth
er-
child
Rel
atio
nsh
ip
••
•
••
Fam
ily &
W
hān
au
Pare
nt-
child
Rel
atio
nsh
ip;
Inte
r-par
enta
l Rel
atio
nsh
ip;
Fam
ily
Rel
atio
nsh
ips;
Fam
ily S
truct
ure
; Pa
renting
••
•
•
•
•
••
Culture
&
Iden
tity
Fam
ily;
Eth
nic
ity;
Culture
; Att
itudes
About
Oth
ers;
Rel
igio
sity
/Spiritual
ity;
Com
munity
••
•
•
••
••
Soci
al C
onte
xt,
Nei
ghbourh
ood
& E
nvi
ronm
ent
House
hold
Am
enitie
s; A
cces
s To
Non-H
ouse
hold
Res
ourc
es;
Soci
al C
apital
; Engag
emen
t W
ith
Nei
ghbourh
ood;
Inst
itutions;
Eco
nom
ic C
apital
; Cultura
l Cap
ital
; H
ouse
hold
Soci
oec
onom
ic S
tatu
s;
Exp
osu
re t
o T
V &
oth
er m
edia
••
•
•
••
••
M =
moth
er P
= p
artn
er C =
child
CP
= c
hild
pro
xy

GROWING UP IN NEW ZEALAND - NOW WE ARE BORN 2012
Notes