Embed Size (px)
Citation preview

CLIMATE RESEARCHClim Res
Vol. 39: 275–286, 2009doi: 10.3354/cr00828
Published September 10
1. INTRODUCTION
In most of the northern hemisphere, advancementsof phenological events in spring, and to a lesser degreein autumn, have been recorded in recent decades(e.g. Menzel & Fabian 1999, Parmesan & Yohe 2003,Schaber & Badeck 2005, Menzel et al. 2006, Parme-san 2007). However, in some regions, for example inEastern Europe and the Balkans, there are indicationsof a delayed trend in spring phenophases (Menzel &Fabian 1999, Menzel 2000, Ahas et al. 2002). In Switzer-land, even more regional differences have been found,with a stronger trend of earlier onset of spring in the
northern lowland parts compared with a weak trend athigh altitude and in southern regions (Studer et al.2005, 2007). Fennoscandia (defined here as Norway,Sweden, Finland, and the Kola Peninsula and Kareliaof northwestern Russia) is characterized by strongclimate gradients running from north to south, fromwest to east, and from the lowlands to the mountains.In the northern continental parts of Fennoscandia, aslight shortening of growing-season length has beenreported for the 1930–1998 period (Kozlov & Berlina2002). However, Pudas et al. (2008a,b) report that thisshortening trend seems to have ended, with an earlieronset of spring and no changes in the timing of autumn
© Inter-Research 2009 · www.int-res.com*Email: [email protected]
Growing-season trends in Fennoscandia 1982–2006,determined from satellite and phenology data
Stein Rune Karlsen1,*, Kjell Arild Høgda1, Frans Emil Wielgolaski2, Anne Tolvanen3, 4, Hans Tømmervik5, Jarmo Poikolainen3, Eero Kubin3
1Norut, Northern Research Institute Tromsø, PO Box 6434, 9294 Tromsø, Norway2University of Oslo, Department of Biology, PO Box 1045, Blindern, 0316 Oslo, Norway
3Finnish Forest Research Institute, Muhos Research Unit, 91500 Muhos, Finland4University of Oulu, PO Box 3000, 90014 University of Oulu, Finland
5The Norwegian Institute for Nature Research, Arctic Ecology Department, The Polar Environmental Centre, 9296 Tromsø,Norway
ABSTRACT: The study area of Fennoscandia is a heterogeneous climatic region. To map the lineartrends in onset, end, and length of the growing season in Fennoscandia, the bimonthly Global Inven-tory Modeling and Mapping Studies (GIMMS) normalized difference vegetation index (NDVI) satel-lite data set was used. The data set has an 8 × 8 km2 spatial resolution and covers the period from 1982to 2006. The mapping was done by applying pixel-specific threshold values to the NDVI data. Thesethreshold values were determined from surface phenology data on birch Betula pubescens from 28stations across the study area. During spring, most stations showed a moderately strong positive cor-relation between field and NDVI data. However, mapping of the end of the growing season showedless correlation with field phenology data and presented some uncertainty. On average, there was alinear trend for all of Fennoscandia of a 0.27 d yr–1 earlier onset of the growing season, a 0.37 d yr–1
later end of the growing season, and a 0.64 d yr–1 longer growing season. Within Fennoscandia, thetrends showed similarities with vegetation zones and sections, which reflect the climatic gradientsfrom north to south and from west to east in the study area. The southern and oceanic regions showeda trend of about a 1 d yr–1 longer growing season, in contrast to the alpine and northern continentalregions which showed either no trend or a slightly shorter growing season.
KEY WORDS: Fennoscandia · GIMMS · Growing season · NDVI · Phenology · Linear trends ·Vegetation regions
Resale or republication not permitted without written consent of the publisher
OPENPEN ACCESSCCESS
Contribution to CR Special 19 ‘European plant phenology’

Clim Res 39: 275–286, 2009
phenophases for northern Finland for the 1997–2006period. In central, southern, and western oceanic partsof Fennoscandia, there are indications of a differentpattern, with only weak trends in change of onset andend of the growing season on a century time scale, butwith significant earlier onset of spring phenophasesduring the last 2 decades (Emberlin et al. 2002, Nordliet al. 2008, Pudas et al. 2008b). However, neither thespatial nor the temporal pattern of the changes in thegrowing season within Fennoscandia is obvious.
The main problem with applying phenological fielddata to study changes in timing of the growing seasonwithin Fennoscandia is that phenological field dataare sparse, compared with the climatic and ecologicaldifferences in the region. Finland has a rather well-developed network of phenological stations (Pudas etal. 2008b), whereas Norway has only a few stations.In Sweden, there are very few long-term series ofcontinuous phenological data. The existing long-termphenological series may be useful for local studies ofclimatic and environmental effects through time, butcarrying out field phenological observations is tediousand expensive, and full coverage of all regions cannever be obtained. As a result, to document the effectsof the current climatic trends on the growing season,there is a need for objective methods applicable on aregional level.
Satellite image-aided analysis of phenology of nat-ural vegetation provides spatially complete coveragethat can be used in addition to traditional ground-based phenological observations. Phenological changesduring the growing season can be studied by examin-ing changes in the remote-sensing-based normalizeddifference vegetation index (NDVI) value. The NDVIis defined as: NDVI = (NIR – RED)/(NIR + RED), whereRED and NIR are the spectral reflectance measure-ments acquired in the red and near-infrared regions,respectively (Lillesand & Kiefer 1994). The NDVIis correlated with the fraction of photosyntheticallyactive radiation absorbed by plants, and thus to photo-synthetic activity. In most published studies, ground-based phenological observations have been linked tosatellite imagery from the low-resolution advancedvery high resolution radiometer (AVHRR) instrumentonboard the NOAA series of meteorological satellites(e.g. White et al. 1997, Schwartz et al. 2002). Karlsen etal. (2006, 2007a) mapped the mean onset and end ofthe growing season and the variability in the onset ofthe whole of Fennoscandia by applying the GlobalInventory Modeling and Mapping Studies (GIMMS)NDVI data set based on AVHRR data (Tucker et al.2005). Høgda et al. (2007) used an early version of theGIMMS-NDVI data set, and mapped the trends in thegrowing season for the 1982–1999 period; however,their study included data from only 4 stations with
birch phenology data and 5 stations with birch pollendata.
The aim of the present study was to use the GIMMS-NDVI data set for the 1982–2006 period to map thelinear trends in onset, end, and length of the growingseason, and to analyze the spatial pattern according tovegetation zones, sections, and regions.
2. DATA AND METHODS
2.1. Vegetation zones, sections, and regions
The study area of Fennoscandia includes Norway,Finland, most of Sweden, and northwestern Russia(Fig. 1). The region is climatically and ecologically het-erogeneous (Tuhkanen 1980, Moen 1999, Tveito et al.2001). The regional variation in vegetation in Fenno-scandia can be expressed in terms of vegetation zonesand sections (Moen 1999). Vegetation zones (Fig. 1a)and altitudinal belts are considered to mostly reflectsummer temperatures, whereas vegetation sections in-dicate oceanic gradients (Fig. 1b). In the study area, thenorthern, middle and southern boreal zones (NB, MBand SB, respectively) are characterized by coniferousforests. The boreonemoral zone (BN) forms a transitionbetween the nemoral zone (N)—which is characterizedby broad-leaved deciduous forest—and the typicalconiferous forests. The alpine belts are the area abovethe climatic forest line, and the southern Arctic zone isthe area north of the climatic forest line. The highlyoceanic (O3), markedly oceanic (O2), and slightlyoceanic (O1) sections are all characterized by a longgrowing season, high annual precipitation, and west-ern species, as defined by Moen (1999). The intermedi-ate section (OC) forms a transition between the oceanicand continental sections and occupies roughly three-quarters of the study area. The slightly continental sec-tion (C1) is characterized by a short growing seasonand low annual precipitation. The maps of vegetationzones and sections by Moen (1999) are used in theanalyses. However, some of the zones and section coveronly small areas and were thus included in the nearestzone/section in the analyses: the southern Arctic zonewas included in the alpine belts, the N zone in the BNzone, and the O3 section in the O2 section. In the pre-sent study, vegetation regions are defined as the com-bination of overlapping vegetation zones and sections.
2.2. Phenology data
Comparable phenophase data on birch (Betula pubes-cens and its subspecies Betula pubescens ssp. tortuosa)from 28 observation stations in Finland and Norway
276

Karlsen et al.: Trends in the growing season in Fennoscandia 277
Fig. 1. Vegetation (a) zones and (b) sections in the study area according to Moen (1999), redrawn with permission, showing the positions of phenological stations used in the present study
Table 1. Relationship between NDVI values and observed phenophases of birch. Onset and end of the growing season (onset ofleafing and >50% yellowing of leaves, respectively) were measured from normalized difference vegetation index (NDVI) and phe-nological field data. The stations are sorted from north to south. Vegetation regions (zones and sections)—NB: northern boreal,MB: middle boreal, SB: southern boreal, BN: boreonemoral; O1, O2, O3: slightly, markedly, and highly oceanic, respectively;OC: intermediate; C1: slightly continental. Yr: number of years with field data; RMS: root mean square between field and NDVIdata; B: bias, defined as differences in days between date of field observation and NDVI observation. (–) no data; *p < 0.05; **p < 0.01
Station Vegetation Onset of the growing season End of the growing seasonregion region Yr r RMS B Yr r RMS B
Tromsø MB-O1 25 0.30 20.7 –16– –Svanhovd NB-OC 14 0.36 11.6 –6 12 0.17 10.5 0Kevoa NB-C1 25 0.61** 10.1 5 10 0.47 6.3 –3Kilpisjärvi NB-C1 15 0.37 8.7 1 17 –0.28– 9.7 –6Muddusjärvi NB-C1 10 –0.05– 16.2 10 10 0.35 4.8 0Saariselkä NB-C1 10 0.45 12.6 10 10 –0.02– 9.6 –7Pallasjärvi NB-C1 10 0.36 13.6 7 10 0.69* 6.3 –5Kolari MB-OC 10 0.60 10.4 8 10 0.15 17.2 –14–Värriö NB-OC 8 0.60 10.7 7 10 0.20 5.6 –4Oulanka NB-OC 10 0.50 7.6 0 10 0.32 6.9 –7Muhos MB-OC 10 0.29 15.1 11 10 –0.18– 17.9 –17–Kvithamar NB-O1 23 0.45* 17.2 –14– 19 –0.20– 22.7 14Paljakka MB-OC 10 0.66* 8.1 4 10 0.04 16.1 –14–Kannus MB-OC 10 0.72* 19.1 18 10 –0.11– 16.8 –13–Nurmes MB-OC 10 0.57 9.7 6 10 –0.03– 16.5 –14–Koli SB-OC 10 0.30 9.0 1 10 0.41 6.7 0Siilinjärvi SB-OC 10 0.60 8.1 –4 5 0.45 9.9 –4Mekrijärvi SB-OC 10 0.31 14.6 11 7 0.07 14.2 –10–Kolkanlahti MB-OC 10 0.45 8.3 4 6 –0.03– 8.1 –2Suonenjoki SB-OC 9 0.45 12.1 9 9 0.56 11.9 –8Joensuu SB-OC 10 0.51 10.7 8 10 0.24 12.0 –9Parkano MB-OC 10 0.56 23.0 22 8 0.19 13.8 –5Punkaharju SB-OC 10 0.51 7.6 0 10 0.20 12.9 11Vesijako SB-OC 10 0.89** 15.8 16 9 0.41 7.7 0Aulanko SB-OC 10 0.60 7.5 5 10 0.51 6.4 2Lapinjärvi SB-OC 10 0.56 8.1 6 10 0.04 7.2 –4Fana BN-O2 20 0.54* 16.2 –10– 11 0.31 23.6 13Ruotsinkylä BN-OC 10 0.69* 8.7 6 10 0.01 11.8 7aPhenophase budburst

Clim Res 39: 275–286, 2009
(Fig. 1a; see Table 1 for vegetation region of each station)were used. Finnish data are from the Finnish pheno-logical network launched in 1995 (Poikolainen et al.1996, Pudas et al. 2008b). The data for Norway are fromTromsø at 69’ 65° N, Svanhovd at 69’ 45° N, Kvithamar at63’ 47° N, and Fana at 60’ 27° N. The stations are un-evenly distributed. None of the 28 stations were locatedin the Arctic/Alpine zone and 19 of the stations werelocated in the intermediate (OC) section. At the Finnishstations and at Svanhovd in Norway, phenological ob-servations on birch were obtained from the same 4 to5 individual trees twice a week from April to Octobereach year. At the other stations, observations were moreirregular. In the present study we used 2 phenophases—onset of leafing of birch and >50% yellowing of leaves ofbirch—except for Kevo where we used the phenophasebudburst due to the long time series of this phase. Bud-burst is when leaves have emerged from their buds buthave not yet opened (BBCH07 code according to Meier1997); onset of leafing is when the first leaves unfold andthe first leaf stalk is visible, about 1 wk after budburst;and >50% yellowing of leaves is recorded when morethan half of the leaves on each tree have turned yellow(BBCH92). The phenophases are illustrated in Kubin etal. (2007). Birch is the dominant tree species in most partsof the study area and is well suited as a phenologicalindicator, since its deciduous growth form allows forwell-defined phenophases, phenomena not observedeasily in conifers. The chosen birch phenophases repre-sent well the general greening and colouring of theregion’s vegetation.
None of the stations have complete time-series forboth the spring and autumn phenophases. The pheno-phase onset of leafing (including budburst) was ob-served in 338 seasons of data and >50% yellowing ofleaves comprises 272 observations.
2.3. Mapping the growing season
2.3.1. GIMMS-NDVI data set
An NDVI data set was acquired from the NASAGIMMS project for the 1982–2006 period from theUniversity of Maryland Global Land Cover Facility(www.landcover.org/). The GIMMS data set is pro-duced by data from the AVHRR instrument onboardthe afternoon-viewing NOAA satellite series (NOAA 7,9, 11, 14, 16, and 17). The data set has an 8 × 8 km2 res-olution and is composed of the maximum NDVI valuesfor bimonthly periods between July 1981 and De-cember 2006. There are 2 half-month composites permonth, from Day 1 to 15 and from Day 16 to themonth’s end. The processing of the applied version ofthe data set includes reduced NDVI variations arising
from calibration, view geometry, volcanic aerosols, andother effects not related to actual vegetation change.This includes NOAA-9 descending node data fromSeptember 1994 to January 1995, volcanic stratosphericaerosol correction for 1982–1984 and 1991–1994, andimproved NDVI using empirical mode decomposition/reconstruction (EMD) to minimize effects of orbitaldrift. Details of the data set are described by Tucker etal. (2004, 2005) and Pinzón et al. (2005). Different ver-sions of the GIMMS-NDVI data set have been used innumerous studies investigating vegetation activity andphenological changes (e.g. Myneni et al. 1997, Karlsenet al. 2006, 2007a, Raynolds et al. 2008, Verbyla 2008).
2.3.2. Estimating the growing season from NDVI
To estimate the onset and end of the growing season,we applied a pixel-specific threshold method. Wemodified a method first used by Høgda et al. (2001)and later described and discussed by Karlsen et al.(2006). This modified method has also recently beenused on MODIS-NDVI data (Karlsen et al. 2008), butwith different thresholds due to differences in thespectral bands on the MODIS and NOAA-AVHRRsensors, as well as the smoothing methods used on theGIMMS-NDVI data set. Here we give a short summaryof the method and thresholds we used; for an illustra-tion of the method, see Karlsen et al. (2008). First, theNDVI values were calculated for a 3 × 3 pixel area cen-tered on each of the 28 phenological stations. In somecases, the centre position of the 3 × 3 pixel area wasadjusted by 1 pixel to avoid inclusions of pixels notrepresentative for the area around a station, e.g. water,high altitude, and human impact areas. Topographicalmaps, terrain models, and vegetation maps from theBaltic Sea drainage area (Malmberg 2001) and Nor-way (Johansen & Karlsen 2007) were used in theadjustment process to find representative areas. Tolink surface phenology with NDVI data to measure theonset and end of the growing season, we computed, forevery pixel, a 25 yr mean NDVI value of the period 15June to 1 September for the period 1982–2006. The useof this specific period reduces the noise from snow-covered ground. The date for the onset of the growingseason for each pixel for each year was defined as thefirst day in the half-month period when the NDVIvalue passed (upwards) 0.70 of the 25 yr mean NDVIvalue for the 15 June to 1 September period. The datefor the end of the growing season for each pixel foreach year was defined as the first day in the half-month period when the NDVI value passed (down-wards) 0.72 of the 25 yr mean NDVI value for the 15June to 1 September period. These thresholds werechosen because they showed the highest correlation
278

Karlsen et al.: Trends in the growing season in Fennoscandia
with the birch phenophases of onset of leafing andyellowing of leaves.
From the yearly onset and end of growing season val-ues, for each pixel within the study area, the lineartrends over the period were computed and the mean lin-ear trends for vegetation zones, sections, and regions de-termined. As agricultural activities can be expected tohave an influence on the results, for example by misin-terpreting the harvesting time as the end of the growingseason, agricultural lands and major lakes were omittedfrom the analyses. Due to uncertainties in the vegetationzones and section maps, the Baltic countries were omit-ted from the linear trend analyses. Finally, to improve thecartographic presentation, a 3 × 3 spatial median filterwas applied to the final NDVI-based products.
3. RESULTS
3.1. Timing of the growing season
Table 1 shows the relationship between NDVI valuesand observed phenophases of birch. In general, theNDVI-defined onset of growing season showed a
higher correlation with birch phenology data duringspring as compared with data from the autumn period.During spring, most of the stations showed a moder-ately strong positive correlation: 20 of the 28 stationsshowed correlation values (r) above 0.45, and 7 of thesewere significant (p < 0.05). The root mean square(RMS) values between field data and NDVI data were<11 d for 15 of the stations. However, RMS values forboth the Tromsø and Parkano stations were >20 d. Thebias was <1 wk for 15 of the stations, and the NDVI-defined onset occurred earlier than the phenophaseonset of leafing of birch at 23 of the stations.
The NDVI-defined end of the growing season wascorrelated with the phenophase >50% yellowing ofleaves. Seven of the 28 stations showed r-values >0.40,but only one station was significant (Pallasjärvi, p <0.05), and 6 of the stations showed negative correlationvalues. However, for half of the stations the RMS val-ues between NDVI data and field data were betterthan 10 d. Additionally, the bias between field andNDVI data was ≤1 wk for 16 of the stations, and theNDVI-defined onset occurred earlier than the pheno-phase >50% yellowing of leaves of birch at slightlymore than half of the stations (18 of 28).
279
Fig. 2. Changes in onset of the growing season based on GIMMS-NDVI data for the 1982–2006 period
Clim Res 39: 275–286, 2009
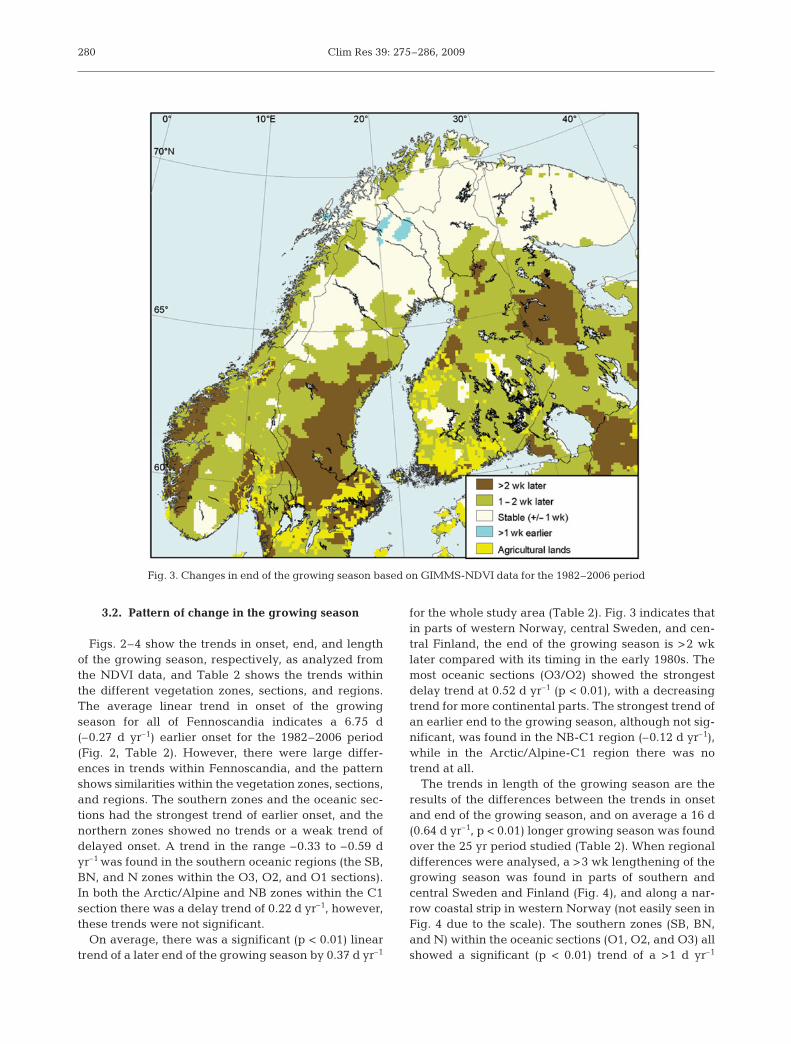
3.2. Pattern of change in the growing season
Figs. 2–4 show the trends in onset, end, and lengthof the growing season, respectively, as analyzed fromthe NDVI data, and Table 2 shows the trends withinthe different vegetation zones, sections, and regions.The average linear trend in onset of the growingseason for all of Fennoscandia indicates a 6.75 d(–0.27 d yr–1) earlier onset for the 1982–2006 period(Fig. 2, Table 2). However, there were large differ-ences in trends within Fennoscandia, and the patternshows similarities within the vegetation zones, sections,and regions. The southern zones and the oceanic sec-tions had the strongest trend of earlier onset, and thenorthern zones showed no trends or a weak trend ofdelayed onset. A trend in the range –0.33 to –0.59 dyr–1 was found in the southern oceanic regions (the SB,BN, and N zones within the O3, O2, and O1 sections).In both the Arctic/Alpine and NB zones within the C1section there was a delay trend of 0.22 d yr–1, however,these trends were not significant.
On average, there was a significant (p < 0.01) lineartrend of a later end of the growing season by 0.37 d yr–1
for the whole study area (Table 2). Fig. 3 indicates thatin parts of western Norway, central Sweden, and cen-tral Finland, the end of the growing season is >2 wklater compared with its timing in the early 1980s. Themost oceanic sections (O3/O2) showed the strongestdelay trend at 0.52 d yr–1 (p < 0.01), with a decreasingtrend for more continental parts. The strongest trend ofan earlier end to the growing season, although not sig-nificant, was found in the NB-C1 region (–0.12 d yr–1),while in the Arctic/Alpine-C1 region there was notrend at all.
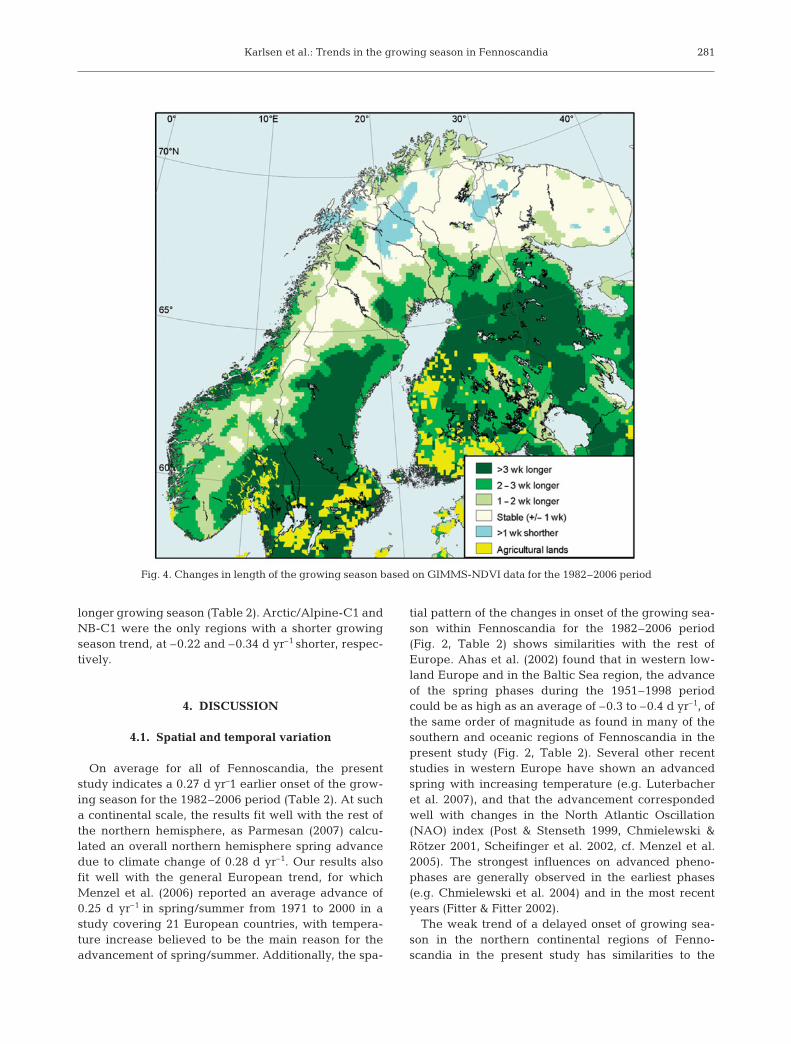
The trends in length of the growing season are theresults of the differences between the trends in onsetand end of the growing season, and on average a 16 d(0.64 d yr–1, p < 0.01) longer growing season was foundover the 25 yr period studied (Table 2). When regionaldifferences were analysed, a >3 wk lengthening of thegrowing season was found in parts of southern andcentral Sweden and Finland (Fig. 4), and along a nar-row coastal strip in western Norway (not easily seen inFig. 4 due to the scale). The southern zones (SB, BN,and N) within the oceanic sections (O1, O2, and O3) allshowed a significant (p < 0.01) trend of a >1 d yr–1
280
Fig. 3. Changes in end of the growing season based on GIMMS-NDVI data for the 1982–2006 period
Karlsen et al.: Trends in the growing season in Fennoscandia
longer growing season (Table 2). Arctic/Alpine-C1 andNB-C1 were the only regions with a shorter growingseason trend, at –0.22 and –0.34 d yr–1 shorter, respec-tively.
4. DISCUSSION
4.1. Spatial and temporal variation
On average for all of Fennoscandia, the presentstudy indicates a 0.27 d yr–1 earlier onset of the grow-ing season for the 1982–2006 period (Table 2). At sucha continental scale, the results fit well with the rest ofthe northern hemisphere, as Parmesan (2007) calcu-lated an overall northern hemisphere spring advancedue to climate change of 0.28 d yr–1. Our results alsofit well with the general European trend, for whichMenzel et al. (2006) reported an average advance of0.25 d yr–1 in spring/summer from 1971 to 2000 in astudy covering 21 European countries, with tempera-ture increase believed to be the main reason for theadvancement of spring/summer. Additionally, the spa-
tial pattern of the changes in onset of the growing sea-son within Fennoscandia for the 1982–2006 period(Fig. 2, Table 2) shows similarities with the rest ofEurope. Ahas et al. (2002) found that in western low-land Europe and in the Baltic Sea region, the advanceof the spring phases during the 1951–1998 periodcould be as high as an average of –0.3 to –0.4 d yr–1, ofthe same order of magnitude as found in many of thesouthern and oceanic regions of Fennoscandia in thepresent study (Fig. 2, Table 2). Several other recentstudies in western Europe have shown an advancedspring with increasing temperature (e.g. Luterbacheret al. 2007), and that the advancement correspondedwell with changes in the North Atlantic Oscillation(NAO) index (Post & Stenseth 1999, Chmielewski &Rötzer 2001, Scheifinger et al. 2002, cf. Menzel et al.2005). The strongest influences on advanced pheno-phases are generally observed in the earliest phases(e.g. Chmielewski et al. 2004) and in the most recentyears (Fitter & Fitter 2002).
The weak trend of a delayed onset of growing sea-son in the northern continental regions of Fenno-scandia in the present study has similarities to the
281
Fig. 4. Changes in length of the growing season based on GIMMS-NDVI data for the 1982–2006 period

Clim Res 39: 275–286, 2009
delay in spring phases in Eastern Europe from 1951 to1998 (IPCC 2001, Ahas et al. 2002). The aforemen-tioned authors explained the delay as an influence ofthe Siberian high-pressure system. Emberlin et al.(2002) predicted flowering of birch to occur about 6 dlater at Kevo (northernmost Finland) during the next10 yr due to cooler springs if the weather continues asit was around the millennium shift. Also, Shutova et al.(2006) showed that the timing of birch bud burst wasdelayed during the 1982–2002 period in northernmostFennoscandia, including the Kola Peninsula, and inparticular in eastern parts of the district. They con-cluded that snowmelt occurred later in more recentperiods due to more precipitation falling as snow. Thismay even be seen as one reason for the stable (or evendelayed) onset of the growing season at higher eleva-tions further south in Fennoscandia (and in particularin southern Norway) for the 1982–2006 period in spiteof increased temperatures (Hanssen-Bauer et al. 2003).Both Studer et al. (2005) and Menzel et al. (2001)observed that in Switzerland from 1965 to 2002 and inGermany from 1951 to 1996, respectively, earlier onsetof spring was was less pronounced at higher eleva-tions. However, neither discussed the findings further.
Linear trends are sensitive to the choice of startingyear. Pudas et al. (2008a) found that the advance ofbirch budburst in Finland increased during 1997–2006by –0.7 d yr–1 in the SB zone and –1.4 d yr–1 in the MB
and NB zones. The present study, however, found astable situation in the NB zone of Finland (Fig. 2). Thisdisagreement could be a result of different startingyears. The study by Pudas et al. (2008a) began in 1997,a period with generally late onset dates in the NB zone,while the present study began in 1982, a period withmore average onset dates in the same area, as seen onthe yearly onset maps by Karlsen et al. (2007a). Thefirst flowering of various plant species in Norway dur-ing the period 1928–1977 is currently being analyzed(Wielgolaski 2009, F. E. Wielgolaski et al. unpubl. data),after the phenological curves were smoothed using aGaussian filtering technique, it is clear that there is a10 to 15 yr fluctuation in plant earliness throughout thisperiod, masking to some degree an overall trend. Thepresent study has revealed the regional pattern in lin-ear trends over a 25 yr period; however, the regionalpattern of the fluctuations in onset of the growing sea-son over the last decades within Fennoscandia is stillnot clear. Also, across Fennoscandia there are indica-tions that since the late 1990s many years have had anearly onset of the growing season (Karlsen et al. 2007a,2009, Nordli et al. 2008, Pudas et al. 2008a,b), influenc-ing the trends and perhaps the fluctuation pattern.
In the present study (as seen by comparing Figs. 2 & 3,and Table 2), the end of the growing season was gener-ally delayed in the same regions of Fennoscandia thatshowed an earlier onset. An exception is found in thealpine parts of southern Norway, which primarily show adelayed trend in end of the growing season (Fig. 3), butan unchanged situation in onset of the growing season(Fig. 2). In the SB and MB zones of Finland, a weak sig-nificant correlation between the delay of leaf colouringof birch and autumn temperatures was observed (Pudaset al. 2008a). A trend in the delay of the timing of au-tumn, however, was not found to be significant, eitherthere or in Germany (Menzel 2000, Menzel et al. 2001,2006), although higher autumn temperatures were foundto delay autumn colouring of horse chestnut Aesculushippocastanum (Menzel 2003). In northern continentalregions, the end of the growing season may even occursomewhat earlier throughout the study period (Table 2),a result also found by Shutova et al. (2006) for the conti-nental parts of northernmost Fennoscandia. They con-cluded that a cool period was necessary to trigger theyellowing of birch leaves. However, they also hypothe-sized that reduced light conditions, e.g. because of moreclouds due to climate change resulting in shorter days inautumn in the far north (north of the Arctic Circle), mightinfluence birch yellowing (Håbjørg 1972a,b, Shutova etal. 2006).
As a consequence of earlier spring and later autumnin southern and oceanic parts of Fennoscandia, thelength of the growing season is prolonged during thestudy period. The same result was found in other stud-
282
Table 2. Linear trends (d yr–1) in the normalized difference veg-etation index (NDVI)-based onset, end and length of the grow-ing season for the 1982–2006 period for various vegetationzones, sections, and regions. Zones: NB: northern boreal; MB:middle boreal; SB: southern boreal; BN: boreonemoral; N:nemoral. Sections: O3, O2, O1: highly, markedly, and slightlyoceanic, respectively; OC: intermediate; C1: slightly continental
section. (–): no data; *p < 0.05; **p < 0.01
Section/ Arctic/ NB MB SB N/BN Allzone alpine
OnsetO3/O2 .– –0.04 –0.04 –0.33 –0.46 –0.23O1 0.08 –0.04 –0.04 –0.52** –0.59* –0.20OC 0.01 –0.03 –0.52** –0.46** –0.29 –0.32*C1 0.22 0.22 .– .– .– 0.20All 0.06 0.02 –0.46** –0.45** –0.41* –0.27
EndO3/O2 .– 0.58** 0.39** 0.69** 0.57** 0.52**O1 0.45** 0.28** 0.27** 0.51** 0.62** 0.41**OC 0.27** 0.17 0.47* 0.46** 0.55** 0.38**C1 0.00 –0.12 .– .– .– –0.08All 0.30 0.14* 0.46** 0.48** 0.57** 0.37**
LengthO3/O2 .– 0.62** 0.43 1.02** 1.03** 0.76**O1 0.37 0.32 0.31 1.03** 1.21** 0.62**OC 0.26 0.20 0.99** 0.92** 0.84** 0.71**C1 –0.22 –0.34 .– .– .– –0.27All 0.24** 0.12 0.92** 0.93** 0.98** 0.64**
Karlsen et al.: Trends in the growing season in Fennoscandia
ies (Menzel 2000, Menzel et al. 2001, 2003, Pudas et al.2008a,b) in various parts of Europe. In contrast, as aconsequence of both later spring and earlier autumn inthe northern continental regions of Fennoscandia, thegrowing season length there was found to decreaseduring the study period 1982–2006. This, however, isnot true in alpine parts of southern Norway, wherelater autumns follow the sometimes later onset ofthe vegetation period, possibly due to the predictedstrongly increasing winter precipitation (Hanssen-Bauer et al. 2001, 2009) through the first half of the2000s (up to 5–6% per decade compared to about 4%in the north of Fennoscandia). Although winter tem-perature may also increase (Hanssen-Bauer et al. 2003,2009), winter precipitation in the southern mountains(as well as in the northern continental regions) will stillfall mainly as snow (see the winter temperature sce-nario up to 2100 for Finnmarksvidda in northern conti-nental Norway in Hanssen-Bauer et al. 2009).
4.2. Reliability of the trend maps
The geographical pattern of the NDVI-based maps,showing the trends in onset, end, and length of thegrowing season (Figs. 2–4), seems reasonable becauseit follows a climatic pattern. This is particularly true inspring, where the strongest trend of earlier onset isfound in the southern and oceanic regions, and aslightly positive (delay) trend in the alpine and north-ern continental parts. During spring, the correlationvalues between phenology data on birch and NDVIvalues interpreted as the onset of the growing seasonare moderately high and significant (p < 0.05) for 7 ofthe 28 stations. However, in some years there are largedisparities between the field and NDVI data. Theseoutliers influence the correlation values and the trends.For example, at Parkano station in southern Finland in2005, the field data shows onset of leafing of birch atDay 144 (24 May), while the NDVI data indicate onsetat Day 107 (17 April). The overall correlation value in-creases from 0.56 to 0.81 if this year is removed. Sincethe surrounding phenological stations also have onsetof leafing at about the same time, and in those locationsthe NDVI data correspond well with the field data, itseems reasonable that the error can be explained bynoise in the GIMMS-NDVI data set. Such a local errorcould be due to long periods with cloud cover, veryheterogeneous land-cover, or changes in land-use.
During autumn, the correlation values between phe-nology data of >50% yellowing of leaves of birch andNDVI data were low, and the climatic pattern is lessclear than in spring. However, the bias between fieldand NDVI data was ≤ 2 wk for all stations except one(Muhos), indicating that the NDVI-based map cor-
responded well with the field observations of yellow-ing of birch. There were also several outliers inautumn, with the disagreement between field andNDVI data strongly influencing the correlation valuesand the trends. This may be due to an observationerror since autumn phenological phases are more diffi-cult to observe on the ground than spring phases.Another explanation for the lack of correlation couldbe that the autumn colouring shows a very hetero-geneous pattern due to the fact that different plantspecies simply change colour at different times be-cause of variation in responses to light, and thus thiswould not be detected by birch alone.
The method applied does not work in agriculturalareas, where onset relies on the sowing time, or inurban areas, where the land has been radically trans-formed. However, we have masked out the agriculturalareas, and urban areas only cover relative small areasin the study area, for instance only 1.4% of Norway(Statistics Norway 2008). In addition, the method usedhere is also sensitive to changes in forestry; however,we believe that year-to-year land use changes occur atsmaller scales than the NDVI data set of 8 × 8 km2
resolution is likely to detect. For instance, large-scalelogging of coniferous (pine and spruce) and deciduousforests (birch) is restricted by law in the Nordic coun-tries (Swedish Forest Agency 2007), and hence theforestry in the Nordic countries are managed in a sus-tainable way with small- to medium-scale clear-cutareas, mainly <0.25 km2, not affecting the spatial reso-lution considered here. However, due to an ending ofsubsidies in 1994, extended reduction in clearing ofbirch and willows on the clear-cut areas has occurredin Sweden (Swedish Forest Agency 2007) and theannual area of clearing dropped from 278 to 138 km2 in1995, with a subsequent increase to 179 km2 in 2002(Swedish Forest Agency 2008). This may affect theproportion of deciduous forests in the northern part ofSweden and thereby, to some degree, the NDVI valueand the timing of the growing season, but most likelyonly on a local scale. The situation in Finland is more orless the same (FFRI 2008), while forestry occurs mainlyon a smaller scale in Norway.
Several studies have mapped the trends in NDVIand onset and end of the growing season over verylarge areas, which also cover Fennoscandia (Myneni etal. 1997, Tucker et al. 2001, Zhou et al. 2001, Dye &Tucker 2003, Gong & Shi 2003, Slayback et al. 2003,Bunn & Goetz 2006, Zhang et al. 2008). However, mostof these studies have a poor link with field phenologi-cal data, or no field data at all, and were conducted atscales that are difficult to interpret effectively forFennoscandia. Stöckli & Vidale (2004) processed theEuropean Fourier-Adjusted and Interpolated (EFAI)NDVI data set, a well-smoothed and calibrated data
283

Clim Res 39: 275–286, 2009
set based on NOAA-AVHRR, over all of Europe for the1982–2001 period. They showed a trend for Fenno-scandia with a similar pattern for onset of the growingseason as found in the present study. In autumn, theyfound a heterogeneous pattern with a trend primarilyof a later end of the growing season, but with no con-tradictions to the present study. However, they did notcompare the results with field data, and they used athreshold method that would yield too early an onsetand too late an end of growing season compare withthe present study. Delbart et al. (2008) used both aphenological model and a remote sensing-based dataset and mapped the trend in onset of the growing sea-son in boreal Eurasia for the 1982–2002 period, andfound a stable or slightly delayed trend in onset foralpine and northern continental regions of Fennoscan-dia, which partly supports the present study. In previ-ous preliminary studies, Høgda et al. (2001, 2007) usedan early version of the GIMMS-NDVI data set to mapthe trends in the growing season for the 1982–1999period for Fennoscandia, correlated, however, withdata from only a few field stations. They found a simi-lar pattern but with a stronger trend in onset of thegrowing season in southern and oceanic regions. Thisis most likely because a threshold based on the meanNDVI value above zero was used. The threshold wouldthen be influenced by the degree of snow cover, andsome southern and oceanic regions that lack a stablesnow cover each year could have an overly strongtrend, with the onset more associated with the timingof snowmelt.
The present study used a pixel-specific method anda threshold from a mean summer NDVI value. Othermethods that work on a pixel-by-pixel basis were alsotested, for instance, using the period of steepest in-crease in NDVI as the timing of the onset of the grow-ing season (White et al. 1997, Studer et al. 2007); how-ever, they yielded a low correlation when comparedwith field observations in our study area. An earliercomparison of methods showed that the presentmethod is most suitable for the GIMMS-NDVI data setof the study area (Karlsen et al. 2006). Our pixel-specific method based on a mean summer NDVIthreshold has also recently been used on MODIS-NDVI data in different regions of the study area, andhas shown high correlation in spring both with birchphenology (Karlsen et al. 2008) and pollen data(Karlsen et al. 2009). These MODIS-NDVI-based maps,based on the summer NDVI mapping method, havealso been compared with snow maps, based on micro-wave data, in southern Norway (Karlsen et al. 2007b).The study from southern Norway showed that the timedifferences between the last day of snow and the onsetof the growing season was much larger in the oceaniclowland compared with the alpine areas, indicating
that our method based on mean summer NDVI valuesis not directly influenced by snowmelt, but with green-ing. However, the correlation with autumn pheno-phases was also low in the MODIS-NDVI-based study(Karlsen et al. 2008), which indicates that more re-search is needed to map the timing of autumn. Denseconiferous forest is very common in the study area, inparticular in Finland and Sweden. It should be empha-sized that dense coniferous forest without birch haslow NDVI amplitude variation and in these regions thetrends mapped for the growing season are thus likelyto be more affected by noise, becoming less accurate.Also, since birch is rare in some coniferous-dominatedareas, we may detect the understorey green-up fromshrubs, herbs, and grasses in the forest rather than theoverstorey coniferous species, but this was not furtherinvestigated. However, if the threshold value we deter-mine is wrong in some pixels, this will influence theaccuracy of the timing (too early or too late), but it isreasonable to believe that the 25 yr mapped trends inthe growing season will be less influenced. The lack ofbirch is, of course, also the case for alpine areas wherewe only measured the general greening and yellowingof the species in the field layer. In general, in areas notdominated by birch it is not possible to know what weare measuring with the 8 × 8 km2 pixel resolution.
White et al. (2009) investigated 10 different satelliteNDVI methods for retrieving the onset of the growingseason in North America. The individual methods dif-fered by ±60 d in average day for onset of the growingseason and by ±20 d in standard deviation. They con-cluded that the ability of satellite methods to retrieveonset of the growing season estimates was highest innorthern latitudes and that, compared with groundobservations, onset estimates were more related to thephenophases of first leaf and first flowers expanding.They also highlighted the importance of implementa-tion details (e.g. how the threshold value is selected)for the onset of the growing season results. Accord-ingly, our confidence in the results from the present isconsistent with their findings, as we worked with highlatitude data, selected a NDVI threshold value so thatthe timing of the passing of this threshold value fit withthe onset of leafing in the area investigated, and useda method specifically designed for the area we investi-gated. Results from the present study also showed acorrelation with ground data that is moderately high inspring, and trends were similar in both ground andsatellite data.
In conclusion, despite the local errors in disagree-ment between field phenology and NDVI data forsome stations in some years, we believe that the NDVI-defined trends for onset, end, and length of the grow-ing season are reliable in the majority of the studyarea. This is due to the moderately high correlation
284

Karlsen et al.: Trends in the growing season in Fennoscandia
values in spring, the rather low bias in autumn, and ageneral agreement with comparable studies. However,there are errors on a local level due to the noise in thesatellite data used, and the maps presented show onlythe general trends on a regional scale. We also believethat the trend in the onset of the growing season ismore accurate than the trends in end and length ofthe growing season.
Acknowledgements. We are grateful to the staff of the FinnishForest Research Institute, the Universities of Helsinki, Joen-suu, Oulu, and Turku, Metsähallitus, the Game and FisheriesResearch Institute, and several polytechnics for carrying outthe phenological observations in Finland. We are also gratefulto the Norwegian Institute for Agricultural and Environmen-tal Research (Bioforsk) for contributing data from their pheno-logical gardens in Pasvik and Kvithamar, and for their pheno-logical observations in Tromsø. Finally, we thank researchscientist O. Skre at the Norwegian Forest Research InstituteBergen for phenology data from Fana. This study was fi-nanced by Norut, Northern Research Institute Tromsø, withinthe strategic institute program ‘New and improved remotesensing techniques for environmental monitoring’ (EnviMon),and by the IPY core project PPS Arctic (http://ppsarctic.nina.no), financially supported by The Research Council ofNorway through the grant 176065/S30.
LITERATURE CITED
Ahas R, Aasa A, Menzel A, Fedotova VG, Scheifinger H (2002)Changes in European spring phenology. Int J Climatol22:1727–1738
Bunn AG, Goetz SJ (2006) Trends in satellite-observed circum-polar photosynthetic activity from 1982 to 2003: the influ-ence of seasonality, cover type and vegetation density.Earth Interact 10:1–19
Chmielewski FM, Rötzer T (2001) Responses of tree phenologyto climate change across Europe. Agric For Meteorol108:101–112
Chmielewski FM, Müller A, Bruns E (2004) Climate changesand trends in phenology of fruit trees and field crops inGermany, 1961–2000. Agric For Meteorol 121:69–78
Delbart N, Picard G, Le Toan T, Kergoat L and others (2008)Spring phenology in boreal Eurasia over a nearly centurytime scale. Glob Change Biol 14:603–614
Dye DG, Tucker CJ (2003) Seasonality and trends of snow-cover, vegetation index, and temperature in northern Eura-sia. Geophys Res Lett 30:1405, doi: 10.1029/2002GL016384
Emberlin J, Detandt M, Gehrig R, Jaeger S, Nolard N, Rantio-Lehtimäki A (2002) Responses in the start of Betula (Birch)pollen season to recent changes in spring temperaturesacross Europe. Int J Biometeorol 46:159–170
FFRI (Finnish Forest Research Institute) (2008) Finnish sta-tistical yearbook of forestry 2008. Finnish Forest ResearchInstitute, Vantaa
Fitter AH, Fitter RSR (2002) Rapid changes in flowering time inBritish plants. Science 296:1689–1691
Gong DY, Shi PJ (2003) Northern hemispheric NDVI variationsassociated with large-scale climate indices in spring. Int JRemote Sens 24:1303–1315
Håbjørg A (1972a) Effects of photoperiod and temperature ongrowth and development of three latitudinal and three alti-tudinal populations of Betula pubescens Ehrh. Meld NordLandbruks 51:1–27
Håbjørg A (1972b) Effects of light quality, light intensity andnight temperature on growth and development of three lat-itudinal populations of Betula pubescens Ehrh. Meld NordLandbruks 51:1–17
Hanssen-Bauer I, Tveito OE, Førland EJ (2001) Precipitationscenarios for Norway: empirical downscaling from theECHAM4/OPYC3 GSDIO integration. DNMI Report 10/01,RegClim, Oslo
Hanssen-Bauer I, Førland EJ, Haugen JE, Tveito OE (2003)Temperature and precipitation scenarios for Norway: com-parison of results from dynamical and empirical down-scaling. Clim Res 25:15–27
Hanssen-Bauer I, Førland EJ, Roald L, Hisdal H and others(2009) Klima i Norge 2100. Bakgrunnsmateriale til NOUKlimatilpasning. Foreløpig utgave, juni 2009, Norsk klima-senter, Oslo
Høgda KA, Karlsen SR, Solheim I (2001) Climatic changeimpact on growing season in Fennoscandia studied by atime series of NOAA AVHRR NDVI data. Proc Int GeosciRemote Sens Symp, Vol 3, 9–13 Jul 2001, Sydney. IEEEInternational, Piscataway, NJ, p 1338–1340
Høgda KA, Karlsen SR, Tømmervik H (2007) Changes in grow-ing season in Fennoscandia 1982–1999. In: Ørbæk JB, Kal-lenborn R, Tombre I, Hegseth EN, Falk-Petersen S, Hoel AH(eds) Arctic alpine ecosystems and people in a changingenvironment. Springer-Verlag, Berlin/Heidelberg, p 71–84
IPCC (2001) Climate change 2001: the scientific basis. Contri-bution of Working Group I to the third assessment report ofthe Intergovernmental Panel on Climate Change. Cam-bridge University Press, Cambridge
Johansen B, Karlsen SR (2007) Vegetation mapping of Norway,using Landsat TM/ETM+ data. Preliminary Norut Report387/1-08, Norut, Tromsø
Karlsen SR, Elvebakk A, Høgda KA, Johansen B (2006) Satel-lite based mapping of the growing season and bioclimaticzones in Fennoscandia. Glob Ecol Biogeogr 15:416–430
Karlsen SR, Solheim I, Beck PSA, Høgda KA, Wielgolaski FE,Tømmervik H (2007a) Variability of the start of the growingseason in Fennoscandia, 1982–2002. Int J Biometeorol 51:513–524
Karlsen SR, Malnes E, Haarpaintner J, Solberg R (2007b) Map-ping and modelling the snowmelt and greening pattern insouthern Norway by combining microwave and opticalremote sensing sensors. Proc Int Geosci Remote Sens Symp,23–27 Jul 2007, Barcelona. IEEE International, Piscataway,NJ, p 1279–1282
Karlsen SR, Tolvanen A, Kubin E, Poikolainen J and others(2008) MODIS-NDVI based mapping of the length of thegrowing season in northern Fennoscandia. Int J Appl EarthObs Geoinf 10:253–266
Karlsen SR, Ramfjord H, Høgda KA, Johansen B, Danks FS,Brobakk TE (2009) A satellite-based map of onset of birch(Betula) flowering in Norway. Aerobiologia 25:15–25
Kozlov MV, Berlina NG (2002) Decline in length of the summerseason on the Kola Peninsula, Russia. Clim Change 54:387–398
Kubin E, Kotilainen E, Poikolainen J, Hokkanen T and others(2007) Monitoring instructions of the Finnish Nation Pheno-logical Network. Finnish Forest Research Institute (Metla),Muhos Research Unit, Muhos
Lillesand TM, Kiefer R (1994) Remote sensing and image inter-pretation, 3rd edn. John Wiley & Sons, New York
Luterbacher J, Liniger MA, Menzel A, Estrella N and others(2007) The exceptional European warmth of autumn 2006and winter 2007: historical context, the underlying dy-namics and its phenological impacts. Geophys Res Lett34:L12704. doi:10.1029/2007GL029951
285
Clim Res 39: 275–286, 2009
Malmberg U (2001) BALANS land cover and land use classifi-cation methodology. Summary of report balans-utv-24 ver1.0. Metria Miljöanalys, Stockholm
Meier I (ed) (1997) Growth stages of mono- and dicotyledonousplants. BBCH Monograph. Blackwell, Berlin
Menzel A (2000) Trends in phenological phases in Europebetween 1951 and 1996. Int J Biometeorol 44:76–81
Menzel A (2003) Plant phenological anomalies in Germany andtheir relation to air temperature and NAO. Clim Change57:243–263
Menzel A, Fabian P (1999) Growing season extended in Europe.Nature 397:659
Menzel A, Estrella N, Fabian P (2001) Spatial and temporalvariability of the phenological seasons in Germany from1951 to 1996. Glob Change Biol 7:657–666
Menzel A, Jakobi G, Ahas R, Scheifinger H, Estrella N (2003)Variations of the climatological growing season (1951–2000) in Germany compared with other countries. Int J Cli-matol 23:793–812
Menzel A, Sparks TH, Estrella N, Eckhardt S (2005) ‘SSW toNNE’—North Atlantic Oscillation affects the progress ofseasons across Europe. Glob Change Biol 11:909–918
Menzel A, Sparks TH, Estrella N, Koch E and others (2006)European phenological response to climate changematches the warming pattern. Glob Change Biol 12:1969–1976
Moen A (ed) (1999) National atlas of Norway: vegetation.Norwegian Mapping Authority, Hønefoss
Myneni RB, Keeling CD, Tucker CJ, Asrar G, Nemani RR(1997) Increased plant growth in the northern high lati-tudes from 1981 to 1991. Nature 386:698–702
Nordli Ø, Wielgolaski FE, Bakken AK, Hjeltnes SH, Måge F,Sivle A, Skre O (2008) Regional trends for bud burst andflowering of woody plants in Norway as related to climatechange. Int J Biometeorol 52:625–639
Parmesan C (2007) Influences of species, latitudes and method-ologis on estimates of phenological response to globalwarming. Glob Change Biol 13:1860–1872
Parmesan C, Yohe G (2003) A globally coherent fingerprint ofclimate change impacts across natural systems. Nature 421:37–42
Pinzón J, Brown ME, Tucker CJ (2005) Satellite time seriescorrection of orbital drift artefacts using empirical modedecomposition. In: Huang N (ed) Hilbert-Huang transform:introduction and applications. World Scientific, Hacken-sack, NJ, p 167–186
Poikolainen J, Karhu J, Kubin E (1996) Development of a plantphenological observation network in Finland. Res RepFinnish Forest Res Inst 623:97–101
Post E, Stenseth NC (1999) Climatic variability, plant phenol-ogy, and northern ungulates. Ecology 80:1322–1339
Pudas E, Leppälä M, Tolvanen A, Poikolainen J, Venäläinen A,Kubin E (2008a) Trends in phenology of Betula pubescensacross the boreal zone in Finland. Int J Biometeorol 52:251–259
Pudas E, Tolvanen A, Poikolainen J, Sukuvaara T, Kubin E(2008b) Timing of plant phenophases in Finnish Lapland in1997–2006. Boreal Environ Res 13:31–43
Raynolds MK, Comiso JC, Walker DA, Verbyla D (2008) Rela-tionship between satellite-derived land surface tempera-tures, arctic vegetation types, and NDVI. Remote SensEnviron 112:1884–1894
Schaber J, Badeck FW (2005) Plant phenology in Germanyover the 20th century. Reg Environ Change 5:37–46
Scheifinger H, Menzel A, Koch E, Peter C, Ahas R (2002)Atmospheric mechanisms governing the spatial and tempo-
ral variability of phenological phases in central Europe. IntJ Climatol 22:1739–1755
Schwartz MD, Reed BC, White MA (2002) Assessing satellitederived start-of-season measures in the conterminous USA.Int J Climatol 22:1793–1805
Shutova E, Wielgolaski FE, Karlsen SR, Makarova O and others(2006) Growing seasons in nordic mountain birch in north-ernmost Europe as indicated by long-term field studies andanalyses of satellite images. Int J Biometeorol 51:155–166
Slayback DA, Pinzón JE, Los OS, Tucker CJ (2003) NorthernHemisphere photosynthetic trends 1982–1999. Glob ChangeBiol 9:1–15
Statistics Norway (2008) Guide to environment statistics 2008.Statistics Norway, Oslo
Stöckli R, Vidale PL (2004) European plant phenology and cli-mate as seen in a 20-year AVHRR land-surface parameterdata set. Int J Remote Sens 25:3303–3330
Studer S, Appenzeller C, Defila C (2005) Inter-annual variabil-ity and decadal trends in alpine spring phenology: a multi-variate analysis approach. Clim Change 73:395–414
Studer S, Stöckli R, Appenzeller C, Vidal PL (2007) A compar-ative study of satellite and ground-based phenology. Int JBiometeorol 51:405–414
Swedish Forest Agency (2007) The Swedish forest. SwedishForest Agency, Jönköping
Swedish Forest Agency (2008) Statistical yearbook of forestry2008. Swedish Forest Agency, Jönköping
Tucker CJ, Slayback DA, Pinzón JE, Los SO, Myneni RB, Tay-lor MG (2001) Higher northern latitude normalized differ-ence vegetation index and growing season trends from1982 to 1999. Int J Biometeorol 45:184–190
Tucker CJ, Pinzón JE, Brown ME (2004) Global InventoryModeling and Mapping Studies, NA94apr15b.n11-VIg, 2.0.Global Land Cover Facility, University of Maryland, Col-lege Park, MD
Tucker CJ, Pinzón JE, Brown ME, Slayback D and others(2005) An extended AVHRR 8-km NDVI dataset compatiblewith MODIS and SPOT vegetation NDVI data. Int J RemoteSens 26:4485–4498
Tuhkanen S (1980) Climatic parameters and indices in plantgeography. Acta Phytogeo Suec 67:1–105
Tveito OE, Førland EJ, Alexandersson H, Drebs A, Jónsson T,Tuomenvirta H, Vaarby Laursen E (2001) Nordic climatemaps. DNMI Report 06/01, The Norwegian MeteorologicalInstitute, Oslo
Verbyla D (2008) The greening and browning of Alaska basedon 1982–2003 satellite data. Glob Ecol Biogeogr 17:547–555
White MA, Thornton PE, Running SW (1997) A continentalphenology model for monitoring vegetation responses tointerannual climatic variability. Global Biogeochem Cycles11:217–234
White MA, De Beurs KM, Idan KD, Inouye DW and others(2009) Intercomparison, interpretation, and assessment ofspring phenology in North America estimated from remotesensing for 1982–2006. Glob Change Biol (in press) doi:10.1111/j.1365-2486.2009.01910.x
Wielgolaski FE (2009) Old Norwegian phenodata series in rela-tion to recent ones. Ital J Agrometeorol 14:33–38
Zhang K, Kimball JS, Hogg EH, Zhao M, Oechel WC, CassanoJJ, Running SW (2008) Satellite-based model detection ofrecent climate-driven changes in northern high-latitudevegetation productivity. J Geophys Res 113:G03033
Zhou L, Tucker CJ, Kaufmann RK, Slayback D, Shabanov NV,Myneni RB (2001) Variations in northern vegetation activityinferred from satellite data of vegetation index during 1981to 1999. J Geophys Res 106(17):20069–20083
286
Submitted: April 6, 2009; Accepted: August 11, 2009 Proofs received from author(s): September 5, 2009