Embed Size (px)
Citation preview

AN
NU
AL
RE
PO
RT
EnduringStrength
GrowingMomentum,

ABOUT THE COVERRobinsons Bank Corporation (Robinsons Bank
or Bank) is one of the fastest growing commercial banks in the Philippines today. The stride embodies the decisive steps the Bank will take to sustain its growth momentum. The establishment of solid foundation enabled the Bank to deliver and fulfill the changing needs of its customers. Further, the stride encapsulates the significant progress the Bank is undertaking to become the Bank of Choice.
CONTENTS
01 Vision, Mission and Core Values 02 Who We Are 04 Consolidated Financial Highlights 06 Message from the Chairman and the President & CEO14 Flying High with Cebu Air, Inc.: Delivering Innovative Solution to a Business Challenge16 Streamlining Processes: Designing Solutions Fit to Customer Needs 18 Going the Extra Mile: Synergy and Personalized Service 20 Celebrating a Decade of Supporting Lives and Making Dreams a Reality 22 Promoting Inclusive Growth: Bridging Opportunities through Accessible Financing 24 Enabling Entrepreneurs: Partnering through Convenient Access to Capital and Financial Literacy 28 Board of Directors 32 Senior Advisory Board33 Key Officers34 Board of Directors Profile
38 Corporate Governance 45 Risk Management62 Products and Services66 Branch Directory 72 Table of Organization74 List of Officers 76 Committees Reporting to the Board77 Lending Segment79 Business Development Segment/Treasury 80 Retail Banking Group 81 Operations, Control, and Governance 83 Sustaining Human Capital Growth 85 Corporate Social Responsiblity89 Statement of Management’s Responsibility90 Independent Auditor’s Report93 Financial Statements 103 Notes to Financial Statements 192 Legazpi Savings Bank196 JG Summit Businesses

Concern ExcellenceLeadershipTeamworkIntegrityChange
We are the Bank of Choice driven to fulfill your changing needs.
Aiming to be better everyday.
Committed to provide to the:Customers – best experienceEmployees – winning cultureOwners – outstanding returnsCommunity – responsive organization
CORE VALUESVISION MISSION

2 Robinsons Bank Annual Report 2016
who we are
60%
60%
40%

3Robinsons Bank Annual Report 2016
4 Robinsons Bank Annual Report 20164
49,173
2014
2014
2014 20142015
2015
2015 20152016
2016
2016 2014 2015 2016 2016
41,211
57,676
43,668
77,612
63,295
34.6%
44.9%
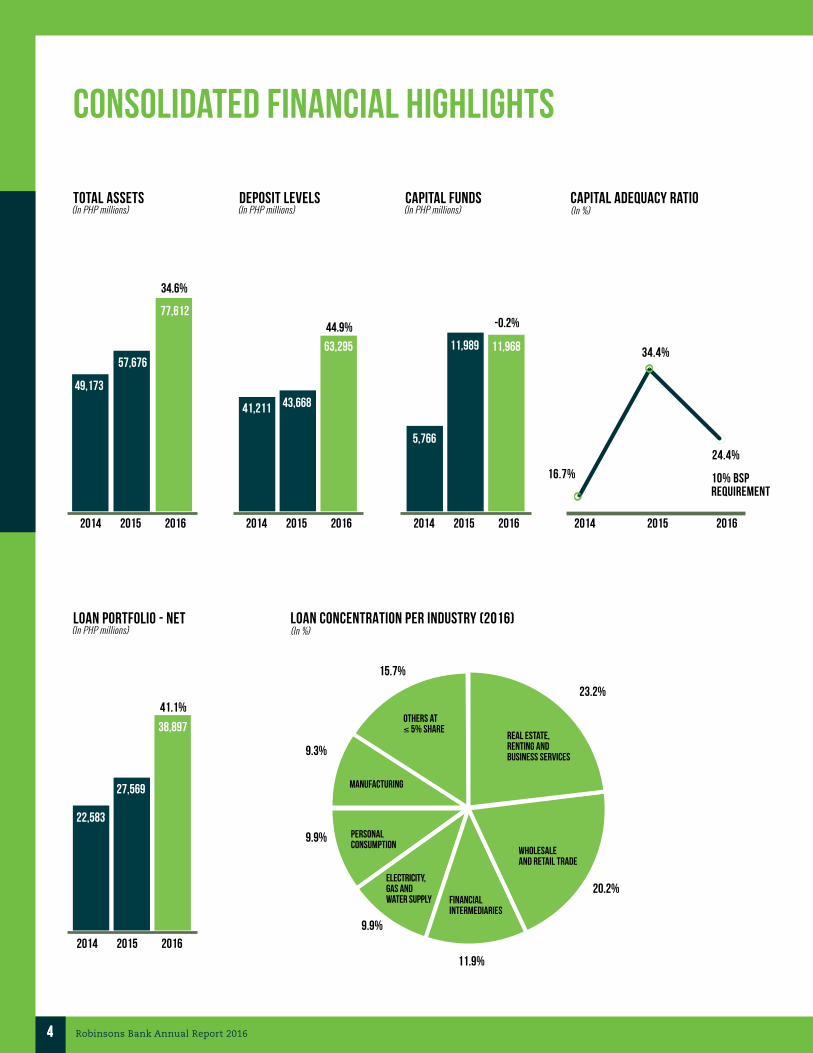
TOTAL ASSETS(In PHP millions)
loan portfolio - net(In PHP millions)
deposit levels(In PHP millions)
capital funds(In PHP millions)
5,766
11,989 11,968
-0.2%
capital adequacy ratio (In %)
34.4%
consolidated financial highlights
LOAN CONCENTRATION PER INDUSTRY (2016) (In %)
23.2%
20.2%
11.9%
9.9%
9.9%
9.3%
15.7%
Real estate, renting and business services
Wholesale and retail trade
Financial intermediaries
Electricity, gas and water supply
Personal consumption
Manufacturing
Others at ≤ 5% Share
16.7% 10% BSP Requirement
24.4%
22,583
27,569
38,897
41.1%
5Robinsons Bank Annual Report 2016
1,0401,118 1,139
4.6%
2014 2015 2016 2014 2015 20162014 2015 2016
2014 2015 2016
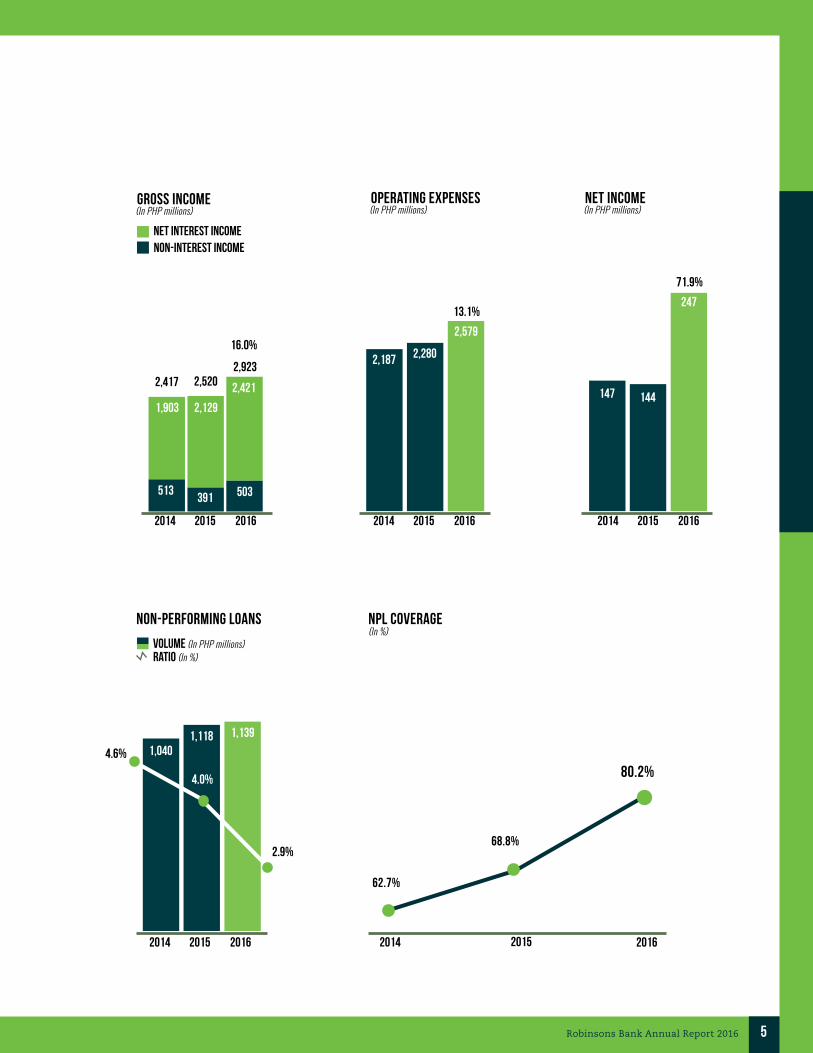
gross income(In PHP millions)
operating expenses(In PHP millions)
net income(In PHP millions)
non-performing loans
147 144
4.0%
2,187 2,280
2,579
13.1%
16.0%
71.9%
2.9%
513391 503
1,903 2,129
2,4212,417 2,5202,923
Non-interest incomenet interest income
ratio (In %)volume (In PHP millions)
npl coverage (In %)
2014 2015 2016
62.7%
68.8%
80.2%
247

6 Robinsons Bank Annual Report 2016
Lance Y. GokongweiChairman
message from the CHAIRMAN and the PRESIDENT & CEO

7Robinsons Bank Annual Report 2016
We begin this message with our profound gratitude to our customers, Board of Directors, and employees who have been with us throughout the years, building with us an extraordinary heritage that is distinctly Robinsons Bank.
2016 was a year of markedly global turning points driven by the surge of populist politics around the world – the unexpected outcome of the Brexit referendum and the result of the close US Presidential election race. Closer to home, in Asia-Pacific, China faced issues on debt, economic slowdown, and currency devaluation, while Japan combated slow growth influenced by the shock of Brexit, low inflation, aging population, and negative interest rate policy. The rising sentiment on anti-globalization in some parts of the world has impacted trade in the region and introduced risks to global growth. Notwithstanding the volatile global environment and in another election year, the Philippines remained to be one of the fastest growing economies in the region with 6.8% GDP growth. This broad-based growth was driven by a strong services sector, a revitalized manufacturing sector, and robust domestic consumption demand which was spurred by low inflation, low interest rates, increase in consumer confidence, higher OFW remittances, and growing BPO sector.
Riding on the wave of the country’s gains and benefitting from the completion of the Bank’s capacity-building thrust last year, Robinsons Bank achieved a significant growth in its net income. This growth was underpinned by strong business performance and steadfast dedication to our clients and communities.
In this era where banking products and services are commoditized especially because of the prevalent digitization which transformed the business landscape, Robinsons Bank was able to differentiate its business and increase market share through deepened client relationships. We take pride in what we have accomplished for our clients and we are grateful for their role in our growth. In the
succeeding pages, our clients provide their account about how we were able to make that difference by delivering value through deeply-rooted partnerships, creating relevance, and sustainability for their businesses and in their lives in the process.
Strong Financial Results Alongside the strong domestic economic
growth is the buoyant improvement by 7.7% of the financial sector. Likewise, we are pleased to report that Robinsons Bank posted a profitable year and contributed to the financial deepening of the banking industry in 2016. We were able to sustain our performance, with a record net income of PHP247.5 million, 71.9% higher than the previous year, and outpacing the industry growth of 14.0%. This was driven primarily by the increase in net interest income and non-interest income.
The Bank’s net interest margin for 2016 stood at 3.9%, surpassing the industry’s 3.2%. Robinsons Bank’s net interest income rose to PHP2.4 billion level, up by 13.7% compared to last year’s PHP2.1 billion. Moreover, our non-interest income climbed by 28.4% to PHP502.6 million from PHP391.4 million in 2015.
Robinsons Bank’s performance was supported by the asset base growth of 34.6% to PHP77.6 billion from PHP57.7 billion in 2015, beating the industry’s 12.4%. The Bank’s total assets had been expanding at a compounded annual growth rate of 19.2% over the last three years, almost doubling the industry’s 10.9%. The Bank’s lending model was successfully carried out, increasing our loan portfolio by 40.7% to PHP38.9 billion in 2016 with a good mix of growth for both consumer and commercial. Whereas the credit quality of our loan portfolio level has been managed with gross nonperforming loan (NPL) ratio dropping to 2.9% in 2016 from 4.0% in 2015. Furthermore, Robinsons Bank remained sound and well-capitalized with almost PHP12.0 billion total equity and capital adequacy ratio remains comfortably at 24.4%, well above BSP’s minimum requirement of 10.0%.

8 Robinsons Bank Annual Report 2016
Expanding the Retail Banking Network The Retail Banking Group (RBG) branch
expansion initiative intends to support the aggressive market penetration undertaken by the Bank to increase its deposits, client base, and push the cross-sell agenda. In 2016, we were able to strengthen our presence in key cities, allowing the Bank to deliver our services closer to our growing clientele by opening 11 branches and deploying 23 ATMs, ending the year with a total network of 134 branches and 225 ATMs strategically located nationwide.
This initiative, coupled with various deposit campaigns and strategic marketing also to support the Lending Segment, resulted to a 44.9% surge in our total deposits hitting PHP63.3 billion from last year’s PHP43.7 billion. We had a good deposit mix of current and saving accounts (CASA) and time deposits (TD). Our CASA upswing by 57.9% to PHP50.4 billion, while our TD rose 9.7%, reaching PHP12.9 billion in 2016.
Capitalizing on our strength in being part of a large conglomerate, the Bank engaged the networks
across the supply chain. We continue to work with our conglomerate in offering complete financial value chain proposition to the entire ecosystem, addressing both personal and corporate financial requirements. While we pursue providing lending facilities to everyone in the supply chain and we are committed to innovate on our offerings every single day, we also foster collaborative interactions with our conglomerate to expand our deposit base.
The RBG Sales platform is critical to our business. Several big accounts and corporate deals were closed because of the branch referrals. The Bank’s other business teams will continue to collaborate with RBG to ensure better client coverage, responding better to the broad range of their changing needs. Intensifying the Consumer Lending Business
Consumer lending propelled the Lending Segment as well as the Bank’s growth for 2016. The broad spectrum of consumer markets handled by the two major lending groups, the Consumer Finance Group (CFG) which offers home, auto (including fleet financing), personal (salary),
message from the CHAIRMAN and the PRESIDENT & CEOKey Business Drivers
PHP in millions, except ratios and where otherwise noted 2016 2015 YoY∆
Key Performance Indicators (KPIs)
Assets 77,612 57,659 35%Liabilities 65,644 45,670 44%Equity 11,968 11,968 0%Capital Adequacy Ratio (CAR) 24.4% 34.4% (10%)Net Income 248 144 72%Net Interest Margin 3.9% 4.3%Number of Branches (n) 134 123 9%Number of ATMs (n) 225 202 11%Headcount (n) 1,608 1,357 18%
Profitability
Interest Income 3,069 2,693 14%Interest Expense 649 564 15%Other Income 503 391 28%Operating Expense 2,579 2,280 13%Net Income 248 144 72%
Deposits
Total Deposits 63,295 43,668 45%Current and Savings Deposits 22,157 18,073 23%Term Deposit and Special Savings 33,592 19,857 69%FCDU Deposits 7,546 5,737 32%
Loans
Current Loans 37,802 26,552 42%Non-Performing Loans (NPL) 1,139 1,118 2%Gross Loans 38,941 27,671 41%Net NPL 354 406 (13%)Gross NPL ratio 2.9% 4.0%Net NPL ratio 0.9% 1.5%
InvestmentsSecurity Holdings 15,296 10,955 40%Deposit in BSP and in Other Banks 17,506 14,612 20%Trust Volume 15,508 12,743 22%
*Note: 2015 - as Restated

9Robinsons Bank Annual Report 2016
and small business loans and the Community Banking Group (CBG) which offers motorcycle financing and microfinance loans, were supported by the bank wide capacity building both in terms of people and process.
As of end-2016, the total consumer portfolio grew substantially by 44.7% to PHP11.0 billion compared to PHP7.6 billion in 2015. The huge increase in the consumer loan volume was driven by the continued expansion of the Philippine economy and the low interest rates boosting the demand for home and auto loans.
In CFG, the hike in the home loans by 118% was generated through accreditation and partnerships with real estate leaders, flexible terms, competitive rates, and promos. Likewise, the 212% hike of the auto loans was the result of active relationship with dealers, improved processes to meet industry standards, promos, better financing terms, and wider geographic reach brought about by the branch expansion especially in key cities outside Metro Manila.
In CBG, the loans in Microfinance expanded beyond 40% and this was attributable to the improved capacity building which resulted to efficient delivery of loan services as well as stronger sales marketing force. Loans in Motorcycle segment also posted an above 40% growth owing to the enhanced loan processes and stronger relationships with the accredited dealerships via attractive financing rates and terms. Notably, despite the loan growths in CBG, the past due levels dropped from double-digit to single digit in 2016. The loan growths of CFG’s home and auto, together with CBG’s microfinance and motorcycle, surpassed the industry’s growth records.
As part of the Bank’s process improvement in the consumer lending segment, in CFG, we implemented the Loans Origination System (LOS) and Document Management System for home and auto loans to deliver loan approvals at par with the industry. While in CBG, a mobile-based Motorcycle Back-End System Tool (MC BEST) was rolled out to more than 130 partner dealer outlets which significantly improved the loan payment collections processing and hence lower past due levels. Using technology effectively to enable process improvements translated in the huge improvement of our loan portfolio.
The Bank is also compliant to regulatory initiatives in the country that ensures a sound and healthy credit market. Thus, in June 2016, the Bank complied to Republic Act No. 9510, otherwise known as the Credit Information System Act as a submitting entity. Likewise, the Bank has been continuously strengthening our credit quality structure as lending volume grows.
The Bank also saw the need to increase the lending group’s footprint in the provincial areas, thus lending centers were opened and channels were enhanced. With these diversified touchpoints, we are confident that the lending group will be able to further expand its customer base and reach, and deliver the highest level of customer service to our clients.
Introducing New Products and Services Innovation is inherent in the way we do
business and customer experience is intrinsic in our innovation strategies.
In 2016, the key themes of our innovation centered on products and services to protect our customers. Robinsons Bank is compliant with the global standard for the debit cards and ATMs as we implemented the Europay Mastercard Visa
In 2016, we were able to strengthen our presence in key cities, allowing the Bank to deliver our services closer to our growing clientele by opening 11 branches and deploying 23 ATMs, ending the year with a total network of 134 branches and 225 ATMs strategically located nationwide.
“
“

10 Robinsons Bank Annual Report 2016
(EMV) technology. The Bank’s adoption of the EMV chip technology will provide additional security to our cardholders as they transact using their debit card via ATM or POS, compared to the traditional magnetic stripe. We launched the Robinsons Bank Visa Debit Card (VDC), a chip-enabled debit card which allows online purchases, bills payment, shopping, dining, and cash withdrawal worldwide. Now, our cardholders can have a reliable and secure payment transaction anytime anywhere.
Likewise, with the protection of our customers in mind, we launched our non-life insurance product, the Robinsons Bank ATM Guard, which provides our depositors a guarantee to recover lost cash withdrawn from ATMs in case of robbery.
Growing Transaction Banking Demonstrating our ability to deliver strategic
solutions to our corporate and small-and medium-sized enterprise (SME) clients, the Transaction Banking Group (TBG) grew its portfolio in 2016 by commercializing on the product and technology build that it executed in 2015. Aiming to be the best in class service provider for our clients, our top priority remains in helping our clients achieve their objectives with the best possible solutions and products we can provide to enable our corporates increase efficiency, streamline processes, optimize performance and gain competitive advantage. Our highly consultative approach allows us to build effective end-to-end solutions for our client’s value proposition, connecting the supply chain ecosystem for greater efficiency.
Our Approach End-to-End SolutionsWe develop solutions that are intimately linked with our clients’ end-to-end processes and ultimately integrating seamlessly with our clients’ Enterprise Resource Planning (ERP) systems for straight-through processing. The approach resulted to operational and cost efficiencies for our clients and enhanced visibility of cash in their organizations. The value that we provided in enhancing efficiencies and visibility contributed 25% growth in the transaction values that we processed.
We have grown our SME client base in 2016 by 30% through offering solutions that help in the automation of some of their processes. We also
tapped the SME client base by connecting the communities around our large corporates which resulted to a seamless flow of interactions and transactions. By covering our footprint across client category types, we have increased our total client portfolio by 32%.
Future-Ready TechnologyBy leveraging on cutting-edge solutions, we have
been able to integrate seamlessly with our clients’ ERP systems for straight-through processing. This strategy helped increase the volume of transactions that we process by 12% from 2015. Enrollment to our retail internet banking channel grew by 5% in 2016 and enrollment to our corporate internet banking platform grew by 20%. Access to our corporate and retail online banking sites are available on a 24x7, 365 days basis. We continue to strive to do better every year so that our customers can have a great experience in interacting with us, thus in 2017, we will be upgrading our retail internet banking platform and introduce our mobile banking app to further delight our customers. Delivering Compelling Value Propositions
Our clients mean a lot to us and we make sure that our interactions with them add value to the relationship and enable them to meet their objectives. This year, we have seen 17% growth in our cash card enrollment which ultimately contributes to the financial inclusion agenda of our country. In cash management, we came out with six new products which were launched as part of our innovative solution offerings, addressing our clients’ goals in optimizing their cash by enhancing income and reducing expense.
Superior Client ServiceClients always have been at the center of our
business, and complementing our business with strong, customer-centric delivery is a top priority. Our After Sales Service works hand in hand with our clients to ensure that issues are identified at an early stage and to appropriately escalate concerns to keep small problems from manageable, resulting in better client service. Our service delivery is measured by a turn-around time for closure of issues in which 95% have been closed in a timely manner.
message from the CHAIRMAN and the PRESIDENT & CEO

11Robinsons Bank Annual Report 2016
Elfren Antonio S. SartePresident & CEO

12 Robinsons Bank Annual Report 2016
Diversifying TreasuryDespite the global market uncertainty coupled
with geopolitical risks, Treasury was able to improve trading and foreign exchange gain to a total of PHP260.2 million in 2016 from PHP164.6 million in 2015. Interest income likewise increased from PHP646.7 million in 2015 to PHP741.3 million in 2016, albeit the drop in yields arising out of the delays in the US Fed tightening. Treasury focused investments in high yielding corporate bonds by increasing portfolio from PHP4.0 billion in 2015 to PHP6.7 billion in 2016 and this strategy greatly contributed to the Bank’s bottom line.
Treasury also increased its focus in tapping the client base by building sales capacity to expand its volume in both Peso and US Dollars. The additional sales force also centered on improving client servicing through regular face-to-face interactions and providing updates on market performance. This approach allowed us to deepen our relationships and meet the clients’ servicing requirements in their investments and foreign exchange transactions.
Sensitive to the needs of our customers, Robinsons Bank likewise expanded its over the counter offerings for third currencies to meet client demand.
Growing Trust and Investments The Trust and Investments Group (TIG) generated
a 24.3% growth in total assets under management (AUM) in 2016, or an incremental increase of PHP3.0 billion from end-2015’s PHP12.5 billion AUM, attributable to a 25.6% growth in the Investment Management Accounts (IMA), 3.4% growth in Trust and Other Fiduciary Accounts (TOFA), and 180.9% growth in Unit Investment Trust Fund (UITF) accounts, generated primarily from the launching of the Tax-Exempt Retirement UITF in October 2016, as well as additional funds generated for the Money Market UITF.
TIG launched the Robinsons Bank Tax Exempt Retirement UITF. It is a Peso-denominated UITF for BIR-approved tax exempt-certified retirement plans of companies. Portfolio is invested in peso-denominated fixed income and exchange-listed preferred shares, with the option to invest a portion
in USD-denominated securities with initial and maintaining balance of at least PHP1.0 million with minimum additional participation of PHP1,000.00 and with no holding period.
The Robinsons Bank UITF had outstanding performance in 2016, ranking 2nd out of 18 Balanced Fund UITFs, while the Robinsons Bank Money Market Fund UITF ranked 12th out of the 37 Money Market Fund UITFs, as reported by the official Trust Officers Association of the Philippines (TOAP) ranking of various UITFs’ year-on-year return-on-investment (ROI).
Investing in Information Technology Cyber security was a key concern in 2016 and is
still at the top of our minds today. We want to make sure that we are providing our clients with a safe and secure environment when they bank with us. With that in mind, the Bank strengthened its defenses and invested on a host of world-class IT and cyber security solutions to protect the Bank’s business, improve compliance, remediate threats, reduce insider fraud, theft and data leakage and reduce pre-exploit risks.
WE MADE MEANINGFUL PROGRESS IN 2016. LOOKING AHEAD, we are VERY MUCH EXCITED. THE INITIATIVES ARE IN PLACE AND THE FOUNDATIONS HAVE BEEN FORTIFIED. WE ENTERED 2016 GUIDED BY OUR FIVE-YEAR PLAN IMPLEMENTATION INITIATIVES, AND WE WILL WELCOME 2017 WITH MORE FOCUSED STRATEGIES TO SUSTAIN OUR GROWTH MOMENTUM.
“
“
message from the CHAIRMAN and the PRESIDENT & CEO

13Robinsons Bank Annual Report 2016
Digitizing Processes and Process Improvement Digitization is key to delighting our customers
and as such the Bank has re-engineered some of its processes to improve turn-around time, increase over-all efficiency and minimize risks. Among the highlights for the year were the implementation of the Bulk Account Opening and Card Linking (BAO-CL) process, the Check Imaging Clearing System (CICS) and the Document Management System (DMS).
The BAO-CL took away the burdensome task of individual account opening and card linking from the branches to the Operations Processing Group, allowing faster turn-around times and enabling branches to focus on frontline business activities.
Under the CICS, no physical delivery of checks will be needed as the system only requires the digital images of checks and their electronic payment information to be transmitted to the paying bank beginning January 2017. The new check clearing process is expected to speed up the crediting of funds to depositors’ accounts to only one banking day. Robinsons Bank was among the first banks to join the CICS pilot run in 2016.
The Bank also embarked on document digitization by acquiring a DMS to control the creation and authentication of scanned documents, manage its storage and facilitate convenient retrieval of any scanned document when needed. This solution has been rolled out to Retail Banking Group, Purchasing & Admin and Lending Group for Auto & Housing Loans. This project will soon be implemented in all business units of Robinsons Bank.
Our Commitment Moving ForwardWe have made meaningful progress in 2016.
Looking ahead, we are very much excited. The initiatives are in place and the foundations have been fortified. We entered 2016 guided by our five-year plan implementation initiatives, and we will welcome 2017 with more focused strategies to sustain our growth momentum.
These achievements would not have been possible without the hard work, dedication, and leadership of our Board of Directors. Thank you for your continuous guidance, this has been integral to the success of Robinsons Bank. Our special thanks to Wilfred T. Co, our former Senior Advisory Board member, for his significant contributions to the Bank.
Our recognition goes as well to our Executive Committee partners and the rest of the officers of the Bank for delivering steadfast service in positioning the Bank to where it is now.
Equally, we would like to acknowledge the more than 1,600 RBankers who remain focused in creating and sustaining lifelong relationships with our valued customers.
We would like to thank our clients for the trust and confidence bestowed upon Robinsons Bank. As Robinsons Bank moves forward, we will continue to be your partner in achieving your goals and dreams. Thank you for allowing Robinsons Bank to be your Bank of choice, driven to fulfill your changing needs.
Lance Y. Gokongwei Elfren Antonio S. Sarte

CLIENT FEATURE: CEBU AIR, INC.
FLYING HIGH WITH CEBU AIR, INC.: DELIVERING INNOVATIVE SOLUTION TO a BUSINESS CHALLENGE
“The Bank spent considerable time understanding the requirements of CEB and provided resources and technical assistance to implement the facility.”
– Elynore J. Villanueva Treasurer of Cebu Air, Inc.
14 Robinsons Bank Annual Report 2016
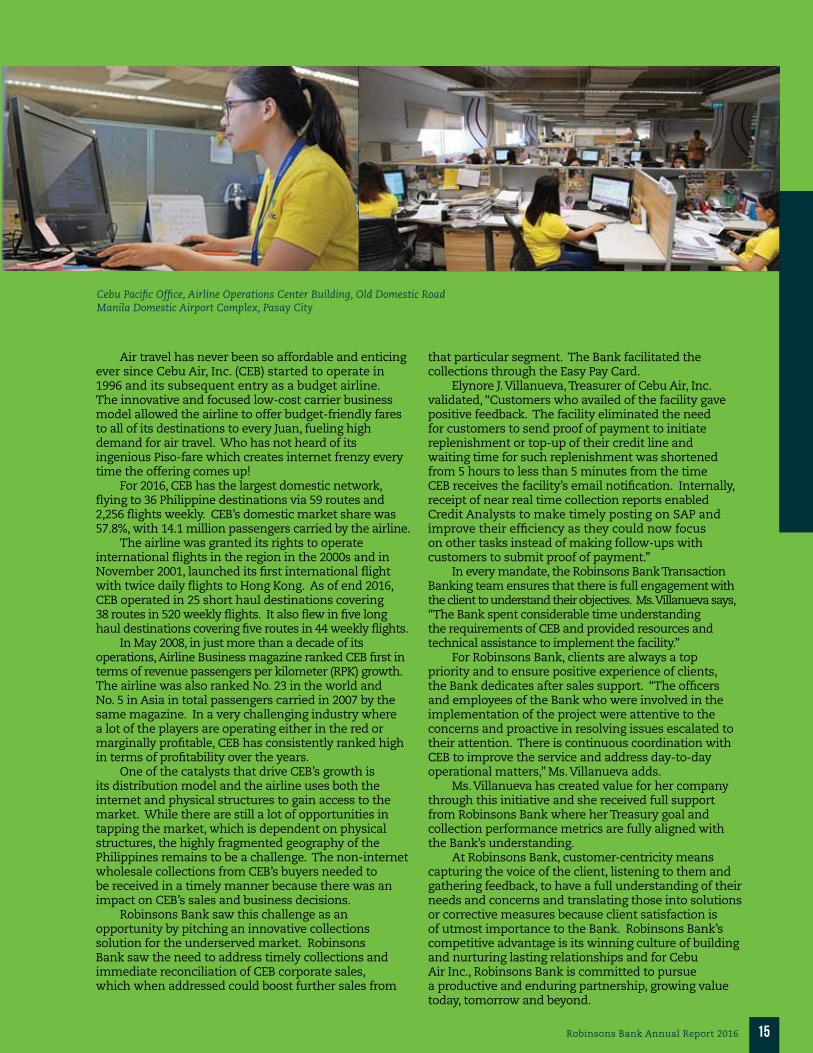
Cebu Pacific Office, Airline Operations Center Building, Old Domestic Road Manila Domestic Airport Complex, Pasay City
15Robinsons Bank Annual Report 2016
that particular segment. The Bank facilitated the collections through the Easy Pay Card.
Elynore J. Villanueva, Treasurer of Cebu Air, Inc. validated, “Customers who availed of the facility gave positive feedback. The facility eliminated the need for customers to send proof of payment to initiate replenishment or top-up of their credit line and waiting time for such replenishment was shortened from 5 hours to less than 5 minutes from the time CEB receives the facility’s email notification. Internally, receipt of near real time collection reports enabled Credit Analysts to make timely posting on SAP and improve their efficiency as they could now focus on other tasks instead of making follow-ups with customers to submit proof of payment.”
In every mandate, the Robinsons Bank Transaction Banking team ensures that there is full engagement with the client to understand their objectives. Ms. Villanueva says, “The Bank spent considerable time understanding the requirements of CEB and provided resources and technical assistance to implement the facility.”
For Robinsons Bank, clients are always a top priority and to ensure positive experience of clients, the Bank dedicates after sales support. “The officers and employees of the Bank who were involved in the implementation of the project were attentive to the concerns and proactive in resolving issues escalated to their attention. There is continuous coordination with CEB to improve the service and address day-to-day operational matters,” Ms. Villanueva adds.
Ms. Villanueva has created value for her company through this initiative and she received full support from Robinsons Bank where her Treasury goal and collection performance metrics are fully aligned with the Bank’s understanding.
At Robinsons Bank, customer-centricity means capturing the voice of the client, listening to them and gathering feedback, to have a full understanding of their needs and concerns and translating those into solutions or corrective measures because client satisfaction is of utmost importance to the Bank. Robinsons Bank’s competitive advantage is its winning culture of building and nurturing lasting relationships and for Cebu Air Inc., Robinsons Bank is committed to pursue a productive and enduring partnership, growing value today, tomorrow and beyond.
Air travel has never been so affordable and enticing ever since Cebu Air, Inc. (CEB) started to operate in 1996 and its subsequent entry as a budget airline. The innovative and focused low-cost carrier business model allowed the airline to offer budget-friendly fares to all of its destinations to every Juan, fueling high demand for air travel. Who has not heard of its ingenious Piso-fare which creates internet frenzy every time the offering comes up!
For 2016, CEB has the largest domestic network, flying to 36 Philippine destinations via 59 routes and 2,256 flights weekly. CEB’s domestic market share was 57.8%, with 14.1 million passengers carried by the airline.
The airline was granted its rights to operate international flights in the region in the 2000s and in November 2001, launched its first international flight with twice daily flights to Hong Kong. As of end 2016, CEB operated in 25 short haul destinations covering 38 routes in 520 weekly flights. It also flew in five long haul destinations covering five routes in 44 weekly flights.
In May 2008, in just more than a decade of its operations, Airline Business magazine ranked CEB first in terms of revenue passengers per kilometer (RPK) growth. The airline was also ranked No. 23 in the world and No. 5 in Asia in total passengers carried in 2007 by the same magazine. In a very challenging industry where a lot of the players are operating either in the red or marginally profitable, CEB has consistently ranked high in terms of profitability over the years.
One of the catalysts that drive CEB’s growth is its distribution model and the airline uses both the internet and physical structures to gain access to the market. While there are still a lot of opportunities in tapping the market, which is dependent on physical structures, the highly fragmented geography of the Philippines remains to be a challenge. The non-internet wholesale collections from CEB’s buyers needed to be received in a timely manner because there was an impact on CEB’s sales and business decisions.
Robinsons Bank saw this challenge as an opportunity by pitching an innovative collections solution for the underserved market. Robinsons Bank saw the need to address timely collections and immediate reconciliation of CEB corporate sales, which when addressed could boost further sales from

STREAMLINING PROCESSES: DESIGNING SOLUTIONS FIT TO CUSTOMER NEEDS
16 Robinsons Bank Annual Report 2016
CLIENT FEATURE: FLUID TECHNOLOGIES AND ENVIRONMENTAL MANAGEMENT, INC.
Emilio D. Bayog, Jr. PME Corporate Planning Director
Eden B. Culala Chairman and CEO
Rodrigo M. Culala President/COO
“We have an easier time contacting support every time problems are encountered.” – Eden B. Culala Chairman and CEO Fluid Technologies and Environmental Management, Inc.

17Robinsons Bank Annual Report 2016
Fluid Technologies and Environmental Management, Inc. (FluidTech) was encountering problems with their payroll processing supported by their previous bank. There were several instances where FluidTech could not access the bank-provided payroll system because of glitches and the committed support was not timely for their needs.
Robinsons Bank Marikina Branch Center Head Leah P. Claveria learned about what FluidTech was experiencing. “Upon hearing FluidTech’s problem, I immediately took the opportunity to offer Robinsons Bank’s SME Builder solution set, which includes HRIS Payroll and CheckPro facilities,” Leah said.
HRIS Payroll is Robinsons Bank’s stand-alone system that streamlines payroll processing by automating and linking the time-keeping, leave management, payroll administration, and generation of statutory reports, which ultimately results to payroll management efficiencies. CheckPro, on the other hand, is a self-serve system that automates corporate check printing. The facility enables a company to define their ledger and as checks are created, the payable can be assigned to the appropriate ledger for accurate payment type tracking. In addition to that, the facility can generate the BIR Form 2307 for withholding tax certification.
Spouses Eden and Rodrigo Culala established FluidTech in 1998. With almost 20 years of operation, the Corporation is engaged in providing products, technologies, and services for water, sewage, and waste water treatment. It is an enterprise that regards environment, health, and safety as equally important in delivering their business. They expanded their business and built a vast clientele covering different industries
over the past years. The client base that they have is a testament to the quality of service and products that they provide.
FluidTech became a depositor of Robinsons Bank in 2015. With the recent business relationship, Leah hopes to further nurture the alliance by making sure that all their banking requirements are met in addition to ensuring total customer satisfaction.
Today, because of the automation benefits brought about by Robinsons Bank’s HRIS Payroll and CheckPro solutions, FluidTech’s payroll and supplier payments are efficient and personnel time is more productive. This allows the company to fully focus on their customers and on new business opportunities. The pain point experienced from their previous bank was additionally addressed by the Robinsons Bank Cash Management Team – “We have easier time contacting support every time problems are encountered,” said Eden Culala, Chairman and CEO of Fluid Technologies and Environmental Management, Inc. The consistent personalized customer experience is further extended by Leah’s branch where she ensures that FluidTech’s calls are always prioritized and attended to.
Robinsons Bank shows commitment to its clients by addressing their business challenges. In the case of FluidTech, Robinsons Bank has provided access to digital technologies that enabled them to operate efficiently, raise their productivity, and lower their costs. Recognizing that trust is fundamental to client relationships. Robinsons Bank is committed to recommending solutions that serve our client’s long-term goals and build partnerships to foster their growth.
Sewage Treatment Plant of Xentro Mall Tanay, Rizal, completed in September 2016
Rodrigo M. Culala President/COO
Sewage Treatment Plant of Xentro Mall Angono, Rizal, completed in August 2016
Wastewater Treatment Facility for Andok’s Commissary in Balete, Batangas, completed in 2014
Centralized Sewage Treatment Facility of Cathay Land Industrial Park in Silang, Cavite, completed in 2015

18 Robinsons Bank Annual Report 2016
CLIENT FEATURE: PTT PHILIPPINES CORPORATION
“On behalf of PTT Philippines, we want to thank and appreciate your support and assistance in all our banking needs. We are highly pleased with your exemplary level of service and professional knowledgeable staff. Your attention to details, great communication skills, and ready friendly smile made our experience even better than expected. We are delighted to be associated with you in the business and we look forward to another successful year together with you. Well done and keep up the good performance.” – Danilo AlabadoPTT Phils. Trading Corp. General Manager
going the extra mile: synergy and personalized service
PTT Lucena Gasoline Station

(L to R) PTT Chief Finance Officer Patrinee Suponthana, PTT President & CEO Sukanya Seriyothin with RBG AVP Michael Lawrence Posadas, President & CEO Elfren Antonio Sarte and Chairman Lance Y. Gokongwei
19Robinsons Bank Annual Report 2016
In 1998, the Philippine Congress enacted Republic Act 8479, otherwise known as “Downstream Oil Industry Deregulation Act of 1998,” which is the policy of the country” to liberalize and deregulate the downstream oil industry in order to ensure a truly competitive market under a regime of fair prices, adequate and continuous supply of environmentally-clean and high quality petroleum products.”
As the country liberalized the oil market, PTT Public Company Limited (PTTPLC) saw this as an opportunity to expand its oil business in the Philippines as they perceived the country’s growing economy and huge available market. PTTPLC established PTT Philippines whose primary business is marketing of refined petroleum products and lubricants.
PTT is a Thai acronym for Por Tor Tor, which means Petroleum Authority of Thailand. PTTPLC is Thailand’s largest and only fully-integrated oil and gas company and state enterprise under the control of Thailand’s Ministry of Energy. It is also the only company in Thailand that is listed in the Fortune Global 500 companies and ranked as 190th by Forbes Global 2000. To date, PTTPLC operates in seven ASEAN countries and has more than 50 independent subsidiaries operating globally.
With its 20 years of operations here in the country, its retail network now spans from Luzon to Visayas. In 2016, PTT Philippines announced its PHP5 billion expansion plan from 2017-2021 in the country which covers increase of its retail network to 300 and setting up its Amazon Café brand. At present, PTT Philippines is the major fuel supplier of various domestic and international airlines and marine vessels which includes Cebu Air, Inc., Robinsons Bank’s sister company, as one of its clients.
Being able to partner and address the needs of the dynamic and growing organization like PTT Philippines is an achievement for the Bank. The demonstration of the collective efforts from the RBG, Lending, TBG, and Treasury groups culminated the commencement of a successful partnership. As a partner bank, Robinsons Bank is committed to support PTT Philippines by providing personalized interactions to better understand its banking needs.
According to Rodney D. Cruz, Treasury Foreign Exchange (FX) Marketing Officer, “The relationship with PTT Philippines expanded because Robinsons Bank was able to meet their requirements.
Aside, we were able to manage their accounts with ease on their part and we always make them feel valued.”
“With PTT as one of the Bank’s material clients, we always ensure to raise the bar of service excellence in handling all their transactional needs. We guarantee that a personalized service is carried out notwithstanding logistics,” said Michael Lawrence S. Posadas, Makati Cluster 3 Head.
According to Danilo Alabado, PTT Phils. Trading Corp. General Manager, “On behalf of PTT Philippines, we want to thank and appreciate your support and assistance in all our banking needs. We are highly pleased with your exemplary level of service and professional knowledgeable staff. Your attention to details, great communication skills, and ready friendly smile made our experience even better than expected. We are delighted to be associated with you in the business and we look forward to another successful year together with you. Well done and keep up the good performance.”
As PTT Philippines forges onto growth expansion in the country, Robinsons Bank will steadfastly strengthen the business relationship with them. Robinsons Bank is driven to deliver PTT’s banking needs with outstanding service and extended mileage.
ROBINSONS BANK MICROFINANCE
celebrating A DECADE OF SUPPORTING LIVES AND MAKING DREAMS A REALITY
20 Robinsons Bank Annual Report 2016
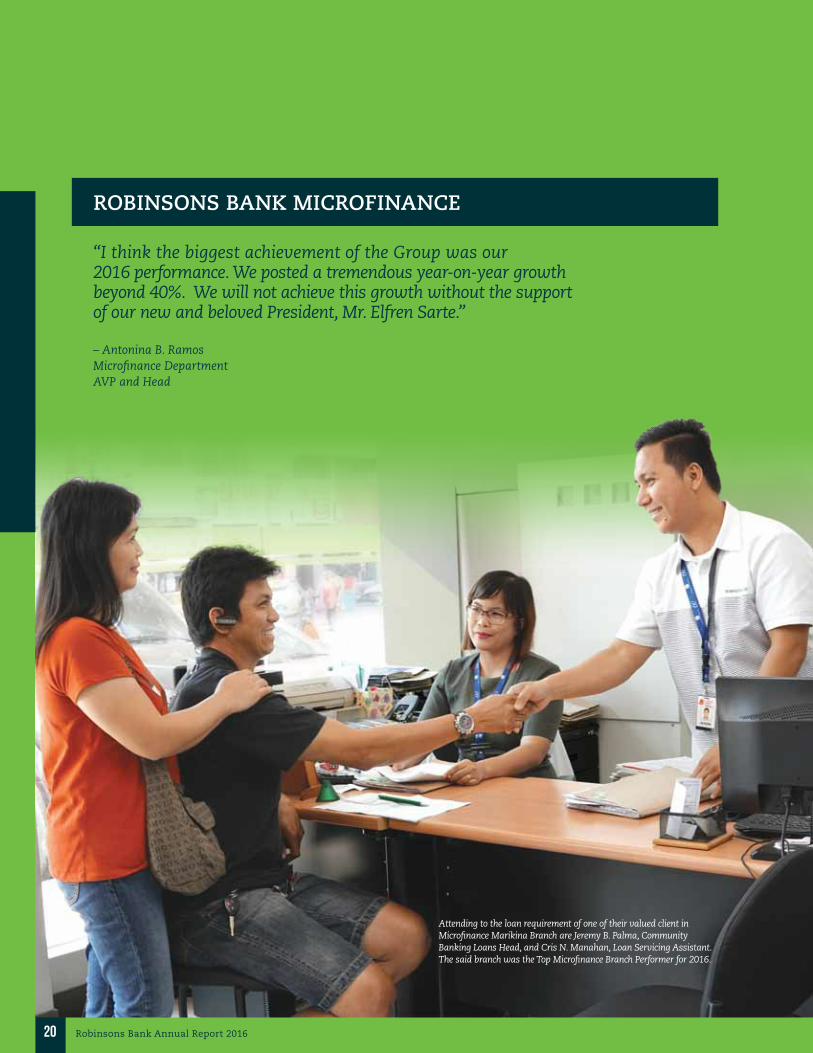
Attending to the loan requirement of one of their valued client in Microfinance Marikina Branch are Jeremy B. Palma, Community Banking Loans Head, and Cris N. Manahan, Loan Servicing Assistant. The said branch was the Top Microfinance Branch Performer for 2016.
“I think the biggest achievement of the Group was our 2016 performance. We posted a tremendous year-on-year growth beyond 40%. We will not achieve this growth without the support of our new and beloved President, Mr. Elfren Sarte.” – Antonina B. RamosMicrofinance Department AVP and Head

21Robinsons Bank Annual Report 2016
The poverty incidence in the Philippines remains high and the national government has been actively promoting strategies and implementing policies to combat poverty. As a developing country where hunger and unemployment remain as issues, there must be creation of economic activities to promote welfare and inclusive growth. Moreover, there must be sufficient opportunities to allow businesses to be established to support social development. However, the challenge remains on the viability of sources of capitalization to conduct and operate a business and allow one to make a living.
Microfinance is one of the social development initiatives to alleviate poverty. The micro-, small-, and medium-sized enterprises (MSMEs) are considered as the engine of economic growth. Globally, the assistance provided to MSMEs gained traction due to its benefits to the marginalized group of the society. In the Philippines, the National Strategy of the Philippines for Microfinance envisions a viable and sustainable MSMEs with greater access to financial services.
The BSP adheres to this strategy and promotes microfinance. Likewise, BSP supports financial inclusion. As BSP sees the importance of access to financial services for every household and business in accelerating their development process, so is Robinsons Bank. The Bank responds to this call of reaching out to a larger number of underserved and unserved Filipino entrepreneurs to improve their well-being and further contribute to the financial stability and economic development of the country.
Robinsons Bank provides access to financing for the micro, small, and medium entrepreneurs through the Microfinance Group. The Bank has a range of microfinance products and services which are designed to help the individual borrowers improve their businesses.
Antonina “Tonette” B. Ramos, Microfinance Department Head, said, “Robinsons Bank established this Group when I joined the Bank last June 1, 2007. I just realized, I am as old as our Bank’s Microfinance business. I am very grateful that Robinsons Bank trusted me to start this business as I was just 26 years old then.”
The Group has been supporting the microfinance industry for almost a decade and has been delivering a strong progress, having supported around PHP2.0 billion loan releases from 2007 to 2016 to the more than 50,000 micro, small, and medium entrepreneurs and their families. The assistance span from working capital, to renovation of business site, and to acquisition of business equipment.
Aside from the financial support, guidance and financial literacy are also provided to the clients, especially the virtue of saving. “The Group provides continual education on how to improve cash flow management, which are discussed every loan cycle application. With this, our client can draw a timely and reliable decision for their business. Likewise, we teach them how to manage their finances more efficiently,” Tonette said.
Robinsons Bank Microfinance has three products: Super Loan ng Bayan (SLB), SLB Plus, and CBG SME. The term payment for new loans ranges from two to 12 months, while repeat loans borrowers can avail of two to twelve months’ term payment.
The Group, through its almost 150 employees, is providing services via its 25 branches: seven in Metro Manila, six in Northern Luzon, seven in Southern Luzon, and five in other provinces. Soon, to serve greater number of MSME entrepreneurs, branches in Sto. Tomas [Batangas] and Tuguegarao will open.
The Group’s financial support flowed through the following industries: (1) Agriculture, Hunting and Forestry; (2) Fishing; (3) Wholesale and Retail, Repair of Motor Vehicles; (4) Transportation, Storage, and Communication; (5) Other Community, Social and Personal Services; and (6) Hotel and Restaurant.
After almost a decade, it was not just the lives of the Bank’s clients that progressed. Tonette herself, is a testimony of the operational success of the Bank’s Microfinance business. Tonette considers success not only through profits, but also through career growth of employees as well. “I remember during my interview, the former Bank President asked me how do I see myself in 10 years and I replied, I actually imagined myself as one of the Senior Officers of this Bank, managing a successful Microfinance Operation,” Tonette recalled.
Robinsons Bank Community Banking Group Microfinance takes pride in serving the MSME budding and aspiring entrepreneurs by providing an available financing option. Through this financial intermediation, the Bank aids the low-income entrepreneurs improve the quality of their living conditions. Access to credit supports the underserved extend their cash flows and avoid circumstances where resources for food, clothing, shelter, or education are sacrificed.
In the next pages, you will read the humble beginnings, challenges, and triumphs of some of Robinsons Bank Microfinance clients whom the Bank truly value. In almost a decade, Robinsons Bank has built relationships with them and their testaments serve as our accolades.

“Sa tulong ng Robinsons Bank at gabay ng Diyos, mabilis na lumago ang aming negosyo. Dahil sa mababait na empleyado ng Bangko na tumulong sa amin sa pagproseso ng aming hiniram na pera sa Super Loan ng Bayan, marami ang nagbago sa aming negosyo at kabuhayan. Salamat Robinsons Bank, dahil sa paglago ng aming negosyo, nakakatulong na rin ako sa iba pang nagbabasura.” – Junel M. Abarquez, borrower of Robinsons Bank Microfinance Super Loan ng Bayan Loan Product, Marikina
PROMOTING INCLUSIVE GROWTH: BRIDGING OPPORTUNITIES THROUGH ACCESSIBLE FINANCING
22 Robinsons Bank Annual Report 2016
CLIENT FEATURE: THE TRASH TO CASH SUCCESS STORY OF JUNEL M. ABARQUEZ

Junel and his wife are proudly showing the photos of their three children who graduated from college and are now practicing their own professions. On-site of Junel’s junk shop.
23Robinsons Bank Annual Report 2016
Junel Abarquez was born and raised in Cebu. His family did not have the resources to send him into college after graduating from high school. At that time, majority of the Philippines had limited commercial development. Work was concentrated mostly in agriculture, where earning a living involved a significant risk and was unsteady. Just like many provincial Filipinos, Junel took his chances to find better opportunities in Manila.
Not being able to finish formal schooling, he had no luck finding a job. Soon he acquired various unhealthy vices and engaged in illicit activities. Then he met his future wife, Tessie. Tessie led him back to his faith in God and together they strove to provide better for their family.
It was a very difficult phase. “Nagsimula kaming matuto mangalakal ng basura nang tumira kami sa Tumana [Marikina] at noon ay may dumpsite pa sa nasabing lugar. Ibinibenta namin sa junk shop ang mga nababasura naming mag-asawa sa maghapon,” Junel recalled. In 2004, Junel saved up an amount of PHP1,500.00 as a starting capital to operate his own junk shop. “Habang namamasura kaming mag-asawa, nagsimula na rin kaming mamili ng kalakal. Dalawang bata na taga-lugar lang din namin ang mga una kong kliyente,” Junel happily shared. The family decided to preserve their capital investment and its earnings. Soon their customers grew and even smaller junk shops near their area were selling scrap materials to them.
In 2007, Junel learned about the Super Loan ng Bayan through a friend who was a client of Robinsons Bank Microfinance Loan. He realized that he could increase his capital for investment, and decided to go to Robinsons Bank after learning that loans were granted to MSMEs like his own business.
Junel’s first loan in December 2007 from Robinsons Bank amounted to PHP40,000.00. Junel was one of the pioneer clients of Microfinance Marikina Branch. With an expanding operation, he bought a second-hand vehicle to buy greater volume of plastics, bottles, metals, and other recyclable materials scavenged from trash, this time, in Valenzuela.
On his second loan cycle, Junel was able to establish an outlet in San Mateo [Rizal] and the rest, he added to his initial capital. This expansion decision would later save their family from the natural calamity that would hit their business in Marikina.
When tropical storm Ondoy (international name, Ketsana) hit Luzon in September 2009, the rise in the water level of the Marikina River damaged their home and business. To make it worse, his son acquired leptospirosis. He was fast losing hope and did not know how to recover from the disaster and yet he impressed Robinsons Bank employees when he braved the flood by riding a boat, just to go to the branch to pay his weekly amortization.
He was glad to have a reliable partner in Robinsons Bank at that time. Little by little, with the support of the working capital he borrowed from Robinsons Bank, Junel was able to recover and reestablish his business.
Year after year since 2013, his business continued to flourish. The Bank’s lending facility enabled him to improve his business and expand his business operations. Some of the fixed assets he was able to acquire were vehicles to carry greater volume of recyclable materials. He was also able to purchase a property (house and lot) in his wife’s province which serves as their summer home. At the age of 47, he now owns three trucks and manages six employees. His greatest achievement, like what all other parents strive for, was being able to send all his four children to school. This is what he and Tessie are very proud – all are from the fruits of scrap materials. To date, three of his children graduated from college already. He now has a Registered Nurse, an Information Technologist, and a Hotel and Restaurant Management Graduate.
As the Microfinance business of Robinsons Bank turns ten years, so is its partnership with Junel. He began as a scavenger for used bottles, scrap, and other recyclables almost 10 years ago. Today, he runs a sizeable and organized junk shop in their area with a branch in San Mateo.
Junel is truly grateful that he has found a reliable partner in Robinsons Bank. “Robinsons Bank is flexible and responsive and has developed an excellent understanding of the financial needs of my business.” Junel concluded.
Robinsons Bank takes pride of Junel’s achievements along with the more than 50,000 families assisted by the Bank’s Microfinance Group. The microfinance lending products support the Filipino MSME entrepreneurs via an efficient and convenient access to capital to allow them to grow their business and fulfill their dreams. Robinsons Bank grants an enabling business environment for SME entrepreneurs like Junel.
24 Robinsons Bank Annual Report 2016
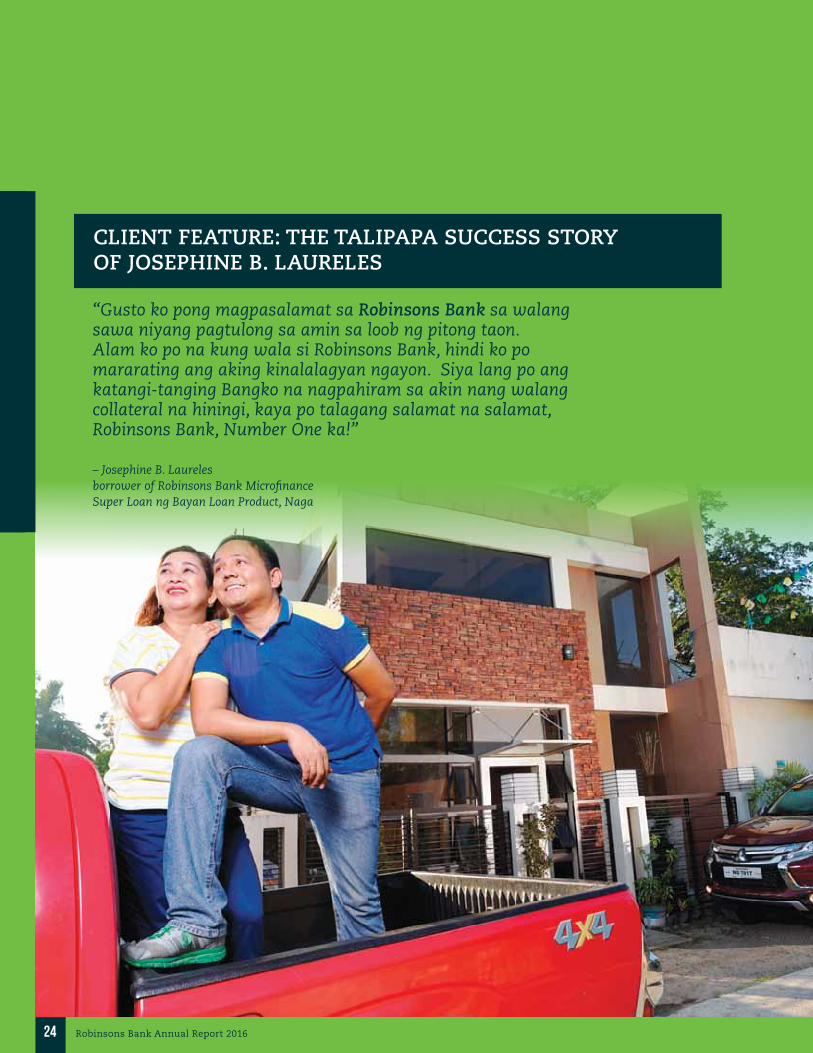
“Gusto ko pong magpasalamat sa Robinsons Bank sa walang sawa niyang pagtulong sa amin sa loob ng pitong taon. Alam ko po na kung wala si Robinsons Bank, hindi ko po mararating ang aking kinalalagyan ngayon. Siya lang po ang katangi-tanging Bangko na nagpahiram sa akin nang walang collateral na hiningi, kaya po talagang salamat na salamat, Robinsons Bank, Number One ka!”
– Josephine B. Laureles borrower of Robinsons Bank Microfinance Super Loan ng Bayan Loan Product, Naga
CLIENT FEATURE: THE TALIPAPA SUCCESS STORY OF JOSEPHINE B. LAURELES
ENABLING ENTREPRENEURS:PARTNERING THROUGH CONVENIENT ACCESS TO CAPITAL AND FINANCIAL LITERACY

25Robinsons Bank Annual Report 2016
The Setting As they say, the early bird catches the worm.
However, in Joy’s case, her life-changing opportunity occurred one afternoon. Back then in 2009, while she was in their stall in the “talipapa” curing meat to produce pork tocino to sell, Oscar Almendral from Robinsons Bank Microfinance Group Naga approached her. Oscar was still a Field Credit Assistant at that time (Oscar is now the Area 2 Sales Head of Robinsons Bank Microfinance). He offered Joy to avail one of Robinsons Bank Microfinance’s products, the Super Loan ng Bayan. The sincerity Oscar showed when he discussed the loan product to Joy encouraged her to take his loan offer. Also, Oscar was able to explain to her that her loan required NO COLLATERAL.
Veinticinco Joy was able to loan PHP25,000.00 on her
first cycle. She decided to borrow money from Robinsons Bank because she wanted to try and experience what borrowing from a bank is like. She was also enticed because of the tacked in savings component in the regular amortization and low interest rate compared to the “Bombay five-six”.
In the Beginning The family of Josephine “Joy” B. Laureles is no
exemption to the more than 10 million Filipino families struggling to put their conditions in better positions. Together with her husband, Noel C. Laureles, the couple needed to ensure that they could provide food on their table and that they could send their children to school.
The couple turned nights into days. Their mornings started way ahead before everyone else in their little hometown in Naga was awake. Every dawn, for four years, the couple went to the slaughter house to procure the fresh pork that they were going to sell. Daily, they required one mature pig worth PHP7,000.00 slaughtered to supply fresh meat to their small stall in a nearby ‘talipapa’ and to their restaurant patrons. To add to their source of income, they also established a small sari-sari store.
For five years, from 2004, the two small businesses of Mrs. Laureles had a combined capitalization of PHP50,000.00, borrowed from several moneylenders all with interest. In instances during hard times and there was none to turn to, she borrowed money from high-cost “Bombay five-six” informal financing loan scheme, as they were always available to market vendors in the “talipapa”.
Talipapa where Joy used to sell fresh meat. Portion of the proceeds of her second loan was used as down payment to move to a satellite market.
The family’s old house
The newly married Noel and Joy Laureles with their eldest child.

26 Robinsons Bank Annual Report 2016
Joy now sells fruits, vegetables, and fresh meat in Robinsons Supermarket Naga.
From PHP50k to PHP5M Capitalization in Seven Years In 2011, better opportunities knocked at
Joy’s door. Other than selling fresh meat in Robinsons Supermarket Naga, she was given the opportunity to sell fruits and vegetables, as well as cooked meals in the ‘Ready to Eat’ section of the Supermarket. Counting on Robinsons Bank, she borrowed for the eighth time to support this new business venture and Robinsons Bank did not fail to support her.
As Joy continued to diversify her businesses, her relationship and partnership with Robinsons Bank flourished. According to Joy, the Bank helped her a lot especially in times of huge volume requirements for her meat inventory and in acquiring properties. What she appreciated the most from Robinsons Bank was that the Bank taught her how to wisely manage her finances. The Bank also educated her on how to save and instilled in her the value of saving. In Robinsons Bank, not only did she gain a good credit standing but also her personal savings increased. These encouraged her to perform better in her businesses.
Because of the trust and confidence that Robinsons Bank Super Loan ng Bayan gave to her, Joy had the opportunity to grow her business. Joy very much
She was very pleased because her first loan process was efficient. She vividly remembered what Oscar oriented her with – be a good payer and her interest payment would be discounted at the end of the loan cycle and would be lower in the next loan cycles. To her surprise, her succeeding loan processes were certainly hassle-free. According to her, the Bank employees were very accommodating and oriented her clearly about the loan payment procedures.
Mrs. Laureles started selling meat products in the “talipapa” in 2004. “Lupa ang tinutuntungan ng aming tindahan noon at ang bubong ay nasa ulo na namin,” Joy recalls. With the money she borrowed from Robinsons Bank, she ensured she would put the money into good use. Her first loan proceeds were added to her rolling capital to purchase more pigs. On her next loan cycle, she used the money as down payment to a satellite market to improve their meat shop location. After a few months, she had her greatest break when she was asked to supply fresh pork in Robinsons Supermarket Naga. Joy did not waste time and borrowed her fourth loan cycle from Robinsons Bank “…at dito nagsimula ang pagbabago ng aming buhay, kasama ang Robinsons Bank,” Joy exclaimed with gladness.
27Robinsons Bank Annual Report 2016
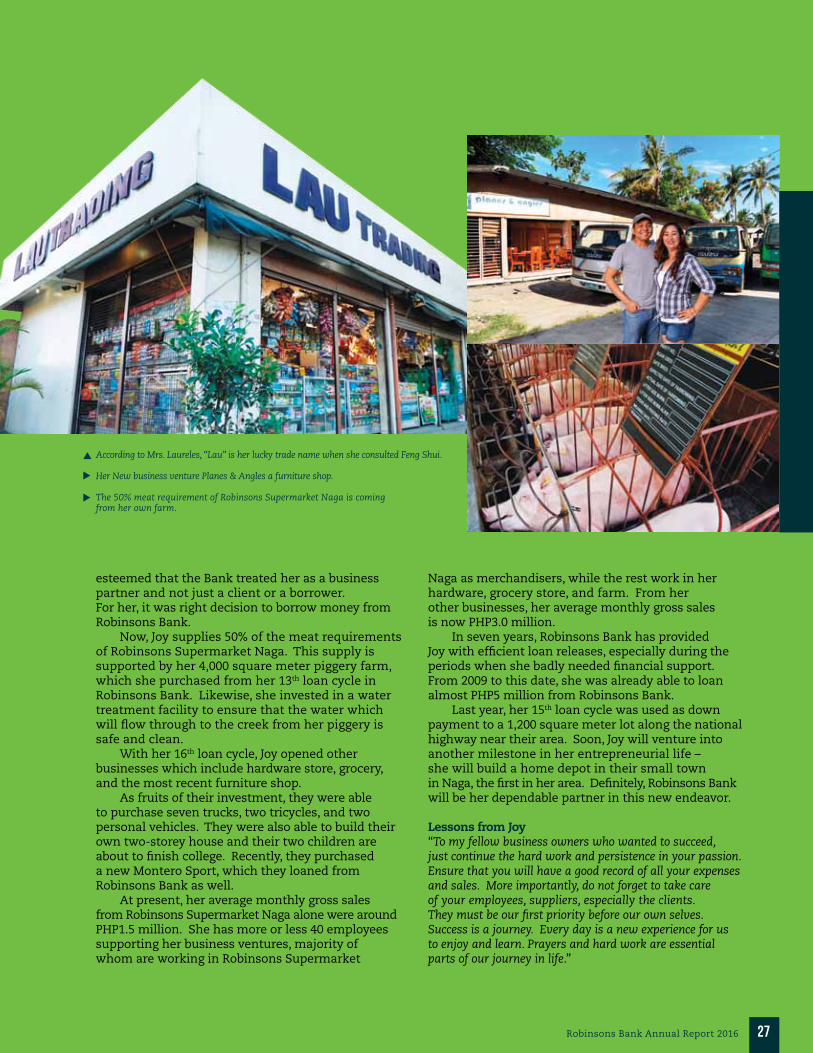
According to Mrs. Laureles, “Lau” is her lucky trade name when she consulted Feng Shui.
Her New business venture Planes & Angles a furniture shop.
The 50% meat requirement of Robinsons Supermarket Naga is coming from her own farm.
esteemed that the Bank treated her as a business partner and not just a client or a borrower. For her, it was right decision to borrow money from Robinsons Bank.
Now, Joy supplies 50% of the meat requirements of Robinsons Supermarket Naga. This supply is supported by her 4,000 square meter piggery farm, which she purchased from her 13th loan cycle in Robinsons Bank. Likewise, she invested in a water treatment facility to ensure that the water which will flow through to the creek from her piggery is safe and clean.
With her 16th loan cycle, Joy opened other businesses which include hardware store, grocery, and the most recent furniture shop.
As fruits of their investment, they were able to purchase seven trucks, two tricycles, and two personal vehicles. They were also able to build their own two-storey house and their two children are about to finish college. Recently, they purchased a new Montero Sport, which they loaned from Robinsons Bank as well.
At present, her average monthly gross sales from Robinsons Supermarket Naga alone were around PHP1.5 million. She has more or less 40 employees supporting her business ventures, majority of whom are working in Robinsons Supermarket
Naga as merchandisers, while the rest work in her hardware, grocery store, and farm. From her other businesses, her average monthly gross sales is now PHP3.0 million.
In seven years, Robinsons Bank has provided Joy with efficient loan releases, especially during the periods when she badly needed financial support. From 2009 to this date, she was already able to loan almost PHP5 million from Robinsons Bank.
Last year, her 15th loan cycle was used as down payment to a 1,200 square meter lot along the national highway near their area. Soon, Joy will venture into another milestone in her entrepreneurial life – she will build a home depot in their small town in Naga, the first in her area. Definitely, Robinsons Bank will be her dependable partner in this new endeavor.
Lessons from Joy “To my fellow business owners who wanted to succeed, just continue the hard work and persistence in your passion. Ensure that you will have a good record of all your expenses and sales. More importantly, do not forget to take care of your employees, suppliers, especially the clients. They must be our first priority before our own selves. Success is a journey. Every day is a new experience for us to enjoy and learn. Prayers and hard work are essential parts of our journey in life.”

28 Robinsons Bank Annual Report 2016
LANCE Y. GOKONGWEI CHAIRMAN
FREDERICK D. GO VICE CHAIRMAN
BOARD OF DIRECTORS
ROBINA Y. GOKONGWEI-PE DIRECTOR

29Robinsons Bank Annual Report 2016
OMAR BYRON T. MIER DIRECTOR
PATRICK HENRY C. GO DIRECTOR
ELFREN ANTONIO S. SARTE PRESIDENT & CEO

30 Robinsons Bank Annual Report 2016
BOARD OF DIRECTORS
DAVID C. MERCADO INDEPENDENT DIRECTOR
ESPERANZA s. OSMEña INDEPENDENT DIRECTOR

31Robinsons Bank Annual Report 2016
roberto s. gaerlan INDEPENDENT DIRECTOR
ANGELES Z. LOrAyES INDEPENDENT DIRECTOR
hermogenes s. roxas INDEPENDENT DIRECTOR

32 Robinsons Bank Annual Report 2016
Lisa Y. gokongwei-cheng member
james l. go member
johnson robert g. go, jr. member
brian m. go member
senior advisory board

33Robinsons Bank Annual Report 2016
ANGELITO V. EVANGELISTA EVP & COO
MYKEL D. ABAD EVP & LSB PRESIDENT
MA. REGINA N. LUMAIN evp & treasurer
eric b. santos evp & chief lending officer
ElFREN ANTONIO S. SARTE PRESIDENT & CEO
KEY OFFICERS

34 Robinsons Bank Annual Report 2016
LANCE Y. GOKONGWEICHAIRMANFILIPINO, 50 years old
Lance Y. Gokongwei is the Chairman of the Board of Robinsons Bank Corporation. He is the Chairman of the Executive Committee, and a member of the Trust Committee of the Bank. Concurrently, he is President, Director, and COO of JG Summit Holdings Inc. He likewise holds key positions in its major subsidiaries. He is the President and CEO of Cebu Air, Inc. and Universal Robina Corporation, and the Vice-Chairman and CEO of Robinsons Land Corporation. He is the CEO of JG Summit Petrochemical Corporation and JG Summit Olefins Corporation. Furthermore, he is the Chairman and CEO of Robinsons Retail Holdings, Inc., Vice Chairman of Manila Electric Company, and a Director of Oriental Petroleum & Minerals Corporation and United Industrial Corporation Limited.
He is a Trustee and Secretary of the Gokongwei Brothers Foundation, Inc.
In 2015, he was Institutional Investor’s Best CEO for Asia and was also named Best CEO by Finance Asia.
He graduated Summa Cum Laude from the University of Pennsylvania’s Management and Technology Program with double degrees in Finance from Wharton School and Applied Sciences from the Penn Engineering School.
FREDERICK D. GOVICE CHAIRMANFILIPINO, 47 years old
Frederick D. Go is the Vice Chairman of the Board of Robinsons Bank Corporation. He is the Vice Chairman of Executive Committee of the Bank. Concurrently, he is a Director of Universal Robina Corporation, Cebu Air Inc., the President, Director and COO of Robinsons Land Corporation and its subsidiaries. Moreover, he is the Vice Chairman of the Philippine Retailers Association.
He holds a Bachelor of Science degree in Management Engineering from the Ateneo de Manila University.
ELFREN ANTONIO S. SARTEPRESIDENT, DIRECTOR AND CEOFILIPINO, 57 years old
Elfren Antonio S. Sarte is the President, Director, and CEO of Robinsons Bank Corporation. He is a member of the Executive Committee, Risk Management Committee and IT Steering Committee. Concurrently, he is the Vice Chairman and Director of Legazpi Savings Bank Inc., a subsidiary of Robinsons Bank.
As an industry leader, he holds directorships in Bankers Association of the Philippines (BAP) and BancNet.
Prior to joining Robinsons Bank, Mr. Sarte was President, Director, and CEO of PNB Savings Bank (formerly known as Allied Savings Bank). His banking career spans over three decades and includes posts at other financial institutions, among them are Philippine National Bank, Unionbank of the Philippines, and Credit Information Bureau.
He holds a Bachelor of Science degree in Industrial Management Engineering minor in Mechanical Engineering from the De La Salle University.
ROBINA GOKONGWEI-PE DIRECTORFILIPINO, 55 years old
Robina Gokongwei-Pe is the Chairperson of Robinsons Bank’s Trust Committee. Concurrently, she is the Director of JG Summit Holdings, Inc., Robinsons Land Corp., CPAir Holdings, Inc., Unicon Insurance Brokers Corp., Itech Global Business Solutions, Inc., Summit Media Informatix Holdings, Inc., Batangas Agro-Industrial Development Corp., United Philippine Oil Trading, Inc., Tropical Aqua Resources, Inc., and Samar Commodities Trading and Industrial Corporation.
Concurrently, she is the President, Director and COO of Robinsons Retail Holdings, Inc. She also served as President of The Manila Times from 1989 to 1998.
She holds a Bachelor of Arts degree in Journalism from the New York University.
board of directors PROFILE

35Robinsons Bank Annual Report 2016
PATRICK HENRY C. GODIRECTORFILIPINO, 47 years old
Patrick Henry C. Go is the Vice Chairman of the Robinsons Bank’s Trust Committee and a member of the Corporate Governance Committee. Concurrently, he is a Director of JG Summit Holdings, Inc. and Robinsons Land Corporation.
Concurrently, he is the President and COO of JG Summit Petrochemical Corp (JGSPC) and JG Summit Olefins Corp. (JGSOC), as well as the Executive Vice President and Senior Managing Director of URC Packaging Division (BOPP) and CFC Flexible Packaging Division. He was the General Manager of Litton Mills Inc. from 1996 to 1997.
He holds a Bachelor of Science degree in Management from the Ateneo de Manila University and took The General Manager Program from the Harvard Business School. OMAR BYRON T. MIERDIRECTORFILIPINO, 70 years old
Omar Byron T. Mier is a Director of Robinsons Bank Corporation. He was appointed as a Director of the Bank in 2015. He is a member of the Audit Committee, Corporate Governance Committee and Risk Management Committee, and alternate member in the Executive Committee.
Concurrently, he is a Director of Legazpi Savings Bank Inc. a subsidiary of Robinsons Bank and is a member of its Risk Management Committee. He is a Director of Paymaya Philippines, Inc.
Prior to joining Robinsons Bank, Mr. Mier was President and CEO of Philippine National Bank. His banking career spans over four decades and includes posts at other financial institutions, among them are Citibank N.A. and Deutsche Bank.
He holds a Bachelor of Science degree in Business Administration Major in Accounting and a Bachelor of Arts degree in Economics, both from the University of the Philippines. He is a Certified Public Accountant and holds a Master of Arts in Economics from the University of the Philippines.
ROBERTO S. GAERLAN INDEPENDENT DIRECTORFILIPINO, 65 years old
Roberto S. Gaerlan is the Chairperson of Robinsons Bank’s Related Party Transactions Committee, Vice Chairperson of Audit Committee, and member of Risk Management Committee.
His banking career spans over three decades and includes posts at other financial institutions, among them are First United Bank and United Coconut Planters Bank.
He holds a Bachelor of Arts degree in Economics from the University of Santo Tomas and Advanced Bank Management from the Asian Institute of Management.
HERMOGENES S. ROXASINDEPENDENT DIRECTORFILIPINO, 66 years old
Hermogenes S. Roxas is the Chairperson of Robinsons Bank’s Corporate Governance Committee and a member of Audit Committee and Related Party Transactions Committee.
Concurrently, he is a Director of Legazpi Savings Bank Inc., a subsidiary of Robinsons Bank. He is the Chairperson of Legazpi Savings Bank’s Corporate Governance Committee and Audit Committee, and is the Vice Chairperson of Risk Management Committee.
Prior to joining Robinsons Bank, Mr. Roxas was President of UCPB Savings. His banking career spans over three decades. He held posts at other financial institutions, among them are Directorships at UCPB Leasing & Finance Corp., UCPB Foreign Exchange Corp., UCPB Capital Corp., UCPB Rural Bank, UCPB Securities Inc., Cocolife, and Dutch Boy Philippines.
He holds a Bachelor of Science degree in Business Administration from the University of the Philippines.

36 Robinsons Bank Annual Report 2016
ANGELES Z. LORAYESINDEPENDENT DIRECTORFILIPINO, 67 years old
Angeles Z. Lorayes is the Chairperson of Robinsons Bank’s Audit Committee, Vice Chairperson of Corporate Governance Committee, and a member of the Related Party Transactions Committee.
Prior to joining Robinsons Bank, she was the Head of Credit Policy and Supervision in Philippine National Bank. Her banking career spans over four decades and includes posts at other financial institutions, among them are Equitable PCI Bank and Citibank N.A.
She holds a degree in Business Administration from the University of the Philippines and earned MBA units at the Ateneo Graduate School of Business. ESPERANZA S. OSMEÑA INDEPENDENT DIRECTORFILIPINO, 66 years old
Esperanza S. Osmeña is the Chairperson of Robinsons Bank’s Risk Management Committee, and a member of Corporate Governance Committee, Related Party Transactions Committee and Trust Committee.
Prior to joining Robinsons Bank, she was Executive Vice President in Equitable PCI Bank. Her banking career spans over three decades and includes posts at other financial institutions, among them are Asian Savings Bank, PCI Bank and its subsidiaries and Equitable PCI Bank and its subsidiaries. She was a Director at PCI Capital Inc., PCI Leasing Inc., PCI Insurance Brokers Inc., and Bankard Inc.
She holds a Bachelor of Arts degree in Commerce from Saint Theresa’s College and the Colegio de Santa Anna in Zaragoza, Spain.
DAVID C. MERCADO INDEPENDENT DIRECTORFILIPINO, 66 years old
David C. Mercado is the Chairperson of Robinsons Bank’s IT Steering Committee, Vice Chairperson of the Risk Management Committee and a member of the Audit Committee.
Prior to joining Robinsons Bank, he was First Vice President, Head of Consumer Banking Group in United Coconut Planters Bank. His banking career spans over three decades and includes other posts in United Coconut Planters Bank and Allied Banking Corporation.
He holds a Business Administration degree from the Philippine School of Business Administration. He is a Certified Public Accountant and holds a Masters in Business Administration from the De La Salle Graduate School of Business.
board of directors PROFILE

37Robinsons Bank Annual Report 2016
JAMES L. GO MEMBERFILIPINO, 78 years old
James L. Go is a Senior Advisory Board Member of Robinsons Bank Corporation. Concurrently, he is the Chairman and CEO of JG Summit Holdings, Inc. and Oriental Petroleum and Minerals Corporation. He is also the Chairman of Robinsons Land Corporation, Universal Robina Corporation, JG Summit Petrochemical Corporation, and JG Summit Olefins Corporation. He is the Vice Chairman of Robinsons Retail Holdings, Inc. and a Director of Cebu Air, Inc., Marina Center Holdings Private Limited, United Industrial Corporation Limited, and Hotel Marina City Private Limited.
Likewise, he is the President and Trustee of the Gokongwei Brothers Foundation, Inc.
He has been a director of the Philippine Long Distance Telephone Company (“PLDT”) since November 3, 2011. He is a member of the Technology Strategy and Risk Committees and Advisor of the Audit Committee of the Board of Directors of PLDT. He was elected a director of Manila Electric Company on December 16, 2013.
He holds a Bachelor and Master of Science Degrees in Chemical Engineering from Massachusetts Institute of Technology, USA.
JOHNSON ROBERT G. GO, JR. MEMBERFILIPINO, 52 years old
Johnson Robert G. Go, Jr. is a Senior Advisory Board Member of Robinsons Bank Corporation. Concurrently, he is a Director of JG Summit Holdings, Inc., Universal Robina Corporation, and Robinsons Land Corporation, among others. He was the President of Robinsons Convenience Stores, Inc. (2002) and the Vice President of Robinsons Daiso Diversified Corp. (2010). He was a director of Robinsons Bank Corporation from 1997 to 2012.
He holds a Bachelor of Arts in Interdisciplinary Studies degree from the Ateneo de Manila University.
BRIAN M. GOMEMBERFILIPINO, 43 years old
Brian M. Go is a Senior Advisory Board Member of Robinsons Bank Corporation. Concurrently, he is General Manager of URC Foods (Singapore) Pte Ltd and URC Snack Foods (Malaysia) Sdn Bhd since Feb 2015; He is responsible for overall operations in Singapore, Malaysia, and Brunei.
He has been a consultant of the Booz Allen & Hamilton (1996 to 1997) and Robinsons Retail Group (1998). He was the Head of Corporate Planning in Digitel Telecommunications Phils., Inc. (1998 to 2002), Director of JG Summit Petrochemical Corporation, Managing Director at Digitel One (2002), Chief Finance Officer at Ding Feng Real Estate in China (from 2003 to 2004), and Director of various Ding Feng Real Estate companies. He served as General Manager at Universal Robina Corporation – China (2007).
He holds a Bachelor’s degree in Economics from the Harvard University.
LISA Y. GOKONGWEI-CHENG MEMBERFILIPINO, 48 years old
Lisa Y. Gokongwei-Cheng is a Senior Advisory Board Member of Robinsons Bank Corporation. Concurrently, she is the President and Director of Summit Media. She held various senior positions and Directorships in the Gokongwei group namely: Summit Internet Investments, Inc., Jobstreet Philippines, JE Holdings, Inc., Robinsons Retail Holdings, Inc., Itech Global Business Solutions, Inc., Hongkong-China Foods Co., and as Vice-President and Director of Summit-App Addictive Philippines, Inc. She was the Vice President at Metromedia Times Corporation and Project Manager at Digital Communications.
She holds a Bachelor of Arts degree from Ateneo de Manila University and obtained her Master degree in Journalism at Columbia University.
SENIOR ADVISORY BOARD PROFILE
corporate governance
38 Robinsons Bank Annual Report 2016
I. Board Governance
The Board of Directors (“Board”) of Robinsons Bank Corporation represents the owners’ interests in the Bank’s objective to sustainably increase shareholder value and to ensure the long-term success of the business. The Board is actively responsible in ensuring that the Bank is properly managed in attaining this objective. In addition to fulfilling the Board’s obligations for increased shareholder value, it also has the responsibility to protect the interests of other stakeholders which include, among others, customers, employees, suppliers, financiers, government and community in which it operates.
The Board is primarily responsible for the observance of governance, including business and risk strategies, organization, and financial soundness of the Bank. Corollary to setting the policies for the accomplishment of the corporate objectives, it shall provide an independent checking and effective oversight of the Management.
1. Composition of the Board
The Board is composed of 11 members elected by the stockholders, five of whom are independent. All members of the Board are Filipinos and possess all the qualifications and none of the disqualifications to hold a directorship as prescribed under the Corporation Code and existing rules and regulations of the BSP and the Securities and Exchange Commission (SEC). They all passed the fit and proper test for the position of a director of the Bank, taking into account their integrity and probity, physical and mental fitness, competence, relevant education, financial literacy and training, diligence and knowledge and expertise. They are known for their independence and professionalism, and for making decisions with complete fidelity to the Bank while cognizant of their responsibilities under existing applicable laws, rules, and regulations.
The Board determines the appropriate number of its members to ensure that the number thereof is commensurate with the size and complexity of the Bank’s operations. To the extent practicable, the members of the Board of Directors have been selected from a broad pool of qualified candidates. A sufficient number of qualified non-executive members had been elected to promote independence of the Board from the views of the senior management. For this purpose, non-executive members of the Board are those who are not part of the day-to-day management of banking operations.
The five independent directors (ID) are independent of Management and are free from any business or other relationship which could or could reasonably be perceived, to materially interfere with their exercise of independent judgment in carrying out their responsibilities as a director. They hold no interests or relationships with the Bank that may hinder their independence from the Bank or management or will interfere with the exercise of independent judgment in fulfilling their responsibilities. They are compliant with all the qualifications required of an independent director and none of the disqualifications as provided in the Manual of Regulations for Banks (MORB).
2. Conduct of Board Meetings
As provided for in the Bank’s By-Laws, the Board schedules and holds regular monthly meetings and convenes special meetings when necessary. The Corporate Secretary provides the directors the notice, agenda, and meeting materials prior to each meeting. Proceedings of the meetings are properly documented and duly minuted.
In accordance with the rules and regulations of the SEC and the BSP, the members of the Board attend regular and/or special meetings in person or through teleconferencing and video conferencing which allows the directors to actively participate in the deliberations on matters taken. The Bank ensures availability of teleconferencing facilities if and when a director cannot physically attend due to unavoidable circumstances. A director may also attend the meetings by submitting written comments on the agenda to the Corporate Secretary and the Chairman prior to the meeting pursuant to Subsection X141.1 of the MORB.

39Robinsons Bank Annual Report 2016
In 2016, all members of the Board have substantially complied with the attendance requirement and actively participated in the deliberations on matters taken up during the regular and/or special meetings.
No. of meetings held during
the yearNo. of meetings
attended %1. Lance Y. Gokongwei 12 10 83.332. Frederick D. Go 12 9 75.003. Elfren Antonio S. Sarte 12 12 100.004. Robina Y. Gokongwei-Pe 12 9 75.005. Patrick Henry C. Go 12 9 75.006. Omar Byron T. Mier 12 12 100.007. Roberto S. Gaerlan (ID) 12 12 100.008. Angeles Z. Lorayes (ID) 12 12 100.009. David C. Mercado (ID) 12 12 100.0010. Esperanza S. Osmeña (ID) 12 10 83.3311. Hermogenes S. Roxas (ID) 12 11 91.67
3. Board Committees
In order to increase efficiency and gain deeper focus in specific areas, the Board has created committees, which are relative and consistent to the size, complexity of operations, long-term strategies, and risk tolerance level of the Bank. The scope, authority and responsibilities of these committees are defined in their respective board-approved charter which is subject to regular review and updated at least annually or whenever there are significant changes.
The Board has appointed the members of the committees taking into account the optimal mix of skills and experience which would allow them to fully understand, be critical and objectively evaluate the issues. To promote objectivity, the Board has appointed independent directors and non-executive directors to the greatest extent possible and ensures that such mix will not impair the collective skills, experience and effectiveness of the committees. Each of these committees maintains appropriate records (e.g., minutes of meeting) of their deliberations and decisions, subject to notation and/or confirmation of the Board. The records document the committees’ fulfillment of their responsibilities and facilitate the assessment of the effective performance of their functions which is regularly and periodically conducted.
The Board has established and delegated responsibilities to seven committees, namely: the Executive Committee, the Corporate Governance Committee, the Risk Management Committee, the Audit Committee, the Trust Committee, the Related Party Transactions Committee, and the IT Steering Committee.
a. Executive Committee
The Bank’s Executive Committee has been created as the highest credit approving body of the Bank after the Board. The Committee provides the necessary approvals for applications, deviations and other loan transactions. Resolutions of the Committee may be overruled only by the Board.
The Executive Committee provides decisions regarding applications for critical loan accounts and deviations that require careful deliberation. Approvals made are in compliance with internal policies and those required under existing laws, rules and regulations. Decisions made are influenced by the latest profitability and delinquency figures of an account or loan product.
No. of meetings held during
the yearNo. of meetings
attended %1. Lance Y. Gokongwei 48 47 97.922. Frederick D. Go 48 48 100.003. Elfren Antonio S. Sarte 48 44 91.674. Omar Byron T. Mier 48 48 100.00

corporate governance
40 Robinsons Bank Annual Report 2016
b. Corporate Governance Committee
In order to proactively assist the Board in its fulfillment of its corporate governance responsibilities and ensure transparency in all of the Bank’s transactions, it created the Corporate Governance Committee. The Committee ensures the Board’s effectiveness and due observance of corporate governance principles, best practices and guidelines which are necessary components of what constitute sound strategic business management. It generates awareness of corporate governance within the Bank.
In particular, the Committee oversees the development and implementation of corporate governance principles and policies, reviews and evaluates the qualifications of the persons nominated to the Board as well as those nominated for election to other positions requiring appointment by the Board, decides the manner by which the Board’s performance is evaluated and assists the Board in the periodic performance evaluation of the Board and its committees and executive management, and oversees the development and implementation of professional development programs for directors and officers.
The Committee is composed of five members, three of whom are independent directors including the Chairperson and Vice-Chairperson. The Committee holds regular meetings and may call for special meetings as deemed necessary. To properly evaluate its performance, the Committee meetings are properly and duly minuted.
No. of meetings held during
the yearNo. of meetings
attended %1. Hermogenes S. Roxas (ID) 12 11 91.672. Angeles Z. Lorayes (ID) 12 12 100.003. Esperanza S. Osmeña (ID) 12 10 83.334. Patrick Henry C. Go 12 10 83.335. Omar Byron T. Mier 12 12 100.00 Risk Management Committee
To aid the Board in efficiently carrying out its function on risk management, it created the Risk Management Committee. This committee oversees the development and oversight of the Bank’s risk management program including Trust Group and ensures an acceptable level of risk while minimizing losses. The Committee oversees the system of limits to discretionary authority that the Board delegates to management, supervises the system and ensures its effectiveness, provides and set limits and ensures that these are properly observed and that immediate corrective actions are taken should breaches occur.
The Board has appointed five members of the Committee who possess a broad-range of expertise as well as adequate knowledge of the Bank’s risk exposures which enables them to develop appropriate strategies for preventing more losses when they occur. The committee members meet regularly and may call for special meetings whenever necessary.
No. of meetings held during
the yearNo. of meetings
attended %1. Esperanza S. Osmeña (ID) 12 11 91.672. David C. Mercado (ID) 12 12 100.003. Roberto S. Gaerlan (ID) 12 12 100.004. Elfren Antonio S. Sarte 12 11 91.675. Omar Byron T. Mier 12 12 100.00

41Robinsons Bank Annual Report 2016
c. Audit Committee
The Board has constituted an Audit Committee to provide oversight over the Bank’s financial reporting policies, practices and control, and internal and external audit functions. In particular, the Committee aids the Board in monitoring and evaluating the adequacy, effectiveness, and efficiency of the Bank’s internal controls system. Further, the Committee assists the Board in fulfilling its oversight responsibilities with regard to the integrity of the Bank’s financial reporting process, the independence and performance of the Bank’s external and internal auditors, the compliance to corporate governance policies and guidelines, and the Bank’s compliance with regulatory requirements.
To carry-out its mandate, the Committee has explicit authority to investigate any matter within its terms of reference, full access and cooperation by management and full discretion to invite any director or executive officer to attend its meetings, and adequate resources to enable it to effectively discharge its functions.
As prescribed under existing rules and regulations, the Committee is composed of, to the greatest extent possible, sufficient number of independent and non-executive board members. All members of the Committee, including the Chairperson who is an ID, possess the required qualifications and none of the disqualifications. The Committee holds regular meetings and may call special meetings upon the request of the Chairperson or by at least two of its members, which proceedings are duly minuted.
No. of meetings held during
the yearNo. of meetings
attended %1. Angeles Z. Lorayes (ID) 8 8 100.002. Roberto S. Gaerlan (ID) 8 8 100.003. David C. Mercado (ID) 8 8 100.004. Hermogenes S. Roxas (ID) 8 6 75.005. Omar Byron T. Mier (Non-Voting) 8 8 100.00
d. Trust Committee
The Trust Committee provides the overall direction and guidelines in the conduct of the Trust business, reviews plans for new investments, trust products and business development, and conducts assessment of Trust and Investments Group’s performance and operational effectiveness.
No. of meetings held during
the yearNo. of meetings
attended %1. Robina Y. Gokongwei-Pe 12 10 83.332. Patrick Henry C. Go 12 9 75.003. Lance Y. Gokongwei 12 11 91.674. Esperanza S. Osmeña (ID) 12 11 91.675. Elizabeth T. Aquino 12 12 100.00 Related Party Transactions Committee
Pursuant to existing rules and regulations on related party transactions issued by the BSP, the Board created a Related Party Transactions Committee. This stems from the recognition of management that the Bank engages in transactions between and among related parties, which brings a need to exercise appropriate oversight and implement control systems for managing said exposures as these may potentially lead to abuses that are disadvantageous to the Bank and its depositors, creditors, and other stakeholders.
The Committee supports the Board in the exercise of appropriate oversight and implements a control system for managing exposures to related parties. It assists the Board in ensuring that transactions with related parties are handled in a sound and prudent manner and in compliance with applicable laws, rules and regulations to protect the interest of its depositors, creditors, and other stakeholders.

corporate governance
42 Robinsons Bank Annual Report 2016
In particular, the Committee identifies related parties and monitors their transactions, evaluates related party transactions which are classified material and endorse the same to the Board for approval, ensures disclosure and reporting of related party transactions and oversees the implementation of a system to facilitate its functions as well as the development and periodic review of policies and procedures for related party transactions.
The Committee is composed of four members of the Board who are all independent directors. In case a member has a conflict of interest in a particular transaction, he should refrain from evaluating that particular transaction. The Chief Compliance Officer and Chief Audit Officer and/or their representatives including an executive director sit as resource persons in the said Committee.
No. of meetings held during
the yearNo. of meetings
attended %1. Roberto S. Gaerlan (ID) 10 10 100.002. Esperanza S. Osmeña (ID) 10 9 90.003. Angeles Z. Lorayes (ID) 10 10 100.004. Hermogenes S. Roxas (ID) 10 9 90.005. Omar Byron T. Mier (Resource Person) 10 10 100.006. Romel D. Meniado (Resource Person) 10 10 100.007. Cynthia Bautista (Resource Person) 10 9 90.00
e. IT Steering Committee
In compliance with BSP Circular 808, the Board has created the Information Technology Steering Committee which oversees a safe, sound, controlled and efficient information technology operating environment that supports the Bank’s goals and objectives. In particular, the Committee, among others: reviews and monitors the performance of all IT projects; reviews the Bank’s current IT infrastructure, system performance, associated risks and other significant issues and events and institutes appropriate actions to achieve the desired results; monitors and evaluates the performance of third party service providers on all information technology initiatives subject of the service contract; and reports to the Board relevant and adequate information regarding IT performance, status of major IT projects and significant issues affecting the Bank’s IT operations.
The Committee is chaired by a non-executive and independent director, assisted by the Head of IT Group as Vice-Chairperson and executive officers of the Bank. The heads of Audit, Risk and Compliance are also invited in the regular and/or special meetings of the Committee as resource persons.
4. Board Trainings
In accordance with the Corporate Governance Manual and Subsection X141.3 of the MORB, the Corporate Governance Committee is responsible for making recommendations to the Board on the required trainings and continuing education of the directors. Relative thereto, all members of the Board have attended the required corporate governance seminar for bank directors at BSP-accredited training providers, a pre-requisite for Monetary Board confirmation. These include topics on risk and governance, audit and control, and accountability.
To remain relevant and abreast with the evolving corporate governance landscape, the directors attended a refresher corporate governance training provided by an accredited training service provider on December 1, 2016. The directors completed the training on the topics of “Sustainable Development Goals and Engaging Investors and Sustainability”.

43Robinsons Bank Annual Report 2016
II. Governance Policies and Mechanisms
1. Corporate Governance Manual
The Board and its Management committed themselves to the principles and best practices on corporate governance. They believe that corporate governance is a necessary component of what constitutes sound business management and therefore undertake every effort necessary to create awareness within the Bank.
Toward this end, the Board adopted a corporate governance framework or the Corporate Governance Manual (or “Manual”) that embodies the rules, systems and processes in the Bank. The framework governs the performance of the Board and Management of their respective duties and responsibilities to stockholders and other stakeholders. The Manual is periodically reviewed with the objective of continually aligning the Bank’s policies with the BSP and SEC circulars or issuances on corporate governance including best practices issued by the Basel Committee on Banking Supervision. This ensures that the interests of stockholders and other stakeholders are always taken into account, the directors, officers, and employees are aware of their responsibilities and the business of the Bank is conducted in a safe and sound manner.
2. Internal Control and Audit
The Bank has implemented its internal control processes which are designed and effected by its Board of Directors, senior management and all levels of personnel to provide reasonable assurance on the achievement of objectives through efficient and effective operations; reliable, complete and timely financial and management information; and compliance with applicable laws, regulations, supervisory requirements and the Bank’s policies and procedures.
The Bank put in place an adequate and effective internal control framework for the conduct of its business, taking into account the size, risk profile and complexity of operations. The framework embodies management oversight and control culture, risk recognition and assessment; control activities; information and communication; and monitoring activities and correcting deficiencies.
The control environment of the Bank consists of: (a) the Board which ensures that the Bank is properly and effectively managed and supervised; (b) Management that actively manages and operates the Bank in a sound and prudent manner; (c) the organizational and procedural controls supported by effective management information and risk management support systems; and (d) an independent audit mechanism to monitor the accuracy and effectiveness of the Bank’s governance, operations and information systems, including the reliability and integrity of financial and operational information, the effectiveness and efficiency of operations, the safeguarding of assets, and compliance with laws, rules, regulations and contracts.
The Bank has an internal audit system that reasonably assures the Board, Management and stockholders that the Bank’s key organizational and operational controls are faithfully complied with. The Board appointed an Internal Auditor to perform the function, and required the Auditor to report to the Audit Committee, a board-level committee, which allows the internal audit activity to fulfill its mandate. The Internal Auditor is guided by the International Standards on Professional Practice of Internal Auditing and existing laws, rules and regulations. With the Board appointment, the Chief Audit Officer oversees the implementation of the internal audit system.
3. Money Laundering and Terrorist Financing Prevention Program
As approved by the Board and as required by the BSP, the Bank implements a program to combat money laundering and terrorist financing. The Program has been issued and is regularly updated to comply with RA No. 9160, as amended, BSP Circular No. 706 and other policies of the State. The Program is intended to protect the integrity and confidentiality of the accounts of the clients, and ensure that the Bank is not used as money laundering site for the proceeds of any unlawful activities, taking into consideration best practices to combat terrorist financing.

corporate governance
44 Robinsons Bank Annual Report 2016
The Program has been developed to disseminate information which will help the employees understand and prevent money laundering activities, detect and report suspicious transactions, and know better the Bank’s customers; understand the penalties for non-compliance; take the required AML training for responsible officers and personnel of the Bank; satisfy legal and ethical responsibilities with a minimal adverse impact on the Bank’s overall daily business responsibilities and performance goals. Moreover, the Program has been promulgated to protect the Bank as well as its employee’s interests.
Laws governing secrecy on bank deposits have been strictly complied with by the Bank when implementing procedures related to combating money laundering and terrorist financing. The Program provides guidance in complying with the Anti-Money Laundering Law as well as other applicable regulations without violating relevant laws and without losing legitimate business or clients in the process.
4. Related Party Transactions
In compliance with BSP Circular 895, as amended, the Bank has created a Related Party Transactions (RPT) Committee that supports the Board in managing exposures to related parties. Under its policy, the Bank defined related parties to include directors, officers, stockholders or related interests (DOSRI) of the Bank and their close family members. It also includes corresponding persons in affiliated companies, subsidiaries and affiliates, any party that the Bank exerts control over or that exerts control over the Bank, and such other entity whose interest may pose potential conflict with the interest of the Bank.
The Committee evaluates material RPTs to ensure that these are not undertaken on more favorable economic terms (e.g., price, commissions, interest rates, fees, tenor, collateral requirement) to such related parties that similar transactions with non-related parties under similar circumstances and that no corporate or business resources of the Bank are misappropriated or misapplied, and to determine any potential reputational risk issues that may arise as a result of or in connection with the transactions. All material RPTs are evaluated and endorsed by the Committee to the Board for approval. Refer to the Notes to Financial Statements for the Bank’s related party transactions.
5. Remuneration Policy
Board of Directors compensation is a fee or per diem in an amount as may be determined by the Board shall be paid to each director for attendance at any meeting of the Board; provided, however, that nothing herein contained shall be construed to preclude any director from serving in any other capacity and receiving compensation therefore, The Board shall fix the compensation and other remuneration of any compensation therefore. The Board shall fix the compensation and other remuneration of any Director or any other officer of the Bank should they be designated to perform executive functions or any special service to the Bank. In no case shall the total yearly compensation of directors, as such directors, exceed ten percent (10%) of the net income before income tax of the corporation during the preceding year.
REMUNERATION OF BOARD OF DIRECTORS
PHP Parent Subsidiary Consolidated
2016 2,265,000 723,000 2,988,000
2015 1,830,602 672,000 2,502,602
6. Code of Conduct
The Bank’s Code of Conduct for Employees exists to develop or pattern behavior in accordance to the Bank’s standards, to instill professional conduct, and to enforce discipline and order. The Code is implemented by the Human Resources and Management Group. Copies of the Code of Conduct are given to employees upon hiring, while seminars are conducted regularly to further expound on the subject.
7. Whistle-Blowing Policy
Employees of the Bank are encouraged to perform the duty of disclosing to their immediate superior the existing or potential violations and wrongdoings that they are or may become aware of. The Bank’s Policy on Timely Reporting of Concerns and Incidents, otherwise known as the Whistle-Blowing Policy, serves as a guide for all employees for reporting matters that breach integrity and the Bank’s Code of Conduct.

Overview
Robinsons Bank positions itself to become a more visible commercial bank and a significant player in the banking industry. The Bank aims to introduce new products and services and to fully develop the most significant areas of its operations while being cognizant of the associated risks.
The Risk Management is headed by the Chief Risk Officer (CRO) and is responsible for oversight of enterprise risk management, risk governance and control, framework, policies and practices. The CRO is supported by a dedicated team of risk management professionals organized to oversee risks arising from each of the Bank’s risk categories.
Robinsons Bank takes a comprehensive approach to Risk Management with a defined framework and an articulated Risk Appetite Statement, which are approved by the Risk Management Committee (RMC) and the Board of Directors.
Scope and Structure
The Bank is faced with multiple risks inherent to the nature of the business.
The following are the types of risk faced by the Bank:
Credit Risk – arises from a counterparty’s failure to meet the terms of any contract with the Bank or to perform otherwise as agreed. Credit risk is found in all activities where success depends on counterparty’s, issuer’s, or borrower’s performance. It arises any time the bank funds are extended, committed, invested, or otherwise exposed through actual or implied contractual agreements, whether reflected on – or off – balance sheet. Credit risk is not limited to the loan portfolio.
Market Risk – is defined by the Bank as the risk to earnings or capital arising from changes in the value of traded portfolios of financial instruments. It is the exposure to the uncertain market value of a portfolio due to price fluctuations. The value of investments fluctuates over a given time period because of general market conditions, economic changes or other events that impact large portions of the market such as political events, natural calamities, and others. This risk arises from market-making, dealing, and position-taking in interest rate, foreign exchange, equity, and commodities markets. Market risk is present in both trading and non-trading activities.
Interest Rate Risk – the Bank defines interest rate risk as the current and prospective risk to earnings or capital arising from the movements in interest rates.
Liquidity Risk – is defined by the Bank as the current and prospective risks to earnings or capital arising from the Bank’s inability to meet its obligations when they become due without incurring unacceptable losses. It includes the inability to manage unplanned decreases or changes in funding sources. It also arises from the failure to recognize or address changes in market conditions that affect the ability to liquidate assets quickly and with minimal loss in value.
Operational Risk – the Bank adopts the definition of BSP Circular 900 or Guidelines on Operational Risk Management, to wit; “Operational risk refers to the risk of loss resulting from inadequate or failed internal processes, people and systems; or from external events. This includes legal risk, but excludes strategic and reputational risks.”
IT Risk – is defined as any potential adverse outcome, damage, loss, violation, failure, or disruption associated with the use of or reliance on computer hardware, software, devices, systems, applications and networks.
Business Risk – the Bank adopts the definition provided by BSP Circular 747 on “Revised Compliance Framework for Banks” dated 06 February 2012series of 2012, Business Risk refers to conditions which may be detrimental to a bank’s business model and its ability to generate returns from operations, which in turn erodes its franchise value.
RISK MANAGEMENT
45Robinsons Bank Annual Report 2016

The following sections provide a comprehensive description of the Bank’s risk management procedures, measures, framework, and analyses for the identified risk areas.
Credit Risk
Credit Risk Management – is the process of controlling the potential consequence of credit risk. The process follows a standard risk management: identification, measurement, monitoring, and control. The cause of the risk has to be identified and the extent of the risk has to be evaluated and decisions have to be made as to how the risk has to be managed.
RISK MANAGEMENTCOMMITTEE
HEAD,CREDIT RISKDEPARTMENT
HEAD,OPERATIONAL RISK
DEPARTMENT
HEAD, MARKET ANDLIQUIDITY RISKDEPARTMENT
HEAD,IT RISK
DEPARTMENT
HEAD,CREDIT REVIEW UNIT -COMMERCIAL LOANS
HEAD,CREDIT ANALYTICS
UNIT
ANALYST,OPS AND IT
RISK
HEAD,CREDIT REVIEW UNIT -CONSUMER LOANS
ANALYST,MARKET RISK
OFFICER,CREDIT REVIEW
SPECIALIST,CREDIT ANALYTICS
ANALYST, CREDIT ANALYTICS
ANALYST, ASSET-LIABILITY
SPECIALIST,CREDIT REVIEW
ANALYST,CREDIT ANALYTICS
ANALYST, PORTFOLIO ANALYTICS
CHIEF RISK OFFICER AND HEAD, ENTERPRISE RISK MANAGEMENT GROUP
Credit Risk Management Framework
IDENTIFY
CONTROL MEASURE
MONITOR
46 Robinsons Bank Annual Report 2016
risk management

The Bank has several credit risk mitigation practices:
Identify – The starting point for the Credit Risk Management Framework is to develop an understanding of the institution, taking into account the external environment (e.g., economics trends, regulatory landscape, and competition) and within an organization’s internal environment (e.g., people, process, and infrastructure) mainly focused on credit risk.
Measure – The next step is to measure the identified inherent credit risk using several measurement tools such as ICCRS (Internal Credit Risk Rating System), Score cards, NFR (Net Flow Rate), PQR (Portfolio Quality Review), among others. These measurements tools help in forecasting the potential risk factors in any transactions. The identified risk are properly assessed as to impact and probability of occurrence, and measured quantitatively and qualitatively in terms of estimating cost of losses that may incurred should the risk events occur. This will serve as basis for the prioritizing the risks to be treated.
Monitor – After measuring the inherent credit risk, the Bank sets monitoring tools to assess the risk. The result of the assessment is reported to the Senior Management, RMC and of Directors, for discussion of pertinent issues on the credit risk and development of strategic actions.
Control – Once the Bank’s credit risks are identified and its impact is measured, the next step is to evaluate the adequacy of the Banks management systems to effectively monitor and control their risks within the Bank’s business activities. Adequate controls are established to prevent or detect exposure to credit risk in a timely manner, and that appropriate corrective actions shall be taken promptly to mitigate losses, and systematic treatment measures to prevent or minimize the recurrence of the risk events.
Market Risk
Market Risk Management – The Bank considers the following factors in setting up the market limits: business prospects, present market conditions, expected returns and budget for the year, among others. It is the responsibility of the risk-taking personnel to request or renew market risk limits. The limits are approved by the Board of Directors through the Risk Management Committee.
The Board of Directors approved the following set of risk control limits that are intended to prevent over-trading, excessive concentration, and to limit financial loss arising from the Bank’s exposure to market risk.
1. Aggregate Control Limits
Aggregate Control Limits refer to the boundary limits and loss limits around the business activities other than VAR and Stop Loss limits. Aggregate control limits would include, for example, permitted instruments and currencies, volume limits, and other similar limits.
2. Value-at-Risk Limits
Value-at-Risk (or VaR) measures the potential loss of value resulting from unlikely, adverse event in the normal market environment in a specified period of time within a specified probability of occurrence. It is a measure of likely earnings volatility for marked-to-market portfolios.
VaR is used to alert the senior management whenever the potential for losses in the Bank’s trading portfolio exceeds tolerable levels. Because the VaR measure is tied to market volatility, it gives an immediate “feel” for the amount of risk in a portfolio especially in dynamic and volatile market environments. It therefore allows management to react quickly and adjust its portfolio strategies in different market conditions in accordance with its risk philosophy and appetite.
3. Stop Loss and Loss Alert Limits
Stop loss and loss alert limits are pre-determined level of losses within a defined time period (month-to-date or year-to-date), set as a function of the tolerable VAR and whose effect on capital adequacy is given due importance.
47Robinsons Bank Annual Report 2016

Stop loss and loss alert limits are compared on a daily basis with the cumulative business day realized and unrealized (marked-to-market) profits/losses. If an excess occurs, the concerned risk-taking personnel/unit is given notice through a standard breach regularization form, where the details of the breach is served. The concerned risk-taking personnel/unit is required to provide justification, strategy or alternative courses of action which will be approved by the appropriate authority based on the exception management matrix.
4. Weighted Average Modified Duration
The portfolio modified duration is a strategic tool used to model portfolio risk. To operate modified duration as a risk management tool, it is important to apply it on the overall portfolio as well as on the individual securities comprising the portfolio. The goal is to control excessive losses beyond the calculated modified duration.
5. Off-Market Rate Tolerance
Off-market rate tolerance limit is set up to mitigate the operational risk that dealers may consummate deals at an off-market rate even after carefully checking prevailing prices. This matters because an attempt to alter profit and loss (P&L) may require the trader to enter trades at an off-market rate. By doing so, the trades could reverse any P&L that the trader may have incurred in the other positions. The limits are also set up to rectify erroneous pricing and identify deal prices that are adverse to the Bank’s P&L.
For transactions incorrectly tagged as off-market rates transactions, ERMG independently reviews the cause of the breach and documents supporting worksheets that would illustrate how such deals are evaluated and how tolerance band is recomputed based on the market rates prevailing at deal date.
The limits were obtained by performing box-and-whiskers on the posted data and on market rates for foreign exchange trading and box-and-whiskers on posted transactions for fixed income trading.
6. Dealer Single Transaction Limits
Trader limits enable delegation of authority to execute transactions for and in behalf of the Bank to allow continuity of the treasury function even in the absence of the Treasurer. Trader limits aim to manage operational risks that is caused by this delegation of authority.
Interest Rate Risk
Interest Rate Management – Interest rate risk is a form of market risk but it has a multi-dimensional nature involving the movements of rates across yield curves (term structures) of one or more instruments. Specifically for the Bank’s banking book, the lending activities, taking deposits with different maturities and interest rates, and investing in a portfolio of fixed income securities, expose the Bank to interest rate risk. This risk may affect the recognition and/or accrual of interest income and expense.
Basis of Measurement – The Bank utilizes the Earnings-at-Risk (EaR) methodology in assessing the capital requirement of its interest rate risk exposure.
The EaR of the Bank is an estimate of the annualized maximum change in net interest income given a specified holding period for a particular time band’s repricing gap, with a corresponding probability of occurrence in a normal market environment.
Liquidity Risk
Liquidity Risk Management – The Bank’s appetite for liquidity risk is measured through the limits set for each book/fund vehicle, and for each liquidity target. These limits represent the historical liquidity levels tolerated by the Bank in the past.
The Bank uses two approaches to liquidity measurement. The flow approach uses the maximum cumulative outflow (MCO) as a tool to measure liquidity gaps of maturing assets and liabilities. The stock approach is more traditional – it focuses on ratios, and generally stems from the assumption that past experience enables institutions to determine a ratio that would provide future liquidity.
risk management
48 Robinsons Bank Annual Report 2016

The liquidity gap and balance sheet ratios are regularly measured, monitored and compared against their respective limits. These liquidity risk measures and other information on the liquidity position of the Bank are reported to ALCO weekly and to the RMC monthly.
Operational Risk
Operational Risk Management – The Bank further acknowledges that “operational risk is inherent in all activities, products, and services, and cuts across multiple activities and business lines within the financial institution and across the different entities in a banking group or conglomerate where the financial institution belongs.”
Operational Risk Structural Framework
RISK MANAGEMENT COMMITTEE
ENTERPRISE RISK MANAGEMENT GROUP - OPERATIONAL AND IT RISK MANAGEMENT OFFICES
INTERNAL AUDIT
MANAGEMENT, OPERATIONS & IT STEERING COMMITTEE
BUSINESS LINES / UNITS
NEW ACTIVITIES, PROCESSES, PRODUCTS, SYSTEMS
Key Risk Indicators Risk and Control Self Assessment Loss Events
RISK MITIGATION AND ACTION PLANS
REPORTING
SCENARIO ANALYSIS AND ICAAP
Identify Specify KRIs Escalation Triggers
Identify Risk Identify Control and Owner and Owner
Assess Assess Control Inherent Performance & and Effectiveness Residual Risk
Identify and Analyze Capture Causes Internal or and External Control Events Failures
Policies
and
Procedures
Technology
and
Systems
Rules
and
Regulations
Culture
and
Awareness
Sources: (1) The Institute of Internal Auditors, IIA Position Paper. The Three Lines of Defense in Effective Risk Management and Control, January 2013, page 2. (2) BSP MORB
The Bank adopts the Three Lines of Defense framework in managing operational risk. The framework is enumerated below:
First Line of Defense – Business and Service Units take ownership of the risk by identifying, assessing and managing the risks from the new activities, processes, products and systems they do and use.
Second Line of Defense – Operational and Information Technology Risk Management (OITRM) under Enterprise Risk Management Group, provides the tools and the consistency in risk management language such as results of internal/external audit and supervisory issues raised in the BSP Report of Examination (ROE), Risk & Control Self-Assessment (RCSA), Key Risk Indicators (KRI), Loss Events Database (LED) and Analysis, Business Impact Analysis (BIA).
Guided by the Bank’s policies and procedures, rules and regulations and with the aid of Technology and Systems as well as promotion of Risk awareness and establishment of culture and ethics, OITRM assists business units in defining the target risk exposure and reporting adequate risk-related information throughout the organization.
49Robinsons Bank Annual Report 2016
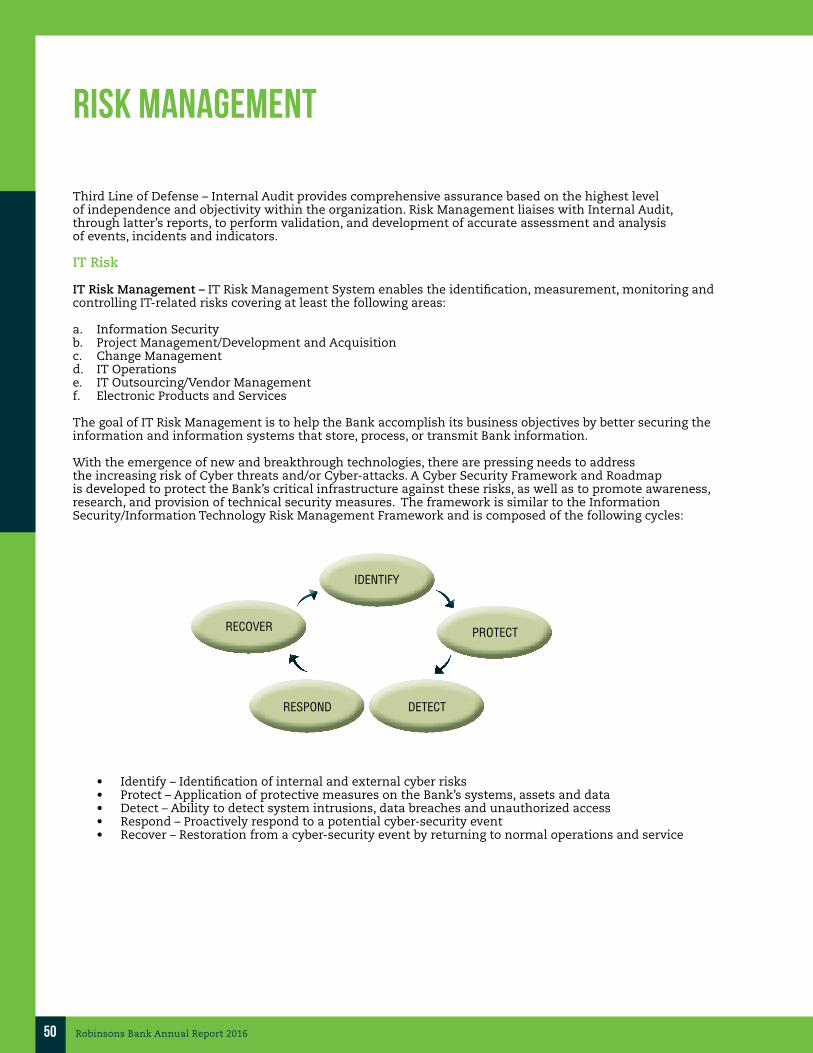
Third Line of Defense – Internal Audit provides comprehensive assurance based on the highest level of independence and objectivity within the organization. Risk Management liaises with Internal Audit, through latter’s reports, to perform validation, and development of accurate assessment and analysis of events, incidents and indicators. IT Risk
IT Risk Management – IT Risk Management System enables the identification, measurement, monitoring and controlling IT-related risks covering at least the following areas:
a. Information Securityb. Project Management/Development and Acquisitionc. Change Managementd. IT Operationse. IT Outsourcing/Vendor Managementf. Electronic Products and Services
The goal of IT Risk Management is to help the Bank accomplish its business objectives by better securing the information and information systems that store, process, or transmit Bank information.
With the emergence of new and breakthrough technologies, there are pressing needs to address the increasing risk of Cyber threats and/or Cyber-attacks. A Cyber Security Framework and Roadmap is developed to protect the Bank’s critical infrastructure against these risks, as well as to promote awareness, research, and provision of technical security measures. The framework is similar to the Information Security/Information Technology Risk Management Framework and is composed of the following cycles:
IDENTIFY
RECOVER PROTECT
RESPOND DETECT
• Identify – Identification of internal and external cyber risks• Protect – Application of protective measures on the Bank’s systems, assets and data• Detect – Ability to detect system intrusions, data breaches and unauthorized access• Respond – Proactively respond to a potential cyber-security event• Recover – Restoration from a cyber-security event by returning to normal operations and service
risk management
50 Robinsons Bank Annual Report 2016

Business Risk
Business Risk Management – Combining business risk with financial risks arising from the use of borrowed funds generates total corporate risk of the Bank. Business risks shall include, but not limited to the following:
1. Risks to reputation that arise from internal decisions that may damage the Bank’s market standing;2. Risks to reputation that arise from internal decisions and practices that ultimately impinge on the public’s trust
of the Bank;3. Risks from the actions of Bank that are contrary to existing regulations and identified best practices and reflect
weaknesses in the implementation of codes of conduct and standards of good practice; and4. Legal risks to the extent that changes in the interpretation or provisions of regulations directly affect the Bank’s
business model. Legal risk also covers the Bank’s current and potential losses from lawsuits.
• Reputational Risk – Is defined as the current and prospective impact on earnings or capital arising from negative public opinion. It affects a financial institution’s ability to establish new relationships or services or continue servicing existing relationships. This exposure may also expose a financial institution to litigation, financial loss, or a decline in its customer base.
The Objectives are to:
I. Ensure that the Bank’s credibility and reputation in the banking community is maintained at all times; II. Identify and establish potential reputational risk situations and the corresponding course of action
to address them; III. Establish and delineate the role of each of the unit/s department/s in the Bank in relation
to reputational risk; IV. Establish accountabilities and identify point persons for specific scenarios; and V. Assist in the implementation and strict monitoring of measures to ensure that all risk factors in relation
to reputational risk are identified and addressed.
• Compliance Risk – Is the current and prospective risk to earnings or capital arising from violations of, or nonconformance with laws, rules, regulations, prescribed practices, internal policies, and procedures, or ethical standards. Compliance risk also arises in situations where the laws or rules governing certain Bank products or activities of the Bank’s clients may be ambiguous or untested. This risk exposes the Bank to fines, payment of damages and the voiding of contracts. Compliance risk can lead to diminished reputation, reduced franchise value, limited business opportunities, reduced expansion potential, and lack of contract enforceability.
• Legal Risk – Is the extent that changes in the interpretation or provisions of regulations directly affect a Bank’s business model. Legal risk also covers the Bank’s current and potential losses from lawsuits.
Compliance & Legal Risk Management aims to adhere to the highest standards of ethical and professional behavior in the conduct of its business, and comply fully with all applicable laws, regulations and rules that govern the Bank‘s business, whether arising in the Philippines or in any other jurisdiction to which the Bank is subject.
To address and handle customers’ concerns particularly requests, queries and complaints and to mitigate associated risks (e.g., reputational and legal risks), the Bank created its Customers Care Center. In 2016, the Bank received a total of 12,136 request/queries and 2,698 complaints (70 of which or only 2.59% is complex).
51Robinsons Bank Annual Report 2016

Business Continuity Plan
The Bank’s Business Continuity Plan (BCP) covers an end-to-end and proactive process that covers five major segments: Business Impact Analysis (BIA), Business Resumption Strategy, Preventive Strategy, Testing Strategy and Review Plan & Certification. The BIA reviews the impact of disruption on the unit’s core processes and the resulting risk assessment serves as basis for prioritization in the Bank’s business Resumption Strategy. The Preventive Strategy describes the proactive measures taken to minimize losses during interruptions, if these cannot be avoided. The Testing Strategy and Review Plan define the process on how the Bank prepares for any eventuality, anytime and it makes way for continuous improvement.
BCP Framework: Over-all Process, Policies and Guidelines
Department Headsas Risk Owners with BCP Role
Senior Management: Prioritization & of Major Issues
IT: Computer System & Telecommunications
Board: Review & Approvalper BSP Memo dated 01.22.04
RASCU: Over-allCoordination
• Roll-out Standard BCP Framework• Provide Risk Management Tools• Ensure migration of best practices• Aggregate the BCPs, Test Results
for Bank Risk Profiling
• Develop Department BCP: BIA, Business Resumption & Preventive Strategy
• Maintain & Test Back-up Operations Centers• Implement BCP
• Develop appropriate IT BCP (TCP) based on BIA • Coordinate maintenance of the Back-up Operations
Centers• Coordinate Testing of technical & related matters
The BCP Framework
The major sections of the BCP are the Generic BCP, the Unit BCP and the Technical Contingency Plan (TCP)
risk management
52 Robinsons Bank Annual Report 2016

Capital Adequacy and Capital Management
The primary objectives of the Bank’s capital management are to ensure that the Bank complies with externally imposed capital requirements, as mandated by the BSP, and the Bank maintains healthy capital ratios in order to support its business and to maximize shareholder’s value. Presented below are the risk-based capital components, including regulatory deductions, on a parent and consolidated bases for 2015 and 2016:
Qualifying Capital(In PHP Million)
Consolidated Parent Company
2016 2015 2016 2015
Tier 1 CapitalPaid-up common stock 12,000.00 436.84 12,000.00 436.84 Additional paid-in-capital - - - - Deposit for Common Stock Subscription - 5,900.00 - 5,900.00 Retained Earnings 632.00 477.39 620.27 395.70 Undivided profits 250.99 100.73 234.26 173.50 Net unrealized gains or losses on AFS securities (818.39) (561.70) (818.39) (561.70)Cumulative Foreign Currency Translation (112.77) (103.29) (112.77) (103.29)Others (27.08) (33.32) (27.08) (33.09)Minority Interest - - - - Less: Regulatory adjustments DOSRI (0.31) (0.17) - - Deferred income tax (106.55) (108.31) (89.20) (90.96) Goodwill (607.08) (563.08) (362.75) (318.75) Other Intangible Assets (640.19) (641.81) (14.10) (14.10) Investments in subsidiary - - (1,160.00) (759.70)
Total Common Equity Tier 1 Capital 10,570.63 4,903.28 10,270.25 5,024.45 Additional Tier 1 Capital
Instruments issued by the bank that are eligible as AT1 Capital - 5,663.17 - 5,663.17 Total Tier 1 Capital 10,570.63 10,566.45 10,270.25 10,687.62
Tier 2 CapitalGeneral Loan Loss Provision (GLLP) 330.63 254.86 317.56 241.79
Total Tier 2 Capital 330.63 254.86 317.56 241.79 Total Gross Qualifying Capital 10,901.26 10,821.31 10,587.81 10,929.41 Total Qualifying Capital 10,901.26 10,821.31 10,587.81 10,929.41
The Bank manages its capital structure and makes adjustments to it in light of changes in economic conditions and the risk characteristics of its activities. In order to maintain or adjust the capital structure, the Bank may adjust the amount of dividend payment to shareholders, return capital to shareholders, or issue capital securities. No changes were made in the objectives, policies, and processes from the previous years.
53Robinsons Bank Annual Report 2016

The Risk-based Capital Ratios are as follows:
Qualifying Capital(In PHP Million)
Consolidated Parent Company
2016 2015 2016 2015
Tier 1 Capital 10,570.63 10,566.45 10,270.25 10,687.62Common Equity Tier 1 10,570.63 4,903.28 10,270.25 5,024.45 Additional Tier 1 Capital - 5,663.17 - 5,663.17 Tier 2 Capital 330.63 254.86 317.56 241.79 Gross Qualifying Capital 10,901.26 10,821.31 10,587.81 10,929.41 Less : Required deductions - - - - Total Qualifying Capital 10,901.26 10,821.31 10,587.81 10,929.41 Risk Weighted Assets 51,016.21 33,340.33 43,377.40 31,780.42 Common Equity Tier 1 Ratio 20.72% 14.71% 23.68% 15.81%Capital Conservation Buffer 14.72% 8.71% 17.68% 9.81%Tier 1 Capital Ratio 20.72% 31.69% 23.68% 33.63%Capital Adequacy Ratio 21.37% 32.46% 24.41% 34.39%
The regulatory qualifying capital of the Bank consists of Tier 1 (core) capital, which comprises of paid-up common stock, additional paid-in capital, deposit for common stock subscription, retained earnings, surplus including current year profit, minority interest less required deductions such as unsecured accommodations to DOSRI, deferred income tax and goodwill. The other component of regulatory capital is Tier 2 (supplementary) capital, which includes net unrealized gains and losses on AFS equity securities and general loan loss provision. A capital conservation buffer of 2.5% comprised of CET 1 capital is likewise imposed in the Basel III capital ratios.
Reconciliation between the Philippine Financial Reporting Standards (PFRS) Capital, capital under Philippine Regulatory Principles and Qualified Capital for Minimum Adequacy under Basel III are as follows (in PHP million):
PFRS Capital, 2016 11,968.22Differences due to Accounting Principles (43.46)RAP Capital, 2016 11,924.76General Loan Loss Provision 330.63
Capital Adjustments (1,354.13)
Qualified Capital for Minimum Adequacy Compliance under Basel III 10,901.26
risk management
54 Robinsons Bank Annual Report 2016

The capital requirements for Credit, Market, and Operational Risks are provided below, on solo and consolidated bases for 2015 and 2016:
Capital Requirementin PHP Million
Consolidated Parent Company
2016 2015 2016 2015
Credit Risk 4,643.95 2,924.61 3,893.06 2,804.44 Market Risk 22.21 10.31 22.31 10.40 Operational Risk 435.46 399.11 422.37 363.20 Total Capital Requirements 5,101.62 3,334.03 4,337.74 3,178.04
Credit Risk
The Bank uses the Standardized Approach under Circular No. 538 in computing its exposure for credit risk. Credit Risk-Weighted Asset (CRWA) is an important risk measure of the Bank, primarily because it is used to determine the Bank’s minimum capital requirement. The Bank’s minimum capital requirement for credit risk is defined as 10% of the CRWA.
The following table summarizes the result of the risk quantification and capital assessment of the Bank’s credit risk using the standardized approach:
CREDIT RISK-WEIGHTED ASSETS(in PHP million)
Consolidated Parent Company2016 2015 2016 2015
Credit Risk-Weighted AssetsTotal Risk Weighted On-Balance Sheet Assets 46,257.90 29,110.13 38,748.98 27,908.38Total Risk-Weighted Off-Balance Sheet Assets 152.47 128.79 152.47 128.79Total Counterparty Risk-Weighted Assets in the Trading Book 29.12 7.20 29.12 7.20(Derivatives and Repo-style Transactions) Total Gross Risk-Weighted Assets 46,439.49 29,246.12 38,930.57 28,044.37Deductions:
General loan loss provision [in excess of the amount permitted to be included in Upper Tier 2
- - - -
Unbooked valuation reserves and other capital adjustments affecting asset accounts based on the latest report of examination as approved by the Monetary Board
- - - -
TOTAL CREDIT RISK-WEIGHTED ASSETS 46,439.49 29,246.12 38,930.57 28,044.37
The Bank’s total CRWA as of 31 December 2016 stood at PHP38,930.57 million and PHP46,439.49 million, on solo and consolidated basis, respectively.
Presented in the next table is the total credit exposure, on solo and consolidated bases, broken down by type of exposures and risk buckets:
55Robinsons Bank Annual Report 2016
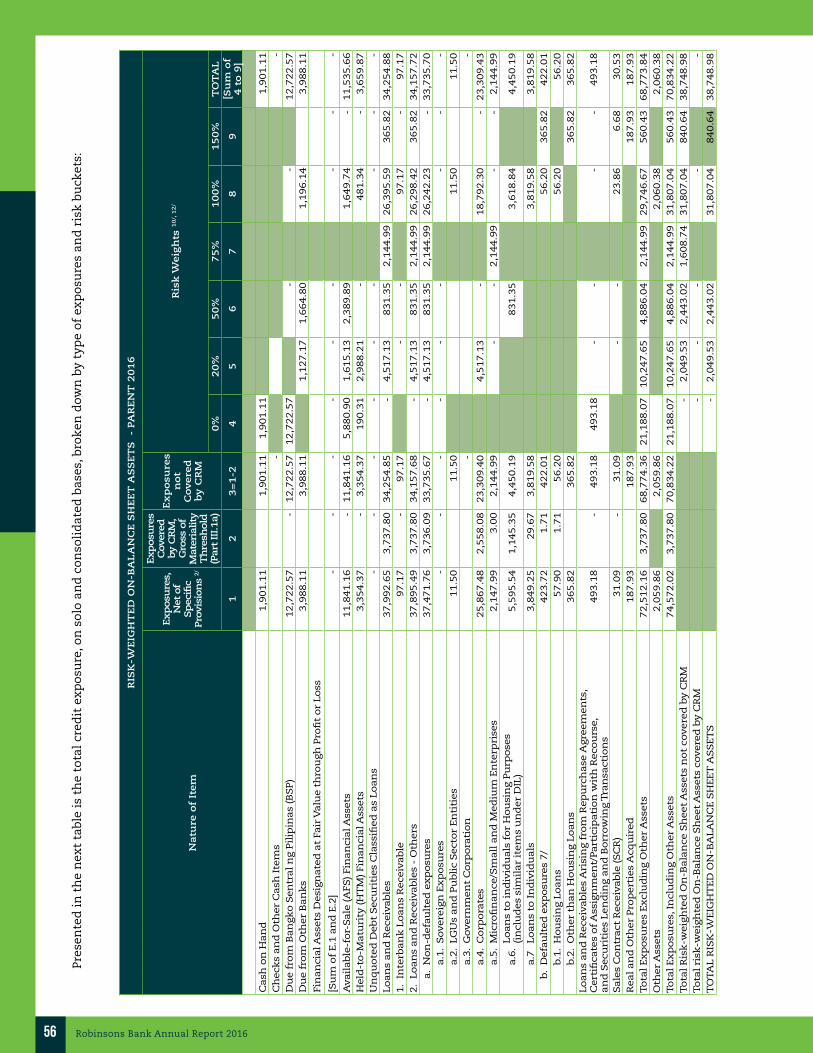
RIS
K-W
EIG
HT
ED
ON
-BA
LA
NC
E S
HE
ET
AS
SE
TS
-
PA
RE
NT
20
16
Natu
re o
f It
em
Exposu
res,
N
et o
f Spec
ific
Pro
visi
on
s 2/
Exposu
res
Cov
ered
by C
RM
, G
ross
of
Mat
eria
lity
T
hre
shold
(Part
III
.1a)
Ex
po
sure
s
no
t C
overe
d
by
CR
M
Ris
k W
eig
hts
10
/, 1
2/
0%
20
%5
0%
75
%1
00
%1
50
%T
OT
AL
12
3=
1-2
45
67
89
[Su
m o
f
4 t
o 9
]
Cash
on
Han
d 1
,901.1
1
1,9
01.1
1
1,9
01.1
1
1,9
01.1
1
Ch
eck
s an
d O
ther
Cash
Ite
ms
-
-
Du
e f
rom
Ban
gk
o S
en
tral n
g P
ilip
inas
(BS
P)
12,7
22.5
7
-
12,7
22.5
7
12,7
22.5
7
-
-
12,7
22.5
7
Du
e f
rom
Oth
er
Ban
ks
3,9
88.1
1
3,9
88.1
1
1,1
27.1
7
1,6
64.8
0
1,1
96.1
4
3,9
88.1
1
Fin
an
cial A
ssets
Desi
gn
ate
d a
t Fa
ir V
alu
e t
hro
ugh
Pro
fit
or
Lo
ss
[Su
m o
f E.1
an
d E
.2]
--
--
--
--
-
Avail
able
-fo
r-S
ale
(A
FS
) Fi
nan
cial A
ssets
1
1,8
41.1
6
-
11,8
41.1
6
5,8
80.9
0
1,6
15.1
3
2,3
89.8
9
1,6
49.7
4
-
11,5
35.6
6
Held
-to
-Matu
rity
(H
TM
) Fi
nan
cial A
ssets
3,3
54.3
7
-
3,3
54.3
7
190.3
1
2,9
88.2
1
-
481.3
4
-
3,6
59.8
7
Un
qu
ote
d D
eb
t S
ecu
riti
es
Cla
ssifi
ed
as
Lo
an
s -
-
-
-
-
-
-
-
-
Lo
an
s an
d R
ece
ivable
s 3
7,9
92.6
5
3,7
37.8
0
34,2
54.8
5
-
4,5
17.1
3
831.3
5
2,1
44.9
9
26,3
95.5
9
365.8
2
34,2
54.8
8
1.
Inte
rban
k L
oan
s R
ece
ivable
9
7.1
7
-
97.1
7
-
-
97.1
7
-
97.1
7
2.
Lo
an
s an
d R
ece
ivable
s -
Oth
ers
3
7,8
95.4
9
3,7
37.8
0
34,1
57.6
8
-
4,5
17.1
3
831.3
5
2,1
44.9
9
26,2
98.4
2
365.8
2
34,1
57.7
2
a.
No
n-d
efa
ult
ed
ex
po
sure
s 3
7,4
71.7
6
3,7
36.0
9
33,7
35.6
7
-
4,5
17.1
3
831.3
5
2,1
44.9
9
26,2
42.2
3
-
33,7
35.7
0
a.1
.S
overe
ign
Ex
po
sure
s -
-
-
-
-
-
-
-
-
a.2
.LG
Us
an
d P
ubli
c S
ect
or
En
titi
es
11.5
0
11.5
0
11.5
0
11.5
0
a.3
.G
overn
men
t C
orp
ora
tio
n -
-
a.4
.C
orp
ora
tes
25,8
67.4
8
2,5
58.0
8
23,3
09.4
0
4,5
17.1
3
-
18,7
92.3
0
-
23,3
09.4
3
a.5
.M
icro
fin
an
ce/S
mall
an
d M
ed
ium
En
terp
rise
s 2
,147.9
9
3.0
0
2,1
44.9
9
-
-
2,1
44.9
9
-
-
2,1
44.9
9
a.6
.Lo
an
s to
in
div
idu
als
fo
r H
ou
sin
g P
urp
ose
s
(in
clu
des
sim
ilar
item
s u
nd
er
DIL
) 5
,595.5
4
1,1
45.3
5
4,4
50.1
9
831.3
5
3,6
18.8
4
4,4
50.1
9
a.7
Lo
an
s to
In
div
idu
als
3,8
49.2
5
29.6
7
3,8
19.5
8
3,8
19.5
8
3,8
19.5
8
b.
Defa
ult
ed
ex
po
sure
s 7/
423.7
2
1.7
1
422.0
1
56.2
0
365.8
2
422.0
1
b.1
.H
ou
sin
g L
oan
s 5
7.9
0
1.7
1
56.2
0
56.2
0
56.2
0
b.2
.O
ther
than
Ho
usi
ng L
oan
s 3
65.8
2
365.8
2
365.8
2
365.8
2
Lo
an
s an
d R
ece
ivable
s A
risi
ng f
rom
Rep
urc
hase
Agre
em
en
ts,
Cert
ifica
tes
of
Ass
ign
men
t/Part
icip
ati
on
wit
h R
eco
urs
e,
an
d S
ecu
riti
es
Len
din
g a
nd
Bo
rrow
ing T
ran
sact
ion
s 4
93.1
8
-
493.1
8
493.1
8
-
-
-
-
493.1
8
Sale
s C
on
tract
Rece
ivable
(S
CR
) 3
1.0
9
-
31.0
9
-
-
23.8
6
6.6
8
30.5
3
Real an
d O
ther
Pro
pert
ies
Acq
uir
ed
187.9
3
187.9
3
187.9
3
187.9
3
To
tal Ex
po
sure
s Ex
clu
din
g O
ther
Ass
ets
7
2,5
12.1
6
3,7
37.8
0
68,7
74.3
6
21,1
88.0
7
10,2
47.6
5
4,8
86.0
4
2,1
44.9
9
29,7
46.6
7
560.4
3
68,7
73.8
4
Oth
er
Ass
ets
2
,059.8
6
2,0
59.8
6
2,0
60.3
8
2,0
60.3
8
To
tal Ex
po
sure
s, I
ncl
ud
ing O
ther
Ass
ets
74,5
72.0
2
3,7
37.8
0
70,8
34.2
2
21,1
88.0
7
10,2
47.6
5
4,8
86.0
4
2,1
44.9
9
31,8
07.0
4
560.4
3
70,8
34.2
2
To
tal R
isk
-weig
hte
d O
n-B
ala
nce
Sh
eet
Ass
ets
no
t co
vere
d b
y C
RM
-
2
,049.5
3
2,4
43.0
2
1,6
08.7
4
31,8
07.0
4
840.6
4
38,7
48.9
8
To
tal ri
sk-w
eig
hte
d O
n-B
ala
nce
Sh
eet
Ass
ets
covere
d b
y C
RM
-
-
-
-
-
TO
TA
L R
ISK
-WEIG
HT
ED
ON
-BA
LA
NC
E S
HEET
AS
SET
S-
2,0
49.5
32,4
43.0
231,8
07.0
4840.6
438,7
48.9
8
Pres
ente
d in
th
e n
ext
tabl
e is
th
e to
tal c
red
it e
xpos
ure
, on
sol
o an
d c
onso
lid
ated
bas
es, b
roke
n d
own
by
typ
e of
exp
osu
res
and
ris
k bu
cket
s:
56 Robinsons Bank Annual Report 2016

RIS
K-W
EIG
HT
ED O
N-B
ALA
NC
E SH
EET
ASS
ETS
- C
ON
SOLI
DA
TED
201
6
Natu
re o
f It
em
Exposu
res,
N
et o
f Spec
ific
Pro
visi
on
s 2/
Exposu
res
Cov
ered
by C
RM
, G
ross
of
Mat
eria
lity
T
hre
shold
(Part
III
.1a)
Exposu
res
n
ot
Cov
ered
by C
RM
Ris
k W
eig
hts
10
/, 1
2/
0%
20
%5
0%
75
%1
00
%1
50
%T
OT
AL
12
3=
1-2
45
67
89
[Su
m o
f
4 t
o 9
]
Cas
h o
n H
and
1,9
38.8
1 1
,938
.81
1,9
38.8
1 1
,938
.81
Ch
ecks
an
d O
ther
Cas
h I
tem
s -
-
Du
e fr
om B
angk
o Se
ntr
al n
g Pi
lip
inas
(BSP
) 1
3,32
0.90
-
1
3,32
0.90
1
3,32
0.90
-
-
1
3,32
0.90
Du
e fr
om O
ther
Ban
ks 4
,077
.56
4,0
77.5
6 1
,127
.17
1,6
64.8
0 1
,285
.59
4,0
77.5
6
Fin
anci
al A
sset
s D
esig
nat
ed a
t Fa
ir V
alu
e th
rou
gh P
rofi
t or
Los
s -
-
-
-
-
-
-
-
-
Ava
ilab
le-f
or-S
ale
(AFS
) Fin
anci
al A
sset
s 1
1,84
1.16
-
1
1,84
1.16
5
,880
.90
-
-
5,9
60.2
6 -
1
1,84
1.16
Hel
d-t
o-M
atu
rity
(HT
M) F
inan
cial
Ass
ets
3,5
71.6
1 -
3
,571
.61
190
.31
3,2
03.4
0 -
1
77.8
9 -
3
,571
.61
Un
qu
oted
Deb
t Se
curi
ties
Cla
ssifi
ed a
s Lo
ans
-
-
-
-
-
-
-
-
-
Loan
s an
d R
ecei
vabl
es
38,
907.
79
3,7
40.7
1 3
5,16
7.08
-
-
8
34.6
0 2
,248
.44
31,
631.
31
452
.73
35,
167.
08
1.In
terb
ank
Loan
s R
ecei
vabl
e 9
7.17
-
9
7.17
-
-
9
7.17
-
9
7.17
2.Lo
ans
and
Rec
eiva
bles
- O
ther
s 3
8,81
0.62
3
,740
.71
35,
069.
91
-
-
834
.60
2,2
48.4
4 3
1,53
4.14
4
52.7
3 3
5,06
9.91
a.N
on-d
efau
lted
exp
osu
res
38,
298.
28
3,7
39.0
0 3
4,55
9.28
-
-
8
34.6
0 2
,248
.44
31,
476.
24
-
34,
559.
28
a.1.
Sove
reig
n E
xpos
ure
s -
-
-
-
-
-
-
-
-
a.2.
LGU
s an
d P
ubl
ic S
ecto
r En
titi
es 1
1.50
1
1.50
1
1.50
1
1.50
a.3.
Gov
ern
men
t C
orp
orat
ion
-
-
a.4.
Cor
por
ates
25,
867.
48
2,5
58.0
8 2
3,30
9.40
-
-
2
3,30
9.40
-
2
3,30
9.40
a.5.
Mic
rofi
nan
ce/S
mal
l an
d M
ediu
m E
nte
rpri
ses
2,2
51.4
4 3
.00
2,2
48.4
4 -
-
2
,248
.44
-
-
2,2
48.4
4
a.6.
Loan
s to
ind
ivid
ual
s fo
r H
ousi
ng
Purp
oses
(i
ncl
ud
es s
imil
ar it
ems
un
der
DIL
) 5
,598
.79
1,1
45.3
5 4
,453
.44
834
.60
3,6
18.8
4 4
,453
.44
a.7
Loan
s to
In
div
idu
als
4,5
69.0
7 3
2.58
4
,536
.50
4,5
36.5
0 4
,536
.50
b.D
efau
lted
exp
osu
res
7/ 5
12.3
4 1
.71
510
.64
57.
90
452
.73
510
.64
b.1.
Hou
sin
g Lo
ans
59.
61
1.7
1 5
7.90
5
7.90
5
7.90
b.2.
Oth
er t
han
Hou
sin
g Lo
ans
452
.73
452
.73
452
.73
452
.73
Loan
s an
d R
ecei
vabl
es A
risi
ng
from
Rep
urc
has
e A
gree
men
ts, C
erti
fica
tes
of
Ass
ign
men
t/Pa
rtic
ipat
ion
wit
h R
ecou
rse,
an
d S
ecu
riti
es L
end
ing
and
Bor
row
ing
Tran
sact
ion
s 6
76.8
7 -
6
76.8
7 6
76.8
7 -
-
-
-
6
76.8
7
Sale
s C
ontr
act
Rec
eiva
ble
(SC
R)
49.
29
-
49.
29
-
-
39.
07
10.
22
49.
29
Rea
l an
d O
ther
Pro
per
ties
Acq
uir
ed 3
37.7
8 3
37.7
8 3
37.7
8 3
37.7
8
Tota
l Exp
osu
res
Excl
ud
ing
Oth
er A
sset
s 7
4,72
1.77
3
,740
.71
70,
981.
06
22,
007.
80
4,3
30.5
7 2
,499
.40
2,2
48.4
4 3
9,09
4.13
8
00.7
2 7
0,98
1.06
Oth
er A
sset
s 2
,160
.55
2,1
60.5
5 2
,160
.55
2,1
60.5
5
Tota
l Exp
osu
res,
In
clu
din
g O
ther
Ass
ets
76,
882.
32
3,7
40.7
1 7
3,14
1.61
2
2,00
7.80
4
,330
.57
2,4
99.4
0 2
,248
.44
41,
254.
67
800
.72
73,
141.
61
Tota
l Ris
k-w
eigh
ted
On
-Bal
ance
Sh
eet
Ass
ets
not
cov
ered
by
CR
M -
8
66.1
1 1
,249
.70
1,6
86.3
3 4
1,25
4.67
1
,201
.09
46,
257.
90
Tota
l ris
k-w
eigh
ted
On
-Bal
ance
Sh
eet
Ass
ets
cove
red
by
CR
M
-
-
-
-
-
TO
TAL
RIS
K-W
EIG
HT
ED O
N-B
ALA
NC
E SH
EET
ASS
ETS
-
866
.11
1,2
49.7
0 1
,686
.33
41,
254.
67
1,2
01.0
9 4
6,25
7.90
57Robinsons Bank Annual Report 2016

The credit equivalent amount for off-balance sheet items, broken down by type of exposures, in PHP million on a consolidated and parent bases, are:
Off-balance Sheet Assets(In PHP Million)
Consolidated Parent
2016 2015 2016 2015
NotionalPrincipal
CreditEquivalent
NotionalPrincipal
CreditEquivalent
NotionalPrincipal
CreditEquivalent
NotionalPrincipal
CreditEquivalent
Direct Credit Substitutes 134.35 134.35 96.23 96.23 134.35 134.35 96.23 96.23
Transaction-related contingencies - - - - - - - -
Trade-related contingencies
arising from movement of goods 452.89 90.58 162.84 32.57 452.89 90.58 162.84 32.57
Other commitments (which
can be done unconditionally
cancelled at any time by
the bank without prior notice) 18,401.08 - 26,912.17 - 18,399.10 - 26,910.84 -
Total Notional Principal and
Credit Equivalent Amount 18,988.33 224.93 27,171.24 128.79 18,986.35 224.93 27,169.91 128.79
Credit equivalent amount for counterparty risk-weighted items, broken down by type of exposures (in PHP million)
COUNTERPARTY RISK-WEIGHTED ASSETS IN THE BANKING BOOK
(In PHP Million)
Consolidated Parent
2016 2015 2016 2015
NotionalPrincipal
CreditEquivalent
NotionalPrincipal
CreditEquivalent
NotionalPrincipal
CreditEquivalent
NotionalPrincipal
CreditEquivalent
Derivatives Exposures
Forward Foreign Exchange Rate Contracts
5,681.65 58.24 1,436.25 14.36 5,681.65 58.24 1,436.25 14.36
Total Notional Amount 5,681.65 58.24 1,436.25 14.36 5,681.65 58.24 1,436.25 14.36
Total Counterparty Risk-Weighted Assets of Derivative Transaction 29.12 7.20 29.12 7.20
Pursuant to the Bank’s policy, the credit ratings given by foreign and local rating agencies were used to determine the credit risk weights of On-balance sheet, Off-balance sheet and counter party exposures.
For all rated credit exposures, regardless of currency, the Bank used the ratings of Standard & Poor’s (S&P); Moody’s, and Fitch Ratings. On the other hand, the credit rating given by Philippine Rating Services Corporation was used for Unquoted Debt Securities, certain Corporate Bonds, Peso-denominated exposures and loans to rated domestic private entities.
The Bank neither uses credit derivatives as credit risk mitigants, nor provides credit protection through credit derivatives. The Bank has no outstanding exposure to securitization structures and other types of structured products issued or purchased by the Bank.
risk management
58 Robinsons Bank Annual Report 2016
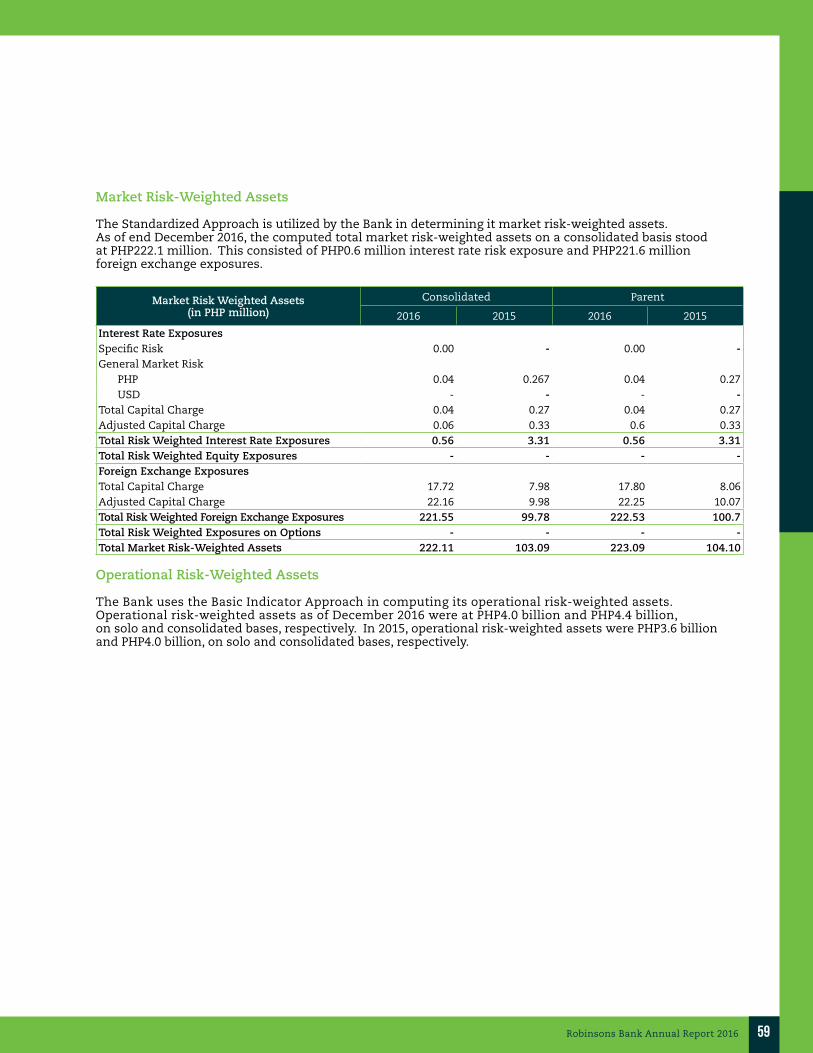
Market Risk-Weighted Assets
The Standardized Approach is utilized by the Bank in determining it market risk-weighted assets. As of end December 2016, the computed total market risk-weighted assets on a consolidated basis stood at PHP222.1 million. This consisted of PHP0.6 million interest rate risk exposure and PHP221.6 million foreign exchange exposures.
Market Risk Weighted Assets(in PHP million)
Consolidated Parent
2016 2015 2016 2015
Interest Rate ExposuresSpecific Risk 0.00 - 0.00 -General Market Risk
PHP 0.04 0.267 0.04 0.27USD - - - -
Total Capital Charge 0.04 0.27 0.04 0.27Adjusted Capital Charge 0.06 0.33 0.6 0.33Total Risk Weighted Interest Rate Exposures 0.56 3.31 0.56 3.31Total Risk Weighted Equity Exposures - - - -Foreign Exchange ExposuresTotal Capital Charge 17.72 7.98 17.80 8.06Adjusted Capital Charge 22.16 9.98 22.25 10.07Total Risk Weighted Foreign Exchange Exposures 221.55 99.78 222.53 100.7Total Risk Weighted Exposures on Options - - - -Total Market Risk-Weighted Assets 222.11 103.09 223.09 104.10 Operational Risk-Weighted Assets
The Bank uses the Basic Indicator Approach in computing its operational risk-weighted assets. Operational risk-weighted assets as of December 2016 were at PHP4.0 billion and PHP4.4 billion, on solo and consolidated bases, respectively. In 2015, operational risk-weighted assets were PHP3.6 billion and PHP4.0 billion, on solo and consolidated bases, respectively.
59Robinsons Bank Annual Report 2016

Interest Rate Risk in the Banking Book
The Bank’s lending activities, taking deposits with different maturities, interest rates, and investing in a portfolio of fixed income securities, exposes the Bank to interest rate risk.
In this case, the Bank aims to achieve the optimum level of net interest income (NII) while managing its volatility and susceptibility to changes in interest rates.
Basis of Measurement – The Bank utilizes a repricing gap analysis as a tool for measuring interest rate risk. The analysis is created by distributing the Bank’s inflows/assets and outflows/liabilities into time bands according to each instruments remaining term to next repricing.
Specific assumptions are used to reflect the behavior of interest-sensitive assets and liabilities in the preparation of repricing gap:
Loans – Performing loans are bucketed according to either the maturity date (for accounts paying fixed interest rate) or next repricing date (for accounts paying floating interest rate). No prepayment is assumed. Non-performing loans are placed under “Non-rate sensitive”.
Deposits – Non-maturity deposits such as Current Accounts and Savings Account are placed under “Non-rate sensitive” while Time Deposits and Special Savings Account are bucketed based on their contractual maturity.
The repricing gap per time band is derived by computing the difference between the rate-sensitive assets (RSA) and the rate-sensitive liabilities (RLA) within the time band.
To control interest rate risk arising from repricing gaps, maximum repricing gap and EaR limits are set for time bands up to one year. EAR is a statistical measure derived from the repricing gaps, and calculates the likely impact of changes in interest rates to the NII. Based on December 31, 2016 figures, the increase (decrease) in NII for upward and downward rate shocks of 100 basis points is as follows (in PHP millions):
Earnings at Risk Up 100 BPS Rate shock Down 100 BPS Rate shock
Instruments sensitive to local interest rates (102.68) 102.68Instruments sensitive to foreign interest rates (2.08) 2.08Total (104.76) 104.76
risk management
60 Robinsons Bank Annual Report 2016

2016 Highlights
Credit Risk Management
a. The following are the enhancements implemented comply with BSP Circular 855 Guidelines on Sound Credit Risk Management Practices:• Developed an ICRRS model specifically for commercial loan borrowers with asset size
of PHP15.0 million and below to address the requirements that all borrowers shall be rated for risk.
• Implemented an internal method of collective impairment for consumer and microfinance loan portfolios based on the historical charge off rate of the portfolio with considerations for any recovery from delinquent and foreclosed accounts.
b. Internally developed and implemented scorecards and policy deviation rules for Auto and Housing Loans in the Acacia Loans Origination System (LOS);
c. Set-up materiality threshold and limits for Related Party Transactions (RPT).
Operational Risk Management
a. Enhanced Integrated Risk and Control Self-Assessment (RCSA) and Key Risk Indicator (KRI) Methodology
b. Enhanced Risk Awareness Program
IT Risk Management
a. IT Governance: IT Risk Management• EnhancedtheInformationSecurity/InformationTechnologyRiskAssessment(ISITRA)
b. Information Security• ImprovedtheInformationAssetRegister(IAR)andconductedabank-widerolloutoftheIAR;
c. IT Operations and Security• EstablishmentandenhancementoftheITStrategicPlanandITDisasterRecoveryPlan
(a subset of the Bank’s Business Continuity Plan);• FormulationoftheCyberSecurityRoadmapandFramework;• ImplementationoftheDisasterRecoveryTestofthemajorsystemssuchasFinacleCore,
Finacle Treasury, Retail Internet Banking, Postilion and FICO LOS
d. Enhanced the Business Continuity Management (BCM)
Market Risk Management
a. Enhanced the Daily Market Risk Reports b. Established the VaR and MTM calculation of currency derivativesc. Revised the VaR Methodologyd. Enhanced the Market Risk Stress Testing
Liquidity Risk Management
a. Enhanced the Liquidity Risk Stress Testingb. Enhanced the ALM Reports
61Robinsons Bank Annual Report 2016

62 Robinsons Bank Annual Report 2016
DEPOSIT PRODUCTS• Peso Savings Account
- Regular Passbook - ATM Account - Payroll Account - Tykecoon Kiddie Account
• Peso Checking Account - Individual Account - Corporate Account
• Peso Term Deposits - Special Savings Account - Time Deposit
• Other Foreign Currency Savings and Time Deposit Accounts
- US Dollar - Euro (EUR) - Japanese Yen (JPY)
CONSUMER LOAN PRODUCTS • Home Loan • Auto Loan • Personal Loan • PLP Secured Loan • Microfinance • Motorcycle Financing • Fleet Financing • Small Business Loan• mSME Loan
COMMERCIAL LOAN PRODUCTS • Cash Secured Loan• Revolving Credit Line• Medium and Long-term Facilities for small,
medium and large industries• Receivables Financing• Bills Purchased Line for small,
medium and large enterprises
TREASURY PRODUCTS • Peso Special Savings• Peso Sovereign Bonds (TBills, FXTNs, RTBs)• Peso Corporate Bonds• US$, Euro and Yen TD• Spot and Forward Foreign Exchange for US$
and Third Currencies• US$ Sovereign Bonds (ROPs and Sovereign Bonds)• US$ Corporate Bonds
TRUST PRODUCTS • Unit Investment Trust Fund
- Money Market Fund - Balanced Fund - Tax-Exempt Retirement Fund
• Escrows• Retirement Fund Management• Safekeeping• Peso/USD Personal Investment Management
Agreement• Peso/USD Corporate Investment Management
Agreement
TRADE SERVICES PRODUCTS • Import
- Letter of credit issuance/amendment (Import/Domestic/Standby LC/Bank Guarantee)
- Non-documentary import collection - Shipside Bond/Shipping Guaranty Issuance - Trust Receipt Financing - Duties and Taxes Collection
PRODUCTS AND SERVICES

63Robinsons Bank Annual Report 2016
• Export - Advising export letter of credit - Export bills purchase - Export bills for collection - Export advances facility
CASH MANAGEMENT PRODUCTS • SME Builder (CheckPro & HRIS)• Disbursements
- Payroll Crediting - Electronic Crediting - Outsourced Manager’s Check - Outsourced Corporate Check - Domestic and Cross-Border Wire Payments
• Collections - Reference Account Solution - PDC Warehousing - Merchant Collection (Bills Payment) - Check Collection
• Others - Liquidity Management• Electronic Banking Services
- Automated Teller Machine (ATM) - Corporate Internet Banking (e2Banking) - Retail Internet Banking (RWeb)
OTHER BANKING SERVICES• Telegraphic Transfer• Philippine Domestic Dollar Transfer System
(PDDTS)• Real Time Gross Settlement (RTGS)• Western Union• OTC Bills Payment• Foreign Exchange• Deposit Pick-up Service• Day and Night Depository Box• Safety Deposit Box (SDB)• ATM Guard

64 Robinsons Bank Annual Report 2016

65Robinsons Bank Annual Report 2016

66 Robinsons Bank Annual Report 2016
127220 Branches
LUZON
METRO MANILA
VISAYAS
MINDANAO
39 Branches | 31%
63 Branches | 49%
16 Branches | 13%
9 Branches | 7%
ATMs
*As of May 31, 2017
*
*
BRANCH DIRECTORY

67Robinsons Bank Annual Report 2016
METRO MANILA BRANCHESA. ARNAIZ AVENUEUnit 7A, Commercial Space, The Beacon MakatiA. Arnaiz Avenue corner Chino Roces Avenue, Makati City894-1667 | 894-1671 | 894-1758
ACACIA LANE – SHAW BOULEVARDG/F Padilla Bldg. 333 Shaw BoulevardBrgy. Bagong Silang, Mandaluyong City668-2534 | 668-2510
ALABANGG/F Unit 4, El Molito Commercial ComplexMadrigal Avenue corner Alabang Zapote RoadAlabang, Muntinlupa City850-9529 | 772-1565
ASUNCION - BINONDOG/F Don Norberto & Doña Salustiana Ty Building 403 Asuncion Street corner San Nicolas, Binondo, Manila241-2610 | 241-2061 | 241-3044
AYALA6780 GF JAKA 1 Building Ayala Avenue, Makati City822-7980 | 822-7965
BANAWEStore No. 2, Ll Commercial Building Lot 5 Block 240, Banawe Street, Brgy. Tatalon, Quezon City516-8644 | 516-8674 | 411-1834
BETTER LIVINGG/F Triple M Commercial Building Doña Soledad Ave. corner Australia Street, Better Living Subd, Parañaque City823-2503 | 823-2510
BGC 34TH STREETShop 1, Panorama Tower, 34th Street corner Lane A, Bonifacio Global City, Taguig City897-3771 | 869-6407 | 869-6406
BGC 7TH AVEUnit GF 7, Trade and Financial Tower Building 7th Ave. corner Lane Q Road, Bonifacio Global City Taguig City887-5649 | 887-5648 | 887-5654
BGC BURGOS CIRCLEG/F Unit B, The Cresent Park Residences, 30th Street corner 2nd Avenue, Bonifacio Global City, Taguig City553-7204 | 553-7205
BINONDOG/F Pacific Centre Building, 460 Quintin Paredes corner Sabino Padilla Street Binondo, Manila242-4430 | 242-4443
BONIFACIO GLOBAL CITYGround Level, Market Market MallBonifacio Global City, Taguig City856-0693 | 856-0694
BRIDGETOWNE – C5G/F Tera Tower, Bridgetowne C5 corner Ortigas Avenue Extension, Quezon City650-4440 | 650-4386
*Branches opened in 2017**Branches renamed in 2017

68 Robinsons Bank Annual Report 2016
PASIG C. RAYMUNDOG/F Marius Arcadia Building, C. Raymundo Avenue corner Pag-asa Street, Pasig City477-5949 | 477-5947
CALOOCANG/F Dona Lolita Building, 363 Rizal Avenue Extension Kalookan City363-4654 | 363-3758
CHINO ROCES AVENUE EXTENSIONG/F 2308 Natividad BuildingChino Roces Avenue Extension, Makati City345-2014 | 403-7057
CUBAO P. TUAZONG/F & Mezz, Genato Building, 250 P. Tuazon corner 15th Avenue, Cubao, Quezon City912-0053 | 912-0046
D. GUEVARA MANDALUYONGG/F 50 D. Guevara Street, Mandaluyong City531-0855 | 531-1478
DEL MONTE AVENUEG/F EWELL Square, Del Monte Avenue corner Biak-na-Bato, Quezon City354-8582 | 354-8583
DOMESTIC ROADG/F Cebu Pacific Airline Operations Center Building Domestic Road, Pasay City893-5968 | 893-5971
E. RODRIGUEZ SR. AVE.G/F 1166, E. Rodriguez Sr. Avenue, New Manila, Quezon City571-5745 | 571-6754
EASTWOOD CITYG/F IBM Plaza Building, Eastwood CityE. Rodriguez Jr. Avenue, Bagumbayan, Quezon City395-1336 | 395-1337
EDSA CALOOCAN524-F, Jun Building, EDSA, Caloocan921-3600 | 921-3500
ERMITALevel 1, Padre Faura Wing, Robinsons Place Manila Ermita, Manila397-7027 | 536-1140
EVANGELISTA – MAKATIG/F 1861, Evangelista Street, Pio Del Pilar, Makati City815-7946 | 815-7433
FILINVEST ALABANGUnit 104, Civic Place Condominium, 2301 Civic DriveFilinvest Corporate City, Alabang, Muntinlupa City659-0493 | 659-0494
GIL PUYAT AVE.G/F New Solid Realty Inc. Building 357 Sen. Gil Puyat Avenue, Makati City897-1189 | 897-9440
J.P. RIZAL ST. – MAKATIG/F Mendoza Building 834 J. P. Rizal Street corner E. Zobel Street, Makati City807-1240 | 807-1236
KATIPUNANG/F Burgundy Place Condominium Katipunan Avenue, Loyola Heights, Quezon City426-2594 | 426-5604
LAS PIÑASG/F Units G86-G87, Robinsons Place Las Piñas345 Alabang-Zapote Road, Talon Uno, Las Piñas City875-6875 | 875-6872
LAS PIÑAS – PAMPLONAG/F South Park Heights, 262 Alabang-Zapote RoadPamplona, Las Piñas City872-6944 | 872-3016
LEGAZPI STREET - MAKATIG/F Office 1 Man Tower Legazpi Building 153 Legazpi Street, Legaspi Village, Makati City893-9395 | 818-4263
MAGINHAWA ST.143 Maginhawa Street, Barangay Teachers Village Quezon City283-7276 | 285-5420
MAGNOLIA TOWN CENTERL/G Unit LG026, Robinsons Magnolia Town CenterAurora Boulevard, Quezon City961-6040 | 961-6041
MAIN OFFICEG/F Galleria Corporate Center EDSA corner Ortigas Avenue, Quezon City702-9540 | 702-9568
MALABON CITYLevel 1-01127, Robinsons Town Mall Malabon5 Governor Pascual Avenue corner Crispin Street, Tinajeros, Malabon City287-7997 | 287-7758 | 287-3635
MARIKINAVC Chan Building, No. 8 Bayan-Bayanan Avenue Concepcion Uno, Marikina City948-6890 | 948-7121
MERALCO AVENUEG01 & G02, Robins Design Center 31 Meralco Avenue, Ortigas, Pasig City942-1853 | 706-0454
MOA COMPLEXUnit 101, Tower 1 Oceanaire ResidencesSunrise Drive corner Road 23, Coral Way MOA Complex, Pasay City801-0243 | 801-0245
N.S. AMORANTO SR. AVE.G/F Unit 102 “R” Place Building 255 N.S. Amoranto Sr-Avenue, Quezon City521-0997 | 521-0936
NINOY AQUINO AVE.G/F Rooms 2 & 3, Sky Freight Building, Sky Freight CenterNinoy Aquino Avenue, Parañaque City851-1066 | 851-1025
NOVALICHESG/F Expansion Building, Robinsons NovalichesQuirino Highway, Bgy Pasong Putik, Novaliches, Quezon City 935-3409 | 935-3412
BRANCH DIRECTORY

69Robinsons Bank Annual Report 2016
ORTIGAS GREENHILLSG/F Limketkai Building, Ortigas Avenue corner Roosevelt Street, Brgy. Greenhills, San Juan City726.3360 | 725.6390
P. RADA TONDO580-584 Padre Rada Street, Tondo, Manila243-9004 | 243-8969
PASAY – LIBERTADG/F Cementina Corporation Building, 160 A. Arnaiz Avenue (formerly Libertad Street) corner Cuenca Street, Pasay City834-7836 | 833-7718
PASEO DE ROXASG/F 111 Paseo de Roxas Building, Legazpi Street corner Paseo de Roxas, Legazpi Village, Makati804-2622 | 804-2629 | 804-2624
PASIG – METRO EASTL/G Robinsons Metro East, Marcos Highway Barangay De la Paz, Pasig City345-2043 | 646-8835 | 249-1173
PIONEER CYBERGATEUpper G/F, Robinsons Pioneer Cybergate Center 1Pioneer St., Mandaluyong City395-2749 | 395-2732
REGALADO AVENUERS137-05, Robinsons Townville Regalado Fairview, Quezon City376-6359 | 376-6063 | 376-6091
ROOSEVELT AVENUEG/F MCCM Bldg. 311 Roosevelt Avenue San Francisco Del Monte, Quezon City376-5672 | 709-8213
SAMSON ROADG/F Units 3, 4 & 5, Samson Square BuildingSamson Road corner Dagohoy Street, Caloocan City 287-3596 | 287-3597
SAN MIGUELG/F Octagon Building, San Miguel Avenue Ortigas Center, Pasig City637-6165 | 636-3074
SANTOLAN – PASIGG/F AD Center Square, Amang Rodriguez corner Evangelista Street, Santolan, Pasig City632-7394 | 632-7396 | 632-7397
SEDEÑO SALCEDO VILLAGEG/F Unit G-104, 88 Corporate Center 141 Sedeño corner Valero Street, Makati City551-4194 | 550-2262
SHAW BOULEVARDG/F 2019 Pelbel Building I, Shaw Boulevard, Pasig City570-1920 | 631-2210 | 570-2391
SOLERG/F Filamco Building, 1220-1222, Soler corner Masangkay Streets, Binondo, Manila243-0972 | 243-2099 | 243-2086
SUCATUnits B13 & B17, JAKA Plaza Mall Dr. A. Santos Avenue, Parañaque City808-2966 | 808-3279 | 478-7170
TOMAS MORATOJSB Building, Tomas Morato Avenue corner Scout Delgado Street, Quezon City412-7980 | 412-7981
VALENZUELAUnit A, South Supermarket, McArthur Highway Karuhatan, Valenzuela City293-9629 | 294-0562
VISAYAS AVE.G/F M & L Building, Visayas Avenue corner Road 1, Quezon City374-0113 | 374-0112
WEST AVENUEG/F Prosperity West Center Building 92 A West Avenue, Quezon City332-3998 | 332-7954
WHITE PLAINSFrancisco Santos Building, 138 Katipunan Avenue Barangay Saint Ignatius, Quezon City438-7260 | 439-2497 | 439-4633
WILSON ST. GREENHILLSG/F Wilson Corporate Center, Wilson Street Greenhills, San Juan City239-0803 | 358-4843
LUZON BRANCHESANGELESLevel 1, Robinsons Place Angeles, McArthur Highway Balibago, Angeles City, Pampanga(045) 892-8052 | (045) 892-8053
ANTIPOLOUnit 169-A, Robinsons Place Antipolo, Sumulong Highway/Circumference Avenue, Dela Paz, Antipolo City630-4241 | 630-4249
BAGUIOLG/F ECCO Building, 43 Asumption Road corner Gen. Luna Road, Baguio City(074) 443-8313 | (074) 443-8314
BALAGTASG/F 103-1 Balagtas Town Center, McArthur Highway Borol 1st, Balagtas, Bulacan(044) 693-2079 | (044) 693-3741
BALANGAG/F Alyss Commercial Building, Don Manuel Banzon Avenue Doña Francisca, Balanga City, Bataan(047) 237-1097 | (047) 237-1099 | (047) 237-1100
BATANGAS CITYG/F Odeste Building, P. Burgos Brgy. 13, Batangas City, Batangas(043) 723-9972 | (043) 723-5113
CABANATUANG/F Franklin de Guzman Building, Km. 114 Maharlika Highway Zulueta District (Pob.) Cabanatuan City, Nueva Ecija(044) 464-7628 | (044) 464-7877
CAINTAG/F Gusali 888 Building,Ortigas Avenue Extension Cainta, Rizal631-9856 | 655-4727

70 Robinsons Bank Annual Report 2016
CALAMBA*G/F FP Perez Building, National HighwayParian Calamba City, Laguna(049) 536-0398 | (049) 536-0390
CALAPANG/F Space No. LS-008, Xentro Mall, Lumang Bayan Calapan City, Oriental Mindoro(043) 441-0027 | (043) 441-0028
CALASIAOLevel 1-01134, Robinsons Place PangasinanMcArthur Highway, Brgy. San Miguel, Calasiao, Pangasinan(075) 632-0578 | (075) 517-3202
DAGUPANGuanzon Building, Perez Boulevard, Dagupan City(075) 522-7444 | (075) 515-2252
DASMARIÑASLevel 1-01302, Robinsons Place Dasmariñas E. Aguinaldo Highway corner Governor’s Drive Pala-Pala, Dasmariñas, Cavite(046) 852-2217 | (046) 852-2216 | (046) 436-3253
DOLORES – SFDOFranda Building, McArthur HighwayBarrio Dolores, City of San Fernando, Pampanga(045) 435-8652 | (045) 435-9130
GENERAL TRIASLevel 1-155 & 156, Robinsons Place General Trias Mall Antero Soriano, EPZZ-Bacao Diversion Road, Brgy. Tejero General Trias, Cavite(046) 437-2592 | (046) 432-2072
ILOCOS2nd Floor Space No. 212-213, Robinsons Ilocos Norte Valdez Center, Brgy. 1, San Nicolas, Ilocos Norte(077) 781-2595 | (077) 781-2794
IMUSG/F Robinsons Place Imus, Emilio Aguinaldo Highway Imus, Cavite City(046) 875-2331 | (046) 875-2333
LEGAZPI CITYG/F Yuzon Commercial Building, Quezon Avenue Legazpi City, Albay(052) 481-3585 | (052) 481-0802 | (052) 481-3235
LIPAG/F Robinsons Place Lipa, Expansion Wing J.P. Laurel Highway, Mataas na Lupa, Lipa City, Batangas(043) 756-2240 | (043) 312-2057
LUCENAG/F AZDEMARK Building, 11 Quezon Avenue, Lucena City(042) 322-0082 | (042) 322-0083
LUISITA TARLACUnit 102, Robinsons Luisita, McArthur HighwaySan Miguel, Tarlac City(045) 985-2001 | (045) 985-2002
MALOLOSLevel 1-01123, Robinsons Place Malolos, McArthur Highway Barangay Sumapang Matanda, Malolos, Bulacan(044) 796-1636 | (044) 796-1637
MEYCAUAYANG/F EMCCO Building, McArthur Highway corner Malhacan Road, Calvario, Meycauayan City, Bulacan(044) 721-2712 | (044) 721-2713
NAGAG/F Crown Hotel Building, Peña Francia Avenue, Naga City(054) 811-1600 | (054) 881-0786
OLONGAPO BRANCH1370 Rizal Avenue Extension, East Tapinac Olongapo City, Zambales(047) 222-7521 | (047) 222-7522
PALAWANUnit 220-222, 2/F Robinsons Place Palawan Mall Puerto Princesa City, Palawan(048) 433-0054 | (048) 433-0055
SAN FERNANDOLevel 1, Robinsons Starmills, Candaba Gate Olongapo-Gapan Road, San Jose, San Fernando City, Pampanga(045) 636-3586 | (045) 636-3587
SAN PABLOEstrellado Building, M. Paulino Street, San Pablo City, Laguna(049) 562-1043 | (049) 562-0711
SAN PEDROKilometer 31, National Highway Brgy. San Vicente, San Pedro, Laguna520-1869 | 520-1991
SANTIAGOLevel 1-01103, Robinsons Place SantiagoBarangay Mabini, Santiago City, Isabela(078) 323-0243 | (078) 323-0890 | (078) 323-0887
STA. ROSALevel 1, Robinsons Sta. Rosa Market Old National Highway, Bo-Tagapo, Sta. Rosa City, Laguna(049) 837-1693 | (049) 520-8527
STA. ROSA ESTATES 2Sta. Rosa Estates 2, Sta. Rosa, Tagaytay Road Sta. Rosa City, Laguna(049) 544-4482 | (049) 544-4039
STO. TOMAS GF Unit 3, Sierra Makiling Commercial Complex Maharlika Highway, Brgy. San Antonio, Sto. Tomas, Batangas(043) 406-7273 | (043) 406-4275
TAGAYTAYLevel 2-00210, Summit Ridge, General Aguinaldo HighwayNational Road, Brgy. Maharlika, Tagaytay City, Cavite(046) 860-2916 | (046) 860-2917
TAYTAYRed Ribbon Uptown Building, Manila East RoadBarangay San Juan, Taytay, Rizal345-2071 | 345-2061
TUGUEGARAOG/F Lui Building, Bonifacio Street Centro 04 Tuguegarao City, Cagayan Valley(078) 375-0722 | (078) 375-0721 | (078) 396-0896
URDANETAG/F S. Plaza Building, McArthur Highway Poblacion, Urdaneta City, Pangasinan(075) 568-1290 | (075) 568-1292
BRANCH DIRECTORY

71Robinsons Bank Annual Report 2016
BACOOR*Units 1 & 2, Apollo Mart Bldg., #369 Gen. Aguinaldo HighwayTalaba 4, Bacoor, Cavite (046) 416-1478 | (046) 416-6145 | (046) 416-1549
BALAYAN*G/F Stalls 2, 3 & 4, Balayan Public MarketPlaza Mabini Street, Balayan, Batangas (043) 774-7660 | (043) 774-7664 | (043) 774-7662
VISAYAS BRANCHESANTIQUELevel 1-116, 117 & 118, Robinsons Place AntiqueBrgy. Maybato, San Jose de Buenavista, Antique(036) 641-0022 | (036) 641-0021 | (036) 641-0023
BACOLODSpace No. 2 Central City Walk, Robinsons Place BacolodBrgy. Mandalagan, Bacolod City, Negros Occidental(034) 441-2372 | (034) 441-2494
BAISStall No. 1, Bais Commercial Center, Marina Building,Aguinaldo St., National Highway, Bais City, Negros Oriental(035) 402-3026 | (035) 402-3028
BAYAWAN Shop 3, Bollos Street corner National HighwayBrgy. Poblacion, Bayawan City, Negros Oriental(035) 522-8415 | (035) 522-8416 | (035) 522-8417
CEBU, GARCIA – LLORENTE**G/F Robinsons Cybergate, Don Gil Garcia cornerJ. Llorente St., Capitol Site, Cebu City(032) 236-0271 | (032) 238-6304
CEBU GALLERIAB1 Robinsons Galleria Cebu, Gen. Maxilom Extension North Reclamation Area, Cebu City(032) 231-4942 | (032) 231-4944 | (032) 231-4946
CEBU MANDAUEG/F Catiaoking Bldg., North Road, Tabok Mandaue City, Cebu(032) 346-6452 | (032) 346-6970
CEBU OSMEÑA2nd Level, Robinsons Place Cebu Fuente Osmeña Avenue, Cebu City(032) 253-1370 | (032) 253-8857
DUMAGUETEStall AF 25-27, Robinsons Dumaguete Dumaguete South Road corner Perdices Street, Dumaguete City(035) 421-1748 | (035) 421-0740
ILOILOUnit 189-190, G/F Robinsons Place Iloilo corner Mabini-Del Leon Street, Iloilo City, Iloilo(033) 336-9625 | (033) 336-9637
JAROLevel 1 Unit G. 17B, Robinsons Place JaroE. Lopez St., Brgy. San Vicente, Iloilo(033) 320-2705 | (033) 320-2701 | (033) 320-2704
KABANKALANG/F NZ Business Center (NZBC) Building, JY Perez HighwayKabankalan City, Negros Occidental(034) 471-0052 | (034) 471-0053
PASSIG/F Unit G5-G6, Gaisano Capital Passi, Simeon Aguilar Street, Passi, Iloilo(033) 536-7041 | (033) 536-7042
ROXASLevel 1-1133B, Robinsons Place Roxas, Pueblo de Panay Barangay Lawa-an, Roxas City, Capiz(036) 651-0023 | (036) 651-0144 | (036) 651-0188
TACLOBANLevel 1-00103 Robinsons Place Tacloban National Highway Tabuan, Marasbaras, Tacloban City, Leyte(053) 327-5881 | (053) 327-5880 | (053) 327-5884
TAGBILARANG/F Castelcelo Building 1, C. Gallares Street corner J. S. Torralba Street, Poblacion II, Tagbilaran City, Bohol(038) 411-1267 | (038) 411-1268 | (038) 411-1269
MINDAnao branchesBUTUANLevel 1-01160, Robinsons Place Butuan Km. 3 J.C Aquino Avenue, Brgy Libertad, Butuan City(085) 342-5415 | (085) 342-6858
CAGAYAN DE OROLevel 1, Robinsons Supercenter, Rosario Street Lim Ket Kai Drive, Lapasan, Cagayan De Oro City(088) 857-4168
CDO – DIVISORIAG/F Palaez Commercial Arcade 1 corner Tiano Bros. & Cruz Taal Streets Divisoria, Cagayan De Oro City(088) 323-4261 | (088) 323-4262 | (088) 323-4263
DAVAODoor 1 & 2, Edward V. A. Lim BuildingSta. Ana Ave, Davao City(082) 227-8054 | (082) 226-3565
DAVAO CYBERGATELevel 1 Unit 109, Robinsons Cybergate Davao J.P Laurel Ave, Davao City(082) 305-4990 | (082) 305-3875
DAVAO MONTEVERDE*HAW Building, T. Monteverde Avenue, Davao City(082) 225-0553 | (082) 297-6137 | (082) 225-0538
GENERAL SANTOSG/F Robinsons Place, Natividad Street corner J. Catolico Avenue, General Santos City(083) 301-3579 | (083) 301-8623
OZAMISG/F Ozamis Insular Life Building, Don Anselmo Bernard Avenue corner Angel Medina Ave. Ozamiz CityMisamis Occidental(088) 564-0549 | (088) 564-0551
TAGUM Level 1 Unit 167, Robinsons Place TagumNational Highway, Brgy. Visayan Village, TagumDavao del Norte(084) 218-8030 | (084) 218-8031 | (084) 218-8028

72 Robinsons Bank Annual Report 2016
TABLE OF ORGANIZATION
Related Party Transactions Committee
CorporateGovernance Committee
Compliance Group
Risk ManagementCommittee
IT Steering Committee
Security Department
Lending Segment
Account Management
Group 1
Account Management
Group 2
Account Management
Group 3
Account Management
Group 4
Consumer Finance Group
Community Banking Group
Credit Group
Remedial Management
and Credit Policy Group
Retail Banking Group
Cards Business
Group
**Chief Compliance Officer, Chief Risk Officer, Chief IT Officer, Human Resource Management Group Head, and Chief Security Officer have oversight functions in Legazpi Savings Bank
Enterprise Risk Management
Group
Business Development Segment
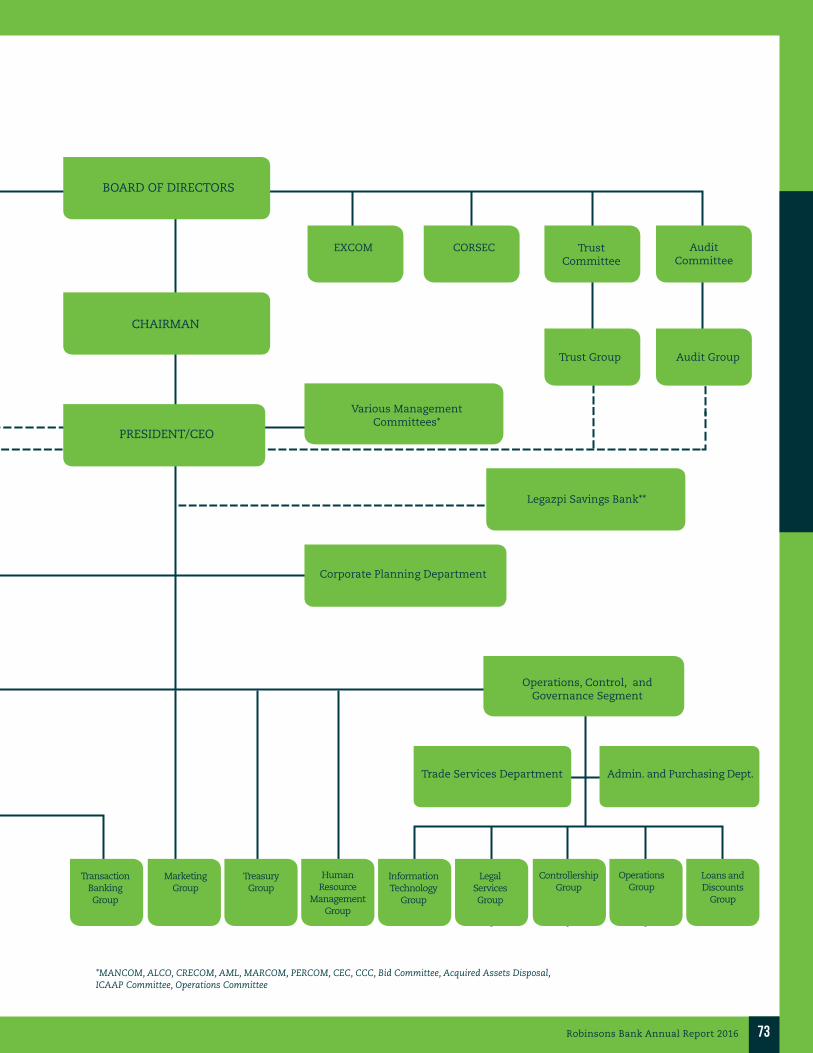
73Robinsons Bank Annual Report 2016
PRESIDENT/CEO
CHAIRMAN
BOARD OF DIRECTORS
EXCOM CORSEC TrustCommittee
Trust Group
Various Management Committees*
Corporate Planning Department
Legazpi Savings Bank**
Operations, Control, and Governance Segment
Transaction Banking Group
MarketingGroup
Treasury Group
Human Resource
Management Group
Information Technology
Group
Trade Services Department Admin. and Purchasing Dept.
Legal Services Group
Controllership Group
Operations Group
Loans and Discounts
Group
Audit Committee
Audit Group
*MANCOM, ALCO, CRECOM, AML, MARCOM, PERCOM, CEC, CCC, Bid Committee, Acquired Assets Disposal, ICAAP Committee, Operations Committee
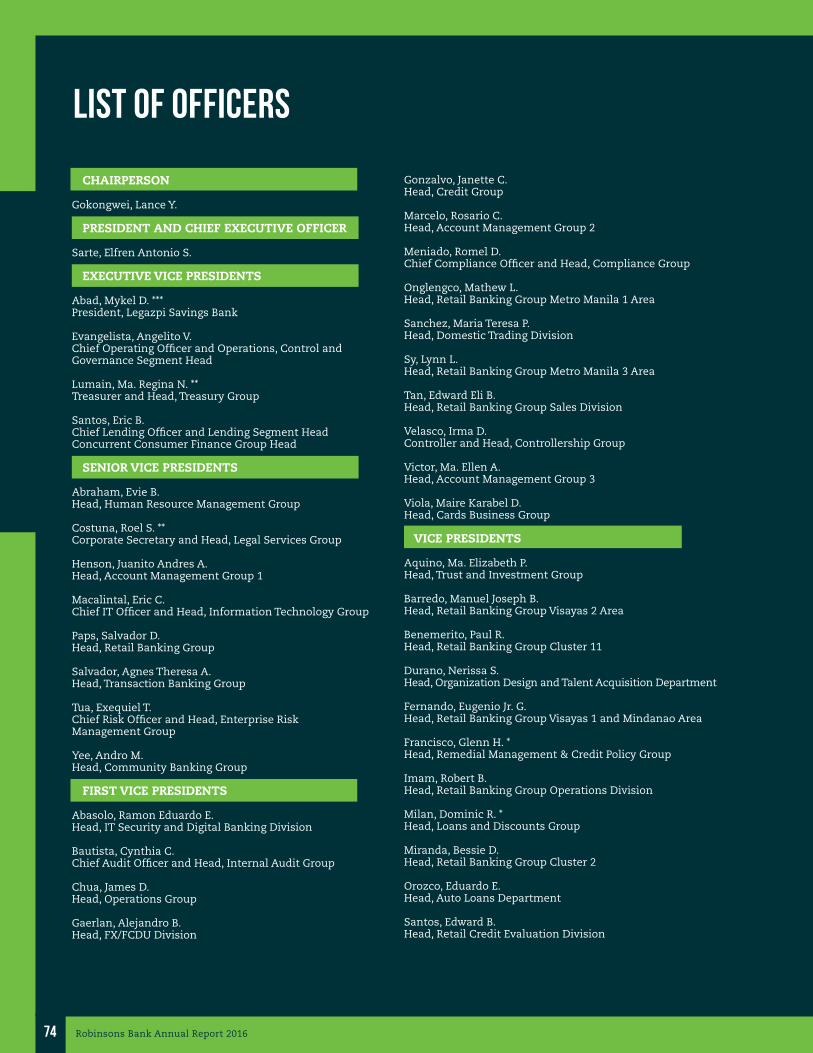
74 Robinsons Bank Annual Report 2016
Gonzalvo, Janette C.Head, Credit Group
Marcelo, Rosario C.Head, Account Management Group 2
Meniado, Romel D. Chief Compliance Officer and Head, Compliance Group
Onglengco, Mathew L.Head, Retail Banking Group Metro Manila 1 Area
Sanchez, Maria Teresa P.Head, Domestic Trading Division
Sy, Lynn L.Head, Retail Banking Group Metro Manila 3 Area
Tan, Edward Eli B.Head, Retail Banking Group Sales Division
Velasco, Irma D.Controller and Head, Controllership Group
Victor, Ma. Ellen A. Head, Account Management Group 3 Viola, Maire Karabel D.Head, Cards Business Group
VICE PRESIDENTS
Aquino, Ma. Elizabeth P.Head, Trust and Investment Group Barredo, Manuel Joseph B.Head, Retail Banking Group Visayas 2 Area
Benemerito, Paul R.Head, Retail Banking Group Cluster 11 Durano, Nerissa S.Head, Organization Design and Talent Acquisition Department Fernando, Eugenio Jr. G.Head, Retail Banking Group Visayas 1 and Mindanao Area Francisco, Glenn H. *Head, Remedial Management & Credit Policy Group Imam, Robert B.Head, Retail Banking Group Operations Division
Milan, Dominic R. *Head, Loans and Discounts Group Miranda, Bessie D.Head, Retail Banking Group Cluster 2
Orozco, Eduardo E.Head, Auto Loans Department
Santos, Edward B.Head, Retail Credit Evaluation Division
CHAIRPERSON
Gokongwei, Lance Y.
PRESIDENT AND CHIEF EXECUTIVE OFFICER
Sarte, Elfren Antonio S.
EXECUTIVE VICE PRESIDENTS Abad, Mykel D. ***President, Legazpi Savings Bank Evangelista, Angelito V.Chief Operating Officer and Operations, Control and Governance Segment Head
Lumain, Ma. Regina N. **Treasurer and Head, Treasury Group
Santos, Eric B.Chief Lending Officer and Lending Segment Head Concurrent Consumer Finance Group Head
SENIOR VICE PRESIDENTS
Abraham, Evie B.Head, Human Resource Management Group Costuna, Roel S. **Corporate Secretary and Head, Legal Services Group
Henson, Juanito Andres A.Head, Account Management Group 1
Macalintal, Eric C.Chief IT Officer and Head, Information Technology Group
Paps, Salvador D.Head, Retail Banking Group Salvador, Agnes Theresa A.Head, Transaction Banking Group
Tua, Exequiel T.Chief Risk Officer and Head, Enterprise Risk Management Group
Yee, Andro M.Head, Community Banking Group
FIRST VICE PRESIDENTS
Abasolo, Ramon Eduardo E.Head, IT Security and Digital Banking Division
Bautista, Cynthia C.Chief Audit Officer and Head, Internal Audit Group Chua, James D.Head, Operations Group Gaerlan, Alejandro B.Head, FX/FCDU Division
LIST OF OFFICERS

75Robinsons Bank Annual Report 2016
Santos, Pia Marie M.Head, Home Loans Division
Tengco, Sareena R.Head, Retail Banking Group Metro Manila 2 Area
Yap, Jean J.Head, Retail Banking Group Cluster 1
ASSISTANT VICE PRESIDENTS
Abando, Conrado Jr. M. **Head, Retail Banking Group Business Center- Magnolia
Acosta, G. Fulton V.Head, Remedial and Special Asset Management Department
Almario, Rey Noel V.Head, Account Management Group 4
Arcigal, Joven S.Head, Dealer Channel Team Bañares, John I.Head, Head Office Audit Department Casaul, Allan H.Head, Collection & Asset Recovery Department Chan, Kelly T. *Senior Account Officer, Account Management Group 3 Ching, Engelbert C.Head, Retail Banking Group Cluster 5
Confesor, Luis Miguel R. *Officer, Merchant Acquiring and Management Cortez, Adeline C. **Head, Documentation and Opinion Department and Assistant Corporate Secretary Cruz, Reynaldo Jr. S.Head, Cash Management Services Division
Datoc, Agnellus Raymund Jay R.Head, Consumer Credit Evaluation Division De Torres, Dexter P. **Head, Network and Infrastructure Department Escueta, Dale Daniel C.Head, Cards Marketing & Portfolio Management Department Estrellado, Cherre S.Head, SBL, PLP, mSME Department Figueroa, Maria Alicia P.Head, Payments and E-Channels Division Gabriel, Maria Encarnacion T. Account Officer
Go, Rhory F.Head, Corporate Planning Department
Infante, Reynante R.Head, FX Trading Department (Peso/FCDU)
Inocando, Ursula F. **Head, Retail Banking Group Business Center- San Miguel Laxa, Miriam Ruby B.Head, Branches Channel Team Masangkay, Vincent V. **Head, IT Security Department Mendez, Mary Joy C.Head, Trust Marketing Department Mendoza, Jason B.Head, Credit Investigation and Appraisal Department
Mendoza, Virgilio D.Head, Total Rewards and HR Services Department Monje, Martha Melody D.Head, Specialized Application Support Department Montalbo, Ruth P.Head, Retail Banking Group Cluster 7
Monterona, Herminigildo Jr. R.Head, Retail Banking Group Business Center- Gil Puyat
Ong, Marites P.Head, Trade Services Department Pangilinan, Leopoldo M.Head, Technical Support and Service Delivery Department
Platero, Rosalie E.Head, Branch / Direct Channel Department
Posadas, Michael Lawrence S. **Head, Retail Banking Group Cluster 3
Quinto, Rodolfo T.Chief Security Officer Ramos, Antonina B. **Head, Microfinance Department
Reyes, Odette G.Head, Market & Liquidity Risks Department
Rosanes, Annallette M.Head, Documentation Department Villareal, Kareen R. ***Chief Compliance Officer - Legazpi Savings Bank Yabut, Galo P. Head, Dealership Peso Fixed Income Department
Yu, Jocelyn S.Head, Cards Operations Department
Zoleta, Ma. Bernadette B. *Head, Cards Customer Experience Management
*New Hire 2017**Promoted 2017 ***Seconded

76 Robinsons Bank Annual Report 2016
MA. ELIZABETH P.AQUINO VP & HEAD
CYNTHIA C.BAUTISTAFVP & CHIEF AUDIT OFFICER
ROMEL D.MENIADOFVP & CHIEF COMPLIANCEOFFICER
INTERNAL AUDIT GROUP
COMPLIANCEGROUP
TRUST ANDINVESTMENTS GROUP
EXEQUIEL T. TUA SVP & CHIEF RISK OFFICER
ENTERPRISE Risk MANAGEMENT GROUP
COMMITTEEs REPORTING TO THE BOARD

77Robinsons Bank Annual Report 2016
ROSARIO C. MARCELO FVP & HEAD
JUANITO ANDRES A. HENSON SVP & HEAD
ma. ELLEN A. VICTOR FVP & HEAD
ANDRO M. YEE svp & head
REY NOEL V. ALMARIO AVP & HEAD
COMMUNITY BANKING GROUP
ACCOUNTMANAGEMENTGROUP 3
ACCOUNTMANAGEMENTGROUP 1
ACCOUNTMANAGEMENTGROUP 2
ACCOUNTMANAGEMENTGROUP 4
LENDING SEGMENT

78 Robinsons Bank Annual Report 2016
antonina B. ramos AVP & head
cherre s. estrellado AVP & head
auto loans department
SBL, PLP, MSMEdepartment
microfinancedepartment
PIA MARIE M. SANTOS VP & HEAD
HOME LOANSDIVISION
LENDING SEGMENT
EDUARDO E. OROZCO VP & HEAD

79Robinsons Bank Annual Report 2016
SALVADOR D. PAPS SVP & HEAD
MAIRE KARABEL D. VIOLA fvp & head
AGNES THERESA A. SALVADOR SVP & HEAD
RETAIL BANKING GROUP
CARDs BUSINESS GROUP
TRANSACTION BANKING GROUP
treasury group domestictrading
MAria TERESA p. SANCHEZfvp & head
treasury group fx/fcdu
alejandro B. gaerlan fvp & head
treasury
BUSINESS DEVELOPMENT SEGMENT

80 Robinsons Bank Annual Report 2016
retail banking group
LYNN L. SY FVP & area HEAD
metro manila 3 & southern luzon
EDWARD ELI B. TAN fvp & head
sales division
ROBERT B. IMAM vp & head
OPERATIONS DIVISION
SAREENA R. TENGCO VP & AREA HEAD
MATHEW L. ONGLENGCO FVP & area HEAD
metro manila 1 & north luzon
visayas 2
metro manila 2
MANUEL JOSEPH B. BARREDO VP & area head
visayas 1 & mindanao
EUGENIO G. FERNANDO, JR vp & area head

81Robinsons Bank Annual Report 2016
operations, control, and governance
evie b.abraham svp & HEAD
ATTY. ROEL S.COSTUNA SVP & HEADCORPORATE SECRETARY
ERIC C. MACALINTAL SVP & CHIEF IT OFFICER
IRMA D.VELASCOFVP & CONTROLLER
JAMES D.CHUAFVP & HEAD
ramon eduardo e. abasolo FVP & head
controllership GROUP
legal services group
human resource mANAGEMENT group
INFORMATION TECHNOLOGY GROUP
it security & digital banking division
OPERATIONS GROUP

82 Robinsons Bank Annual Report 2016
GLENN H. FRANCISCO VP & HEAD
DOMINIC R. MILAN VP & HEAD
MARITES P. ONG AVP & HEAD
col. rodolfo t.quintoAVP & HEAD
RHORY F.GOAVP & HEAD
TRADE SERVICESDEPARTMENT
REMEDIAL MANAGEMENT & CREDIT POLICY GROUP
LOANS AND DISCOUNTs GROUP
SECURITYDEPARTMENT
JANETTE C. GONZALVO FVP & HEAD
CREDITGROUP
CORPORATE PLANNINGDEPARTMENT
operations, control, and governance

Investing in human capital continues to be one of Robinsons Bank’s strategic priorities. The Bank’s capacity building exercise bore fruit as the collective efforts of the Bank’s more than 1,600 human resources helped realize the second phase of the Bank’s five-year initiative Roadmap 2020 – Core Income Growth. The success of this initiative relies relatively on the Bank’s capacity to retain, engage, develop, and attract employees with the skills and experience to help the Bank conquer challenges and optimize opportunities.
This section provides transparency on the Bank’s employee programs and how the Bank translates its strategic priorities into action. This report displays the Bank’s accomplishments in 2016 in talent acquisition and development; succession planning; compensation and benefits; and corporate social responsibility.
TALENT ACQUISITION AND DEVELOPMENT
In 2016, Robinsons Bank continued attracting talents with 13 Senior Officers and 33 Business Center Heads joining the Bank. These critical positions were part of the 517 hired talents, meeting almost 90% of the planned manpower.
The Bank encouraged open discourse and timely feedback between the subordinates and the superior by providing avenues for monthly meetings; where updates, concerns, and upcoming projects are discussed. These helped in gauging yearly performance appraisals, which are supported by Key Result Areas (KRAs) and are tracked through Balanced Scorecards. Aside from administering performance-based assessments, Robinsons Bank was gearing towards cultivating a competency-based culture that would develop and utilize employee competencies to efficiently meet the Bank’s needs. The Bank conducted a series of competency-based system workshops wherein 168 technical competencies were identified.
In addition, the Bank recognized the need for employee development and support programs. Training programs were deployed by the Organization and People Development Department (OPD) to motivate and equip employees with the proper knowledge, skills, and attitude.
OPD conducted the Junior Management Training Program (JMTP) and Officers Development Program (ODP) to cultivate future Bank leaders. JMTP, jumpstarts the careers of outstanding and honor graduates from prominent schools, wherein the trainees are exposed to all facets of banking over a span of one year. Seven trainees graduated from JMTP and were assigned in the business units they excelled in.
On the other hand, the Officers Development Program (ODP) is a fast-track four-month training program available for staff and supervisors to equip them with management and leadership skills. 19 officers graduated from this program and were promoted to Junior Officer rank.
For the year 2016, OPD facilitated a total of 25 internal and 63 external training programs attended by 1,713 RBankers and 114 RBankers respectively. In addition, two e-learning programs had been successfully rolled out: Information Security Awareness and Anti-Money Laundering Act. A total of 1,543 RBankers benefitted from these modules.
The Bank utilized employee retention strategies spanning from a wide range of health, wellness, communications, community development, and employee loan programs to cater to RBankers’ various needs and to promote a healthy work-life balance. The Bank set-up a clinic with a resident nurse who organized health and wellness activities, aside from ensuring immediate health-related assistance to employees.
Total Number of Training Hours
EO 14,091RBG 18,649Total 32,739
Internal 31,343External 1,343Total 32,739
SUSTAINING HUMAN CAPITAL GROWTH
83Robinsons Bank Annual Report 2016

Total Number of Trained Employees per Rank
Rank and File Junior Officer Senior Officer
877 405 72
Total
1354
SUCCESSION PLANNINGThe Bank’s management developed tools to continually hone and retain potential leaders,
and prepare for inevitable management changes. Advancement planning addresses structural and leadership vulnerabilities with a framework that begins with identifying executive level susceptibilities and middle management critical positions that may affect business performance and may have an impact on operations when left vacant.
The leaders of Robinsons Bank are tapped and engaged by HR in the process. The Group Heads and Segment Heads assess their talents and discussed developmental plans with HR in preparing the talents for future leadership roles. Aside from ensuring the sufficiency of talent pool to continue the leadership, advancement planning also addresses opportunities for growth, competency gaps, and proactive strategies to strengthen the Bank’s leadership structure.
The familial culture, pay-for-performance environment, and career opportunities are some of the compelling factors for an RBanker to invest long years in the institution until retirement. The leaders who have dedicatedly served the institution brought with them extensive experience, wisdom, and management styles. Advancement planning is also a strategic move to fill-in future vacancy due to retirement. It aims to smoothen the transfer of knowledge and skills to a targeted internal successor. In 2016, the advance planning exercise identified 99 successors from 65 in 2015.
COMPENSATION AND BENEFITSThe Robinsons Bank’s employee compensation structure was designed to be at par with the current banking
industry rates. Its policy is to pay for performance or meritocracy, highlighted by a competitive salary scale, profit sharing and annual merit increase hinged on employee performance and attainment of the Bank’s key result indicators. The Bank had revised its car plan and housing loan programs by improving maximum loan amount and reducing interest rates. Employees are guaranteed with an annual compensation equivalent to 15 months, inclusive of 13th month pay, mid-year, and Christmas bonuses.
On top of regular compensation, variable incentive pay is provided to Business Center Heads and Account Officers to motivate and reward exemplary performance. The variable compensation scheme is based on achievement of defined categories and given to employees based on their contributions to the Bank’s objectives.
Remuneration of Senior Management Personnel (in PHP)
Parent Subsidiary Consolidated
2016 68,537,095 24,308,768 92,845,863
2015 57,538,763 24,440,723 81,979,486
84 Robinsons Bank Annual Report 2016
SUSTAINING HUMAN CAPITAL GROWTH

In honoring Robinsons Bank’s mission to be a responsive organization to the community, the Bank focused its 2016 Corporate Social Responsibility (CSR) initiative “Robinsons Bank Gives” to giving and reaching out to its social partners and protecting the environment.
Almost 300 RBankers nationwide volunteered in the different CSR programs of the Bank. They were grouped according to areas and were tasked with activities depending on the assigned color and corresponding theme. Red group was tasked with promoting awareness and value for good health, Blue group was tasked with concern for the global community and lastly, the Green group was tasked with protecting the environment.
SHAPING BETTER COMMUNITIES
85Robinsons Bank Annual Report 2016
CORPORATE SOCIAL RESPONSIBILITY

CONCERN FOR THE GLOBAL COMMUNITYThe Blue group undertook educational and
community services as a way for showing concern to the global community. Head Office and branch personnel from Metro Manila Clusters 1, 2, and 6 read to pupils of Camarilla Public Elementary School, Quezon City. Likewise, the group served food and donated loot bags containing snacks, school supplies, hygiene kit, and books to more than 50 children.
To instill the importance of education and values to school children, volunteers from Head Office, Metro Manila 1, Metro Manila 2, and Metro Manila 6 organized a reading and feeding program to Grade 3 and 4 pupils from Camarilla Public Elementary School in Quezon City.
RBankers from Santiago, Ilocos Norte, and Tuguegarao branches distributed relief goods to the residents of Brgy. Lario Alto, Tuguegarao.
Camarilla Elementary School Principal Rodelio R. Olonan with HR Head Evie B. Abraham
“It is great relief that we will no longer borrow speakers and microphone from our Barangay every time we conduct a program. Thank you RBankers. Thank you for giving us your time and love,” Principal Rodelio R. Olonan said.
Another group of RBankers from Ilocos Norte, Santiago, and Tuguegarao distributed relief goods to the typhoon struck residents of Brgy. Lario Alto, Tuguegarao.
86 Robinsons Bank Annual Report 2016

87Robinsons Bank Annual Report 2016
PROTECTING THE ENVIRONMENT The Green group had three tree planting
activities that took place in different locations. Fifty-six employees from the North and Central Luzon Clusters planted 100 seedlings of macopa, mahogany, mango, chico, and other fruit trees in the Clark Air Base. The volunteers also gladly shared their lunch with the Aeta children in the area.
Embracing the strong commitment to protect Mother Earth, North and Central Luzon Clusters planted trees in Clark Air Base Pampanga last November 2016.
Employees from Kabankalan Branch planted different seedlings at Magaso Falls, Sitio Magaso, Brgy. Oringao, Kabankalan City.
Robinsons Bank West VisMin Cluster called their tree planting activity “Green Legacy”. The tree planting was held at Brgy. Bongol Suage River, Janiuay, Iloilo.
Kabankalan Branch along with the Barangay scholars and officials of Sitio Magaso planted 100 different seedlings at Magaso Falls.
Another group of employees from the Western Visayas and Mindanao (VisMin) Cluster left a “Green Legacy” in Brgy. Bongol Suage River in Iloilo.

88 Robinsons Bank Annual Report 2016
Head Office employees donated blood through the Blood Letting Activity of the JG Summit in cooperation with the Philippine Red Cross.
Eastern VisMin Area, through Cebu Branch visited Casa sa Gugma in Cabantan Street, Mabolo Cebu for a feeding program and distribution of supplies.
AWARENESS AND VALUE FOR GOOD HEALTHTo increase the employee awareness for good
health, various activities were conducted by the Red group. Some personnel from Head Office donated blood through a bloodletting activity in partnership with the Philippine Red Cross.
The South Area had a feeding program at St. Rita Orphanage in Sucat, Parañaque.
Cebu Branch personnel shared a warm afternoon with the Casa sa Gugma senior residents. They brought food and supplies.
Aside from singing and dancing, the best part of the activity was the warm hugs they shared with the residents of Casa sa Gugma.
The Central Luzon Cluster visited the little angels of Hospicio de San Jose in San Miguel, Metro Manila and Tahanang Mapagkalinga.
CORPORATE SOCIAL RESPONSIBILITY

89Robinsons Bank Annual Report 2016
The management of Robinsons Bank Corporation is responsible for the preparation and fair presentation of the financial statements including the schedules attached therein, for the year ended December 31, 2016, in accordance with the prescribed financial reporting framework indicated therein, and for such internal control as management determines is necessary to enable the preparation of financial statements that are free from material misstatement, whether due to fraud or error.
In preparing the financial statements, management is responsible for assessing the Company’s ability to contribute as a going concern, disclosing, as applicable matters related to going concern and using the going concern basis of accounting unless management either intends to liquidate the Company or to cease operations, or has no realistic alternative but to do so.
The Board of Directors is responsible for overseeing the Company’s financial reporting process.
The Board of Directors reviews and approves the financial statements including the schedules attached therein, and submits the same to the stockholders or members.
SyCip Gorres Velayo & Co, the independent auditor appointed by the stockholders, has audited the financial statements of the company in accordance with Philippine Standards on Auditing, and in its report to the stockholders or members, has expressed its opinion on the fairness of presentation upon completion of such audit.
Lance Y. GokongweiChairman of the Board
Elfren Antonio S. SartePresident and Chief Executive Officer
Angelito V. EvangelistaExecutive Vice-President and Chief Operating Officer
STATEMENT OF MANAGEMENT’S RESPONSIBILITY

90 Robinsons Bank Annual Report 2016
The Board of Directors and Stockholders Robinsons Bank Corporation
Report on the Consolidated and Parent Company Financial Statements
Opinion
We have audited the consolidated financial statements of Robinsons Bank Corporation and its subsidiary (the Group) and the Parent Company financial statements of Robinsons Bank Corporation, which comprise the consolidated and parent company statements of financial position as at December 31, 2016 and 2015, and the consolidated and parent company statements of income, consolidated and parent company statements of comprehensive income, consolidated and parent company statements of changes in equity and consolidated and parent company statements of cash flows for the years then ended, and notes to the consolidated and parent company financial statements, including a summary of significant accounting policies.
In our opinion, the accompanying consolidated and parent company financial statements present fairly, in all material respects, the financial position of the Group and the Parent Company as at December 31, 2016 and 2015, and their financial performance and their cash flows for the years then ended in accordance with Philippine Financial Reporting Standards (PFRSs).
Basis for Opinion
We conducted our audits in accordance with Philippine Standards on Auditing (PSAs). Our responsibilities under those standards are further described in the Auditor’s Responsibilities for the Audit of the Consolidated and Parent Company Financial Statements section of our report. We are independent of the Group in accordance with the Code of Ethics for Professional Accountants in the Philippines
(Code of Ethics) together with the ethical requirements that are relevant to our audit of the consolidated financial statements in the Philippines, and we have fulfilled our other ethical responsibilities in accordance with these requirements and the Code of Ethics. We believe that the audit evidence we have obtained is sufficient and appropriate to provide a basis for our opinion.
Responsibilities of Management and Those Charged with Governance for the Consolidated and Parent Company Financial Statements
Management is responsible for the preparation and fair presentation of the consolidated and parent company financial statements in accordance with PFRSs, and for such internal control as management determines is necessary to enable the preparation of consolidated and parent company financial statements that are free from material misstatement, whether due to fraud or error.
In preparing the consolidated and parent company financial statements, management is responsible for assessing the Group’s and the Parent Company’s ability to continue as a going concern, disclosing, as applicable, matters related to going concern and using the going concern basis of accounting unless management either intends to liquidate the Group and the Parent Company or to cease operations, or has no realistic alternative but to do so.
INDEPENDENT AUDITOR’S REPORT

91Robinsons Bank Annual Report 2016
Those charged with governance are responsible for overseeing the Group’s and the Parent Company’s financial reporting process.
Auditor’s Responsibilities for the Audit of the Consolidated and Parent Company Financial Statements
Our objectives are to obtain reasonable assurance about whether the consolidated and parent company financial statements as a whole are free from material misstatement, whether due to fraud or error, and to issue an auditor’s report that includes our opinion. Reasonable assurance is a high level of assurance, but is not a guarantee that an audit conducted in accordance with PSAs will always detect a material misstatement when it exists. Misstatements can arise from fraud or error and are considered material if, individually or in the aggregate, they could reasonably be expected to influence the economic decisions of users taken on the basis of these consolidated and parent company financial statements.
As part of an audit in accordance with PSAs, we exercise professional judgment and maintain professional skepticism throughout the audit. We also:
Identify and assess the risks of material misstatement of the consolidated and parent company financial statements, whether due to fraud or error, design and perform audit procedures responsive to those risks, and obtain audit evidence that is sufficient and appropriate to provide a basis for our opinion. The risk of not detecting a material misstatement resulting from fraud is higher than for one resulting from error, as fraud may involve collusion, forgery, intentional omissions, misrepresentations, or the override of internal control.
Obtain an understanding of internal control relevant to the audit in order to design audit procedures that are appropriate in the circumstances, but not for the purpose of expressing an opinion on the effectiveness of the Group’s and the Parent Company internal control.
Evaluate the appropriateness of accounting policies used and the reasonableness of accounting estimates and related disclosures made by management.
Conclude on the appropriateness of management’s use of the going concern basis of accounting and, based on the audit evidence obtained, whether a material uncertainty exists related to events or conditions that may cast significant doubt on the Group’s and the Parent Company’s ability to continue as a going concern. If we conclude that a material uncertainty exists, we are required to draw attention in our auditor’s report to the related disclosures in the consolidated and parent company financial statements or, if such disclosures are inadequate, to modify our opinion. Our conclusions are based on the audit evidence obtained up to the date of our auditor’s report. However, future events or conditions may cause the Group and the Parent Company to cease to continue as a going concern.
Evaluate the overall presentation, structure and content of the consolidated and parent company financial statements, including the disclosures, and whether the consolidated and parent company financial statements represent the underlying transactions and events in a manner that achieves fair presentation.
Obtain sufficient appropriate audit evidence regarding the financial information of the entities or business activities within the Group to express an opinion on the consolidated financial statements. We are responsible for the direction, supervision and performance of the audit. We remain solely responsible for our audit opinion.

92 Robinsons Bank Annual Report 2016
We communicate with those charged with governance regarding, among other matters, the planned scope and timing of the audit and significant audit findings, including any significant deficiencies in internal control that we identify during our audit.
Report on the Supplementary Information Required Under Revenue Regulations 15-2010
Our audits were conducted for the purpose of forming an opinion on the basic financial statements taken as a whole. The supplementary information required under Revenue Regulations 15-2010 in Note 31 to the financial statements is presented for purposes of filing with the Bureau of Internal Revenue and is not a required part of the basic financial statements. Such information is the responsibility of the management of Robinsons Bank Corporation. The information has been subjected to the auditing procedures applied in our audit of the basic financial statements. In our opinion, the information is fairly stated, in all material respects, in relation to the basic financial statements taken as a whole.
SYCIP GORRES VELAYO & CO.
Aris C. MalanticPartnerCPA Certificate No. 90190SEC Accreditation No. 0326-AR-3 (Group A),
May 1, 2015, valid until April 30, 2018Tax Identification No. 152-884-691BIR Accreditation No. 08-001998-54-2015,
February 27, 2015, valid until February 26, 2018 PTR No. 5908720, January 3, 2017, Makati City
March 22, 2017
INDEPENDENT AUDITOR’S REPORT

93Robinsons Bank Annual Report 2016
Consolidated Parent CompanyDecember 31, 2016 December 31, 2015 December 31, 2016 December 31, 2015 January 1, 2015
(As Restated-Notes 2)
ASSETSCash and Other Cash Items 1,684,403,861 1,702,287,136 1,653,720,370 1,665,564,278 1,501,127,113Due from Bangko Sentral ng Pilipinas (Note 15) 13,415,517,416 9,922,250,327 12,722,258,187 9,189,740,992 8,805,204,359Due from Other Banks 4,090,364,784 4,689,841,387 3,995,280,423 4,596,213,199 1,509,908,716Interbank Loans Receivable/Securities
Purchased Under ResaleAgreements (Notes 6 and 28) 677,831,467 97,000,000 589,077,515 97,000,000 598,000,000
Financial Assets at Fair ValueThrough Profit or Loss (Note 7) 2,555,185 5,132,724 2,555,185 5,132,724 1,305,791,077
Available-for-Sale Investments (Notes 7 and 25) 11,743,930,219 8,201,125,329 11,774,130,219 8,230,125,329 7,746,407,389Held-to-Maturity Investment (Note 7) 3,549,900,604 2,749,295,603 3,334,528,051 2,749,295,603 1,768,603,469Loans and Receivables (Note 8) 38,897,081,887 27,568,842,486 37,969,349,408 26,686,102,326 21,695,776,380Investment in a Subsidiary (Note 9) - - 1,204,884,010 782,647,853 811,791,275Property and Equipment (Note 10) 513,030,557 470,526,900 451,969,911 414,549,520 437,846,674Investment Properties (Note 11) 285,433,340 180,790,929 129,916,432 94,168,563 93,093,679Branch Licenses (Note 12) 997,450,182 952,850,182 376,850,182 332,850,182 331,850,182Goodwill (Note 9) 244,327,006 244,327,006 - - -Deferred Tax Asset - Net (Note 23) 53,435,098 3,325,050 194,482,918 142,537,278 128,708,199Other Assets (Note 13) 1,456,629,880 871,682,978 1,439,012,183 852,332,706 586,763,651
77,611,891,486 57,659,278,037 75,838,014,994 55,838,260,553 47,320,872,163
LIABILITIES AND EQUITYLiabilitiesDeposit Liabilities (Notes 15 and 24)Demand 12,428,636,410 9,982,449,774 12,286,356,800 9,822,670,598 8,960,550,167Savings 37,970,501,792 21,933,799,995 36,800,315,109 20,755,278,771 22,006,003,584Time 12,895,961,824 11,751,509,324 12,456,975,222 11,297,180,630 8,456,107,023
63,295,100,026 43,667,759,093 61,543,647,131 41,875,129,999 39,422,660,774Manager’s Checks 404,180,308 289,136,769 404,180,308 289,136,769 278,420,426Accrued Expenses (Note 17) 420,399,662 442,753,879 412,576,968 433,591,258 432,130,587Other Liabilities (Note 17) 1,523,995,301 1,270,590,982 1,509,394,398 1,251,365,213 1,421,762,838
65,643,675,297 45,670,240,723 63,869,798,805 43,849,223,239 41,554,974,625EquityCommon stock (Note 19) 12,000,000,000 436,835,000 12,000,000,000 436,835,000 436,835,000Deposit for stock subscription (Note 19) - 5,900,000,000 - 5,900,000,000 5,202,462,740Preferred stock (Note 19) - 5,663,165,000 - 5,663,165,000 -Surplus 816,363,435 573,408,796 816,363,435 573,408,796 399,198,980Surplus reserves (Note 19 and 25) 112,303,137 107,777,298 112,303,137 107,777,298 137,984,625Remeasurement losses on retirement plan (Note 20) (10,358,609) (26,844,846) (10,358,609) (26,844,846) (33,321,046)Net unrealized gains (losses) on AFS investments (Note 7) (838,255,143) (562,948,094) (838,255,143) (562,948,094) (275,369,283)Cumulative translation adjustments (111,836,631) (102,355,840) (111,836,631) (102,355,840) (101,893,478)
11,968,216,189 11,989,037,314 11,968,216,189 11,989,037,314 5,765,897,53877,611,891,486 57,659,278,037 75,838,014,994 55,838,260,553 47,320,872,163
See accompanying Notes to Financial Statements.
statements of financial position
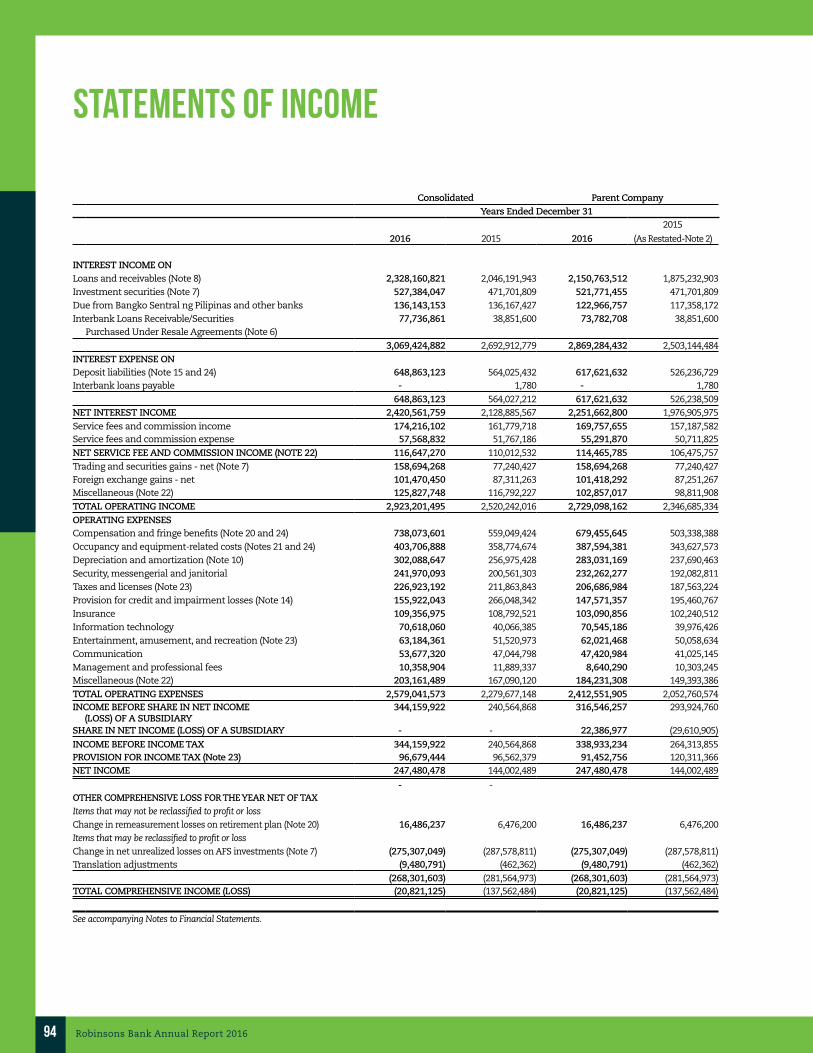
94 Robinsons Bank Annual Report 2016
Consolidated Parent CompanyYears Ended December 31
2015
2016 2015 2016 (As Restated-Note 2)
INTEREST INCOME ONLoans and receivables (Note 8) 2,328,160,821 2,046,191,943 2,150,763,512 1,875,232,903Investment securities (Note 7) 527,384,047 471,701,809 521,771,455 471,701,809Due from Bangko Sentral ng Pilipinas and other banks 136,143,153 136,167,427 122,966,757 117,358,172Interbank Loans Receivable/Securities 77,736,861 38,851,600 73,782,708 38,851,600
Purchased Under Resale Agreements (Note 6)3,069,424,882 2,692,912,779 2,869,284,432 2,503,144,484
INTEREST EXPENSE ONDeposit liabilities (Note 15 and 24) 648,863,123 564,025,432 617,621,632 526,236,729Interbank loans payable - 1,780 - 1,780
648,863,123 564,027,212 617,621,632 526,238,509NET INTEREST INCOME 2,420,561,759 2,128,885,567 2,251,662,800 1,976,905,975Service fees and commission income 174,216,102 161,779,718 169,757,655 157,187,582Service fees and commission expense 57,568,832 51,767,186 55,291,870 50,711,825NET SERVICE FEE AND COMMISSION INCOME (NOTE 22) 116,647,270 110,012,532 114,465,785 106,475,757Trading and securities gains - net (Note 7) 158,694,268 77,240,427 158,694,268 77,240,427Foreign exchange gains - net 101,470,450 87,311,263 101,418,292 87,251,267Miscellaneous (Note 22) 125,827,748 116,792,227 102,857,017 98,811,908TOTAL OPERATING INCOME 2,923,201,495 2,520,242,016 2,729,098,162 2,346,685,334OPERATING EXPENSESCompensation and fringe benefits (Note 20 and 24) 738,073,601 559,049,424 679,455,645 503,338,388Occupancy and equipment-related costs (Notes 21 and 24) 403,706,888 358,774,674 387,594,381 343,627,573Depreciation and amortization (Note 10) 302,088,647 256,975,428 283,031,169 237,690,463Security, messengerial and janitorial 241,970,093 200,561,303 232,262,277 192,082,811Taxes and licenses (Note 23) 226,923,192 211,863,843 206,686,984 187,563,224Provision for credit and impairment losses (Note 14) 155,922,043 266,048,342 147,571,357 195,460,767Insurance 109,356,975 108,792,521 103,090,856 102,240,512Information technology 70,618,060 40,066,385 70,545,186 39,976,426Entertainment, amusement, and recreation (Note 23) 63,184,361 51,520,973 62,021,468 50,058,634Communication 53,677,320 47,044,798 47,420,984 41,025,145Management and professional fees 10,358,904 11,889,337 8,640,290 10,303,245Miscellaneous (Note 22) 203,161,489 167,090,120 184,231,308 149,393,386TOTAL OPERATING EXPENSES 2,579,041,573 2,279,677,148 2,412,551,905 2,052,760,574INCOME BEFORE SHARE IN NET INCOME 344,159,922 240,564,868 316,546,257 293,924,760 (LOSS) OF A SUBSIDIARYSHARE IN NET INCOME (LOSS) OF A SUBSIDIARY - - 22,386,977 (29,610,905)INCOME BEFORE INCOME TAX 344,159,922 240,564,868 338,933,234 264,313,855PROVISION FOR INCOME TAX (Note 23) 96,679,444 96,562,379 91,452,756 120,311,366NET INCOME 247,480,478 144,002,489 247,480,478 144,002,489
- -OTHER COMPREHENSIVE LOSS FOR THE YEAR NET OF TAX Items that may not be reclassified to profit or lossChange in remeasurement losses on retirement plan (Note 20) 16,486,237 6,476,200 16,486,237 6,476,200Items that may be reclassified to profit or lossChange in net unrealized losses on AFS investments (Note 7) (275,307,049) (287,578,811) (275,307,049) (287,578,811)Translation adjustments (9,480,791) (462,362) (9,480,791) (462,362)
(268,301,603) (281,564,973) (268,301,603) (281,564,973)TOTAL COMPREHENSIVE INCOME (LOSS) (20,821,125) (137,562,484) (20,821,125) (137,562,484)
See accompanying Notes to Financial Statements.
statements of income
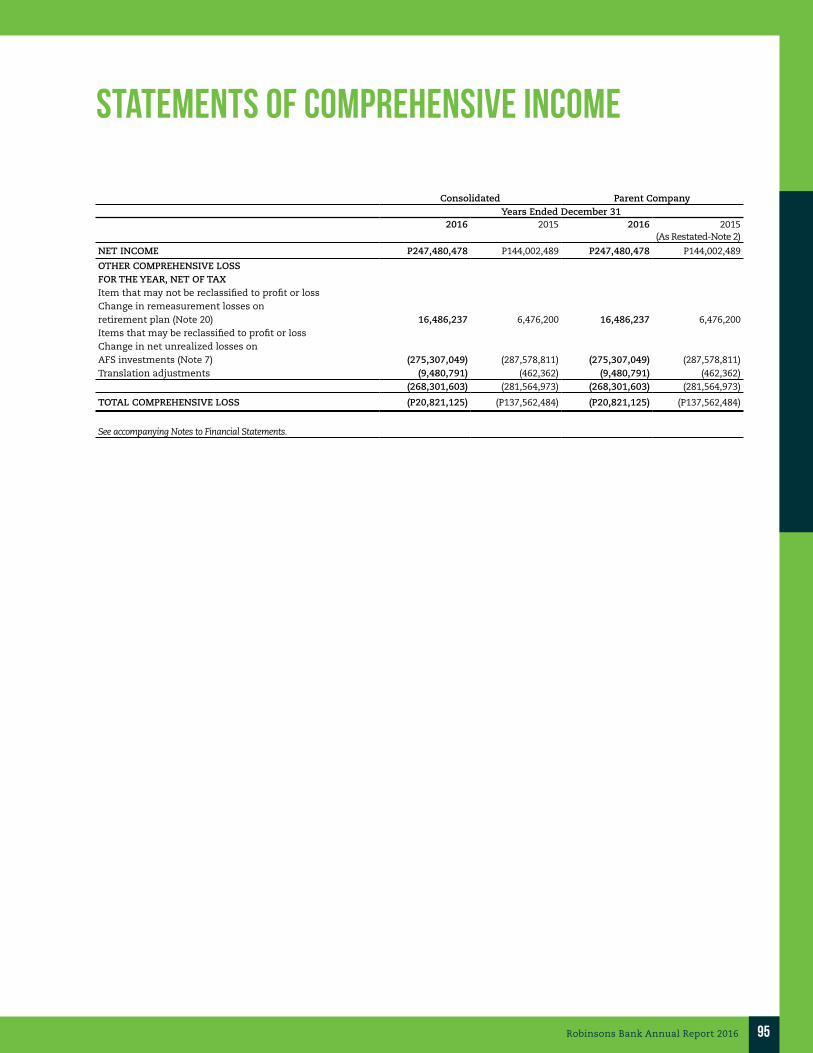
95Robinsons Bank Annual Report 2016
Consolidated Parent CompanyYears Ended December 31
2016 2015 2016 2015(As Restated-Note 2)
NET INCOME P247,480,478 P144,002,489 P247,480,478 P144,002,489
OTHER COMPREHENSIVE LOSSFOR THE YEAR, NET OF TAXItem that may not be reclassified to profit or lossChange in remeasurement losses onretirement plan (Note 20) 16,486,237 6,476,200 16,486,237 6,476,200Items that may be reclassified to profit or lossChange in net unrealized losses onAFS investments (Note 7) (275,307,049) (287,578,811) (275,307,049) (287,578,811)Translation adjustments (9,480,791) (462,362) (9,480,791) (462,362)
(268,301,603) (281,564,973) (268,301,603) (281,564,973)
TOTAL COMPREHENSIVE LOSS (P20,821,125) (P137,562,484) (P20,821,125) (P137,562,484)
See accompanying Notes to Financial Statements.
statements of COMPREHENSIVE income

96 Robinsons Bank Annual Report 2016
stat
emen
ts o
f CHA
NGES
IN E
QUIT
Y
Con
solid
ated
Com
mon
St
ock
(Not
e 19
)
Pref
erre
d
Stoc
k(N
ote
19)
Dep
osit
fo
r St
ock
Su
bscr
iptio
n(N
ote
19)
Surp
lus
(Defi
cit)
(N
ote
19)
Surp
lus
Res
erve
s (N
ote
19)
Rem
easu
rem
ent
Loss
es o
n
Ret
irem
ent P
lan
(N
ote
20)
Net
Un
real
ized
G
ain
s (L
osse
s)
on A
FS
Inve
stm
ents
(Not
e 7)
Cu
mu
lativ
e Tr
ansl
atio
n
Adj
ust
men
tsTo
tal
Bala
nce
at J
anu
ary
1, 2
016
P43
6,83
5,00
0P
5,66
3,16
5,00
0P
5,90
0,00
0,00
0P
573,
408,
796
P10
7,77
7,29
8P
(26,
844,
846)
P(5
62,9
48,0
94)
P(1
02,3
55,8
40)
P11
,989
,037
,314
Tota
l com
preh
ensi
ve in
com
e (lo
ss) f
or th
e ye
ar24
7,48
0,47
816
,486
,237
(275
,307
,049
)(9
,480
,791
)(2
0,82
1,12
5)C
onve
rsio
n o
f pre
ferr
ed s
tock
to c
omm
on s
tock
(Not
e 19
)5,
663,
165,
000
(5,6
63,1
65,0
00)
-Is
suan
ce o
f com
mon
sto
ck (
Not
e 19
)5,
900,
000,
000
(5,9
00,0
00,0
00)
-A
ppro
pria
tion
of s
elf-
insu
ran
ce (N
ote
19)
(3,6
00,0
00)
3,60
0,00
0-
App
ropr
iati
on fo
r tr
ust
res
erve
s (N
ote
19)
(925
,839
)92
5,83
9-
Bala
nce
at D
ecem
ber
31, 2
016
P12
,000
,000
,000
P-
P-
P81
6,36
3,43
5P
112,
303,
137
P(1
0,35
8,60
9)P
(838
,255
,143
)P
(111
,836
,631
)P
11,9
68,2
16,1
89
Bala
nce
at J
anu
ary
1, 2
015
P43
6,83
5,00
0P
5,20
2,46
2,74
0P
-P
399,
198,
980
P13
7,98
4,62
5P
(33,
321,
046)
P(2
75,3
69,2
83)
P(1
01,8
93,4
78)
P5,
765,
897,
538
Issu
ance
of p
refe
rred
sto
ck (N
ote
19)
-46
0,70
2,26
0-
--
--
-46
0,70
2,26
0D
epos
it fo
r fu
ture
sto
ck s
ubs
crip
tion
--
5,90
0,00
0,00
0-
--
--
5,90
0,00
0,00
0To
tal c
ompr
ehen
sive
inco
me
(loss
) for
the
year
--
-14
4,00
2,48
9-
6,47
6,20
0(2
87,5
78,8
11)
(462
,362
)(1
37,5
62,4
84)
App
ropr
iati
on fo
r se
lf-i
nsu
ran
ce (N
ote
19)
--
-(3
,600
,000
)3,
600,
000
--
--
App
ropr
iati
on fo
r tr
ust
res
erve
s (N
ote
19)
--
-(2
,624
,210
)2,
624,
210
--
--
Rev
ersa
l of a
ppro
pria
tion
--
-36
,431
,537
(36,
431,
537)
--
--
Bala
nce
at D
ecem
ber
31, 2
015
P43
6,83
5,00
0P
5,66
3,16
5,00
0P
5,90
0,00
0,00
0P
573,
408,
796
P10
7,77
7,29
8P
(26,
844,
846)
P(5
62,9
48,0
94)
P(1
02,3
55,8
40)
P11
,989
,037
,314

97Robinsons Bank Annual Report 2016
Pare
nt C
ompa
ny
Com
mon
St
ock
(Not
e 19
)
Pref
erre
d
Stoc
k(N
ote
19)
Dep
osit
fo
r St
ock
Su
bscr
iptio
n(N
ote
19)
Surp
lus
(Defi
cit)
(N
ote
19)
Surp
lus
Res
erve
s (N
ote
19)
Rem
easu
rem
ent
Loss
es o
n
Ret
irem
ent P
lan
(N
ote
20)
Net
Un
real
ized
G
ain
s (L
osse
s)
on A
FS
Inve
stm
ents
(Not
e 7)
Cu
mu
lativ
e Tr
ansl
atio
n
Adj
ust
men
tsTo
tal
Bala
nce
at J
anu
ary
1, 2
016
P43
6,83
5,00
0P
5,66
3,16
5,00
0P
5,90
0,00
0,00
0P
521,
993,
304
P10
7,77
7,29
8P
(27,
077,
207)
P(5
62,9
48,0
94)
P(1
02,3
55,8
40)
P11
,937
,389
,461
Effe
ct o
f ado
ptio
n o
f Am
ende
d Ph
ilipp
ine
Acc
oun
tin
g St
anda
rd (P
AS)
27
(Not
e 2)
51,4
15,4
9223
2,36
151
,647
,853
Bala
nce
at J
anu
ary
1, 2
016,
as
rest
ated
436,
835,
000
5,66
3,16
5,00
05,
900,
000,
000
573,
408,
796
107,
777,
298
(26,
844,
846)
(562
,948
,094
)(1
02,3
55,8
40)
11,9
89,0
37,3
14To
tal c
ompr
ehen
sive
inco
me
(loss
) for
the
year
247,
480,
478
16,4
86,2
37(2
75,3
07,0
49)
(9,4
80,7
91)
(20,
821,
125)
Con
vers
ion
of p
refe
rred
sto
ck to
com
mon
sto
ck5,
663,
165,
000
(5,6
63,1
65,0
00)
-Is
suan
ce o
f com
mon
sto
ck (N
ote
19)
5,90
0,00
0,00
0(5
,900
,000
,000
)-
App
ropr
iati
on fo
r se
lf-i
nsu
ran
ce (N
ote
19)
(3,6
00,0
00)
3,60
0,00
0-
App
ropr
iati
on fo
r tr
ust
res
erve
s (N
ote
19)
(925
,839
)92
5,83
9-
Bala
nce
at D
ecem
ber
31, 2
016
P12
,000
,000
,000
P-
P-
P81
6,36
3,43
5P
112,
303,
137
P(1
0,35
8,60
9)P
(838
,255
,143
)P
(111
,836
,631
)P
11,9
68,2
16,1
89
Bala
nce
at J
anu
ary
1, 2
015
P43
6,83
5,00
0P
5,20
2,46
2,74
0P
-P
318,
172,
583
P13
7,98
4,62
5P
(33,
085,
924)
P(2
75,3
69,2
83)
P(1
01,8
93,4
78)
P5,
685,
106,
263
Effe
ct o
f ado
ptio
n o
f Am
ende
d PA
S 27
(Not
e 2)
81,0
26,3
97(2
35,1
22)
80,7
91,2
75Ba
lan
ce a
t Jan
uar
y 1,
201
5, a
s re
stat
ed43
6,83
5,00
05,
202,
462,
740
-39
9,19
8,98
013
7,98
4,62
5(3
3,32
1,04
6)(2
75,3
69,2
83)
(101
,893
,478
)5,
765,
897,
538
Tota
l com
preh
ensi
ve in
com
e (lo
ss) f
or th
e ye
ar-
--
144,
002,
489
-6,
476,
200
(287
,578
,811
)(4
62,3
62)
(137
,562
,484
)Is
suan
ce o
f pre
ferr
ed s
tock
-46
0,70
2,26
0-
--
--
-46
0,70
2,26
0D
epos
it fo
r st
ock
subs
crip
tion
--
5,90
0,00
0,00
0-
--
--
5,90
0,00
0,00
0R
ever
sal o
f app
ropr
iati
on fo
r se
lf-i
nsu
ran
ce (N
ote
19)
--
-36
,431
,537
(36,
431,
537)
--
--
App
ropr
iati
on fo
r se
lf-i
nsu
ran
ce (N
ote
19)
--
-(3
,600
,000
)3,
600,
000
--
--
App
ropr
iati
on fo
r tr
ust
res
erve
s (N
ote
19)
--
-(2
,624
,210
)2,
624,
210
--
--
Bala
nce
at D
ecem
ber
31, 2
015
P43
6,83
5,00
0P
5,66
3,16
5,00
0P
5,90
0,00
0,00
0P
573,
408,
796
P10
7,77
7,29
8P
(26,
844,
846)
P(5
62,9
48,0
94)
P(1
02,3
55,8
40)
P11
,989
,037
,314

98 Robinsons Bank Annual Report 2016
Consolidated Parent CompanyYears Ended December 31
20152016 2015 2016 (As Restated-Notes 2)
CASH FLOWS FROM OPERATING ACTIVITIESIncome before income tax 344,159,922 240,564,868 338,933,234 264,313,855Adjustments for:
Depreciation and amortization (Note 10) 302,088,647 256,975,428 283,031,169 237,690,463Provision for credit and impairment losses (Note 14) 155,922,043 266,048,342 147,571,357 195,460,767Loss (gain) on sale of available-for-sale investments (Note 7) 146,826,846 (57,821,174) 146,826,846 (57,821,174)Retirement expense (Note 20) 30,146,298 23,033,026 28,570,765 21,507,889Gain on initial recognition of repossessed chattels (Note 22) (25,017,967) (6,001,755) (25,066,668) (5,995,744)Gain on initial recognition of investment properties (Note 22) (17,303,414) (35,549,709) (12,665,271) (30,698,176)Gain on sale of repossessed chattels (Note 22) 13,778,921 - 13,792,885 -Gain on sale of investment properties (Note 22) (8,148,422) (10,466,376) (3,543,546) (5,936,420)Unrealized loss on fair value of derivative liability (Note 7) 7,447,751 - 7,447,751 -Gain on sale of property and equipment (Note 22) (3,864,811) (680,079) (3,824,515) (680,079)Unrealized gain on fair value of derivative assets (Note 7) (1,322,995) - (1,322,995) -Reclassification of allowance for credit and impairment losses 1,204,958 - 1,204,958 -Unrealized loss on fair value of financial assets at fair value through profit or loss (Note 7) 125,955 9,562,658 125,955 9,562,658
Loss on sale of repossessed chattels (Note 22) - (12,433,552) - (12,283,552)Share in net income (loss) of a subsidiary - - (22,386,977) 29,610,905
Changes in operating assets and liabilities: Decrease (increase) in: Financial assets at fair value through profit or loss 3,774,579 1,291,095,695 3,774,579 1,291,095,695 Loans and receivables (11,763,966,266) (5,304,236,982) (11,639,214,422) (5,263,128,214) Other assets (567,764,559) (212,829,317) (567,727,758) (209,040,013) Increase (decrease) in: Deposit liabilities 19,627,340,933 2,457,084,672 19,668,517,132 2,452,469,225 Manager’s checks 115,043,539 10,716,343 115,043,539 10,716,343 Accrued expenses 1,413,008 (7,673,188) (21,014,290) 1,460,671 Other liabilities 244,466,663 (182,961,834) 271,354,008 (194,133,445)Net cash generated from operations 8,606,351,629 (1,275,572,934) 8,729,427,736 (1,265,828,346)Income taxes paid (195,424,104) (198,772,460) (187,824,093) (194,244,529)Contributions paid on retirement plan (25,293,666) - (25,293,666) -Net cash provided by operating activities 8,385,633,859 (1,474,345,394) 8,516,309,977 (1,460,072,875)
statements of cash flows

99Robinsons Bank Annual Report 2016
Consolidated Parent CompanyYears Ended December 31
20152016 2015 2016 (As Restated-Notes 2)
CASH FLOWS FROM INVESTING ACTIVITIESAcquisitions of:
Placements with other banks - (259,700,610) - (259,700,610)Available-for-sale investments (12,016,173,086) (10,422,285,592) (12,014,973,086) (10,422,285,592)Held-to-maturity investment (Note 7) (825,605,001) (1,115,692,134) (610,232,448) (1,115,692,134)Investment in Subsidiary (Note 9) - - (400,000,000) -Property and equipment (Notes 10 and 28) (209,213,066) (171,718,782) (187,931,105) (154,534,468)Branch licenses (Note 12) (44,600,000) (1,000,000) (44,000,000) (1,000,000)Software costs (Note 13) (26,193,192) (9,779,795) (24,795,432) (2,444,000)
Proceeds from sale of:Available-for-sale investments 8,010,258,301 9,589,810,015 8,010,258,301 9,589,810,015Property and equipment 5,926,745 6,301,486 5,761,451 6,301,486Investment properties 32,453,351 16,563,652 17,228,000 11,588,473Repossessed chattels 88,955,558 68,517,478 88,897,159 68,367,478
Proceeds from maturity of:Placements with Bangko Sentral ng Pilipinas 1,000,000 1,000,000 1,000,000 1,000,000Placements with other banks (Note 28) 259,700,610 259,700,610Available-for-sale investments 39,776,000 119,000,000 39,776,000 119,000,000Held-to-maturity investment (Note 7) 25,000,000 135,000,000 25,000,000 135,000,000
Net cash used in investing activities (4,658,713,780) (2,043,984,282) (4,834,310,550) (2,024,589,352)CASH FLOWS FROM FINANCING ACTIVITIESProceeds from deposit for future stock subscription (Note 19) - 5,900,000,000 - 5,900,000,000Issuance of common stock (Note 19) - 460,702,260 - 460,702,260 Net cash provided by financing activities - 6,360,702,260 - 6,360,702,260
EFFECTS OF FOREIGN EXCHANGE RATE CHANGES (9,480,791) (462,362) (9,480,791) (462,362)NET INCREASE (DECREASE) IN CASH AND CASH EQUIVALENTS 3,717,439,288 2,841,910,222 3,672,518,636 2,875,577,671 CASH AND CASH EQUIVALENTS AT BEGINNING OF YEARCash and other cash items 1,702,287,136 1,576,260,066 1,665,564,278 1,501,127,113 Due from Bangko Sentral ng Pilipinas 9,922,250,327 9,494,853,206 9,189,740,992 8,805,204,359 Due from other banks (Note 28) 4,430,140,777 1,641,654,746 4,336,512,589 1,509,908,716 Securities Purchased Under Resale Agreements (Note 28) - 500,000,000 - 500,000,000
16,054,678,240 13,212,768,018 15,191,817,859 12,316,240,188 CASH AND CASH EQUIVALENTS AT END OF YEARCash and other cash items 1,684,403,861 1,702,287,136 1,653,720,370 1,665,564,278 Due from Bangko Sentral ng Pilipinas 13,415,517,416 9,922,250,327 12,722,258,187 9,189,740,992 Due from other banks (Note 28) 4,090,364,784 4,430,140,777 3,995,280,423 4,336,512,589 Securities Purchased Under Resale Agreements (Note 6) 581,831,467 - 493,077,515 -
19,772,117,528 16,054,678,240 18,864,336,495 15,191,817,859
OPERATIONAL CASH FLOWS FROM INTERESTInterest received 2,974,464,676 2,629,678,424 2,788,093,052 2,448,295,736 Interest paid 611,710,788 584,371,226 580,745,810 546,459,375
See accompanying Notes to Financial Statements.

100 Robinsons Bank Annual Report 2016
NOTES TO financial STATEMENTS
*SGVFS022572*
ROBINSONS BANK CORPORATION AND SUBSIDIARYNOTES TO FINANCIAL STATEMENTS
1. Corporate Information
Robinsons Bank Corporation (the Parent Company or the Bank) was domiciled and incorporatedin the Philippines and registered with the Philippine Securities and Exchange Commission (SEC)on April 28, 1966 and acquired its license from Bangko Sentral ng Pilipinas (BSP) to operate as acommercial bank on March 1, 2002. On March 21, 2013, the SEC granted the license extendingthe Bank’s corporate life for another fifty (50) years.
The registered address and principal place of business of the Parent Company is at 17th Floor,Galleria Corporate Center, EDSA corner Ortigas Avenue, Quezon City.
The Parent Company is 60.00% and 40.00% owned by JG Summit Capital Services Corp.(JGSCSC) and Robinsons Retail Holdings, Inc. (RRHI), respectively. The ultimate parentcompany of the Bank is JG Summit Holdings, Inc.
In December 2012, the Parent Company acquired 100.00% controlling interest in Legazpi SavingsBank, Inc. (LSB) (see Note 9).
LSB was incorporated and registered with the SEC on May 8, 1976 and acquired license from theBSP to operate as a thrift bank. LSB’s registered address and principal place of business is atRizal Street, Barangay Sagpon, Albay, Legazpi City.
The Parent Company and its subsidiary (the Group) is engaged in commercial and thrift banking,respectively, whose principal activities include deposit-taking, lending, treasury, foreign exchangedealing and fund transfers or remittance servicing.
2. Summary of Significant Accounting Policies
Basis of PreparationThe accompanying financial statements of the Group and of the Parent Company have beenprepared on a historical cost basis except for financial assets at fair value through profit or loss(FVPL) and available-for-sale (AFS) investments which are measured at fair value.
The financial statements of the Parent Company reflect the accounts of the Regular Banking Unit(RBU) and the Foreign Currency Deposit Unit (FCDU). The functional currency of RBU andFCDU is Philippine Peso (PHP) and United States dollar (USD), respectively. For financialreporting purposes, FCDU accounts and foreign currency-denominated accounts in the RBU aretranslated into their equivalents in PHP (see accounting policy on Foreign Currency Translation).The financial statements individually prepared for these units are combined and inter-unitaccounts and transactions are eliminated.
The financial statements are presented in PHP, and all amounts are rounded to the nearest peso(P=), except when otherwise indicated.

101Robinsons Bank Annual Report 2016
- 2 -
*SGVFS022572*
Statement of ComplianceThe financial statements of the Group and of the Parent Company have been prepared incompliance with Philippine Financial Reporting Standards (PFRS).
Presentation of Financial StatementsThe Group and the Parent Company present its statements of financial position broadly in theorder of liquidity. An analysis regarding recovery or settlement within twelve (12) months afterthe statement of financial position date (current) and more than twelve (12) months after thestatement of financial position date (non-current) is presented in Note 18.
The Bank assesses that it has a currently enforceable right of offset if the right is not contingent ona future event, and is legally enforceable in the normal course of business, event of default, andevent of insolvency or bankruptcy of the Bank and all of the counterparties. Income and expenseare not offset in the statement of income unless required or permitted by any accounting standardor interpretation, and as specifically disclosed in the accounting policies of the Group and of theParent Company. This is not generally the case with master-netting agreements, where the relatedassets and liabilities are presented gross in the statement of financial position.
Basis of ConsolidationThe consolidated financial statements include the financial statements of the Parent Company andof its subsidiary and are prepared for the same reporting period as the subsidiary, using consistentaccounting policies.
All intra-group balances, transactions, income and expenses and profit and losses resulting fromintra-group transactions are eliminated in full in the consolidation.
A subsidiary is fully consolidated from the date on which control is transferred to the ParentCompany. Control is achieved where the Parent Company is exposed, or has the rights, tovariable returns from its involvement with the investee and has the ability to affect those returnsthrough its power over the investee. Consolidation of a subsidiary ceases when control istransferred out of the Parent Company. The results of a subsidiary acquired or disposed of duringthe year are included in the consolidated statement of income from the date of acquisition or up tothe date of disposal, as appropriate.
A change in the Parent Company’s ownership interest in a subsidiary, without a loss of control, isaccounted for as an equity transaction. Any difference between the amount by which the non-controlling interests are adjusted and the fair value of the consideration paid or received isrecognized directly in equity and attributed to the owners of the Parent Company.
When a change in ownership interest in a subsidiary occurs which results in a loss of control overthe subsidiary, the Parent Company:∂ derecognizes the related assets (including goodwill) and liabilities of the subsidiary;∂ derecognizes the carrying amount of any non-controlling interests;∂ derecognizes the related other comprehensive income (OCI) recorded in equity and recycles
the same to statement of income or surplus;∂ recognizes the fair value of the consideration received;∂ recognizes the fair value of any investment retained; and∂ recognizes any surplus or deficit in statement of income.

102 Robinsons Bank Annual Report 2016
NOTES TO financial STATEMENTS- 3 -
*SGVFS022572*
Changes in Accounting Policies and DisclosuresThe Group applied, for the first time, the following applicable new and revised accountingstandards. Unless otherwise indicated, these new and revised accounting standards have no impactto the Group. Except for these standards and amended PFRS which were adopted as ofJanuary 1, 2016, the accounting policies adopted are consistent with those of the previousfinancial year.
Amendments to Philippine Accounting Standards (PAS) 1, Presentation of Financial Statements,Disclosure InitiativeThe amendments are intended to assist entities in applying judgment when meeting thepresentation and disclosure requirements in PFRSs. They clarify the following:• That entities shall not reduce the understandability of their financial statements by either
obscuring material information with immaterial information; or aggregating material itemsthat have different natures or functions;
• That specific line items in the statement of income and OCI and the statement of financialposition may be disaggregated;
• That entities have flexibility as to the order in which they present the notes to financialstatements; and
• That the share of OCI of associates and joint ventures accounted for using the equity methodmust be presented in aggregate as a single line item, and classified between those items thatwill or will not be subsequently reclassified to profit or loss.
Amendments to PAS 16, Property, Plant and Equipment and PAS 38, Intangible Assets,Clarification of Acceptable Methods of Depreciation and AmortizationThe amendments clarify the principle in PAS 16 and PAS 38 that revenue reflects a pattern ofeconomic benefits that are generated from operating a business (of which the asset is part) ratherthan the economic benefits that are consumed through use of the asset. As a result, a revenue-based method cannot be used to depreciate property, plant and equipment and may only be used invery limited circumstances to amortize intangible assets.
These amendments are applied prospectively and do not have any impact to the Group, given thatthe Group has not used a revenue-based method to depreciate or amortize its property, plant andequipment and intangible assets.
Amendment to PAS 27, Separate Financial Statements, Equity Method in Separate FinancialStatementsIn 2016, the Parent Company adopted the amendments to PAS 27 following the guidelinesprovided by the BSP. The amendments allow entities to use the equity method to account forinvestment in subsidiaries, joint ventures, and associates in their separate financial statements.The Parent Company elected to use the equity method in its separate financial statements. Theseamendments do not have any impact on the Group’s consolidated financial statements.
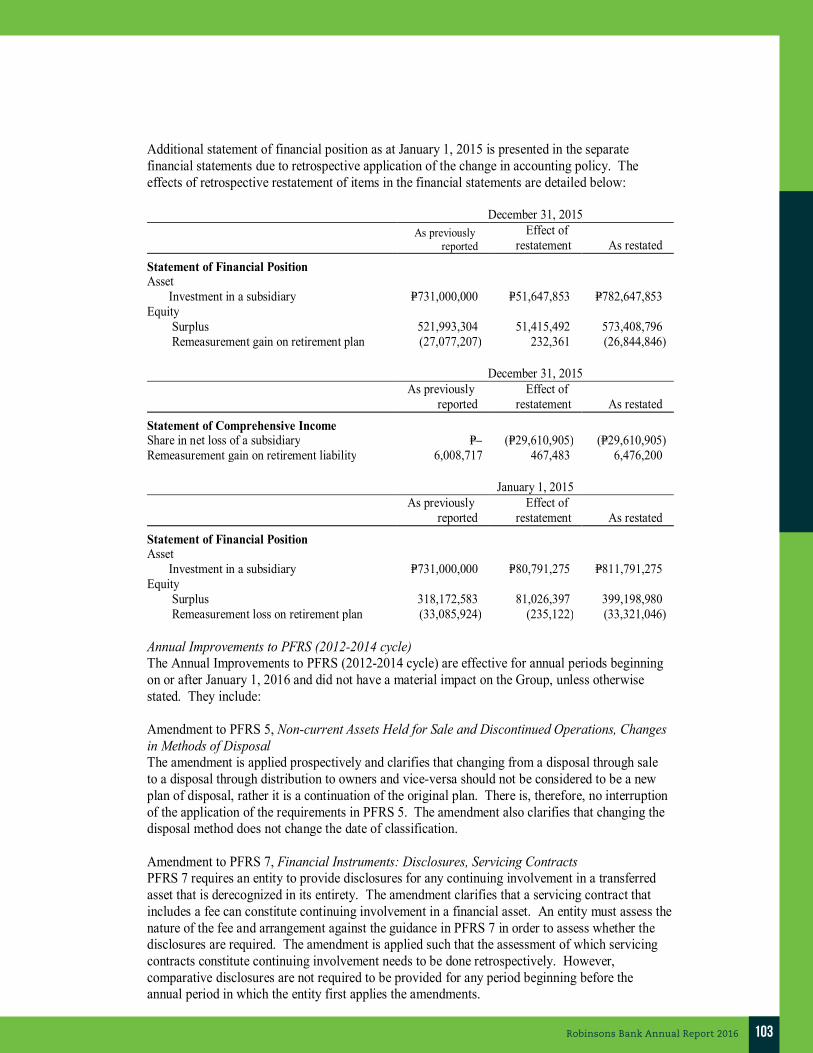
103Robinsons Bank Annual Report 2016
- 4 -
*SGVFS022572*
Additional statement of financial position as at January 1, 2015 is presented in the separatefinancial statements due to retrospective application of the change in accounting policy. Theeffects of retrospective restatement of items in the financial statements are detailed below:
December 31, 2015As previously
reportedEffect of
restatement As restated
Statement of Financial PositionAsset
Investment in a subsidiary P=731,000,000 P=51,647,853 P=782,647,853Equity
Surplus 521,993,304 51,415,492 573,408,796Remeasurement gain on retirement plan (27,077,207) 232,361 (26,844,846)
December 31, 2015As previously
reportedEffect of
restatement As restated
Statement of Comprehensive IncomeShare in net loss of a subsidiary P=– (P=29,610,905) (P=29,610,905)Remeasurement gain on retirement liability 6,008,717 467,483 6,476,200
January 1, 2015As previously
reportedEffect of
restatement As restated
Statement of Financial PositionAsset
Investment in a subsidiary P=731,000,000 P=80,791,275 P=811,791,275Equity
Surplus 318,172,583 81,026,397 399,198,980Remeasurement loss on retirement plan (33,085,924) (235,122) (33,321,046)
Annual Improvements to PFRS (2012-2014 cycle)The Annual Improvements to PFRS (2012-2014 cycle) are effective for annual periods beginningon or after January 1, 2016 and did not have a material impact on the Group, unless otherwisestated. They include:
Amendment to PFRS 5, Non-current Assets Held for Sale and Discontinued Operations, Changesin Methods of DisposalThe amendment is applied prospectively and clarifies that changing from a disposal through saleto a disposal through distribution to owners and vice-versa should not be considered to be a newplan of disposal, rather it is a continuation of the original plan. There is, therefore, no interruptionof the application of the requirements in PFRS 5. The amendment also clarifies that changing thedisposal method does not change the date of classification.
Amendment to PFRS 7, Financial Instruments: Disclosures, Servicing ContractsPFRS 7 requires an entity to provide disclosures for any continuing involvement in a transferredasset that is derecognized in its entirety. The amendment clarifies that a servicing contract thatincludes a fee can constitute continuing involvement in a financial asset. An entity must assess thenature of the fee and arrangement against the guidance in PFRS 7 in order to assess whether thedisclosures are required. The amendment is applied such that the assessment of which servicingcontracts constitute continuing involvement needs to be done retrospectively. However,comparative disclosures are not required to be provided for any period beginning before theannual period in which the entity first applies the amendments.
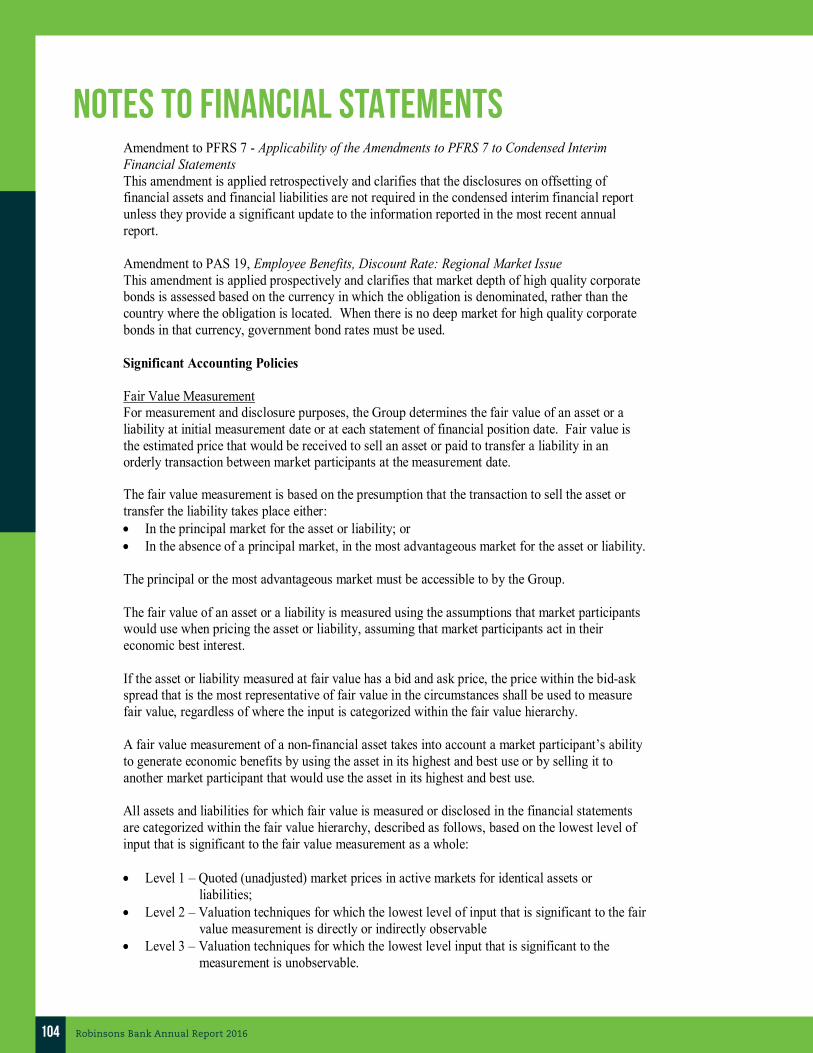
104 Robinsons Bank Annual Report 2016
NOTES TO financial STATEMENTS- 5 -
*SGVFS022572*
Amendment to PFRS 7 - Applicability of the Amendments to PFRS 7 to Condensed InterimFinancial StatementsThis amendment is applied retrospectively and clarifies that the disclosures on offsetting offinancial assets and financial liabilities are not required in the condensed interim financial reportunless they provide a significant update to the information reported in the most recent annualreport.
Amendment to PAS 19, Employee Benefits, Discount Rate: Regional Market IssueThis amendment is applied prospectively and clarifies that market depth of high quality corporatebonds is assessed based on the currency in which the obligation is denominated, rather than thecountry where the obligation is located. When there is no deep market for high quality corporatebonds in that currency, government bond rates must be used.
Significant Accounting Policies
Fair Value MeasurementFor measurement and disclosure purposes, the Group determines the fair value of an asset or aliability at initial measurement date or at each statement of financial position date. Fair value isthe estimated price that would be received to sell an asset or paid to transfer a liability in anorderly transaction between market participants at the measurement date.
The fair value measurement is based on the presumption that the transaction to sell the asset ortransfer the liability takes place either:∂ In the principal market for the asset or liability; or∂ In the absence of a principal market, in the most advantageous market for the asset or liability.
The principal or the most advantageous market must be accessible to by the Group.
The fair value of an asset or a liability is measured using the assumptions that market participantswould use when pricing the asset or liability, assuming that market participants act in theireconomic best interest.
If the asset or liability measured at fair value has a bid and ask price, the price within the bid-askspread that is the most representative of fair value in the circumstances shall be used to measurefair value, regardless of where the input is categorized within the fair value hierarchy.
A fair value measurement of a non-financial asset takes into account a market participant’s abilityto generate economic benefits by using the asset in its highest and best use or by selling it toanother market participant that would use the asset in its highest and best use.
All assets and liabilities for which fair value is measured or disclosed in the financial statementsare categorized within the fair value hierarchy, described as follows, based on the lowest level ofinput that is significant to the fair value measurement as a whole:
∂ Level 1 – Quoted (unadjusted) market prices in active markets for identical assets orliabilities;
∂ Level 2 – Valuation techniques for which the lowest level of input that is significant to the fairvalue measurement is directly or indirectly observable
∂ Level 3 – Valuation techniques for which the lowest level input that is significant to themeasurement is unobservable.

105Robinsons Bank Annual Report 2016
- 6 -
*SGVFS022572*
The Group uses valuation techniques that are appropriate in the circumstances and for whichsufficient data are available to measure fair value, maximizing the use of relevant observableinputs and minimizing the use of unobservable inputs.
Foreign Currency TranslationTransactions and balancesThe books of accounts of the RBU are maintained in PHP, while those of the FCDU aremaintained in USD.
For financial reporting purposes, FCDU accounts and the foreign currency-denominated monetaryassets and liabilities in the RBU are translated into their PHP equivalents based on the PhilippineDealing System (PDS) closing rate prevailing at the statement of financial position date and for,foreign currency-denominated income and expenses based on the spot exchange rate at the date ofthe transaction. Foreign exchange differences arising from restatements of foreign currency-denominated assets and liabilities in the RBU are credited to or charged against the statement ofincome under ‘Foreign exchange gain (loss) - net’ in the year in which the rates change. Foreignexchange differences arising on translation of FCDU accounts to peso are taken to OCI under‘Translation adjustments’.
Cash and Cash EquivalentsFor purposes of reporting cash flows, cash and cash equivalents include cash and other cash items,amounts due from BSP and other banks, interbank loans receivable and Securities PurchasedUnder Resale Agreements (SPURA) with original maturities of three (3) months or less from datesof placements and that are subject to insignificant risk of changes in value.
Repurchase and Reverse Repurchase AgreementsSecurities sold under agreements to repurchase at a specified future date (‘repos’) are notderecognized from the statement of financial position. The corresponding cash received,including accrued interest, is recognized in the statement of financial position as ‘Securities soldunder repurchase agreements (SSURA)’, reflecting the economic substance of such transaction.
Conversely, securities purchased under agreements to resell at a specified future date (‘reverserepos’) are not recognized in the statement of financial position. The corresponding cash paid,including accrued interest, is recognized in the statement of financial position as SPURA, and isconsidered a loan to the counterparty.
The difference between the purchase price and resale price is treated as interest income and isaccrued over the life of the agreement using the effective interest rate (EIR) method.
Financial Instruments - Initial Recognition and Subsequent MeasurementDate of recognitionPurchases or sales of financial instruments that require delivery of assets within the time frameestablished by regulation or convention in the marketplace are recognized on the settlement date.Settlement date accounting refers to (a) recognition of an asset on the day it is received by theGroup, and (b) the derecognition of an asset and recognition of any gain or loss on disposal on theday that it is delivered by the Group. Derivatives are recognized on a trade date basis. Deposits,amounts due from banks and customers and loans are recognized when cash is received by theGroup or advanced to the borrowers.

106 Robinsons Bank Annual Report 2016
NOTES TO financial STATEMENTS- 7 -
*SGVFS022572*
Initial recognition of financial instrumentsAll financial instruments are initially recognized at fair value. Except for financial assets andfinancial liabilities at FVPL, the initial measurement of financial instruments includes transactioncosts. The Group classifies its financial assets in the following categories: financial assets atFVPL, AFS investments, held-to-maturity (HTM) investments, and loans and receivables.Financial liabilities are classified into financial liabilities at FVPL and financial liabilities atamortized cost. The classification depends on the purpose for which the financial instrumentswere acquired and whether they are quoted in an active market. Management determines theclassification of its financial instruments at initial recognition, and where allowed and appropriate,and re-evaluates such designation at every statement of financial position date.
‘Day 1’ differenceWhere the transaction price in a non-active market is different from the fair value from otherobservable current market transactions in the same instrument or computed based on valuationtechnique whose variables include only data from observable markets, the Group recognizes thedifference between the transaction price and the fair value (a ‘Day 1’ difference) in the statementof income unless it qualifies for recognition as some other type of asset or liability. In cases wherefair value is determined using data which are not observable from the market, the differencebetween the transaction price and the model value is only recognized in the statement of incomewhen the inputs become observable or when the instrument is derecognized. For each transaction,the Group determines the appropriate method of recognizing the amount of ‘Day 1’ difference.
Derivatives recorded at FVPLThe Parent Company is a counterparty to derivative contracts, such as currency forwards andcurrency swaps. These derivatives are entered into as a service to customers and as a means ofreducing or managing their respective foreign exchange exposures, as well as for trading purposes.Such derivative financial instruments are initially recorded at fair value on the date at which thederivative contract is entered into and are subsequently remeasured at fair value. Any gains orlosses arising from changes in fair values of derivatives are taken directly to the statement ofincome and are included in ‘Trading and securities gain - net’. Derivatives are carried as assetswhen the fair value is positive and as liabilities when the fair value is negative.
Financial assets held for tradingFinancial assets held for trading are recorded in the statement of financial position at fair value.Changes in fair value relating to the held for trading positions are recognized in ‘Trading andsecurities gains - net’ and interest earned is recorded in ‘Interest income’. Included in thisclassification are debt securities which have been acquired principally for the purpose of sellingand repurchasing in the near term.
AFS investmentsAFS investments are non-derivative financial assets designated as AFS or which do not qualify tobe classified as financial assets at FVPL, HTM investments or loans and receivables. They arepurchased and held indefinitely, and may be sold in response to liquidity requirements or changesin market conditions. They include equity investments, government securities and other debtinstruments.
After initial measurement, AFS investments are subsequently measured at fair value. Theeffective yield component of AFS debt securities, as well as the impact of restatement on foreigncurrency-denominated AFS debt securities, is reported in the statement of income. The unrealizedgains and losses arising from the fair valuation of AFS investments are excluded, net of tax, fromreported income and are reported as part of OCI as ‘Net unrealized losses on AFS investments’.

107Robinsons Bank Annual Report 2016
- 8 -
*SGVFS022572*
When an AFS investment is disposed of, the cumulative gain or loss previously recognized in OCIis recognized as ‘Trading and securities gain - net’ in the statement of income. Where the Groupholds more than one investment in the same security, these are deemed to be disposed of on a first-in first-out basis. Gains or losses on disposal are determined using average cost method. Interestearned on holding AFS debt investments are reported as ‘Interest income’ using the EIR method.Dividends earned on holding AFS equity investments are recognized in the statement of income as‘Miscellaneous income’ when the right of the payment has been established. The losses arisingfrom impairment of AFS investments are recognized as ‘Provision for credit and impairmentlosses’ in the statement of income.
HTM investmentsHTM investments are quoted non-derivative financial assets with fixed or determinable paymentsand fixed maturities which the Group’s management has the positive intention and ability to holdto maturity. Where the Group sells other than an insignificant amount of HTM investments beforetheir maturity, the entire category would be tainted and reclassified as AFS investments unless forsales or reclassifications that:∂ are so close to maturity or the financial asset’s call date (for example, less than three months
before maturity) that changes in the market rate of interest would not have a significant effecton the financial asset’s fair value;
∂ occur after the entity has collected substantially all of the financial asset’s original principalthrough scheduled payments or prepayments; or
∂ are attributable to an isolated event that is beyond the entity’s control, is non-recurring andcould not have been reasonably anticipated by the entity.
Once tainted, the Group is not permitted to classify any of its financial assets as HTM investmentsfor the next two fiscal years after the year of reclassification.
After initial measurement, these investments are subsequently measured at amortized cost usingthe EIR method, less any impairment in value. Amortized cost is calculated by taking intoaccount any discount or premium on acquisition and fees that are an integral part of the EIR.Gains and losses are recognized in profit or loss in the statement of income when the HTMinvestments are derecognized and impaired, as well as through the amortization process. Thelosses arising from impairment of such investments are recognized in the statement of incomeunder ‘Provision for credit and impairment losses’. The effects of restatement of foreigncurrency-denominated HTM investments are recognized in profit or loss.
Loans and receivablesThis category comprises ‘Cash and other cash items’, ‘Due from BSP’, ‘Due from other banks’,‘Interbank loans receivable/Securities purchased under resale agreements’, ‘Loans andreceivables’ and certain items in ‘Other assets’. These are non-derivative financial assets withfixed or determinable payments and fixed maturities that are not quoted in an active market.They are not entered into with the intention of immediate or short-term resale and are notdesignated as AFS investments or financial assets at FVPL.
After initial measurement, loans and receivables are subsequently measured at amortized costusing the EIR method, less allowance for credit losses. Amortized cost is calculated by taking intoaccount any discount or premium on acquisition and fees and costs that form an integral part of theEIR. The amortization is included in ‘Interest income’ in the statement of income. The lossesarising from impairment are recognized in the profit or loss under ‘Provision for credit andimpairment losses’.

108 Robinsons Bank Annual Report 2016
NOTES TO financial STATEMENTS- 9 -
*SGVFS022572*
Financial liabilities at amortized costThis category represents issued financial instruments or their components, which are notdesignated at FVPL and comprises ‘Deposit liabilities’, ‘Manager’s checks’ and certain itemsunder ‘Accrued expenses and other liabilities’ in the statement of financial position, where thesubstance of the contractual arrangement results in the Group having an obligation either todeliver cash or another financial asset to the holder, or to satisfy the obligation other than by theexchange of a fixed amount of cash or another financial asset for a fixed number of own equityshares. The components of issued financial instruments that contain both liability and equityelements (‘compound’ financial instruments) are accounted for separately, with the equitycomponent being assigned the residual amount after deducting from the instrument as a whole theamount separately determined as the fair value of the liability component on the date of issue.
After initial measurement, financial liabilities at amortized cost are subsequently measured atamortized cost using the EIR method. Amortized cost is calculated by taking into account anydiscount or premium on the issue and debt issuance costs that form an integral part of the EIR.
Offsetting Financial InstrumentsFinancial assets and financial liabilities are offset and the net amount reported in the statement offinancial position if, and only if, there is a currently enforceable legal right to offset the recognizedamounts and there is an intention to settle on a net basis, or to realize the asset and settle theliability simultaneously. Income and expenses are not offset in the statement of comprehensiveincome unless required or permitted by any accounting standard or interpretation, as specificallydisclosed in the accounting policies of the Company. This is not generally the case with masternetting agreements, thus, the related assets and liabilities are presented gross in the statement offinancial position.
Derecognition of Financial Assets and LiabilitiesFinancial assetA financial asset (or, where applicable a part of a financial asset or part of a group of similarfinancial assets) is derecognized when:∂ the rights to receive cash flows from the asset have expired; or∂ the Group has transferred its rights to receive cash flows from the asset or has assumed an
obligation to pay the received cash flows in full without material delay to a third party under a‘pass-through’ arrangement; and
∂ the Group has transferred its rights to receive cash flows from the asset and either (a) hastransferred substantially all the risks and rewards of the asset, or (b) has neither transferred norretained substantially all the risks and rewards of the asset, but has transferred control over theasset.
Where the Group has transferred its rights to receive cash flows from an asset or has entered into apass-through arrangement, it evaluates if and to what extent it has retained the risks and rewards ofownership. When it has neither transferred nor retained substantially all of the risks and rewardsof the asset, nor transferred control over the asset, the Group continues to recognize the transferredasset to the extent of the Group’s continuing involvement. In that case, the Group also recognizesan associated liability. The transferred asset and the associated liability are measured on a basisthat reflects the rights and obligations that the Group has retained.
Continuing involvement that takes the form of a guarantee over the transferred asset is measuredat the lower of the original carrying amount of the asset and the maximum amount ofconsideration that the Group could be required to repay.

109Robinsons Bank Annual Report 2016
- 10 -
*SGVFS022572*
Financial liabilityA financial liability is derecognized when the obligation under the liability is discharged orcancelled or has expired. Where an existing financial liability is replaced by another from thesame lender on substantially different terms, or the terms of an existing liability are substantiallymodified, such an exchange or modification is treated as a derecognition of the original liabilityand the recognition of a new liability, and the difference in the respective carrying amounts isrecognized in statement of income.
Impairment of Financial AssetsThe Group assesses at each statement of financial position date whether there is objectiveevidence that a financial asset or a group of financial assets is impaired. A financial asset or agroup of financial assets is deemed to be impaired if, and only if, there is objective evidence ofimpairment as a result of one or more events that has occurred after the initial recognition of theasset (an incurred ‘loss event’) and that loss event (or events) has an impact on the estimatedfuture cash flows of the financial asset or the group of financial assets that can be reliablyestimated. Evidence of impairment may include indications that the borrower or a group ofborrowers is experiencing significant financial difficulty, default or delinquency in interest orprincipal payments, the probability that they will enter bankruptcy or other financialreorganization and where observable data indicate that there is measurable decrease in theestimated future cash flows of the financial asset or group of financial assets, such as changes inarrears or economic conditions that correlate with defaults.
Financial assets carried at amortized costFor loans and receivables and HTM investments, the Group first assesses at each statement offinancial position date whether objective evidence of impairment exists individually for financialassets that are individually significant. If there is objective evidence that an impairment loss hasbeen incurred, the amount of loss is measured as the difference between the asset’s carryingamount and the present value of the estimated future cash flows (excluding future credit losses thathave not been incurred), discounted using the financial asset’s original EIR. If a financial assetcarried at amortized cost has a variable interest rate, the discount rate for measuring anyimpairment loss is the current EIR, adjusted for the original credit risk premium. The calculationof the present value of the estimated future cash flows of collateralized financial assets reflects thecash flows that may result from foreclosure, less cost for obtaining and selling the collateral,whether or not foreclosure is probable.
The carrying amount of the asset is reduced through the use of an allowance account and theamount of loss is charged to the statement of income as ‘Provision for credit and impairmentlosses’. Interest income continues to be recognized based on the original EIR of the asset.Financial assets, together with the associated allowance accounts, are written off when there is norealistic prospect of future recovery and all collateral has been realized. If subsequently, theamount of the estimated impairment loss decreases because of an event occurring after theimpairment was recognized, the previously recognized impairment loss is reduced by adjusting theallowance account. If a future write-off is later recovered, any amounts formerly charged arecredited to ‘Provision for credit and impairment losses’ in the profit or loss. If the Groupdetermines that no objective evidence of impairment exists for individually assessed loans andreceivables, whether significant or not, it includes the asset in a group of assets with similar creditrisk characteristics and collectively assesses for impairment in order to capture losses which theGroup believes has been incurred during the reporting period, but has not yet been identified tospecific financial assets. Financial assets that are individually assessed for impairment and forwhich an impairment loss is or continues to be recognized are not included in a collectiveassessment for impairment.

110 Robinsons Bank Annual Report 2016
NOTES TO financial STATEMENTS- 11 -
*SGVFS022572*
For the purpose of a collective evaluation of impairment, loans and receivables are grouped on thebasis of asset type, industry, collateral type, past-due status and other relevant factors. Thosegroupings reflect credit risk characteristics relevant to the estimation of future cash flows andindicative of the debtors’ ability to pay all amounts due according to the contractual terms of theloans and receivables being evaluated.
Future cash flows in a group of loans and receivables that are collectively evaluated forimpairment are estimated on the basis of historical loss experience for assets within the samecredit risk groupings. Historical loss experience is adjusted on the basis of current observable datato reflect the effects of current conditions. Estimates of changes in future cash flows reflectchanges in related observable data from year to year (such as changes in unemployment rates,property prices, payment status, or other factors that are indicative of incurred losses in the Bankand their magnitude). The methodology and assumptions used for estimating future cash flows arereviewed regularly by the Group to reduce any differences between loss estimates and actual lossexperience.
The Group also uses the Net Flow Rate method to determine the credit loss rate of a particulardelinquency age bucket based on historical data of flow-through and flow-back of loans acrossspecific delinquency age buckets.
The allowance for credit losses is determined based on the results of the net flow to write-offmethodology. Net flow tables are derived from monitoring of monthly peso movements betweendifferent stage buckets, from 1-day past due to 180-day past due. The net flow to write-offmethodology relies on the last 12 months of net flow tables to establish a percentage (‘net flowrate’) of receivables from customers that are current or in any state of delinquency (i.e., 30, 60, 90,120, 150 and 180 day past due) as of reporting date that will eventually result in write-off. Thegross provision is then computed based on the outstanding balances of the receivables as ofstatement of financial position date and the net flow rates determined for the current and eachdelinquency bucket. This gross provision is reduced by the estimated recoveries, which are alsobased on historical data, to arrive at the required allowance for credit losses.
If, in a subsequent period, the amount of the impairment loss decreases and the decrease can berelated objectively to an event occurring after the impairment was recognized, the previouslyrecognized impairment loss is reversed.
Any subsequent reversal of an impairment loss is recognized in the statement of income, to theextent that the carrying value of the asset does not exceed its amortized cost at the reversal date.
Restructured loansWhere possible, the Group seeks to restructure past due loans rather than take possession of therelated collateral. This may involve extending the payment arrangements and the agreement ofnew loan conditions. Once the terms have been renegotiated, any impairment is measured usingthe original EIR as calculated before the modification of terms and the loan is no longerconsidered past due.
Management continually reviews renegotiated loans to ensure that all criteria are met and thatfuture payments are likely to occur. The loans continue to be subject to an individual or collectiveimpairment assessment, calculated using the loan’s original EIR.

111Robinsons Bank Annual Report 2016
- 12 -
*SGVFS022572*
AFS investmentsFor equity securities classified as AFS investments, this would include a significant or prolongeddecline in the fair value of the investments below its cost. Where there is evidence of impairment,the cumulative loss-measured as the difference between the acquisition cost and the current fairvalue, less any impairment loss on that financial asset previously recognized in OCI is removedfrom OCI and recognized in the statement of income. Impairment losses on equity securities arenot reversed through the statement of income. Increases in fair value after impairment arerecognized directly in OCI.
For debt securities classified as AFS investments, impairment is assessed based on the samecriteria as financial assets carried at amortized cost. Future interest income from impaired AFSdebt securities is based on the reduced carrying amount and is accrued based on the original EIRused to discount future cash flows for the purpose of measuring impairment loss. Such accrual isrecorded as part of ‘Interest income’ in the statement of income. If subsequently, the fair value ofa debt security increased and the increase can be objectively related to an event occurring after theimpairment loss was recognized in the statement of income, the impairment loss is reversedthrough the statement of income.
Property and EquipmentLand is stated at cost less any impairment in value. Depreciable property and equipment arecarried at cost less accumulated depreciation and amortization, and any impairment in value.
The initial cost of property and equipment consists of its purchase price and any directlyattributable costs of bringing the asset to its working condition and location for its intended use.Expenditures incurred after the property and equipment have been put into operation, such asrepairs and maintenance, are normally charged against operations in the year the costs areincurred. In situations where it can be clearly demonstrated that the expenditures have resulted inan increase in the future economic benefits expected to be obtained from the use of property andequipment beyond its originally assessed standard of performance, the expenditures are capitalizedas an additional cost of property and equipment.
Depreciation and amortization is calculated using the straight-line method over the estimateduseful life of the depreciable assets. Leasehold improvements are amortized over the shorter ofthe terms of the covering leases and the estimated useful lives of the improvements.
The estimated useful lives of property and equipment follow:
Building 25 yearsTransportation equipment 5 yearsLeasehold improvements 5 yearsFurniture, fixtures and equipment 3 to 5 years
The useful lives and the depreciation and amortization method are reviewed periodically to ensurethat the period and the method of depreciation and amortization are consistent with the expectedpattern of economic benefits from the items of property and equipment.
The carrying values of the property and equipment are reviewed for impairment when events orchanges in circumstances indicate the carrying values may not be recoverable. If any suchindication exists and where the carrying values exceed the estimated recoverable amount, animpairment loss is recognized in the statement of income (see accounting policy on Impairment ofNon-financial Assets).

112 Robinsons Bank Annual Report 2016
NOTES TO financial STATEMENTS- 13 -
*SGVFS022572*
An item of property and equipment and any significant part initially recognized is derecognizedupon disposal or when no future economic benefits are expected from its use or disposal. Anygain or loss arising from derecognition of the asset (calculated as the difference between the netdisposal proceeds and the carrying amount of the asset) is included in the statement of income inthe year the asset is derecognized.
Investment in a SubsidiarySubsidiary pertains to entity over which the Parent Company has control. When the ParentCompany has less than a majority of the voting or similar rights of an investee, the ParentCompany considers all relevant facts and circumstances in assessing whether it has power over aninvestee, including:
∂ the contra arrangement with the other vote holders of the investee;∂ rights arising from other contractual arrangements; and∂ the Parent Company’s voting rights and potential voting rights.
Investment in a subsidiary in the separate financial statements is accounted for using the equitymethod. Under the equity method, the investment in a subsidiary is initially recognized at cost.The carrying amount of the investment is adjusted to recognize changes in the Group and theParent Company’s share of net assets of the subsidiary since the acquisition date. Goodwillrelating to the subsidiary is included in the carrying amount of the investment and is neitheramortized nor individually tested for impairment.
The statement of income reflects the Parent Company’s share of the results of operations of thesubsidiary. Any change in OCI of the investee is presented as part of the Group and the ParentCompany’s OCI. In addition, when there has been a change recognized directly in the equity ofthe subsidiary, the Parent Company recognizes its share of any changes, when applicable, in thestatement of changes in equity.
The aggregate of the Parent Company’s share of profit or loss of a subsidiary is shown on the faceof the statement of income under ‘Share in net income (loss) of a subsidiary’ and represents profitor loss after tax and non-controlling interests in the subsidiary.
The financial statements of the subsidiary are prepared for the same reporting period as the Group.When necessary, adjustments are made to bring the accounting policies in line with those of theGroup.
After application of the equity method, the Parent Company determines whether it is necessary torecognize an impairment loss on its investment in a subsidiary. At each statement of financialposition date, the Parent Company determines whether there is objective evidence that theinvestment in a subsidiary is impaired. If there is such evidence, the Parent Company calculatesthe amount of impairment as the difference between the recoverable amount of the subsidiary andits carrying value, then recognizes the loss in the statement of income.
Upon loss of control over the subsidiary, the Parent Company measures and recognizes anyretained investment at its fair value.
As of December 31, 2016 and 2015, the sole and wholly owned subsidiary of the Parent Companyis LSB.

113Robinsons Bank Annual Report 2016
- 14 -
*SGVFS022572*
Investment PropertiesInvestment properties are measured initially at cost, including transaction costs. Transaction costsrepresent nonrefundable taxes such as capital gains tax and documentary stamp tax that are for theaccount of the Group. An investment property acquired through an exchange transaction ismeasured at fair value of the asset acquired unless the fair value of such an asset cannot bemeasured in which case the investment property acquired is measured at the carrying amount ofasset given up. Foreclosed properties are classified as ‘Investment properties’ upon: a) entry ofjudgment in case of judicial foreclosure; b) execution of the Sheriff’s Certificate of Sale in case ofextra-judicial foreclosure; or c) notarization of the Deed of Dacion in case of dation in payment(dacion en pago).
The difference between the fair value of the asset acquired and the carrying amount of the assetgiven up is recognized as ‘Gain on initial recognition of investment properties’ under‘Miscellaneous income’ in the statement of income.
Subsequent to initial recognition, depreciable investment properties are carried at cost lessaccumulated depreciation and any impairment in value.
Investment properties are derecognized when they have either been disposed of or when they arepermanently withdrawn from use and no future benefit is expected from their disposal. Any gainsor losses on the retirement or disposal of an investment property are recognized in the statement ofincome under ‘Miscellaneous income’ in the year of retirement or disposal.
Expenditures incurred after the investment properties have been put into operations, such asrepairs and maintenance costs, are normally charged against income in the year in which the costsare incurred.
Depreciation is calculated on a straight-line basis using the remaining useful lives from the time ofacquisition of the investment properties but not to exceed ten (10) years for buildings andcondominium units.
Transfers are made to investment properties when, and only when, there is a change in useevidenced by ending of owner occupation, commencement of an operating lease to another partyor ending of construction or development. Transfers are made from investment properties when,and only when, there is a change in use evidenced by commencement of owner occupation orcommencement of development with a view to sale.
For a transfer from investment property to owner-occupied property, the deemed cost of propertyfor subsequent accounting is its fair value at the date of change in use. If the property occupied bythe Group as an owner-occupied property becomes an investment property, the Group accounts forsuch property in compliance with the policy stated under property and equipment up to the date ofchange in use.
Other Assets - Repossessed ChattelsRepossessed chattels represent other properties acquired in settlement of loan receivablescomprising mainly of repossessed vehicles. Repossessed chattels are stated at cost lessaccumulated depreciation and impairment in value. Depreciation is calculated on a straight-linebasis using the remaining useful lives of the vehicles from the time of acquisition. The usefullives of repossessed chattels are estimated to be three (3) to five (5) years.

114 Robinsons Bank Annual Report 2016
NOTES TO financial STATEMENTS- 15 -
*SGVFS022572*
Business Combinations and GoodwillBusiness combinations are accounted for using the purchase method of accounting. This involvesrecognizing identifiable assets (including previously unrecognized intangible assets) and liabilities(including contingent liabilities but excluding future restructuring) of the acquired business at fairvalue. Any excess of the cost of acquisition over the fair values of the identifiable net assetsacquired is recognized as goodwill. If the cost of acquisition is less than the fair values of theidentifiable net assets acquired, the discount on acquisition is recognized directly in the statementof income in the year of acquisition.
Goodwill acquired in a business combination is initially measured at cost being the excess of thecost of the business combination over the Parent Company’s interest in the net fair value of theidentifiable assets, liabilities and contingent liabilities acquired.
Following initial recognition, goodwill is measured at cost less any accumulated impairmentlosses. Goodwill is reviewed for impairment annually, or more frequently, if event or changes incircumstances indicate that the carrying value may be impaired.
For the purpose of impairment testing, goodwill acquired in a business combination is, from theacquisition date, allocated at each of the Parent Company’s cash-generating units (CGUs) or groupof CGUs, which are expected to benefit from the synergies of the combination, irrespective ofwhether other assets or liabilities of the acquiree are assigned to those units. Each unit to whichthe goodwill is allocated represents the lowest level within the Group at which the goodwill ismonitored for internal management purposes, and is not larger that an operating segment inaccordance with PFRS 8, Operating Segments.
Where goodwill has been allocated to a CGU and part of the operation within the unit is disposedof, the goodwill associated with the operation is included in the carrying amount of the operationwhen determining the gain or loss on disposal. Goodwill disposed of in these circumstances ismeasured based on the relative values of the disposed operation and the portion of the CGUretained.
When subsidiaries are sold, the difference between the selling price and net assets plus cumulativetranslation differences and goodwill is recognized in the statement of income.
Intangible AssetsIntangible assets acquired separately are measured on initial recognition at cost. The cost ofintangible assets acquired in a business combination is its fair value as at the date of acquisition.Following initial recognition, intangible assets are carried at cost less any accumulatedamortization and any accumulated impairment losses. Internally generated intangible assets,excluding capitalized development costs, are not capitalized and expenditure is reflected in thestatement of income in the year in which the expenditure is incurred.
The useful lives of intangible assets are assessed to be either finite or indefinite. Intangible assetswith finite lives are amortized over the useful economic life and assessed for impairmentwhenever there is an indication that the intangible assets may be impaired. The amortizationperiod and the amortization method for an intangible asset with a finite useful life are reviewed atleast at each statement of financial position date. Changes in the expected useful life or theexpected pattern of consumption of future economic benefits embodied in the asset are accountedfor by changing the amortization period or method, as appropriate, and treated as change inaccounting estimates. The amortization expense on intangible assets with finite lives isrecognized in the statement of income consistent with the function of the intangible asset.
115Robinsons Bank Annual Report 2016
- 16 -
*SGVFS022572*
Intangible assets with indefinite useful lives are tested for impairment annually either individuallyor at the CGU level. Such intangibles are not amortized. The useful life of an intangible assetwith an indefinite life is reviewed annually to determine whether indefinite life assessmentcontinues to be supportable. If not, the change in the useful life assessment from indefinite tofinite is made on a prospective basis.
Gains or losses arising from the derecognition of an intangible asset are measured as the differencebetween the net disposal proceeds and the carrying amount of the asset and are recognized in thestatement of income when the asset is derecognized.
Branch licensesBranch licenses arise from the acquisition of branches of a local bank by the Parent Company.The Parent Company’s branch licenses have indefinite useful lives and are subject to annualindividual impairment testing. These are tested for impairment annually either individually or atthe CGU level. Such intangibles are not amortized. The useful life is reviewed annually todetermine whether indefinite useful life assessment continues to be supportable. If not, the changein the useful life from indefinite to finite is made on a prospective basis.
Software costsSoftware costs are carried at cost less accumulated amortization and any impairment loss.Software costs are amortized on a straight-line basis over the estimated useful life which rangesfrom three (3) to seven (7) years.
Impairment of Non-financial AssetsProperty and equipment, investment in a subsidiary, investment properties and repossessedchattelsAt each statement of financial position date, the Group assesses whether there is any indicationthat its non-financial assets may be impaired. When an indicator of impairment exists or when anannual impairment testing for an asset is required, the Group makes a formal estimate ofrecoverable amount.
Recoverable amount is the higher of an asset’s (or CGU’s) fair value less costs to sell and its valuein use and is determined for an individual asset, unless the asset does not generate cash inflowsthat are largely independent of those from other assets or groups of assets, in which case therecoverable amount is assessed as part of the CGU to which it belongs. Where the carryingamount of an asset (or CGU) exceeds its recoverable amount, the asset (or CGU) is consideredimpaired and is written down to its recoverable amount. In assessing value in use, the estimatedfuture cash flows are discounted to their present value using a pre-tax discount rate that reflectscurrent market assessments of the time value of money and the risks specific to the asset (orCGU).
An impairment loss is charged to operations in the year in which it arises. An assessment is madeat each statement of financial position date as to whether there is any indication that previouslyrecognized impairment losses may no longer exist or may have decreased. If such indicationexists, the recoverable amount is estimated. A previously recognized impairment loss is reversedonly if there has been a change in the estimates used to determine the asset’s recoverable amountsince the last impairment loss was recognized. If that is the case, the carrying amount of the asset(or CGU) is increased to its recoverable amount. That increased amount cannot exceed thecarrying amount that would have been determined, net of depreciation and amortization, had noimpairment loss been recognized for the asset in prior years. Such reversal is recognized in thestatement of income unless the asset (or CGU) is carried at a revalued amount, in which case thereversal is treated as a revaluation increase. After such a reversal, the depreciation and

116 Robinsons Bank Annual Report 2016
NOTES TO financial STATEMENTS- 17 -
*SGVFS022572*
amortization expense is adjusted in future years to allocate the asset’s revised carrying amount,less any residual value, on a systematic basis over its remaining life.
Intangible assetsIntangible assets with indefinite useful lives are tested for impairment annually at the statement offinancial position date either individually or at the CGU level, as appropriate. Intangible assetswith finite lives are assessed for impairment whenever there is an indication that the intangibleasset may be impaired.
Revenue Recognition Revenue is recognized to the extent that it is probable that future economic benefits will flow to
the Group and the revenue can be reliably measured, regardless of when the payment is beingmade. The Group concluded that it is acting as a principal in all of its revenue arrangementsexcept for commission income arrangements. The following specific recognition criteria mustalso be met before revenue is recognized:
Interest incomeFor all financial instruments measured at amortized cost and interest-bearing financial instruments,interest income is recorded at the EIR, which is the rate that exactly discounts estimated futurecash payments or receipts through the expected life of the financial instrument or a shorter period,where appropriate, to the net carrying amount of the financial asset or financial liability. Thecalculation takes into account all contractual terms of the financial instrument (for example,prepayment options), includes any fees or incremental costs that are directly attributable to theinstrument and are an integral part of the EIR, but not future credit losses.
The carrying amount of the financial asset or financial liability is adjusted if the Group revises itsestimates of payments or receipts. The adjusted carrying amount is calculated based on theoriginal EIR and the change in carrying amount is recorded as ‘Interest income’.
Once the recorded value of a financial asset or group of similar financial assets has been reduceddue to an impairment loss, interest income continues to be recognized using the original EIRapplied to the new carrying amount.
Interest income - finance leaseThe excess of aggregate lease rentals plus the estimated residual value over the cost of the leasedinvestment property constitutes the unearned lease income. Residual values represent estimatedproceeds from the disposal of investment property at the time lease is estimated. The unearnedlease income is amortized over the term of the lease, commencing on the month the lease isexecuted using the EIR method.
Unearned lease income ceases to be amortized when the lease contract receivables become pastdue for more than three months.
Service fees and commission incomeFees earned for the provision of services over a period of time are accrued over that period. Thesefees include investment fund fees, custodian fees, fiduciary fees, portfolio fees, credit-related feesand other service and management fees. Fees on deposit-related accounts are recognized onlyupon collection or accrued when there is reasonable degree of certainty as to its collection.
Dividend incomeDividend income, included in ‘Miscellaneous income’, is recognized when the Group’s right toreceive payment is established.
117Robinsons Bank Annual Report 2016
- 18 -
*SGVFS022572*
Trading and securities gain (loss) - netTrading and securities gain (loss) - net represents results arising from disposal of AFS investmentsand trading activities including all gains and losses from changes in fair value of financial assets atFVPL.
Rental incomeRental income arising from leased properties is accounted for on a straight-line basis over thelease terms on ongoing leases and is recorded in the statement of income under ‘Miscellaneousincome’.
Income from sale of property and equipment, investment property and repossessed chattelsIncome from sale of property and equipment, investment property and repossessed chattels isrecognized upon completion of the earning process and the collectability of the sales price isreasonably assured.
Other incomeOther income is recognized when earned and is recorded under ‘Miscellaneous income’ in thestatement of income.
Expense RecognitionExpenses are recognized when it is probable that decrease in future economic benefits related tothe decrease in asset or an increase in liability has occurred and that the decrease in economicbenefits can be measured reliably. Expenses that may arise in the course of ordinary regularactivities of the Group include, among others, the operating expenses on the Group’s operation.
Operating expensesOperating expenses constitute costs which arise in the normal business operation and arerecognized when incurred.
Taxes and licensesThis includes all other taxes, local and national, including gross receipts taxes (GRT),documentary stamp taxes, real estate taxes, licenses and permit fees and are recognized whenincurred.
Borrowing CostBorrowing costs are capitalized if they are directly attributable to the acquisition of a qualifyingasset. Capitalization of borrowing costs commences when the activities to prepare the qualifyingassets are in progress and expenditures and borrowing costs are incurred. Borrowing costs arecapitalized until the qualifying assets are substantially ready for their intended use. All otherborrowing costs are expensed as incurred.
LeasesThe determination of whether an arrangement is, or contains a lease is based on the substance ofthe arrangement and requires an assessment of whether the fulfillment of the arrangement isdependent on the use of a specific asset or assets and the arrangement conveys a right to use theasset. A reassessment is made after inception of the lease only if one of the following applies:
a. there is a change in contractual terms, other than a renewal or extension of the arrangement;b. a renewal option is exercised or extension granted, unless that term of the renewal or
extension was initially included in the lease term;

118 Robinsons Bank Annual Report 2016
NOTES TO financial STATEMENTS- 19 -
*SGVFS022572*
c. there is a change in the determination of whether fulfillment is dependent on a specified asset;or
d. there is a substantial change to the asset.
Where a reassessment is made, lease accounting shall commence or cease from the date when thechange in circumstances gave rise to the reassessment for scenarios (a), (c) or (d) above, and at thedate of renewal or extension period for scenario (b).
Group as lesseeLeases where the lessor retains substantially all the risks and benefits of ownership of the asset areclassified as operating leases. Any rental payments are accounted for on a straight-line basis overthe lease term and included in ‘Occupancy and equipment-related costs’ in the statement ofincome.
Group as lessorFinance leases, where the Group transfers substantially all the risks and benefits incidental toownership of the leased item to the lessee, are included in the statement of financial position under‘Loans and receivables’ account. A lease receivable is recognized at an amount equal to the netinvestment in the lease. All income resulting from the receivables is included in ‘Interest incomeon loans and receivables’ in the statement of income.
Leases where the Group does not transfer substantially all the risks and benefits of ownership ofthe assets are classified as operating leases. Initial direct costs incurred in negotiating operatingleases are added to the carrying amount of the leased asset and recognized over the lease term onthe same basis as the rental income. Contingent rents are recognized as revenue in the year inwhich they are earned.
Retirement CostThe Group has a non-contributory defined benefit retirement plan. The retirement cost of theGroup is actuarially determined using the projected unit credit method. Under this method, thecurrent service cost is the present value of retirement benefits payable in the future with respect toservices rendered in the current period.
The net defined benefit liability or asset is the aggregate of the present value of the defined benefitobligation at the end of the reporting period reduced by the fair value of plan assets (if any),adjusted for any effect of limiting a net defined benefit asset to the asset ceiling. The asset ceilingis the present value of any economic benefits available in the form of refunds from the plan orreductions in future contributions to the plan.
The cost of providing benefits under the defined benefit plans is actuarially determined using theprojected unit credit method.
Defined benefit costs comprise the following:∂ Service cost∂ Net interest on the net defined benefit liability or asset∂ Remeasurements of net defined benefit liability or asset
Service costs which include current service costs, past service costs and gains or losses on non-routine settlements are recognized as expense in the statement of income. Past service costs arerecognized when plan amendment or curtailment occurs. These amounts are calculatedperiodically by independent qualified actuaries.
119Robinsons Bank Annual Report 2016
- 20 -
*SGVFS022572*
Net interest on the net defined benefit liability or asset is the change during the period in the netdefined benefit liability or asset that arises from the passage of time which is determined byapplying the discount rate based on government bonds to the net defined benefit liability or asset.Net interest on the net defined benefit liability or asset is recognized as expense or income in thestatement of income.
Remeasurements comprising actuarial gains and losses, return on plan assets and any change inthe effect of the asset ceiling (excluding net interest on defined benefit liability) are recognizedimmediately in OCI in the period in which they arise. Remeasurements are not reclassified toprofit or loss in subsequent periods.
Plan assets are assets that are held by a long-term employee benefit fund or qualifying insurancepolicies. Plan assets are not available to the creditors of the Group, nor can they be paid directlyto the Group. Fair value of plan assets is based on market price information. When no marketprice is available, the fair value of plan assets is estimated by discounting expected future cashflows using a discount rate that reflects both the risk associated with the plan assets and thematurity or expected disposal date of those assets (or, if they have no maturity, the expectedperiod until the settlement of the related obligations). If the fair value of the plan assets is higherthan the present value of the defined benefit obligation, the measurement of the resulting definedbenefit asset is limited to the present value of economic benefits available in the form of refundsfrom the plan or reductions in future contributions to the plan.
The Group’s right to be reimbursed of some or all of the expenditure required to settle a definedbenefit obligation is recognized as a separate asset at fair value when and only whenreimbursement is virtually certain.
Termination benefitTermination benefits are employee benefits provided in exchange for the termination of anemployee’s employment as a result of either an entity’s decision to terminate an employee’semployment before the normal retirement date or an employee’s decision to accept an offer ofbenefits in exchange for the termination of employment.
A liability and expense for a termination benefit is recognized at the earlier of when the entity canno longer withdraw the offer of those benefits and when the entity recognizes related restructuringcosts. Initial recognition and subsequent changes to termination benefits are measured inaccordance with the nature of the employee benefit, as either post-employment benefits, short-term employee benefits, or other long-term employee benefits.
ProvisionsProvisions are recognized when the Group has a present obligation (legal or constructive) as aresult of a past event and it is probable that an outflow of assets embodying economic benefits willbe required to settle the obligation and a reliable estimate can be made of the amount of theobligation. Where the Group expects some or all of a provision to be reimbursed, for example,under an insurance contract, the reimbursement is recognized as a separate asset but only when thereimbursement is virtually certain. The expense relating to any provision is presented in thestatement of income, net of any reimbursement. If the effect of the time value of money ismaterial, provisions are determined by discounting the expected future cash flows at a pre-tax ratethat reflects current market assessments of the time value of money and, where appropriate, therisks specific to the liability. Where discounting is used, the increase in the provision due to thepassage of time is recognized as ‘Interest expense’ in the statement of income.

120 Robinsons Bank Annual Report 2016
NOTES TO financial STATEMENTS- 21 -
*SGVFS022572*
Contingent Liabilities and Contingent AssetsContingent liabilities are not recognized in the financial statements but are disclosed unless thepossibility of an outflow of assets embodying economic benefits is remote. Contingent assets arenot recognized but are disclosed in the financial statements when an inflow of economic benefitsis probable.
Income TaxesCurrent taxCurrent tax assets and liabilities for the current period are measured at the amount expected to berecovered from or paid to the taxation authorities. The tax rates and tax laws used to compute theamount are those that are enacted or substantively enacted, at the statement of financial positiondate.
Deferred taxDeferred tax is provided using the liability method on temporary differences between the tax basesof assets and liabilities and their carrying amounts for financial reporting purposes at the reportingdate.
Deferred tax liabilities are recognized for all taxable temporary differences, except:∂ When the deferred tax liability arises from the initial recognition or an asset or liability in a
transaction that is not a business combination and, at the time of the transaction, affectsneither the accounting profit nor taxable profit or loss; and
∂ In respect of taxable temporary differences associated with investments in subsidiaries,associates and interests in joint ventures, when the timing of the reversal of the temporarydifferences can be controlled and it is probable that the temporary differences will not reversein the foreseeable future.
Deferred tax assets are recognized for all deductible temporary differences, the carry forward ofunused tax credits and any unused tax losses. Deferred tax assets are recognized to the extent thatit is probable that taxable profit will be available against which the deductible temporarydifferences and the carry forward of unused tax credits and unused tax losses can be utilized,except:∂ When the deferred tax asset relating to the deductible temporary differences arises from the
initial recognition of an asset or liability in a transaction that is not a business combinationand, at the time of the transaction, affects neither the accounting profit nor taxable profit orloss; and
∂ In respect of deductible temporary differences associated with investment in subsidiaries,associates and interest in joint ventures, deferred tax assets are recognized only to the extentthat it is probable that the temporary differences will reverse in the foreseeable future andtaxable profit will be available against which the temporary differences can be utilized.
The carrying amount of deferred tax assets is reviewed at each statement of financial position dateand reduced to the extent that it is no longer probable that sufficient future taxable income will beavailable to allow all or part of the deferred tax assets to be utilized. Unrecognized deferred taxassets are reassessed at each statement of financial position date and are recognized to the extentthat it has become probable that future taxable income will allow the deferred tax asset to berecovered.
Deferred tax assets and liabilities are measured at the tax rates that are expected to apply in theyear when the asset is realized or the liability is settles, based on the tax rates (and tax laws) thathave been enacted or substantively enacted at the reporting date.

121Robinsons Bank Annual Report 2016
- 22 -
*SGVFS022572*
Deferred tax relating to items recognized outside profit or loss is recognized outside profit or loss.Deferred tax items are recognized in correlation to the underlying transactions either in OCI ordirectly in equity.
Deferred tax assets and deferred tax liabilities are offset if a legally enforceable right exists tocurrent tax assets against current tax liabilities and the deferred taxes relate to the same taxableentity and same taxation authority.
Tax benefits acquired as part of a business combination, but not satisfying criteria for separaterecognition at that date, are recognized subsequently if new information about facts andcircumstances change. The adjustment is either treated as a reduction in goodwill (as long as itdoes not exceed goodwill) if it was incurred during the measurement period or recognized in profitor loss.
Events after the Reporting PeriodPost year-end events that provide additional information about the Group’s position at thestatement of financial position date (adjusting events) are reflected in the consolidated financialstatements. Post year-end events that are not adjusting events are disclosed in the notes to theconsolidated financial statements when material.
Standards Issued but not yet Effective
Standards and interpretations issued but not yet effective up to the date of issuance of the Group’sfinancial statements are listed below. This listing consists of standards and interpretations issued,which the Group reasonably expects to be applicable at a future date. The Group intends to adoptthese standards when they become effective. Except as otherwise indicated, the Group does notexpect the adoption of these new and amended PAS, PFRS and Philippine Interpretations to havesignificant impact on the consolidated financial statements.
Effective beginning on or after January 1, 2017Amendment to PFRS 12, Clarification of the Scope of the Standard (Part of Annual Improvementsto PFRSs 2014 - 2016 Cycle)The amendments clarify that the disclosure requirements in PFRS 12, other than those relating tosummarized financial information, apply to an entity’s interest in a subsidiary, a joint venture oran associate (or a portion of its interest in a joint venture or an associate) that is classified (orincluded in a disposal group that is classified) as held for sale.
The amendments do not have any impact on the Group’s financial position and results ofoperation. The Group will include the required disclosures in its 2017 financial statements.
Amendments to PAS 7, Statement of Cash Flows, Disclosure InitiativeThe amendments to PAS 7 require an entity to provide disclosures that enable users of financialstatements to evaluate changes in liabilities arising from financing activities, including bothchanges arising from cash flows and non-cash changes (such as foreign exchange gains or losses).On initial application of the amendments, entities are not required to provide comparativeinformation for preceding periods. Early application of the amendments is permitted.
Application of amendments will result in additional disclosures in the 2017 financial statements ofthe Company.

122 Robinsons Bank Annual Report 2016
NOTES TO financial STATEMENTS- 23 -
*SGVFS022572*
Amendments to PAS 12, Income Taxes, Recognition of Deferred Tax Assets for Unrealized LossesThe amendments clarify that an entity needs to consider whether tax law restricts the sources oftaxable profits against which it may make deductions on the reversal of that deductible temporarydifference. Furthermore, the amendments provide guidance on how an entity should determinefuture taxable profits and explain the circumstances in which taxable profit may include therecovery of some assets for more than their carrying amount.
Entities are required to apply the amendments retrospectively. However, on initial application ofthe amendments, the change in the opening equity of the earliest comparative period may berecognized in opening retained earnings (or in another component of equity, as appropriate),without allocating the change between opening retained earnings and other components of equity.Entities applying this relief must disclose that fact. Early application of the amendments ispermitted.
Effective beginning on or after January 1, 2018PFRS 9, Financial Instruments (2014 or final version)In July 2014, the final version of PFRS 9, Financial Instruments, was issued. PFRS 9 reflects allphases of the financial instruments project and replaces PAS 39, Financial Instruments:Recognition and Measurement, and all previous versions of PFRS 9. The standard introduces newrequirements for classification and measurement, impairment, and hedge accounting. PFRS 9 iseffective for annual periods beginning on or after January 1, 2018, with early applicationpermitted. Retrospective application is required, but comparative information is not compulsory.For hedge accounting, the requirements are generally applied prospectively, with some limitedexceptions.
The adoption of PFRS 9 will have an effect on the classification and measurement of the Group’sfinancial assets and impairment methodology for financial assets, but will have no impact on theclassification and measurement of the Group’s financial liabilities. The Group will quantify thiseffect to present a comprehensive picture of the impact of adoption on the financial position orperformance of the Group.
PFRS 15, Revenue from Contracts with CustomersPFRS 15 establishes a new five-step model that will apply to revenue arising from contracts withcustomers. Under PFRS 15, revenue is recognized at an amount that reflects the consideration towhich an entity expects to be entitled in exchange for transferring goods or services to a customer.The principles in PFRS 15 provide a more structured approach to measuring and recognizingrevenue. The new revenue standard is applicable to all entities and will supersede all currentrevenue recognition requirements under PFRSs. Either a full or modified retrospective applicationis required for annual periods beginning on or after January 1, 2018. The Group is currentlyassessing the impact of PFRS 15 and plans to adopt the new standard on the required effectivedate once adopted locally.
Effective beginning on or after January 1, 2019PFRS 16, LeasesUnder the new standard, lessees will no longer classify their leases as either operating or financeleases in accordance with PAS 17, Leases. Rather, lessees will apply the single-asset model.Under this model, lessees will recognize the assets and related liabilities for most leases on theirbalance sheets, and subsequently, will depreciate the lease assets and recognize interest on thelease liabilities in their profit or loss. Leases with a term of 12 months or less or for which theunderlying asset is of low value are exempted from these requirements. The accounting by lessorsis substantially unchanged as the new standard carries forward the principles of lessor accountingunder PAS 17. Lessors, however, will be required to disclose more information in their financial
123Robinsons Bank Annual Report 2016
- 24 -
*SGVFS022572*
statements, particularly on the risk exposure to residual value. Entities may early adopt PFRS 16but only if they have also adopted PFRS 15. When adopting PFRS 16, an entity is permitted touse either a full retrospective or a modified retrospective approach, with options to use certaintransition reliefs. The Group is currently assessing the impact of adopting PFRS 16.
The following amendments to standards issued by the International Accounting Standards Boardwere already adopted by the Financial Reporting Standards Council (FRSC) but are still forapproval by the Board of Accountancy.
Deferred effectivityAmendments to PFRS 10 and PAS 28, Sale or Contribution of Assets between an Investor and itsAssociate or Joint VentureThe amendments address the conflict between PFRS 10 and PAS 28 in dealing with the loss ofcontrol of a subsidiary that is sold or contributed to an associate or joint venture. The amendmentsclarify that a full gain or loss is recognized when a transfer to an associate or joint ventureinvolves a business as defined in PFRS 3, Business Combinations. Any gain or loss resulting fromthe sale or contribution of assets that does not constitute a business, however, is recognized only tothe extent of unrelated investors’ interests in the associate or joint venture.
On January 13, 2016, the Financial Reporting Standards Council postponed the original effectivedate of January 1, 2016 of the said amendments until the International Accounting StandardsBoard has completed its broader review of the research project on equity accounting that mayresult in the simplification of accounting for such transactions and of other aspects of accountingfor associates and joint ventures.
Philippine Interpretation IFRIC 15, Agreements for the Construction of Real EstateThis interpretation covers accounting for revenue and associated expenses by entities thatundertake the construction of real estate directly or through subcontractors. The SEC and theFRSC have deferred the effectivity of this interpretation.
3. Significant Accounting Judgments and Estimates
The preparation of the Group’s consolidated financial statements requires the management of theGroup and the Parent Company to make judgments, estimates and assumptions that affect thereported amounts of assets, liabilities, income and expenses and the disclosures of contingentassets and contingent liabilities at the statement of financial position date. Future events mayoccur which can cause the assumptions used in arriving at the estimates to change. The effects ofany change in estimates are reflected in the financial statements as they become reasonablydeterminable.
Judgments and estimates are continually evaluated and are based on historical experience andother factors, including expectations of future events that are believed to be reasonable under thecircumstances.

124 Robinsons Bank Annual Report 2016
NOTES TO financial STATEMENTS- 25 -
*SGVFS022572*
The following are the critical judgments and key assumptions that have a significant risk ofmaterial adjustment to the carrying amounts of assets and liabilities within the next financial year:
Judgmentsa) HTM investments
The classification under HTM investments requires significant judgment. In making thisjudgment, the Group evaluates its intention and ability to hold such investments to maturity.If the Group fails to keep these investments to maturity other than in certain specificcircumstances, as discussed in Note 2, it will be required to reclassify the entire portfolio asAFS investments. The investments would therefore be measured at fair value and not atamortized cost.
b) LeasesOperating leaseGroup as lessorThe Group has entered into commercial property leases on its investment property portfolio.The Group has determined based on the evaluation of the terms and conditions of thearrangements (i.e., the lease does not transfer the ownership of the asset to the lessee by theend of the lease term, the lessee has no option to purchase the asset at a price that is expectedto be sufficiently lower than the fair value at the date the option is exercisable and the leaseterm is not for the major part of the asset’s economic life), that it retains all the significantrisks and rewards of ownership of these properties which are leased and so accounts for thecontracts as operating leases.
Group as lesseeThe Group has entered into commercial property leases for its head office and branchpremises. The Group has determined, based on the evaluation of the terms and conditions ofthe lease agreement (i.e., the lease does not transfer ownership of the asset to the lessee by theend of the lease term and lease term is not for the major part of the asset’s economic life), thatthe lessor retains all the significant risks and rewards of ownership of the properties which areleased out on operating leases.
c) Fair value of financial instrumentsWhere the fair values of financial assets and financial liabilities recorded in the statement offinancial position cannot be derived from active markets, these are determined using internalvaluation techniques using generally accepted market valuation models. The inputs to thesemodels are taken from observable markets where possible, but where this is not feasible, adegree of judgment is required in establishing fair values.
These judgments may include consideration of liquidity and model inputs such as correlationand volatility for longer dated derivatives (see Note 5).
d) Financial assets not quoted in an active marketThe Group classifies financial assets by evaluating, among others, whether the asset is quotedor not in an active market. Included in the evaluation on whether a financial asset is quoted inan active market is the determination on whether quoted prices are readily and regularlyavailable, and whether those prices represent actual and regularly occurring markettransactions on an arm’s length basis.
125Robinsons Bank Annual Report 2016
- 26 -
*SGVFS022572*
e) Commitments and ContingenciesThe Group is currently involved in legal proceedings. The estimate of the probable cost forthe resolution of claims has been developed in consultation with the aid of the outside legalcounsel handling the Group’s defense in this matter and is based upon an analysis of potentialresults. Management does not believe that the outcome of this matter will affect the results ofoperations.
It is probable, however, that future results of operations could be materially affected bychanges in the estimates or in the effectiveness of the strategies relating to these proceedings(see Note 26).
f) Functional currencyPAS 21, The Effects of Changes in Foreign Exchange Rates, requires management to use itsjudgment to determine the entity’s functional currency such that it most faithfully representsthe economic effects of the underlying transactions, events and conditions that are relevant tothe entity. In making this judgment, the Group considers the following:∂ the currency that mainly influences sales prices for financial instruments and services
(this will often be the currency in which sales prices for its financial instruments andservices are denominated and settled);
∂ the currency in which funds from financing activities are generated; and∂ the currency in which receipts from operating activities are usually retained.
Estimatesa) Credit losses on loans and receivables
The Group reviews its loans and receivables at each statement of financial position date toassess whether a credit loss should be recorded in the statement of income. In particular,judgment by management is required in the estimation of the amount and timing of future cashflows when determining the level of allowance required. Such estimates are based onassumptions about a number of factors and actual results may differ, resulting in futurechanges to the allowance.
The carrying values of and allowance for credit losses on loans and receivables of the Groupand of the Parent Company as of December 31, 2016 and 2015 are disclosed in Note 8.
b) Impairment of AFS debt securitiesThe Group reviews its debt securities classified as AFS investments at each statement offinancial position date to assess whether they are impaired. This requires similar judgmentapplied to the individual assessment of loans and receivables.
The carrying values of AFS debt securities of the Group and of the Parent Company as ofDecember 31, 2016 and 2015 are disclosed in Note 7.
c) Impairment of AFS equity securitiesThe Group treats AFS equity securities as impaired when there has been a significant orprolonged decline in the fair value below its cost or where other objective evidence ofimpairment exists. The determination of what is ‘significant’ or ‘prolonged’ requiresjudgment. The Group treats ‘significant’ generally as 20.00% or more and ‘prolonged’ greaterthan twelve (12) months. In addition, the Group evaluates other factors, including normalvolatility in share prices for quoted equities and the future cash flows and discount factors forunquoted equity investments.

126 Robinsons Bank Annual Report 2016
NOTES TO financial STATEMENTS- 27 -
*SGVFS022572*
The carrying values of AFS equity securities of the Group and of the Parent Company as ofDecember 31, 2016 and 2015 are disclosed in Note 7.
d) Valuation of unquoted equity securitiesThe Group’s investments in equity securities that do not have quoted market price in an activemarket and whose fair value cannot be reliably measured are carried at cost less impairmentlosses.
The carrying values of unquoted AFS equity securities of the Group and of the ParentCompany as of December 31, 2016 and 2015 are disclosed in Note 7.
e) Impairment of non-financial assetsInvestment properties and repossessed chattelsThe Group assesses impairment on investment properties and repossessed chattels wheneverevents or changes in circumstances indicate that the carrying amount of an asset may not berecoverable. The factors that the Group considers important which could trigger animpairment review include the following:a. significant underperformance relative to expected historical or projected future operating
results;b. significant changes in the manner of use of the acquired assets or the strategy for overall
business; andc. significant negative industry or economic trends.
An impairment loss is recognized whenever the carrying amount of an asset exceeds itsrecoverable amount. The recoverable amount is computed using the fair value less costs tosell for investment properties and repossessed chattels. Recoverable amounts are estimatedfor individual assets or, if it is not possible, for the Cash Generating Unit (CGU) to which theasset belongs.
The Bank’s reversal for allowance for impairment losses pertains to increase in recoverableamount of its investment properties which has been determined based on its fair value lesscost to sell, using valuation techniques as discussed in Note 5.
The carrying values of and the allowance for impairment losses, if any, on investmentproperties and repossessed chattels of the Group and of the Parent Company are disclosed inNotes 11, 13 and 14, respectively.
Branch licensesBranch license is considered an intangible asset with an indefinite useful life and it is requiredto be tested for impairment annually by comparing its carrying amount with its recoverableamount, irrespective of whether there is any indication that it may be impaired.
When the branch license’s fair value less cost of disposal is lower than its carrying amount,the Group’s impairment test is based on value in use calculations that use a discounted cashflow model. The cash flows are derived from the budget for the next five (5) years and do notinclude restructuring activities that the Group is not yet committed to or significant futureinvestments that will enhance the asset base of the CGU being tested. The recoverableamount is most sensitive to the discount rate used for the discounted cash flow model as wellas the expected future cash-inflows and the growth rate used for extrapolation purposes.
127Robinsons Bank Annual Report 2016
- 28 -
*SGVFS022572*
No additional impairment was recognized for the Group’s branch licenses in 2016 and 2015.The carrying amounts of branch licenses as of December 31, 2016 and 2015 approximate theirrespective fair values less cost to sell. The carrying values of and allowance for impairmentlosses on branch licenses of the Group are disclosed in Note 12.
GoodwillGoodwill is reviewed for impairment, annually or more frequently if events of changes incircumstances indicate that the carrying value may be impaired. Impairment is determined forgoodwill by assessing the recoverable amount of the CGU (or group of CGUs) to which thegoodwill relates. Where the recoverable amount of the CGU (or group of CGUs) is less thanthe carrying amount of the CGU (or group of CGUs) to which goodwill has been allocated, animpairment loss is recognized immediately in the statement of income. The Group estimatedthe discount rate used for the computation of the net present value be referenced to industrycost of capital. Future cash flows from the business are estimated based on the theoreticalannual income of the CGUs. Average growth rate was derived from the average increase inannual income during the last five (5) years. The recoverable amount of the CGU has beendetermined based on a value in use calculations using cash flow projections from financialbudgets approve by senior management covering a five-year period. The applicable pre-taxdiscount rate applied to cash flow projections is 9.95% both in 2016 and 2015, respectively.Key assumptions in value in use calculation of CGUs are most sensitive to discount rates andgrowth rates used to project cash flows.
The carrying values of goodwill of the Group are disclosed in Note 9.
f) Recognition of deferred taxesDeferred tax assets are recognized for all unused tax losses to the extent that it is probable thattaxable profit will be available against which the losses can be utilized. Significantmanagement judgment is required to determine the amount of deferred tax assets that can berecognized, based upon the likely timing and level of future taxable profits together withfuture tax planning strategies.
The estimates of future taxable income indicate that certain temporary differences will berealized in the future. Details of recognized and unrecognized deferred tax on temporarydifferences are disclosed in Note 23.
g) Present value of retirement liabilityThe cost of defined benefit retirement plan and other post-employment benefits is determinedusing actuarial valuations. The actuarial valuation involves making assumptions aboutdiscount rates, future salary increases, mortality rates and future pension increases. Due to thelong-term nature of these plans, such estimates are subject to significant uncertainty.
The assumed discount rates were determined using market yields on Philippine governmentbonds with terms consistent with the expected employee benefit payouts as of the statement offinancial position date.
The present values of the Group and the Parent Company’s defined benefit obligation as ofDecember 31, 2016 and 2015 are disclosed in Note 20.

128 Robinsons Bank Annual Report 2016
NOTES TO financial STATEMENTS- 29 -
*SGVFS022572*
4. Financial Risk Management Objectives and Polices
The main risks arising from the Group’s financial instruments are credit, market and liquidityrisks. In general, the Group’s risk management objective is to ensure that risks taken are withinthe Group’s risk appetite, which is assessed based on the Group’s capital adequacy framework.The risk management process involves risk identification, measurement, monitoring and control.
The Group recognizes that risk management is the responsibility of the entire organization.Accordingly, all employees are expected to manage risks relating to their own responsibilities.Still, there are specialized entities within the Group that perform certain risk managementfunctions.
The Board of Directors (BOD) ultimately oversees and approves significant matters related to riskmanagement throughout the Parent Company, upon the review and recommendation of variouscommittees composed of members of the BOD and Senior Management. Among the ParentCompany’s committees are:∂ the Corporate Governance Committee, which ensures the BOD’s effectiveness and due
observance of the corporate governance principles and guidelines;∂ the Risk Management Committee (RMC), which is responsible for the development and
oversight of the Parent Company’s risk management program;∂ the Audit Committee, which examines the Parent Company’s framework of risk management,
control and governance process to ensure that these are adequate and functional; and∂ the Credit Committee, which recommends credit policies and evaluates credit applications.
The following units within the Parent Company jointly perform risk management functions on adaily basis:∂ Compliance for regulatory risk;∂ Treasury for funding and liquidity risk;∂ Credit Cycle Operations for credit risk;∂ Enterprise Risk Management Unit (ERMU) for various risks, including market risk; credit and
operational risks; and∂ Internal Audit for the evaluation of the adequacy of internal control systems, covering
operational risk.
These units submit various risk reports to the Management Committee, the RMC and the BOD,among others.
Further specific risk management disclosures, including mitigation, measurement and control, arein the succeeding sections.
Credit RiskCredit risk may be defined as the possibility of loss due to the failure of a customer/borrower orcounterparty to perform its obligation to the Group.
The Group has several credit risk mitigation practices:∂ The Group offers a variety of loan products with substantial collateral values. The latter part
of this credit risk section discusses collateral and other credit enhancements.∂ Limits are set on the amount of credit risk that the Group is willing to take for customers and
counterparties, and exposures are monitored against such credit limits.∂ The Group also observes related regulatory limits such as the single borrower’s limit (SBL)
and directors, officers, stockholders and related interests (DOSRI) ceiling.

129Robinsons Bank Annual Report 2016
- 30 -
*SGVFS022572*
∂ To protect against settlement risk, the Group employs a delivery-versus-payment (DvP)settlement system, wherein payment is effected only when the corresponding asset has beendelivered.
∂ There is an internal credit risk rating system (ICRRS) in place, providing a structured formatfor collating and analyzing borrower data to arrive at a summary indicator of credit risk.
∂ Past due and non-performing loan (NPL) ratios are also used to measure and monitor thequality of the loan portfolio.
Maximum exposure to credit riskThe table below shows the Group’s net credit risk exposure for financial assets with maximumexposure to credit risk different from its carrying amounts after considering the financial effect ofcollateral and other credit enhancements:
ConsolidatedDecember 31,2016
CarryingAmount
Fair value of Collateral
FinancialEffect of
Collateral
MaximumExposure toCredit Risk
Interbank loans receivable/SPURA P=96,000,000 P=96,352,096 P=96,000,000 P=−Loans and receivables: Receivables from customers: Commercial 8,472,128,175 3,249,062,324 2,966,644,526 5,505,483,649 Real estate 5,352,677,002 9,248,284,662 5,001,508,450 351,168,552 Consumption 1,685,810,649 1,838,552,078 1,448,140,640 237,670,009 Other receivables: Sales contract receivable 46,124,679 82,823,176 45,417,018 707,661
P=15,652,740,505 P=14,515,074,336 P=9,557,710,634 P=6,095,029,871
ConsolidatedDecember 31, 2015
CarryingAmount
Fair Valueof Collateral
Financial Effectof Collateral
MaximumExposure toCredit Risk
Interbank loans receivable/SPURA P=97,000,000 P=97,863,514 P=97,000,000 P=–Loans and receivables: Receivables from customers: Commercial 7,709,641,169 4,636,093,691 1,875,104,801 5,834,536,368 Real estate 3,586,409,165 7,667,926,714 3,522,686,326 63,722,839 Consumption 811,450,499 2,084,029,754 807,370,990 4,079,509 Other receivables: Sales contract receivable 64,229,554 132,430,461 63,462,054 767,500
P=12,268,730,387 P=14,618,344,134 P=6,365,624,171 P=5,903,106,216
Parent CompanyDecember 31, 2016
CarryingAmount
Fair Valueof Collateral
Financial Effectof Collateral
MaximumExposure toCredit Risk
Interbank loans receivable/SPURA P=96,000,000 P=96,352,096 P=96,000,000 P=−Loans and receivables: Receivables from customers: Commercial 8,373,155,085 2,918,119,752 2,886,232,383 5,486,922,702 Real estate 5,346,408,900 9,222,332,686 4,995,240,348 351,168,552 Consumption 1,668,696,760 1,799,141,716 1,434,279,220 234,417,540 Other receivables: Sales contract receivable 33,882,159 36,123,275 33,882,159 −
P=15,518,142,904 P=14,072,069,525 P=9,445,634,110 P=6,072,508,794

130 Robinsons Bank Annual Report 2016
NOTES TO financial STATEMENTS- 31 -
*SGVFS022572*
Parent CompanyDecember 31, 2015
CarryingAmount
Fair Valueof Collateral
Financial Effectof Collateral
MaximumExposure toCredit Risk
Interbank loans receivable/SPURA P=97,000,000 P=97,863,514 P=97,000,000 P=–Loans and receivables: Receivables from customers: Commercial 7,598,995,322 4,133,869,890 1,774,071,543 5,824,923,779 Real estate 3,582,219,194 7,649,973,528 3,518,496,355 63,722,839 Consumption 782,856,077 1,922,389,965 780,826,115 2,029,962 Other receivables: Sales contract receivable 44,240,051 72,562,954 44,240,051 –
P=12,105,310,644 P=13,876,659,851 P=6,214,634,064 P=5,890,676,580
Collateral and other credit enhancementThe amount and type of collateral required depends on an assessment of credit risk. Guidelinesare implemented regarding the acceptability of types of collateral and valuation parameters.The main types of collateral obtained are as follows:
∂ Mortgages over real estate and vehicle for consumer lending∂ Chattels over inventory and receivable for commercial lending∂ Government securities for interbank lending
It is the Group’s policy to dispose repossessed properties in an orderly fashion. In general, theproceeds are used to reduce or repay the outstanding claim, and are not occupied for business use.
Concentration of creditConcentrations arise when a number of counterparties are engaged in similar business activities, oractivities in the same geographic region, or have similar economic features that would cause theirability to meet contractual obligations to be similarly affected by changes in economic, political orother conditions. Concentrations indicate the relative sensitivity of the Group’s performance todevelopments affecting a particular industry.
The tables below show the distribution of maximum exposure to credit risk by industry sector ofthe Group before taking into account collateral held and other credit enhancements(in millions):
Consolidated2016
Loans andReceivables*
InvestmentSecurities** Total
Government institutions P=12,924 P=8,383 P=21,307Real estate, renting and
business services 9,203 2,235 11,438Financial intermediaries 9,632 1,497 11,129Wholesale and retail 7,554 − 7,554Electricity, gas and water 3,895 1,425 5,320Personal consumption 5,059 51 5,110Manufacturing 3,649 597 4,246Transport, storage and
communication 1,778 436 2,214(Forward)

131Robinsons Bank Annual Report 2016
- 32 -
*SGVFS022572*
Consolidated2016
Loans andReceivables*
InvestmentSecurities** Total
Construction P=583 P=562 P=1,145Agriculture, hunting and forestry 617 49 666Others 3,157 61 3,218
58,051 15,296 73,347Less allowance for credit losses 913 − 913
P=57,138 P=15,296 P=72,434* All financial assets other than investment securities and cash on hand (net of UID)** Financial assets at FVPL, AFS and HTM investments
Consolidated2015
Loans andReceivables*
InvestmentSecurities** Total
Government institutions P=9,260 P=6,947 P=16,207Financial intermediaries 9,459 682 10,141Real estate, renting and business
services 7,092 1,689 8,781Wholesale and retail 5,790 − 5,790Personal consumption 3,747 − 3,747Manufacturing 2,665 733 3,398Electricity, gas and water 1,868 599 2,467Transport, storage and
communication 1,602 294 1,896Agriculture, hunting and forestry 489 − 489Construction 472 − 472Others 1,031 11 1,042
43,475 10,955 54,430Less allowance for credit losses 769 − 769
P=42,706 P=10,955 P=53,661* All financial assets other than investment securities and cash on hand (net of UID)** Financial assets at FVPL, AFS and HTM investments
Parent Company2016
Loans andReceivables*
InvestmentSecurities** Total
Government institutions P=12,924 P=8,383 P=21,307Financial intermediaries 8,755 1,378 10,133Real estate, renting and business
services 9,058 2,220 11,278Wholesale and retail 7,788 − 7,788Electricity, gas and water 3,895 1,424 5,319Manufacturing 3,649 597 4,246Personal consumption 4,037 51 4,088Transport, storage and
communication 1,778 436 2,214(Forward)

132 Robinsons Bank Annual Report 2016
NOTES TO financial STATEMENTS- 33 -
*SGVFS022572*
Parent Company2016
Loans andReceivables*
InvestmentSecurities** Total
Construction P=583 P=562 P=1,145Agriculture, hunting and forestry 530 34 564Others 3,132 26 3,158
56,129 15,111 71,240Less allowance for credit losses 797 − 797
P=55,332 P=15,111 P=70,443* All financial assets other than investment securities and cash on hand (net of UID)** Financial assets at FVPL, AFS and HTM investments
Parent Company2015
Loans andReceivables*
InvestmentSecurities** Total
Government institutions P=9,260 P=6,947 P=16,207Financial intermediaries 8,629 711 9,340Real estate, renting and business
services 6,912 1,689 8,601Wholesale and retail 5,715 − 5,715Manufacturing 2,665 733 3,398Personal Consumption 2,816 − 2,816Electricity, gas and water 1,868 599 2,467Transport, storage and
communication 1,602 294 1,896Construction 472 − 472Agriculture, hunting and forestry 423 − 423Others 973 11 984
41,335 10,984 52,319Less allowance for credit losses 721 − 721
P=40,614 P=10,984 P=51,598* All financial assets other than investment securities and cash on hand (net of UID)** Financial assets at FVPL, AFS and HTM investments
Credit qualityParent CompanyFor receivables from customers, the Parent Company’s internal credit rating risk (ICRR) systemwas approved in 2007 and improved in 2011 in accordance with BSP requirement, to covercorporate credit exposures, which is defined by BSP Circular no. 439 as exposures to companieswith assets of more than P=15.00 million.
The Parent Company’s ICRR is as follows:
Grades Categories DescriptionHigh grade
Risk rating 1 Excellent Lowest probability of default; exceptionally strongcapacity for financial commitments; highly unlikely to beadversely affected by foreseeable events.

133Robinsons Bank Annual Report 2016
- 34 -
*SGVFS022572*
Grades Categories DescriptionRisk rating 2 Super Prime Very low probability of default; very strong capacity for
payment of financial commitments; less vulnerable toforeseeable events.
Risk rating 3 Prime Low probability of default; strong capacity for payment offinancial commitments; may be more vulnerable toadverse business/economic conditions.
Risk rating 4 Very Good Moderately low probability of default; more than adequatecapacity for payment of financial commitments; butadverse business/economic conditions are more likely toimpair this capacity.
Risk rating 5 Good More pronounced probability of default; business orfinancial flexibility exists which supports the servicing offinancial commitments; vulnerable to adversebusiness/economic changes.
StandardRisk rating 6 Satisfactory Material probability of default is present, but a margin of
safety remains; financial commitments are currently beingmet although the capacity for continued payment isvulnerable to deterioration in the business/economiccondition.
Risk rating 7 Average Greater probability of default which is reflected in thevolatility of earnings and overall performance; repaymentsource is presently adequate; however, prolongedunfavorable economic period would create deteriorationbeyond acceptable levels.
Risk rating 8 Fair Sufficiently pronounced probability of default, althoughborrowers should still be able to withstand normalbusiness cycles; any prolonged unfavorableeconomic/market conditions would create an immediatedeterioration of cash flow beyond acceptable levels.
Sub-standard gradeRisk rating 9 Marginal Elevated level of probability of default, with limited
margin; Repayment source is adequate to marginal.Risk rating 10 Watchlist Unfavorable industry or company specific risk factors
represent a concern, financial strength may be marginal;will find it difficult to cope with significant downturn.
Risk rating 11 Special mention Loans have potential weaknesses that deserve closeattention; borrower has reached a point where there is areal risk that the borrower’s ability to pay the interest andrepay the principal timely could be jeopardize due toevidence of weakness in the borrower’s financialcondition.

134 Robinsons Bank Annual Report 2016
NOTES TO financial STATEMENTS- 35 -
*SGVFS022572*
Grades Categories DescriptionRisk rating 12 Substandard Substantial and unreasonable degree of risk to the
institution because of unfavorable record or unsatisfactorycharacteristics; with well-defined weakness(es) thatjeopardize their liquidation. e.g. negative cash flow, incase of fraud.
Past due andimpairedRisk rating 13 Doubtful Weaknesses similar to “Substandard”, but with added
characteristics that make liquidation highly improbable.Risk rating 14 Loss Uncollectible or worthless.
The Parent Company’s ICRR system intends to provide a structure to define the credit portfolio,and consists of an initial rating for the borrower risk adjusted for the facility risk. Inputs includean assessment of management, credit experience, financial condition, industry outlook,documentation, security and term.
The following tables show the credit quality per class of loans and receivables, gross of allowancefor credit losses and unearned interest and discount of the Parent Company (in millions):
Parent Company2016
Neither past due nor individually impaired
HighGrade
StandardGrade
SubstandardGrade Unrated
Past duebut not
IndividuallyImpaired
IndividuallyImpaired Total
Receivables from customers: Commercial P=13,022 P=10,495 P=1,447 P=1,816 P=32 P=691 P=27,503 Real estate − 5,685 − − 67 − 5,752 Consumption − 2,585 − − 1,979 − 4,564 Domestic bills purchased 139 − − − − − 139Other receivables: Accrued interest receivable − 201 − − 254 − 455 Accounts receivable − 324 − − − − 324 Sales contract receivable − 32 − − 5 − 37
P=13,022 P=19,322 P=1,447 P=1,816 P=2,337 P=691 P=38,774
Parent Company2015
Neither past due nor impaired
HighGrade
StandardGrade
SubstandardGrade Unrated
Past duebut not
IndividuallyImpaired
IndividuallyImpaired Total
Receivables from customers: Commercial P=8,784 P=7,439 P=785 P=1,470 P=– P=674 P=19,152 Real estate – 3,757 – – 91 – 3,848 Consumption – 2,764 – – 412 2 3,178 Domestic bills purchased 607 – – – – – 607Other receivables: Accrued interest receivable – 207 – – 165 – 372 Accounts receivable – 209 – – – – 209 Sales contract receivable – 46 – – 4 – 50
P=9,391 P=14,422 P=785 P=1,470 P=672 P=676 P=27,416
External ratingsIn ensuring a quality investment portfolio, the Parent Company monitors credit risk frominvestments using credit ratings based on Moody’s Investors Service (Moody’s rating).

135Robinsons Bank Annual Report 2016
- 36 -
*SGVFS022572*
Credit quality of due from BSP and other banks and interbank loans receivable are based onavailable accredited international and local credit raters using Fitch as standard of rating.
The Parent Company assigns the following credit quality groupings based on Fitch Ratings andMoody’s rating as follows:
Credit Quality Fitch Moody’sHigh Grade AAA to A- Aaa to A3Standard Grade BBB+ to BB- Baa1 to Ba3Substandard Grade B+ to C- B1 to CaPast due and impaired D C
The following tables show the credit quality per class of financial assets other than receivablesfrom customers and other receivables of the Parent Company (in millions):
Parent Company2016
Neither past due nor impaired Past due
HighGrade
StandardGrade
SubstandardGrade Unrated
but notIndividually
ImpairedIndividually
Impaired TotalFinancial assets at FVPL P=3 P=− P=− P=− P=− P=− P=3AFS investments: Government securities 8,192 − − − − − 8,192 Private bonds − 1,178 − 2,044 − − 3,222 Quoted equity securities − 306 − − − − 306 Unquoted equity securities − − − 54 − − 54HTM investment 190 2,970 − 175 − − 3,335Loans and receivables: Due from BSP − 12,722 − − − − 12,722 Due from other banks − 3,884 − 111 − − 3,995 Interbank loans receivable/
SPURA − 589 − − − − 589Other assets: Refundable deposits − 56 − − − − 56
P=8,385 P=21,705 P=− P=2,384 P=− P=− P=32,474
Parent Company2015
Neither past due nor impaired Past due
HighGrade
StandardGrade
SubstandardGrade Unrated
but notIndividually
ImpairedIndividually
Impaired TotalFinancial assets at FVPL P=– P=5 P=– P=– P=– P=– P=5AFS investments: Government securities 6,787 − – – – – 6,787 Private bonds – 1,378 – – – – 1,378 Quoted equity securities − 12 − − − − 12 Unquoted equity securities – − – 53 – – 53HTM Investments 115 2,634 – − – – 2,749Loans and receivables: Due from BSP − 9,190 – – – – 9,190 Due from other banks – 4,596 – – – – 4,596
Interbank loans receivable – 97 – – – – 97Other assets: Refundable deposits – 46 – – – – 46
P=6,902 P=17,958 P=− P=53 P=− P=− P=24,913
As of December 31, 2016 and 2015, the Parent Company’s commitments amounting toP=501.32 million and P=11.98 billion, respectively, have a risk rating class of Standard Grade(see Note 26).

136 Robinsons Bank Annual Report 2016
NOTES TO financial STATEMENTS- 37 -
*SGVFS022572*
LSBFor receivables from customers, credit quality is being evaluated by LSB using the followingclassifications:
Neither past due nor individually impairedLSB classifies those accounts under current status having the following loan grades:∂ High grade
This pertains to accounts with a very low probability of default as demonstrated by theborrower’s long history of stability, profitability and diversity. The borrower has the ability toraise substantial amounts of funds through the public markets. The borrower has a strong debtservice record and a moderate use of leverage.
∂ Standard gradeThe borrower has no history of default. The borrower has sufficient liquidity to fully serviceits debt over the medium term. The borrower has adequate capital to readily absorb anypotential losses from its operations and any reasonably foreseeable contingencies. Theborrower reported profitable operations for at least the past 3 years.
∂ Substandard gradeThe borrower is expected to be able to adjust to the cyclical downturns in its operations. Anyprolonged adverse economic conditions would however ostensibly create profitability andliquidity issues.
∂ Unrated gradeOther credit assets which cannot be classified as High, Standard or Substandard are tagged asUnrated.
Past due but not individually impairedThese are accounts which are classified as delinquent but LSB assesses that there is no objectiveevidence that these accounts are impaired as of statement of financial position date.
Individually impairedAccounts which show evidence of impairment as of statement of financial position date.
The following tables show credit quality per class of financial assets, gross of allowance for creditlosses and unearned interest and discount of LSB (in millions):
2016Neither past due nor impaired
HighGrade
StandardGrade
SubstandardGrade Unrated
Past due butnot Impaired
IndividuallyImpaired Total
Due from BSP P=– P=693 P=– P=– P=– P=– P=693Due from other banks – 95 – – – – 95Securities purchased under resale
agreement 89 – – – – – 89HTM investments 215 – – – – – 215Receivables from customers: Consumption – 378 28 – – 248 654 Commercial – 82 4 – – 231 317 Real estate – 3 – – – 8 11Other receivables: Sales contract receivable – 6 – – 4 2 12 Accounts receivable – 17 – – – 8 25 Accrued interest receivable – 7 1 – – 31 39 Finance lease receivable – 9 – – – – 9Refundable deposits – – – 2 – – 2
P=304 P=1290 P=33 P=2 P=4 P=528 P=2,161

137Robinsons Bank Annual Report 2016
- 38 -
*SGVFS022572*
2015Neither past due nor impaired
HighGrade
StandardGrade
SubstandardGrade Unrated
Past due butnot Impaired
IndividuallyImpaired Total
Due from BSP P=– P=733 P=– P=– P=– P=– P=733Due from other banks – 94 – – – – 94Receivables from customers: Consumption – 296 72 – 1 234 603 Commercial – 48 24 – – 207 279 Real estate – – – – – 4 4Other receivables: Sales contract receivable – 4 2 – 12 2 20 Accounts receivable – 5 – – 2 11 18 Accrued interest receivable – 2 2 – – 21 25 Finance lease receivable – – 6 – – – 6Refundable deposits – – – 1 – – 1
P=– P=1182 P=106 P=1 P=15 P=479 P=1,783
Aging analysis of past due but not impaired loans and receivables per classThe tables below show the aging analysis of past due but not impaired loans and receivables perclass of the Group (in millions):
Consolidated2016
Less than30 days
30 to 60days
61 to 90days
91 daysto 1 year Over 1 year Total
Receivables from customers: Consumption P=1,461 P=37 P=28 P=384 P=70 P=1,980 Real estate 9 12 3 39 4 67 Commercial − − − 32 − 32Other receivables: Accrued interest receivable 205 2 4 26 17 254 Sales contract receivable 3 − − 5 8
P=1,678 P=51 P=35 P=481 P=96 P=2,341
Parent Company2016
Less than30 days
30 to 60Days
61 to 90days
91 daysto 1 year Over 1 year Total
Receivables from customers: Consumption P=1,460 P=37 P=28 P=386 P=68 P=1,979 Real estate 9 12 3 39 4 67 Commercial − − − 30 2 32Other receivables: Accrued interest Receivable 205 2 4 26 17 254 Sales contract Receivable − − − − 5 5
P=1,674 P=51 P=35 P=481 P=96 P=2,337
Consolidated2015
Less than30 days
30 to 60Days
61 to 90days
91 to 360days Over 1 year Total
Receivables from customers: Consumption P=10 P=18 P=27 P=42 P=316 P=413 Real estate − 1 1 15 74 91
Other receivables: Accrued interest receivable 1 2 3 2 176 184 Accounts receivable − − − 1 1 2 Sales contract receivable − − 1 1 14 16
P=11 P=21 P=32 P=61 P=581 706

138 Robinsons Bank Annual Report 2016
NOTES TO financial STATEMENTS- 39 -
*SGVFS022572*
Parent Company2015
Less than30 days
30 to 60Days
61 to 90days
91 to 360days Over 1 year Total
Receivables from customers: Real estate P=10 P=18 P=27 P=42 P=315 P=412 Consumption − 1 1 15 74 91Other receivables: Accrued interest receivable 1 2 3 2 157 165 Sales contract receivable − − − 1 3 4
P=11 P=21 P=31 P=60 P=549 P=672
Liquidity RiskLiquidity risk may be defined as the possibility of loss due to the Group’s inability to meet itsfinancial obligations when they become due. Liquidity risk is considered in the Group’s assetsand liabilities management. The Group seeks to lengthen liability maturities, diversify existingfund sources, and continuously develop new instruments that cater to different segments of themarket.
The Parent Company’s Assets and Liabilities Committee (ALCO) is composed of some membersof the Senior Management including the Lending Groups and Treasury Group Heads. ALCOconducts weekly meetings. The Parent Company also has specialized units that help monitormarket and regulatory developments pertinent to interest rates and liquidity position, as well asprepare cash position reports as needed to measure the liquidity and reserves position of the ParentCompany.
The Parent Company also keeps credit lines with financial institutions, as well as a pool of liquidor highly marketable securities. Reserves management is another specialized function within theBank, complying with BSP reserve requirements, which may be a buffer against unforeseenliquidity drains.
The liquidity or maturity gap report is another tool for measuring liquidity risk. Althoughavailable contractual maturity dates are generally used for putting instruments into time bands,expected liquidation periods, often based on historical data, are used if contractual maturity datesare unavailable. The liquidity gap per time band is computed by getting the difference betweenthe inflows and outflows within the time band. A positive liquidity gap is an estimate of theGroup’s net excess funds for the time band. A negative liquidity gap is an estimate of a futurefunding requirement of the Group. Although such gaps are a normal part of the business, asignificant negative amount may bring significant liquidity risk.
To help control liquidity risk arising from negative liquidity gaps, maximum cumulative outflow(MCO) targets are set for time bands up to one (1) year.

139Robinsons Bank Annual Report 2016
- 40 -
*SGVFS022572*
Analysis of financial instruments by remaining maturitiesThe table below summarized the maturity profile of the Group’s financial instruments based oncontractual undiscounted cash flows except for financial assets at FVPL which and based onexpected disposal (in millions):
Consolidated2016
On demandUp to
3 monthsOver 3 up
to 12 monthsOver 1 to
5 Years Over 5 years TotalFinancial AssetsCash and other cash items P=1,684 P=– P=– P=– P=– P=1,684Due from BSP 11,016 2,401 – – – 13,417Due from other banks 1,865 1,033 1,195 – – 4,093Interbank loans
receivable/SPURA – 582 75 27 – 684Financial assets at FVPL 3 – – – – 3AFS investments – 127 297 2,874 10,747 14,045HTM investments – 276 99 2,468 1,859 4,702Loans and receivables 858 9,250 6,247 12,295 11,209 39,859Other assets 1 – 23 37 1 62
15,427 13,669 7,936 17,701 23,816 78,549Financial LiabilitiesDeposit liabilities 30,257 24,803 7,414 4,530 – 67,004Manager’s checks 404 – – – – 404Redeemable preferred shares 31 – – – – 31Accrued expenses – 418 – – – 418Other liabilities 1,377 – – – – 1,377
32,069 25,221 7,414 4,530 – 69,234Commitments 501 – – – – 501
32,570 25,221 7,414 4,530 − 69,735(P=17,143) (P=11,552) P=522 P=13,171 P=23,816 P=8,814
Parent Company2016
On demandUp to
3 monthsOver 3 up
to 12 monthsOver 1 to
5 Years Over 5 years TotalFinancial AssetsCash and other cash items P=1,654 P=– P=– P=– P=– P=1,654Due from BSP 10,872 1,851 – – – 12,723Due from other banks 1,770 1,032 1,195 – – 3,997Interbank loans
receivable/SPURA – 493 75 27 – 595Financial assets at FVPL 3 – – – – 3AFS investments 127 297 2,874 10,747 14,045HTM investment – 261 99 2,468 1,603 4,431Loans and receivables 509 9,187 6,113 11,305 11,085 38,199Other assets – − 23 37 − 60
14,808 12,951 7,802 16,711 23,435 75,707
(Forward)

140 Robinsons Bank Annual Report 2016
NOTES TO financial STATEMENTS- 41 -
*SGVFS022572*
Consolidated2016
On demandUp to
3 monthsOver 3 up
to 12 monthsOver 1 to
5 Years Over 5 years TotalFinancial LiabilitiesDeposit liabilities P=29,163 P=24,576 P=7,383 P=4,107 P=– P=65,229Manager’s checks 404 – – – – 404Accrued expenses – 412 – – – 412Other liabilities 1,367 – – – – 1,367
30,934 24,988 7,383 4,107 – 67,412Commitments 501 – – – – 501
31,435 24,988 7,383 4,107 – 67,913(P=16,627) (P=12,037) P=419 P=12,604 P=23,435 P=7,794
Consolidated2015
On demandUp to
3 monthsOver 3 up
to 12 monthsOver 1 to
5 Years Over 5 years TotalFinancial AssetsCash and other cash items P=1,702 P=– P=– P=– P=– P=1,702Due from BSP 7,403 2,521 – – – 9,924Due from other banks 1,723 2,805 166 – – 4,694Interbank loans
receivable/SPURA – 1 5 102 – 108Financial assets at FVPL 5 – – – – 5HTM investments – 57 57 1,078 2,743 3,935AFS investments 36 161 161 3,906 8,241 12,505Loans and receivables 776 6,109 4,182 9,613 15,436 36,116Other assets – 1 23 24 – 48
11,645 11,655 4,594 14,723 26,420 69,037Financial LiabilitiesDeposit liabilities 31,669 5,349 2,428 4,818 4 44,268Manager’s checks 289 – – – – 289Redeemable preferred shares 2 – – – – 2Accrued expenses – 442 – – – 442Other liabilities 1,154 – – – – 1,154
33,114 5,791 2,428 4,818 4 46,155Commitments 11,979 – – – – 11,979
45,093 5,791 2,428 4,818 4 58,134(P=33,448) P=5,864 P=2,166 P=9,905 P=26,416 P=10,903

141Robinsons Bank Annual Report 2016
- 42 -
*SGVFS022572*
Parent Company2015
On demandUp to
3 monthsOver 3 up
to 12 monthsOver 1 to
5 Years Over 5 years TotalFinancial AssetsCash and other cash items P=1,665 P=– P=– P=– P=– P=1,665Due from BSP 7,260 1,931 – – – 9,191Due from other banks 1,630 2,804 166 – – 4,600Interbank loans
receivable/SPURA – 1 5 102 – 108Financial assets at FVPL 5 – – – – 5AFS investments 36 161 161 3,906 8,241 12,505HTM investment – 57 57 1,078 2,743 3,935Loans and receivables 114 5,902 3,884 9,293 15,364 34,557Other assets – 1 22 23 – 46
10,710 10,857 4,295 14,402 26,348 66,612Financial LiabilitiesDeposit liabilities 30,578 5,100 2,385 4,368 3 42,434Manager’s checks 289 – – – – 289Accrued expenses 433 – – – 433Other liabilities 1,133 – – – – 1,133
32,000 5,533 2,385 4,368 3 44,289Commitments 11,979 – – – – 11,979
43,979 5,533 2,385 4,368 3 56,268(P=33,269) P=5,324 P=1,910 P=10,034 P=26,345 P=10,344
Market RiskMarket risk may be defined as the possibility of loss due to adverse movements in market factorssuch as rates and prices. Market risk is present in both trading and non-trading activities. Theseare the risk to earnings or capital arising from changes in the value of traded portfolios of financialinstruments. The risk arises from market-making, dealing and position-taking in quoted debtsecurities and foreign exchange.
The Parent Company observes market risk limits, which are approved by the BOD and reviewedat least annually. Limits are set in such a way as to ensure that risks taken are based on the ParentCompany’s existing capital adequacy framework, and corresponding monitoring reports areprepared regularly by an independent risk management unit.
When limits are breached, approval is sought from successive levels of authority depending on theamount of the excess. Limit breaches are periodically presented to the BOD.
Value-at-Risk (VaR) is computed to estimate potential losses arising from market movements.The Parent Company calculates and monitors VaR and profit or loss on a daily basis.
VaR objectives and methodologyVaR is used by the Parent Company to measure market risk exposure from its trading andinvestment activities. VaR is an estimate of the maximum decline in value on a given positionover a specified holding period in a normal market environment, with a given probability ofoccurrence.

142 Robinsons Bank Annual Report 2016
NOTES TO financial STATEMENTS- 43 -
*SGVFS022572*
The Parent Company uses the historical simulation method in estimating VaR. The historicalsimulation method is a non-parametric approach to VaR calculation, in which asset returns are notsubject to any functional distribution assumption. VaR is estimated directly from historical datawithout deriving parameters or making assumptions about the entire data distribution.
In employing the historical simulation method, the Parent Company assumes a 260 historical data(approximately 1 year), 99.50% confidence level and 1-day holding period. On August 17, 2016,the Parent Company implemented new assumptions in the model, specifically the use of 500historical data (approximately 2 years) and 99.00% confidence level, with the holding period stillat 1-day.
VaR methodology limitations and assumptionsDiscussed below are the limitations and assumptions applied by the Parent Company on its VaRmethodology:a. VaR is a statistical estimate; thus, it does not give the precise amount of loss the Parent
Company may incur in the future;b. VaR is not designed to give the probability of bank failure, but only attempts to quantify
losses that may arise from a Parent Company’s exposure to market risk;c. Since VaR is computed from end-of-day positions and market factors, VaR does not capture
intraday market risk.d. VaR systems depend on historical data. It attempts to forecast likely future losses using past
data. As such, this assumes that past relationships will continue to hold in the future.Therefore, market shifts (i.e., an unexpected collapse of the market) will not be captured andmay inflict losses larger than VaR; and
e. The limitation relating to the pattern of historical returns being indicative of future returns isaddressed by supplementing VaR with daily stress testing reported to the RMC, ALCO andthe concerned risk-takers.
VaR back testing is the process by which financial institutions periodically compare ex-post profitor loss with the ex-ante VaR figures to gauge the robustness of the VaR model. The ParentCompany performs quarterly back testing.
The Parent Company’s VaR figures are as follows (in millions):
January – August 2016Average Daily Highest Lowest August 17
Local interest rates P=3.0005 P=20.6307 P=0.1707 P=2.5533Foreign interest rate − − − −
August – December 2016*Average Daily Highest Lowest December 31
Local interest rates P=4.2745 P=7.8317 P=0.0222 P=0.0225Foreign interest rate 0.0002 0.0158 − −*based on new VaR assumptions
2015Average Daily Highest Lowest December 31
Local interest rates P=42.38 P=104.57 P=0.17 P=0.17Foreign interest rate 0.0029 0.0792 0.0047 −

143Robinsons Bank Annual Report 2016
- 44 -
*SGVFS022572*
Interest rate riskInterest rate risk arises from the possibility that changes in interest rates will affect future cashflows or the fair values of financial instruments.
The sensitivity analysis below shows the impact of movement in interest rates on AFS investmentsof the Parent Company as of December 31, 2016 and 2015 (in millions).
December 31, 2016Net Carrying
Value100 bps parallel shift
in yield curvePeso Denominated AFS P=7,777.79 (P=542.13)Dollar Denominated AFS (in PHP) 3,941.36 (354.43)
December 31, 2015Net Carrying
Value100 bps parallel shift
in yield curvePeso Denominated AFS P=6,167.60 (P=487.38)Dollar Denominated AFS (in PHP) 2,010.32 (159.22)
The Parent Company’s ALCO surveys the interest rate environment, adjusts the interest rates forthe Parent Company’s loans and deposits, assesses investment opportunities and reviews thestructure of assets and liabilities. The Parent Company uses Earnings-at-Risk (EaR) as a tool formeasuring and managing interest rate risk in the banking book.
Earnings-at-Risk objectives and methodologyEAR is a statistical measure of the likely impact of changes in interest rates to the Bank’s netinterest income (NII). To do this, repricing gaps (difference between interest rate-sensitive assetsand liabilities) are classified according to time to repricing and multiplied with applicablehistorical interest rate volatility, although available contractual repricing dates are generally usedfor putting instruments into time bands, contractual maturity dates (e.g., for fixed rate instruments)or expected liquidation periods often based on historical data are used alternatively. The repricinggap per time band is computed by getting the difference between the inflows and outflows withinthe time band. A positive repricing gap implies that the Parent Company’s NII could decline ifinterest rates decrease upon repricing. A negative repricing gap implies that the Parent Company’sNII could decline if interest rates increase upon repricing. Although such gaps are a normal partof the business, a significant change may bring significant interest rate risk.
To help control interest rate risk arising from repricing gaps, maximum repricing gap and EaR/NIItargets are set for time bands up to one year. EaR is prepared and reported to the RMC monthly.
The Parent Company’s EaR figures are as follows (in PHP millions):
2016Average Highest Lowest December 31
Instruments sensitive to localinterest rates P=71.65 P=154.18 P=1.08 P=121.35
Instruments sensitive to foreigninterest rates 0.04 0.09 0.01 0.09
2015Average Highest Lowest December 31
Instruments sensitive to localinterest rates P=67.97 P=113.36 P=31.62 P=36.22
Instruments sensitive to foreigninterest rates 0.06 0.09 0.04 0.05

144 Robinsons Bank Annual Report 2016
NOTES TO financial STATEMENTS- 45 -
*SGVFS022572*
Foreign currency riskForeign currency risk is the risk that the value of a financial instrument will fluctuate due tochanges in foreign exchange rates. The BOD has set limits on positions by currency. Inaccordance with the Parent Company’s policy, positions are monitored on a daily basis and areused to ensure positions are maintained within established limits.
December 31, 2016Statement of
Income OCI+10% USD appreciation USD (P=416,372,261) P=394,119,655
Other Foreign Currencies* 20,666,562 −-10% USD depreciation USD 416,372,261 394,119,655
Other Foreign Currencies* (20,666,562) −
December 31, 2015Statement of
Income OCI+10% USD appreciation USD (P=211,102,042) P=201,032,038
Other Foreign Currencies* 7,425,600 −-10% USD depreciation USD 211,102,042 201,032,038
Other Foreign Currencies* (7,425,600) −*significant positions held in CAD and AUD
5. Fair Value Measurement
The methods and assumptions used by the Group in estimating the Group’s assets and liabilitiesare:
Cash and other cash items, due from BSP, due from other banks, interbank loansreceivable/securities purchased under repurchase agreements, accounts receivable and accruedinterest receivableCarrying value approximates fair value given the short-term nature of these financial assets andinsignificant risk of changes in value.
Trading and investment securitiesFair values of debt securities (financial assets at FVPL, AFS and HTM investments) and equityinvestments are generally based on quoted market prices. If the market prices are not readilyavailable, fair values are estimated using either values obtained from independent parties offeringpricing services or adjusted quoted market prices of comparable investments or using thediscounted cash flow methodology.
For equity investments that are not quoted, the investments are carried at cost less allowance forimpairment losses due to the unpredictable nature of future cash flows and the lack of suitablemethods of arriving at a reliable fair value.
Receivables from customersFair values are estimated using the discounted cash flow methodology, using the Group’s currentincremental lending rates for similar types of receivables at current market rates. Where theinstruments reprice on a short-term basis or have a relatively short maturity, the carrying amountsapproximate fair values.
Investment propertiesFair value of investment properties are based on market data (or direct sales comparison)approach. This approach relies on the comparison of recent sale transactions or offerings ofsimilar properties which have occurred and/or offered with close proximity to the subject property.

145Robinsons Bank Annual Report 2016
- 46 -
*SGVFS022572*
The fair values of the Group’s investment properties have been determined by appraisers,including independent external appraisers, in the basis of the recent sales of similar properties inthe same areas as the investment properties and taking into account the economic conditionsprevailing at the time of the valuations are made.
The Group has determined that the highest and best use of the property used for the land andbuilding is its current use.
Time depositsFair values are estimated using the discounted cash flow methodology using the Group’s currentincremental borrowing rates for similar borrowings with maturities consistent with thoseremaining for the liability being valued.
Financial liabilities at amortized cost except time depositsCarrying amounts approximate fair values due to either the demand nature or the relatively short-term maturities of these liabilities.
Consolidated2016
Carrying Value Level 1 Level 2 Level 3 Total Fair ValueAssets Measured at Fair ValueFinancial AssetsFinancial assets at FVPL P=2,555,185 P=2,555,185 P=− P=− P=2,555,185AFS investments: Government securities 8,192,453,343 8,192,453,343 − − 8,192,453,343 Private bonds 3,222,098,803 3,222,098,803 − − 3,222,098,803 Quoted equity securities 305,500,000 305,772,373 − − 305,772,373
P=11,722,607,331 P=11,722,879,704 P=− P=− P=11,722,879,704Assets for which Fair Values are DisclosedFinancial AssetsHTM investment P=3,549,900,604 P=3,519,092,648 P=− P=− P=3,519,092,648AFS – unquoted equity securities 23,878,073 − − 23,605,700 23,605,700Loans and receivables: Receivables from customers: Commercial 27,433,555,335 − − 29,920,068,814 29,920,068,814 Real estate 5,749,265,920 − − 6,177,801,009 6,177,801,009 Consumption 4,964,602,167 − − 5,726,255,974 5,726,255,974 Other receivables: Sales contract receivable 40,733,131 − − 28,609,405 28,609,405 Accrued interest receivables 411,487,979 − − 216,755,077 216,755,077 Accounts receivable 288,822,809 − − 156,385,798 156,385,798 Lease receivable 8,614,546 − − 9,030,296 9,030,296Interbank loans receivable 96,000,000 − − 110,156,313 110,156,313Refundable deposits 57,201,471 − − 58,926,429 58,926,429Non-Financial AssetsInvestment properties 282,997,561 − − 254,920,603 254,920,603Repossessed chattels 103,489,250 − − 129,366,626 129,366,626
P=43,010,548,846 P=3,519,092,648 P=− P=42,811,882,044 P=46,330,974,692Liabilities for which Fair Values are
DisclosedFinancial LiabilitiesDerivative liabilities P=7,447,751 P=7,447,751 P=− P=− P=7,447,751Deposit liabilities: Time deposits 12,895,961,824 − − 12,927,516,996 12,927,516,996
P=12,903,409,575 P=7,447,751 P=− P=12,927,516,996 P=12,934,964,747

146 Robinsons Bank Annual Report 2016
NOTES TO financial STATEMENTS- 47 -
*SGVFS022572*
Parent Company2016
Carrying Value Level 1 Level 2 Level 3 Total Fair ValueAssets Measured at Fair ValueFinancial AssetsFinancial assets at FVPL P=2,555,185 P=2,555,185 P=− P=− P=2,555,185AFS investments: Government securities 8,192,453,343 8,192,453,343 − − 8,192,453,343 Private bonds 3,222,098,803 3,222,098,803 − − 3,222,098,803 Quoted equity securities 305,500,000 305,772,373 − − 305,772,373
P=11,722,607,331 P=11,722,879,704 P=− P=− P=11,722,879,704Assets for which Fair Values are DisclosedFinancial AssetsHTM investment P=3,334,528,051 P=3,314,412,732 P=− P=− P=3,314,412,732AFS – unquoted debt securities 52,605,700 − − 52,605,700 52,605,700Loans and receivables: Receivables from customers: Commercial 27,054,342,316 − − 29,627,729,761 29,627,729,761 Real estate 5,744,776,460 − − 6,167,115,367 6,167,115,367 Consumption 4,483,317,073 − − 4,734,804,642 4,734,804,642 Other receivables: Sales contract receivable 29,198,272 − − 17,778,187 17,778,187
Accrued interest receivable 385,594,954 − − 216,755,077 216,755,077Accounts receivable 272,120,333 − − 154,905,359 154,905,359
Interbank loans receivable 96,000,000 − − 110,156,313 110,156,313Refundable deposits 55,721,032 − − 57,537,175 57,537,175Non-financial assetsInvestment properties 129,916,432 − − 49,368,625 49,368,625Repossessed chattels 103,489,250 − − 129,366,626 129,366,626
P=41,741,609,873 P=3,314,412,732 P=− P=41,318,122,832 P=44,632,535,564Liabilities for which Fair Values are
DisclosedFinancial LiabilitiesDerivative liabilities P=7,447,751 P=7,447,751 P=− P=− P=7,447,751Deposit liabilities: Time deposits 12,895,961,824 − − 12,478,437,971 12,478,437,971
P=12,903,409,575 P=7,447,751 P=− P=12,478,437,971 P=12,485,885,722
Consolidated2015
Carrying Value Level 1 Level 2 Level 3 Total Fair ValueAssets Measured at Fair ValueFinancial AssetsFinancial assets at FVPL P=5,132,724 P=5,132,724 P=– P=– P=5,132,724AFS investments: Government securities 6,787,060,393 6,787,060,393 – – 6,787,060,393 Private bonds 1,378,397,236 1,378,397,236 – – 1,378,397,236 Quoted equity securities 12,062,000 12,062,000 – – 12,062,000
P=8,182,652,353 P=8,182,652,353 P=– P=– P=8,182,652,353Assets for which Fair Values are DisclosedFinancial AssetsHTM investment P=2,749,295,603 P=2,228,829,809 P=572,870,263 P=– P=2,801,700,072AFS – unquoted securities 23,605,700 – – 23,605,700 23,605,700Loans and receivables: Receivables from customers: Commercial 19,717,767,844 – – 20,054,128,202 20,054,128,202 Real estate 3,837,920,447 – – 3,965,369,213 3,965,369,213 Consumption 3,481,219,500 – – 4,031,953,419 4,031,953,419 Other receivables: Accrued interest receivables 64,229,554 – – 58,786,812 58,786,812 Sales contract receivable 310,304,893 – – 310,304,893 310,304,893 Accounts receivable 151,043,424 – – 151,043,424 151,043,424 Lease receivable 6,356,824 – – 6,725,164 6,725,164Non-Financial AssetsInvestment properties 243,680,939 – – 352,743,898 352,743,898Repossessed chattels 73,343,238 – – 220,157,982 220,157,982
P=30,658,767,966 P=2,228,829,809 P=572,870,263 P=29,174,818,707 P=31,976,518,779
(Forward)

147Robinsons Bank Annual Report 2016
- 48 -
*SGVFS022572*
Consolidated2015
Carrying Value Level 1 Level 2 Level 3 Total Fair ValueLiabilities for which Fair Values are
DisclosedFinancial LiabilitiesFinancial liabilities at amortized cost: Deposit liabilities: Time deposits P=11,751,509,324 P=– P=– P=11,854,842,814 P=11,854,842,814
Parent Company2015
Carrying Value Level 1 Level 2 Level 3 Total Fair ValueAssets Measured at Fair ValueFinancial AssetsFinancial assets at FVPL P=5,132,724 P=5,132,724 P=– P=– P=5,132,724AFS investments: Government securities 6,787,060,393 6,787,060,393 – – 6,787,060,393 Private bonds 1,378,397,236 1,378,397,236 – – 1,378,397,236 Quoted equity securities 12,062,000 12,062,000 – – 12,062,000
P=8,182,652,353 P=8,182,652,353 P=– P=– P=8,182,652,353Assets for which Fair Values are DisclosedFinancial assetsHTM investment P=2,749,295,603 P=2,228,829,809 P=572,870,263 P=– P=2,801,700,072Loans and receivables: 52,605,700 – – 52,605,700 52,605,700 Receivables from customers: Commercial 19,379,918,915 – – 19,577,179,359 19,577,179,359 Real estate 3,830,975,673 – – 3,961,137,955 3,961,137,955 Consumption 2,984,141,533 – – 3,309,940,743 3,309,940,743 Other receivables: Sales contract receivable 44,240,051 – – 38,766,648 38,766,648
Accrued interest receivable 307,698,278 – – 307,698,278 307,698,278Accounts receivable 139,127,876 – – 139,127,876 139,127,876
Non-financial assetsInvestment properties 94,168,563 – – 146,859,620 146,859,620Repossessed chattels 73,316,657 – – 220,131,401 220,131,401
P=29,655,488,849 P=2,228,829,809 P=572,870,263 P=27,753,447,580 P=30,555,147,652Liabilities for which Fair Values are
DisclosedFinancial liabilitiesFinancial liabilities at amortized cost: Deposit liabilities: Time deposits P=11,297,180,630 P=– P=– P=11,331,146,622 P=11,331,146,622
For assets and liabilities that are recognized in the financial statements on a recurring basis, theGroup determines whether transfers have occurred between levels in the hierarchy by reassessingcategorization (based on the lowest level input that is significant to the fair value measurement asa whole at the end of each statement of financial position).
In 2016 and 2015, there were no transfers between Level 1 and Level 2 fair value measurementsand there were no transfers into and out of the Level 3 category.

148 Robinsons Bank Annual Report 2016
NOTES TO financial STATEMENTS- 49 -
*SGVFS022572*
Description of significant unobservable inputs to valuation:
ConsolidatedAccounts Valuation Technique Significant Unobservable InputsLoans and receivables Discounted cash flow method 4.00% - 14.75% risk premium rateInvestment properties
Land Market data approach Price per square meter, size, shape,location, time element and discount
Building Cost approach Cost per square meter, size, shape,location, condition and time element
Refundable deposits Discounted cash flow method 0.25% - 11.50% risk premium rateRepossessed chattels Market data approach Price per unit, size, shape, location,
time element and discountTime deposits Discounted cash flow method 0.25% - 3.90% risk premium rate
Parent CompanyAccounts Valuation Technique Significant Unobservable InputsLoans and receivables Discounted cash flow method 4.00% - 5.00% risk premium rateInvestment properties
Land Market data approach Price per square meter, size, shape,location, time element and discount
Building Cost approach Cost per square meter, size, shape,location, condition and time element
Refundable deposits Discounted cash flow method 0.25% - 3.00% risk premium rateRepossessed chattels Market data approach Price per unit, size, shape, location,
time element and discountTime deposits Discounted cash flow method 0.25% - 3.00% risk premium rate
Significant increases (decreases) in price per square meter and size of investment properties wouldresult in a significantly higher (lower) fair value of the properties. Significant increases(decreases) in discount would result in a significantly lower (higher) fair value of the properties.
Significant Unobservable Inputs
Size Size of lot in terms of area. Evaluate if the lot size of property or comparableconforms to the average cut of the lots in the area and estimate the impact of thelot size differences on land value.
Shape Particular form or configuration of the lot. A highly irregular shape limits theusable area whereas an ideal lot configuration maximizes the usable area of the lotwhich is associated in designing an improvement which conforms with the highestand best use of the property.
Location Location of comparative properties whether on a main road, or secondary road.Road width could also be a consideration if data is available. As a rule, propertieslocated along a main road are superior to properties located along a secondaryroad.
Time element An adjustment for market conditions is made if general property values haveappreciated or depreciated since the transaction dates due to inflation or deflationor a change in investor’s perceptions of the market over time. In which case, thecurrent data is superior to historic data.

149Robinsons Bank Annual Report 2016
- 50 -
*SGVFS022572*
Discount Generally, asking prices in ads posted for sale are negotiable. Discount is theamount the seller or developer is willing to deduct from the posted selling price ifthe transaction will be in cash or equivalent.
Risk premium The return in excess of the risk-free rate of return that an investment is expectedto yield.
6. Interbank Loans Receivable/Securities Purchased Under Resale Agreement
This account consists of:
Consolidated Parent Company2016 2015 2016 2015
Interbank loans receivable P=96,000,000 P=97,000,000 P=96,000,000 P=97,000,000SPURA 581,831,467 − 493,077,515 −
P=677,831,467 P=97,000,000 P=589,077,515 P=97,000,000
Interbank loans receivable by the Parent Company in local savings bank has a remaining maturityof one (1) to two (2) years in 2016 and two (2) to three (3) years in 2015.
As of December 31, 2016, placement on reverse repurchase agreement with BSP had a remainingmaturity of three (3) days. In 2016 and 2015, placements in BSP and other local savings bankearn interests ranging from 2.50% to 6.17% and from 2.50% to 6.17%, respectively.
7. Investment Securities
Financial Assets at FVPLThis account consists of investments by the Parent Company in:
2016 2015Derivatives assets P=1,322,995 P=−Government securities 1,232,190 5,132,724
P=2,555,185 P=5,132,724
The nominal annual interest rates of peso-denominated government securities range from 1.73% to4.60% in 2016 and from 3.30% to 5.75% in 2015. The nominal annual interest rates of foreigncurrency-denominated government securities range from 2.89% to 4.87% in 2016 and from 2.48%to 4.86% in 2015.

150 Robinsons Bank Annual Report 2016
NOTES TO financial STATEMENTS- 51 -
*SGVFS022572*
The table below shows the fair values of derivative financial instruments entered into by theParent Company, recorded as derivative assets/liabilities, together with the notional amounts. Thenotional amount is the amount of a derivative’s underlying asset, reference rate or index and is thebasis upon which changes in the value of derivatives are measured. The notional amounts indicatethe volume of transactions outstanding as of December 31, 2016 and 2015 and are not indicativeof either market risk or credit risk.
2016
AssetsLiabilities(Note 17)
Average
Maturity DateForward Notional
Rate AmountFreestanding DerivativesCurrency Swaps
Bought:USD/PHP P=− P=1,319,176 49.8815 $25,000,000 January 3 – January 12, 2017EUR/USD 1,267,485 − 1.0453 €1,000,000 January 10, 2017
Sold:PHP/USD − 6,128,575 49.8035 $14,000,000 January 3 – March 27, 2017USD/EUR 55,510 − 49.6269 €30,000,000 January 10, 2017
P=1,322,995 P=7,447,751
AFS InvestmentsThis account consists of investments in:
Consolidated Parent Company2016 2015 2016 2015
Government securities P=8,192,453,343 P=6,787,060,393 P=8,192,453,343 P=6,787,060,393Private bonds 3,222,098,803 1,378,397,236 3,222,098,803 1,378,397,236Quoted equity securities 305,500,000 12,062,000 305,500,000 12,062,000Unquoted equity securities 23,878,073 23,605,700 54,078,073 52,605,700
P=11,743,930,219 P=8,201,125,329 P=11,774,130,219 P=8,230,125,329
The EIR on AFS investments in peso-denominated and foreign currency-denominated governmentsecurities ranges from 2.57% to 4.71% and from 2.80% to 4.86%, respectively, in 2016 andfrom 3.11% to 8.14% and from 2.75% to 4.44%, respectively, in 2015. The EIR on AFSinvestments in peso-denominated and foreign currency-denominated private bonds rangesfrom 3.89% to 5.27% and from 3.56% to 7.10%, respectively, in 2016 and from 4.41% to 6.88%and from 3.74% to 6.50%, respectively, in 2015.
As of December 31, 2016 and 2015, the quoted equity securities of the Group consist of shares ofstocks in a private corporation.
Investments in unquoted equity securities include investment in shares of stock of PhilippineClearing House Corporation (PCHC). This investment is required to be held by the ParentCompany as part of its operations. The Parent Company does not have any plans to sell theseshares in the future. These securities are carried at cost due to the unpredictable nature of futurecash flows from these securities and the lack of suitable valuation for arriving at a reliable fairvalue estimate.
In 2016 and 2015, dividend income from equity securities under ‘AFS investments’ presentedunder ‘Miscellaneous income’ of the Group amounted to P=6.92 million and P=0.25 million,respectively (see Note 22).
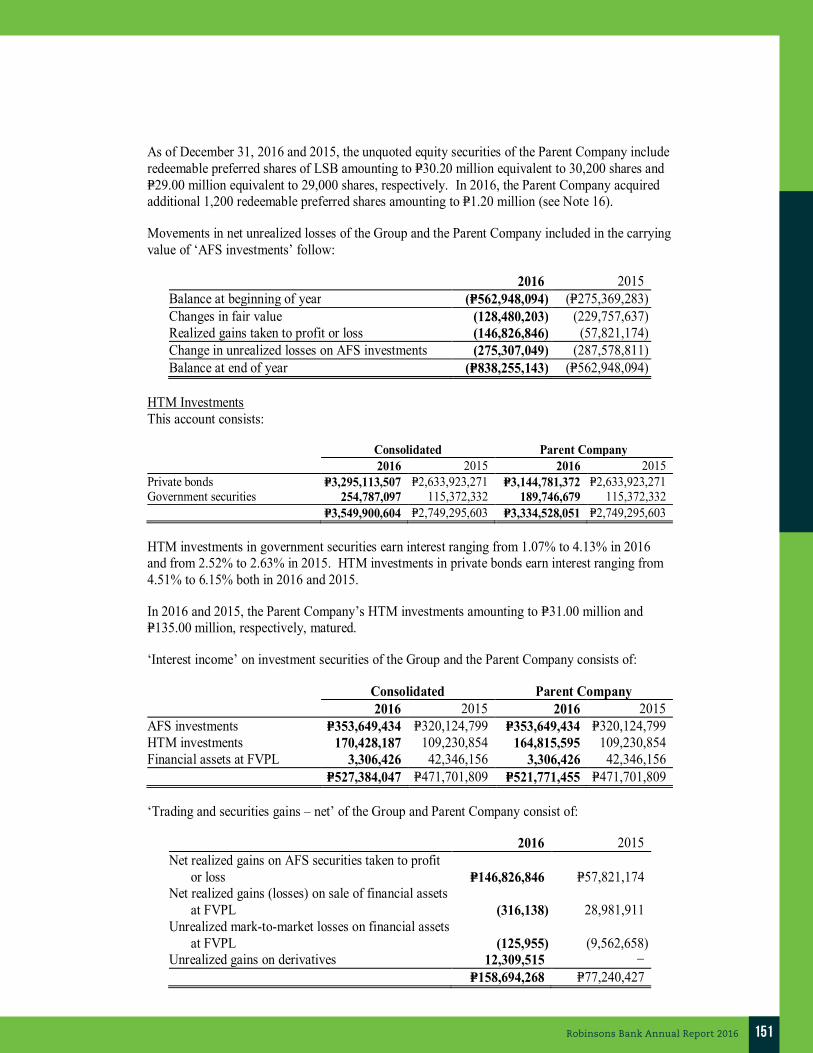
151Robinsons Bank Annual Report 2016
- 52 -
*SGVFS022572*
As of December 31, 2016 and 2015, the unquoted equity securities of the Parent Company includeredeemable preferred shares of LSB amounting to P=30.20 million equivalent to 30,200 shares andP=29.00 million equivalent to 29,000 shares, respectively. In 2016, the Parent Company acquiredadditional 1,200 redeemable preferred shares amounting to P=1.20 million (see Note 16).
Movements in net unrealized losses of the Group and the Parent Company included in the carryingvalue of ‘AFS investments’ follow:
2016 2015Balance at beginning of year (P=562,948,094) (P=275,369,283)Changes in fair value (128,480,203) (229,757,637)Realized gains taken to profit or loss (146,826,846) (57,821,174)Change in unrealized losses on AFS investments (275,307,049) (287,578,811)Balance at end of year (P=838,255,143) (P=562,948,094)
HTM InvestmentsThis account consists:
Consolidated Parent Company2016 2015 2016 2015
Private bonds P=3,295,113,507 P=2,633,923,271 P=3,144,781,372 P=2,633,923,271Government securities 254,787,097 115,372,332 189,746,679 115,372,332
P=3,549,900,604 P=2,749,295,603 P=3,334,528,051 P=2,749,295,603
HTM investments in government securities earn interest ranging from 1.07% to 4.13% in 2016and from 2.52% to 2.63% in 2015. HTM investments in private bonds earn interest ranging from4.51% to 6.15% both in 2016 and 2015.
In 2016 and 2015, the Parent Company’s HTM investments amounting to P=31.00 million andP=135.00 million, respectively, matured.
‘Interest income’ on investment securities of the Group and the Parent Company consists of:
Consolidated Parent Company2016 2015 2016 2015
AFS investments P=353,649,434 P=320,124,799 P=353,649,434 P=320,124,799HTM investments 170,428,187 109,230,854 164,815,595 109,230,854Financial assets at FVPL 3,306,426 42,346,156 3,306,426 42,346,156
P=527,384,047 P=471,701,809 P=521,771,455 P=471,701,809
‘Trading and securities gains – net’ of the Group and Parent Company consist of:
2016 2015Net realized gains on AFS securities taken to profit
or loss P=146,826,846 P=57,821,174Net realized gains (losses) on sale of financial assets
at FVPL (316,138) 28,981,911Unrealized mark-to-market losses on financial assets
at FVPL (125,955) (9,562,658)Unrealized gains on derivatives 12,309,515 −
P=158,694,268 P=77,240,427

152 Robinsons Bank Annual Report 2016
NOTES TO financial STATEMENTS- 53 -
*SGVFS022572*
8. Loans and Receivables
This account consists of:
Consolidated Parent Company2016 2015 2016 2015
Receivables from customers: Commercial (Note 24) P=27,820,217,445 P=19,473,540,367 P=27,503,181,551 P=19,152,178,905 Real estate 5,763,511,983 3,862,786,362 5,752,176,923 3,847,546,561 Consumption 5,217,952,917 3,727,749,391 4,564,423,973 3,178,321,325 Domestic bills purchased
(Notes 17 and 24) 139,337,392 606,548,470 139,337,392 606,548,47038,941,019,737 27,670,624,590 37,959,119,839 26,784,595,261
Less: unearned interest and discount 30,998,551 24,220,705 8,332,311 8,626,18038,910,021,186 27,646,403,885 37,950,787,528 26,775,969,081
Other receivables: Accrued interest receivable 493,726,051 397,268,645 454,754,720 372,066,140 Accounts receivable 348,198,599 218,207,275 323,793,278 209,506,011 Sales contract receivable 49,541,368 70,151,102 37,298,848 49,829,152 Lease receivables (Note 21) 8,614,547 6,356,824 − −
39,810,101,751 28,338,387,731 38,766,634,374 27,407,370,384Less: Allowance for credit losses
(Note 14) 913,019,864 769,545,245 797,284,966 721,268,058P=38,897,081,887 P=27,568,842,486 P=37,969,349,408 P=26,686,102,326
Sales contract receivable earn interest at annual fixed rates ranging from 6.25% to 52.10% andfrom 6.50% to 52.10% in 2016 and 2015, respectively.
Interest income on loans and receivables consists of:
Consolidated Parent Company2016 2015 2016 2015
Receivables from customers: Commercial P=1,076,902,794 P=956,944,794 P=1,040,826,798 P=931,758,029 Consumption 921,025,063 802,149,938 785,282,361 663,407,539 Real estate 314,683,992 278,990,191 314,097,616 274,442,403 Domestic bills purchased 455,965 482,050 455,965 482,050Others 15,093,007 7,624,970 10,100,772 5,142,882
P=2,328,160,821 P=2,046,191,943 P=2,150,763,512 P=1,875,232,903
Others consist of sales contract receivables and lease receivables.
Of the total receivables from customers of the Parent Company as of December 31, 2016 and2015, 36.29% and 41.25% respectively, are subject to periodic interest repricing. The EIR on theremaining receivables from customers of the Group ranges from 0.20% to 60.95% in 2016 andfrom 0.12% to 60.95% in 2015. The EIR on the remaining receivables from customers of theParent Company ranges from 2.00% to 60.95% in both years.

153Robinsons Bank Annual Report 2016
- 54 -
*SGVFS022572*
BSP ReportingAs of December 31, 2016 and 2015, information relating to secured loans by collateral type andunsecured receivables from customers follows:
Consolidated2016 2015
Amount % Amount %Secured by:
Real estate P=7,371,818,158 18.93 P=4,649,142,762 16.80Deposit hold-outs 2,604,951,023 6.69 1,267,114,262 4.58Chattel 1,913,195,794 4.91 1,164,546,525 4.21Others 3,620,650,848 9.30 5,222,155,736 18.87
15,510,615,823 39.83 12,302,959,285 44.46Unsecured 23,430,403,914 60.17 15,367,665,305 55.54
P=38,941,019,737 100.00 P=27,670,624,590 100.00
Parent Company2016 2015
Amount % Amount %Secured by:
Real estate P=7,266,575,046 19.14 P=4,515,503,821 16.86Chattel 2,590,747,470 6.83 1,144,166,816 4.27Deposit hold-outs 1,910,287,378 5.03 1,267,101,625 4.73Others 3,620,650,848 9.54 5,222,155,736 19.50
15,388,260,742 40.54 12,148,927,998 45.36Unsecured 22,570,859,097 59.46 14,635,667,263 54.64
P=37,959,119,839 100.00 P=26,784,595,261 100.00
Others include jewelry, mortgage trust indenture, company guarantees, deed of assignments ofreceivables and deed of suretyships.
As of December 31, 2016 and 2015, information on the concentration of credit as to industryfollows (in millions):
Consolidated Parent Company 2016 2015 2016 2015
Amount % Amount % Amount % Amount %Real estate, renting and business
services P=9,018 23.16 P=6,831 24.69 P=8,927 23.52 P=6,815 25.44Wholesale and retail trade 7,854 20.17 5,959 21.54 7,763 20.45 5,697 21.27Financial intermediaries 4,623 11.87 3,805 13.75 4,623 12.18 3,805 14.21Electricity, gas and water supply 3,860 9.91 1,867 6.75 3,860 10.17 1,867 6.97Loans to individuals for
consumption purposes 3,852 9.89 3,098 11.20 3,852 10.15 2,727 10.18Manufacturing 3,627 9.32 2,654 9.59 3,627 9.55 2,654 9.91Other community, social and
personal activities 2,017 5.18 729 2.63 1,303 3.43 730 2.73Transport, storage and
communication 1,758 4.52 1,597 5.77 1,758 4.63 1,597 5.96Agriculture, hunting and forestry 586 1.50 653 2.36 501 1.32 416 1.55Construction 580 1.49 471 1.70 580 1.53 471 1.76Health and social work 152 0.39 2 0.01 152 0.40 2 0.01Others 1,014 2.60 4 0.01 1,013 2.67 4 0.01
P=38,941 100.00 P=27,670 100.00 P=37,959 100.00 P=26,785 100.00
Others relate to mining and quarrying, hotels and restaurants and education.
The BSP considers that concentration risk exists when the total loan exposure to a particularindustry or economic sector exceeds 30.00% of the total loan portfolio.

154 Robinsons Bank Annual Report 2016
NOTES TO financial STATEMENTS- 55 -
*SGVFS022572*
Under banking regulations, non-performing loans (NPLs) shall, as a general rule, refer to loanswhose principal and/or interest is unpaid for thirty (30) days or more after due date or after theyhave become past due in accordance with existing BSP rules and regulations. This shall apply toloans payable in lump sum and loans payable in quarterly, semi-annual, or annual installments, inwhich case, the total outstanding balance thereof shall be considered non-performing. Under BSPCircular No. 772, which was issued on October 16, 2012, gross NPLs include NPLs that arecovered with 100.00% allowance.
In the case of receivables that are payable in monthly installments, the total outstanding balancethereof shall be considered non-performing when three (3) or more installments are in arrears. Inthe case of receivables that are payable in daily, weekly, or semi-monthly installments, the totaloutstanding balance thereof shall be considered non-performing at the same time that they becomepast due in accordance with existing BSP regulations, i.e., the entire outstanding balance of thereceivable shall be considered as past due when the total amount of arrearages reaches 10.00% ofthe total receivable balance. Restructured receivables which do not meet the requirements to betreated as performing receivables shall also be considered as NPLs.
The Group classifies its loans and receivables as NPL in compliance with BSP regulations, orwhen, in the opinion of management, collection of interest or principal is doubtful. Loans andreceivables are not reclassified as performing until interest and principal payments are broughtcurrent or the loans are restructured in accordance with existing BSP regulations and futurepayments appear assured.
As of December 31, 2016 and 2015, details of these NPLs follow:
Consolidated Parent Company2016 2015 2016 2015
Secured P=217,159,825 P=240,710,476 P=152,204,657 P=177,752,958Unsecured 921,465,654 877,580,470 539,003,323 498,353,895
P=1,138,625,479 P=1,118,290,946 P=691,207,980 P=676,106,853
As of December 31, 2016 and 2015, NPLs of the Group and of the Parent Company as reported tothe BSP follow:
Consolidated Parent Company2016 2015 2016 2015
Total NPLs P=1,138,625,479 P=1,118,290,946 P=691,207,980 P=676,106,853Deductions as required by the
BSP* 784,875,886 712,703,960 397,721,518 344,617,958P=353,749,593 P=405,586,986 P=293,486,462 P=331,488,895
*Allowance for credit losses per BSP
Restructured receivables which do not meet the requirements to be treated as performingreceivables shall also be considered as NPLs. Restructured receivables of the Parent Company asof December 31, 2016 and 2015 amounted to P=348.01 million and P=356.96 million, respectively.

155Robinsons Bank Annual Report 2016
- 56 -
*SGVFS022572*
9. Investment in a Subsidiary
On July 25, 2012, the Parent Company’s BOD approved the acquisition of the 100.00%controlling interest (both common and preferred shares) in LSB. Further, it was resolved that theParent Company would seek approval from the Monetary Board (MB) of the BSP for theacquisition and other incentives.
On August 15, 2012, the MB of the BSP issued its approval in principle of the Parent Company’srequest to acquire LSB and of all the incentives requested by the Parent Company subject to thesubmission of the necessary requirements.
Beginning August 27, 2012, the Parent Company executed a share purchase agreement (SPA) withthe LSB stockholders and made the related partial settlements therewith. The stock and transferbooks of LSB will be updated upon the issuance of the certificate authorizing registration from theBIR. As of December 26, 2012, the Parent Company and majority of LSB stockholders hadsigned on the SPA.
On December 26, 2012, the MB of the BSP approved the SPA covering the Parent Company’sacquisition of the 100.00% common shares of LSB. The deeds of sale to implement the SPA wereexecuted afterwards.
In addition to the approval of the acquisition, the MB of the BSP approved the following mergerincentives:
1. Grant of several branch licenses to the Parent Company in restricted areas and waiver ofcorresponding P=20.00 million special branch licensing fee for each restricted branch license,subject to the following conditions: (a) the establishment of the awarded branches in restrictedareas shall be subject to compliance with all other applicable provisions on branchestablishment prescribed under Section X151 of the Manual of Regulations for Banks(MORB); and (b) branches shall be opened within three (3) years from BSP final approval ofthe Parent Company’s acquisition of LSB.
2. Waiver of (a) the monetary penalties aggregating P=6.40 million as of November 30, 2012 forviolation of laws assessed by BSP on LSB, except penalties accruing to other parties, e.g.,Micro, Small and Medium Enterprises Development Council Fund. Such waiver shall notpreclude BSP from pursuing watchlisting and imposition of non-monetary and administrativesanctions (e.g., fines, disqualifications, suspensions and/or removal from office) against thedirectors and officers of LSB in accordance with applicable banking laws and regulations,without prejudice to the filing of criminal cases against liable persons under Section 34, 35and 36 of Republic Act No. 7653 (the New Central Bank Act); (b) the applicablerestrictions/ceilings on transactions between the Parent Company and LSB, for a period ofthree months, with respect to the Parent Company’s liquidity support to LSB (through depositsto and/or purchase of receivables from LSB).
3. Staggered booking, up to five (5) years from final BSP approval of the Parent Company’sacquisition of LSB, of the P=274.10 million required allowance for probable losses on LSB’srisk assets. The periodic amortization shall be charged against current operations, inaccordance with the regulatory accounting guidelines for deferred loss recognition underAppendix 56a (to Subsection X394.10) of the MORB. The unamortized losses shall bededucted from qualifying capital for purposes of capital adequacy ratio computation and fromcomputation of LSB’s unimpaired capital under Subsection X116.1 of the MORB.

156 Robinsons Bank Annual Report 2016
NOTES TO financial STATEMENTS- 57 -
*SGVFS022572*
4. Retention of the thrift branch license of LSB on its existing eleven (11) branches, for itsoperations as a wholly-owned subsidiary of the Parent Company to pursue microfinance andcountry-side banking.
5. Approval of the following interlocking positions:
a. concurrent assignment of the Parent Company’s Head of Legal Services as CorporateSecretary of LSB;
b. secondment of the officers of the Parent Company to LSB to assume the position ofPresident and Chief Compliance Officer subject to the condition that these officers shall(i) relinquish all their duties, responsibilities, and signing authorities in the ParentCompany and (ii) receive compensation/salaries and other emoluments from LSB; and
c. notation of the interlocking directorships and officership-directorships of the ParentCompany.
Based on the foregoing events, the Parent Company acquired effective control and management ofLSB as of December 26, 2012. Accordingly, in accordance with PFRS 3, Business Combinations,the Parent Company’s date of acquisition of LSB is December 26, 2012. However, forconvenience purposes, the Group used December 31, 2012 as the cut-off in determining the fairvalue of the net assets of LSB. Therefore, only the fair values of the identifiable assets andliabilities of LSB as December 31, 2012 were consolidated and the profit and loss of LSB for theyear ended December 31, 2012 were excluded from the Group’s consolidated financial statementsas of December 31, 2012.
The acquisition resulted in recognition of goodwill amounting to P=244.33 million. There were noadjustments resulting from the final purchase price allocation from LSB. As of December 31,2016 and 2015, goodwill amounted to P=244.33 million.
On August 22, 2012, the BOD of the Parent Company approved the infusion of cash equity tobring LSB’s capital adequacy ratio (CAR) to at least 10.00% amounting to P=620.00 million. InDecember 2012, the Parent Company infused the P=620.00 million to LSB as a deposit for futurestock subscription.
On January 23, 2013, the BOD of LSB approved the conversion of deposit for future stocksubscription amounting to P=174.04 million equivalent to 1.74 million shares at P=100.00 par valueper share.
On June 22, 2015, LSB obtained approval of its application for increase in authorized capital stockfrom the BSP.
On September 28, 2015, LSB filed its application for the increase in its authorized capital stockwith the SEC and paid for the related filing fees on January 11, 2016. On January 13, 2016, theSEC approved LSB’s application for the increase in its authorized capital stock. LSB convertedthe outstanding deposit for future stock subscription amounting to P=445.96 million equivalentto 4.46 million shares at P=100.00 par value.
On April 27, 2016, the Parent Company infused additional capital to LSB amounting toP=400.00 million equivalent to 4.00 million shares at P=100.00 par value.

157Robinsons Bank Annual Report 2016
- 58 -
*SGVFS022572*
As of December 31, 2016 and 2015, the Parent Company‘s investment in LSB consists of:
December 31,December 31,
2015January 1,
20152016 (As restated – Note 2)
CostBalance at beginning of year P=782,647,853 P=811,791,275 P=731,000,000Capital infusion 400,000,000 − −Balance at end of year 1,182,647,853 811,791,275 731,000,000Accumulated equity in net incomeShare in net income (loss) of a subsidiary 22,386,977 (29,610,905) 81,026,397Accumulated equity in OCIRemeasurement gain (loss) on retirement
liability (150,820) 467,483 (235,122)22,236,157 (29,143,422) 80,791,275
P=1,204,884,010 P=782,647,853 P=811,791,275
10. Property and Equipment
The composition of and the movements in this account follow:
Consolidated2016
Land BuildingTransportation
EquipmentLeasehold
Improvements
Furniture,Fixtures and
Equipment TotalCostBalance at beginning of year P=14,703,332 P=55,097,696 P=144,927,502 P=475,604,173 P=683,357,742 P=1,373,690,445Additions − − 17,745,866 133,163,203 58,303,997 209,213,066Disposals − − (7,382,851) − − (7,382,851)Reclassification − − 8,459,565 − − 8,459,565Balance at end of year 14,703,332 55,097,696 163,750,082 608,767,376 741,661,739 1,583,980,225Accumulated depreciation and
amortizationBalance at beginning of year − 24,457,866 84,381,680 283,658,119 510,665,880 903,163,545Depreciation and amortization − 3,038,335 24,258,818 69,709,080 74,188,407 171,194,640Disposals − − (5,320,917) − − (5,320,917)Reclassification − (2,182,010) (1,827,724) 4,475,659 (465,925) −Balance at end of year − 25,314,191 101,491,857 357,842,858 584,388,362 1,069,037,268Allowance for impairment losses
(Note 14)Balance at beginning of year − − − − − −Provision 1,912,400 − − − − 1,912,400Balance at end of year 1,912,400 − − − − 1,912,400Net Book Value at End of the Year P=12,790,932 P=29,783,505 P=62,258,225 P=250,924,518 P=157,273,377 P=513,030,557

158 Robinsons Bank Annual Report 2016
NOTES TO financial STATEMENTS- 59 -
*SGVFS022572*
Consolidated2015
Land BuildingTransportation
EquipmentLeasehold
Improvements
Furniture,Fixtures and
Equipment TotalCostBalance at beginning of year P=14,703,332 P=53,076,058 P=132,459,338 P=395,234,602 P=687,197,140 P=1,282,670,470Additions − 11,500 29,221,842 76,083,240 74,356,400 179,672,982Disposals − − (21,514,593) (64,300) (83,993) (21,662,886)Reclassification − 2,010,138 4,760,915 4,350,631 (78,111,805) (66,990,121)Balance at end of year 14,703,332 55,097,696 144,927,502 475,604,173 683,357,742 1,373,690,445Accumulated depreciation and
amortizationBalance at beginning of year − 21,649,583 77,945,571 220,012,405 472,272,780 791,880,339Depreciation and amortization − 2,836,681 22,339,350 57,259,070 70,814,459 153,249,560Disposals − − (16,041,479) − − (16,041,479)Reclassification − (28,398) 138,238 6,386,644 (32,421,359) (25,924,875)Balance at end of year − 24,457,866 84,381,680 283,658,119 510,665,880 903,163,545Net Book Value at End of the Year P=14,703,332 P=30,639,830 P=60,545,822 P=191,946,054 P=172,691,862 P=470,526,900
Parent2016
BuildingTransportation
EquipmentLeasehold
Improvements
Furniture,Fixtures and
Equipment TotalCostBalance at beginning of year P=39,946,381 P=132,503,291 P=450,866,491 P=619,457,578 P=1,242,773,741Additions − 16,205,143 125,646,585 46,079,377 187,931,105Disposals − (7,082,851) − − (7,082,851)Reclassification − 8,459,565 − − 8,459,565Balance at end of year 39,946,381 150,085,148 576,513,076 665,536,955 1,432,081,560Accumulated depreciation and
amortizationBalance at beginning of year 16,589,183 75,531,022 273,909,308 462,194,708 828,224,221Depreciation and amortization 1,597,856 21,932,433 67,670,720 65,832,334 157,033,343Disposals − (5,145,915) − − (5,145,915)Balance at end of year 18,187,039 92,317,540 341,580,028 528,027,042 980,111,649Net Book Value at End of the Year P=21,759,342 P=57,767,608 P=234,933,048 P=137,509,913 P=451,969,911
Parent2015
BuildingTransportation
EquipmentLeasehold
Improvements
Furniture,Fixtures and
Equipment TotalCostBalance at beginning of year P=39,946,381 P=121,386,049 P=377,882,836 P=636,819,719 P=1,176,034,985Additions − 27,655,973 73,047,955 61,784,740 162,488,668Disposals − (21,514,593) (64,300) (83,993) (21,662,886)Reclassification − 4,975,862 − (79,062,888) (74,087,026)Balance at end of year 39,946,381 132,503,291 450,866,491 619,457,578 1,242,773,741Accumulated depreciation and
amortizationBalance at beginning of year 15,257,636 70,863,790 220,012,405 432,054,480 738,188,311Depreciation and amortization 1,331,547 20,708,711 53,896,903 63,007,675 138,944,836Disposals − (16,041,479) − − (16,041,479)Reclassification − − − (32,867,447) (32,867,447)Balance at end of year 16,589,183 75,531,022 273,909,308 462,194,708 828,224,221Net Book Value at End of the Year P=23,357,198 P=56,972,269 P=176,957,183 P=157,262,870 P=414,549,520
Gain on sale of property and equipment included in ‘Miscellaneous income’ amounted toP=3.86 million and P=0.68 million in 2016 and 2015, respectively, for the Group, and P=3.82 millionand P=0.68 million in 2016 and 2015, respectively, for the Parent Company (see Note 22).

159Robinsons Bank Annual Report 2016
- 60 -
*SGVFS022572*
The details of depreciation and amortization follow:
Consolidated Parent Company2016 2015 2016 2015
Property and equipment P=171,194,640 P=153,249,560 P=157,033,343 P=138,944,836Software costs (Note 13) 73,933,679 59,018,378 70,641,825 56,369,530Repossessed chattels (Note 13) 45,975,711 37,958,112 45,936,432 37,943,224Investment properties (Note 11) 10,984,617 6,749,378 9,419,569 4,432,873
P=302,088,647 P=256,975,428 P=283,031,169 P=237,690,463
As of December 31, 2016 and 2015, the cost of fully depreciated items of property and equipmentstill in use by the Group amounted to P=697.19 million and P=533.73 million, respectively.
As of December 31, 2016 and 2015, the cost of fully depreciated items of property and equipmentstill in use by the Parent Company amounted to P=644.76 million and P=487.77 million,respectively.
11. Investment Properties
The movements in this account, which consists of land and buildings, for the Group follow:
2016Land Building Total
CostBalances at beginning of year P=204,459,484 P=105,201,788 P=309,661,272Additions (Note 28) 41,829,746 49,522,434 91,352,180Disposals (24,663,347) (14,588,080) (39,251,427)Reclassifications 3,348,410 (3,348,410) −Balances at end of year 224,974,293 136,787,732 361,762,025Accumulated depreciationBalances at beginning of year − 31,816,561 31,816,561Depreciation (Note 10) − 10,984,617 10,984,617Disposals − (5,482,183) (5,482,183)Balances at end of year − 37,318,995 37,318,995Allowance for impairment losses
(Note 14)Balances at beginning of year 85,971,916 11,081,866 97,053,782Provisions (Reversals) (52,619,371) 607,594 (52,011,777)Disposals (3,476,669) (2,555,646) (6,032,315)Balances at end of year 29,875,876 9,133,814 39,009,690Net Book Value at End of the Year P=195,098,417 P=90,334,923 P=285,433,340
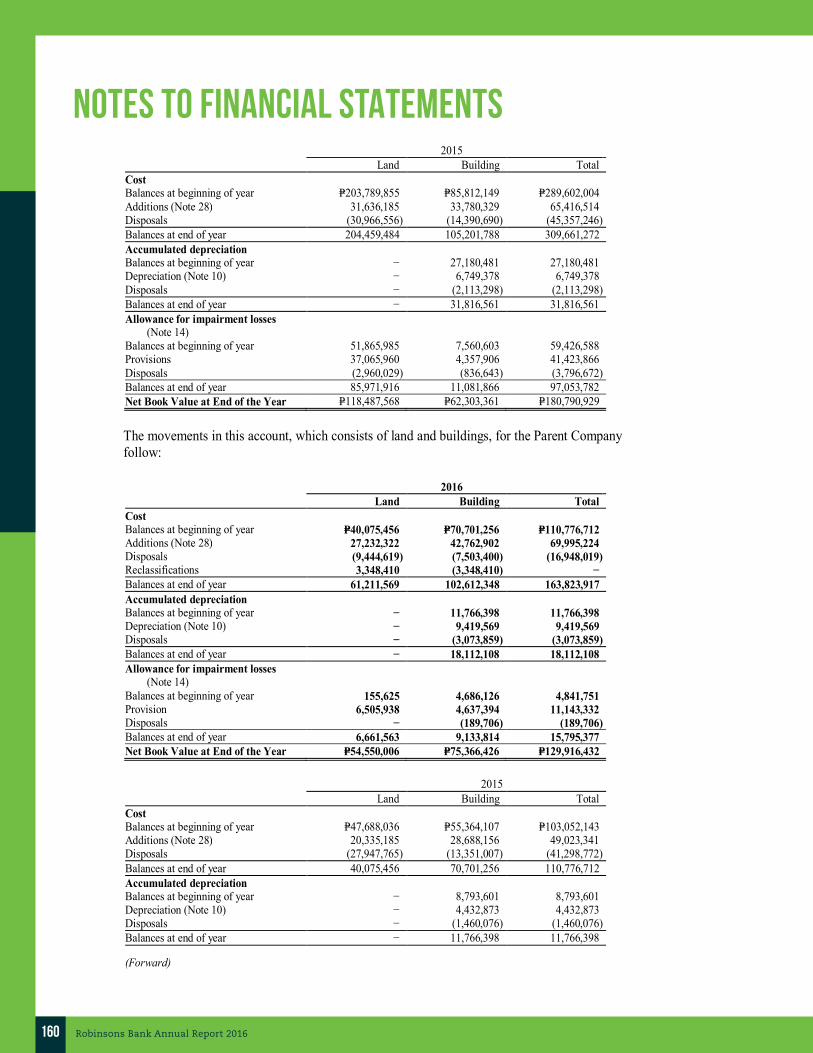
160 Robinsons Bank Annual Report 2016
NOTES TO financial STATEMENTS- 61 -
*SGVFS022572*
2015Land Building Total
CostBalances at beginning of year P=203,789,855 P=85,812,149 P=289,602,004Additions (Note 28) 31,636,185 33,780,329 65,416,514Disposals (30,966,556) (14,390,690) (45,357,246)Balances at end of year 204,459,484 105,201,788 309,661,272Accumulated depreciationBalances at beginning of year − 27,180,481 27,180,481Depreciation (Note 10) − 6,749,378 6,749,378Disposals − (2,113,298) (2,113,298)Balances at end of year − 31,816,561 31,816,561Allowance for impairment losses
(Note 14)Balances at beginning of year 51,865,985 7,560,603 59,426,588Provisions 37,065,960 4,357,906 41,423,866Disposals (2,960,029) (836,643) (3,796,672)Balances at end of year 85,971,916 11,081,866 97,053,782Net Book Value at End of the Year P=118,487,568 P=62,303,361 P=180,790,929
The movements in this account, which consists of land and buildings, for the Parent Companyfollow:
2016Land Building Total
CostBalances at beginning of year P=40,075,456 P=70,701,256 P=110,776,712Additions (Note 28) 27,232,322 42,762,902 69,995,224Disposals (9,444,619) (7,503,400) (16,948,019)Reclassifications 3,348,410 (3,348,410) −Balances at end of year 61,211,569 102,612,348 163,823,917Accumulated depreciationBalances at beginning of year − 11,766,398 11,766,398Depreciation (Note 10) − 9,419,569 9,419,569Disposals − (3,073,859) (3,073,859)Balances at end of year − 18,112,108 18,112,108Allowance for impairment losses
(Note 14)Balances at beginning of year 155,625 4,686,126 4,841,751Provision 6,505,938 4,637,394 11,143,332Disposals − (189,706) (189,706)Balances at end of year 6,661,563 9,133,814 15,795,377Net Book Value at End of the Year P=54,550,006 P=75,366,426 P=129,916,432
2015Land Building Total
CostBalances at beginning of year P=47,688,036 P=55,364,107 P=103,052,143Additions (Note 28) 20,335,185 28,688,156 49,023,341Disposals (27,947,765) (13,351,007) (41,298,772)Balances at end of year 40,075,456 70,701,256 110,776,712Accumulated depreciationBalances at beginning of year − 8,793,601 8,793,601Depreciation (Note 10) − 4,432,873 4,432,873Disposals − (1,460,076) (1,460,076)Balances at end of year − 11,766,398 11,766,398
(Forward)

161Robinsons Bank Annual Report 2016
- 62 -
*SGVFS022572*
2015Land Building Total
Allowance for impairment losses(Note 14)
Balances at beginning of year P=− P=1,164,863 P=1,164,863Provision 155,625 4,357,906 4,513,531Disposals − (836,643) (836,643)Balances at end of year 155,625 4,686,126 4,841,751Net Book Value at End of the Year P=39,919,831 P=54,248,732 P=94,168,563
Direct operating expenses on investment properties (recorded in ‘Litigation expense on assetsacquired’ under ‘Miscellaneous expense’) amounted to P=14.90 million and P=8.84 million in 2016and 2015, respectively, for the Group, and P=13.09 million and P=8.06 million in 2016 and 2015,respectively, for the Parent Company (see Note 22).
Gain on initial recognition of investment properties included in ‘Miscellaneous income’ of theGroup amounted to P=17.30 million and P=35.55 million in 2016 and 2015, respectively, for theGroup, and P=12.67 million and P=30.70 million in 2016 and 2015, respectively, for the ParentCompany (see Note 22).
Gain on sale of investment properties included in ‘Miscellaneous income’ amounted toP=8.15 million and P=10.47 million in 2016 and 2015, respectively for the Group and P=3.54 millionand P=5.94 million in 2016 and 2015, respectively, for the Parent Company (see Note 22).
12. Branch Licenses
The movements in this account follow:
Consolidated Parent Company2016 2015 2016 2015
CostBalance at beginning of year P=1,185,377,111 P=1,184,377,111 P=565,377,111 P=564,377,111Additions 44,600,000 1,000,000 44,000,000 1,000,000Balance at end of year 1,229,977,111 1,185,377,111 609,377,111 565,377,111Allowance for impairment losses
(Note 14)Balance at beginning and end of year 232,526,929 232,526,929 232,526,929 232,526,929
P=997,450,182 P=952,850,182 P=376,850,182 P=332,850,182
13. Other Assets
This account consists of:
Consolidated Parent Company2016 2015 2016 2015
Bills payment – contra P=626,363,142 P=128,910,734 P=626,363,142 P=128,910,734Software costs – net 353,353,540 401,094,027 348,001,639 393,848,032Creditable withholding tax 141,316,753 104,303,672 141,316,753 104,303,672Repossessed chattels – net 103,598,417 73,343,238 103,489,250 73,316,657Prepaid expenses 84,489,727 42,549,284 80,194,606 37,119,210Refundable deposits 57,201,471 46,377,395 55,721,032 45,877,084Sundry debits 27,898,129 20,107,049 27,898,129 18,975,425
(Forward)

162 Robinsons Bank Annual Report 2016
NOTES TO financial STATEMENTS- 63 -
*SGVFS022572*
Consolidated Parent Company2016 2015 2016 2015
Advance payment to suppliers P=25,857,400 P=15,893,833 P=25,857,400 P=15,893,833Documentary stamp tax on hand 25,806,925 30,359,307 23,048,149 27,722,633Others 20,946,370 16,610,749 14,800,243 13,843,586
1,466,831,874 879,549,288 1,446,690,343 859,810,866Allowance for impairment losses
(Note 14) (10,201,994) (7,866,310) (7,678,160) (7,478,160)P=1,456,629,880 P=871,682,978 P=1,439,012,183 P=852,332,706
Bills payment – contra is the contra account of bills payment under ‘Accrued expenses and otherliabilities’ (see Note 17).
Advance payment to suppliers consists of various down payments made to various suppliers andcontractors in connection with the Group’s and the Parent Company’s operation and other projectssuch as branch expansions.
Software costs – net represent costs incurred to date in the development of the Parent Company’score banking and other systems that are under the testing phase and will be rolled out aftercompletion of all the phases, including but not limited to further enhancement and testing. In2016, all phases were completed and this was reclassified to software cost.
Others include stationeries, office supplies, and other miscellaneous assets.
In 2016 and 2015, the Parent Company recognized provision for impairment losses on certainmiscellaneous assets amounting to P=0.20 million and P=7.48 million, respectively.The composition of and the movements in ‘Repossessed chattels – net’ of the Group follow:
2016Cars Others Total
CostBalances at beginning of year P=10,730,001 P=114,513,229 P=125,243,230Additions (Note 28) 22,680,000 202,906,603 225,586,603Disposals (12,995,000) (174,146,215) (187,141,215)Reclassifications (8,400,000) (615,500) (9,015,500)Balances at end of year 12,015,001 142,658,117 154,673,118Accumulated depreciationBalances at beginning of year 5,846,529 32,197,840 38,044,369Depreciation (Note 10) 2,950,281 43,025,430 45,975,711Disposals (4,803,995) (38,455,663) (43,259,658)Reclassifications (1,108,909) (89,631) (1,198,540)Balances at end of year 2,883,906 36,677,976 39,561,882Allowance for impairment losses
(Note 14)Balances at beginning of year 873,576 12,982,047 13,855,623Provisions 1,045,676 5,968,500 7,014,176Disposals (353,736) (9,003,244) (9,356,980)Balances at end of year 1,565,516 9,947,303 11,512,819Net Book Value at End of the Year P=7,565,579 P=96,032,838 P=103,598,417

163Robinsons Bank Annual Report 2016
- 64 -
*SGVFS022572*
2015Cars Others Total
CostBalances at beginning of year P=30,228,903 P=66,950,590 P=97,179,493Additions (Note 28) 13,629,098 114,463,913 128,093,011Disposals (26,490,000) (66,634,274) (93,124,274)Reclassifications (6,638,000) (267,000) (6,905,000)Balances at end of year 10,730,001 114,513,229 125,243,230Accumulated depreciationBalances at beginning of year 7,512,885 20,133,460 27,646,345Depreciation (Note 10) 12,132,116 25,825,996 37,958,112Disposals (11,977,639) (13,653,311) (25,630,950)Reclassifications (1,820,833) (108,305) (1,929,138)Balances at end of year 5,846,529 32,197,840 38,044,369Allowance for impairment losses
(Note 14)Balances at beginning of year − 7,523,147 7,523,147Provisions 873,576 5,650,310 6,523,886Disposals − (191,410) (191,410)Balances at end of year 873,576 12,982,047 13,855,623Net Book Value at End of the Year P=4,009,896 P=69,333,342 P=73,343,238
The composition of and the movements in ‘Repossessed chattels – net’ of the Parent Companyfollow:
2016Cars Others Total
CostBalances at beginning of year P=10,730,001 P=114,432,703 P=125,162,704Additions (Note 28) 22,680,000 202,740,303 225,420,303Disposals (12,995,000) (174,085,591) (187,080,591)Reclassifications (8,400,000) (615,500) (9,015,500)Balances at end of year 12,015,001 142,471,915 154,486,916Accumulated depreciationBalances at beginning of year 5,846,529 32,152,548 37,999,077Depreciation (Note 10) 2,950,281 42,986,151 45,936,432Disposals (4,803,995) (38,439,474) (43,243,469)Reclassifications (1,108,909) (89,631) (1,198,540)Balances at end of year 2,883,906 36,609,594 39,493,500Allowance for impairment losses
(Note 14)Balances at beginning of year 873,576 12,973,394 13,846,970Provision 1,045,676 5,968,500 7,014,176Disposals (353,736) (9,003,244) (9,356,980)Balances at end of year 1,565,516 9,938,650 11,504,166Net Book Value at End of the Year P=7,565,579 P=95,923,671 P=103,489,250
2015Cars Others Total
CostBalances at beginning of year P=30,228,903 P=66,684,664 P=96,913,567Additions (Note 28) 13,629,098 114,457,901 128,086,999Disposals (26,490,000) (66,442,862) (92,932,862)Reclassifications (6,638,000) (267,000) (6,905,000)Balances at end of year 10,730,001 114,432,703 125,162,704
(Forward)

164 Robinsons Bank Annual Report 2016
NOTES TO financial STATEMENTS- 65 -
*SGVFS022572*
2015Cars Others Total
Accumulated depreciationBalances at beginning of year P=7,512,885 P=20,103,055 P=27,615,940Depreciation (Note 10) 12,132,116 25,811,108 37,943,224Disposals (11,977,639) (13,653,310) (25,630,949)Reclassifications (1,820,833) (108,305) (1,929,138)Balances at end of year 5,846,529 32,152,548 37,999,077Allowance for impairment losses
(Note 14)Balances at beginning of year − 7,331,729 7,331,729Provision 873,576 5,641,665 6,515,241Balances at end of year 873,576 12,973,394 13,846,970Net Book Value at End of the Year P=4,009,896 P=69,306,761 P=73,316,657
Gain on initial recognition of repossessed chattels included in ‘Miscellaneous income’ amountedto P=25.02 million in 2016 and P=6.00 million in 2015, for the Group, and P=25.07 million in 2016and P=6.00 million in 2015, for the Parent Company (Note 22).
Loss on sale of repossessed chattels included in ‘Miscellaneous expense’ amounted toP=13.78 million and P=13.79 million in 2016, for the Group and the Parent Company, respectively.Gain on sale of repossessed chattels included in ‘Miscellaneous income’ amounted to P=12.43million and P=12.28 million in 2015, respectively, for the Group and the Parent Company,respectively (see Note 22).
Movements in ‘Software costs – net’ follow:
Consolidated Parent Company2016 2015 2016 2015
CostBalance at beginning of year P=572,885,012 P=109,348,152 P=559,242,555 P=104,553,716Additions 26,193,192 9,779,795 24,795,432 2,444,000Reclassification − 453,757,065 − 452,244,839
599,078,204 572,885,012 584,037,987 559,242,555Accumulated amortizationBalance at beginning of year 171,790,985 78,391,643 165,394,523 76,157,546Amortization (Note 10) 73,933,679 59,018,378 70,641,825 56,369,530Reclassification/others − 34,380,964 − 32,867,447Balance at end of year 245,724,664 171,790,985 236,036,348 165,394,523Net Book Value at the End of
the Year P=353,353,540 P=401,094,027 P=348,001,639 P=393,848,032

165Robinsons Bank Annual Report 2016
- 66 -
*SGVFS022572*
14. Allowance for Credit and Impairment Losses
Movements in the allowance for credit and impairment losses follow:
Consolidated Parent Company2016 2015 2016 2015
Balances at beginning of yearLoans and receivables P=769,545,245 P=652,437,168 P=721,268,058 P=633,997,148Investment properties 97,053,782 59,426,588 4,841,751 1,164,863Branch licenses 232,526,929 232,526,929 232,526,929 232,526,929Repossessed chattels 13,855,623 7,523,147 13,846,970 7,331,729Other assets 7,866,310 388,150 7,478,160 −
1,120,847,889 952,301,982 979,961,868 875,020,669Provision for the year 155,922,043 266,048,342 147,571,357 195,460,767Disposals (15,389,295) (4,045,538) (9,546,686) (836,643)Reversals/others (53,196,942) (88,471,547) (53,196,941) (84,697,575)Accounts charged-off − (4,985,350) − (4,985,350)
87,335,806 168,545,907 84,827,730 104,941,199Balances at end of year
Loans and receivables (Note 8) 913,019,864 769,545,245 797,284,966 721,268,058Property and equipment (Note 10) 1,912,400 − − −Investment properties (Note 11) 39,009,690 97,053,782 15,795,377 4,841,751Branch licenses (Note 12) 232,526,929 232,526,929 232,526,929 232,526,929Repossessed chattels (Note 13) 11,512,819 13,855,623 11,504,166 13,846,970Other assets (Note 13) 10,201,994 7,866,310 7,678,160 7,478,160
P=1,208,183,696 P=1,120,847,889 P=1,064,789,598 P=979,961,868
A reconciliation of the allowance for credit losses by class of loans and receivables follows(in thousands):
Consolidated2016
Commercial Consumption Real Estate
DomesticBills
Purchased Others TotalBalance at beginning of year P=362,454 P=207,256 P=24,866 P=5,467 P=169,502 P=769,545Provisions for the year 130,929 57,427 (1,449) 14,932 (5,167) 196,672Reversals/others 15,426 (45,540) (9,170) − (13,913) (53,197)Balance at end of year P=508,809 P=219,143 P=14,247 P=20,399 P=150,422 P=913,020Individual impairment P=350,466 P=139,405 P=6,509 P=− P=21,455 P=517,869Collective impairment 158,343 79,738 7,738 20,399 128,967 395,151
P=508,809 P=219,143 P=14,247 P=20,399 P=150,422 P=913,020Gross amount of loans and
receivables individuallydetermined to beimpaired P=745,379 P=141,432 P=7,887 P=− P=30,298 P=924,996

166 Robinsons Bank Annual Report 2016
NOTES TO financial STATEMENTS- 67 -
*SGVFS022572*
Parent Company2016
Commercial Consumption Real Estate
DomesticBills
Purchased Others TotalBalance at beginning of year P=364,703 P=194,192 P=16,571 P=5,467 P=140,335 P=721,268Provisions for the year 68,709 43,062 − 14,932 2,511 129,214Reversals/others 15,427 (45,540) (9,170) − (13,913) (53,197)Balance at end of year P=448,839 P=191,714 P=7,400 P=20,399 P=128,933 P=797,285Individual impairment P=184,831 P=− P=− P=− P=− P=184,831Collective impairment 264,008 191,714 7,400 20,399 128,933 612,454
P=448,839 P=191,714 P=7,400 P=20,399 P=128,933 P=797,285Gross amount of loans and
receivables individuallydetermined to be impaired P=554,364 P=− P=− P=− P=− P=554,364
Consolidated2015
Commercial Consumption Real Estate
DomesticBills
Purchased Others TotalBalance at beginning of year P=306,026 P=232,300 P=48,259 P=2,795 P=63,058 P=652,438Provisions for the year 94,403 123,848 10,596 − 18,693 247,540Reversals/others (37,975) (143,907) (33,989) 2,672 87,751 (125,448)Accounts charged-off – (4,985) – − − (4,985)Balance at end of year P=362,454 P=207,256 P=24,866 P=5,467 P=169,502 P=769,545Individual impairment P=229,726 P=111,273 P=8,295 P=− P=29,167 P=378,461Collective impairment 132,728 95,983 16,571 5,467 140,335 391,084
P=362,454 P=207,256 P=24,866 P=5,467 P=169,502 P=769,545Gross amount of loans and
receivables individuallydetermined to be impaired P=893,659 P=180,428 P=12,523 P=− P=38,424 P=1,125,034
Parent Company2015
Commercial Consumption Real Estate
DomesticBills
Purchased Others TotalBalance at beginning of year P=301,194 P=225,831 P=44,069 P=2,795 P=60,108 P=633,997Provisions for the year 77,473 86,824 1,822 − 10,835 176,954Reversals/others (13,964) (113,478) (29,320) 2,672 69,392 (84,698)Accounts charged-off − (4,985) − − − (4,985)Balance at end of year P=364,703 P=194,192 P=16,571 P=5,467 P=140,335 P=721,268Individual impairment P=198,221 P=1,536 P=− P=− P=− P=199,757Collective impairment 166,482 192,656 16,571 5,467 140,335 521,511
P=364,703 P=194,192 P=16,571 P=5,467 P=140,335 P=721,268Gross amount of loans and
receivables individuallydetermined to be impaired P=672,818 P=1,608 P=− P=− P=− P=674,426
Below is the breakdown of provision for (reversal of) credit and impairment losses:
Consolidated Parent Company2016 2015 2016 2015
Loans and receivables P=196,671,560 P=210,622,430 P=129,213,849 P=176,953,835Investment properties (52,011,777) 41,423,866 11,143,332 4,513,531Repossessed chattels 7,014,176 6,523,886 7,014,176 6,515,241Property and equipment 1,912,400 – – –Other assets 2,335,684 7,478,160 200,000 7,478,160
P=155,922,043 P=266,048,342 P=147,571,357 P=195,460,767

167Robinsons Bank Annual Report 2016
- 68 -
*SGVFS022572*
15. Deposit Liabilities
Of the total deposit liabilities of the Group as of December 31, 2016 and 2015, 52.12% and40.84%, respectively, are subject to periodic interest repricing. Remaining deposit liabilities bearannual fixed interest rates ranging from nil to 2.88% in 2016 and from nil to 1.00% in 2015,respectively.
On March 27, 2014, the BSP through Circular 830 approved the 1.00% increase in reserverequirements effective April 11, 2014, thereby increasing the reserve requirements on non-FCDUdeposit liabilities of the Parent Company and LSB from 18.00% to 19.00% and 6.00% to 7.00%respectively. As mandated by the Circular, only demand deposit accounts maintained by the bankwith the BSP are eligible for compliance with reserve requirements, thereby excludinggovernment securities and cash in vault as eligible reserves. Further, deposits maintained with theBSP in compliance with the reserve requirement shall no longer be paid interest. On May 8, 2014,the BSP, through BSP Circular 832, approved the 1.00% increase in reserve requirement effectiveMay 30, 2014, thereby further increasing the reserve requirements on non-FCDU deposit liabilitiesof the Parent Company and LSB from 19.00% to 20.00% and from 7.00% to 8.00%, respectively.
The Group’s liquidity and statutory reserves as reported to the BSP follow:
Consolidated Parent Company2016 2015 2016 2015
Due from BSP P=11,015,517,416 P=7,402,250,327 P=10,872,258,187 P=7,259,740,992
As of December 31, 2016 and 2015, the Group is in compliance with the regulations.
Details of interest expense on deposit liabilities follow:
Consolidated Parent Company2016 2015 2016 2015
Savings P=327,306,744 P=287,391,613 P=315,475,701 P=270,638,593Time 319,618,027 274,848,318 300,207,579 253,812,635Demand 1,938,352 1,785,501 1,938,352 1,785,501
P=648,863,123 P=564,025,432 P=617,621,632 P=526,236,729
16. Redeemable Preferred Shares
In 2013, the Parent Company acquired 29,000 redeemable preferred shares at P=1,000 par valuefrom LSB (see Note 7). Details of LSB’s redeemable preferred shares as of December 31, 2016and 2015 follow:
Shares AmountPreferred shares – P=1,000 par value
Authorized 50,000 P=50,000,000Issued and outstanding
Balances at beginning and end of year 30,700 P=30,700,000

168 Robinsons Bank Annual Report 2016
NOTES TO financial STATEMENTS- 69 -
*SGVFS022572*
The preferred shares has the following features:a. The minimum subscription is 100 shares and payable in cash;b. The shares shall earn monthly interest at a rate to be fixed by the BOD, but such interest shall
not be less than the prevailing market interest rates and said shares shall not be treated as timedeposit, deposit substitute or as other form of borrowings;
c. The interest shall be paid in the form of dividends cumulatively, which may be declaredannually or as often as the BOD may determine;
d. The shares shall have preference in the distribution of dividends and in the distribution ofassets in case of liquidation or dissolution, provided, however that no dividend shall bedeclared or paid on redeemable shares in the absence of sufficient undivided profits, freesurplus and approval of the BSP;
e. The shares are non-voting on matters provided for in the last paragraph of Section 6 of theCorporation Code;
f. Pre-emptive rights are not available on preferred shares nor shall they be subject to one andthe shares shall be held for five (5) years with a right of alienation or encumbrance of the sameto any third person within the period of five years from the original date of subscription,provided, however, that on the 5th year the holder shall be obliged to surrender the same to thecorporation and upon prior approval of the BSP and in compliance with the provisions of theMORB and the BSP’s circulars regarding this matter, the corporation shall be obliged to takeup the subscription at the price when the preferred shares of stock were originally subscribed.Provided that shares redeemed are replaced with at least an equivalent amount of newly paid-in shares so that the total paid-in capital stock is maintained at the same level immediatelyprior to redemption and provided further, that the corporation is not insolvent or if suchredemption will not cause insolvency, impairment of capital or inability of the corporation tomeet its debts as they mature; and
g. As of December 31, 2013, LSB has not yet created a sinking fund pending request from BSPto redeem and retire the preferred shares. The fund that will be used to redeem the preferredshares will be taken from the equity infused by the Parent Company.
As discussed in Note 9, the SEC’s approved LSB’s application for increase in authorizedcapital stock on January 13, 2016.
The shares may again be disposed of by LSB for a price fixed by the BOD. Based on the BODresolution on March 6, 2013, the entire redeemable preferred shares of LSB will be retired after itsredemption subject to BSP’s approval. As of December 31, 2016 and 2015, the entire redeemablepreferred shares of LSB are still subject to BSP’s approval.
17. Accrued Expenses and Other Liabilities
Accrued expenses account consist of:
Consolidated Parent Company2016 2015 2016 2015
Accrued expenses P=322,888,723 P=382,395,275 P=315,439,003 P=373,329,115Accrued interest payable 97,510,939 60,358,604 97,137,965 60,262,143
P=420,399,662 P=442,753,879 P=412,576,968 P=433,591,258
Accrued expenses consist of accruals and provisions for general expenses, bonuses and insuranceon deposits, fees and advertisements.
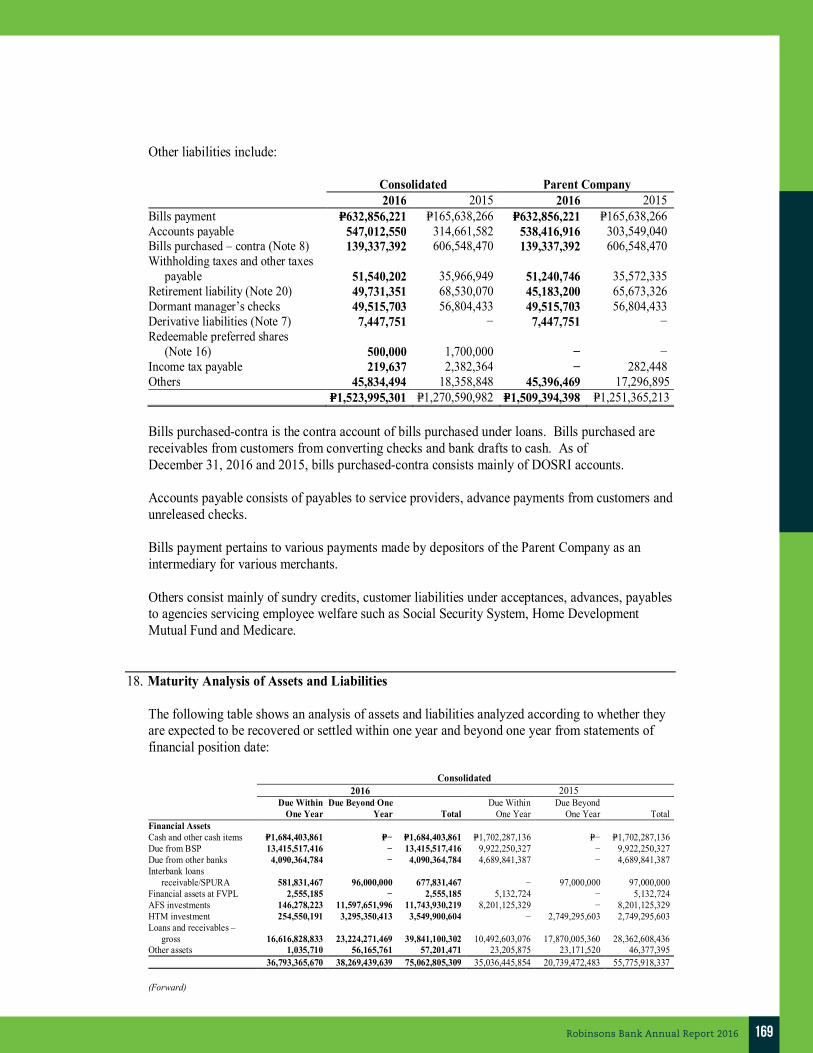
169Robinsons Bank Annual Report 2016
- 70 -
*SGVFS022572*
Other liabilities include:
Consolidated Parent Company2016 2015 2016 2015
Bills payment P=632,856,221 P=165,638,266 P=632,856,221 P=165,638,266Accounts payable 547,012,550 314,661,582 538,416,916 303,549,040Bills purchased – contra (Note 8) 139,337,392 606,548,470 139,337,392 606,548,470Withholding taxes and other taxes
payable 51,540,202 35,966,949 51,240,746 35,572,335Retirement liability (Note 20) 49,731,351 68,530,070 45,183,200 65,673,326Dormant manager’s checks 49,515,703 56,804,433 49,515,703 56,804,433Derivative liabilities (Note 7) 7,447,751 − 7,447,751 −Redeemable preferred shares
(Note 16) 500,000 1,700,000 − −Income tax payable 219,637 2,382,364 − 282,448Others 45,834,494 18,358,848 45,396,469 17,296,895
P=1,523,995,301 P=1,270,590,982 P=1,509,394,398 P=1,251,365,213
Bills purchased-contra is the contra account of bills purchased under loans. Bills purchased arereceivables from customers from converting checks and bank drafts to cash. As ofDecember 31, 2016 and 2015, bills purchased-contra consists mainly of DOSRI accounts.
Accounts payable consists of payables to service providers, advance payments from customers andunreleased checks.
Bills payment pertains to various payments made by depositors of the Parent Company as anintermediary for various merchants.
Others consist mainly of sundry credits, customer liabilities under acceptances, advances, payablesto agencies servicing employee welfare such as Social Security System, Home DevelopmentMutual Fund and Medicare.
18. Maturity Analysis of Assets and Liabilities
The following table shows an analysis of assets and liabilities analyzed according to whether theyare expected to be recovered or settled within one year and beyond one year from statements offinancial position date:
Consolidated2016 2015
Due WithinOne Year
Due Beyond OneYear Total
Due WithinOne Year
Due BeyondOne Year Total
Financial AssetsCash and other cash items P=1,684,403,861 P=− P=1,684,403,861 P=1,702,287,136 P=− P=1,702,287,136Due from BSP 13,415,517,416 − 13,415,517,416 9,922,250,327 − 9,922,250,327Due from other banks 4,090,364,784 − 4,090,364,784 4,689,841,387 − 4,689,841,387Interbank loans
receivable/SPURA 581,831,467 96,000,000 677,831,467 − 97,000,000 97,000,000Financial assets at FVPL 2,555,185 − 2,555,185 5,132,724 − 5,132,724AFS investments 146,278,223 11,597,651,996 11,743,930,219 8,201,125,329 − 8,201,125,329HTM investment 254,550,191 3,295,350,413 3,549,900,604 − 2,749,295,603 2,749,295,603Loans and receivables –
gross 16,616,828,833 23,224,271,469 39,841,100,302 10,492,603,076 17,870,005,360 28,362,608,436Other assets 1,035,710 56,165,761 57,201,471 23,205,875 23,171,520 46,377,395
36,793,365,670 38,269,439,639 75,062,805,309 35,036,445,854 20,739,472,483 55,775,918,337
(Forward)

170 Robinsons Bank Annual Report 2016
NOTES TO financial STATEMENTS- 71 -
*SGVFS022572*
Consolidated2016 2015
Due WithinOne Year
Due Beyond OneYear Total
Due WithinOne Year
Due BeyondOne Year Total
Non-financial AssetsProperty and equipment –
net P=− P=513,030,557 P=513,030,557 P=− P=470,526,900 P=470,526,900Investment properties – net − 285,433,340 285,433,340 − 180,790,929 180,790,929Branch licenses – net − 997,450,182 997,450,182 − 952,850,182 952,850,182Deferred tax asset − 53,435,098 53,451,334 − 3,325,050 3,325,050Goodwill − 244,327,006 244,327,006 − 244,327,006 244,327,006Other assets 890,556,639 508,871,770 1,399,412,173 299,903,361 525,402,222 825,305,583
P=37,683,922,309 P=40,871,987,592 78,555,909,901 P=35,336,349,215 P=23,116,694,772 58,453,043,987Less:Unearned interest and
discounts 30,998,551 24,220,705Allowance for credit and
impairment losses – loansand receivables 913,019,864 769,545,245
P=77,611,891,486 P=57,659,278,037Financial LiabilitiesDeposit liabilities P=59,123,635,173 P=4,171,464,853 P=63,295,100,026 P=39,410,367,245 P=4,257,391,848 P=43,667,759,093Manager’s checks 404,180,308 − 404,180,308 289,136,769 − 289,136,769Accrued expenses 420,399,662 − 420,399,662 442,753,879 − 442,753,879Other liabilities 1,377,238,397 − 1,377,238,397 1,149,837,104 − 1,149,837,104
61,325,453,540 4,171,464,853 65,496,918,393 41,292,094,997 4,257,391,848 45,549,486,845Non-financial LiabilitiesOther liabilities 96,525,553 50,231,351 146,756,904 52,223,808 68,530,070 120,753,878
P=61,421,979,093 P=4,221,696,204 P=65,643,675,297 P=41,344,318,805 P=4,325,921,918 P=45,670,240,723
Parent2016 2015 (As Restated – Note 2)
Due WithinOne Year
Due BeyondOne Year Total
Due WithinOne Year
Due BeyondOne Year Total
Financial AssetsCash and other cash items P=1,653,720,370 P=− P=1,653,720,370 P=1,665,564,278 P=− P=1,665,564,278Due from BSP 12,722,258,187 − 12,722,258,187 9,189,740,992 − 9,189,740,992Due from other banks 3,995,280,423 − 3,995,280,423 4,596,213,199 − 4,596,213,199Interbank loans
receivable/SPURA 493,077,515 96,000,000 589,077,515 − 97,000,000 97,000,000Financial assets at FVPL 2,555,185 − 2,555,185 5,132,724 − 5,132,724AFS investments 176,478,223 11,597,651,996 11,774,130,219 8,230,125,329 − 8,230,125,329HTM investment 239,560,181 3,094,967,870 3,334,528,051 − 2,749,295,603 2,749,295,603Loans and receivables –
gross 16,465,803,192 22,309,163,493 38,774,966,685 10,092,084,091 17,323,912,473 27,415,996,564Other assets 194,611 55,526,421 55,721,032 23,205,875 22,671,209 45,877,084
35,748,927,887 37,153,309,780 72,902,237,667 33,802,066,488 20,192,879,285 53,994,945,773Non-financial AssetsProperty and equipment –
net − 451,969,911 451,969,911 − 414,549,520 414,549,520Investment properties – net − 129,916,432 129,916,432 − 94,168,563 94,168,563Branch licenses – net − 376,850,182 376,850,182 − 332,850,182 332,850,182Deferred tax asset − 194,482,918 194,499,154 − 142,537,278 142,537,278Investment in subsidiary − 1,204,884,010 1,204,884,010 − 782,647,853 782,647,853Other assets 890,356,639 492,934,512 1,383,274,915 293,756,050 512,699,572 806,455,622
P=36,639,284,528 P=40,004,347,745 76,643,632,271 P=34,095,822,538 P=22,472,332,253 56,568,154,791Less:Unearned interest and
discounts (loans) 8,332,311 8,626,180Allowance for credit and
impairment losses – loansand receivables 797,284,966 721,268,058
P=75,838,014,994 P=55,838,260,553Financial LiabilitiesDeposit liabilities P=57,772,149,864 P=3,771,497,267 P=61,543,647,131 P=38,027,804,564 P=3,847,325,435 P=41,875,129,999Manager’s checks 404,180,308 − 404,180,308 289,136,769 − 289,136,769Accrued expenses 412,576,968 − 412,576,968 433,591,258 − 433,591,258Other liabilities 1,367,573,983 − 1,367,573,983 1,149,837,104 − 1,149,837,104
59,956,481,123 3,771,497,267 63,727,978,390 39,900,369,695 3,847,325,435 43,747,695,130Non-financial LiabilitiesOther liabilities 96,637,215 45,183,200 141,820,415 35,854,783 65,673,326 101,528,109
P=60,053,118,338 P=3,816,680,467 P=63,869,798,805 P=39,936,224,478 P=3,912,998,761 P=43,849,223,239

171Robinsons Bank Annual Report 2016
- 72 -
*SGVFS022572*
19. Equity
As of December 31, 2016 and 2015, the Parent Company’s capital stock consists of:
Shares Amount2016 2015 2016 2015
Common shares - P=10 par value Authorized 1,500,000,000 43,683,500 P=15,000,000,000 P=436,835,000Issued and outstanding Issued and outstanding 43,683,500 43,683,500 P=436,835,000 P=436,835,000 Issued during the year 1,156,316,500 – 11,563,165,000 –Balances at end of year 1,200,000,000 43,683,500 P=12,000,000,000 P=436,835,000
Preferred shares A - P=10 par value Authorized − 356,316,500 P=− P=3,563,165,000 Issued and outstanding Balance at beginning of year 356,316,500 310,641,564 3,563,165,000 3,106,415,640 Issuance of preferred shares A − 45,674,936 − 456,749,360 Conversion of preferred shares A (356,316,500) − (3,563,165,000) −
− 356,316,500 − 3,563,165,000Preferred shares B - P=10 par value
Authorized − 210,000,000 − 2,100,000,000 Issued and outstanding Balance at beginning of year 210,000,000 209,604,710 2,100,000,000 2,096,047,100 Issuance of preferred shares B − 395,290 − 3,952,900 Conversion of preferred shares B (210,000,000) − (2,100,000,000) −
− 210,000,000 − 2,100,000,000− 566,316,500 P=− P=5,663,165,000
The preferred shares have the following features:
a. Preferred stockholders are entitled to receive preferential but non-cumulative dividends at therate to be determined by the BOD.
b. Preferred stocks are redeemable at the option of the Parent Company at any time provided thatthe redemption price shall not be lower than the par value or higher than 110.00% of said parvalue;
c. In the event of any voluntary or involuntary liquidation, the preferred stockholders are entitledto receive the liquidation value of the said shares equivalent to 110.00% of the par value plusany unpaid but declared dividends thereon. If the net assets of the Parent Company shall beinsufficient to pay in full the liquidation value of all the preferred stock, then such netresources shall be distributed among such preferred stock ratably in accordance with therespective liquidation value of the shares they are holding.
Surplus ReservesIn compliance with existing BSP regulations, 10.00% of the net profits realized by the ParentCompany from its trust business is appropriated to surplus reserve. The yearly appropriation isrequired until the surplus reserve for trust business equals 20.00% of the Parent Company’sregulatory capital.
In 2016 and 2015, the Parent Company’s BOD approved to appropriate reserves for self-insuranceamounting to P=3.60 million and for trust reserves amounting to P=0.93 million and P=2.62 million,respectively.

172 Robinsons Bank Annual Report 2016
NOTES TO financial STATEMENTS- 73 -
*SGVFS022572*
Capital ManagementThe Group considers the equity attributable to the equity holders of the Parent Company as thecapital base of the Group. The primary objectives of the Group’s capital management are toensure that it complies with externally imposed capital requirements and that it maintains strongcredit ratings and healthy capital ratios in order to support its business and to maximizeshareholders value.
The Group manages its capital structure and makes adjustments to it in the light of changes ineconomic conditions and the risk characteristics of its activities and assessment of prospectivebusiness requirements or directions. In order to maintain or adjust the capital structure, the Groupmay adjust the amount and mode of dividend payment to shareholders, issue capital securities orundertake a share buy-back. The processes and policies guiding the determination of thesufficiency of capital for the Group relative to its business risks are the very same methodologythat have been incorporated into the Group’s Internal Capital Adequacy Assessment Process(ICAAP) in compliance with the requirements of BSP Circular No. 639 for its adoption. Underthis framework, the assessment of risks extends beyond the Pillar 1 set of credit, market andoperational risks and onto other risks deemed material by the Group. The level and structure ofcapital are assessed and determined in light of the Group’s business environment, plans,performance, risks and budget; as well as regulatory edicts. BSP requires submission of anICAAP document every January 31.
The Group had complied with all externally imposed capital requirements throughout the year.
Regulatory Qualifying CapitalIn 2013, the determination of the Parent Company’s compliance with regulatory requirements andratios is based on the amount of the Parent Company’s ‘unimpaired capital’ (regulatory net worth)reported to the BSP, which is determined on the basis of regulatory policies. In addition, the risk-based capital ratio of a bank, expressed as a percentage of qualifying capital to risk-weightedassets, should not be less than 10.00% for both solo basis (head office and branches) andconsolidated basis (parent company and subsidiaries engaged in financial allied undertakings).Qualifying capital and risk-weighted assets are computed based on BSP regulations.
The regulatory Gross Qualifying Capital of the Parent Company consists of Tier 1 (core) andTier 2 (supplementary) capital. Tier 1 capital comprises share capital, retained earnings (includingcurrent year profit) and non-controlling interest less required deductions such as deferred tax andunsecured credit accommodations to DOSRI. Tier 2 capital includes unsecured subordinated note,revaluation reserves and general loan loss provision. Certain items are deducted from theregulatory Gross Qualifying Capital, such as but not limited to equity investments inunconsolidated subsidiary banks and other financial allied undertakings, but excludinginvestments in debt capital instruments of unconsolidated subsidiary banks (for solo basis) andequity investments in subsidiary non-financial allied undertakings.
Risk-weighted assets are determined by assigning defined risk weights to statement of financialposition exposures and to the credit equivalent amounts of off-balance sheet exposures. Certainitems are deducted from risk-weighted assets, such as the excess of general loan loss provisionover the amount permitted to be included in Tier 2 capital. The risk weights vary from 0.00% to125.00% depending on the type of exposure, with the risk weights of off-balance sheet exposuresbeing subjected further to credit conversion factors. Following is a summary of risk weights andselected exposure types:

173Robinsons Bank Annual Report 2016
- 74 -
*SGVFS022572*
Risk weight Exposure/Asset type*0% Cash on hand; claims collateralized by securities issued by the non-government, BSP;
loans covered by the Trade and Investment Development Corporation of the Philippines;real estate mortgages covered by the Home Guarantee Corporation
20% COCI, claims guaranteed by Philippine incorporated banks/quasi-banks with the highestcredit quality; claims guaranteed by foreign incorporated banks with the highest creditquality; loans to exporters to the extent guaranteed by Small Business Guarantee andFinance Corporation
50% Housing loans fully secured by first mortgage on residential property; LocalGovernment Unit (LGU) bonds which are covered by Deed of Assignment of InternalRevenue allotment of the LGU and guaranteed by the LGU Guarantee Corporation
75% Direct loans of defined Small Medium Enterprise and microfinance loans portfolio;nonperforming housing loans fully secured by first mortgage
100% All other assets (e.g., real estate assets) excluding those deducted from capital (e.g.,deferred tax)
125% All NPLs (except nonperforming housing loans fully secured by first mortgage) and allnonperforming debt securities
* Not all inclusive
With respect to off-balance sheet exposures, the exposure amount is multiplied by a creditconversion factor (CCF), ranging from 0.00% to 100.00%, to arrive at the credit equivalentamount, before the risk weight factor is multiplied to arrive at the risk-weighted exposure. Directcredit substitutes (e.g., guarantees) have a CCF of 100.00%, while items not involving credit riskhas a CCF of 0.00%.
On January 15, 2013, the BSP issued Circular No. 781, Basel III Implementing Guidelines onMinimum Capital Requirements, which provides the implementing guidelines on the revised risk-based capital adequacy framework particularly on the minimum capital and disclosurerequirements for universal banks and commercial banks, as well as their subsidiary banks andquasi-banks, in accordance with the Basel III standards. The circular is effective onJanuary 1, 2014.
The Circular sets out a minimum Common Equity Tier 1 (CET1) ratio of 6.00% and Tier 1 capitalratio of 7.50%. It also introduces a capital conservation buffer of 2.50% comprised of CET1capital. The BSP’s existing requirement for Total CAR remains unchanged at 10.00% and theseratios shall be maintained at all times.
Further, existing capital instruments as of December 31, 2010 which do not meet the eligibilitycriteria for capital instruments under the revised capital framework shall no longer be recognizedas capital upon the effectivity of Basel III. Capital instruments issued under BSP CircularNos.709 and 716 (the circulars amending the definition of qualifying capital particularly onHybrid Tier 1 and Lower Tier 2 capitals), starting January 1, 2011 and before the effectivity ofBSP Circular No. 781, shall be recognized as qualifying capital until December 31, 2015. Inaddition to changes in minimum capital requirements, this Circular also requires variousregulatory adjustments in the calculation of qualifying capital.
On June 27, 2014, the BSP issued Circular No. 839, REST Limit for Real Estate Exposures whichprovides the implementing guidelines on the prudential REST limit for universal, commercial, andthrift banks on their aggregate real estate exposures. The Circular sets out a minimum REST limitof 6.00% CET1 capital ratio and 10.00% risk-based capital adequacy ratio, on a solo andconsolidated basis, under a prescribed write-off rate of 25.00% on the Group’s real estateexposure. These limits shall be complied with at all times.

174 Robinsons Bank Annual Report 2016
NOTES TO financial STATEMENTS- 75 -
*SGVFS022572*
On June 9, 2015, the BSP issued Circular No. 881, Implementing Guidelines on the Basel IIILeverage Ratio Framework, which provides implementing guidelines for universal, commercial,and their subsidiary banks/quasi banks. The circular sets out a minimum leverage ratio of 5.00%on a solo and consolidated basis and shall be complied with at all times.
The CAR of the Group and of the Parent Company as reported to the BSP as of December 31,2016 and 2015 follows:
2016 2015Common Equity Tier 1 Capital P=10,270 P=5,024Additional Tier 1 Capital − 5,663Tier 1 capital 10,270 10,687Tier 2 capital 318 242Total qualifying capital P=10,588 P=10,929Credit RWA P=38,391 P=28,044Market RWA 223 104Operational RWA 4,224 3,632Total RWA P=42,838 P=31,780Common Equity Tier 1 Ratio 1 23.97% 15.81%Additional Tier 1 Ratio 0.00% 17.82%Tier 1 capital ratio 23.97% 33.63%Tier 2 capital ratio 0.74% 0.76%Risk-based capital adequacy ratio 24.71% 34.39%
As of December 31, 2016 and 2015, the Group was in compliance with the required CAR.
On October 29, 2014, the BSP issued amendments to Circular No. 854 which required a newminimum capitalization for Banks. The Parent Company, as a commercial bank with more than100 branches, was required to increase its capitalization to P=15.00 billion.
On January 28, 2015 and February 25, 2015, the BOD of the Parent Company and thestockholders representing at least two-thirds (2/3) of the outstanding capital stock, respectively,approved the issuance of the remaining 46,070,226 unissued preferred shares (A and B) at P=10.00par value in favor of JGSCSC and RRHI as follows:
Stockholder Types of SharesNo. of SharesSubscribed Par Value Amount
JGSCSC Preferred A 27,404,962 P=10 P=274,049,620Preferred B 237,174 10 2,371,740
RRHI Preferred A 18,269,974 10 182,699,740Preferred B 158,116 10 1,581,160
Total 46,070,226 P=460,702,260
Furthermore, the BOD also approved the following resolutions:∂ Conversion of all preferred shares of the Parent Company, whether issued or unissued,
particularly the 356.32 million preferred shares A and the 210.00 million preferred shares B,into common shares, and removal of all the other class of shares of the Parent Company,except common shares.
∂ Increase in the Parent Company’s authorized capital stock from P=6.10 billion divided into610.00 million common shares with par value of P=10.00 each.

175Robinsons Bank Annual Report 2016
- 76 -
*SGVFS022572*
∂ The total authorized stock of the Parent Company is P=15.00 billion divided into 1.50 billioncommon shares with a par value of P=10.00 each.
On March 15, 2015, JGSCSC acquired additional preferred shares A and B of 27,404,962 sharesand 237,174 shares, respectively.
In 2015, RRHI acquired additional preferred shares A and B of 18,269,974 shares and 158,116shares, respectively.
On June 17, 2015, RRHI subscribed to an additional 297,094,118 common shares at P=10.00 pershare.
On July 8, 2015, JGSCSC subscribed to an additional 292,905,882 common shares at P=10.00 pershare.
On July 9, 2015, the Parent Company BOD approved the increase in authorized capital stockamounting to P=8.90 billion composed of 890.00 million common shares at P=10.00 per share. Outof the P=8.90 billion increase, P=5.90 billion was paid-up and subscribed as follows:
StockholderNo. of SharesSubscribed Amount
JGSCSC 292,905,882 P=2,929,058,820RRHI 297,094,118 2,970,941,180Total 590,000,000 P=5,900,000,000
On November 15, 2015, the BSP approved the Parent Company’s capital build-up program withthe following milestones:1. Capital infusion from unissued shares up to the existing authorized capital stock of
P=6.10 billion.2. Capital infusion from the increase in authorized capital stock from P=6.10 billion to
P=15.00 billion of which P=12.00 billion is paid up.3. Internally generated capital based on the Parent Company’s financial projections for the
period 2015 to 2019.
The approval of BSP to the capital build-up program further provides that the Parent Company shall:1. Refrain from declaring and distributing cash dividends until the P=15.00 billion minimum
capital requirement is attained;2. Call on its stockholders to infuse additional capital in case of shortfall in internally-generated
income to meet the target capital levels; and3. Submit progress reports with supporting documents, duly noted by its BOD, to the Central
Point of Contact Department II, within 20 banking days from end of December of each tearuntil the Bank is deemed by the BSP to have fully complied with its capital build-up program.
On December 15, 2015, the Parent Company filed its application for the increase in its authorizedcapital stock as approved by the BOD and the BSP with the SEC.

176 Robinsons Bank Annual Report 2016
NOTES TO financial STATEMENTS- 77 -
*SGVFS022572*
On January 29, 2016, the SEC approved the Parent Company’s application for the increase inauthorized capital stock from P=6.10 billion divided into 43.68 million common shares,356.32 million preferred shares A and 210.00 million preferred shares B of P=10.00 par value each,to P=12.00 billion divided into 633.64 million common shares, 356.32 million preferred shares Aand 210.00 million preferred shares B of P=10.00 par value each.
In 2016, the Parent Company issued 590.00 million common shares amounting to P=5.90 billion inexchange for the deposits for future subscriptions.
In 2016, the Parent Company removed all the other classes of shares, except common shares, andconverted its 356.32 million preferred shares A and 210.00 million preferred shares B to566.32 million common shares with P=10.00 par value.
SurplusAs of December 31, 2016 and 2015, a portion of the Parent Company’s retained earningsamounting to P=188.03 million and P=142.54 million, respectively, relating to deferred tax asset, andP=838.26 million and P=562.95 million, respectively, relating to changes in fair value of AFS, is notavailable for dividend declaration in accordance with SEC Memorandum Circular No. 11 andSRC Rule 68.
20. Retirement Plan
The Parent Company has a noncontributory defined benefit retirement covering substantially allits officers and regular employees. Under this retirement plan, all covered officers and employeesare entitled to cash benefits after satisfying certain age and service requirements. In 2008, theParent Company established a plan asset for its defined benefit retirement plan.
LSB has an unfunded noncontributory retirement plan covering all its regular permanentemployees. Under the retirement plan, all employees are entitled to cash benefits after satisfyingcertain age and service requirements.
The latest actuarial valuation of the retirement plan of the Group was made as ofDecember 31, 2016. The principal actuarial assumptions used in determining retirement liabilityof the Group as of January 1 follow:
Parent Company LSB2016 2015 2016 2015
Average remaining working life inyears 6 11 10 11
Discount rate 5.27% 4.99% 5.54% 5.09%Salary rate increase 5.70% 5.70% 5.70% 5.00%
The amounts recognized in the statements of financial position follow:
Consolidated Parent Company2016 2015 2016 2015
Present value of defined benefitobligation P=130,697,133 P=123,620,708 P=128,020,411 P=120,763,964
Fair value of plan assets (80,965,782) (55,090,638) (82,837,211) (55,090,638)Retirement liability P=49,731,351 P=68,530,070 P=45,183,200 P=65,673,326

177Robinsons Bank Annual Report 2016
- 78 -
*SGVFS022572*
The amounts of ‘Retirement expense’ included in ‘Compensation and fringe benefits’ in thestatements of income follow:
Consolidated Parent Company2016 2015 2016 2015
Current service cost P=26,724,158 P=20,569,822 P=25,293,666 P=19,128,703Net interest cost 3,422,140 2,463,204 3,277,099 2,379,186
P=30,146,298 P=23,033,026 P=28,570,765 P=21,507,889
Changes in net defined benefit obligation (DBO) of funded funds follow:
ConsolidatedPresent Value
of DBOFair Value of
Plan AssetsNet Retirement
LiabilityJanuary 1, 2016 P=123,620,708 P=55,090,638 P=68,530,070Net Benefit Cost in Consolidated
Statement of IncomeCurrent service cost 26,724,158 − 26,724,158Net interest cost 6,089,146 2,667,006 3,422,140
Sub-total 32,813,304 2,667,006 30,146,298Benefits paid (1,225,393) (1,225,393) −Remeasurement in OCI
Return on plan assets(excluding amount includedin net interest) (67,520) (860,135) 792,615
Actuarial changes arising fromexperience adjustments (2,652,787) − (2,652,787)
Actuarial changes arising fromchanges infinancial/demographicassumptions (21,791,179) − (21,791,179)
Sub-total (24,511,486) (860,135) (23,651,351)Contributions − 25,293,666 (25,293,666)December 31, 2016 P=130,697,133 P=80,965,782 P=49,731,351
ConsolidatedPresent Value
of DBOFair Value of
Plan AssetsNet Retirement
LiabilityJanuary 1, 2015 P=107,160,282 P=53,413,915 P=53,746,367Net Benefit Cost in Consolidated
Statement of IncomeCurrent service cost 18,698,393 − 18,698,393Net interest cost 4,909,561 2,446,357 2,463,204Sub-total 23,607,954 2,446,357 21,161,597
Remeasurement in OCIReturn on plan assets
(excluding amount includedin net interest) − (769,634) 769,634
(Forward)

178 Robinsons Bank Annual Report 2016
NOTES TO financial STATEMENTS- 79 -
*SGVFS022572*
ConsolidatedPresent Value
of DBOFair Value of
Plan AssetsNet Retirement
LiabilityActuarial changes arising from
experience adjustments (P=1,557,812) P=− (P=1,557,812)Actuarial changes arising from
changes infinancial/demographicassumptions (5,589,716) − (5,589,716)
Sub-total (7,147,528) (769,634) (6,377,894)December 31, 2015 P=123,620,708 P=55,090,638 P=68,530,070
Parent CompanyPresent Value
of DBOFair Value of
Plan AssetsNet Retirement
LiabilityJanuary 1, 2016 P=120,763,964 P=55,090,638 P=65,673,326Net Benefit Cost Statement of
IncomeCurrent service cost 25,293,666 − 25,293,666Net interest cost 5,944,105 2,667,006 3,277,099
Sub-total 31,237,771 2,667,006 28,570,765Benefits paid (1,225,393) (1,225,393) −Remeasurement in OCI
Return on plan assets(excluding amount includedin net interest) − (860,135) 860,135
Actuarial changes arising fromexperience adjustments (2,836,181) − (2,836,181)
Actuarial changes arising fromchanges in financialassumptions (21,791,179) − (21,791,179)
Sub-total (24,627,360) (860,135) (23,767,225)Contributions − 25,293,666 (25,293,666)December 31, 2016 P=126,148,982 P=80,965,782 P=45,183,200
Parent CompanyPresent Value
of DBOFair Value of
Plan AssetsNet Retirement
LiabilityJanuary 1, 2015 P=105,361,192 P=53,413,915 P=51,947,277Net Benefit Cost Statement of
IncomeCurrent service cost 17,257,274 − 17,257,274Net interest cost 4,825,543 2,446,357 2,379,186Sub-total 22,082,817 2,446,357 19,636,460
Remeasurement in OCIReturn on plan assets
(excluding amount includedin net interest) − (769,634) 769,634
Actuarial changes arising fromexperience adjustments (1,662,861) − (1,662,861)
(Forward)

179Robinsons Bank Annual Report 2016
- 80 -
*SGVFS022572*
Parent CompanyPresent Value
of DBOFair Value of
Plan AssetsNet Retirement
LiabilityActuarial changes arising from
changes in financialassumptions (P=5,017,184) P=− (P=5,017,184)
Sub-total (6,680,045) (769,634) (5,910,411)December 31, 2015 P=120,763,964 P=55,090,638 P=65,673,326
The major categories of plan assets as a percentage of the fair value of total plan assets follow:
2016 2015Deposits in banks 72.63% 60.65%Debt securities 27.10% 39.06%Other assets 0.27% 0.29%
100.00% 100.00%
Movements in “Remeasurement losses on retirement plan” in OCI follow:
Consolidated2016 2015
Balance at beginning of year P=26,844,846 P=33,321,046Remeasurement losses (gains) on retirement plan in
OCIReturn on plan assets (excluding amount
included in net interest) 792,615 (1,101,795)Due to experience adjustments (2,652,787) (1,557,812)Due to changes in financial/demographic
assumptions (21,791,179) (5,589,716)Remeasurement losses (gains) during the year (23,651,351) (8,249,323)Tax effect 7,165,114 1,773,123
Remeasurement losses during the year, net of tax (16,486,237) (6,476,200)Balance at end of year, net of tax P=10,358,609 P=26,844,846
Parent Company2016 2015
Balance at beginning of year P=27,077,207 P=33,085,924Effect of early adoption of PAS 27 (Note 2) (232,361) 235,122
26,844,846 33,321,046Remeasurement losses (gains) on retirement plan in
OCIReturn on plan assets (excluding amount
included in net interest) 860,135 (1,101,795)Due to experience adjustments (2,836,181) (1,662,861)Due to changes in financial/demographic assumptions (21,791,179) (5,017,184)Remeasurement losses (gains) during the year (23,767,225) (7,781,840)Tax effect 7,130,168 1,073,279
Remeasurement losses during the year, net of tax (16,637,057) (6,708,561)Effect of adoption of Amended PAS 27 (Note 2) 150,820 232,361
(16,486,237) (6,476,200)Balance at end of year, net of tax P=10,358,609 P=26,844,846

180 Robinsons Bank Annual Report 2016
NOTES TO financial STATEMENTS- 81 -
*SGVFS022572*
The sensitivity analysis below has been determined based on reasonably possible changes ofeach significant assumption on the DBO as of December 31, 2016, assuming if all otherassumptions were held constant:
Consolidated Parent Company+/- basis points
(bps) Impact to DBO Impact to DBODiscount rate +100 bps (P=120,131,501) (P=116,194,738)
-100 bps 142,870,744 137,576,236Salary increase rate +100 bps 143,555,487 138,240,060
-100 bps (119,344,416) (115,434,562)
The sensitivity analysis below has been determined based on reasonably possible changes ofeach significant assumption on the DBO as of December 31, 2015, assuming if all otherassumptions were held constant:
+/- basis points Consolidated Parent Company(bps) Impact to DBO Impact to DBO
Discount rate +100 bps (P=110,734,435) (P=108,265,697)-100 bps 138,947,279 135,616,094
Salary increase rate +100 bps 139,487,513 136,142,511-100 bps (110,047,094) (107,595,704)
Shown below is the maturity analysis of the undiscounted benefit payments:
Consolidated Parent Company2016 2015 2016 2015
Less than 1 year P=6,782,350 P=3,301,694 P=6,760,113 P=3,287,263More than 1 year to 5 years 49,233,106 39,330,154 48,218,318 38,168,884More than 5 years to 10 years 109,549,008 90,526,363 106,602,246 88,879,509More than 10 years to 15 years 220,065,974 175,750,706 207,554,266 167,478,227More than 15 years to 20 years 187,952,652 240,516,298 169,639,965 228,285,840More than 20 years 363,788,797 825,254,069 282,348,379 769,793,789
The weighted average duration of the defined benefit obligation is equivalent to 22.03 years and21.58 years in 2016 and 2015, respectively.
21. Leases
Operating Lease - Group as LesseeThe Parent Company leases its head office and branch premises for periods ranging from one (1)to ten (10) years, renewable upon mutual agreement of both parties. LSB also leases the premisesoccupied by its head offices and most of its branches for periods ranging from five (5) to fifteen(15) years, renewable upon mutual agreement of both parties. Various lease contracts of theGroup include escalation clauses, most of which bear annual rent increase ranging from 5.00% to10.00%.
Lease rentals charged to operations amounting to P=277.52 million and P=241.41 million in 2016and 2015, respectively, are included under ‘Occupancy and equipment-related expenses’ in thestatements of income for the Group.

181Robinsons Bank Annual Report 2016
- 82 -
*SGVFS022572*
Future minimum rentals payable on non-cancellable leases follow:
Consolidated Parent Company2016 2015 2016 2015
Within one year P=261,639,924 P=212,898,691 P=252,450,190 P=205,167,726Beyond one year but not more than
five years 531,101,622 476,759,239 496,308,714 453,857,638More than five years 27,025,441 34,966,519 7,789,314 11,532,245
P=819,766,987 P=724,624,449 P=756,548,218 P=670,557,609
Finance Lease - LSB as LessorLSB has entered to a lease on its investment property portfolio. The lease contract provides anoption to purchase the properties the end of the lease term. The lease has a lease term of ten (10)years, from April 30, 2009 to March 31, 2019. The building being leased out has an estimateduseful life of ten (10) years.
As of December 31, 2016 and 2015, the future minimum lease receivable under the finance leaseas follows:
2016 2015Minimum Minimum
Lease LeaseReceivable Interest Principal Receivable Interest Principal
Within one year P=750,000 P=1,236,467 (P=486,467) P=750,000 P=3,007,723 (P=2,257,723)Beyond one year but not
more than five years 10,750,000 1,648,986 9,101,014 11,500,000 2,885,453 8,614,547P=11,500,000 P=2,885,453 P=8,614,547 P=12,250,000 P=5,893,176 P=6,356,824
22. Income and Expenses
Net service fees and commission income consists of:
Consolidated Parent Company2016 2015 2016 2015
Service fees and commission income:Deposit-related P=66,119,009 P=68,313,430 P=62,349,982 P=64,211,300Credit-related 52,492,218 54,264,781 52,492,218 54,264,781Commissions 29,962,443 17,429,860 29,273,023 16,939,854Utility and store payment charges 12,683,084 10,867,246 12,683,084 10,867,246Trust and other fiduciary 12,959,348 10,904,401 12,959,348 10,904,401
174,216,102 161,779,718 169,757,655 157,187,582
Service charges and commissionexpense:Banking fees 46,675,184 35,955,063 44,398,222 35,463,836Brokerage and commissions 10,893,648 15,812,123 10,893,648 15,247,989
57,568,832 51,767,186 55,291,870 50,711,825P=116,647,270 P=110,012,532 P=114,465,785 P=106,475,757

182 Robinsons Bank Annual Report 2016
NOTES TO financial STATEMENTS- 83 -
*SGVFS022572*
Miscellaneous income consists of:
Consolidated Parent Company2016 2015 2016 2015
Penalties P=31,117,160 P=31,347,431 P=27,104,964 P=31,347,431Gain on initial recognition of
repossessed chattels (Note 13) 25,017,967 6,001,755 25,066,668 5,995,744Gain on initial recognition of
investment properties (Note 11) 17,303,414 35,549,709 12,665,271 30,698,176Gain on sale of repossessed chattels
(Note 13) − 12,433,552 − 12,283,552Recovery on charged-off assets 9,345,586 1,296,639 9,275,154 1,212,938Gain on sale of investment properties
(Note 11) 8,148,422 10,466,376 3,543,546 5,936,420Gain on sale of property and
equipment (Note 10) 3,864,811 680,079 3,824,515 680,079Others (Note 7) 31,030,388 19,016,686 21,376,899 10,657,568
P=125,827,748 P=116,792,227 P=102,857,017 P=98,811,908
Other income includes share on notarial and insurance fees, rental income from safety deposit box,night depository and dividend income.
Miscellaneous expenses consist of:
Consolidated Parent Company2016 2015 2016 2015
Transportation and travel P=47,170,766 P=38,351,888 P=40,318,065 P=33,327,807Advertising 43,584,613 23,606,017 41,819,403 22,951,122Stationery and supplies 37,691,988 33,426,496 34,851,681 31,523,948Litigation expense on assets acquired
(Note 11) 14,901,894 8,840,503 13,086,222 8,064,075Loss on sale of repossessed chattels
(Note 13) 13,778,921 − 13,792,885 −Appraisal fees 12,772,070 8,208,406 12,772,070 8,208,406Fines, penalties and other charges 8,429,624 14,424,703 8,429,624 14,423,388Membership dues 3,018,896 5,876,471 2,918,798 5,770,516Others 21,812,717 34,355,636 16,242,560 25,124,124
P=203,161,489 P=167,090,120 P=184,231,308 P=149,393,386
Other expenses include notarial fee, registration expense, documentary stamps used, freightcharges, periodicals and magazines, donations.
23. Income and Other Taxes
Under Philippine tax laws, the Parent Company is subject to percentage and other taxes (presentedas ‘Taxes and licenses’ in the statement of income) as well as income taxes. Percentage and othertaxes paid consist principally of gross receipts tax (GRT) and documentary stamp taxes.
Income taxes consist of final withholding taxes on gross interest income from governmentsecurities, deposits and other deposit substitutes, tax on the FCDU income and RCIT, as discussedbelow, on net taxable income. These income taxes, as well as the deferred tax benefit, arepresented in the statement of income as ‘Provision for income tax’.
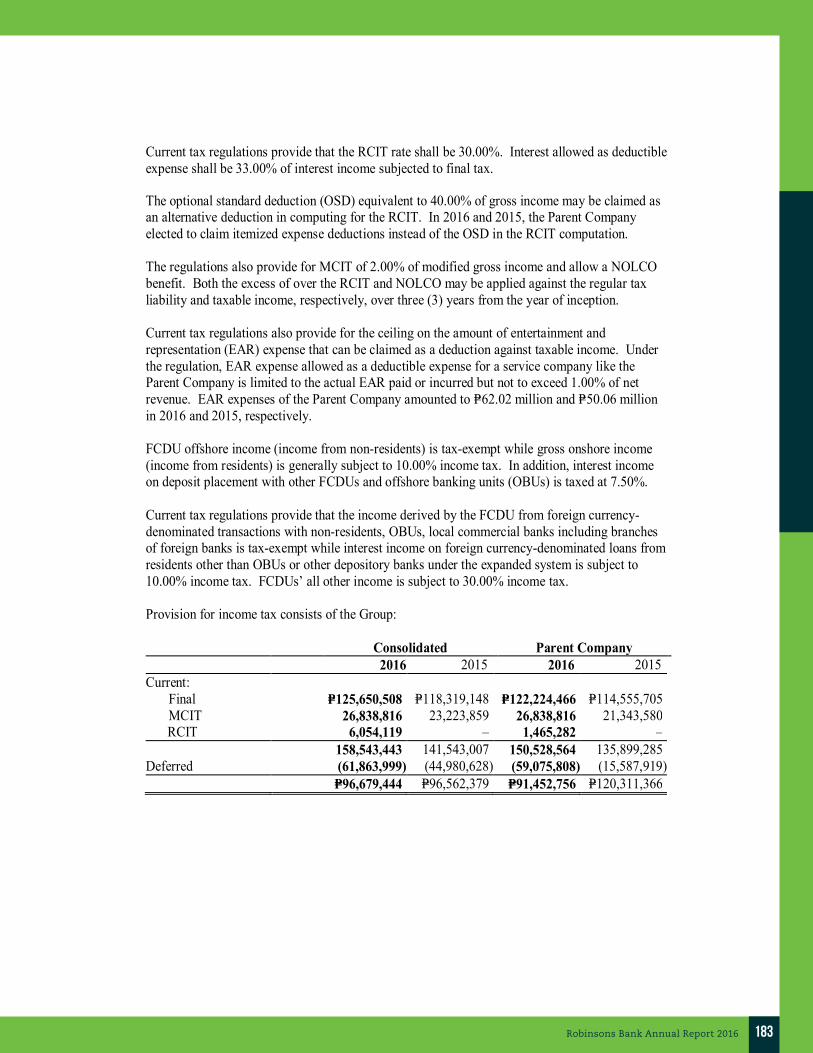
183Robinsons Bank Annual Report 2016
- 84 -
*SGVFS022572*
Current tax regulations provide that the RCIT rate shall be 30.00%. Interest allowed as deductibleexpense shall be 33.00% of interest income subjected to final tax.
The optional standard deduction (OSD) equivalent to 40.00% of gross income may be claimed asan alternative deduction in computing for the RCIT. In 2016 and 2015, the Parent Companyelected to claim itemized expense deductions instead of the OSD in the RCIT computation.
The regulations also provide for MCIT of 2.00% of modified gross income and allow a NOLCObenefit. Both the excess of over the RCIT and NOLCO may be applied against the regular taxliability and taxable income, respectively, over three (3) years from the year of inception.
Current tax regulations also provide for the ceiling on the amount of entertainment andrepresentation (EAR) expense that can be claimed as a deduction against taxable income. Underthe regulation, EAR expense allowed as a deductible expense for a service company like theParent Company is limited to the actual EAR paid or incurred but not to exceed 1.00% of netrevenue. EAR expenses of the Parent Company amounted to P=62.02 million and P=50.06 millionin 2016 and 2015, respectively.
FCDU offshore income (income from non-residents) is tax-exempt while gross onshore income(income from residents) is generally subject to 10.00% income tax. In addition, interest incomeon deposit placement with other FCDUs and offshore banking units (OBUs) is taxed at 7.50%.
Current tax regulations provide that the income derived by the FCDU from foreign currency-denominated transactions with non-residents, OBUs, local commercial banks including branchesof foreign banks is tax-exempt while interest income on foreign currency-denominated loans fromresidents other than OBUs or other depository banks under the expanded system is subject to10.00% income tax. FCDUs’ all other income is subject to 30.00% income tax.
Provision for income tax consists of the Group:
Consolidated Parent Company2016 2015 2016 2015
Current:Final P=125,650,508 P=118,319,148 P=122,224,466 P=114,555,705MCIT 26,838,816 23,223,859 26,838,816 21,343,580RCIT 6,054,119 – 1,465,282 –
158,543,443 141,543,007 150,528,564 135,899,285Deferred (61,863,999) (44,980,628) (59,075,808) (15,587,919)
P=96,679,444 P=96,562,379 P=91,452,756 P=120,311,366

184 Robinsons Bank Annual Report 2016
NOTES TO financial STATEMENTS- 85 -
*SGVFS022572*
Net deferred tax assets (liabilities) of the Group and the Parent Company consist of the following:
Consolidated Parent Company2016 2015 2016 2015
Deferred tax assets on:Allowance for credit and
impairment losses P=209,889,771 P=106,408,229 P=158,869,194 P=56,389,729Provision for profit sharing 40,237,851 43,984,321 40,237,851 43,984,321Accumulated depreciation on
investment properties andrepossessed chattels 17,281,683 14,929,642 17,281,683 14,929,642
NOLCO – 29,347,212 – 29,347,212Retirement liability 13,554,959 19,701,998 13,554,959 19,701,998Accrued rent 9,887,686 8,906,369 9,887,686 8,906,369Excess of MCIT over RCIT – 353,337 – 353,337Unrealized loss on financial asset
at FVPL 38,448 2,868,797 38,448 2,868,797290,890,398 226,499,905 239,869,821 176,481,405
Deferred tax liabilities on:Branch licenses 186,000,000 186,000,000 – –Unrealized gain on initial
recognition of investmentproperties 32,214,602 20,111,004 28,217,857 16,898,275
Unrealized foreign exchange gain 10,470,888 10,437,697 10,455,241 10,419,698Unrealized gain on initial
recognition of repossessedchattels 6,713,805 5,933,714 6,713,805 5,933,714
Unrealized income on financelease receivable 2,021,059 – – –
Retirement liability 34,946 – – –Net unrealized gain on AFS
investments – 692,440 – 692,440237,455,300 223,174,855 45,386,903 33,944,127P=53,435,098 P=3,325,050 P=194,482,918 P=142,537,278
The Group did not set up deferred tax assets on the following temporary differences sincemanagement believes that it is not highly probable that these differences will be realized in thefuture:
Consolidated Parent Company2016 2015 2016 2015
Allowance for credit andimpairment losses P=797,384,738 P=768,461,927 P=295,220,529 P=794,304,240
Unrealized loss on AFSinvestments 838,255,143 562,948,094 838,255,143 562,948,094
Excess of MCIT over RCIT 51,948,304 29,794,294 48,259,167 21,420,351Unearned income 22,666,240 15,594,527 − −Accumulated depreciation on
investment properties andrepossessed chattels 19,275,269 20,095,457 − −
Unfunded retirement liability 4,548,151 2,856,743 − −Accrued rent 4,340,138 3,556,937 − −NOLCO − 26,324,907 − −
P=1,738,417,983 P=1,429,632,886 P=1,181,734,839 P=1,378,672,685

185Robinsons Bank Annual Report 2016
- 86 -
*SGVFS022572*
Details of NOLCO follow:
ConsolidatedInception Year Amount Used Balance Expiry Year2015 P=97,824,041 P=97,824,041 P=− 20182014 19,135,477 19,135,477 − 20172013 9,975,426 9,975,426 − 2016
P=126,934,944 P=126,934,944 P=−
Parent CompanyInception Year Amount Used Balance Expiry Year2015 P=97,824,041 P=97,824,041 P=− 2018
Details of the excess of MCIT over RCIT follow:
ConsolidatedInception Year Amount Used/Expired Balance Expiry Year2016 P=26,838,816 P=– P=26,838,816 20192015 22,947,293 – 22,947,293 20182014 2,677,819 868,961 1,808,858 20172013 4,073,213 4,073,213 – 2016
P=56,537,141 P=4,942,174 P=51,594,967
Parent CompanyInception Year Amount Expired Balance Expiry Year2016 P=26,838,816 P=– P=26,838,816 20192015 21,067,014 – 21,067,014 20182013 353,337 353,337 – 2016
P=48,259,167 P=353,337 P=47,905,830
A reconciliation of statutory income tax rate to the effective income tax rate of the Group and thexParent Company follows:
Consolidated Parent Company
2016 2015 20162015 (As restated
- Note 2)Statutory income tax rate 30.00% 30.00% 30.00% 30.00%Tax effect of:
Tax paid and tax-exempt income (32.09) (26.56) (31.90) (24.10)Non-deductible expenses 38.82 55.14 37.31 49.15Unrecognized deferred tax assets (7.64) (22.33) (9.36) (15.72)FCDU income 2.87 3.11 2.91 2.83Others – net (3.87) 0.78 (1.98) 3.36
Effective income tax rate 28.09% 40.14% 26.98% 45.52%
24. Related Party Transactions
Parties are considered to be related if one party has the ability, directly or indirectly, to control theother party or exercise significant influence over the other party in making financial and operatingdecisions or if they are subjected to common control of common significant influence such assubsidiaries and associates of subsidiaries or other related parties. Related parties may beindividuals or corporate entities.
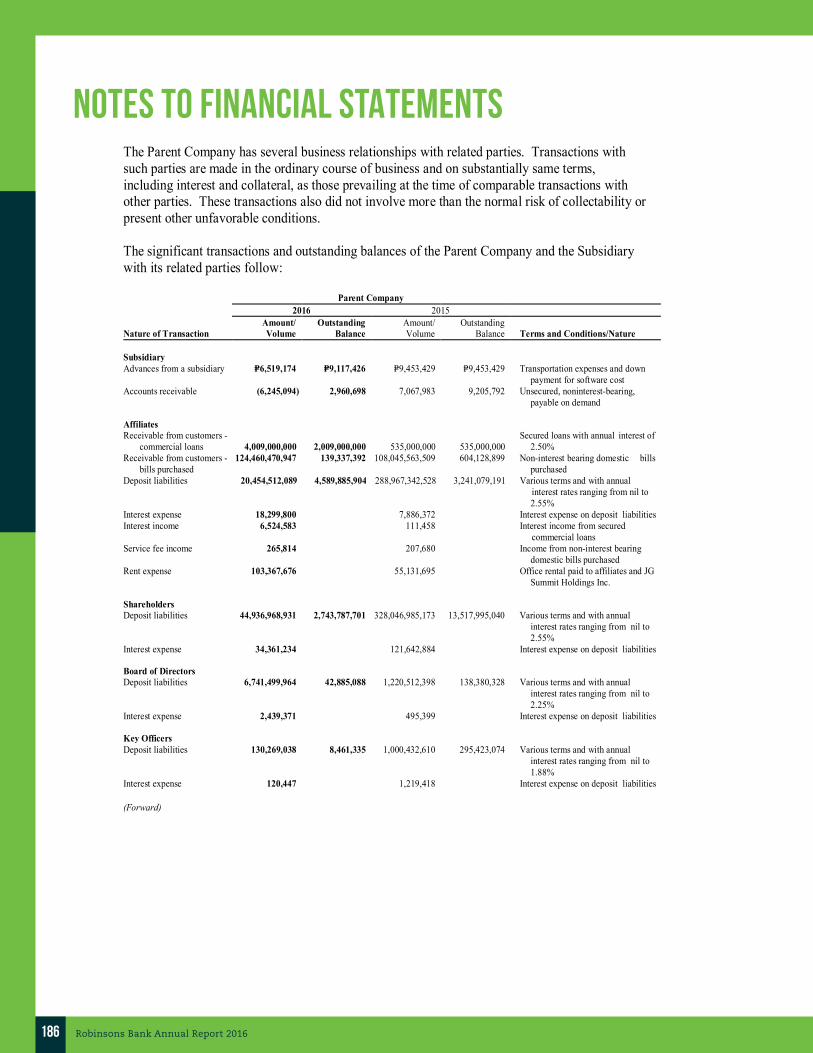
186 Robinsons Bank Annual Report 2016
NOTES TO financial STATEMENTS- 87 -
*SGVFS022572*
The Parent Company has several business relationships with related parties. Transactions withsuch parties are made in the ordinary course of business and on substantially same terms,including interest and collateral, as those prevailing at the time of comparable transactions withother parties. These transactions also did not involve more than the normal risk of collectability orpresent other unfavorable conditions.
The significant transactions and outstanding balances of the Parent Company and the Subsidiarywith its related parties follow:
Parent Company2016 2015
Nature of TransactionAmount/Volume
OutstandingBalance
Amount/Volume
OutstandingBalance Terms and Conditions/Nature
SubsidiaryAdvances from a subsidiary P=6,519,174 P=9,117,426 P=9,453,429 P=9,453,429 Transportation expenses and down
payment for software costAccounts receivable (6,245,094) 2,960,698 7,067,983 9,205,792 Unsecured, noninterest-bearing,
payable on demand
AffiliatesReceivable from customers -
commercial loans 4,009,000,000 2,009,000,000 535,000,000 535,000,000Secured loans with annual interest of
2.50%Receivable from customers -
bills purchased124,460,470,947 139,337,392 108,045,563,509 604,128,899 Non-interest bearing domestic bills
purchasedDeposit liabilities 20,454,512,089 4,589,885,904 288,967,342,528 3,241,079,191 Various terms and with annual
interest rates ranging from nil to2.55%
Interest expense 18,299,800 7,886,372 Interest expense on deposit liabilitiesInterest income 6,524,583 111,458 Interest income from secured
commercial loansService fee income 265,814 207,680 Income from non-interest bearing
domestic bills purchasedRent expense 103,367,676 55,131,695 Office rental paid to affiliates and JG
Summit Holdings Inc.
ShareholdersDeposit liabilities 44,936,968,931 2,743,787,701 328,046,985,173 13,517,995,040 Various terms and with annual
interest rates ranging from nil to2.55%
Interest expense 34,361,234 121,642,884 Interest expense on deposit liabilities
Board of DirectorsDeposit liabilities 6,741,499,964 42,885,088 1,220,512,398 138,380,328 Various terms and with annual
interest rates ranging from nil to2.25%
Interest expense 2,439,371 495,399 Interest expense on deposit liabilities
Key OfficersDeposit liabilities 130,269,038 8,461,335 1,000,432,610 295,423,074 Various terms and with annual
interest rates ranging from nil to1.88%
Interest expense 120,447 1,219,418 Interest expense on deposit liabilities
(Forward)

187Robinsons Bank Annual Report 2016
- 88 -
*SGVFS022572*
Subsidiary2016 2015
Nature of TransactionAmount/Volume
OutstandingBalance
Amount/Volume
OutstandingBalance Terms and Conditions/Nature
ParentAccounts payable (P=6,245,094) P=2,960,698 P=7,067,983 P=9,205,792 Unsecured, noninterest-bearing, payable
on demandAccounts receivable 6,519,174 9,117,426 13,909,148 2,598,252 Unsecured, noninterest bearing
accounts payableDue from other banks 3,583,686 3,583,686 − − Regular checking account, non-interest
bearingCapital stock issuance 400,000,000 − See Note 9
Key employeesReceivables from customers 364,037 3,591,673 12,009 3,227,636 Loans of directors, officers and
stockholdersInterest income 269,552 967,878 Interest earned from loans of directors,
officers and stockholdersDeposit liabilities (998,726) 394,773 509,688 1,393,499 Deposits of directors, officers and
stockholdersInterest expense 2,669 7,058 Interest expense on deposit liabilitiesCompensation and fringe
benefits6,938,634
25,112,723Remuneration and benefits to directors
and key management personnelPost-employment benefits 302,018 18,448,438 Post-employment benefits
In the ordinary course of business, the Parent Company has loan transactions with affiliates andwith certain DOSRI. Existing banking regulations limit the amount of individual loans to DOSRI,70.00% of which must be secured, to the total of their respective deposits and book value of theirrespective investments in the Parent Company. In the aggregate, loans to DOSRI generally shouldnot exceed the Bank’s total regulatory capital or 15.00% of total loan portfolio, whichever islower.
Parent Company LSB2016 2015 2016 2015
Total outstanding DOSRI accounts P= 2,148,337,392 P=1,139,128,899 P=3,591,673 P=3,227,636Percent of DOSRI accounts to total loans 5.66% 4.15% 0.28% 0.27%Percent of nonperforming DOSRI loans to total
DOSRI loans − − 0.80% −Percent of unsecured DOSRI loans to total
DOSRI loans − − 32.61% 30.66%
The Parent Company has no assets pledged as collaterals on its liabilities.
On January 31, 2007, BSP Circular No. 560 was issued providing the rules and regulations thatgovern loans, other credit accommodations and guarantees granted to subsidiaries and affiliates ofbanks and quasi-banks. Under the said circular, the total outstanding exposures to each of thebank’s subsidiaries and affiliates shall not exceed 10.00% of bank’s net worth, the unsecuredportion of which shall not exceed 5.00% of such net worth. Further, the total outstandingexposures to subsidiaries and affiliates shall not exceed 20.00% of the net worth of the lendingbank. BSP Circular No. 560 is effective on February 15, 2007.
The retirement fund of the Parent Company’s employees amounted to P=82.84 million andP=55.09 million as of December 31, 2016 and 2015, respectively (see Note 20). This includes payoff to resigned employees amounting to P=1.23 million. The fund is being managed by JG SummitMulti-Employer Retirement Plan (MERP), a corporation created for the purpose of managing thefunds of the Group, with Robinsons Bank Corporation (RBC)-Trust and Investment Group as thetrustee.

188 Robinsons Bank Annual Report 2016
NOTES TO financial STATEMENTS- 89 -
*SGVFS022572*
Details of the transactions of the Parent Company with its retirement plan follow:
2016
Related Party Nature of TransactionAmount/Volume
OutstandingBalance Terms and Conditions/Nature
Retirement plan Contribution and interestearned
P=1,806,871 P=80,965,782 Contributions to the Fund plusinterest earned during the year
2015
Related Party Nature of TransactionAmount/Volume
OutstandingBalance Terms and Conditions/Nature
Retirement plan Contribution and interestearned
P=1,676,723 P=55,090,638 Contributions to the Fund plusinterest earned during the year
The retirement plan under the MERP has an Executive Retirement Committee, which is mandatedto approve the plan, trust agreement, investment plan, including any amendments or modificationsthereto, and other activities of the plan. Certain members of the BOD of the Parent Company arerepresented in the Executive Retirement Committee. RBC manages the plan based on the mandateas defined in the trust agreement.
Details of remuneration of directors and other key management personnel of the Group and theParent Company follow:
Consolidated Parent Company2016 2015 2016 2015
Short-term benefits P=72,065,338 P=58,957,915 P=65,126,704 P=54,599,160Post-employment benefits 5,977,408 5,994,561 5,675,390 5,657,049
P=78,042,746 P=64,952,476 P=70,802,094 P=60,256,209
25. Trust Operations
Properties held by the Parent Company in fiduciary or agency capacity for their customers are notincluded in the accompanying statement of financial position since these are not assets of theParent Company (see Note 26).
In compliance with the requirements of the General Banking Law relative to the ParentCompany’s trust functions, treasury notes and bills included under ‘Held-to-Maturity Investment’as of December 31, 2016 and 2015 with a total face value of P=140.00 million and P=115.00 million,respectively, were deposited with the BSP (see Note 7).
An appropriation of 10.00% of the Parent Company’s income from trust operations is set aside assurplus reserve to absorb any losses that may arise from its trust functions.
26. Commitments and Contingencies
a. The Group is also involved in a number of legal proceedings. The estimate of the probablecosts for the resolutions of these claims has been developed in consultation with outsidecounsel handling the Group’s defense and is based on an analysis of potential results. TheGroup does not believe that these proceedings will have a material adverse effect on thefinancial statements.
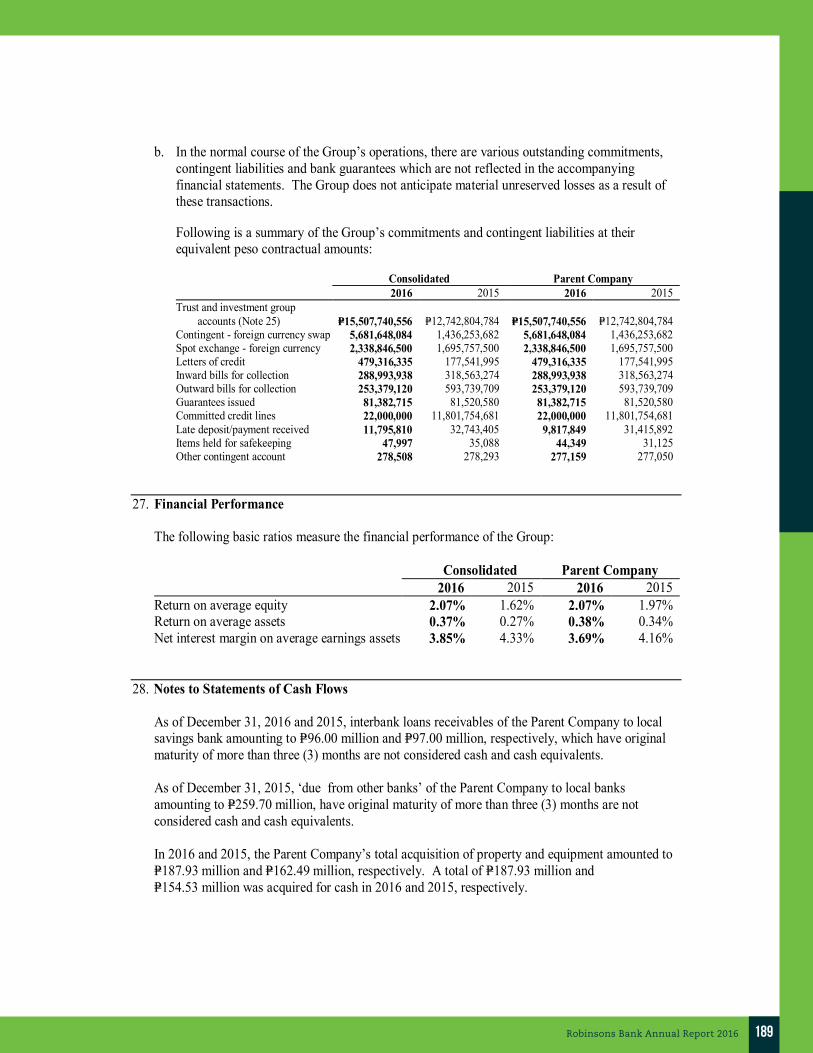
189Robinsons Bank Annual Report 2016
- 90 -
*SGVFS022572*
b. In the normal course of the Group’s operations, there are various outstanding commitments,contingent liabilities and bank guarantees which are not reflected in the accompanyingfinancial statements. The Group does not anticipate material unreserved losses as a result ofthese transactions.
Following is a summary of the Group’s commitments and contingent liabilities at theirequivalent peso contractual amounts:
Consolidated Parent Company2016 2015 2016 2015
Trust and investment groupaccounts (Note 25) P=15,507,740,556 P=12,742,804,784 P=15,507,740,556 P=12,742,804,784
Contingent - foreign currency swap 5,681,648,084 1,436,253,682 5,681,648,084 1,436,253,682Spot exchange - foreign currency 2,338,846,500 1,695,757,500 2,338,846,500 1,695,757,500Letters of credit 479,316,335 177,541,995 479,316,335 177,541,995Inward bills for collection 288,993,938 318,563,274 288,993,938 318,563,274Outward bills for collection 253,379,120 593,739,709 253,379,120 593,739,709Guarantees issued 81,382,715 81,520,580 81,382,715 81,520,580Committed credit lines 22,000,000 11,801,754,681 22,000,000 11,801,754,681Late deposit/payment received 11,795,810 32,743,405 9,817,849 31,415,892Items held for safekeeping 47,997 35,088 44,349 31,125Other contingent account 278,508 278,293 277,159 277,050
27. Financial Performance
The following basic ratios measure the financial performance of the Group:
Consolidated Parent Company2016 2015 2016 2015
Return on average equity 2.07% 1.62% 2.07% 1.97%Return on average assets 0.37% 0.27% 0.38% 0.34%Net interest margin on average earnings assets 3.85% 4.33% 3.69% 4.16%
28. Notes to Statements of Cash Flows
As of December 31, 2016 and 2015, interbank loans receivables of the Parent Company to localsavings bank amounting to P=96.00 million and P=97.00 million, respectively, which have originalmaturity of more than three (3) months are not considered cash and cash equivalents.
As of December 31, 2015, ‘due from other banks’ of the Parent Company to local banksamounting to P=259.70 million, have original maturity of more than three (3) months are notconsidered cash and cash equivalents.
In 2016 and 2015, the Parent Company’s total acquisition of property and equipment amounted toP=187.93 million and P=162.49 million, respectively. A total of P=187.93 million andP=154.53 million was acquired for cash in 2016 and 2015, respectively.

190 Robinsons Bank Annual Report 2016
NOTES TO financial STATEMENTS- 91 -
*SGVFS022572*
Details of non-cash investing activities follow:
Consolidated Parent Company2016 2015 2016 2015
Increase in capital stock due toconversion of deposit for futurestock subscription P=445,960,000 P=− P=− P=−
Increase in NUGL due to MTM loss(gain) on AFS 275,307,049 − 275,307,049 −
Increase in investmentproperties due to foreclosure 91,352,180 65,416,514 69,995,224 49,023,341
Disposal of investment propertiesand repossessed chattels throughsales contract receivable 34,045,955 44,567,987 30,613,955 44,567,987
Increase in property and equipmentdue to reclassifications 17,938,868 4,975,862 7,502,851 4,975,862
Increase in investment property dueto reclassification of allowance 10,436,017 − − −
Increase in repossessedchattels due to foreclosure 225,586,603 128,093,011 225,420,303 128,086,999
Increase in software licenses due toreclassifications from advances tosuppliers − 373,181,951 − 373,181,951
Increase in software licenses due toreclassifications from propertyand equipment − 46,195,441 − 46,195,441
Increase in surplus reserves due toappropriation from retainedearnings − − 4,525,839 −
29. Subsequent Event
HTM investments with carrying value of P=300.00 million were disposed by the Bank in2017. Accordingly, the Bank reclassified the remaining HTM investments to AFS investments inaccordance with PFRS.
30. Approval of the Release of the Financial Statements
The accompanying financial statements of the Group and of the Parent Company were approvedand authorized for issue by the BOD on March 22, 2017.
31. Supplementary Information Required under Revenue Regulations (RR) 15-2010
The BIR issued RR No. 15-2010 prescribing the manner of compliance in connection with thepreparation and submission of financial statements accompanying the tax returns. This RRinclude provisions for additional disclosure requirements in the notes to the financial statements,particularly on composition of taxes, duties, licenses paid or accrued during the year.

191Robinsons Bank Annual Report 2016
- 92 -
*SGVFS022572*
Supplementary Information Required Under RR No. 15-2010The Parent Company reported and/or paid the following types of taxes for the year:
Gross Receipts Tax (GRT)The National Internal Revenue Code (NIRC) of 1997 provides for the imposition of GRT on grossreceipts derived by banks from sources within the Philippines. Accordingly, the ParentCompany’s gross receipts are subject to GRT as re-imposed in RA No. 9238 beginningJanuary 1, 2004.
Details of the Parent Company’s gross receipts and GRT due declared and paid for taxable year2016 follow:
Gross Receipts GRT DueInterest income P=1,929,532,580 P=61,624,401Other income 210,808,753 14,756,612
P=2,140,341,333 P=76,381,013
Documentary Stamp Tax:The Documentary stamp tax (DST) paid or accrued on the following transactions are:
Transaction Amount DST thereonDeposits P=681,925,380,165 P=95,037,953Loan instruments 17,919,871,084 89,599,355
P=699,845,251,249 P=184,637,308
Other Taxes and LicensesThis includes all other taxes, local and national, including documentary stamp tax, fringe benefitstax, local business tax, licenses and permit fees lodged under the ‘Salaries and employees’ benefitsand ‘Taxes and Licenses’ account in the statement of income and expenses.
a. LocalBusiness Permits P=9,752,517Community Tax Certificates 10,500
b. NationalGross Receipt Tax P=56,707,532
Part of the GRT and DST remitted to the BIR are shouldered/ charged to clients/borrowers.
Withholding TaxesThe following table shows the breakdown of taxes withheld and remitted in 2016:
Total Withheld Total RemittedWithholding tax on deposits P=51,963,288 P=49,008,332Withholding taxes on compensation and benefits 105,258,945 89,818,449Expanded withholding taxes 28,296,672 26,079,231
P=185,518,905 P=164,906,012
As of December 31, 2016, there are no outstanding tax cases under investigation, litigation orprosecution in courts or bodies outside BIR.

192 Robinsons Bank Annual Report 2016
*New Hire 2017**Promoted 2017***Seconded
Legazpi Savings Bank (LSB), a wholly owned subsidiary of Robinsons Bank, is a thrift bank primarily engaged in deposit-taking and lending activities. LSB was acquired in 2012 by Robinsons Bank under the BSP strengthening program for thrift and rural banks.
In 2016, LSB implemented various key expansion initiatives. In its nearly five decades of operating in the Bicol region, LSB took the opportunity to span its countryside reach in another fastest growing region in the country - CALABARZON. LSB is now providing financial services in Calauag, Quezon and will soon expand its scope to other nearby provinces.
As LSB continues to focus on ramping up its high-yielding loan portfolio, it acquired accreditation for providing teacher’s salary loans under the Department of Education’s Automatic Payroll Deduction System (APDS).
LSB also recognizes the important role of MSMEs in elevating the lives in the community as it aggressively rolled out its microfinance business.
In line with LSB’s commitment to serve communities better, reach more markets, and acquire new clients, its parent Robinsons Bank infused additional capital amounting to PHP400 million in 2016. As of yearend, LSB’s equity amounted to PHP515.4 million. Supported by this capital infusion, LSB’s assets grew to PHP2.3 billion, or 18.8% higher than previous year’s level. Gross Loans grew by 8% and reached PHP1.3 billion. LSB was also able to participate in the interbank and bonds market.
As of end-2016, LSB’s total physical network reached 11 branches, with one Micro-Banking Office (MBO) each in Camarines Sur and Quezon, and 12 ATMs.
As a result of these strategic initiatives, LSB grew its customer base by 17% to almost 71 thousand and contributed PHP22.4 million net income to its parent Robinsons Bank.
LSB PRODUCTS AND SERVICES
A. DEPOSIT PRODUCTS
Savings Accounts Regular Savings Account Special Savings Account Friendly Savings Deposit Bulilit Savings Account Savings ATM Account
Checking Accounts Regular Checking Account Time Deposits Regular Time Deposit Friendly Time Deposit
B. LOAN PRODUCTS
Consumer LoansPersonal Salary LoanJewelry Loan Teachers LoanMotorcycle Loan Housing LoanAuto Loan
Commercial LoansSmall and Medium Enterprise LoanMicrofinance LoanSmall Business Loan
Other LoansBack-to-back LoanSales Contract Receivables Lease Purchase Agreement
C. OTHER SERVICES
Electronic Services ATM Services
LEGAZPI SAVINGS BANK
193Robinsons Bank Annual Report 2016
LSB BOARD OF DIRECTORS
Lance Y. Gokongwei ChairmanElfren Antonio S. Sarte Vice ChairmanOmar Byron T. Mier MemberMykel D. Abad MemberAngelito V. Evangelista MemberEric B. Santos Member Janette C. Gonzalvo Member Hermogenes S. Roxas Independent DirectorVictor V. Laynes Independent DirectorRoel S. Costuna Corporate Secretary
LSB KEY OFFICERS
Mykel D. Abad PresidentRoel S. Costuna Corporate Secretary and Legal Unit HeadAileen Mary C. Ejercito Asst. Corporate SecretaryEleanor Leni M. Ante TreasurerKareen R. Villareal Chief Compliance Officer Cynthia C. Bautista Chief Audit OfficerEvie B. Abraham Human Resource Management Group HeadMa. Socorro S. Liganor Retail Banking Group HeadErlinda O. Del Villar Operations HeadAbundio B. Blanquisco, jr. Deputy for OperationsJason-Dennis R. Sambitan Information Technology Department HeadAdrian T. Llana Credit Cycle & Operations HeadCarmela Monica C. Borromeo Officer-in-Charge for ControllershipRodolfo T. Quinto Chief Security Officer

194 Robinsons Bank Annual Report 2016
LSB BRANCHES
NAGA NEA Building, Triangulo, 4400 Naga CityTel. Nos. (054) 473-5086 | (054) 811-5647Banking Hours: Mon. to Sat., 9:00am-5:00pm
MICRO-BANKING OFFICES GOAJ. Quinzon Building Bagumbayan Pequeño, Rizal St. Goa, Camarines SurTel. Nos. (054) 881-9287Banking Hours: Tue. to Sat., 9:00am-5:00pm
CALAUAGSitio Maharlika District 2 Brgy. Sta. Maria Calauag, QuezonTel. Nos. (042) 717-6763Banking Hours: Tue. to Sat., 9:00am-5:00pm
ATM
MAINRizal Street, Sagpon, Old Albay District 4500 Legazpi City
LEGAZPICorner Rizal and Mabini Streets, 4500 Legazpi City
DARAGARizal Street, 4501 Daraga, Albay
TABACOGround Floor N.N. Building AA Berces StreetBasud, 4511 Tabaco City
POLANGUINational Road, Basud, 4506 Polangui, Albay
SORSOGONRizal Street, 4700 Sorsogon City
GUINOBATANT. Paulate Street, 4503 Guinobatan, Albay
DAETSUBIA Bldg. J. Lukban St.4600 Daet, Camarines Norte
VIRACG/F D&L Building corner Surtida & Rizal StreetsSan Jose, 4800 Virac Catanduanes
MASBATEUnits 8 & 9 S&T Bldg. Cagba St., Brgy. Tugbo 5400 Masbate City
NAGA NEA Building, Triangulo, 4400 Naga City
HEAD OFFICE
Rizal Street, Sagpon, Old Albay District 4500 Legazpi CityTel Nos. (052) 481-1253 | (052) 480-5539Fax No. (052) 480-7008 | (052) 480-5959
BRANCHES
MAIN Rizal Street, Sagpon, Old Albay District 4500 Legazpi CityTel. Nos. (052) 481-1145 | (052) 481-2366Banking Hours: Mon. to Sat., 9:00am-5:00pm
LEGAZPICorner Rizal and Mabini Streets 4500 Legazpi CityTel. Nos. (052) 742-1380 | (052) 480-7039Banking Hours: Mon. to Sat., 9:00am-5:00pm
DARAGARizal Street, 4501 Daraga, AlbayTel. Nos.(052) 742-0070 | (052) 483-3726Banking Hours: Mon. to Sat., 9:00am-5:00pm
TABACOGround Floor, N.N. Building, AA Berces StreetBasud, 4511 Tabaco CityTel. Nos. (052) 487-7121 | (052) 487-7122Banking Hours: Mon. to Sat., 9:00am-5:00pm
POLANGUINational Road, Basud, 4506 Polangui, AlbayTel. Nos. (052) 486-2164Banking Hours: Mon. to Sat., 9:00am-5:00pm
SORSOGONRizal Street, 4700 Sorsogon CityTel. No. (056) 421-5289Banking Hours: Mon. to Sat., 9:00am-5:00pm
GUINOBATANT. Paulate Street, 4503 Guinobatan, AlbayTel. Nos. (056) 484-6664 | (052) 826-0039Banking Hours: Mon. to Sat., 9:00am-5:00pm
DAETSUBIA Bldg. J Lukban St.4600 Daet, Camarines NorteTel. Nos. (054) 440-0570 | (054) 440-0580Banking Hours: Mon. to Sat., 9:00am-5:00pm
VIRACG/F D&L Building corner Surtida & Rizal StreetsSan Jose, 4800 Virac, CatanduanesMobile Nos. 0917-584-1696 | 0908-811-3423Banking Hours: Mon. to Sat., 9:00am-5:00pm
MASBATEUnits 8 & 9 S&T Bldg. Cagba St., Brgy. Tugbo 5400 Masbate CityTel. Nos. (056) 333-574 | (056) 333-5744Banking Hours: Mon. to Sat., 9:00am-5:00pm

195Robinsons Bank Annual Report 2016
LSB KEY OFFICERS
ERLINDA O. DEL VILLARVP & HEAD
MA. SOCORRO S. LIGANOR VP & HEAD
ABUNDIO B. BLANQUISCO, JR.AVP & DEPUTY
JASON-DENNIS R. SAMBITAN AVP & HEAD
KAREEN R. VILLAREAL AVP & chief compliance officer
ADRIAN T. LLANA AVP & HEAD
INFORMATION TECHNOLOGY
RETAIL BANKING GROUP
OPERATIONS
OPERATIONS
CREDIT CYCLE department
COMPLIANCE group

196 Robinsons Bank Annual Report 2016
FOOD, AGRO-INDUSTRIAL AND COMMODITIESUniversal Robina Corporation110 E. Rodriguez Avenue, BagumbayanQuezon City, Metro ManilaTel. Nos.: (632) 633-7631 to 40 / (632) 240-8801
REAL ESTATE AND HOTELSRobinsons Land CorporationLevel 2, Galleria Corporate CenterEDSA corner Ortigas AvenueQuezon City, Metro Manila, Philippines 1100Tel. No.: (632) 397-1888
AIR TRANSPORTATIONCebu Air, Inc.Cebu Pacific BuildingDomestic Road, Barangay 191, Zone 20Pasay City, 1301 PhilippinesTel. No.: (02) 802-7000
PETROCHEMICALSJG Summit Petrochemical CorporationGround Floor, Robinsons Cybergate Center (Tower 1)EDSA corner Pioneer St., Mandaluyong CityMetro Manila, Philippines 1550Tel. Nos.: (632) 397-3200/ (632) 397-2674Plantsite: Bo. Simlong, Batangas CityPhilippines 4200Tel. Nos.: (632) 631-5407 to 10/ (632) 230-5000
BANKING SERVICESRobinsons Bank Corporation17th Floor, Galleria Corporate CenterEDSA corner Ortigas Avenue, Quezon CityMetro Manila, Philippines 1100Tel. Nos.: (632) 702-9500; (632) 637-2273
CORE INVESTMENTSPLDT Inc.Ramon Cojuangco BuildingMakati Ave., corner Ayala Ave.Legaspi Village, Makati CityTel. Nos.: (632) 888-8171 to 173
United Industrial Corporation (UIC)24 Raffles Place, #22-01/ 06, Clifford CenterSingapore 048621Tel. No.: (65) 622-0135-2
PARTNER COMPANIESSummit Publishing Company Inc.6F & 7F Robinsons Cybergate Center (Tower 3)Robinsons Pioneer Complex, Pioneer St.Mandaluyong City, Metro Manila, Philippines 1550Tel. No.: (632) 451-8888
JobStreet.com Philippines, Inc.20th Floor Cybergate Center Tower 3Robinson’s Pioneer ComplexPioneer Street, Mandaluyong City 1550Tel. No.: (632) 286-6222
Robinsons Retail Holdings, Inc. 10 E. Rodriguez Jr. Ave., Libis Quezon CityMetro Manila, PhilippinesTel. No.: (632) 635-0751
i-Tech Global Business Solutions Inc.3rd Floor, Robinsons Otis, 1536 P. Guazon St.Paco, Manila, Philippines 1007Tel. No.: (632) 249-4305
JG SUMMIT BUSINESSES

17F Galleria Corporate Center EDSA corner Ortigas Avenue, Quezon City www.robinsonsbank.com.ph