Embed Size (px)
Citation preview
Growing Asian Demand In Physical Gold And Its Impact
On Gold Prices
Minerals Council of AustraliaGold Forum
2 June 2015
Market Maker of the year
2014
COMMODITY RISK
SURVEY
COMMODITY RISK
SURVEY
Market Maker of the year
2013
Market Maker of the year
2012
Precious metals house of the year
2014
No 1. ranking in precious metals
2013
No 1. ranking in precious metals
2012
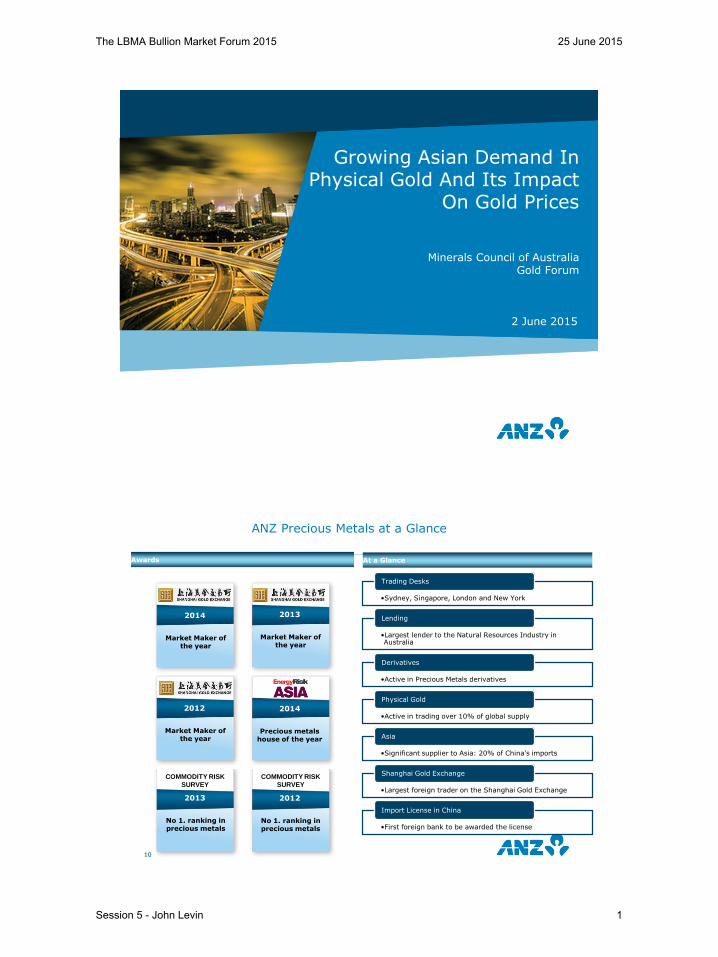
•Sydney, Singapore, London and New York
Trading Desks
•Largest lender to the Natural Resources Industry in Australia
Lending
•Active in Precious Metals derivatives
Derivatives
•Active in trading over 10% of global supply
Physical Gold
•Significant supplier to Asia: 20% of China’s imports
Asia
•Largest foreign trader on the Shanghai Gold Exchange
Shanghai Gold Exchange
•First foreign bank to be awarded the license
Import License in China
Awards At a Glance
ANZ Precious Metals at a Glance
10
The LBMA Bullion Market Forum 2015 25 June 2015
Session 5 - John Levin 1
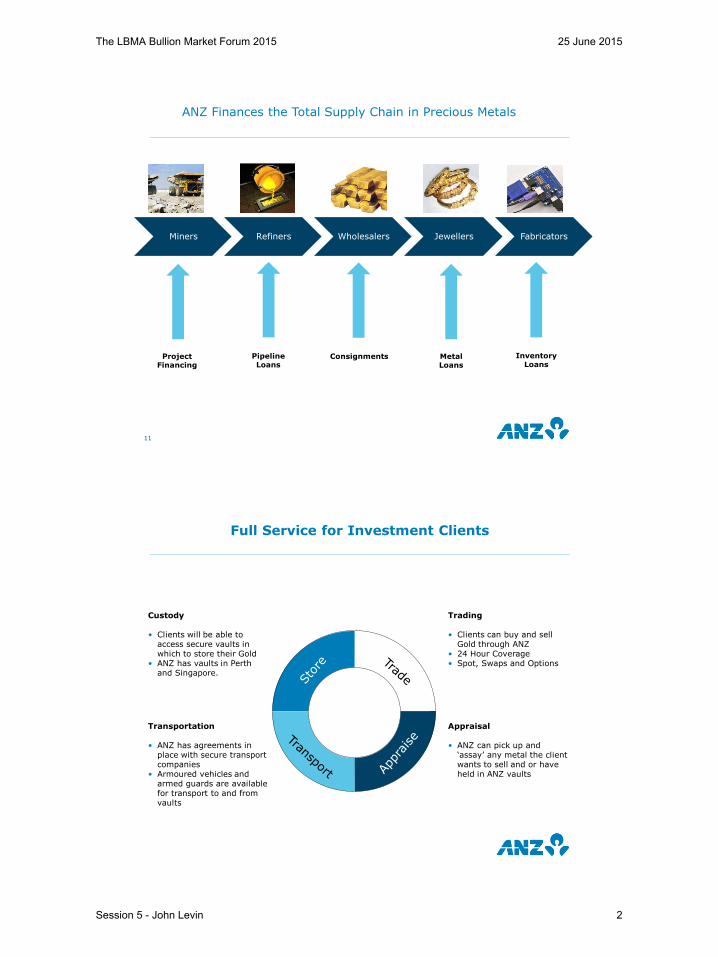
Miners Refiners Wholesalers Jewellers Fabricators
Project Financing
Pipeline Loans
Consignments Metal Loans
Inventory Loans
ANZ Finances the Total Supply Chain in Precious Metals
11
Full Service for Investment Clients
Custody
• Clients will be able to access secure vaults in which to store their Gold
• ANZ has vaults in Perth and Singapore.
Transportation
• ANZ has agreements in place with secure transport companies
• Armoured vehicles and armed guards are available for transport to and from vaults
Trading
• Clients can buy and sell Gold through ANZ
• 24 Hour Coverage• Spot, Swaps and Options
Appraisal
• ANZ can pick up and ‘assay’ any metal the client wants to sell and or have held in ANZ vaults
The LBMA Bullion Market Forum 2015 25 June 2015
Session 5 - John Levin 2
Sth Africa
Europe
Indonesia
Russia
Ghana
India
Peru
Australia
Canada
Mexico
US
ThailandVietnam
ChinaTurkey
Middle East
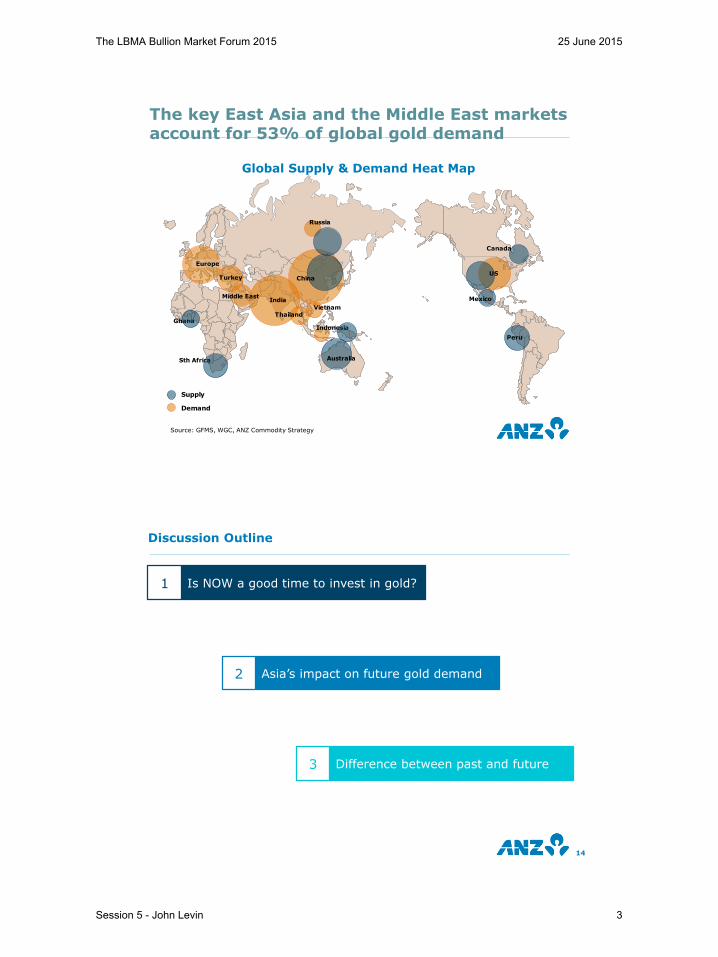
Source: GFMS, WGC, ANZ Commodity Strategy
Global Supply & Demand Heat Map
The key East Asia and the Middle East markets account for 53% of global gold demand
Supply
Demand
Discussion Outline
14
Is NOW a good time to invest in gold?1
Difference between past and future3
Asia’s impact on future gold demand2
The LBMA Bullion Market Forum 2015 25 June 2015
Session 5 - John Levin 3
Discussion Outline
15
Is NOW a good time to invest in gold?1
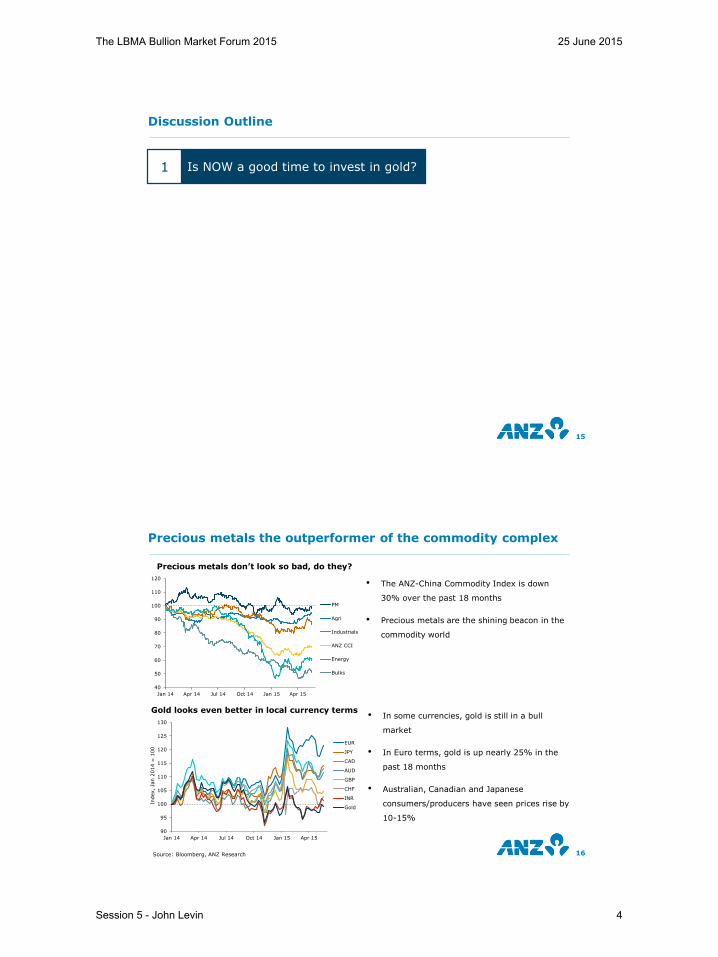
Precious metals the outperformer of the commodity complex
16Source: Bloomberg, ANZ Research
• The ANZ-China Commodity Index is down
30% over the past 18 months
• Precious metals are the shining beacon in the
commodity world
Precious metals don’t look so bad, do they?
• In some currencies, gold is still in a bull
market
• In Euro terms, gold is up nearly 25% in the
past 18 months
• Australian, Canadian and Japanese
consumers/producers have seen prices rise by
10-15%
Gold looks even better in local currency terms
40
50
60
70
80
90
100
110
120
Jan 14 Apr 14 Jul 14 Oct 14 Jan 15 Apr 15
PM
Agri
Industrials
ANZ CCI
Energy
Bulks
90
95
100
105
110
115
120
125
130
Jan 14 Apr 14 Jul 14 Oct 14 Jan 15 Apr 15
Index,
Jan 2
014 =
100
EUR
JPY
CAD
AUD
GBP
CHF
INR
Gold
The LBMA Bullion Market Forum 2015 25 June 2015
Session 5 - John Levin 4

What does the big dollar mean for gold?
17Source: Bloomberg, ANZ Research
40
50
60
70
80
90
100100
110
120
130
140
150
160
Oct 80 Oct 81 Oct 82 Oct 83 Oct 84
USD Gold (RHS)
Higher USD, Lower Gold
100
110
120
130
140
150
160
170
18050
60
70
80
90
100
Mar 85 Mar 86 Mar 87 Mar 88
USD Gold (RHS)
Lower USD, Higher Gold
USD bull markets = gold bear markets… but the reverse is also true
60
70
80
90
100
11090
100
110
120
130
140
Oct 11 Oct 12 Oct 13 Oct 14 Oct 15
USD Gold (RHS)
Higher USD, Lower Gold
60
70
80
90
100
11090
100
110
120
130
140
Aug 95 Aug 96 Aug 97 Aug 98 Aug 99 Aug 00 Aug 01
USD Gold (RHS)
Higher USD, Lower Gold
100
120
140
160
180
20065
70
75
80
85
90
95
100
Feb 02 Feb 03 Feb 04 Feb 05 Feb 06
USD Gold (RHS)
Lower USD, Higher Gold
USD Gold (RHS)
Lower USD, Higher Gold
1980to
1988
1995to
2006
2011to
----
Market Trend #1 - China
18Source: ANZ Research
-300
-250
-200
-150
-100
-50
0
50
100
150
200
250
300
-500
-400
-300
-200
-100
0
100
200
300
400
500
09 10 11 12 13 14 15
Metr
ic t
onnes
Metr
ic t
onnes
Supply Demand Physical Stock Change (RHS)
Eyes too big for stomach…
… imports are still too high
• Onshore stocks have increased by over 500
tonnes over the past 12 months
• This is likely to create problems with
oversupply of physical metal
• Gold jewellery demand down 10% y/y in the
first quarter of 2015
• Our Physical Demand barometer showed a
sharp pickup in Q2 imports
• This will continue to exacerbate the physical
oversupply issues onshore
• Physical premiums and spreads will remain
soft this year-0.1
0.0
0.1
0.2
0.3
0.4
0.5
0
20
40
60
80
100
120
140
Jun 13 Sep 13 Dec 13 Mar 14 Jun 14 Sep 14 Dec 14 Mar 15
Valu
e
Metr
ic t
onnes
Imports (CH) Imports (HK) Demand Barometer (2m fwd) (RHS)(RHS)
The LBMA Bullion Market Forum 2015 25 June 2015
Session 5 - John Levin 5
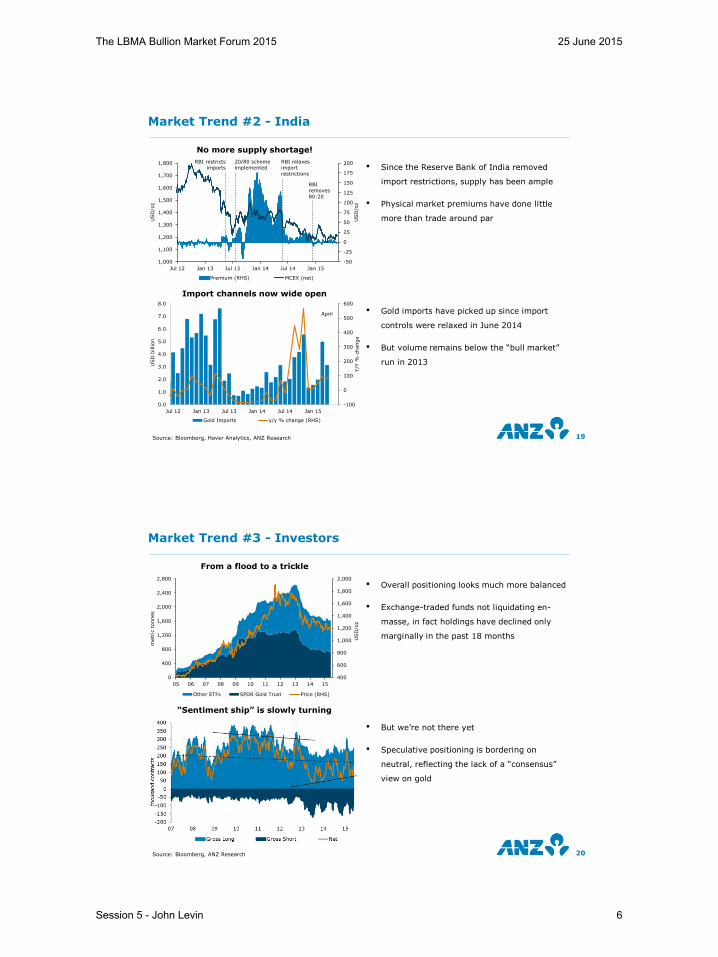
Market Trend #2 - India
19Source: Bloomberg, Haver Analytics, ANZ Research
No more supply shortage!
Import channels now wide open
• Since the Reserve Bank of India removed
import restrictions, supply has been ample
• Physical market premiums have done little
more than trade around par
• Gold imports have picked up since import
controls were relaxed in June 2014
• But volume remains below the “bull market”
run in 2013
-50
-25
0
25
50
75
100
125
150
175
200
1,000
1,100
1,200
1,300
1,400
1,500
1,600
1,700
1,800
Jul 12 Jan 13 Jul 13 Jan 14 Jul 14 Jan 15
USD
/oz
USD
/oz
Premium (RHS) MCEX (net)
RBI restricts
imports
20/80 scheme
implemented
RBI relaxes
import
restrictions
RBI
removes 80:20
-100
0
100
200
300
400
500
600
0.0
1.0
2.0
3.0
4.0
5.0
6.0
7.0
8.0
Jul 12 Jan 13 Jul 13 Jan 14 Jul 14 Jan 15
Y/Y
% c
hange
USD
billion
Gold Imports y/y % change (RHS)
April
Market Trend #3 - Investors
20Source: Bloomberg, ANZ Research
From a flood to a trickle
“Sentiment ship” is slowly turning
• Overall positioning looks much more balanced
• Exchange-traded funds not liquidating en-
masse, in fact holdings have declined only
marginally in the past 18 months
• But we’re not there yet
• Speculative positioning is bordering on
neutral, reflecting the lack of a “consensus”
view on gold
400
600
800
1,000
1,200
1,400
1,600
1,800
2,000
0
400
800
1,200
1,600
2,000
2,400
2,800
05 06 07 08 09 10 11 12 13 14 15
USD
/oz
metr
ic t
onnes
Other ETFs SPDR Gold Trust Price (RHS)
The LBMA Bullion Market Forum 2015 25 June 2015
Session 5 - John Levin 6

• Gold will rise once the USD has had its run
• China/India physical demand is soft, “rush to buy” is not there
• Investors are sidelined by low conviction
Discussion Outline
21
Is NOW a good time to invest in gold?1
Asia’s impact on future gold demand2
Accumulate!
• Asia’s ascension will be led by 10 economies – China, India, Indonesia, Japan, South Korea, Malaysia, Philippines, Singapore, Thailand and Vietnam
• These 10 economies could account for 50% of global GDP by 2050
0%
10%
20%
30%
40%
50%
60%
1980 1985 1990 1995 2000 2005 2010 2015 2020 2025 2030 2035 2040 2045 2050
Percen
tag
e o
f W
orld
GD
P C
urren
t P
ric
es
Asia 10
Euro Zone
USA
Source: CEIC, ANZ Research projections
The ‘Asian Century’ – an economic perspective of the A10
The LBMA Bullion Market Forum 2015 25 June 2015
Session 5 - John Levin 7
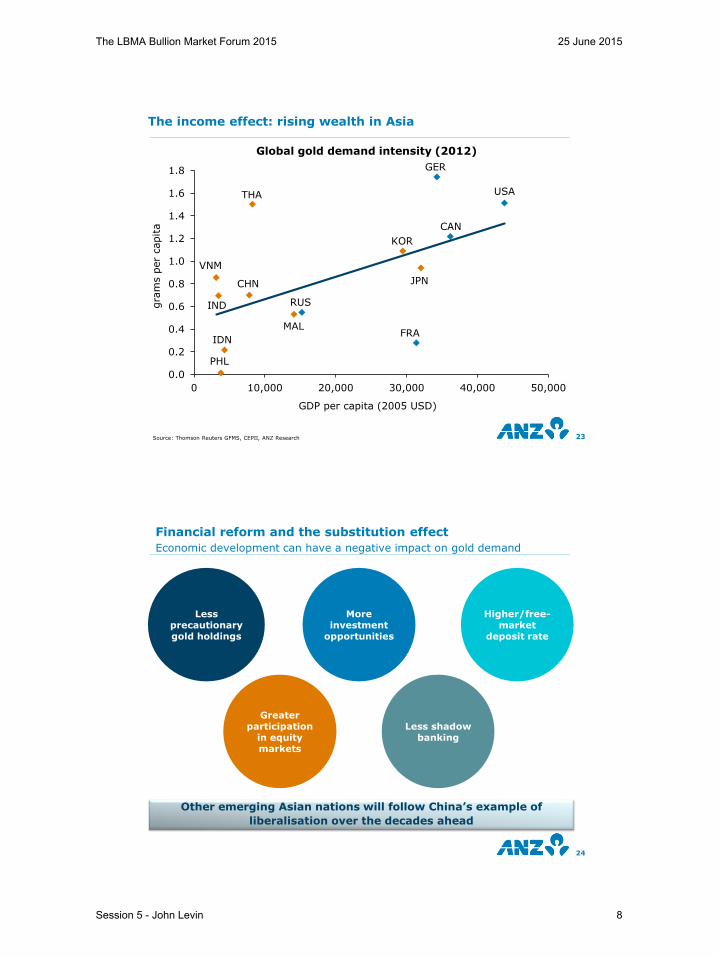
23
0.0
0.2
0.4
0.6
0.8
1.0
1.2
1.4
1.6
1.8
0 10,000 20,000 30,000 40,000 50,000
gra
ms p
er
capita
GDP per capita (2005 USD)
USA
GER
CAN
FRA
JPN
KOR
THA
CHN
RUS
MAL
VNM
IND
IDN
PHL
Global gold demand intensity (2012)
Source: Thomson Reuters GFMS, CEPII, ANZ Research
The income effect: rising wealth in Asia
Financial reform and the substitution effect
Economic development can have a negative impact on gold demand
24
Other emerging Asian nations will follow China’s example of
liberalisation over the decades ahead
Less precautionary gold holdings
More investment
opportunities
Higher/free-market
deposit rate
Greater participation
in equity markets
Less shadow banking
The LBMA Bullion Market Forum 2015 25 June 2015
Session 5 - John Levin 8

Financial reform and Asia’s new fund managersInstitutional asset base of Asia 10 countries to continue growing
25
Projected size of institutional assets (% of GDP)
0
50
100
150
200
250
300
350
400
Chin
a
India
Indonesia
Japan
South
Kore
a
Mala
ysia
Philip
pin
es
Sin
gapore
Thailand
Vie
tnam
Asia
10
% o
f G
DP
2009 2030 2050
Source: World Bank, ANZ Research
Total retail and institutional gold demand to double by 2050An increase to 5,000 annually, from 2,500 tonnes currently
26
Asia 10 projected annual gold investment demand
RETAIL
CONSUMPTION
(gm/capita)
0.0% 0.5% 1.0% 1.5% 2.0% 2.5% 3.0% 3.5% 4.0% 4.5%
0.5 1,841 2,024 2,208 2,391 2,575 2,758 2,941 3,125 3,308 3,492
0.6 2,209 2,392 2,576 2,759 2,943 3,126 3,310 3,493 3,677 3,860
0.7 2,577 2,760 2,944 3,127 3,311 3,494 3,678 3,861 4,045 4,228
0.8 2,945 3,129 3,312 3,495 3,679 3,862 4,046 4,229 4,413 4,596
0.9 3,313 3,497 3,680 3,864 4,047 4,231 4,414 4,598 4,781 4,964
1.0 3,681 3,865 4,048 4,232 4,415 4,599 4,782 4,966 5,149 5,333
1.1 4,049 4,233 4,416 4,600 4,783 4,967 5,150 5,334 5,517 5,701
1.2 4,418 4,601 4,785 4,968 5,152 5,335 5,518 5,702 5,885 6,069
1.3 4,786 4,969 5,153 5,336 5,520 5,703 5,887 6,070 6,254 6,437
1.4 5,154 5,337 5,521 5,704 5,888 6,071 6,255 6,438 6,622 6,805
1.5 5,522 5,706 5,889 6,072 6,256 6,439 6,623 6,806 6,990 7,173
1.6 5,890 6,074 6,257 6,441 6,624 6,808 6,991 7,174 7,358 7,541
1.7 6,258 6,442 6,625 6,809 6,992 7,176 7,359 7,543 7,726 7,910
1.8 6,626 6,810 6,993 7,177 7,360 7,544 7,727 7,911 8,094 8,278
1.9 6,995 7,178 7,362 7,545 7,728 7,912 8,095 8,279 8,462 8,646
2.0 7,363 7,546 7,730 7,913 8,097 8,280 8,464 8,647 8,830 9,014
% OF INSTITUTIONAL HOLDINGS BY 2050
Source: Thomson Reuters GFMS, World Bank, ANZ Research
The LBMA Bullion Market Forum 2015 25 June 2015
Session 5 - John Levin 9

Discussion Outline
27
Is NOW a good time to invest in gold?1
Difference between past and future3
Asia’s impact on future gold demand2
• Gold will rise once the USD has had its run
• China/India physical demand is soft, “rush to buy” is not there
• Investors are sidelined by low conviction
• Annual gold demand in Asia to double to 5,000 tonnes by 2050
• Higher incomes boosting consumption - “Income” effect
• “Substitution” effect initially negative, ultimately positive for demand
Accumulate!
The pattern of gold production has changed in recent decadesChina is both the world’s largest producer and consumer
28
135
Source: Thomson Reuters GFMS, ANZ Research
The LBMA Bullion Market Forum 2015 25 June 2015
Session 5 - John Levin 10

Ultimately, the producer cost-curve should underpin prices20% of world production is not profitable on a cash-cost basis
29
0
200
400
600
800
1,000
1,200
1,400
1,600
1,800
2,000
0 250 500 750 1,000 1,250 1,500 1,750 2,000
Cash C
ost
(USD
/oz)
Cumulative Production (tonnes)
2014 average price
Source: Wood Mackenzie, US Geological Survey, Bloomberg, ANZ Research
Gold mining is not cheap… Long-term, the cost-curve will underpin prices
• China may only have 5 years of domestic
supply left
• Australia and South Africa are some of the
highest-cost producers
• Historically, the 75th percentile has provided a
good guide to long-term price levels
92 94 96 98 00 02 04 06 08 10 12 14 16
USD
/oz (
log s
cale
)
Gold Price Weighted Average 75th Percentile 90th Percentile
200
400
600
1,200
1,600
2,000
800
10,000
9,000
8,000
7,000
6,000
5,000
4,000
3,000
2,000
1,000
0
1,000
2,000
Oth
er
Austr
alia
South
Afr
ica
Russia
Chile
United S
tate
s
Indonesia
Bra
zil
Peru
Chin
a
Uzbekis
tan
Ghana
Mexic
o
PN
G
Canada
tonnes
Annual Mine Production
Below Ground Reserves
But the years ahead could look different…
Producer hedging was common practice during the 1990’sBut the impact of this is now much smaller
30
Producer hedging activity in the gold market
Source: Thomson Reuters GFMS, Bloomberg, ANZ Research
(500)
(250)
0
250
500
90 92 94 96 98 00 02 04 06 08 10 12 14
tonnes
Hedging
De-hedging
0
250
500
750
1,000
1,250
1,500
1,750
0
500
1,000
1,500
2,000
2,500
3,000
90 92 94 96 98 00 02 04 06 08 10 12 14
USD
/oz
tonnes
Global Hedge Book Avg. gold price (RHS)
The LBMA Bullion Market Forum 2015 25 June 2015
Session 5 - John Levin 11

Central banks no longer net sellers of goldAfter liquidating holdings for most of the past 25 years
31
(800)
(600)
(400)
(200)
0
200
400
600
84 86 88 90 92 94 96 98 00 02 04 06 08 10 12 14
tonnes
Central bank activity in the gold market
Some should be holding more gold
0
10
20
30
40
50
60
70
80
90
Perc
ent
of to
tal FX r
eserv
es
Upper middle-
income
High-income Lower middle-
income
Low income
Source: World Gold Council, World Bank, Bloomberg, ANZ Research
• Central banks became net accumulators of
gold since the global financial crisis
• Most of the buying has been from emerging
market central banks, particularly Russia,
Turkey and Kazakhstan
• “High-income” countries hold an average 20%
of FX reserves in gold, though this is heavily
skewed by western European countries and
the U.S.
• Countries in the other income brackets hold
gold comprising less than 10% of reserves, on
average
CONCLUSIONS
32
Is NOW a good time to invest in gold?1
Difference between past and future3
Asia’s impact on future gold demand2
• Gold will rise once the USD has had its run
• China/India physical demand is soft, “rush to buy” is not there
• Investors are sidelined by low conviction
• Cost-curve is supportive of prices
• Producer hedging is minimal and central banks net buyers
• Gold prices forecast to reach USD2,400/oz by 2030
• Annual gold demand in Asia to double to 5,000 tonnes by 2050
• Higher incomes boosting consumption -“Income” effect
• “Substitution” effect initially negative, ultimately positive for demand
Accumulate!
The LBMA Bullion Market Forum 2015 25 June 2015
Session 5 - John Levin 12